· 0v 3kxrqj 7kl .lp 1jx\hq %lqkgxrqj 6rfldo 'lvhdvh 3uhyhqwlrq &rqwuro &hqwhu...
TRANSCRIPT

MINISTRY OF HEALTH MEDICAL SERVICE ADMINISTRATION NATIONAL SURVEY ON AVOIDABLE BLINDNESS
VIET NAM, 2015
Using the Rapid Assessment for Avoidable Blindness (RAAB) methodology

This survey was implemented by local ophthalmologists under supervision of:
Medical Service Administration of Viet Nam Ministry of Health
138A, Giang Vo, Ba Dinh, Hanoi, Viet Nam
Viet Nam National Institute of Ophthalmology
85 Ba Trieu Street, Hanoi, Viet Nam
This survey was conducted under a grant from: The World Health Organization
and international partners including:
Australian Government Christian Blind Mission (CBM)
International Agency for Prevention of Blindness (IAPB)
The Fred Hollows Foundation (FHF) Eye Care Foundation (ECF)
ORBIS Helen Keller International (HKI)
Brien Holden Vision Institute (BHVI)

Contributors Technical working group - Dr. Hans Limburg - Dr. Duong Anh Vuong - Mr. Thang Duc Nguyen - Ms. Thuy Thi Thu Nguyen - Dr. Vu Anh Tuan - Dr. Dung Chi Nguyen - Dr. Nga Thi Quynh Pham - Dr. Lam Tuan Nguyen
Consultant on Community Eye Care Medical Services Administration, MOH Medical Services Administration, MOH Medical Services Administration, MOH Vietnam National Institute of Opthamology Vietnam National Institute of Opthamology World Health Oganization in Vietnam World Health Oganization in Vietnam
Technical advisory group - Assoc. Prof. Dr Khue Ngoc Luong - Assoc. Prof. Dr An Tran
- Mr Damian Facciolo - Mrs Phuong Bich Tran - Dr Phuc Tan Huynh - Mr Anh Quoc Pham - Mr Tung Thanh Truong - Ms Huong Thanh Tran - Ms Ngọc Kim Pham - Ms Ly Phuong Huynh - Dr Andreas Mueller - Dr. Gabit Ismailov
Director of Medical Services Administration, MOH Acting Director of Vietnam National Institute of
Opthamology Program manager of Western Pacific Region, IAPB IAPB in Vietnam Director of FHF in East Asia Representative of FHF in Vietnam Representative of CBM in Vietnam Representative of ORBIS in Vietnam Representative of HKI in Vietnam Representative of BHVI in Vietnam World Health Oganization- Western Pacific Region World Health Oganization in Vietnam

Management team and data collection teams - Assoc. Prof. Dr. Khue Ngoc Luong, Director of Medical Services Administration, MOH - Dr. Nguyen Trong Khoa, Deputy Director of Medical Services Administration, MOH - Dr. Duong Anh Vuong, Medical Services Administration, MOH - Mr. Thang Duc Nguyen, Medical Services Administration, MOH - Ms. Thuy Thu Nguyen, Medical Services Administration, MOH - Assoc. Prof. Dr. An Tran, Acting director of Vietnam National Institute of Opthamology - Dr. Anh Tuan Vu, Vietnam National Institute of Opthamology - Assoc. Prof. Dr. Dung Chi Nguyen, Vietnam National Institute of Opthamology - Dr. Hiep Kiem Nguyen, Vietnam National Institute of Opthamology - Dr. Linh Thi Do, Vietnam National Institute of Opthamology - Dr. Xuan Van Bui, Vietnam National Institute of Opthamology - Dr. Thanh Huy Thien Ha, Vietnam National Institute of Opthamology - Dr. Phu Minh Nguyen, Vietnam National Institute of Opthamology. - Dr. Dat Minh Tran, Vietnam National Institute of Opthamology - Dr. Hung Viet Bui, Vietnam National Institute of Opthamology - Dr. Duong Dai Luong, Vietnam National Institute of Opthamology - Dr. Loi Khanh Tran, Bac Ninh Eye Care hospital - Ms. Hoa Duc Nguyen, Bac Ninh Eye Care hospital - Ms. Huyen Thi Thanh Nguyen, Bac Ninh Eye Care hospital - Dr. Dung Anh Le, Bac Ninh Eye Care Hospital - Dr. Hung Duy Vu, Nam Dinh Eye Care Hospital - Mr. Trong Tran Minh, Nam Dinh Eye Care Hospital - Dr. Trung Van Tran, Nam Dinh Eye Care Hospital - Dr. Phuc Tien Nguyen, Phutho Eye Care Center - Dr. Ha Thi Thuy Mai, Phutho Eye Care Center - Ms. Phuong Thi Viet Do, Phutho Eye Care Center - Dr. Tiep Van Nguyen, Dienbien Social Disease Prevention & Control Center
Dr. Quynh Pham Vu, Dienbien Social Disease Prevention & Control Center - Ms. Hanh Thi Pham, Dienbien Social Disease Prevention & Control Center - Dr.Canh Van Nguyn, Tuyenquang Social Disease Prevention & Control Center - Dr. Dung Thi Mai, Tuyenquang Social Disease Prevention & Control Center - Mr. Vinh Thanh Hoang, Tuyenquang Social Disease Prevention & Control Center - Dr. Sưn Mi Nguyen, Quangtri Social Disease Prevention & Control Center - Dr. Anh Thi Van Bui, Quangtri Social Disease Prevention & Control Center - Mr.Cuong Duc Nguyen, Quangtri Social Disease Prevention & Control Center - Ms. Linh Thi Ha, Quangtri Social Disease Prevention & Control Center - Dr. Thien Ta Vo, Hatinh Eye Care Center - Dr. Khoa Duc Nguyen, Hatinh Eye Care Center - Ms. Anh Nu Lan Nguyen, Hatinh Eye Care Center - Ms. Tam Thi Thanh Nguyen, Hatinh Eye Care Center - Dr. Cuong Cao Nguyen, Quangngai Eye Care Center - Dr. Hieu Minh Doan, Quangngai Eye Care Center - Mr. Vinh Quoc Doan, Quangngai Eye Care Center - Ms. Nhu Thi Quynh Ho, Quangngai Eye Care Center - Ms. Hang Phuong Viet Vu, Gialai Social Disease Prevention & Control Center - Dr. Nghi Van Dang, Gialai Social Disease Prevention & Control Center

- Ms. Tuyet Thi Trinh Huynh, Gialai Social Disease Prevention & Control Center - Dr. Binh Trong Pham, Gialai Social Disease Prevention & Control Center - Dr. Hue Thi Hong Duong, Binhduong Social Disease Prevention & Control Center - Ms. Phuong Thi Kim Nguyen, Binhduong Social Disease Prevention & Control Center - Dr. Dinh Thi Nguyen, Binhduong Social Disease Prevention & Control Center - Mr. Nam Thanh Dang, Binhduong Social Disease Prevention & Control Center - Dr. Thinh Quoc Tang, Camau Social Disease Prevention & Control Center - Dr. Tung Thanh Tran, Camau Social Disease Prevention & Control Center - Mr. Cuong Van Dinh, Camau Social Disease Prevention & Control Center - Mr. Kiep Minh To, Camau Social Disease Prevention & Control Center - Dr. Tuan Viet Tran, Tiengiang Eye Care Hospital - Dr. Vu Thanh Pham, Tiengiang Eye Care Hospital - Mr. Chuong Ky Nguyen, Tiengiang Eye Care Hospital - Mr. Chi Nguyen Van, Tiengiang Eye Care Hospital - Dr. Giap Viet Nguyen, Baria-Vungtau Eye Care Hospital - Dr. Tung Hoang Nguyen, Baria-Vungtau Eye Care Hospital - Dr. Dung Thi Nguyen, Baria-Vungtau Eye Care Hospital - Mr. Quy Hai Tran, Baria-Vungtau Eye Care Hospital - Dr. Hanh Thi Pham, Lamdong Social Disease Prevention & Control Center - Mr. Giap Xuan Le, Lamdong Social Disease Prevention & Control Center

Foreword Visual impairment and blindness has caused serious consequences for health and to individuals and society. Although 80% of all causes of visual impairment are preventable and curable, according to WHO’s estimation in 2010 there were 285 million people visually impaired, of which 39 million were blind. The Rapid Assessment of Avoidable Blindness Survey in Viet Nam 2007 indicated that, the blindness prevalence was 3.1% among people aged from 50 years old and above, which was equivalent to 385,000 people suffering from bilateral blindness. More than 1.6 million people in this age group were suffering from visual impairment. Ministry of Health Viet Nam approved the National Action Plan for Blindness Prevention and Control period 2010-2013 to provide guidance and support in reducing the burden of avoidable blindness. Rapid Assessment of Avoidable Blindness Survey in Viet Nam 2015 was conducted to provide updated information on current situation of avoidable blindness, which is very important to the development of Strategy of Blindness Prevention and Control in the new period. This survey will help Ministry of Health and other eye care partners in evaluating the impact of blindness prevention and control activities in the last period, as well as to provide necessary information for developing action plan in the new period. We highly appreciated the great contribution to the success of this survey made by international and national organizations, namely World Health Organization and Non-government organizations from Eye care Working Group, Viet Nam National Institution of Ophthalmology, provincial Ophthalmology hospitals and provincial eye care centers.
Associate Professor Luong Ngoc Khue Director of Medical Service Administration – Ministry of Health

Acknowledgement First of all we would like to express our heartfelt gratitude to the great dedication and valuable contributions on technician and finance from the World Health Organization and other international organizations and non-government organizations including International Agency for Prevention of Blindness (IAPB), The Fred Hollows Foundation (FHF), Christian Blind Mission (CBM), Eye Care Foundation (ECF), Orbis International, Helen Keller International (HKI) and Brien Holden Vision Institute (BHVI). We also acknowledge and highly appreciate the strong commitment, leadership and support from Ministry of Health and Viet Nam National Institution of Ophthalmology for completing the survey. Our sincerely thanks go to the following experts and colleagues for their considerable contribution in providing support during the survey design, implementation, supervision and management. The most grateful acknowledgement goes to the colleagues from VNIO supervisors’ team for their enthusiastic and valuable technical contribution; to the leadership and support of leaders and managers from Departments of Health and Provincial Ophthalmology Hospitals/Provincial Eye Care Centers; and to the survey teams from 14 selected provinces (Tuyen Quang, Phu Tho, Dien Bien, Bac Ninh, Nam Dinh, Ha Tinh, Quang Tri, Quang Ngai, Gia Lai, Lam Dong, Vung Tau, Binh Duong, Tien Giang, Ca Mau) for their dedicated efforts during the field work. Without their valuable contribution, the survey would never been completed.

Contents 1
Contents
Contents 1 Main findings and recommendations 2 Chapter 1. Introduction 8 1.1 The current situation on eye care in Viet Nam 8 1.2 Earlier surveys 9 1.3 Definitions 10 Chapter 2. RAAB - Survey design 12 2.1 The RAAB methodology 12 2.2 Population of Viet Nam 14 2.3 Selection of 14 provinces 15 2.4 Location of 14 provinces 16 2.5 Weighting factors 17 2.6 Determination of the sample size 18 2.7 Selection of subjects within each province 19 Chapter 3. Survey findings 2015 21 3.1 Sample results from RAAB surveys per province and weighted average 21 3.2 Age and sex adjusted prevalence 23 3.3 Cataract Surgical Coverage 31 3.4 Causes of blindness 32 3.4.1 Trachoma 35 3.4.2 Pterygium 35 3.4.3 Functional low vision 35 3.6 Barriers 36 3.7 Visual outcome 37 3.8 Use and coverage of spectacles 40 Chapter 4. Comparing 2015 with earlier surveys 42 4.1 Comparing findings from surveys in 2000-’02, 2007-’08 and 2015 42 4.2 Comparing blindness and low vision 42 4.3 Cataract surgical coverage (CSC) 45 4.4 Visual outcome 46 4.5 Proportion IOL implanted 47 4.6 Causes of blindness and low vision 47 4.7 Annual cataract operations 2002 – 2015 48 Annex 1 RAAB survey form (English) 49 Annex 2 RAAB survey form (Viet Namese) 50

Main findings and recommendations 2 Main findings and recommendations Introduction Viet Nam has a long history of conducting population-based surveys on blindness and visual impairment (Table 1). Earlier surveys were conducted in 1986, 1990, 1995, 2000-‘02, 2007-‘08 and 2015. The first three surveys covered all age groups, the last three series of 2000-’02, 2007-’08 and 2015 all used the same methodology and protocol and the findings are comparable. These RAABs were well spread over all ecological zones of the country. For each of these three series of surveys, national data has then been estimated based on the weighted average of the provincial data. These national (‘weighted average’) data have been compared in Table 33. This same table also shows that RAABs were repeated in a number of provinces, so that over the years, trends in reduction of blindness could be measured more accurately. With a total population of 91.582 million in 2015, constituted of 54 different ethnic groups and spread over 6 distinct ecological zones, there is no real ‘average’ Vietnamese citizen. If one national survey of blindness and visual impairment was conducted, it would provide just such an ‘average’ picture. Because eye care services are organized at provincial level, and the variation by ethnic group, climate, cultural and socio-economic factors and distance to health and eye care services is likely to be less in each province, it is much more useful to conduct provincial population-based surveys and use these findings for evaluation of past services and planning of future intervention activities at provincial level. The sample size for each of the provincial RAABs has increased from 1,800 in 2000-’02 and in 2007-‘08 to 2,000 in 2015, to compensate for the expected reduction in prevalence of blindness. The sample size of 2,000 should provide enough power to estimate a prevalence of 3.1% (the weighted average prevalence in 2007-’08) with a variation of 32% and a non-compliance of 10% at 95% probability (see Figure 3). The combined data will provide a weighted average estimate,that may be applied to entire Viet Nam, with a much higher accuracy. Most provinces showed a Design Effect of around 1.5 or less, as expected. Some provinces showed a much higher Design Effect, like Vung Tau (1.80), Binh Duong (1.93) and Ha Tinh (4.21), suggesting a very uneven distribution of bilateral blindness in these provinces (Table 10). Separate reports were produced for each of the 14 provinces, and these findings should be used to evaluate past services and to provide baseline data for future planning of eye care services in the individual provinces. This report compares the findings from the 14 individual provinces, calculates weighted averages a proxy for the situation in entire Vietnam, and compares results from individual provinces and the weighted averages from this 2015 survey with earlier surveys in 2007-’08 and 2000-’02 that used the same survey methodology. In this report the main focus lies on the variation between the provinces, the extrapolation of the findings from the provinces to national level, and the comparison between the surveys in 2000-’02, 2007-’08 and 2015. For conclusions, recommendations and planning in individual provinces, findings in the RAAB reports of each of these provinces should be analysed. Main findings: The findings below are focusing on the national (weighted average) trends as indicated in the surveys of 2000-’02, 2007-’08 and 2015. This may not do justice to the variations between the different provinces, but these will be covered in the reports of each of the 14 individual provinces. The good news is that the prevalence of bilateral blindness, of cataract blindness; in people aged 50+, has reduced significantly between 2000 and 2007 and between 2007 and 2015; and reduction trends has been found in the prevalence of cataract low vision. However, the bad

Main findings and recommendations 3 news is that the magnitude of reduction is lower in 2007-2015 than in 2000-2007; the estimated number of people with cataract blindness between those two period remained the same and bilateral low vision due to cataract nearly doubled between 2007 and 2015. This indicates that the cataract backlog is on the increase. . 1. The prevalence of bilateral blindness and the number of blind people went down.
The adjusted prevalence of blindness (presenting VA<3/60 in the better eye) varied between 1.1% in Ha Tinh, Quang Ngai and Lam Dong province and 2.6% in Dien Bien province. The weighted average was 1.8%. The weighted average prevalence in males (1.2%) was significantly lower than the weighted average prevalence in females (2.2%). (table 11). The national estimates (weighted average) show a significant reduction in the adjusted prevalence of bilateral blindness from 4.1% in 2000-’02 to 3.1% in 2007-’08, and again a significant reduction between 2007-’08 and 2015 (1.8%) (Table 33). That is a reduction with 57% between 2000-’02 and 2015. Despite the ageing trend, also the estimated number of cases went down from 443,706 in 2000-’02 to 370,640 in 2007-’08 and 329,333 in 2015, a reduction of 26% (Figure 9, Figure 10).
The individual provinces with a repeat RAAB all show a decline in prevalence, but due to the small sample size in each province, the variation is wider and differences are less likely to be significant. Nevertheless, the decline is significant between 2007-’08 and 2015 in Phu Tho and Bac Ninh, and between 2000-’02 and 2015 in Gia Lai and in Tien Giang (Table 33).
2. The prevalence of cataract blindness went down, but the reduction of people bilateral blind from cataract stagnated. The adjusted prevalence of bilateral cataract blindness (best corrected VA<3/60 in the better eye) varied between 0.5% in Quang Ngai and Lam Dong province and 1.9% in Dien Bien province. This difference is significant (p<0.05). The weighted average prevalence was 1.0%, with the prevalence in males (0.6%) significantly lower than the weighted average prevalence in females (1.4%) (Table 14). The adjusted prevalence of bilateral cataract blindness in Viet Nam in 2015 (1.0%) improved significantly compared with 2007 (1.6%) and with 2000 (2.3%), a reduction by 57% between 2000-’02 and 2015, despite the aging trend that caused an increase of people at risk for cataract blindness by over 25%. The estimated number of bilateral cataract blind people in Viet Nam reduced from 247,659 in 2000 to 192,298 in 2007 but remained stable at 193,987 in 2015 (Table 35, Figure 9, Figure 10).
The main contribution in the decline of the prevalence of blindness was the increase of cataract operations from 84,633 in 2007 (CSR: 1059) to 169,597 in 2014 (CSR: 1,869). However, this was clearly not sufficient to compensate for the fast increase of people at risk for cataract due to the aging trend.
3. Prevalence of low vision reduces slightly, but number of cases increases by 500,000.
The weighted average prevalence of low vision reduced significantly from 14.7% in 2000 to 13.6% in 2007 and further to 11.4% in 2015. Some provinces showed a reduction in prevalence while others show an increase. However, the estimated number of people aged 50+ with bilateral low vision, which reduced slightly from 1.583 million in 2000 to 1.570 million in 2007, increased to 2.099 million in 2015. (Table 34, Figure 9, Figure 10). The national prevalence of low vision due to cataract reduced slightly from 6.3% in 2000 to 6.0% in 2007 and remained at 6.0% in 2015. However, the number of people aged 50+ with bilateral low vision increased slightly from 678,079 in 2000 to 695,131 in 2007, but nearly doubled to 1.131 million in 2015 (Table 36). That clearly shows that the present

Main findings and recommendations 4
capacity of the eye care services is not sufficient to compensate for the increased incidence, caused by the ageing trend. That clearly shows that the present capacity of the eye care services is not sufficient to compensate for the increased incidence, caused by the ageing trend.
4. Cataract Surgical Coverage for bilateral blind persons increased, but hardly for
bilateral low vision. The CSC (persons, <3/60) varies between 41% in Dien Bien and 84% in Tien Giang, with a weighted average of 74%. There is a considerable variation between provinces, but the CSC in males and in females does not differ much. The average weighted CSC in persons at VA6/60 is 59% and in persons at VA<6/18 is 37%. These levels are relatively low, indicating that the number of cataract operations at these levels of VA is limited (Table 18). The average Cataract Surgical Coverage (persons) with BCVA<3/60 in Viet Nam increased from 52% in 2000-’02 to 67% in 2007-’08 and further to 74% in 2015 (Table 37). Similar increases were seen in all provinces where repeat RAABs were conducted, except for Nghe An and Bac Ninh province where the CSC declined.
The average CSC (persons) <6/60 and CSC (persons) <6/18 remain relatively low at 59% and 37% respectively, and there was a minimal change compared to 2007-’08. This indicates that less people come for surgery with cataract and BCVA <6/60 and only few with BCVA <6/18. In some provinces (Bac Ninh, Binh Dinh, Nghe An, Vung Tau and Binh Phuoc) there is even a decline in CSC. This indicates that with the increase in cataract patients with BCVA<6/60 and <6/18 due to the ageing trend, the eye care services are not able to keep up with the demand. The proportion of IOL implantations increased from 47% in 2000-‘02 to 98% in 2015 (Table 41). Although this modern technique permits cataract surgery at a much earlier stage, allowing patients to be operated before they actually become disabled and thus maintain their productivity, it seems not to be used that much in early stage cataract.
5. Present output on cataract surgery is not sufficient and of poor quality. The low
decline in the number of people with bilateral blindness, the increase in the number of people with bilateral low vision and the stagnating CSC at <6/60 and <6/18 level are all indicators that the present output is barely enough to cover the incidence, but not enough to reduce the backlog of unoperated cataract. Visual outcome does not meet the WHO standards. The main barriers why people do not come for cataract surgery are ‘fear for surgery or for poor outcome’, ‘cannot afford’ and ‘no access to treatment because of distance’. These all point at a provider’s problem in services delivery.
6. Visual outcome after cataract surgery still poor. The proportion of good outcome
(presenting VA≥6/18 in operated eye) in 2015 varied from 41% in Bac Ninh to 72% in Quang Ngai. On average 60% of the patients can see 6/18 or better in the operated eye, 22% sees <6/18-6/60 and 18% cannot see 6/60. This is well below the recommended levels of 80%, 15% and 5% respectively. Some provinces have proportions of good outcome below 50% and poor outcome of 25% and higher. With pinhole, the weighted average good outcome increased with 11%, varying from 2% in Nam Dinh to 21% in Bac Ninh. Overall, borderline outcome reduced by 42% and poor outcome by 11% with pinhole, indicating that adequate optical services and biometry could improve outcome considerably. (Table 26-28). Visual outcome after cataract surgery in 2015 (60% good outcome) improved compared to 2007 (51%) and 2000 (36%). The proportion of IOL’s implanted increased from 47% in

Main findings and recommendations 5
2000 to 84% in 2007 and to 98% in 2015. Surgical techniques and equipment also improved during the past 15 years. In the light of these developments it is disappointing that the visual outcome has not improved more. (Table 40).
7. The principal cause of blindness did not change much between 2000-’02 and 2015.
Untreated cataract is by far the main cause of avoidable blindness and low vision in Viet Nam. This can be attributed to the increasing number of people at risk for cataract and the inadequate number of cataract operations. Uncorrected aphakia is declining, because nearly all surgeries are with IOL these days. Complications from cataract surgery are increasing, possibly one of the causes of poor outcome, and also contributing to fear for surgery or poor outcome in the public. Blindness due to trachoma and phthisis are declining, as expected, while diabetic retinopathy and AMD are increasing. Glaucoma remains stable (Table 42).
The 2015 RAABs showed moderate variation in causes between provinces (Table 19). Untreated cataract is the main cause in all 14 provinces (48-87%) and blindness due to complications varied between 0 and 14%. Blindness due to Trachoma seems limited to a few provinces. Glaucoma also varies between provinces, while DR and AMD are more stable.
8. Spectacle coverage is very low. The weighted average spectacle coverage – people
aged 50 years and older who actually use glasses – is 30%, but it varies hugely between 1% in Dien Bien and 61% in Binh Duong (Table 31). Table 28 shows that considerable improvement of visual outcome can be achieved with adequate optical correction. This includes adequate biometry to measure the optimal power of the IOL to be implanted. These figures indicate that optical services are hugely inadequate in many provinces.
9. Females have significantly more blindness than men. In 2015, the weighted average
adjusted prevalence of blindness in males (1.2%(1.0-1.4)) was significantly lower than in females (2.2%(2.0-2.5)). In all provinces, the adjusted prevalence of blindness was lower in males compared to females and this difference was significant in Nam Dinh, despite the small sample size. An estimated 99,782 males and 229,551 females are bilaterally blind (Table 11).
Also the prevalence of bilateral cataract blindness and of low vision due to cataract is significantly lower in males (0.6%) compared to females (1.4%). 47,527 males and 146,460 females are blind due to cataract (Table 14).
However, the weighted average CSC for persons and for eyes is similar in males and females for BCVA<3/60, <6/60 as well as for <6/18 (Table 17, 18). The conclusion must be that the excess of (cataract) blindness in females is caused by the aging trend. There are nearly 2 million more females than males aged 50+ in Viet Nam and they live longer compared to males as well. Therefore, there are more women at risk to develop cataract, and, because they are older, they have a higher risk as well.
10. The main barriers to cataract surgery are ‘Fear’, ‘Cannot afford’, ‘No access’ and
‘No need’. There is considerable variation between provinces in reasons why people with pinhole VA<6/60 due to cataract do not come for cataract surgery (Table 24-25). The main barriers given are ‘Fear’ for surgery of for poor outcome (25%), ‘Cannot afford’ (23%), ‘No access’ (21%), ‘Need not felt’ (19%) and ‘Unaware’ (9%). ‘Fear’ is the most frequent barrier in provinces where visual outcome is relatively poor. Improvement of outcome and awareness campaigns may reduce fear and motivate more patients to come for surgery.

Main findings and recommendations 6
Effective health information campaigns about the benefits of cataract surgery are likely to generate more demand for cataract surgery. At the same time, the quality of the surgery needs to be improved to reduce the fear for poor outcome, the distribution and availability of eye care services has to be expanded to provide better access, especially for patients in remote areas, and the costs have to be reduced to attract more patients.
Conclusion and Recommendations 1. Cataract output needs to be increased considerably. The past and current output of
cataract operations is barely enough to cover the people bilaterally blind due to cataract, but totally inadequate to cover the present and future demand of people with cataract and low vision.
a. Increase the Cataract Surgical Rate from the current 1,869 to at least 4,000-5,000 per year.
b. Expand the VA indication for cataract surgery to <6/60. c. Start provincial and nation-wide health education campaigns to inform the public
about the advantages of timely cataract surgery 2. Visual outcome of cataract surgery needs to be improved. The proportion of good
outcome after cataract surgery is far below the 80% recommended by the WHO (Table 40). Also the proportion of blindness due to complications after cataract is disturbingly high. Poor outcome undermines the confidence and trust of the public in the eye care services and this should be avoided at all cost.
a. Introduce mandatory monitoring of visual outcome after cataract surgery. b. Investigate the reasons for poor visual outcome after cataract surgery in some
provinces and take appropriate action to improve outcome 3. Reduce the costs of cataract surgery. Many countries are using the high-volume
cataract surgery practices developed in India and Nepal with the low cost. This ensures optimal use of cataract surgeons and mid-level ophthalmic staff. Because of the high volume, the costs per operated patient are also strongly reduced.
a. Introduce high volume high quality surgical facilities. b. Use more low cost surgical techniques like small incision cataract surgery (SICS) for
low-income groups. 4. Equal distribution of eye care services over the country. There is a strong variation in
the availability and use of eye care services between provinces. a. Provinces with weak performance should be investigated about the causes of the poor
performance. In case of inadequate resources, these should be provided. In case of ineffective services, management support should be given.
b. Make provisions for cataract surgery for poor people and for people in remote areas 5. Development and use of a robust national Management Information System (MIS)
for Eye Care. Eye care services in a large country like Viet Nam can only be managed effectively if essential information is provided on a regular basis to the managers. This requires a simple, comprehensive and robust computerized MIS system with regular feedback to eye care staff at district and provincial level.
6. More focus on blindness and visual impairment in women. Organise special
campaigns to mobilize female patients with cataract to come forward and get operated. 7. Strengthening of optical services. Supply of glasses to improve vision is one of the most
cost-effective interventions and the spectacle coverage needs to be increased.

Main findings and recommendations 7
a. Identify the reasons why the use of spectacles is so low. b. Improve refraction services in provinces where uncorrected refractive error is an
important cause of low vision
8. Identify priorities for intervention. Correction of refractive errors, trichiasis surgery and cataract surgery are among the most cost-effective medical interventions. These are still the major causes of blindness in Viet Nam and the highest priority should be given to combat these. It has been demonstrated that restoration of sight causes a significant improvement in both the socio-economic status of the operated person, as well as the direct family.1 Intervention programmes for glaucoma and diabetic retinopathy are expensive and far less cost-effective than cataract surgery. These should only be started on pilot basis in the most affected provinces and only be expanded when cataract, refractive errors and trichiasis are well under control.
1 http://iceh.lshtm.ac.uk/cataract-impact-study/

1. Introduction 8 Chapter 1. Introduction 1.1 The current situation on eye care in Viet Nam The eye care system in Viet Nam consists mostly of public sector and some private eye hospitals. The Viet Nam National Institute of Ophthalmology (VNIO) is the leading institution for blindness prevention and treatment in Viet Nam. The eye care model varies in provinces: there are 63 eye departments in 63 general hospitals. Besides these, there are 25 provincial eye hospitals, 6 eye care centers and 25 eye departments in Social Prevention Centers. Meanwhile, 7 provinces, like Long An, Dong Nai, Dong Thap, Hau Giang, Tay Ninh, Khanh Hoa and Ben Tre do not have any established eye center. In addition, there are 21 private eye hospitals and ophthalmic departments in private general hospitals, mostly concentrated in the big cities. There are about 1,350 ophthalmologists working in the two health care systems (public and private), giving a rate of 14.7 ophthalmologists per million population. These include about 500 cataract surgeons mostly doing phaco-surgery. Besides, there are 1.350 ophthalmic nurses in the country, giving a rate of 14.7 mid-level ophthalmic personnel per million population. the relative number of ophthalmic staff is sufficient compared with demand but unevenly distributed, mostly concentrated in the cities and plains. Staff is lacking in mountainous and central highlands. Many districts do not have any eye nurse or ophthalmologist. At provincial level, they do principally cataract surgery and delivery some kind of eye care service. Their capacity of early diagnosis and treatment is still limited. Diseases patterns are very different between regions. Along with the social-economic development, lifestyle changes are the new challenges appearing in eye care. We need the prognoses in the future the changing of disease model of blindness, from cataract and trachomatous corneal opacity to others like AMD, glaucoma and Diabetic Retinopathy. Because of socio-economic development, public demand will increase to lower the VA threshold for cataract surgery from <3/60 to <6/60 and even to <3/18 in several hospitals, which will cause an enormous increase in workload. In order to achieve the goal of reducing avoidable blindness, the workload is still huge, from quantity backlog of cataract to visual outcome of surgery. We need the support from Government, NGO’s and others, but need a real, recent image of blindness situation of nation, of each province of every geographic area in whole country. But due to the financial resource is limited, we have to choose 14 provinces that presents for the 7 geographic areas in Vietnam.

1. Introduction 9 1.2 Earlier surveys Several surveys on blindness have been conducted earlier in Viet Nam. The surveys in 1986, 1990 and 1995 covered all age groups. The clusters were few and they were large, raising doubts about how representative they were for the total population in these provinces. With such large clusters, the Design Effect tends to become high as well, thereby reducing the accuracy of the estimates. In 2000-‘02 rapid assessments for cataract surgical services (RACSS) were conducted in eight provinces. In 2007-’08 Rapid Assessments for Avoidable Blindness (RAABs) were conducted in 16 provinces, 8 of which were also covered in 2000-‘02. In 2015, 14 RAABs were conducted of which 5 were also covered in 2007-’08. Table 1 gives an overview of the main findings of these earlier surveys. Table 1. Blindness surveys in Viet Nam SURVEY YEAR 1986 1990 1995 2000-‘02 2007–‘08 2015 Sample size
50,447 15,071 26,606 14,400 28,800 28,000 Sampling unit
Household Households Households Households Households Households Provinces Hanoi
Haiphong Habac Hatay Thanh Hoa Nghe’an HCM city
Thai Binh Ha Nam Ninh Hau Giang Tien Giang Nghe’an Khanh Hoa Haiphong, HCM city
Hanoi Hue HCM city Hatay Hai Hung Soc Trang Tien Giang Haiphong Ninh Thuan Minh Hai Thai Nguyen Yen Bai Gia Lai
Phu Tho Haiphong Hatay Nghe’an Binh Dinh Gia Lai Binh Phuoc Tien Giang
Lao Cai Thai Nguyen PhuTho Haiphong Bac Ninh Hatay Nghe’an Hue Binh Dinh Gia Lai Binh Phuoc Ho Chi Minh Vung Tau Ninh Thuan Can Tho Tien Giang
Dien Bien Phu Tho Tuyen Quang Bac Ninh Nam Dinh Ha Tinh Quang Tri Quang Ngai Gia Lai Lam Dong Vung Tau Binh Duong Tien Giang Ca Mau
Total no. of clusters (communes)
14 16 24 240 480 560 Coverage
83.7% 94.3% 96.5% 97.4% 97.2% Cause of blindness 1.Uncorr. refr. error 2. Cataract 3. Complications 4. Trachoma corn. scar 5. Other corneal scar 6. Phtisis 7. Pterygium 8. Glaucoma 9. Diabetic Retinopathy 10. ARMD 11. Other post. Segm. 12. Globe / CNS 12. Other
3.6% 39,4%
14.1% 5.5%
6.3%
8,9% 22,2%
2.3% 82,3%
3.1% 2.3%
2.3%
3,1% 4,6%
1.2% 70,7%
5.2% 2.6%
6.3%
4,2% 9,8%
2.5% 66.1% 4.1% 1.7% 5.6% 3.2%
6.4% 0.6%
9.7%
0.5% 74.0% 4.6% 1.5% 4.1% 0.2% 0.6% 4.0% 0.8% 1.4% 6.3% 2.0%
Bilateral Blindness * (in whole population) 0,92% 0,86% 1,25% 0.63% 0.59% 0.43% *: Extrapolated to the entire population of Viet Nam in the respective year and assuming that 20% of all blindness occurs in people younger than 50

1. Introduction 10 The first three surveys included people from all ages, the last three surveys focused on people aged 50 years and older. In none of the surveys listed above the clusters were randomly selected from all communes in entire Viet Nam. It is questionable how representative the results are for entire Viet Nam. In the last three surveys the cluster size reduced from over 1,000 to 60 and 50 in 2015, while the number of clusters increased from 240 in 2000-’02 to 560 in 2015. In the last three surveys the provinces covered were well distributed over the country and each geographical zone was included. In these surveys weighted average indicators were calculated which could then be extrapolated to the population aged 50+ of entire Viet Nam, which may be considered as indicative. 1.3 Definitions The visual acuity (VA) measurements in RACSS and RAAB surveys are using the following definitions, which are conform the World Health Organization’s guidelines:
Blindness: visual acuity <3/60 in the better eye with available correction (presenting vision).
This includes blindness due to refractive errors. The visual field is not measured. Visual acuity is also measured with pinhole correction as a proxy for best corrected vision. The RAAB software also calculates the prevalence of pinhole VA<3/60, the earlier WHO definition.
Severe Visual Impairment (SVI): visual acuity <6/60 but equal to or better than 3/60 in the better eye with available correction (presenting vision).
This includes SVI due to refractive errors. The visual field is not measured. Visual acuity is also measured with pinhole correction as a proxy for best corrected vision.
Moderate Visual Impairment (MVI): visual acuity <6/18 but equal to or better than 6/60 in the better eye with available correction (presenting vision).
This includes MVI due to refractive errors. The visual field is not measured. Visual acuity is also measured with pinhole correction as a proxy for best corrected vision.
Mild or Early Visual Impairment (EVI): visual acuity <6/12 but equal to or better than 6/18 in the better eye with available correction (presenting vision).
This includes EVI due to refractive errors. The visual field is not measured. Early visual acuity is also measured with pinhole correction as a proxy for best corrected vision..
Low vision: visual acuity <6/18 but equal to or better than 3/60 in the better eye with available correction (presenting vision).

1. Introduction 11 This includes low vision due to refractive errors. It is equal to SVI + MVI. The visual field is not measured. Visual acuity is also measured with pinhole correction as a proxy for best corrected vision.
Functional Low Vision (FLV): visual acuity <6/18 but equal to or better than light perception in the better eye
FLV is permanent low vision that is not correctable or treatable, requiring low vision aids and/or mobility training.

2. RAAB – Survey design 12 Chapter 2. RAAB - Survey design 2.1 The RAAB methodology The Rapid Assessment of Avoidable Blindness (RAAB) is a simple and rapid population-based survey method that can provide data on the prevalence and causes of blindness. More than 230 RAABs have been successfully undertaken in over 40 countries, including Viet Nam in 2000 and 2007. The main aims of RAAB are:
• to estimate the prevalence and causes of avoidable blindness and visual impairment in people aged 50 and above
• to assess cataract surgical coverage • to identify the main barriers to the uptake of cataract surgery • to measure visual outcome after cataract surgery.
Using sound epidemiological methods, these data are used to design and monitor eye care programmes in the surveyed area. RAAB focuses primarily on the prevalence of avoidable blindness because the aim of VISION 2020: The Right to Sight is to eliminate 80 per cent of avoidable blindness by the year 2020. RAAB is rapid, because it only includes the over-50 age group, where the prevalence is the highest, so that sample size requirements are minimised. Also, data analysis is automatic, fast and does not require a statistician. RAAB is simple, because it uses straightforward sampling and examination techniques, and RAAB is relatively cheap, as it does not take a long time, does not require expensive ophthalmic equipment, and can be carried out by local staff. A RAAB is ideally carried out at the level of a district or province that has a population size of 0.5 to 5 million people. The sample size required is usually between 2,000 and 5,000 people. Clusters of people to include in the survey are randomly selected from across the survey area. Each day, a team visits one census enumeration area, a small, clearly demarcated area with a known population, often corresponding to a village or a town suburb. The team goes door to door until it has visited 50 people aged over 50 (the cluster). All selected people undergo visual acuity (VA) screening with a tumbling E chart and their lenses are examined. When the VA is lower than 6/12, an ophthalmologist determines the main cause. The information collected in the RAAB is used to estimate the prevalence and causes of blindness in the survey area. Data from a RAAB can also be used to assess outcome after cataract surgery, barriers to cataract surgery, and cataract surgical coverage. RAAB uses cluster sampling and the RAAB software package contains an automated programme to select a list of population units for the survey from the complete list of enumeration areas in the area (sampling frame). Sampling is effected through probability proportionate to size, so that population units with a larger population size have a greater chance of being included than those that are smaller. Households within clusters are selected through compact segment sampling. A map is obtained of the enumeration unit, showing major landmarks and the approximate distribution of neighbourhoods and households. The enumeration area is then divided into segments, so that each segment includes approximately 50 people aged over 50. For instance, if 300 people aged over 50 live in the area, it will be divided into six segments. One of the segments is chosen at random by drawing lots. The team, accompanied by a village guide, then visits all households in the segment door-to-door, until 50 people aged over 50 are identified. If the segment does not include 50 people aged over 50, another segment is chosen at random and sampling continues. If people are not available when the team arrives at the house, the team should revisit them so that they can be screened. This compact segment sampling is less subject to bias and has therefore replaced the ‘random walk’ method that was used in RACSS.

2. RAAB – Survey design 13 All eligible people undergo a standardized ophthalmic examination in their households. The team measures a distance of 3 and 6 meters with a rope. Visual acuity (VA) is measured with a Snellen tumbling E chart, using opto-types size 12, 18 and 60 at a 6 or 3 metre distance. This allows each eye to be classified as:
• can see 6/12 • cannot see 6/12 but can see 6/18 • cannot see 6/18 but can see 6/60 • cannot see 6/60 but can see 3/60 • cannot see 3/60 but can see 1/60 • light perception • no light perception.
If the person cannot see 6/12 in either eye with available correction, pinhole vision will also be measured. The lens status of all participants is assessed by both torch and distant direct ophthalmoscopy, by an ophthalmologist in a shaded or dark environment. All eyes that cannot see 6/12 with available correction are examined with a direct ophthalmoscope (and with a portable slit lamp if available) to assess the cause of the visual impairment. Only the primary cause of blindness or visual impairment is recorded. If there are two or more primary disorders, equally contributing to the visual loss, then the WHO convention is to record the cause that is easiest to treat or to prevent. All information is recorded on a standardised form. People who have a vision-impairing cataract are asked why they have not undergone cataract surgery, and up to two responses are marked per person in pre-coded categories. Those who have undergone cataract surgery are asked about the details of their operation (e.g. place, age, type of operation, cost of surgery). People with a treatable eye condition should be referred for appropriate treatment. Each team should consist of one ophthalmologist, who can diagnose the eye diseases, and of one assistant who can measure visual acuity. The teams will be accompanied every day by a local village guide. It is useful to have between two and five teams to minimise the duration of fieldwork. All teams are trained for at least four days, including a field practice where all teams cover one selected cluster. Training is conducted by a certified RAAB trainer. The survey will usually take between 4 and 12 weeks, depending upon the sample size and the number of teams. RAAB 2015 was conducted in 3 months from end of May to early August 2014, Data entry and data analysis A special software programme is developed for data entry and automatic standardised data analysis. In-built consistency checks and validation through double entry are used to identify and correct any errors in recording and data entry. Automated data analyses are performed on the cleaned data set. These produce estimates of:
• prevalence of blindness, severe (SVI) and moderate visual impairment (MVI) • age- and sex-adjusted prevalence of blindness, SVI, and MVI • prevalence of avoidable blindness, SVI, and MVI • causes of blindness, SVI, and MVI • cataract surgical coverage • outcome after cataract surgery • causes of poor outcome • satisfaction with cataract surgery • barriers to uptake of cataract surgery.
All tables report results for men and women separately, as well as together. A report of the RAAB, including the results, should be written and circulated to stakeholders in the programme. The results from the RAAB should be used to develop a VISION 2020 action

2. RAAB – Survey design 14 plan, to plan the cataract surgical services required, or to identify problems, such as poor outcomes after surgery or significant barriers to surgery, so that strategies can be developed to overcome these difficulties. 2.2 Population of Viet Nam The total population of Viet Nam in 2015 is estimated at 91,582,000 with 45,410,000 males (49.6%) and 46,172,000 females (50.4%). On average 30.77 million people (33.6%) live in urban areas and 60,83 million (66.4%) in rural areas. The average annual growth rate for the period 2009-’14 is projected at 1.09%.2 Using the population projections for 2015, 20.4% of the total population of Viet Nam is 50 years or older (18,717,000). Of all males 18.6% is 50+ (8,439,000), of the females 22.3% (10,278,000).1 Figure 1. Increase in the proportion of population aged 50 years and older, by sex, between 2009 and 2040 1
Figure 1 shows that the proportion of the population aged 50 years and older is projected to double from 17.3% in 2009 to 34.5% in 2039. The actual number of people aged 50+ is projected to grow from 14,851 million in 2009 to 36,868 million in 2039, an increase of nearly 2.5 times. In 2015, 8.439 million males are 50 or older and 10.278 million females (Figure 2). The total
population (all ages) is projected to increase from 85.85 million in 2009 to 106.89 million in 2039, an increase of 1.25 times. Viet Nam is experiencing the aging trend and its population is aging rapidly. This will cause a sharp increase in the incidence of age related diseases, including blindness and visual impairment. Figure 2. Projected males and females aged 50+, between 2010 and 2030
The life expectancy increases from 71 in 2005 to 79 in 2040; for males from 68 to 76 and for females from 74 to 82 over the same period. 3 This will also increase the incidence of age related eye diseases, visual impairment and blindness. Eye care services and their output throughout Viet Nam
have to increase as well in order to balance this annual increase in incidence and to reduce the backlog further. 2 Population Projections for Viet Nam 2009 – 2049. Ministry of Planning and Investment. General Statistics Office, Hanoi, February 2011 3 US Census Bureau, International Database. https://www.census.gov/population/international/data/idb/informationGateway.php

2. RAAB – Survey design 15 2.3 Selection of 14 provinces For the surveys on blindness and low vision in 2015, 14 provinces were selected where a RAAB would be conducted. Table 2 shows these 14 provinces (third column) and the total projected population of the selected province and the region in 2015. These 14 provinces were selected purposely for the RAAB 2015 survey. Five of these provinces (Bac Ninh, Phu Tho, Gia Lai, Vung Tau and Tien Giang) also had a RAAB survey in 2007-’08 and three (Phu Tho, Gia Lai and Tien Giang) in 2000 – ’02. (see Table 1). Findings from these surveys in 2015 can easily be compared with those from 2007–’08 and 2000 – ‘02 to measure any changes in blindness indicators since then. The other provinces were selected to provide an even spread over the different regions of Viet Nam. All ecological zones have one or more provinces where a RAAB is conducted. Table 2. Provinces selected for RAAB surveys in 2015 1
Region Population in Region Province Population
in province Population 50+
in province % 50+ Northern Midlands and Mountains 11,743,000
Tuyen Quang 758,235 147,450 19.4 Phu Tho 1,365,105 319,238 23.4 Dien Bien 532,211 68,415 12.9
Red River Delta 20,770,000 Bac Ninh 1,096,580 239,611 21.9 Nam Dinh 1,876,655 504,044 26.9 North and South Central Coast 19,494,000
Ha Tinh 1,235,828 313,904 25.4 Quang Tri 618,131 128,850 20.8 Quang Ngai 1,234,996 262,570 21.3
Central Highlands 5,628,000 Gia Lai 1,407,289 199,239 14.2
Lam Dong 1,297,786 220,488 17.0 Southeast 16,077,000 Vung Tau 1,086,968 156,803 16.5
Binh Duong 1,929,721 225,345 11.7 Mekong River Delta 17,887,000 Tien Giang 1,722,767 399,073 23.2
Ca Mau 1,258,170 239,608 19.0 Viet Nam 91,582,000 17,420,442 3,472,742 21.0
Although the 14 provinces were not selected at random from entire Viet Nam, they are well spread over the country and each region is represented. The total population in the 14 sampled provinces is 17.42 million, 19.0% of the total population of Viet Nam. With a total sample size of 28,000 (560 clusters of 50 people from 14 provinces well spread over entire Viet Nam), the weighted average findings from all 14 provincial RAABs should give a good picture of blindness in entire Viet Nam. Besides that the data for each province provide valuable information to monitor progress in provinces that were surveyed earlier and to start need based planning of eye care services in the new provinces. The province is the management unit for eye care services in Viet Nam and has an average population of 1.45 million people (all age groups).

2. RAAB – Survey design 16
2.4 Location of 14 provinces Figure 3 shows the location of the selected provinces and their distribution over the country. Figure 3. Map of all provinces of Viet Nam and those selected for RAAB survey in 2015

2. RAAB – Survey design 17 Table 3 shows the projected population in each of the 14 selected provinces in 2015, and the composition by gender. On average 49.5% of the total population is male, varying from 48.1% in Binh Duong to 50.4% in Tuyen Quang province. Table 3. Total population by province in 2015 and % males 1
Population in 2015 Province Male Female Total % Male Tuyen Quang 381,812 376,423 758,235 50.4 Phu Tho 675,373 689,732 1,365,105 49.5 Dien Bien 266,153 266,058 532,211 50.0 Bac Ninh 540,782 555,798 1,096,580 49.3 Nam Dinh 922,962 953,693 1,876,655 49.2 Ha Tinh 615,184 620,644 1,235,828 49.8 Quang Tri 306,197 311,934 618,131 49.5 Quang Ngai 612,207 622,789 1,234,996 49.6 Gia Lai 706,295 700,994 1,407,289 50.2 Lam Dong 650,073 647,713 1,297,786 50.1 Vung Tau 543,779 543,189 1,086,968 50.0 Binh Duong 928,428 1,001,293 1,929,721 48.1 Tien Giang 849,670 873,097 1,722,767 49.3 Ca Mau 632,569 625,601 1,258,170 50.3 Total 8,631,484 8,788,958 17,420,442 49.5
2.5 Weighting factors The total population in the 14 provinces varies from 532,211 in Dien Bien to 1,929,721 in Binh Duong Province. In each province the same sample size of 2,000 people aged 50 years and older is used: 40 clusters of 50 people aged 50+. This design is chosen to provide fairly reliable and comparable data on blindness and low vision at provincial level. This survey was not designed to calculate a prevalence estimate for entire Viet Nam because the clusters were not randomly selected from the whole country. However, with detailed data from 14 of the total 64 provinces, well spread over the country and covering 19.0% of the total population of Viet Nam, a fair estimate can be made. When we combine all the survey records from all 14 provinces, we have a total of 28,000 records. But because the sample size is the same for a province with a small population as for a province with a large population, their ‘weight’ to determine the final prevalence is the same. Ideally, the weight should be proportional to the number of people aged 50 years and older in each province. Table 4 shows the number of males, females and total people aged 50+ in each of the 14 provinces. By dividing the number of males 50+ in each province by the total of males aged 50+ in all 14 provinces (100%), the percentage of males living in that province can be calculated. This percentage is the weighting factor for males for that province. A province with many males 50+ will have a high weighting factor (percentage males 50+), a province with few males 50+ will have a lower weighting factor. The sum of all weighting factors together adds to 100%. The same procedure is followed for females and for all people aged 50+. Each province has a weighting factor for males, females and the total population. To calculate the weighted average, the prevalence of a condition in each of the 14 provinces is multiplied by the weighting factor of the corresponding province and the sum of these resulting coefficients is the weighted average for that condition. We assume that the weighted average for all 14 provinces is indicative for entire Viet Nam.
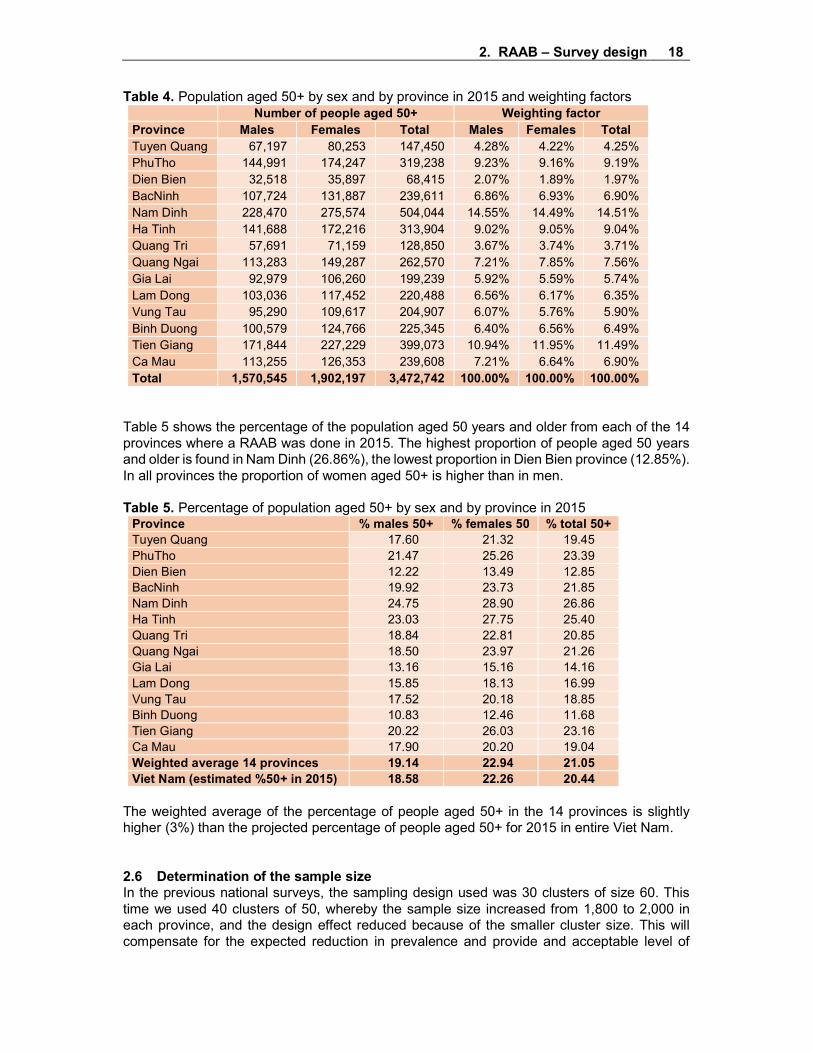
2. RAAB – Survey design 18 Table 4. Population aged 50+ by sex and by province in 2015 and weighting factors
Number of people aged 50+ Weighting factor Province Males Females Total Males Females Total Tuyen Quang 67,197 80,253 147,450 4.28% 4.22% 4.25% PhuTho 144,991 174,247 319,238 9.23% 9.16% 9.19% Dien Bien 32,518 35,897 68,415 2.07% 1.89% 1.97% BacNinh 107,724 131,887 239,611 6.86% 6.93% 6.90% Nam Dinh 228,470 275,574 504,044 14.55% 14.49% 14.51% Ha Tinh 141,688 172,216 313,904 9.02% 9.05% 9.04% Quang Tri 57,691 71,159 128,850 3.67% 3.74% 3.71% Quang Ngai 113,283 149,287 262,570 7.21% 7.85% 7.56% Gia Lai 92,979 106,260 199,239 5.92% 5.59% 5.74% Lam Dong 103,036 117,452 220,488 6.56% 6.17% 6.35% Vung Tau 95,290 109,617 204,907 6.07% 5.76% 5.90% Binh Duong 100,579 124,766 225,345 6.40% 6.56% 6.49% Tien Giang 171,844 227,229 399,073 10.94% 11.95% 11.49% Ca Mau 113,255 126,353 239,608 7.21% 6.64% 6.90% Total 1,570,545 1,902,197 3,472,742 100.00% 100.00% 100.00%
Table 5 shows the percentage of the population aged 50 years and older from each of the 14 provinces where a RAAB was done in 2015. The highest proportion of people aged 50 years and older is found in Nam Dinh (26.86%), the lowest proportion in Dien Bien province (12.85%). In all provinces the proportion of women aged 50+ is higher than in men. Table 5. Percentage of population aged 50+ by sex and by province in 2015
Province % males 50+ % females 50 % total 50+ Tuyen Quang 17.60 21.32 19.45 PhuTho 21.47 25.26 23.39 Dien Bien 12.22 13.49 12.85 BacNinh 19.92 23.73 21.85 Nam Dinh 24.75 28.90 26.86 Ha Tinh 23.03 27.75 25.40 Quang Tri 18.84 22.81 20.85 Quang Ngai 18.50 23.97 21.26 Gia Lai 13.16 15.16 14.16 Lam Dong 15.85 18.13 16.99 Vung Tau 17.52 20.18 18.85 Binh Duong 10.83 12.46 11.68 Tien Giang 20.22 26.03 23.16 Ca Mau 17.90 20.20 19.04 Weighted average 14 provinces 19.14 22.94 21.05 Viet Nam (estimated %50+ in 2015) 18.58 22.26 20.44
The weighted average of the percentage of people aged 50+ in the 14 provinces is slightly higher (3%) than the projected percentage of people aged 50+ for 2015 in entire Viet Nam. 2.6 Determination of the sample size In the previous national surveys, the sampling design used was 30 clusters of size 60. This time we used 40 clusters of 50, whereby the sample size increased from 1,800 to 2,000 in each province, and the design effect reduced because of the smaller cluster size. This will compensate for the expected reduction in prevalence and provide and acceptable level of

2. RAAB – Survey design 19 accuracy. A sample size of 2,000 was considered to be the maximum possible in each province, considering the available manpower and funds. A sample of 2,000 will have enough power to estimate a prevalence of 3.1% (the weighted average prevalence in 2007-’08) with a variation of 32% and a non-compliance of 10% at 95% probability (see Figure 4). The combined data will provide a weighted average estimate, that may be applied to entire Viet Nam, with a much higher accuracy. Figure 4. Calculation of the sample size
2.7 Selection of subjects within each province For each of the 14 provinces we used a sampling frame consisting of all enumeration areas (EAs) and the number of households in each EA, from the 2009 national census, provided by the General Statistics Office (GSO) in Hanoi. The size of the EAs varied between 9 and 474 households, with an average of 125 households. With an average of 5 persons per household, the average EAs is expected to have at around 600 people of all ages, of whom 20% (125) are aged 50+. In case selected EAs had less than 100 households, a second (‘geographically next nearest’) EA was selected where the examinations could be continued in case there were less than 50 eligible persons in the selected EA. Hand-drawn maps are available from the provincial offices to show the location of the selected EA with the main roads and its boundaries. This detailed information makes it very easy for the survey teams to locate the households that are eligible for examination. In each of the 14 provinces, 40 EAs were selected by systematic sampling, using the special module in the RAAB software. This ensures that the selection is done with a probability proportional to the size of the population in each EA. With on average 20% of the population aged 50+, it is expected that among 250 people of all ages there would be 50 people aged 50+. With an average household size of 5, an EA with 50 HH could be expected to provide 50 people aged 50+. If the selected EA has more than 100 households, the selected EA had to be divided in segments with an equal number of households, enough to provide 50 people aged 50+. The map of the EA was essential to find the exact locality, and to divide the EA into segments with approximately 50 households each, if needed. Each segment was given a number on the map. Then ballot papers were made with the same numbers, these were folded and tossed and the village headman was asked to draw two ballots: the first number for the segment of the

2. RAAB – Survey design 20 segment where all households were visited to find the 50 eligible people for examination. The second ballot was to be used in case the first segment would not provide all 50 people for the cluster. Within the selected segment the survey team went door-to-door to find eligible people and asked them to be examined. If they refused, or were not found at home, efforts were made to revisit them. People who were absent for a long time or kept refusing were included in the survey, and were not replaced by others who happened to be at home. The team continued in the same segment until 50 forms were completed. Ethnic differences No information was collected about the ethnic background of the survey participants. Therefore, no information is available about any relation between ethnic background and prevalence of visual impairment in Viet Nam. Reports In accordance with WHO recommendations, the RAAB software reports both the best corrected or pinhole VA, as well as the presenting VA, that is with the correction available to the patient. The prevalence of presenting VA includes patients blind due to refractive errors and uncorrected aphakia. The sampling error for the prevalence estimates of most conditions, as well as the design effect (DEFF), are calculated for cluster sampling by the RAAB software, using the formula’s provided by Bennett, Woods et al (1991).4 The sampling error is expressed in the variation around the prevalence estimates and their corresponding 95% Confidence intervals given in reports generated by the RAAB software and in the tables below.
4 Bennett S, Woods T, Liyanage WM, Smith DL.A simplified general method for cluster-sample surveys of health in developing countries. World Health Stat Q. 1991;44(3):98-106.

3. Survey findings 2015 21 Chapter 3. Survey findings 2015 3.1 Sample results from RAAB surveys per province and weighted average Table 6 shows the sample size and the coverage in the 14 provinces. The coverage varied between 91.8% in Tien Giang to 100% in Quang Tri (Table 6). Table 6. Sample size and coverage in 14 provinces
Province Sample size Examined Coverage Tuyen Quang 1,999 1,919 96.0% Phu Tho 1,997 1,955 97.9% Dien Bien 1,999 1,965 98.3% Bac Ninh 1,974 1,889 95.7% Nam Dinh 1,999 1,931 96.6% Ha Tinh 1,983 1,971 99.4% Quang Tri 1,998 1,998 100.0% Quang Ngai 2,000 1,995 99.8% Gia Lai 2,000 1,961 98.1% Lam Dong 2,000 1,966 98.3% Vung Tau 2,000 1,933 96.7% Binh Duong 1,999 1,971 98.6% Tien Giang 1,999 1,835 91.8% Ca Mau 1,999 1,862 93.1% Total 7,946 27,151 97.2%
Table 7 shows the sample prevalence of blindness in people aged 50+ (old WHO definition: pinhole VA<3/60 in the better eye) for all 14 provinces. A weighted prevalence estimate is also calculated, which gives an indication of the prevalence in the whole of Viet Nam. The difference is significant if the two 95% Confidence intervals do not overlap. Table 7. Prevalence of blindness (pinhole VA<3/60 in the better eye) in sample
Males Females Total Province n % 95%CI n % 95%CI n % 95%CI Tuyen Quang 12 1.5% (0.6-2.4) 51 4.5% (3.0-6.0)* 63 3.3% (2.3-4.3) Phu Tho 8 1.1% (0.4-1.8) 23 1.9% (1.0-2.8) 31 1.6% (1.0-2.2) Dien Bien 24 2.9% (1.8-3.9) 49 4.4% (2.8-5.9) 73 3.7% (2.7-4.7) Bac Ninh 14 1.8% (0.5-3.1) 54 4.8% (3.7-6.0)* 68 3.6% (2.6-4.6) Nam Dinh 12 1.5% (0.6-2.4) 45 4.0% (2.9-5.0)* 57 3.0% (2.2-3.7) Ha Tinh 6 0.8% (0.1-1.6) 21 1.7% (0.4-3.0) 27 1.4% (0.4-2.4) Quang Tri 17 2.2% (1.2-3.1) 47 3.9% (2.6-5.1) 64 3.2% (2.3-4.1) Quang Ngai 10 1.4% (0.6-2.3) 15 1.2% (0.6-1.8) 25 1.3% (0.7-1.8) Gia Lai 13 1.6% (0.7-2.6) 23 2.0% (1.2-2.8) 36 1.8% (1.2-2.5) Lam Dong 10 1.3% (0.6-2.0) 18 1.5% (0.9-2.1) 28 1.4% (1.0-1.9) Vung Tau 15 1.7% (0.7-2.8) 22 2.1% (1.1-3.0) 37 1.9% (1.2-2.7) Binh Duong 12 1.7% (0.9-2.5) 28 2.2% (1.1-3.3) 40 2.0% (1.2-2.8) Tien Giang 11 1.6% (0.6-2.5) 32 2.8% (1.9-3.8) 43 2.3% (1.6-3.1) Ca Mau 15 2.0% (1.0-3.0) 35 3.2% (2.0-4.4) 50 2.7% (1.8-3.5) Weighted average 179 1.5% (1.3-1.8) 463 2.8% (2.5-3.0)* 642 2.3% (2.1-2.5)
*: Significant difference

3. Survey findings 2015 22 The sample prevalence of bilateral blindness (pinhole VA<3/60 in the better eye) in people aged 50+ ranged from 1.3% in Quang Ngai to 3.7% in Dien Bien. In males the prevalence varied from 0.8% in Ha Tinh province to 2.9% in Dien Bien province, in females from 1.2% in Quang Ngai province to 4.8% in Bac Ninh. The weighted average prevalence of blindness for Viet Nam is 2.3% (95%CI: 2.1-2.5%): 1.5% (1.3-1.8) for males and 2.8% (2.5-3.0) for females, a significant difference (p<0.0001). Table 8 shows the prevalence of bilateral blindness with available correction (includes cases with uncorrected refractive errors) in the sample. The prevalence in females is significantly higher than in males in Tuyen Quang, Bac Ninh and Nam Dinh province. Also the weighted average sample prevalence in females is significantly higher compared to males (p<0.0001). Table 8. Prevalence of bilateral blindness in sample (presenting VA<3/60 in the better eye)
Males Females Total Province n % 95%CI n % 95%CI n % 95%CI Tuyen Quang 15 1.9% (0.9-2.9) 51 4.5% (3.0-6.0)* 66 3.4% (2.4-4.4) Phu Tho 9 1.2% (0.5-1.9) 27 2.2% (1.3-3.2) 36 1.8% (1.2-2.5) Dien Bien 25 3.0% (2.0-4.0) 50 4.4% (2.9-6.0) 75 3.8% (2.8-4.8) Bac Ninh 14 1.8% (0.5-3.1) 54 4.8% (3.7-6.0)* 68 3.6% (2.6-4.6) Nam Dinh 12 1.5% (0.6-2.4) 45 4.0% (2.9-5.0)* 57 3.0% (2.2-3.7) Ha Tinh 6 0.8% (0.1-1.6) 24 1.9% (0.5-3.4) 30 1.5% (0.4-2.6) Quang Tri 17 2.2% (1.2-3.1) 49 4.1% (2.8-5.3) 66 3.3% (2.4-4.2) Quang Ngai 11 1.6% (0.6-2.5) 18 1.4% (0.7-2.1) 29 1.5% (0.8-2.1) Gia Lai 13 1.6% (0.7-2.6) 26 2.2% (1.3-3.2) 39 2.0% (1.3-2.7) Lam Dong 10 1.3% (0.6-2.0) 21 1.7% (1.1-2.4) 31 1.6% (1.1-2.1) Vung Tau 17 2.0% (0.8-3.1) 26 2.4% (1.3-3.5) 43 2.2% (1.3-3.1) Binh Duong 15 2.2% (1.2-3.1) 33 2.6% (1.4-3.8) 48 2.4% (1.5-3.4) Tien Giang 11 1.6% (0.6-2.5) 33 2.9% (2.0-3.9) 44 2.4% (1.7-3.1) Ca Mau 18 2.4% (1.2-3.5) 35 3.2% (2.0-4.4) 53 2.8% (2.0-3.7) Weighted average 193 1.6% (1.4-1.9) 492 2.9% (2.7-3.2)* 685 2.4% (2.2-2.6)
*: Significant difference Table 9 shows the sample prevalence of bilateral cataract blindness (pinhole VA<3/60 in the better eye) in people aged 50+. Table 9. Sample prevalence bilateral cataract blindness (pinhole VA<3/60 in the better eye)
Males Females Total Province n % 95%CI n % 95%CI n % 95%CI Tuyen Quang 4 0.5% (0.0-1.0) 33 2.9% (1.6-4.3)* 37 1.9% (1.1-2.7) Phu Tho 6 0.8% (0.2-1.4) 18 1.5% (0.7-2.3) 24 1.2% (0.7-1.7) Dien Bien 16 1.9% (0.9-2.9) 41 3.6% (2.1-5.1) 57 2.9% (1.9-3.9) Bac Ninh 3 0.4% (0.0-0.8) 31 2.8% (1.9-3.7)* 34 1.8% (1.2-2.4) Nam Dinh 7 0.9% (0.3-1.5) 33 2.9% (2.0-3.9) 40 2.1% (1.4-2.7) Ha Tinh 4 0.6% (0.0-1.2) 16 1.3% (0.3-2.3) 20 1.0% (0.2-1.8) Quang Tri 10 1.3% (0.6-2.0) 36 3.0% (1.8-4.2) 46 2.3% (1.4-3.2) Quang Ngai 5 0.7% (0.1-1.3) 8 0.6% (0.1-1.1) 13 0.7% (0.2-1.1) Gia Lai 6 0.7% (0.1-1.4) 15 1.3% (0.6-2.0) 21 1.1% (0.5-1.7) Lam Dong 6 0.8% (0.2-1.4) 8 0.7% (0.2-1.1) 14 0.7% (0.3-1.1) Vung Tau 8 0.9% (0.3-1.6) 17 1.6% (0.7-2.5) 25 1.3% (0.7-1.9) Binh Duong 6 0.9% (0.2-1.5) 21 1.6% (0.9-2.4) 27 1.4% (0.8-1.9) Tien Giang 6 0.8% (0.2-1.5) 21 1.9% (1.0-2.8) 27 1.5% (0.9-2.1) Ca Mau 11 1.4% (0.7-2.2) 24 2.2% (1.3-3.1) 35 1.9% (1.2-2.6) Weighted average 98 0.8% (0.7-1.0) 322 1.9% (1.7-2.1)* 420 1.5% (1.3-1.6)

3. Survey findings 2015 23 *: Significant difference The prevalence ranged from 0.7% in Quang Ngai and Lam Dong to 2.9% in Dien Bien. In males the prevalence varied from 0.4% in Bac Ninh to 1.9% in Dien Bien province, in females from 0.6% in Quang Ngai to 3.6% in Dien Bien. The weighted average sample prevalence of bilateral cataract blindness is 1.5% (1.3-1.6%): 0.8% (0.7-1.0) for males and 1.9% (1.7-2.1) for females, a significant difference (p<0.0001). Because of the relatively low sample size in each province, the variation around the estimate at 95% probability is relatively high. For the sample prevalence of bilateral blindness it varies between 27.0% in Dien Bien to 73.6% in Ha Tinh, with an average of 36.5%, which is slightly higher than the assumed 32% at the planning stage. For the weighted average, the Sampling Error (0.10) was much lower because of the large sample size of the combined records (27,946), resulting in a variation of 8.2% around the estimate (Table 10). Table 10. Prevalence of bilateral blindness (presenting VA <3/60 in the better eye), variation, variation as proportion of prevalence and Design Effect
Province Prev. (%) SE Var. (95%CI) Var/Prev DEFF Tuyen Quang 3.44 0.51 (2.42-4.46) 29.6% 1.52 Phu Tho 1.84 0.32 (1.21-2.47) 34.0% 1.08 Dien Bien 3.82 0.52 (2.79-4.85) 27.0% 1.45 Bac Ninh 3.60 0.51 (2.60-4.60) 27.8% 1.39 Nam Dinh 2.95 0.40 (2.15-3.75) 27.1% 1.10 Ha Tinh 1.52 0.57 (0.40-2.64) 73.6% 4.21 Quang Tri 3.30 0.48 (2.36-4.25) 28.7% 1.43 Quang Ngai 1.45 0.34 (0.79-2.12) 45.9% 1.58 Gia Lai 1.99 0.38 (1.25-2.73) 37.4% 1.42 Lam Dong 1.58 0.25 (1.09-2.06) 30.9% 0.77 Vung Tau 2.22 0.45 (1.33-3.12) 40.1% 1.80 Binh Duong 2.44 0.48 (1.48-3.39) 39.2% 1.93 Tien Giang 2.40 0.36 (1.69-3.11) 29.5% 1.00 Ca Mau 2.85 0.44 (1.98-3.71) 30.5% 1.29 Weighed average 2.41 0.10 (2.21-2.61) 8.2% 1.57
SE: Sampling error DEFF: Design Effect Var/Prev: variation as percentage of prevalence In some provinces, notably Ha Tinh, Binh Duong and Vung Tau, the Design Effect was relatively high, but in most provinces the DEFF was around 1.5 or even less. The weighted average DEFF was 1.57, lower than assumed in the sample size calculation. A high DEFF indicates that the condition under examination is not evenly spread in the examined population. When DEFF is around 1 it means that the condition is even spread among the participants. We may have to look in more detail at Ha Tinh, Binh Duong and Vung Tau to understand why service uptake is so unevenly distributed. Are there certain areas in these provinces without services? Are there certain population groups that don’t have access or don’t want to use services? 3.2 Age and sex adjusted prevalence Most blinding eye diseases are age-related and their prevalence may also differ by sex. Ideally, the age and sex composition of the sample is similar to that of the entire province. In that case the sample is representative for the province and the sample prevalence is equal to the age and sex adjusted prevalence. However, often the age and sex composition of the sample differs from the actual population. To correct this, and to be able to make extra-polations to the actual population in the province, the RAAB software compares the age and sex composition of the sample with that of the entire province and adjusts the age and sex specific prevalence from the sample to that of the actual population of the province.

3. Survey findings 2015 24 To correct this, and to be able to make extra-polations to the actual population in the province, the RAAB software compares the age and sex composition of the sample with that of the entire province and adjusts the age and sex specific prevalence from the sample to that of the actual population of the province. Hence the age and sex adjusted prevalence represents the actual situation in the province.
In table 11 the age and sex adjusted prevalence of bilateral blindness and the estimated number of cases in each province are shown. The highest adjusted prevalence is found in Dien Bien and Bac Ninh (2.5%), the lowest in Quang Ngai Province (0.9%). Although the adjusted prevalence in women is higher than in men in all provinces, the difference is not significant, with exception of Nam Dinh province and the weighted average. Table 11. Adjusted prevalence of blindness (presenting VA<3/60 in the better eye) and estimated number of cases
Males Females Total Province n % CI 95% n % CI 95% n % CI 95% Tuyen Quang 818 1.2% (0.2-2.2) 2,504 3.1% (1.6-4.7) 3,322 2.3% (1.2-3.3) Phu Tho 1,244 0.9% (0.2-1.6) 2,449 1.4% (0.4-2.4) 3,693 1.2% (0.5-1.8) Dien Bien 694 2.1% (1.1-3.1) 1,085 3.0% (1.5-4.6) 1,779 2.6% (1.6-3.6)* Bac Ninh 1,611 1.5% (0.2-2.8) 4,370 3.3% (2.1-4.5) 5,981 2.5% (1.5-3.5) Nam Dinh 2,303 1.0% (0.1-1.9)* 8,209 3.0% (1.9-4.0)* 10,512 2.1% (1.3-2.9) Ha Tinh 991 0.7% (0.0-1.4) 2,558 1.5% (0.0-2.9) 3,549 1.1% (0.1-2.2) Quang Tri 856 1.5% (0.5-2.5) 1,923 2.7% (1.4-4.0) 2,779 2.2% (1.2-3.1) Quang Ngai 1,112 1.0% (0.0-2.0) 1,654 1.1% (0.4-1.8) 2,766 1.1% (0.4-1.7) Gia Lai 868 0.9% (0.0-1.9) 1,583 1.5% (0.6-2.4) 2,451 1.2% (0.5-2.0) Lam Dong 905 0.9% (0.2-1.6) 1,595 1.4% (0.7-2.0) 2,500 1.1% (0.7-1.6)* Vung Tau 1,267 1.3% (0.2-2.5) 2,541 2.3% (1.2-3.4) 3,808 1.9% (1.0-2.7) Binh Duong 1,488 1.5% (0.5-2.4) 2,530 2.0% (0.8-3.2) 4,018 1.8% (0.8-2.7) Tien Giang 2,413 1.4% (0.4-2.4) 5,907 2.6% (1.6-3.6) 8,320 2.1% (1.4-2.8) Ca Mau 2,000 1.8% (0.6-2.9) 3,576 2.8% (1.6-4.0) 5,576 2.3% (1.5-3.2) Weighted average 18,570 1.2% (1.0-1.4) 42,484 2.2% (2.0-2.5)* 61,054 1.8% (1.6-2.0) Viet Nam 99,782 1.2% 229,551 2.2% 329,333 1.8%
*: Significant difference There is a factor 2.4 difference between the highest (Dien Bien: 2.6%) and lowest (Lam Dong: 1.1%) adjusted prevalence of blindness and this is significant. The difference with the other provinces is not statistically significant. Assuming that the weighted average is a fair representation of the situation in entire Viet Nam, the weighted average of 1.8% (CI95%: 1.6-2.0%) can be extrapolated to the total projected population aged 50+ in Viet Nam in 2015. That would give an estimated 329,333 people who are blind in that
For the data analysis in the 14 provinces population data were used from the report ‘Population Projections for Viet Nam 2009 – 2049’, published by the Ministry of Planning and Investment, General Statistics Office, Hanoi, February 2011. During data analysis it was noticed that in all 14 provinces the age group 50-59 was under-represented in the sample, while the age groups 60-69, 70-79 and 80+ were over-represented. As a result, the age and sex adjusted prevalence was considerably lower than the sample prevalence in all 14 provinces. The population projections in this report are based on the data from the latest national census in 2009, and the population data for 2009 are consistent with those from the census report. Also in 2007, the age group 50-59 was under-represented in all 16 provinces, although to a lesser degree than in 2015.

3. Survey findings 2015 25 year: 99,782 males and 229,551 females. The prevalence in males (1.2% (CI95%: 1.0-1.4%)) is significantly lower than in females (2.2% (2.0–2.5)). The data from table 11 is also shown in figure 5. The square represents the calculated prevalence and the line the variation around that estimate. It is clearly visible that Dien Bien province has the highest prevalence but also a wide variation around the estimate. Because of the large sample size, the variation around the weighted average is very narrow compared to that of the individual provinces with their much smaller sample sizes. The width of the variation is also an indicator whether the condition under investigation (blindness) is evenly spread in the population of the provinces. When it is spread evenly, the variation is less (Lam Dong) than when the condition is spread unevenly (Ha Tinh) within the province. Figure 5. Adjusted prevalence of bilateral blindness (presenting VA<3/60 in the better eye) with 95% Confidence interval
Comparing the sample prevalence (Table 8) and adjusted prevalence (Table 11) for bilateral blindness (presenting VA<3/60 in the better eye) shows that the adjusted prevalence was 13% (Tien Giang) to 38% (Gia Lai) lower compared to the sample prevalence. Using sample results would have resulted in a considerable over-estimation of blindness and low vision. This is caused by the fact that in all provinces relatively more elderly people were seen and less people in the younger age groups, compared to the actual population in the province (Table 12).
0.0%0.5%1.0%1.5%2.0%2.5%3.0%3.5%4.0%
Prevalence Lower Confidence Level Upper Confidence Level

3. Survey findings 2015 26 Table 12. Comparing sample prevalence and adjusted prevalence of bilateral blindness (presenting VA <3/60 in the better eye)
Province Sample Prev. (%) Adjusted Prev. (%) Difference Difference (%) Tuyen Quang 3.44 2.25 -1.19 -34% Phu Tho 1.84 1.16 -0.68 -37% Dien Bien 3.82 2.60 -1.22 -32% Bac Ninh 3.60 2.50 -1.10 -31% Nam Dinh 2.95 2.09 -0.87 -29% Ha Tinh 1.52 1.13 -0.39 -26% Quang Tri 3.30 2.16 -1.15 -35% Quang Ngai 1.45 1.05 -0.40 -28% Gia Lai 1.99 1.23 -0.76 -38% Lam Dong 1.58 1.13 -0.44 -28% Vung Tau 2.22 1.86 -0.37 -16% Binh Duong 2.44 1.78 -0.65 -27% Tien Giang 2.40 2.08 -0.31 -13% Ca Mau 2.85 2.33 -0.52 -18% Weighed average 2.41 1.76 -0.65 -27%
SE: Sampling error DEFF: Design Effect Var/Prev: variation as percentage of prevalence Table 13 shows the adjusted prevalence of severe visual impairment (SVI) and moderate visual impairment (MVI). The highest prevalence of SVI is found in Ha Tinh, the lowest in Phu Tho and Lam Dong province. For MVI, the highest prevalence is found in Ha Tinh, the lowest in Dien Bien province. In the 14 provinces together there are 67,231 people with SVI and 328,521 with MVI. Extrapolated to the total population of Viet Nam there are an estimated 362,493 people with SVI and 1,771,353 people with MVI: 667,911 men and 1,103,441 women. Table 13. Adjusted prevalence of severe (SVI) and moderate bilateral visual impairment (MVI) and estimated number of cases in people aged 50+
Presenting VA<6/60 – 3/60 (SVI) Presenting VA<6/18 – 6/60 (MVI) Province n Prev. Var.(CI 95%) n Prev. Var.(CI 95%) Tuyen Quang 1,763 1.2% (0.6-1.8) 11,268 7.6% (6.1-9.2) Phu Tho 3,419 1.1% (0.6-1.5) 31,859 10.0% (7.6-12.4) Dien Bien 1,218 1.8% (0.6-3.0) 3,280 4.8% (3.2-6.4) Bac Ninh 3,782 1.6% (0.9-2.3) 16,507 6.9% (5.3-8.5) Nam Dinh 9,131 1.8% (1.0-2.6) 43,287 8.6% (6.4-10.8) Ha Tinh 12,355 3.9% (2.4-5.4) 42,607 13.6% (10.9-16.3) Quang Tri 2,932 2.3% (1.5-3.1) 14,015 10.9% (9.3-12.4) Quang Ngai 5,382 2.0% (1.2-2.9) 29,126 11.1% (8.0-14.2) Gia Lai 3,636 1.8% (1.0-2.6) 10,592 5.3% (4.2-6.5) Lam Dong 2,514 1.1% (0.5-1.8) 20,066 9.1% (7.4-10.8) Vung Tau 6,448 3.1% (1.9-4.4) 17,338 8.5% (6.8-10.1) Binh Duong 3,011 1.3% (0.6-2.1) 15,809 7.0% (4.8-9.3) Tien Giang 6,934 1.7% (1.2-2.3) 42,759 10.7% (9.0-12.4) Ca Mau 4,706 2.0% (1.2-2.7) 30,008 12.5% (10.4-14.7) Weighted average 67,231 1.9% (1.8-2.1) 328,521 9.5% (9.1-9.8) All Viet Nam 362,493 1.9% 1,771,353 9.5%
SVI and MVI combined are also called low vision (PVA<6/18-3/60). The adjusted prevalence of low vision (presenting VA<6/18-3/60) due to all causes in Viet Nam is 11.4%, an estimated 2.1 million people: 791,524 males (9.4%) and 1,307,886 females (12.7%).

3. Survey findings 2015 27 The data from Table11 and Table 13 is also shown in figure 6. The weighted average of the 14 provinces is assumed to represent the prevalence for entire Viet Nam. Figure 6. Adjusted prevalence of bilateral blindness, severe (SVI) and moderate (MVI) visual impairment with available correction in the better eye
The adjusted prevalence for bilateral blindness due to cataract has been calculated as well for each of the 14 provinces. (Table 14) The highest adjusted prevalence of cataract blindness is found in Dien Bien province (1.9%), the lowest in Quang Ngai and Lam Dong (0.5%). This difference is significant (p<0.05). There are an estimated 35.951 people blind due to cataract in the 14 provinces: 8,845 men and 27,106 women. The adjusted prevalence of cataract blindness in women is higher than in men, except in Lam Dong province, but the difference is never significant. This is caused by the fact that women live longer and therefore have a higher risk of developing cataract. A second factor is that, except for Lam Dong province, less women are operated upon. We may see this also reflected in the cataract surgical coverage and in the barriers to cataract surgery. Extrapolation of the weighted prevalence against the total population of Viet Nam indicates that there are an estimated 193,987 people aged 50+ blind due to cataract in Viet Nam: 47,527 men (25%) and 146,460 women (75%). Also here the prevalence in females is significantly higher than in males. One out of every 4 persons blind due to cataract is a male, the other 3 are female.

3. Survey findings 2015 28 Table 14. Adjusted prevalence of bilateral cataract blindness (pinhole VA<3/60 in the better eye) and estimated number of cases in people aged 50+
Males Females Total Province n % n % n % Var. (CI95%) Tuyen Quang 201 0.3% 1,645 2.0% 1,846 1.3% (0.5-2.0) Phu Tho 712 0.5% 1,617 0.9% 2,329 0.7% (0.2-1.2) Dien Bien 450 1.4% 872 2.4% 1,322 1.9% (0.9-2.9)* Bac Ninh 369 0.3% 2,417 1.8% 2,786 1.2% (0.5-1.8) Nam Dinh 1,209 0.5% 6,004 2.2% 7,213 1.4% (0.8-2.1) Ha Tinh 377 0.3% 1,657 1.0% 2,034 0.6% (0.0-1.5) Quang Tri 483 0.8% 1,419 2.0% 1,902 1.5% (0.6-2.3) Quang Ngai 502 0.4% 689 0.5% 1,191 0.5% (0.0-0.9)* Gia Lai 317 0.3% 845 0.8% 1,162 0.6% (0.0-1.2) Lam Dong 571 0.6% 549 0.5% 1,120 0.5% (0.1-0.9)* Vung Tau 565 0.6% 1,669 1.5% 2,234 1.1% (0.5-1.6) Binh Duong 659 0.7% 1,594 1.3% 2,253 1.0% (0.4-1.6) Tien Giang 1,215 0.7% 3,662 1.6% 4,877 1.2% (0.6-1.8) Ca Mau 1,215 1.1% 2,467 2.0% 3,682 1.5% (0.9-2.2) Weighed average 8,845 0.6% 27,106 1.4% 35,951 1.0% (0.9-1.2) All Viet Nam 47,527 0.6% 146,460 1.4% 193,987 1.0%
*: Significant difference Many people with visual impairment due to cataract do not want to wait until their vision has reduced to less than 3/60. Many of them want to remain productive and independent and ask for cataract surgery at an earlier stage. Therefore people with severe and moderate visual impairment should be taken into consideration as well when assessing the need for cataract surgery. Table 15 shows the adjusted prevalence of people with bilateral SVI and MVI due to cataract, the 95% confidence interval and the estimated number of cases with this condition in each province, the weighted average prevalence for the 14 provinces and the estimates for entire Viet Nam. In the whole country an estimated 224,525 people aged 50+ are severely and another 906,302 people aged 50+ moderately visually impaired from cataract. Table 15. Adjusted prevalence of SVI (pinhole VA<6/60–3/60) and VI (pinhole VA<6/18–6/60) due to cataract and estimated number of cases in people aged 50+
Pinhole VA<6/60 – 3/60 (SVI) Pinhole VA<6/18 – 6/60 (VI) Province n Prev. (%) Var. (CI 95%) n Prev. (%) Var. (CI 95%) Tuyen Quang 714 0.5% (0.2-0.7) 3,118 2.1% (1.5-2.8) Phu Tho 1,536 0.5% (0.3-0.7) 15,528 4.9% (3.4-6.4) Dien Bien 1,037 1.5% (0.7-2.3) 507 0.7% (0.3-1.2) Bac Ninh 2,187 0.9% (0.5-1.3) 8,690 3.6% (2.7-4.5) Nam Dinh 6,542 1.3% (0.6-2.0) 20,832 4.1% (3.2-5.1) Ha Tinh 9,228 2.9% (1.7-4.1) 28,996 9.2% (7.3-11.2) Quang Tri 1,412 1.1% (0.6-1.6) 7,083 5.5% (4.2-6.8) Quang Ngai 2,606 1.0% (0.4-1.6) 16,440 6.3% (4.9-7.7) Gia Lai 1,927 1.0% (0.4-1.5) 4,573 2.3% (1.6-3.0) Lam Dong 1,312 0.6% (0.1-1.1) 6,034 2.7% (1.8-3.7) Vung Tau 4,293 2.1% (1.5-2.7) 11,036 5.4% (3.9-6.9) Binh Duong 2,184 1.0% (0.4-1.5) 8,096 3.6% (2.4-4.8) Tien Giang 3,688 0.9% (0.6-1.3) 21,221 5.3% (4.1-6.5) Ca Mau 2,969 1.2% (0.9-1.6) 15,919 6.6% (5.4-7.9) Weighted average 41,635 1.2% (1.1-1.3) 168,073 4.8% (4.6-5.1) All Viet Nam 224,525 1.2% 906,302 4.8%

3. Survey findings 2015 29 If all people with pinhole VA<6/60 due to bilateral cataract would be considered for cataract surgery, then the backlog would be 418,512 people in entire Viet Nam: 126,219 men and 292,293 women. If all people with pinhole VA<6/18 due to bilateral cataract would be considered for cataract surgery, then the backlog would be 1,324 million people in entire Viet Nam: 455,569 men and 869,244 women. Especially amongst urban professionals the demand for early cataract surgery is likely to increase in the near future. They do not like to lose their job first because they have to wait for cataract surgery and they will insist on being operated at an early stage. The prevalence data from the two tables above (14 and 15) is also shown in figure 7. The weighted average of the 14 provinces is indicative for the prevalence in entire Viet Nam. There is a considerable variation in the prevalence visible. The highest prevalence of operable cataract is found in Ha Tinh, the lowest in Lam Dong province. Figure 7. Adjusted prevalence of bilateral cataract blindness, SVI and VI
Figure 7 shows the estimated number of patients with bilateral blindness, SVI and MVI due to cataract. Ha Tinh, Nam Dinh and Tien Giang Province have the highest number of patients with operable cataract. Figure 7 may help to identify where most surgical capacity is needed
0.0% 5.0% 10.0% 15.0%
Tuyen QuangPhu Tho
Dien BienBac Ninh
Nam DinhHa Tinh
Quang TriQuang Ngai
Gia LaiLam DongVung Tau
Binh DuongTien Giang
Ca MauWeighed average
VA<3/60 VA<6/60 - 3/60 VA<6/18 - 6/60

3. Survey findings 2015 30 Figure 8. Estimated cases with bilateral blindness, SVI and VI due to cataract
The estimated number of people with bilateral blindness or low vision due to cataract is shown in Table 14 and 15 and Figure 7. However, there are also many people with one eye affected by cataract. Many of them also want cataract surgery. Therefore the number of eyes blind, severely or moderately visually impaired due to cataract may be a better indicator of the total workload on cataract surgery. Table 16. Adjusted prevalence and estimated number of eyes with pinhole VA<3/60, <6/60 and <6/18 due to cataract (cumulative)
Eyes cataract (pinhole VA<3/60)
Eyes cataract (pinhole VA<6/60)
Eyes cataract (pinhole VA<6/18)
Province Eyes Prev. (%) Eyes Prev. (%) Eyes Prev. (%) Tuyen Quang 7,119 2.4 8,556 2.9 16,438 5.6 Phu Tho 11,055 1.7 17,004 2.7 56,648 8.9 Dien Bien 3,811 2.8 5,653 4.1 7,008 5.1 Bac Ninh 12,004 2.5 16,649 3.5 38,965 8.1 Nam Dinh 28,202 2.8 45,018 4.5 89,691 8.9 Ha Tinh 11,499 1.8 34,582 5.5 98,047 15.6 Quang Tri 6,656 2.6 11,056 4.3 27,757 10.8 Quang Ngai 5,438 1.0 15,389 2.9 62,012 11.8 Gia Lai 5,319 1.3 9,513 2.4 20,071 5.0 Lam Dong 3,649 0.8 5,595 1.3 12,854 2.9 Vung Tau 10,322 2.5 20,701 5.1 48,283 11.8 Binh Duong 10,779 2.4 16,953 3.8 36,639 8.1 Tien Giang 24,548 3.1 35,539 4.5 94,780 11.9 Ca Mau 21,150 4.4 28,760 6.0 69,655 14.5 Weighted average 161,551 2.3 270,968 3.9 678,848 9.8 All Viet Nam 870,757 2.3 1,460,404 3.9 3,658,776 9.8
0 10,000 20,000 30,000 40,000 50,000
Tuyen QuangPhu Tho
Dien BienBac Ninh
Nam DinhHa Tinh
Quang TriQuang Ngai
Gia LaiLam DongVung Tau
Binh DuongTien Giang
Ca Mau
VA<3/60 VA<6/60 - 3/60

3. Survey findings 2015 31 Table 16 gives the prevalence and the estimated number of eyes with cataract at three levels of visual acuity: pinhole VA<3/60, <6/60 and <6/18, allowing for estimates of the surgical workload at the intake criteria for cataract surgery in the province. The highest number of eyes with operable cataract are found in Ha Tinh, Tien Giang and Nam Dinh province. If we assume the weighted average to be representative for entire Viet Nam then there are nearly 871,000 eyes blind due to cataract in Viet Nam. If all cataract eyes with VA<6/60 need to be operated the total workload is 1.46 million eyes. If the threshold is taken at <6/18 then 3.66 million eyes need surgery. 3.3 Cataract Surgical Coverage Cataract surgical coverage (persons) is an impact indicator to measure which proportion of people with pinhole VA<3/60, <6/60 or <6/18 due to bilateral cataract, have been operated in one or both eyes. Similarly, Cataract surgical coverage (eyes) is used to measure the proportion of eyes with pinhole VA<3/60, <6/60 or <6/18 due to cataract that have been operated upon. Because the VA at the time of surgery is usually not known, the CSC is calculated at three different levels of VA: <3/60, <6/60 and <6/18. These levels are intended to represent the threshold VA below which cataract surgery is usually indicated in the country of concern. In Viet Nam the level in rural areas may lie at <6/60, while in urban areas <6/18 should be the norm. The CSC indicators give an impression about which part of the cataract problem has been addressed so far. The outcome of the cataract surgery is not included in this indicator. Table 17 shows the CSC (eyes) for the 14 provinces. The CSC (eyes; <3/60) is highest in Quang Ngai (77%) and lowest in Dien Bien Province (41%). The weighted average indicates that for every 2 operated eyes there is 1 un-operated eye blind from cataract. If cataract surgery is done at VA<6/60, then for every operated eye there is one un-operated eye. If the VA threshold for cataract surgery is <6/18, then for every operated eye there are 2 un-operated eyes. Table 17. Cataract surgical coverage (in %) in eyes
CSC (eyes) <3/60 CSC (eyes) <6/60 CSC (eyes) <6/18 Province Male Female Total Male Female Total Male Female Total Tuyen Quang 60 42 46 53 38 42 31 26 27 Phu Tho 64 68 67 56 57 57 25 30 28 Dien Bien 45 38 41 37 29 31 34 25 27 Bac Ninh 59 49 51 46 42 43 27 26 26 Nam Dinh 53 51 52 39 41 40 22 28 26 Ha Tinh 68 67 67 38 41 40 19 19 19 Quang Tri 67 59 61 49 48 48 25 29 27 Quang Ngai 67 80 77 41 60 54 16 27 23 Gia Lai 51 56 55 36 42 40 19 28 25 Lam Dong 60 70 67 56 56 56 37 35 36 Vung Tau 69 65 67 53 48 50 31 29 30 Binh Duong 72 72 72 63 61 62 48 40 43 Tien Giang 65 74 72 57 66 64 31 44 40 Ca Mau 58 55 56 50 49 49 26 30 28 Weighted Average 62 63 62 48 50 49 27 30 29
Table 18 shows the CSC (persons), indicating the proportion of people with bilateral cataract and pinhole VA<3/60, <6/60 or <6/18 in the better eye who had a cataract operation in one or both eyes. The CSC (persons) is always higher than the CSC (eyes) because when a person bilateral blind due to cataract is operated in one eye only, he is counted as ‘covered’, while in CSC (eyes) only one of the two eyes is covered. The reasoning is that the operation of one eye in a bilateral cataract blind person may change that person into a sighted person.

3. Survey findings 2015 32 The highest CSC (persons; <3/60) is seen in Tien Giang (84%), the lowest in Dien Bien (41%) province, a high variation. The CSC <6/18 is considerably lower than for VA<6/60, indicating that not that many people with MVI due to cataract get operated. The CSC does not differ much for males and for females. Table 18. Cataract surgical coverage (in %) in persons
CSC (persons) <3/60 CSC (persons) <6/60 CSC (persons) <6/18 Province Male Female Total Male Female Total Male Female Total Tuyen Quang 78 56 60 64 49 52 37 35 35 Phu Tho 79 77 77 70 69 69 33 37 36 Dien Bien 48 37 41 40 25 29 35 23 27 Bac Ninh 85 58 63 61 48 51 35 32 32 Nam Dinh 72 62 64 54 48 50 29 34 32 Ha Tinh 83 76 78 45 47 47 24 25 25 Quang Tri 71 67 68 52 57 56 27 32 31 Quang Ngai 67 85 81 47 71 64 25 39 35 Gia Lai 60 67 66 38 47 44 19 32 28 Lam Dong 71 86 82 72 65 67 47 41 42 Vung Tau 83 76 79 59 57 58 39 36 37 Binh Duong 88 81 83 76 69 71 56 48 50 Tien Giang 84 84 84 71 78 76 44 55 52 Ca Mau 77 77 77 68 66 66 36 41 39 Weighted Average 76 73 74 59 59 59 34 38 37
3.4 Causes of blindness Table 19. Principal causes of bilateral blindness (presenting VA<3/60 in the better eye) in people 50+ in the sample population in 14 provinces.
Bilateral blindness - main cause in person Province URE Aph Cat Compl Trach Other
scar Phthis Ptery Glau DR AMD Other PSD
Globe /CNS
Tuyen Quang 0 0 70 5 6 5 2 0 2 0 3 8 2 Phu Tho 0 0 67 14 0 3 0 0 0 3 0 14 0 Dien Bien 0 0 84 4 0 0 3 0 0 1 1 5 1 Bac Ninh 0 0 63 0 0 10 1 1 4 0 0 18 1 Nam Dinh 0 2 81 4 2 4 0 2 2 0 4 2 0 Ha Tinh 0 0 87 3 3 3 0 0 0 3 0 0 0 Quang Tri 0 0 80 0 0 3 0 0 6 0 0 6 5 Quang Ngai 0 0 72 7 3 3 0 0 7 0 3 0 3 Gia Lai 0 0 69 0 0 8 0 0 13 0 3 5 3 Lam Dong 0 0 48 0 6 10 0 0 13 3 3 16 0 Vung Tau 0 0 81 2 0 7 0 0 2 0 2 2 2 Binh Duong 0 2 73 13 0 2 0 0 4 0 0 6 0 Tien Giang 0 0 77 2 0 0 0 0 2 0 0 9 9 Ca Mau 2 0 79 8 0 2 0 4 6 0 0 0 0 Weighted average 0 0 74 5 1 4 0 1 4 1 1 6 2
URE: Uncorrected refractive error Aph: Uncorrected aphakia Compl: Surgical complications Phthis: Phthisis Trach: Trachomatous corneal scar DR: diabetic retinopathy Other scar: Other corneal scar Ptery: Pterygium AMD: Age related macular degeneration CNS: Central nervous system PSD: Posterior segment disease Glau: Glaucoma The causes of blindness, SVI and VI are calculated from the sample data only and not adjusted to the actual population of the province. The reason is that the number of cases for each cause per 5-year age group will be so low that one case more or less may cause a huge change in prevalence and extrapolation to the actual population may in fact enhance inaccuracy. Diagnostic

3. Survey findings 2015 33 facilities for posterior segment disease are limited and less obvious cases of glaucoma, diabetic retinopathy or ARMD can also be reported under other posterior segment disease. Table 19 shows the principal cause of bilateral blindness (PVA<3/60 in the better eye) in people 50+. Cataract is also the main cause in bilateral SVI and MVI with 85.0% and 73.1% respectively. In MVI, uncorrected refracted errors are the second cause with 12.4% Cataract is clearly the most common cause of bilateral blindness, ranging from 63% in Bac Ninh to 84% in Dien Bien province. Complications after cataract surgery are high in Phu Tho and Binh Duong province and may need further investigation. Trachomatous corneal opacity seems to be limited to Tuyen Quang, Lam Dong, Ha Tinh, Quang Ngai and Nam Dinh province. Glaucoma is reportedly high in Gia Lai and Lam Dong province. Vision loss from certain eye disease is treatable, like uncorrected refractive errors, aphakia, pterygium and un-operated cataract. For other causes it can be prevented through primary health care (PHC) or primary eye care (PEC), like trachoma scars, other corneal scars and phthisis. Specialized ophthalmic services may prevent complications of cataract surgery or that patients with diabetes or glaucoma become visually impaired or blind. Treatable and preventable blindness combined are called avoidable blindness (Table 20). Table 20. Intervention strategies for bilateral blindness in 14 provinces. Treatable
(%) Preventable Avoidable (%)
PSD (%)
Province PHC-PEC (%)
Ophthal (%)
Tuyen Quang 70 12 6 88 12 PhuTho 67 3 17 86 17 Dien Bien 84 3 5 92 8 BacNinh 65 12 4 81 22 Nam Dinh 84 5 5 95 7 Ha Tinh 87 7 7 100 3 Quang Tri 80 3 6 89 12 Quang Ngai 72 7 14 93 10 Gia Lai 69 8 13 90 21 Lam Dong 48 16 16 81 35 Vung Tau 81 7 5 93 7 Binh Duong 75 2 17 94 10 Tien Giang 77 0 5 82 11 Ca Mau 85 2 13 100 6 Weighed average 75 6 9 90 12
PHC-PEC: Primary Health Care – Primary Eye Care PSD: Posterior segment disease In the 14 provinces 75% of the causes of bilateral blindness in people 50+ is treatable, varying from 48% in Lam Dong to 87% in Ha Tinh. Adequate PHC-PEC services can prevent on average 6% (range 0-16%) of the bilateral blindness and adequate specialist ophthalmic services may prevent another 9% (range 4-17%). Combined, 90% (range 81-100%) of all causes of bilateral blindness in people aged 50+ is avoidable. The principal causes of bilateral low vision (presenting VA<6/18-3/60 in the better eye) are shown in Table 21. Cataract is still the main cause with 75% (range 43-90%). Uncorrected refractive error is the second cause with 10% (range 4-45%). Surprising is the 45% in Dien Bien, which may deserve some extra attention.

3. Survey findings 2015 34 Table 21. Principal causes of bilateral low vision (presenting VA<6/18 - 3/60 in the better eye) in people 50+ in the sample population in 14 provinces.
Bilateral blindness - main cause in person Province URE Aph Cat Compl Trach Other scar Phthis Ptery Glau DR AMD Other PSD Globe /CNS Tuyen Quang 11 0 61 1 0 1 0 1 0 0 6 17 2 Phu Tho 4 0 81 8 0 0 0 0 1 0 0 6 0 Dien Bien 45 0 43 4 0 0 0 1 1 4 0 3 0 Bac Ninh 12 0 74 1 0 2 0 0 0 0 0 11 0 Nam Dinh 10 0 69 4 1 0 0 0 1 0 5 8 1 Ha Tinh 5 0 90 3 0 0 0 0 1 0 0 1 0 Quang Tri 10 0 82 0 0 0 0 0 2 0 2 3 0 Quang Ngai 10 0 85 3 0 0 0 1 0 0 0 0 0 Gia Lai 10 0 75 1 0 2 0 0 0 1 1 7 1 Lam Dong 22 0 62 1 0 2 0 1 1 2 2 7 1 Vung Tau 6 0 80 1 0 0 0 0 0 0 0 10 2 Binh Duong 9 0 75 12 0 1 0 0 0 0 0 1 1 Tien Giang 11 0 70 9 0 0 0 1 0 0 4 5 1 Ca Mau 6 0 83 7 0 0 0 3 0 0 0 0 0 Weighted average 10 0 75 4 0 1 0 1 0 0 2 5 1
URE: Uncorrected refractive error Aph: Uncorrected aphakia Compl: Surgical complications Phthis: Phthisis Trach: Trachomatous corneal scar DR: diabetic retinopathy Other scar: Other corneal scar Ptery: Pterygium AMD: Age related macular degeneration CNS: Central nervous system PSD: Posterior segment disease Glau: Glaucoma In the 14 provinces 86% of the causes of bilateral low vision (presenting VA<6/18-3/60 in the better eye) in people 50+ is treatable, varying from 73% in Tuyen Quang to 96% in Quang Ngai. Adequate PHC-PEC services can prevent on average 1% (range 0-3%) of the bilateral low vision and adequate specialist ophthalmic services may prevent another 5% (range 1-12%). Combined, 92% (range 75-100%) of all causes of bilateral low vision in people aged 50+ is avoidable. (Table 22) Table 22. Intervention strategies for bilateral low vision in 14 provinces. Preventable Province Treatable
(%) PHC-PEC
(%) Ophthal
(%) Avoidable
(%) Treatable
(%) Tuyen Quang 73 1 1 75 9 PhuTho 84 0 9 94 11 Dien Bien 89 0 8 97 11 BacNinh 86 2 1 89 1 Nam Dinh 79 1 5 86 8 Ha Tinh 95 0 4 99 0 Quang Tri 92 0 2 94 0 Quang Ngai 96 0 4 100 0 Gia Lai 86 3 2 91 0 Lam Dong 85 3 3 90 0 Vung Tau 86 0 1 88 0 Binh Duong 84 2 12 98 85 Tien Giang 82 0 9 91 105 Ca Mau 92 0 8 100 108 Weighed average 86 1 5 92 28
PHC-PEC: Primary Health Care – Primary Eye Care PSD: Posterior segment disease 3.4.1 Trachoma In these 14 RAABs there were no detailed questions on Trachoma, as in the previous RAABs. Trachomatous corneal opacity caused 1% of bilateral blindness and seems to be limited to Tuyen Quang, Lam Dong, Ha Tinh, Quang Ngai and Nam Dinh province. (Table 19). Bilateral low vision due to trachomatous scarring only occurred sporadically in nam Dinh province.

3. Survey findings 2015 35 3.4.2 Pterygium Because Onchocerciasis is not seen in Viet Nam, this option was replaced by Pterygium. Pterygium caused 1% of bilateral blindness and 1% of bilateral low vision in 2015. 3.4.3 Functional low vision (FLV) In case of visual impairment or blindness which is not caused by un-operated cataract, posterior capsular opacification, uncorrected refractive error or uncorrected aphakia, it is usually not possible to restore normal vision. In such patients visual aids and mobility training can be helpful. With increasing life expectancy the risk of functional low vision may increase, while at the same time further development of specialized eye care services and better diagnostic and therapeutic facilities may prevent people to get sight-threatening complications through timely intervention. The weighted average prevalence of FLV was 1.4%, varying between0.5% in Quang Ngai to 2.1% in Tuyen Quang and Nam Dinh province. There is not much difference between males and females. In the 14 provinces 47,739 people had functional low vision: 19,437 males and 28,302 females. When extrapolated to entire Viet Nam, 259,321 people aged 50+ are estimated to have FLV: 104,966 males and 152,995 females. (Table 23) Table 23. Adjusted prevalence of bilateral functional low vision (pinhole VA<6/18-Perception of Light in the better eye) and estimated number of cases in people aged 50+
Males Females Total Province n % n % n % Tuyen Quang 1,555 2.3 1,510 1.9 3,065 2.1 Phu Tho 1,792 1.2 2,308 1.3 4,100 1.3 Dien Bien 172 0.5 368 1.0 540 0.8 Bac Ninh 1,930 1.8 2,563 1.9 4,493 1.9 Nam Dinh 3,182 1.4 7,328 2.7 10,510 2.1 Ha Tinh 1,307 0.9 1,085 0.6 2,392 0.8 Quang Tri 736 1.3 918 1.3 1,654 1.3 Quang Ngai 192 0.2 1,136 0.8 1,328 0.5 Gia Lai 1,201 1.3 1,622 1.5 2,823 1.4 Lam Dong 1,660 1.6 2,651 2.3 4,311 2.0 Vung Tau 1,305 1.4 2,110 1.9 3,415 1.7 Binh Duong 863 0.9 641 0.5 1,504 0.7 Tien Giang 2,908 1.7 3,153 1.4 6,061 1.5 Ca Mau 634 0.6 909 0.7 1,543 0.6 Weighed average 19,437 1.2 28,302 1.5 47,739 1.4 All Viet Nam 104,966 1.2 152,995 1.5 259,321 1.4
3. Survey findings 2015 36 3.6 Barriers Not all people who are blind or severely visually impaired due to cataract are operated. Many are not and often they have valid reasons for it. If the barriers to cataract surgery are known, it becomes possible to design special intervention activities to overcome such barriers. It should be realized that the procedure in RAAB to interview patients to find out more about the reasons why they have not been operated yet is not ideal. The ophthalmologist is not a neutral person and a patient may not reveal the actual barrier(s) but perhaps one that may sound acceptable to the interviewer. Although the survey teams are trained to ask neutral questions why the cataract has not yet been operated upon, they are not experienced and skilled interviewers and may interpret answers differently. However, the findings on barriers from the RAAB make planners aware about the importance of these factors and they can provide a good starting point for more detailed qualitative assessments on barriers to cataract surgery. There can be considerable variation in barriers between different provinces. Local factors like the credibility of the eye services, literacy of the patients, availability, accessibility and affordability of eye care services, the approach of eye care staff, socio-economic situation in the province, all influence the uptake of cataract surgery. The above factors should be well considered during the planning of future eye care activities in the individual provinces. Looking at the weighted average, ‘Fear’ (fear for the operation as well as fear for poor result) is the major barrier to surgery in people bilaterally blind due to cataract. It is the major barrier in Phu Tho, Dien Bien, Ha Tinh and Vung Tau provinces. ‘Cannot afford’ is the second major barrier, followed by ‘Cannot access treatment’, ‘Need not felt’ and ‘Unaware treatment is possible’ and ‘Treatment denied by provider’. This indicates that with more emphasis on health promotion and information to patients, the utilization of cataract surgical services could increase considerably. Barriers vary considerable between provinces. There are a few remarkable findings: ‘Fear’ is the main barrier in Ha Tinh and Vung Tau, while the proportion good outcome in these provinces is well above the average. The proportion ‘Unaware treatment is possible’ is the same in people with bilateral cataract and with unilateral cataract and BCVA<6/60, while one would expect that many people in the last group must have had prior experience with cataract surgery. In the following tables 24 and 25 the names of the provinces are in the title bar and the barriers are listed on the left. Below are the abbreviations of the names of the provinces. TQ = Tuyen Quang QN = Quang Ngai PT = Phu Tho GL = Gia Lai DB = Dien Bien LD = Lam Dong BN = Bac Ninh VT = Vung Tau ND = Nam Dinh BD = Binh Duong HT = Ha Tinh TG = Tien Giang QT = Quang Tri CM = Ca Mau

Survey findings 2015 37 Table 24. Barriers to cataract surgery in people bilaterally blind due to cataract (pinhole VA<6/60) Barriers TQ PT DB BN ND HT QT QN GL LD VT BD TG CM Weighted average Need not felt 22 13 12 25 14 17 19 15 21 8 24 40 27 6 19 Fear 16 40 45 14 25 33 22 24 8 26 44 31 17 12 25 Cannot afford 8 27 4 14 29 21 2 16 29 20 14 13 20 75 23 Treatment denied * 5 0 0 3 0 2 5 2 0 16 1 0 6 0 3 Unaware ** 29 9 0 1 5 1 7 9 16 0 4 10 29 0 9 No access *** 20 11 39 43 27 26 45 34 26 30 13 6 1 7 21 All barriers 100 100 100 100 100 100 100 100 100 100 100 100 100 100 100
*: Treatment is denied by provider as criteria for surgery were not met. **: Unaware that treatment is possible or unaware of having cataract. ***: Cannot access treatment because of the long distance. Table 25. Barriers to cataract surgery in people unilaterally blind due to cataract (pinhole VA<6/60)
Barriers TQ PT DB BN ND HT QT QN GL LD VT BD TG CM Weighted average Need not felt 27 21 22 43 24 55 31 25 36 19 36 30 34 34 32 Fear 21 30 33 17 24 24 30 23 8 25 31 26 23 5 23 Cannot afford 5 33 6 11 23 10 9 19 25 19 19 13 18 57 21 Treatment denied * 5 2 6 1 4 0 0 1 1 19 1 5 3 1 3 Unaware ** 25 6 14 4 4 0 8 9 17 9 7 16 21 0 9 No access *** 16 8 19 24 21 10 21 24 13 8 6 11 1 3 13 All barriers 100 100 100 100 100 100 100 100 100 100 100 100 100 100 100
*: Treatment is denied by provider as criteria for surgery were not met. **: Unaware that treatment is possible or unaware of having cataract. ***: Cannot access treatment because of the long distance. 3.7 Visual outcome In RAAB all eligible persons have their visual acuity measured with the available correction and with pinhole. This also includes people who were operated for cataract in one or both eyes. Results on visual outcome after cataract surgery in RAAB are usually worse than those obtained from outcome monitoring systems. The reason is that RAAB includes people who were operated last month as well as decades ago, by good eye surgeons as well as less good surgeons, in a well-equipped hospital as well as under improvised conditions in an eye camp. However, this is the outcome as it is seen by the general public and this may determine their faith in cataract surgical services. Visual outcome after cataract surgery is usually measured as ‘good’ (can see 6/18), ‘borderline’ (VA<6/18 – 6/60) and ‘poor’ (cannot see 6/60). When measured as presenting vision, it will include patients who do not have the optimal optical correction. This may also include IOLs with incorrect power. Please note that the number of cases in the non-IOL group can be small and therefore changes in a few patients may result in dramatic changes in percentages. Secondly, not all non-IOL cases are intentionally intra-capsular cataract extractions (ICCE). It may also include planned IOL surgery where no IOL could be implanted because of a surgical complication like capsular rupture or vitreous loss. That may also affect the visual outcome in this group negatively. Table 26 shows visual outcome with presenting VA in the 14 provinces. The proportion of ‘good’ outcome varies from 41% in Bac Ninh to 72% in Quang Ngai Province, the proportion of ‘poor’ outcome from 8% in Quang Ngai to 30% in Dien Bien and Bac Ninh province.

Survey findings 2015 38 Table 26. Proportion good, borderline and poor outcome (presenting VA) after cataract surgery
IOL Non-IOL Total Province Good
(%) B-line
(%) Poor (%)
Good (%)
B-line (%)
Poor (%)
Good (%)
B-line (%)
Poor (%)
Tuyen Quang 59 18 23 0 20 80 57 18 25 Phu Tho 45 31 25 11 33 56 43 31 26 Dien Bien 51 19 30 0 50 50 50 19 30 Bac Ninh 44 30 27 0 0 100 41 28 30 Nam Dinh 56 26 18 0 0 100 55 25 20 Ha Tinh 72 15 13 0 0 100 71 15 14 Quang Tri 58 18 23 0 0 100 58 18 24 Quang Ngai 72 21 8 0 0 0 72 21 8 Gia Lai 70 15 15 0 0 0 70 15 15 Lam Dong 61 27 12 20 20 60 60 27 13 Vung Tau 70 15 16 0 0 100 69 14 16 Binh Duong 73 16 11 0 11 89 71 16 13 Tien Giang 68 25 7 12 0 88 65 24 11 Ca Mau 61 23 16 25 25 50 61 23 16 Weighted average 62 22 16 6 10 84 60 22 18
Good outcome: presenting VA ≥6/18 Borderline outcome: presenting VA <6/18 – 6/60 Poor outcome: presenting VA <6/60 Table 27 gives the visual outcome after cataract surgery with pinhole correction as a proxy for best correction. By comparing the percentages by presenting vision with those by pinhole vision it can be quickly evaluated what proportion of visual outcome can be improved further by optical correction alone. (Table 28) None of the provinces reaches the 80% good outcome, recommended by the WHO. In some provinces the proportion good outcome is alarmingly low. Table 27. Proportion good, borderline and poor outcome (pinhole VA) after cataract surgery
IOL Non-IOL Total Province Good
(%) B-line
(%) Poor (%)
Good (%)
B-line (%)
Poor (%)
Good (%)
B-line (%)
Poor (%)
Tuyen Quang 67 14 19 20 20 60 65 14 21 Phu Tho 55 24 21 11 33 56 53 25 22 Dien Bien 62 17 22 0 50 50 61 17 22 Bac Ninh 55 20 25 0 0 100 52 19 29 Nam Dinh 57 25 18 0 0 100 56 24 20 Ha Tinh 76 11 13 0 0 100 75 11 14 Quang Tri 70 9 21 0 0 100 69 9 22 Quang Ngai 84 10 7 0 0 0 84 10 7 Gia Lai 73 14 13 0 0 0 73 14 13 Lam Dong 75 15 10 40 0 60 74 14 12 Vung Tau 74 12 14 0 100 0 74 13 14 Binh Duong 81 10 10 0 22 78 78 10 12 Tien Giang 76 18 6 12 6 82 72 18 10 Ca Mau 71 15 14 25 25 50 70 15 15 Weighted average 69 16 15 9 17 74 68 16 16
Good outcome: presenting VA ≥6/18 Borderline outcome: presenting VA <6/18 – 6/60 Poor outcome: presenting VA <6/60

Survey findings 2015 39 Table 28 shows that considerable improvement of visual outcome after cataract surgery can be achieved in nearly all provinces by providing pinhole correction. With optimal pre-operative biometry and post-operative refraction, the improvement may even be better than with pinhole alone. This demonstrates that adequate optical correction after cataract surgery can substantially improve visual outcome. Major improvements are achieved in nearly all provinces. Best visual outcome has Quang Ngai, but even there, considerable improvement can be achieved with optimal optical correction after cataract surgery. However, none of the provinces reaches 90% good outcome with best correction (WHO recommendation). Table 28. Change in proportion good, borderline and poor outcome with pinhole correction.
IOL Non-IOL Total Province Good
(%) B-line
(%) Poor (%)
Good (%)
B-line (%)
Poor (%)
Good (%)
B-line (%)
Poor (%)
Tuyen Quang +12 -32 -18 +100 0 -33 +13 -29 -20 Phu Tho +19 -27 -19 0 0 0 +19 -25 -17 Dien Bien +17 -11 -39 0 0 0 +17 -11 -38 Bac Ninh +21 -52 -6 0 0 0 +21 -52 -4 Nam Dinh +2 -5 0 0 0 0 +2 -5 0 Ha Tinh +5 -36 0 0 0 0 +5 -36 0 Quang Tri +16 -95 -12 0 0 0 +16 -95 -12 Quang Ngai +14 -110 -15 0 0 0 +14 -110 -15 Gia Lai +4 -6 -14 0 0 0 +4 -6 -14 Lam Dong +18 -81 -17 +50 0 0 +19 -85 -14 Vung Tau +6 -18 -16 0 +100 0 +6 -13 -20 Binh Duong +9 -65 -13 0 +50 -14 +9 -57 -13 Tien Giang +11 -39 -16 0 +100 -7 +10 -37 -11 Ca Mau +14 -57 -8 0 0 0 +13 -55 -8 Weighted average +11 -43 -11 +9 +24 -4 +11 -42 -11
Good outcome: presenting VA ≥6/18 Borderline outcome: presenting VA <6/18 – 6/60 Poor outcome: presenting VA <6/60 The proportion of IOL surgeries varies from 95% in Bac Ninh and Tien Giang to 100% in Quang Ngai, Gia Lai and Vung Tau province. The weighted average is 98%: 98% for men and 98% for women. (Table 29) Table 29. Proportion IOL surgeries by province and by gender
Province Males (%) Females (%) Total (%) Tuyen Quang 100 94 96 Phu Tho 98 95 96 Dien Bien 98 99 98 Bac Ninh 95 95 95 Nam Dinh 100 97 98 Ha Tinh 97 100 99 Quang Tri 100 99 99 Quang Ngai 100 100 100 Gia Lai 100 100 100 Lam Dong 92 99 97 Vung Tau 99 100 100 Binh Duong 97 98 97 Tien Giang 94 95 95 Ca Mau 98 99 98 Weighted average 98 98 98

Survey findings 2015 40 Table 30 shows the place of surgery by province. Overall, 51% of cataract operations was conducted in district hospitals, 27% in private hospitals, 17% in national hospitals, and 5% in eye camps. However, within each province the distribution varied widely. Table 30. Place of surgery
Province National hospital* (%)
District hospital** (%)
Private hospital (%)
Eye camp / improvised (%)
Tuyen Quang 13 50 2 36 Phu Tho 20 70 7 3 Dien Bien 6 76 2 16 Bac Ninh 0 30 54 15 Nam Dinh 27 50 20 2 Ha Tinh 13 64 12 12 Quang Tri 0 13 85 2 Quang Ngai 28 71 1 1 Gia Lai 11 89 0 0 Lam Dong 0 51 47 2 Vung Tau 45 42 10 3 Binh Duong 55 43 2 0 Tien Giang 0 46 54 0 Ca Mau 0 22 75 3 Weighted average 17 51 27 5
*: National Hospital: National Hospital or HCM Ophthamology hospital **: District hospital: Provincial and district hospitals 3.8 Use and coverage of spectacles All examined persons are asked whether they use glasses for distance vision and for reading (near vision). All people wearing distance glasses plus people with uncorrected distance vision together gives the prevalence of refractive errors for distance vision. The number of people with uncorrected refractive error gives the prevalence of uncorrected refractive errors for distance vision. From these two parameters the spectacle coverage for refractive errors for distance vision can be calculated. This can give a good indication of the availability, accessibility, affordability and acceptance of optical services in the 14 provinces. Table 31. Spectacle coverage for distant vision (%)
Prev. refractive errors Prev. Uncorrected Refr. Error Spectacle coverage Province Male Female Total Male Female Total Male Female Total Tuyen Quang 11 8 9 6 6 6 47 18 33 Phu Tho 12 10 10 8 9 8 31 11 20 Dien Bien 18 17 18 18 17 18 0 1 1 Bac Ninh 8 6 7 4 4 4 56 23 38 Nam Dinh 8 6 7 4 5 5 44 12 27 Ha Tinh 13 9 10 10 7 8 18 19 20 Quang Tri 14 11 12 11 9 9 26 14 23 Quang Ngai 21 17 18 13 13 13 39 23 29 Gia Lai 6 9 8 4 7 6 21 22 23 Lam Dong 16 18 17 13 16 14 22 15 18 Vung Tau 16 14 15 8 7 8 50 49 49 Binh Duong 16 11 13 5 5 5 71 54 61 Tien Giang 13 11 12 6 7 7 54 31 41 Ca Mau 7 6 6 5 5 5 22 16 18 Weighted average 12 10 11 7 8 8 38 22 30

Survey findings 2015 41 Table 31 shows a lot of variation between the provinces. The weighted average prevalence of refractive errors is 11%, ranging from 6% in Ca Mau to 18% in Dien Bien and in Quang Ngai province. The average prevalence of uncorrected refractive errors is 8%, ranging from 4% in Bac Ninh to 18% in Dien Bien province. The spectacle coverage is on average 30%, varying between 1% in Dien Bien and 61% in Binh Duong province. There is a considerable difference between men and women. It seems refractive and optical services deserve more attention in nearly all 14 provinces, but most urgently in Dien Bien, Ca Mau and Lam Dong. Table 32. Spectacle coverage for near vision (%)
Prev. Uncorrected Refr. Error Spectacle coverage Province Male Female Total Male Female Total Tuyen Quang 39 58 50 61 42 50 Phu Tho 16 28 23 84 72 77 Dien Bien 58 69 64 42 31 36 Bac Ninh 40 69 57 60 31 43 Nam Dinh 44 61 54 56 39 46 Ha Tinh 62 81 74 38 19 26 Quang Tri 50 70 62 50 31 38 Quang Ngai 68 78 74 32 22 26 Gia Lai 72 85 80 28 15 21 Lam Dong 46 67 59 54 33 41 Vung Tau 39 45 42 61 55 58 Binh Duong 40 50 46 60 51 54 Tien Giang 54 70 64 46 30 36 Ca Mau 41 60 52 59 40 48 Weighted average 47 63 57 53 37 43
For near vision, it is assumed that all people aged 50+ are presbyopic and need reading glasses. On average 57% of the examined people does not have reading glasses and the coverage is 43%, 53% in males and 37% in females.

Comparing 2015 with earlier surveys 42 Chapter 4. Comparing 2015 with earlier surveys
4.1 Comparing findings from surveys in 2000-’02, 2007-’08 and 2015 Blindness surveys in Viet Nam have been conducted in 1986, 1990, 1995, 2000-’02, 2007-’08 and in 2015 (Table 1). The last three surveys used comparable methodologies: RACSS in 2000-’02 and RAAB in 2007-’08 and in 2015. In this chapter we compare the findings from these last three surveys, covering a total of 25 provinces: 15 provinces were surveyed once, 7 twice and 3 thrice. In the tables below only those provinces are listed that are surveyed twice or thrice, as well as the weighted average prevalence for the corresponding indicators for all surveyed provinces in 2000-’02, 2007-’08 and 2015. 4.2 Comparing blindness and low vision Table 33. Adjusted prevalence of bilateral blindness in 2000, 2007 and in 2015
Blindness (presenting VA<3/60 in better eye) Province 2000-'02 2007–‘08 2015 Phu Tho 3.4% (2.4-4.4) 2.7% (1.8-3.6) 1.2% (0.5-1.8)** Bac Ninh 4.8% (3.6-6.0) 2.5% (1.5-3.5)** Ha Tay 3.4% (2.3-4.5) 3.1% (1.7-4.4) Hai Phong 3.5% (2.5-4.5) 2.9% (1.8-4.0) Binh Dinh 6.0% (4.9-7.1) 5.8% (3.5-8.0) Nghe An 4.8% (3.5-6.1) 4.2% (2.4-6.0) Gia Lai 3.5% (2.4-4.6) 3.1% (1.8-4.5) 1.2% (0.5-2.0)*** Ba Ria - Vung Tau 3.0% (2.2-3.9) 1.9% (1.0-2.7) Tien Giang 4.1% (3.0-5.2) 2.4% (1.4-3.4) 2.1% (1.4-2.8)*** Binh Phuoc 3.3% (2.6-4.0) 2.6% (1.4-3.9) Weighted average 4.1% (3.8-4.5) 3.1% (2.8-3.4)* 1.8% (1.6-2.0)** Estimated cases 443,706 370,640 329,333
*: significant difference 2000-2007 **: significant difference 2007-2015 ***: significant difference 2000-2015 Table 33 shows that the adjusted prevalence of blindness with presenting vision in people aged 50+, including blindness due to refractive errors, reduced in all corresponding provinces between 2000 and 2007, and between 2007 and 2015. Although the reduction was not significant in all provinces, most probably due to the small sample size in each province, there was a significant reduction in Phu Tho, Bac Ninh, Gia Lai and Tien Giang province. The weighted average prevalence in 2015 was significantly lower than 2007-‘08 and that of 2007-‘08 was significantly lower again compared to 2000-‘02. The number of estimated people aged 50+ in Viet Nam with bilateral blindness also reduced, but far less than the prevalence. This is due to the fact that that the number of people aged 50+ (those at risk to develop cataract) increased considerably between 2000 and 2015 due to the aging trend. The weighted average prevalence of low vision reduced significantly between 2000 and 2007 (p=0.00233) and between 2007 and 2015 (p<0.00001). Some provinces show a reduction in prevalence while others show an increase. The number of people aged 50+ with bilateral low vision slightly reduced between 2000 and 2007, but increased in 2015. (Table 34)

Comparing 2015 with earlier surveys 43 Table 34. Adjusted prevalence of bilateral low vision in 2000, 2007 and in 2015
Low Vision (presenting VA<6/18-3/60) Province 2000-‘02 2007–‘08 2015 Phu Tho 14.5% 9.4% 11.1% Bac Ninh 12.3% 8.5% Ha Tay 13.2% 11.7% Hai Phong 11.5% 11.3% Binh Dinh 20.3% 21.9% Nghe An 13.7% 17.1% Gia Lai 15.3% 11.0% 7.1% Ba Ria - Vung Tau 16.9% 11.6% Tien Giang 18.0% 13.6% 12.5% Binh Phuoc 11.2% 13.0% Weighted average 14.7% 13.6% * 11.4% ** Estimated cases 1,582,574 1,570,184 2,099,409
*: significant difference 2000-2007 **: significant difference 2007-2015 Although the sample sizes may have been too low to demonstrate a significant difference between subsequent surveys, there is a significant reduction between 2000-‘02 and 2015 in Phu Tho, Gia Lai and Tien Giang province. The weighted average does show significant reductions between 2007 and 2000 and between 2015 and 2007. However, the estimated number of patients with bilateral cataract in entire Viet Nam stabilized between 2007 and 2015, after the earlier reduction between 2000 and 2007. This means that the possible increase in the annual number of cataract operations was not enough to compensate for the increase of cataract cases due to the aging trend. Table 35. Adjusted prevalence of bilateral cataract blindness in 2000, 2007 and in 2015
Cataract blindness (BCVA<3/60 in better eye) Province 2000-'02 2007–‘08 2015 Phu Tho 2.3% (1.4-3.2) 1.1% (0.0-2.3) 0.7% (0.2-1.2)*** Bac Ninh 1.7% (1.1-2.3) 1.2% (0.5-1.8) Ha Tay 2.0% (1.3-2.7) 1.5% (0.6-2.3) Hai Phong 1.4% (0.9-1.9) 1.3% (0.4-2.1) Binh Dinh 3.5% (2.5-4.5) 3.0% (1.9-4.1) Nghe An 2.3% (1.3-3.3) 2.5% (1.1-4.0) Gia Lai 2.3% (1.2-3.4) 1.8% (0.6-3.0) 0.6% (0.0-1.2)*** Ba Ria - Vung Tau 1.8% (1.1-2.4) 1.1% (0.5-1.6) Tien Giang 2.7% (1.8-3.6) 1.8% (0.9-2.6) 1.2% (0.6-1.8)*** Binh Phuoc 1.7% (1.2-2.2) 1.4% (0.6-2.2) Weighted average 2.3% (2.0-2.6) 1,6% (1.4-1.8)* 1.0% (0.9-1.2)** Estimated cases 247,659 192,298 193,987
*: significant difference 2000-2007 **: significant difference 2007-2015 ***: significant difference 2000-2015 The weighted average prevalence of low vision due to bilateral cataract shows a minimal reduction, and some provinces even show an increased prevalence. Probably the criteria for cataract surgery in these provinces still limit the operation of early cataracts. The number of people aged 50+ with low vision due to bilateral cataract increased substantially between 2015 and 2007, against a marginal increase between 2000 and 2007. This means the current level of cataract surgery is too low and the backlog is increasing.

Comparing 2015 with earlier surveys 44 Table 36. Adjusted prevalence of bilateral cataract low vision in 2000, 2007 and in 2015
Low Vision (BCVA<6/18-3/60) Province 2000-'02 2007–‘08 2015 Phu Tho 8.8% 4.5% 5.4% Bac Ninh 5.2% 4.5% Ha Tay 5.4% 4.2% Hai Phong 4.6% 3.4% Binh Dinh 9.3% 14.7% Nghe An 4.3% 10.6% Gia Lai 7.4% 5.0% 3.3% Ba Ria - Vung Tau 4.6% 7.5% Tien Giang 8.3% 7.7% 6.3% Binh Phuoc 4.7% 6.8% Weighted average 6.3% 6.0% 6.0% Estimated cases 678,079 695,131 1,130,827
Figure 9 illustrates the weighted average prevalence in people aged 50+, as shown in Table 33 to 36. While the prevalence of bilateral blindness, bilateral cataract blindness and bilateral low vision show a steady decline over the past 15 years, the prevalence of bilateral low vision due to cataract has not declined at all. Figure 9. Comparison of prevalence in people aged 50+ in surveys of 2000, 2007 and 2015
Figure 10 illustrates the estimated people aged 50+ with bilateral (cataract) blindness and low vision in entire Viet Nam+, as shown in Table 33 to 36. While a slight decrease is seen in the estimated number of blind people, the strong increase in people with bilateral low vision (due to cataract) since the last survey in 2007 is clearly visible. Figure 10. Comparison of affected people aged 50+ in surveys of 2000, 2007 and 2015
0% 2% 4% 6% 8% 10% 12% 14% 16%
Prev. bilateral blindPrev bilateral cataract blind
Prev. bilateral low visionPrev. bilateral cataract low vision
Tỉ lệ của 3 khảo sát
2000 2007 2015
0 500,000 1,000,0001,500,0002,000,000 2,500,000
People bilateral blindPeople bilateral cataract blind
People bilateral low visionPeople bilateral cataract low vision
Số người mắc trong 3 khảo sát
2000 2007 2015

Comparing 2015 with earlier surveys 45 The conclusion from Figure 8 can only be that the number of cataract surgeries conducted in Viet Nam has not been enough to compensate for the aging trend, which causes a fast increase in the number of people aged 50+, who are at risk for cataract. Figure 8 shows the increase of the cataract backlog, especially during the perion 2007-2015. 4.3 Cataract surgical coverage (CSC) The cataract surgical coverage (persons) is an impact indicator estimating the proportion of people with bilateral cataract blindness that have been operated upon in one or both eyes at the time of the survey. Table 37 shows that the weighted average CSC improved from 52% in 2000 to 67% in 2007 and further to 74% in 2015. The individual provinces also show an increase in the CSC, except Nghe An and Bac Ninh province. It would be interesting to find out why the CSC reduced here. In 2000, for every operated person with bilateral cataract there were two un-operated persons, bilaterally blind from cataract. There was one un-operated person for every two operated persons in 2007, and in 2015 there is one un-operated persons for every 3 operated persons bilaterally blind from cataract. Table 37. Cataract Surgical Coverage in persons at BCVA<3/60
Cataract Surgical Coverage Province 2000-'02 2007–‘08 2015 Phu Tho 33 60 77 Bac Ninh 66 63 Ha Tay 47 63 Hai Phong 70 73 Binh Dinh 58 60 Nghe An 47 40 Gia Lai 34 55 66 Ba Ria - Vung Tau 72 79 Tien Giang 59 70 84 Binh Phuoc 55 62 Weighted average 52 67 74
Table 38. Cataract Surgical Coverage in persons at BCVA<6/60 Cataract Surgical Coverage Province 2000-'02 2007–‘08 2015 Phu Tho 24 47 69 Bac Ninh 57 51 Ha Tay 39 52 Hai Phong 57 63 Binh Dinh 50 44 Nghe An 43 24 Gia Lai 25 36 44 Ba Ria - Vung Tau 65 58 Tien Giang 54 60 76 Binh Phuoc 49 48 Weighted average 45 56 59
When comparing the CSC (persons, BCVA<6/60) and (persons, BCVA<6/18) over the same period it becomes clear that the increase is minimal or even stagnating. In nearly half of the

Comparing 2015 with earlier surveys 46 provinces this CSC is even going down (Table 38 & Table 39). This actually indicates that with the increase in patients with BCVA<6/60 and <6/18 due to the ageing trend, the eye care services are not able to keep up with the demand. The proportion of IOL implantations has increased from 47% in 2000-‘02 to 98% in 2015. This modern technique permits cataract surgery at a much earlier stage, whereby patients can be operated before they actually become disabled. Table 39. Cataract Surgical Coverage in persons at BCVA<6/18 Cataract Surgical Coverage Province 2000-'02 2007–‘08 2015 Phu Tho 13 29 36 Bac Ninh 37 32 Ha Tay 24 35 Hai Phong 39 45 Binh Dinh 31 24 Nghe An 28 15 Gia Lai 15 24 28 Ba Ria - Vung Tau 47 37 Tien Giang 30 36 52 Binh Phuoc 30 24 Weighted average 29 39 37
4.4 Visual outcome Also the visual outcome after cataract surgery improved over the years. The weighted average proportion with good outcome (presenting VA≥6/18) increased from 36% in 2000 to 51% in 2007 and 60% in 2015. However, this is still well below the 80% recommended by the WHO. In some of the provinces the proportion of good outcome is still alarmingly low in 2015, like in Phu Tho and Bac Ninh. Table 40. Proportion good visual outcome after cataract surgery (presenting VA≥6/18)
Proportion good outcome (%) Province 2000-'02 2007–‘08 2015 Phu Tho 43 44 43 Bac Ninh 39 41 Ha Tay 26 42 Hai Phong 44 50 Binh Dinh 42 41 Nghe An 24 30 Gia Lai 44 37 70 Ba Ria - Vung Tau 49 69 Tien Giang 44 65 65 Binh Phuoc 43 59 Weighted average 36 51 60

Comparing 2015 with earlier surveys 47 4.5 Proportion IOL implanted The percentage of cataract operations whereby an IOL was implanted has increased dramatically from 47% in 2000 to 84% in 2007 and 98% in 2015. (Table 39) Table 41. Proportion cataract operations with IOL
Proportion IOL (%) Province 2000-'02 2007–‘08 2015 Phu Tho 36 81 96 Bac Ninh 81 95 Ha Tay 40 82 Hai Phong 59 86 Binh Dinh 39 79 Nghe An 43 83 Gia Lai 74 85 100 Ba Ria - Vung Tau 83 100 Tien Giang 49 88 95 Binh Phuoc 58 83 Weighted average 47 84 98
4.6 Causes of blindness and low vision Table 42 shows the weighted average principal cause of blindness in the three surveys. There are some minor changes in the causes, but none of them are significant. Table 42. Principal cause of bilateral blindness (presenting VA<3/60 in the better eye)
Bilateral blindness - main cause in person (%) Province URE Aph Cat Compl Trach Other
scar Phthis Ptery Glau DR AMD Other PSD
Globe /CNS
2000-‘02 0.9 2.5 68.3 1.8 3.6 2.3 2.0 5.8 0.1 0.1 12.6 0.0 2007-‘08 2.5 0.0 66.1 4.1 1.7 5.6 3.2 6.4 0.6 0.0 9.7 0.0 2015 0.1 0.4 74.0 4.6 1.5 4.1 0.2 0.6 4.0 0.8 1.4 6.3 2.0
URE: Uncorrected refractive error Aph: Uncorrected aphakia Compl: Surgical complications Phthis: Phthisis Trach: Trachomatous corneal scar DR: diabetic retinopathy Other scar: Other corneal scar Ptery: Pterygium AMD: Age related macular degeneration CNS: Central nervous system PSD: Posterior segment disease Glau: Glaucoma Trachomatous corneal opacity Bilateral blindness due to trachomatous corneal opacity seems to be on the decline. In the 2007-’08 survey detailed assessment of trichiasis was part of the examination. This made it possible to make detailed assessments of the workload on trichiasis surgery. In 2015, this was not included in the RAAB. Pterygium Similarly, detailed assessment of pterygium was part of the 2007-’08 survey, to assess the surgical workload of this disorder. In 2015, only the bilateral blindness due to pterygium was assessed, but this was not done in 2000 nor in 2007. Childhood blindness Childhood blindness is not included in the RAAB protocol, which covers only people aged 50 years and older. The prevalence of blindness in people younger than 50 is very low and a sample size of 30.000 or more is needed to obtain prevalence data of acceptable accuracy in this age group. The optional childhood blindness module which was used in 2007-’08 was not applied in the 2015 RAABs in the 14 provinces.

Comparing 2015 with earlier surveys 48 4.7 Annual cataract operations 2007 – 2014 Figure 11 shows the number of cataract operations and the Cataract Surgical Rate (CSR: number of cataract operations in one year divided by the population in millions) in entire Viet Nam from 2007 to 2014. Although the number of operations is increasing, this is not a steady increase and the CSR is relatively low. At present the annual cataract output is not enough to cover the new cases that occur each year and as a result the cataract backlog is increasing. Figure 11. Cataract operations and Cataract Surgical Rate in entire Viet Nam (2007-2014)
0
500
1000
1500
2000
2500
0
50,000
100,000
150,000
200,000
250,000
2007 2008 2009 2010 2011 2012 2013 2014
CSRSố phẫu thuật
Năm
Số lượng và tỉ lệ phẫu thuật thay thể thủy tinh ở Việt Nam

Annex 1 49
Annex 1. RAAB survey form (English)

Annex 2 50
Appendix 3. Summary of research findings in 14 individual provinces RESEARCH ON RAPID ASSESSMENT OF AVOIDABLE BLINDNESS (RAAB) IN
BAC NINH PROVINCE IN 2015 ABSTRACT
Background: The prevalence of visual impairment and blindness has increasing trend and is one of the public health problems in Vietnam as well as in all over the world. The research aims to identify the prevalence of visual impairment; blindness and the cause of blindness which are necessary to define the demand of people for eye care, blindness prevention and control.
Methods: A cross-sectional descriptive study aims to identify the prevalence of visual impairment and blindness of people aged 50 and over was conducted in Bac Ninh from May to July, 2015. The sample size of 2000 people have eye checked which consists of 821 males, 1179 females. The research used random sampling method, choosing 40 groups and investigating 50 people in each group based on rule of door-to-door houses. The data was entered and analyzed on software RAAB6.
Result: The research findings showed that the prevalance of visual impairment from mild to severe (presenting 3/60≤VA<6/12 in the better eye) up to blindness (presenting VA<3/60 in the better eye) in one eye is 26.5% in the both two eyes was 20,5%. In which, the prevalence of bilateral blindness accounted for 3.6%, the prevalence of moderate to severe visual impairment in both two eyes (3/60≤VA<6/18) accounted for 10.9% in the total number of people aged over 50; in which, prevalence of moderate to severe visual impairment among females (12.6%) was significantly higher than those in males (8.3%). The causes of blindness mainly were cataract without surgery (accounted for 53.7%); posterior segment disease (accounted for 20.2%); corneal scars due to other causes (accountedfor 10.3%). Total avoidable blindness causes was 73.6%. The average cataract surgical coverage (CSC) accounted for the individual eye of visual imparment with VA<3/60 was 51.2% and with all VA<6/18 was 25.9%. The average CSC accounted in persons with VA <3/60 and VA <6/18 were 63.4% and 32.3% respectively. After cataract surgery, the rate of good visual acuity was 36.6% and the rate of low vision and blindness was 30.3%. The greatest barriers preventing patients from surgery were far distance to surgery places (43.0%), feeling “no need” for surgery (24.6%) and being “fear” for surgery (13.8%) or being afraid of poor outcome.
Conclusion The research showed that the prevalence of blindness of people aged over 50 in Bacninh
was relatively high (3.6%); the main cause leading to visual impairment and blindness was cataract (53.7%). The successful results of cataract surgery intervention is not high, which is about 41.4%. There are many barriers preventing patients from surgery such as far distance to surgery places, being “fear” for surgery or being affraid of poor outcome.
It is necesssary to intensify health education and promotion to make people regularly taking eye check, early detection of visual imparment causes, improving the quality of cataract surgeries, and proposing solutions to intensify accessibility of people to cataract surgery at the same time.

Annex 2 50
RESEARCH ON RAPID ASSESSMENT OF AVOIDABLE BLINDNESS (RAAB) IN NAMDINH PROVINCE IN 2015: ABSTRACT
Background: The prevalence of visual impairment and blindness has increasing trend and is one of the public health problems in Vietnam as well as in all over the world. The research aims to identify the prevalence of visual impairment; blindness and the cause of blindness which are necessary to define the demand of people for eye care, blindness prevention and control.
Methods: A cross-sectional descriptive study aims to identify the prevalence of visual impairment and blindness of people aged 50 and over was conducted in Namdinh province from May to July, 2015. The sample size of 2000 people have eye checked which consists of 846 males, 1154 females. The research used random sampling method, choosing 40 groups and investigating 50 people in each group based on rule of door-to-door houses. The data was entered and analyzed on software RAAB6.
Result: The research findings showed that the prevalance of visual impairment from mild to severe (presenting 3/60≤VA<6/12 in the better eye) up to blindness (presenting VA<3/60 in the better eye) in one eye is 29.9% in the both two eyes was 25.7%. In which, the prevalence of bilateral blindness accounted for 3.0%, the prevalence of moderate to severe visual impairment in both two eyes (3/60≤VA<6/18) accounted for 13.4% in the total number of people aged over 50; in which, prevalence of moderate to severe visual impairment among females (15.1%) was significantly higher than those in males (10.9%). The causes of blindness mainly were cataract without surgery (accounted for 65.4%); posterior segment disease accounted for 7.9% corneal scars due to other causes (accounted for 7.9%), and total avoidable blindness causes was 81.7%. The average CSC accounted in the individual eye of visual imparment with VA<3/60 was 51.8% and with all VA<6/18 was 25.6%; the average CSC accounted in persons with VA <3/60 and VA <6/18 are 64% and 32,1 respectively. After cataract surgery, the rate of good visual acuity was 55% and the rate of low vision and blindness was 19.8%. The greatest barriers preventing patients from surgery were lack of money (29.3%), far distance to surgery places (43.0%), and being “fear” for surgery and afraid of poor outcome (25.0%).
Conclusion The research showed that the prevalence of blindness of people aged over 50 in
Namdinh was relatively high (3.0%); the main cause leading to visual impairment and blindness was cataract (65.4%). The successful results of cataract surgery intervention is not high, which is about 43.2%. There are many barriers preventing patients from surgery such as lack of money; far distance to surgery places, being “fear” for surgery or being affraid of poor outcome.
It is necesssary to intensify health education and promotion to make people regularly taking eye check, early detection of visual imparment caouses, improving the quality of cataract surgeries, and proposing solutions to intensify accessibility of people to cataract surgery at the same time.

Annex 2 50
RESEARCH ON RAPID ASSESSMENT OF AVOIDABLE BLINDNESS (RAAB) IN PHUTHO PROVINCE IN 2015: ABSTRACT
Background: The prevalence of visual impairment and blindness has increasing trend and is one of the public health problems in Vietnam as well as in all over the world. The research aims to identify the prevalence of visual impairment; blindness and the cause of blindness which are necessary to define the demand of people for eye care, blindness prevention and control.
Methods: A cross-sectional descriptive study aims to identify the prevalence of visual impairment and blindness of people aged 50 and over was conducted in Phutho province from May to July, 2015. The sample size of 2000 people have eye checked which consists of 772 males, 1228 females. The research used random sampling method, particularly, choosing 40 groups and investigating 50 people in each group based on rule of door-to-door houses. The data was entered and analyzed on software RAAB6.
Result: The research findings showed that the prevalance of visual impairment from mild to severe (presenting 3/60≤VA<6/12 in the better eye) up to blindness (presenting VA<3/60 in the better eye) in one eye is 21.9% in the both two eyes was 15.3%. In which, the prevalence of bilateral blindness accounted for 1.8%, the prevalence of moderate to severe visual impairment in both two eyes (3/60≤VA<6/18) accounted for 16.1% in the total number of people aged over 50; in which, prevalence of moderate to severe visual impairment among females (17.7%) was significantly higher than those in males (13.4%). The causes of blindness mainly were cataract without surgery (accounted for 61.1%); post surgery complication accounted for 11.4%; posterior segment disease accounted for 10.9%, and total avoidable blindness causes was84.4%. The average CSC accounted in the individual eye of visual imparment with VA<3/60 was 67.1% and with all VA<6/18 was 28.4%. The average CSC accounted in persons with VA <3/60 and VA <6/18 were 77.4% and 36.1% respectively. After cataract surgery, the rate of good visual acuity was 43%, the rate of low vision and blindness was 25.9%. The greatest barriers preventing patients from surgery are being “fear” for surgery and afraid of poor outcome (40.0%); lack of money (26.7%).
Conclusion: The research showed that the prevalence of blindness of people aged over 50 in Phutho
was not so high (1.8%); the main cause leading to visual impairment and blindness was cataract (61.1%). The successful results of cataract surgery intervention is quite low, which is about 25%. There are many barriers preventing patients from surgery such as being “fear” for surgery; lack of money; being affraid of poor outcome.
It is necesssary to intensify health education and promotion to make people regularly taking eye check, early detection of visual imparment caouses, improving the quality of cataract surgeries, and proposing solutions to intensify accessibility of people to cataract surgery at the same time.

Annex 2 50
RESEARCH ON RAPID ASSESSMENT OF AVOIDABLE BLINDNESS (RAAB) IN DIENBIEN PROVINCE IN 2015: ABSTRACT
Background: The prevalence of visual impairment and blindness has increasing trend and is one of the public health problems in Vietnam as well as in all over the world. The research aims to identify the prevalence of visual impairment; blindness and the cause of blindness which are necessary to define the demand of people for eye care, blindness prevention and control.
Methods: A cross-sectional descriptive study aims to identify the prevalence of visual impairment and blindness of people aged 50 and over was conducted in Dienbien province from May to July, 2015. The sample size of 2000 people have eye checked which consists of 858 males, 1142 females. The research used random sampling method, , choosing 40 groups and investigating 50 people in each group based on rule of door-to-door houses. The data was entered and analyzed on software RAAB6.
Result: The research findings showed that the prevalance of visual impairment from mild to severe (presenting 3/60≤VA<6/12 in the better eye) up to blindness (presenting VA<3/60 in the better eye) in one eye is 31.4% in the both two eyes was 27.3%. In which, the prevalence of bilateral blindness accounted for 3.8%, the prevalence of moderate to severe visual impairment in both two eyes (3/60≤VA<6/18) accounted for 8.4% in the total number of people aged over 50; in which, prevalence of moderate to severe visual impairment among females (9.8%) was significantly higher than those in males (6.7%). The causes of blindness mainly were cataract without surgery (accounted for 71.7%); phthisis accounted for 9.3%; posterior segment disease accounted for 6.6%, and total avoidable blindness causes was 88.9%. The average CSC accounted in the individual eye of visual imparment with VA<3/60 was 40.5% and with all VA<6/18 was 27.3%. The average CSC accounted in persons with VA <3/60 and VA <6/18 were 40.6% and 26.7% respectively. After cataract surgery, the rate of good visual acuity was 50% and the rate of low vision and blindness was 30.3%. The greatest barriers preventing patients from surgery are being “fear” for surgery and afraid of poor outcome (45.5%); far distance to surgery places (38.6%).
Conclusion: The research showed that the prevalence of blindness of people aged over 50 in Dienbien
was relatively high (3.8%); the main cause leading to visual impairment and blindness was cataract (71.7%). The successful results of cataract surgery intervention is quite low, which is about 35.8%. There are many barriers preventing patients from surgery such as being “fear” for surgery and being affraid of poor outcome; feelling “no need” for surgery; far distance to surgery places.
It is necesssary to intensify health education and promotion to make people regularly taking eye check, early detection of visual imparment caouses, improving the quality of cataract surgeries, and proposing solutions to intensify accessibility of people to cataract surgery at the same time.

Annex 2 50
RESEARCH ON RAPID ASSESSMENT OF AVOIDABLE BLINDNESS (RAAB) IN TUYEN QUANG PROVINCE IN 2015
ABSTRACT Background: The prevalence of visual impairment and blindness has increasing trend
and is one of the public health problems in Vietnam as well as in all over the world. The research aims to identify the prevalence of visual impairment; blindness and the cause of blindness which are necessary to define the demand of people for eye care, blindness prevention and control.
Methods: A cross-sectional descriptive study aims to identify the prevalence of visual impairment and blindness of people aged 50 and over was conducted in Tuyenquang province from May to July, 2015. The sample size of 2000 people have eye checked which consists of 843 males, 1157 females. The research used random sampling method, choosing 40 groups and investigating 50 people in each group based on rule of door-to-door houses. The data was entered and analyzed on software RAAB6.
Result: The research findings showed that the prevalance of visual impairment from mild to severe (presenting 3/60≤VA<6/12 in the better eye) up to blindness (presenting VA<3/60 in the better eye) in one eye is 25.7% in the both two eyes was 21.6%. In which, the prevalence of bilateral blindness accounted for 3.4%, the prevalence of moderate to severe visual impairment in both two eyes (3/60≤VA<6/18) accounted for 11.8% in the total number of people aged over 50; in which, prevalence of moderate to severe visual impairment among females (13.1%) was significantly higher than those in males (10.0%). The causes of blindness mainly were cataract without surgery (accounted for 59.7%); posterior segment disease accounted for 8.5%; all globe/CNS abnormalties accounted for 7.2%; total avoidable blindness causes was 77.5%. The average cataract surgical coverage (CSC) accounted for the individual eye of visual imparment with VA<3/60 was 46.3% and with all VA<6/18 was 27.1%; the average CSC accounted in persons with VA <3/60 and VA <6/18 are 60.2% and 35.2% respectively. After cataract surgery, the rate of good visual acuity is 57%, the rate of low vision and blindness is 25.0%. The greatest barriers preventing patients from surgery were unknown if cataract is curable (28.6%); feeling “no need” for surgery (22.2%) and far distance to surgery places (20.6%).
Conclusion: The research showed that the prevalence of blindness of people aged over 50 years in
Tuyenquang compared to researched provinces was relatively high (3.4%); the main causes leading to visual impairment and blindness are refractive error (53.3%) and cataract surgeries which have not yet been performed (59.7%) in turn. The successful results of cataract surgery intervention is quite low, which is about 44.4%. There are many barriers preventing patients difficulties in accessing services cataract surgery
It is necesssary to intensify educational propaganda to make people go for eye test, early detect the status and casuse of blindness, enhance the quality of cataract surgeries, and propose solutions to intensify accessibility of people to cataract surgery at the same time.

Annex 2 50
RESEARCH ON RAPID ASSESSMENT OF AVOIDABLE BLINDNESS (RAAB) IN HATINH PROVINCE IN 2015: ABSTRACT
Background: The prevalence of visual impairment and blindness has increasing trend and is one of the public health problems in Vietnam as well as in all over the world. The research aims to identify the prevalence of visual impairment; blindness and the cause of blindness which are necessary to define the demand of people for eye care, blindness prevention and control.
Methods: A cross-sectional descriptive study aims to identify the prevalence of visual impairment and blindness of people aged 50 and over was conducted in Hatinh province from May to July, 2015. The sample size of 2000 people have eye checked which consists of 735 males, 1265 females. The research used random sampling method, choosing 40 groups and investigating 50 people in each group based on rule of adjacent houses. The data was entered and analyzed on software RAAB6.
Result: The research findings showed that the prevalance of visual impairment from mild to severe (presenting 3/60≤VA<6/12 in the better eye) up to blindness (presenting VA<3/60 in the better eye) in one eye is 47.1% in the both two eyes was 44.3%. In which, the prevalence of bilateral blindness accounted for 3.4%, the prevalence of moderate to severe visual impairment in both two eyes (3/60≤VA<6/18) accounted for 18.2% in the total number of people aged over 50; in which, prevalence of moderate to severe visual impairment among females (23.1%) was significantly lower than those in males (23.5%). The causes of blindness mainly are cataract without surgery (accounted for 59.7%); corneal scars due to other causes (accounted for 12.6%); phithisis accounted for 10.1%; total avoidable blindness causes was 90.6%. The average cataract surgical coverage (CSC) accounted for the individual eye of visual imparment with VA<3/60 is 67% and with all VA<6/18 is 19.0%; the average CSC accounted in persons with VA <3/60 and VA <6/18 are 77.8% and 14.1% respectively. After cataract surgery, the rate of good visual acuity is 57%, the rate of low vision and blindness is 25.0%. The greatest barriers preventing patients from surgery were afraid of poor outcome (33.3%); far distance to surgery places (25.7%); lack of money (21.0%).
Conclusion The research showed that the prevalence of blindness of people aged over 50 years in
Hatinh compared to researched provinces was relatively low (1.5%); the main causes leading to visual impairment and blindness are refractive error (39.1%) and cataract surgeries which have not yet been performed (59.7%) in turn. The successful results of cataract surgery intervention is quite low, which is about 28.6%. There are many barriers preventing patients from surgery such as being “fear” for surgery and being affraid of poor outcome; far distance to surgery places; lack of money.
It is necesssary to intensify educational propaganda to make people go for eye test, early detect the status and casuse of blindness, enhance the quality of cataract surgeries, and propose solutions to intensify accessibility of people to cataract surgery at the same time.

Annex 2 50
RESEARCH ON RAPID ASSESSMENT OF AVOIDABLE BLINDNESS (RAAB) IN QUANGTRI PROVINCE IN 2015: ABSTRACT
Background: The prevalence of visual impairment and blindness has increasing trend and is one of the public health problems in Vietnam as well as in all over the world. The research aims to identify the prevalence of visual impairment; blindness and the cause of blindness which are necessary to define the demand of people for eye care, blindness prevention and control.
Methods: A cross-sectional descriptive study aims to identify the prevalence of visual impairment and blindness of people aged 50 and over was conducted in Quangtri province from May to July, 2015; the sample size of 2000 people have eye checked which consists of 821 males, 1179 females. The research used random sampling method choosing 40 groups and investigating 50 people in each group based on rule of adjacent houses. The data was entered and analyzed on software RAAB6.
Result: The research findings showed that the prevalance of visual impairment from mild to severe (presenting 3/60≤VA<6/12 in the better eye) up to blindness (presenting VA<3/60 in the better eye) in one eye is 34.4% in the both two eyes was 18.3%. In which, the prevalence of bilateral blindness accounted for 3.3%, the prevalence of moderate to severe visual impairment in both two eyes (3/60≤VA<6/18) accounted for 17.8% in the total number of people aged over 50; in which, prevalence of moderate to severe visual impairment among females (19.0%) was significantly higher than those in males (16.1%). The causes of blindness mainly are cataract without surgery (accounted for 61.5%); all globe/CNS abnormalties accounted for 11.9%; posterior segment disease accounted for 7.8%; total avoidable blindness causes was 61.5%. The average cataract surgical coverage (CSC) accounting for the individual eye of visual imparment with VA<3/60 is 60.8% and with all VA<6/18 is 27.4%; the average CSC accounted in persons with VA <3/60 and VA <6/18 were 68.1% and 30.7% respectively. After cataract surgery, the rate of good visual acuity was 58%, the rate of low vision and blindness was 24.1%. The greatest barriers preventing patients from surgery were far distance to surgery places (45.4%); afraid of poor outcome (21.6%).
Conclusion The research showed that the prevalence of blindness of people aged over 50 in
Quangtri was relatively high (3.3%); the main cause leading to visual impairment and blindness was cataract (61.5%).The successful results of cataract surgery intervention is quite low, which is about 37.6%. There are many barriers preventing patients from surgery such as being “fear” for surgery and being affraid of poor outcome; far distance to surgery places.
It is necesssary to intensify educational propaganda to make people go for eye test, early detect the status and casuse of blindness, enhance the quality of cataract surgeries, and propose solutions to intensify accessibility of people to cataract surgery at the same time.

Annex 2 50
RESEARCH ON RAPID ASSESSMENT OF AVOIDABLE BLINDNESS (RAAB) IN QUANGNGAI PROVINCE IN 2015: ABSTRACT
Background: The prevalence of visual impairment and blindness has increasing trend and is one of the public health problems in Vietnam as well as in all over the world. The research aims to identify the prevalence of visual impairment; blindness and the cause of blindness which are necessary to define the demand of people for eye care, blindness prevention and control.
Methods: A cross-sectional descriptive study aims to identify the prevalence of visual impairment and blindness of people aged 50 and over was conducted in Quangngai province from May to July, 2015. The sample size of 2000 people have eye checked which consists of 711 males, 1288 females. The research used random sampling method choosing 40 groups and investigating 50 people in each group based on rule of adjacent houses. The data was entered and analyzed on software RAAB6.
Result: The research findings showed that the prevalance of visual impairment from mild to severe (presenting 3/60≤VA<6/12 in the better eye) up to blindness (presenting VA<3/60 in the better eye) in one eye is 51.1% in the both two eyes was 45.9%. In which, the prevalence of bilateral blindness accounted for 1.5%, the prevalence of moderate to severe visual impairment in both two eyes (3/60≤VA<6/18) accounted for 17.5% in the total number of people aged over 50; in which, prevalence of moderate to severe visual impairment among females (17.7%) was significantly higher than those in males (16.1%). The causes of blindness mainly were cataract without surgery (accounted for 45.6%); phithisis accounted for 13.0%; all globe/CNS abnormalties accounted for 8.3%; total avoidable blindness causes accounted for 80.5%. The average cataract surgical coverage (CSC) accounted for the individual eye of visual imparment with VA<3/60 was 77.0% and with all VA<6/18 was 23.2%; the average CSC accounted in persons with VA <3/60 and VA <6/18 were 72% and 28.3% respectively. After cataract surgery, the rate of good visual acuity was 58%, the rate of low vision and blindness was 24.1%. The greatest barriers preventing patients from surgery were far distance to surgery places (34.3%); afraid of poor outcome (23.9%); lack of money (16.4%).
Conclusion The research showed that the prevalence of blindness of people aged over 50 years in
Quang Ngai was 3.3%; the main cause leading to visual impairment and blindness was cataract (45.6%).The successful results of cataract surgery intervention is quite low, which is about 37.1%. There are many barriers preventing patients from surgery such as being “fear” for surgery and being affraid of poor outcome; far distance to surgery places; lack of money.
It is necesssary to intensify educational propaganda to make people go for eye test, early detect the status and casuse of blindness, enhance the quality of cataract surgeries, and propose solutions to intensify accessibility of people to cataract surgery at the same time.

Annex 2 50
RESEARCH ON RAPID ASSESSMENT OF AVOIDABLE BLINDNESS (RAAB) IN GIALAI PROVINCE IN 2015: ABSTRACT
Background: The prevalence of visual impairment and blindness has increasing trend and is one of the public health problems in Vietnam as well as in all over the world. The research aims to identify the prevalence of visual impairment; blindness and the cause of blindness which are necessary to define the demand of people for eye care, blindness prevention and control.
Methods: A cross-sectional descriptive study aims to identify the prevalence of visual impairment and blindness of people aged 50 and over was conducted in Gialai province from May to July, 2015. The sample size of 2000 people have eye checked which consists of 823 males, 1177 females. The research used random sampling method choosing 40 groups and investigating 50 people in each group based on rule of adjacent houses. The data was entered and analyzed on software RAAB6.
Result: The research findings showed that the prevalance of visual impairment from mild to severe (presenting 3/60≤VA<6/12 in the better eye) up to blindness (presenting VA<3/60 in the better eye) in one eye is 24.1% in the both two eyes was 20.0%. In which, the prevalence of bilateral blindness accounted for 2.0%, the prevalence of moderate to severe visual impairment in both two eyes (3/60≤VA<6/18) accounted for 10.2% in the total number of people aged over 50; in which, prevalence of moderate to severe visual impairment among females (10.9%) was significantly higher than those in males (9.5%). The causes of blindness mainly were cataract without surgery (accounted for 50.5%); corneal scars due to other causes (accounted for 16.8%); total avoidable blindness causes was 78.3%. The average cataract surgical coverage (CSC) accounted for the individual eye of visual imparment with VA<3/60 was 54.8% and with all VA<6/18 was 25.2%; the average CSC accounted in persons with VA <3/60 and VA <6/18 were 60.0% and 18.9% respectively. After cataract surgery, the rate of good visual acuity was 70%, the rate of low vision and blindness was 29.6%. The greatest barriers preventing patients from surgery were lack of money (29.3%); far distance to surgery places (26.1%); feel “no need” for surgery (20.7%).
Conclusion The research showed that the prevalence of blindness of people aged over 50 in Gialai
was relatively high (2.0%); the main cause leading to visual impairment and blindness was cataract (50.5%). The successful results of cataract surgery intervention is quite low, which is about 54.6%. There are many barriers preventing patients from surgery such as feeling “no need” for surgery; far distance to surgery places; lack of money.
It is necesssary to intensify health education and promotion to make people regularly taking eye check, early detection of visual imparment caouses, improving the quality of cataract surgeries, and proposing solutions to intensify accessibility of people to cataract surgery at the same time.

Annex 2 50
RESEARCH ON RAPID ASSESSMENT OF AVOIDABLE BLINDNESS (RAAB) IN LAMDONG PROVINCE IN 2015: ABSTRACT
Background: The prevalence of visual impairment and blindness has increasing trend and is one of the public health problems in Vietnam as well as in all over the world. The research aims to identify the prevalence of visual impairment; blindness and the cause of blindness which are necessary to define the demand of people for eye care, blindness prevention and control.
Methods: A cross-sectional descriptive study aims to identify the prevalence of visual impairment and blindness of people aged 50 and over was conducted in Lamdong province from May to July, 2015. The sample size of 2000 people have eye checked which consists of 777 males, 1223 females. The research used random sampling method choosing 40 groups and investigating 50 people in each group based on rule of adjacent houses. The data was entered and analyzed on software RAAB6.
Result: The research findings showed that the prevalance of visual impairment from mild to severe (presenting 3/60≤VA<6/12 in the better eye) up to blindness (presenting VA<3/60 in the better eye) in one eye is 36.9% in the both two eyes was 32.2%. In which, the prevalence of bilateral blindness accounted for 1.6%, the prevalence of moderate to severe visual impairment in both two eyes (3/60≤VA<6/18) accounted for 13.5% in the total number of people aged over 50; in which, prevalence of moderate to severe visual impairment among females (15.7%) was significantly higher than those in males (10.0%). The causes of blindness mainly were cataract without surgery (accounted for 39.4%); posterior segment disease accounted for 16.5%; corneal scars due to other causes (accounted for 13.8%); total avoidable blindness causes wasr 62.3%. The average cataract surgical coverage (CSC) accounted for the individual eye of visual imparment with VA<3/60 was 66.9% and with all VA<6/18 was 35.5%; the average CSC accounted in persons with VA <3/60 and VA <6/18 were 81.8% and 42.4% respectively. After cataract surgery, the rate of good visual acuity was 70%, the rate of low vision and blindness was 13.3%. The greatest barriers preventing patients from surgery were far distance to surgery places (30.3%); afraid of poor outcome (26.0%); lack of money (20%).
Conclusion The research showed that the prevalence of blindness of people aged over 50 years in
Lamdong was 1.6%; the main cause leading to visual impairment and blindness was cataract (39.4%).The successful results of cataract surgery intervention is quite low, which is about 40.6%. There are many barriers preventing patients from surgery such as being “fear” for surgery and being affraid of poor outcome; far distance to surgery places; lack of money.
It is necesssary to intensify educational propaganda to make people go for eye test, early detect the status and casuse of blindness, enhance the quality of cataract surgeries, and propose solutions to intensify accessibility of people to cataract surgery at the same time.

Annex 2 50
RESEARCH ON RAPID ASSESSMENT OF AVOIDABLE BLINDNESS (RAAB) IN BINHDUONG PROVINCE IN 2015: ABSTRACT
Background: The prevalence of visual impairment and blindness has increasing trend and is one of the public health problems in Vietnam as well as in all over the world. The research aims to identify the prevalence of visual impairment; blindness and the cause of blindness which are necessary to define the demand of people for eye care, blindness prevention and control.
Methods: A cross-sectional descriptive study aims to identify the prevalence of visual impairment and blindness of people aged 50 and over was conducted in Binhduong province from May to July, 2015. The sample size of 2000 people have eye checked which consists of 713 males, 1287 females. The research used random sampling method choosing 40 groups and investigating 50 people in each group based on rule of adjacent houses. The data was entered and analyzed on software RAAB6.
Result: The research findings showed that the prevalance of visual impairment from mild to severe (presenting 3/60≤VA<6/12 in the better eye) up to blindness (presenting VA<3/60 in the better eye) in one eye is 29.0% in the both two eyes was 22.8%. In which, the prevalence of bilateral blindness accounted for 2.4%, the prevalence of moderate to severe visual impairment in both two eyes (3/60≤VA<6/18) accounted for 11.3% in the total number of people aged over 50; in which, prevalence of moderate to severe visual impairment among females (12.1%) was significantly higher than those in males (9.8%). The causes of blindness mainly were cataract without surgery (accounted for 63.4%); cataract surgery complication accounted for 8.0%; total avoidable blindness causes was 80.7%. The average cataract surgical coverage (CSC) accounted for the individual eye of visual imparment with VA<3/60 was 72.1% and with all VA<6/18 was 42.6%; the average CSC accounted in persons with VA <3/60 and VA <6/18 were 82.8% and 50.2% respectively. After cataract surgery, the rate of good visual acuity was 71%, the rate of low vision and blindness was 13.1%. The greatest barriers preventing patients from surgery are feelling “no need” (39.7%); afraid of poor outcome (30.9%); lack of money (13.2%).
Conclusion The research showed that the prevalence of blindness of people aged over 50 years in
Binhduong compared to researched provinces was relatively hight (2.4%); the main causes leading to visual impairment and blindness are refractive error (49.5%) and cataract surgeries which have not yet been performed (63.4%) in turn. The successful results of cataract surgery intervention is quite low, which is about 55.5%. There are many barriers preventing patients from surgery such as being “fear” for surgery and being affraid of poor outcome; feelling “no need” for surgery; lack of money.
It is necesssary to intensify educational propaganda to make people go for eye test, early detect the status and casuse of blindness, enhance the quality of cataract surgeries, and propose solutions to intensify accessibility of people to cataract surgery at the same time.

Annex 2 50
RESEARCH ON RAPID ASSESSMENT OF AVOIDABLE BLINDNESS (RAAB) IN TIENGIANG PROVINCE IN 2015: ABSTRACT
Background: The prevalence of visual impairment and blindness has increasing trend and is one of the public health problems in Vietnam as well as in all over the world. The research aims to identify the prevalence of visual impairment; blindness and the cause of blindness which are necessary to define the demand of people for eye care, blindness prevention and control.
Methods: A cross-sectional descriptive study aims to identify the prevalence of visual impairment and blindness of people aged 50 and over was conducted in Tiengiang province from May to July, 2015; the sample size of 2000 people have eye checked which consists of 805 males, 1194 females. The research used random sampling method choosing 40 groups and investigating 50 people in each group based on rule of adjacent houses. The data was entered and analyzed on software RAAB6.
Result: The research findings showed that the prevalance of visual impairment from mild to severe (presenting 3/60≤VA<6/12 in the better eye) up to blindness (presenting VA<3/60 in the better eye) in one eye is 35.2% in the both two eyes was 28.1%. In which, the prevalence of bilateral blindness accounted for 2.4%, the prevalence of moderate to severe visual impairment in both two eyes (3/60≤VA<6/18) accounted for 14.4% in the total number of people aged over 50; in which, prevalence of moderate to severe visual impairment among females (15.3%) was significantly higher than those in males (12.9%). The causes of blindness mainly were cataract without surgery (accounted for 62.6%); phithisisi accounted for 11.7%; all globe/CNS abnormalties accounted for 8.6%; total avoidable blindness causes was 63.1%. The average cataract surgical coverage (CSC) accounted for the individual eye of visual imparment with VA<3/60 was 71.8% and with all VA<6/18 was 40.0%; the average CSC accounted in persons with VA <3/60 and VA <6/18 were 84.3% and 51.9% respectively. After cataract surgery, the rate of good visual acuity is 65%, the rate of low vision and blindness was 11.2%. The greatest barriers preventing patients from surgery were unknown if cataract is curable (28.8%); afraid of poor outcome (16.7%).
Conclusion The research showed that the prevalence of blindness of people aged over 50 in Tiengiang
was relatively high (2.4%); the main cause leading to visual impairment and blindness was cataract (62.6%). The successful results of cataract surgery intervention is medium, which is about 50.3%. There are many barriers preventing patients from surgery such as being “fear” for surgery and being affraid of poor outcome; feelling “no need” for surgery; unknown if cataract is curable.
It is necesssary to intensify educational propaganda to make people go for eye test, early detect the status and casuse of blindness, enhance the quality of cataract surgeries, and propose solutions to intensify accessibility of people to cataract surgery at the same time.

Annex 2 50
RESEARCH ON RAPID ASSESSMENT OF AVOIDABLE BLINDNESS (RAAB) IN BARIA-VUNGTAU PROVINCE IN 2015: ABSTRACT
Background: The prevalence of visual impairment and blindness has increasing trend and is one of the public health problems in Vietnam as well as in all over the world. The research aims to identify the prevalence of visual impairment; blindness and the cause of blindness which are necessary to define the demand of people for eye care, blindness prevention and control.
Methods: A cross-sectional descriptive study aims to identify the prevalence of visual impairment and blindness of people aged 50 and over was conducted in Baria-Vungtau province from May to July, 2015; the sample size of 2000 people have eye checked which consists of 891 males, 1109 females. The research used random sampling method choosing 40 groups and investigating 50 people in each group based on rule of adjacent houses. The data was entered and analyzed on software RAAB6.
Result: The research findings showed that the prevalance of visual impairment from mild to severe (presenting 3/60≤VA<6/12 in the better eye) up to blindness (presenting VA<3/60 in the better eye) in one eye is 33.7% in the both two eyes was 27.7%. In which, the prevalence of bilateral blindness accounted for 2.2%, the prevalence of moderate to severe visual impairment in both two eyes (3/60≤VA<6/18) accounted for 13.4% in the total number of people aged over 50; in which, prevalence of moderate to severe visual impairment among females (15.2%) was significantly higher than those in males (11.1%). The causes of blindness mainly were cataract without surgery (accounted for 68.3%); posterior segment disease accounted for 9.7%; all globe/CNS abnormalties accounted for 7.0%; total avoidable blindness causes was 81.2%. The average cataract surgical coverage (CSC) accounted for the individual eye of visual imparment with VA<3/60 was 66.8% and with all VA<6/18 was 29.8%; the average CSC accounted in persons with VA <3/60 and VA <6/18 were 78.6% and 37.5% respectively. After cataract surgery, the rate of good visual acuity was 52.4%, the rate of low vision and blindness was 16.2%. The greatest barriers preventing patients from surgery were afraid of poor outcome (44.0%); feelling “no need” (23.8%); lack of money (14.3%).
Conclusion: The research showed that the prevalence of blindness of people aged over 50 years in
Baria-Vungtau compared to Bacninh, Namdinh,.... provinces was lower (2.2%). The main cause leading to visual impairment and blindness was cataract (68.3%). The successful results of cataract surgery intervention is quite low, which is about 52.4%. There are many barriers preventing patients from surgery such as being “fear” for surgery and being affraid of poor outcome; feelling “no need” for surgery; lack for money.
It is necesssary to intensify educational propaganda to make people go for eye test, early
detect the status and casuse of blindness, enhance the quality of cataract surgeries, and propose solutions to intensify accessibility of people to cataract surgery at the same time.
RESEARCH ON RAPID ASSESSMENT OF AVOIDABLE BLINDNESS (RAAB) IN CAMAU PROVINCE IN 2015:

Annex 2 50
ABSTRACT Background: The prevalence of visual impairment and blindness has increasing trend
and is one of the public health problems in Vietnam as well as in all over the world. The research aims to identify the prevalence of visual impairment; blindness and the cause of blindness which are necessary to define the demand of people for eye care, blindness prevention and control.
Methods: A cross-sectional descriptive study aims to identify the prevalence of visual impairment and blindness of people aged 50 and over was conducted in Camau province from May to July, 2015; the sample size of 2000 people have eye checked which consists of 851 males, 1149 females. The research used random sampling method choosing 40 groups and investigating 50 people in each group based on rule of adjacent houses. The data was entered and analyzed on software RAAB6.
Result: The research findings showed that the prevalance of visual impairment from mild to severe (presenting 3/60≤VA<6/12 in the better eye) up to blindness (presenting VA<3/60 in the better eye) in one eye is 43.7% in the both two eyes was 34.7%. In which, the prevalence of bilateral blindness accounted for 2.9%, the prevalence of moderate to severe visual impairment in both two eyes (3/60≤VA<6/18) accounted for 17.0% in the total number of people aged over 50; in which, prevalence of moderate to severe visual impairment among females (17.3%) was significantly higher than those in males (16.6%). The causes of blindness mainly were cataract without surgery (accounted for 68.8%); cataract surgery complication accounted for 10.4%; all globe/CNS abnormalties accounted for 5.7%; total avoidable blindness causes was 90.4%. The average cataract surgical coverage (CSC) accounted for the individual eye of visual imparment with VA<3/60 was 56.2% and with all VA<6/18 was 28.4%; the average CSC accounted in persons with VA <3/60 and VA <6/18 were 76.8% and 39.3% respectively. After cataract surgery, the rate of good visual acuity was 40.8%, the rate of low vision and blindness was 16.1%. The greatest barriers preventing patients from surgery were lack of money (70.5%); afraid of poor outcome (11.8%); far distance to surgery places (7.4%).
Conclusion: The research showed that the prevalence of blindness of people aged over 50 in Camau
was relatively high (2.9%); the main cause leading to visual impairment and blindness was cataract (68.8%). The successful results of cataract surgery intervention is quite low, which is about (40.8%). There are many barriers preventing patients from surgery such as lack of money; being “fear” for surgery and being affraid of poor outcome; far distance to surgery places. It is necesssary to intensify educational propaganda to make people go for eye test, early detect the status and casuse of blindness, enhance the quality of cataract surgeries, and propose solutions to intensify accessibility of people to cataract surgery at the same time.