0t - ices.dk
TRANSCRIPT
This paper not to be cited without prior referenc~ to the author
International Council for theExploration of the Sea
CM 1980/3: 19Fish Ca! ture CommitteeRef: Pelagic Fish andDemersal Fish Committee
A PRFJ..IMINARY INVESTIGATION OF TEE TAR<mI:' STRENGTH OF l'ERRING
, ,
by
'.'J I Edwards·
DAFS Marine Laboratory, Aberd~en, Scotland, UK.
Summary.
Rllsume
Cette contribution d~crit 5 exp~riences destin~es a" ~es~ la va1eur' de 1 ~la:tiorl 'du '~ib:ie pT
kilo des harehgs vivants. Elle d~crit la m~thode e':p~rimentale utilLs~e, rapportles r~sultats de chaque exp~'Tience, ·discute les sou"ces probables dl'lrreur, etconclu,que la force objective moyenne par kilo de hlreng dans la g~!e 21 a 25 cm
• 'est -31.5 dB.
Introduction
."Ta, enable estimates of area b?,ck-scattering strengtk s, to be converted to estimates'of'biomass, fisheries 'scientists must kno~ the averEge target strength for thespecies of fish under observation. There are sever~l methods'of measuring targetstrength (Goddard and vlelsby, '1977; Nakken and OlSf n, 1977; Johannessan andLasse 1974).' The method reported here fallaNs that developed by Johannesson et ale( 1974)., Edwards (1975)' and Dunn (1979) and has been 3.dapted and applied to - -measureroents of herring. : .
The fish are free-swirnmihg but confined within an e~~erimental cage. T!.e targetstrength measured in the experiments r~~orted here iS'obtained by measuring thearea.sca~tering_~oefficie~t(?teradian ) 0t a grou~ cf fi~ and t~eir corre~pondingdens~ty ~~1kg ~1 ' thus y~eld~ng the target strengtb per k~logram ~n dB//1 msteradian kg •
1
The five experiments reported here were conducted at Loch Duich on the WestCoast of Scotland in November and December, 1979.
,Experimental TechniguesI
IThe problems assQciated with the measurement of live caged fish have beeninvestigated in aseries of experiments which started in 1975 (Edwards, 1975).The equipment used in these experiments was similar to that described by Dunn(1979). It con~~sted of an experimental cage rigged within a guard cage,suspended below a transducer platform. The experimental cage was at a range ofapproximately 6 m from the transducer face. Fish were placed within the experimental cage and the whole rig was lowered on a single suspension wire so that the.experimental caße was approximately·17.5 m below the surface. Figure 1 illustratesthe experimental equipment. A low-light TV camera was positioned below theexperimental cage, which allowed monitoring of the fish 'during day-light hours~ithout the us~ of artificial lighting. A reference target (72.4 mm brass ball)was suspended llsing a three-part suspension at a range of approximately 3 m belo'iJ e·:.:he transdtlcer.. The position of the brass ball was carefully adjusted to locateit on the acoustic axis of the transducer.
The experimen':al rig, as described above, was suspended below a raft, moored in100 m of wate:~ and connected by '1 km of cable to a mobile laboratory t sited
'onsßore. The laboratory contained a t~ansmitter, receiver, data logging computerärtd TV monitcring and recording systems. The raft was equipped with hydrauliciifting equif,ment to assist in the deployment. of the experimental~equipment. Thegeneral exp~~imental arrangemen~s are illustrated in Figure 2. .
The transducer used was a Simrad 38-26/22-E 38 kBz ceramic unit, powered by a2 kW transmitter which transmitted a 500 jusec pulse. The echoes received werefirst amplified and then processed by an en~elope detector circuit which removedthe carrier frequency whilst retaining the shape or envelope of the pulse. Theenvelope was sampled at a,rate of 0.1 ms.ec. Each sampIe was then converted intoa 12 bit binary number. These numbers were read by the computer which thenapplied a range correction of the form 20 log R + 2~. R and then squared to obtaina number proportional to the returned power. The sampIes ,;ere then range gatedand selected portions summed to produce an integrated echo energy. The repetition ...rate between sampIes was 0.3 sec. The computer was programmed to collect and analyse1000 transmissions, which takes five minutes, and then suspended data collectionfor one minute to produce a summary of the last 1000 transmissions. The summarywas'presented in the form of histograms on a graphics VDU. It was also printedon a line printer, and the raw data was stored on magnetic tape for further analysis.A sampIe of .the histogram is illustrated in Figure 3. This six minute cycle wasrepeated throughout the experi~ent.
The five herring experiments d1ffered from"tne gadoid experiments reported byEdwards (1975), Dunn (1979), and Forbes, Simrnonds and Edwards (1980) in severalways. Adaptations were required to overcome the dif~iculties associated withhandling herringo Herring are very difficult to capture live and keep in goodcondition. In particular, fis~ which 10080 more than about 10% of thej~ scalesduring the capture and handling processes usually die within a few hours. Toovercome this a method of transferring and transporting herring which eliminatedcontact between fish and container had to be developed. The fish were capturedusing a two-boat ring netting techniqueo The herring were encircled in.the normalway, but instead of drying out the net and taking the fish on board, the ring net
2

;,.
/I
•
0:--.__"
'.\\Tas left as ·Q..1.95>se bae;'- '''i+. .fish· t;J.--e:noport 1')a:rao... CEdwarrl.s ... 1..980) was thenmanoeuvred alongs1a~.. ~he- net and the herring were. transferred using large plasticbuckets from the ring net into the barge. The barge was then towed to theexperimental site and used to store the herring until required. At the start ofeach experiment the barge was manoeuvred alongside the experimental rigG Asection of the herring population in the barge was isolated using a mobile curtain netand the fish were then transferred to the experimental cage using large plasticbuckets. This method of capture, transport and transfer enabled undamaged herringto be introduced into the experimental cage.
The experimental cage was constructed from a nylon-reinforced, resin-coatednetting (5 mm bar). The cage was octagonal in plan, 2 m wide measured across thef~ats and 1 m deep. Netting of this type was found to present an effective~ound~y which did not damage the fish. .
When the required number of fish had been transferred to the experimental cage~between 68 and 250 fish) the cage was lowered in 3 m steps to 17.5 m. Each 3mincrement took approximately 1 minute and the fish were maintained at the!intermediate depth for approximately 5 minutes. The process of lowering the fish,·to 17.5 ~ took 40 minutes. The closed circuit TV system ~las used to monitor the:behavio~ of the herring during this increase in pressure.
I
T~e fish remained at 17.5 m throughout the experiment, data being continuouslycollected usipg the six minute cycle detailed above. In exPeriments 7/79, 8/79and 11/79 artific.ial lighting was used to supplement natural light and .e:x:tend theperiod d~ing which the TV system could be used to monitor the condition andbehaviour ~f the fish. (The experiment numbers refer to the numberirig sequenceused at the Loch Duich Field Station.)
At the end of each experiment the fish were recovered and individually weighedand measured.
Results
The results \\Tere caiculated on the basis of a direct comparison between thestandard reference target (a brass b~l at a range of 3.3 m) ~nd a table tennisball placed at the same range aso the fi6h~ Both targets were adjusted to be onthe acoustic axis of the transdueer. The table tennis ball was taken to have atarget strength of ':'42 dB~. 'The eomparison gave a target strength of -31 dB for thestandard target. All the results quoted below are based on this comparison.
The effeetive beam angle for the transdueer (10 log ~ ) was calculated to be-17.14 dB. This ealeulation takes into aeeount the limited size of the experimentalcage.
The equivalent area seattering coeffieient of the inner e~erimental cage wasmeasured over aperiod of two days as -39.4 dB//steradian • The data werecorrected by subtracting the corresponding energy from the energy of the fishecho.
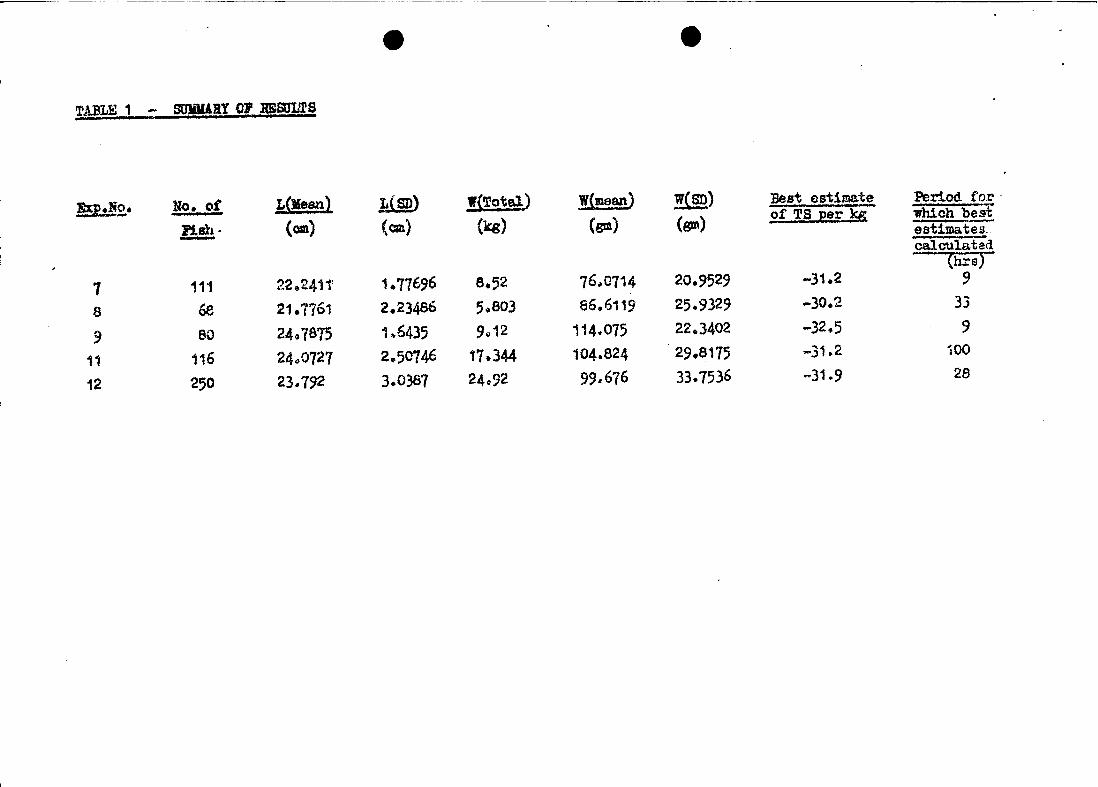
The data from the five experiments on herring performed in November and December,1979, are summarised in Table 1. The best estimate of the target strength per kgwas calculated after a elose examination of the mortality and condition of thefish as monitored on the low-light TV system, combined with the information
3

extracted from the acoustic data. Before data was included in the best estimateit bad to satisfy the following criteria:-
1; . 'l'he herring had to be in good cOI\dition \'Ii th less than 5% mortalities or,\ escapes.II2: The distribution of the herring within the cage had to be uniform.f
~ The 12 and 24 hour running means of target strength per kg had to be wellbehaved.
~he data for each experiment is summarised below. One, twelve and twenty-fourhour running means are plotted in Figures 3 to 7.
Experiment 7/79 (Figure 3)
The first experiment was terminated after less than twenty-four hours whenmortality had,reached twenty-five fish out of the original one hundred and elevenplaced in the experimental .cage. The estimate (-31.2 dB per kg for herring ofmean length 22.24 cm) is based on the first nine hours of data during wh~ch timeonly one mortality occ~red•. The fish showed a tendency to increase their targetstrength over this initial period by approximately 2 dB per kg. The cause of thisincrease is not fully understood, but it is thought to result from changes inbehaviour due to. a decline' in the condition 0f the fish. Overhead lighting wasused at various times tp enable TV pictures to be obtained at night.
Experiment 8/79 (Figure 4)
•
This experiment lasted for approximately six days during which time the mortalityincreased progressively from ten dead at the end of the second day to forty-eightdead out of the original sixty-eight fish at the end of six days. The estimateof target strength (-30.2 dB per kg for herring of mean length 21.77 cm) includes'only the first t~irty-three hours of data collected, at the end of which four fishwere dead. The target strength showed a tendency to decrease by approximately 1 dBduring the first four hours of the experiment, remain steady for approximately 4Itthree hours and then steadily increase as the dead fish lying on their sides atthe bottom of the cage contributed·an increasing amount tQ the integration. Againoverhead flood lighting was used et various times to enable TV pictures to beobtained at night.
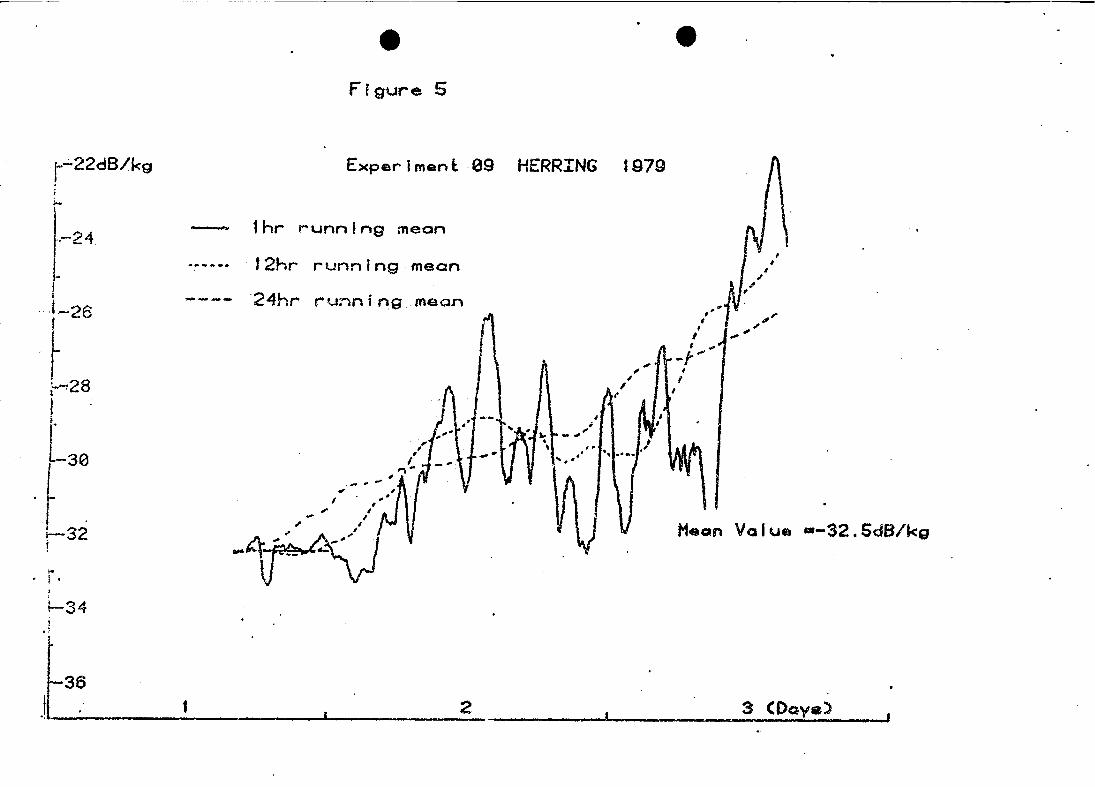
Experiment 9179 (Figure 5)
Slightly larger fish were used in this experiment, which was terminated after twodays when the mortality of the herring had increased to a~ove.the 50% level. Datafrom the first nine hours were used for the estimate of target strength (-32.5 dBper kg for herring of mean length 24.79 cm). At the end of this period eightfish out of the original eighty had died. No artificial light was used duringthis experiment. The target strength appeared to be stable over the fi. 'st fewhours of this experiment, but as in the previous two experiments it increasedgradually as the number of dead fish increased.
4
•
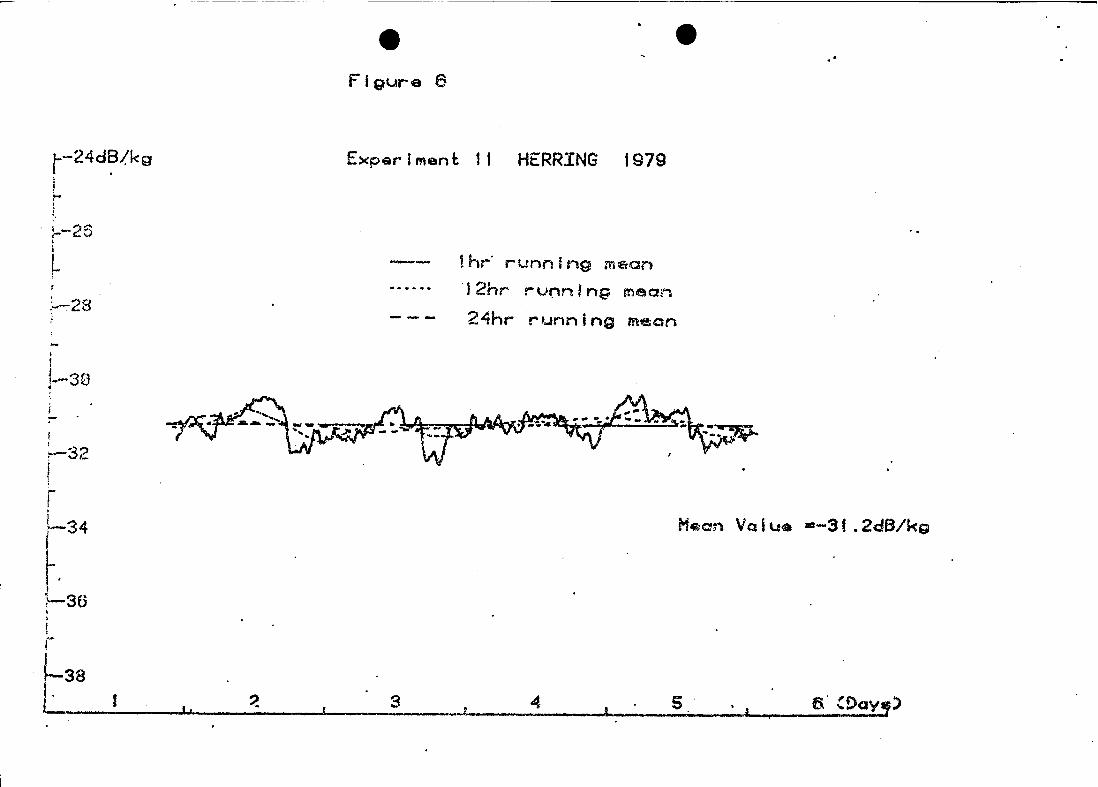
Experiment 11/79 (~~gure 6)
This experiment,us~d herring whi~h.had been handled with 1mproved techniques andincreased care to'prevent physicaldamage'tö the fish. Flood lighting was alsoused throughput'the duration of the experiment. Only five fish died out of onehuncired and sixteen over' a 'foUr day peri,.od during which time th'e target strength(-31.2 da per kg for herring of mean length 24.07 em) remained virtua1ly constant,with hourly means värying by less than 2 dB. The target strength showed a tendeneyto increase' o~er the firs~ fe~ hourS'of the experimen~•.. ~ " :.
E:!fperiment ,12/79' (Figure 7).f
,The Ün~l exper~ent used: a~prPJ~i~~tely t\1,ice a~ many, hsh (259), al?, 'ExpeI'imeht 11,I but unfortunately was plagued by defects in th~ e~peri~en~al cage which allowedI fish to escape into the guard eage although mortality was,~ow. Onee the fish had
escaped irito the guard 'cage they were excluded from the ~ntegration interval thuscausing a progressive cirop in apparent target strength during the first halt of theexperiment.' Tbe initial target strength qf·the herring act~ally rose slightly andthen fell during.the first 3 hours of the:experiment~ Data'from the first·twentyeig&t hours were 'used in the calculation of targ~t strength ~-31.9 4B per kg forherring ?~ mean leng~h 23.79 cm). At the e~d öf thi~ period the number of fishwhich had.escaped was'ten, out of ~he original two h~dred. and fifity.· Noartificial lighting was u~ed during this experiment.
Discussion
the moreThis wasvisibleprevent
•
Previous target 'strength experiments performed,by Mar.ine Laboratory st~ff·at·Loch Etive (Edwards, 1975), Loch Hourn and Loch Duich (Dunn, 1978; Forbes,Simmonds and Edwards, 1980) have concentrated on gadoids, especially cod, haddock,whiting and saithe. BQth the .gadoid and herri~ expe~iments shared a similarexperimental technique, but .two major modifications had t? be m~d~~o allow themore delicate 'herring. to survive. , . .' I •.... " ..
Firstly, the method of transport and transfer of live herring had to be completelyredesigned 50 as to minimise the pbysical. damage and 1055 of.. scales. ~he use. oflarge plastic buckets filled with water to transfer the herring from the ring netto the fish barge and subsequently from the fish barge to the experimental rigenabled mortalities to be kept within acceptable le~els and ensured that the·herring could be measured in good condition. In the ligl.: of experience gained inexperiments 7/79, 8/79 and 9/79 the transfer techniques were improved ~or
experiments 11/79 and 12/79. This improvement took the form of reducing thenumber of fish within the bucket for each transfer and carrying out each transfermore slowly and carefully. As a result, the period for which valid target strengthmeasurements could be obtained ~as extenqed from approx.imately on:e day tQ four d8ys.
Secondly, the inner exyerim~nt C8&e had ~o be reconstructed to preventactive her~ing from either e~caping or bec?ming entangled in the meph.achieved by·the use of a resin-cQated fibreglass.netting w4ich was morethan the netting used .in ga40id experiments,' ~d a ~aller mesh size toescapes and a smo~ther te~t~e to prevent entanglement.
The most' striking.difference bet~een the acoustic prope~ties of herring and gadoidsis the relatlvely small long-term variatipn in the herring target strength data.The short-term variation, as measured by the standard deviation of a single sixminute data block (1000 sampIes), is in the region of 8C6~, a similar value to that
5

obtained from gadoid experiments. However, the gadoid experime~ts werecharacterised by an acclimatization period associated with the increase in depth.This period lasted petween one and a half and seven days, during which time thetarget strength increased by,between ~ dB and 11 dB. A typical cod experiment isillustrated in Figure 8, when 4.47 kg of cod were subjected to an increase inpressure from one atmosphere to 2.75'~tmospheres, produged by lowering the fishfrom near the surface where they had' been kept, to 17.5 m ~here the measurementswere made. 'The herring measured in the experiments reporte,d here ·were' subjectedto a similar increase in pressure'but no long-term acclimatization effects areevident in the data. The initial variations in target strength do not, demonstrateany conclusive trend. Of the five experiments reported, two (7/79 and 11/79)showed a tendency for the target strength to increase for the first few hours ofthe', experiment, and one (8/79) showed a tendency' for the target, strength tp' .decrease. In experiment 9/79 the target strength remained constant," \'ihilst inexperiment 12/79 it rose and fell within the first few hours of the ·~xPeriment.
Changes in the target strenghts of'gadoids when subJected to increased'pressurehave been attributed ·tQ changes in swimbladder size. The acoustic mis-match •between the gas contained within the 'swimbladd~r and sea water is thoug~ to accountfor a large proportion of the energy reflected from the gadoids. Thus a change inthe size of the swimbladder in response to a change in,pressure would cause achange in target strength. Although the structure of the swimbladder in herringand gadoids is different in that gadoids have a large unvented swimbladder whileherring have a smaller vented one,it might be expected that they would react to anincrease in pressure in a similar way. The target strength of herring would bereduced as the pressure increased rapidly, but not to the same extent as~in gadoids.This does not appear to be the case and the reasons are not yet cl·ear. Fourpossible explanations are outlined below:- .
1 That the tilt angle (that is, the angle which the axis of the fish makes withwith the horizontal plane) in gadoid experiments is responsible for the changein target strength and that the variations in target strength caused by changesin swimbladder size are small.
2 That the relatively'small size of the swimbladder in ~erring has little effecton the target strength of the fish. 4It
3 The herring can acclimatize very qu1ckly.
4 That conditions withi,n the experimental. cage prevent the herring from acclimatizing•. ..
Further 'experiments on ~he target strength of herrin~ are planned for November andDecember, 1980, in an effort. to clarify this question.
At the latitude of Loch Duich (57°20 l N) there are only about '7 hours of daylightin November and December and the prevailing weather conditions further reduce naturallight levels. These conditions restricted the proportion of the day during whichTV pictures could be taken. Thus it became necessary to use artificial lighting toobtain amore continuous monitoring of the behaviour and condition of the fish.However, the reaction of caged herring to artificial lighting is not fully understood and the use' of artificial lighting was restricted in the knowledge that itwas likely to cause unnatural behaviour and hence influence the target strengthmeasurements.
'." .
6
•
Initial observations on the,e!fects of chang~s in light level were made duringe~periments 7(?9 and 8(79.~ Switq~ng the,floodoiight~ o~ an4 off c~~sed a distinctincrease in the.~ctivity of the fish. The disturbances lasted approximately fiveminutes after tlie lights were either switched on or off~ Observations on the 'effects of switching the lights off were made ~lhen light levels were just above theminimum required for the TV sYstem to operate without artificial light. Inexperiments 9/79 and 12/79 no artifi9ial lighting was used'obu~ .~n.~xperiment11/79 the artificial lighting was used throughout. Subjectively, the one andt\velve hour, running_means i,n experiment 11/79 (Figure 6) are more constant than thecorresponding means for experiments 9/79 ap.d 12/79 (Figures 5 and'7). This suggeststhat light lev~ls affect the behaviour_of the herring in a way which results indiffering long-term target"strengths; Theoassociation between light levels,andtarget strengths is not understooq. ,'However, one or ~ combination of thefollowing factors could be responsible.' '
1 The herring mayadopt different ~ilt angles at different light levels, thus amore constant light level induced by the continuous use of artificial lightmight cause'a more eonptant targ~t'strength.
""' ~ • " I
2 Th~ size of the herring',s swimbladder may be affected by different light levels.I~ the wild,herring tend to live in deeper water in dayl1ght and corne to the,surf~ce at night. This m1gratiQn, whicfi might be stimul~ted by changing.light. ,., . . ... ... . . ,. .' .levels, 1nvolves a change 1n pressure and a proballe change 1n sW1mbla~der S1ze,whieh would result in a change 'in target strength. Thus a more constant lightlevel might cause a reduetion in the variation in target strength by'suppressingthe stimulus which triggers the vertical migration.
3 The distribution of the fish i~ the eage may change with varying light levels.Unfortunately it was not possible to monitor the distribution of the fish withoutusing flood lighting. Recent developments in monitoring sYstems usingstroboseopic lighting may make it possible to observe fish in the dark withoutusing general flood lighting. Experiments to investigate this Cl-pproach ar.eplanned for December, 1980.
;
The results presented in thi,s paper .indieate that.the variation' in target strength~ was smaller when artificial 'lights were used throughout the experiment. However,
,e.xperiments 9/79, 11/79 and 12/79 we~e oonsiderably different in other respects,,', with mortality affecting experiment 9/79 'and fish escapes ehanging the apparent
'target strength per kg in 'experiment 12/79. F)lrther experiments to investigatethe effects of light levels,are planned for November and December 1980.
The reverberation levels associated with the experi~ental eage should ideally below enough to be igriored, t'hat is, less than 1%" of the average energy returned fromthe fish. Untortunately, the experimental eage us~d in the herring experimentseontributed approximately 5% cf the 'energy returnedduring'1he cage integrationinterval. However, measurements on the empty eage indieated that its target strengthwas reasonably constant (!0.25 dB) over aperiod of two days. In all the ealCUlations of target strength, the",energy returned from the empty exp,erimental eagewas sUbtraeted from the energy returning from the fish before th~ target strengthof the fish was calculated. Recent improvements in, the,construction and materialsused for experimental eages sho~d reduce this problem in fut~e experiments.
7
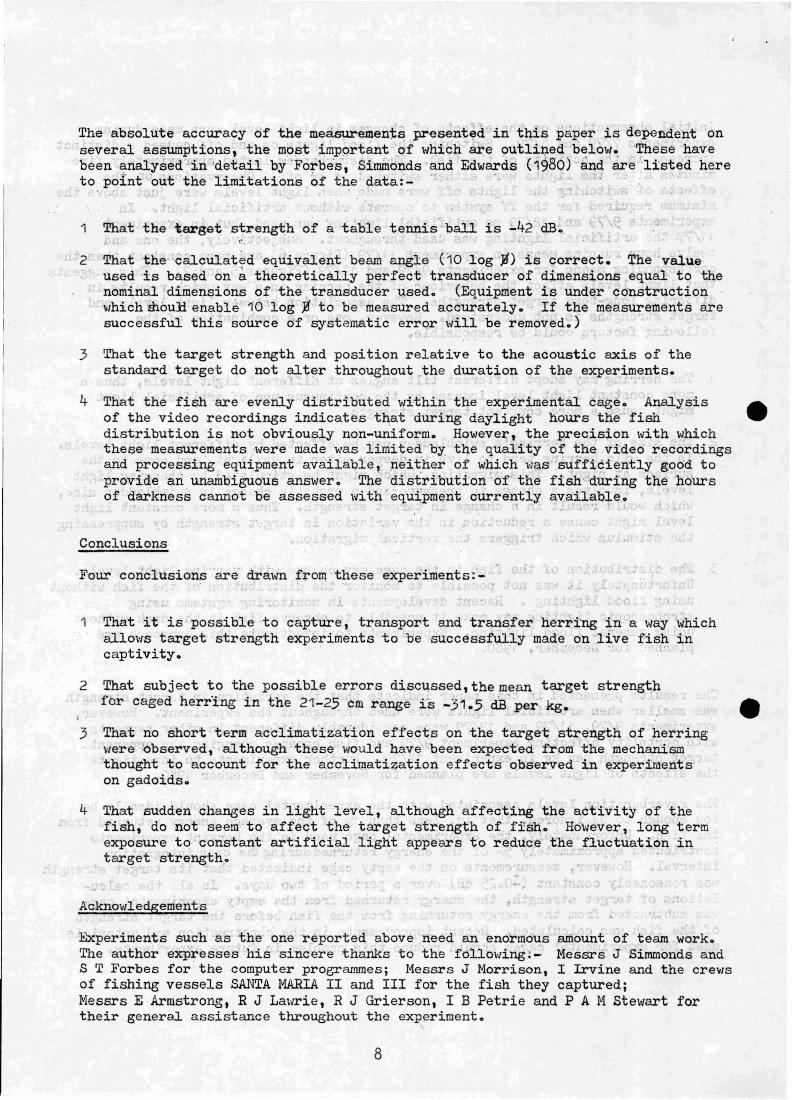
The absolute accuracy of the mea~ments,pre~nt~d' in this paper is dependent onseveral aS$Umptions, the mpst ~mp9rtant of which are outli~ed below. 'These havebeen analysed Jin 'detail by'Forbe's', Simmonds Emd Edwards C1980) and are listed hereto point out the limitations cf the data:-
1 That the target strength of a table tennis ball is ~42 dB.
2 That the calculat~d equivalent beam angle (10 10g'ß) is correct. The valueused is based on ~theoretically perfeet transducer of dimensions equal to thenominal 'dimensions of the transducer used. CEquipment i~ under construction 'whichmou~ enabl~ 10'log ~ to be'measured accurately. If the measurements aresuccessful this source df systematic error will be removed.) :
3 That the target strength and position relative to the acoustic axis of thestandard target do not alter throughout.the duration of the experiments.
4 That the f~sh are evenly distributed within the experimental cage. Analysisof the video recordings indicateß that during daylight hours the fishdistribution is not obviously non-uniform. However, the precision with whichthese measurements were made was limited by the quality of the video recordingsand processing equipment available, ~either of which was ,sufficiently good toprovide an unambiguous ,answer. The ,distriQution of' the fish' :during the hoursof darkness cannot be assessed with'equ{pment curre~tly avai~able. \
•Conclusions
Four conclusions are drawn f~om these experiments:-
1 That it is possible to capture, transport and transfer herring in a way whichallows target strength exper{ments to'be successfully made on live fish incaptivity.
2 That subject to the possible errors discussed,themean target strengthfor caged herring in the 21-25 cm range is -31.5 dB'per, kg.
3 That no short term acclimatizat10n effects on the target strength of herringwere observed, although these would have'been expected from the mechanismthought to account for the acclimatization effects observed in expe!imentson gadoids.
4 That sudden changes in light level, although affecting the activity of thefish, da not 'seem to affect the target strenith of ,ffsh~ However, lang termexposure to constant artifici.al light appears to reduce the fluctuation intarget strength.
•
Acknowledgements
Experiments' such as the one reported above need an enormous amouht of team work.The author expresses his sincere thanks to the following:-' Messrs J Simmonds andS T Forbes for'the computer programmes; Messrs J Morrison, I Irvine and the crewsof fishing vessels SANTA MARIA 11 and 111 for the fish they captured;Messrs E Armstrong, R J Lawrie, R J Grierson, I B Petrie and P A M Stewart fortheir general assistance throughout the experiment.
8

References
Dunn, \1. I.
Edwards, J. I.
Edwards, J. I.
Forbes, S. T.,Simmonds, E. J. andEdwards J. I.
1979 Depth and species dependance of the targetstrength of gadoids. Marine Laboratory WorkingPaper No 80/4.
1975 A preliminary analysis of the variations in targetstrength of multiple fish targets at various depths.Proceedings of the specialist meeting on AcousticSurveying of fish populations. Inst of Acoustics17 December 1975 mimeo.
in press A Barge for the transport and storage of livefish.
in ~re6s Progress in target strength measurement on livegadoids.
•
Goddard, G. C. andI:ielsby V. G.
Johannesson , K. A.and Losse, G. F.
Nakken, O. andOlsen, A.
1977
1977
1977
Statistical measurements of the acoustic targetstrength of live fish. Rapp. P.-v. Reun. Cons.Int. Explor. Mer 170 170-173.
Some results of abuncidnce estimations obtained inseveral UNDP/FAO resources survey projects. Rapp.P.-v o Reun. Cons. Int. Explor. Mer 170 296-318.
Target strength measurements of fish. Rapp.P.-v. Reuno Cons. Int. Explor. Mer 170 52-69.
9
':{lABLE 1 - EmDURY Ol :RE&ULTS
•
Exp,J2.' No. 01 &(J(es.nl ~.(SD) !!Total) W(maan) W{~) B&st estimat!, Period for
l1sh· (cm) (an) (k8) (sm) (ß%l\)of TS per leg which best
- estimates-calculated
1.77696 76.0714(brs)
7 11'J 22.2411' 8.52 20.9529 -31.2 9
8 oe 21.7761 2.23486 59 803 66.6119 25.9329 -30.2 33
9 80 2447875 1..6435 9..12 114.075 22.3402 -32.5 9
11 116 24~O727 2.50746 17.344 104.824 29.8175 -31.2 '100
12 250 23.192 3.0387 24092 99,,676 33.7536 -31.9 28

,"
guard cag~
monofilameni'panels
octagonale~perimenial
____ eage. 2m cfJa
1m deep
..-:-- transducer-- .
~monofilameni'~ suspension
___ reference target
--t V. camera---.;:,..s.--_.
. t V. eable
~-
I.ll.:.:..-----~-~--- sonar (abte
~....
f',/
~'1JI
• I
Experiment.al
Figure 1
Transdueerond
1----:-:-3m---i
4m
," -":\l""'"'l..-__._~-~---
... "... \-'\ \\_... r'\, ...... I .'\ ,* I \ I I ; -,/"I,t" I \ I I ' In'r-.,:' , 1'1
, ..... ' I I 'J'" .....\ . f .,-,..... ·t OI*T I • , .. ~"c
: : : -"\- 1 "l-I l- I \ l -~ ... ', I, , \ .. .. ..
A' ,,' 1._ - ... - I -.. 'a" .
. -_. • ,- - I~"'.... " .... ~"..... I • 1/" .......,
".40",'" '\ ""'.{. .......li;' ~..'.. '\ 7-----_ ---,\ .., /* '\ I ... - - - _ I \ ..,. ,,_... . I - .. ' \
, J'. '/ "--.l------v ' , '\ \ I,, I '\. , . \I • ... ' "i \- \~",.I ,...... _-; \
I \ ,-':"''',.' \." .~, ,I .--- • \
I l" _----~.. __ .....-\-_ ..... -_ .... T~ .. -I ,
I I
TI•

1km sonar and t V. (ableon sea bed
\weights
.'//
..
... ..
.... '"" .
.. '
...
. ..' ..
.. . .. .. , ..'. -• • .. "'I"'l·:-'-··... .... .. .. .....
.., ."..-- .. . ..
.. ... ~ ...
G~neral arrangemenl
.Figure 2 ...
LOCH DUICH(100m deep)
•
Portable laborarorv with electronic and T.V. equiomenl• e· /'
~.I!/;' ....
shore lin~ _ _ . IM {t'.. ..~~:~ .. '" ~~~:•. , . . ._-==-- -.:-"=:=:=- ro'l.·O\I\I ~-" - . .:...: -=- ,-..;.:::::-...:._... ~_.. ,__ a" .t. "'- -- ..._--~raff withgantry and - -::. _- ..::. - _.- • -_ _ - :... -.=-=.~-+..~. '--.2:...=-_.-::- -----hydrautic lifting equ~~e~~~: ~_-=.:: _ =-.'::-', =~- ::~~_; ~~tX-~7" - -- -- -: -..~- •
--_..-- -'- ~._~~~.~~.;;:.:::- ~~~f"-'-- -it-:~bu~ysn;~;kiiigca~te'. --- --- ..,i:~~~·:~·:':'~~;:';:'~~"::·?~/ ..,,- -. _ ... - '-- --
--- t·~'.L ---w ~-:..::d~···::~:rr, I~_" - -i r':-~", ..... l - - --
- i/- - ~ j 1- ·r-~·-Y~\.\\l -'~ -..: \:... J j - - - . - -I 'I I 1 _. - I ,r
1~'17-5m 'i ~\ -'. I J-,,/ --
rnooring wires==----_-- " { ,. - . ljraosduce \, \!
'. . ............".. '. T.V. camera
. ' . exp~rimental rig. . .. . .. .. .... -
/

•Fi gl.~re 3
t hr r Uf''ln i ng mean
t2hr running mean
Mean Value =-31.'dB/kg
meon
Experiment 07 HERRING 1979
24hr running---
II.[--32L
1--22dB!kg•ri-I
L-24
l!l;--26
.f34~
.[--.--36. "-----~----'2 (Day.).

ef 'sure 4
I
·1·..~~ ~\ ...
• \ I_... " ...
\ .. ... , -"".'II
I,• f J..t
Experimenl 08 HERRING 1979
1hr running meon
t2hr running mean
24hr running mean
234 5_____, .....' _;...-...----...a.-.-----..L---------a.,-------- ,I
-24
-22
·-26
. 34
-30
L-28
1--32
----------
Figure 5
Experiment 09 HERRING S979
..
Meon ValuQ --32.5dB/kg
,'~,,I
t ...
-f"",f
I
,. .', .....
f2hr running-mean
-24hr rt.Jnn i ng meon
I
/. t
_. 4-~---\
- 1hr ~"unn!ng meon
/-..;.22dB/kgj
;
..-24
..! •,
1-34!.~
•. 2
{-24d~/kg
!r,
Figura 6
Experimen~ 11 HERRING 1979
, 2.....9 _ .. ~),- ,I
L:--28
•It.-3G•
-- ihr' runnlng ffl&Orl
J2hr ru""'ng macn
24hr running mean
i- .!
~32
IrI-34j
r·}-36
rl38IL '__--.L1"-. ~ 3 ..l: 4_. ~.L. 5__·__L__- 6' ~DQY.!f)
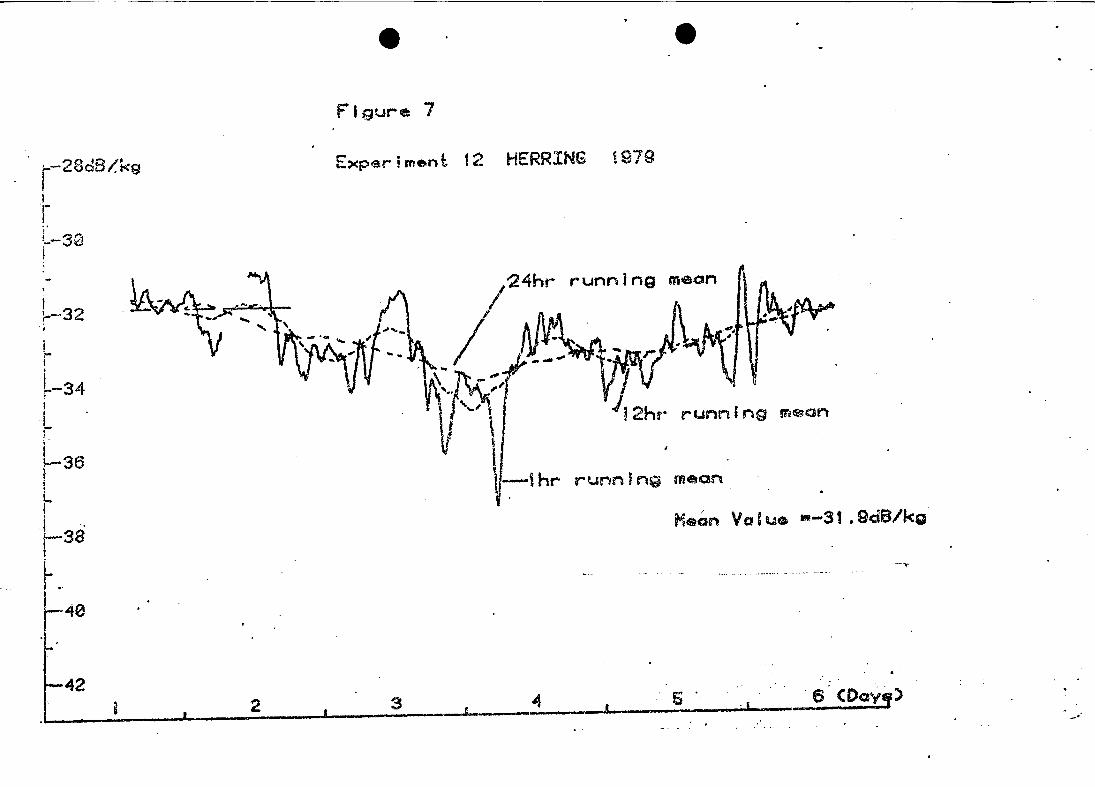
Figure 7
r-28dB/kgj
r
Experiment 12 HERRING 1979
. i•32
~ ,24hr running mean
~ I. '", ,~ .• ~ ,'" / ~
' .., t JV \ 12hr runnlng meon
'I\~1hr running mean
Heon Value --31.9dB/kg
42
I;--··32
",!<-iI
~-~34f
L
L-S6I'"
~t--38I
LI .
40
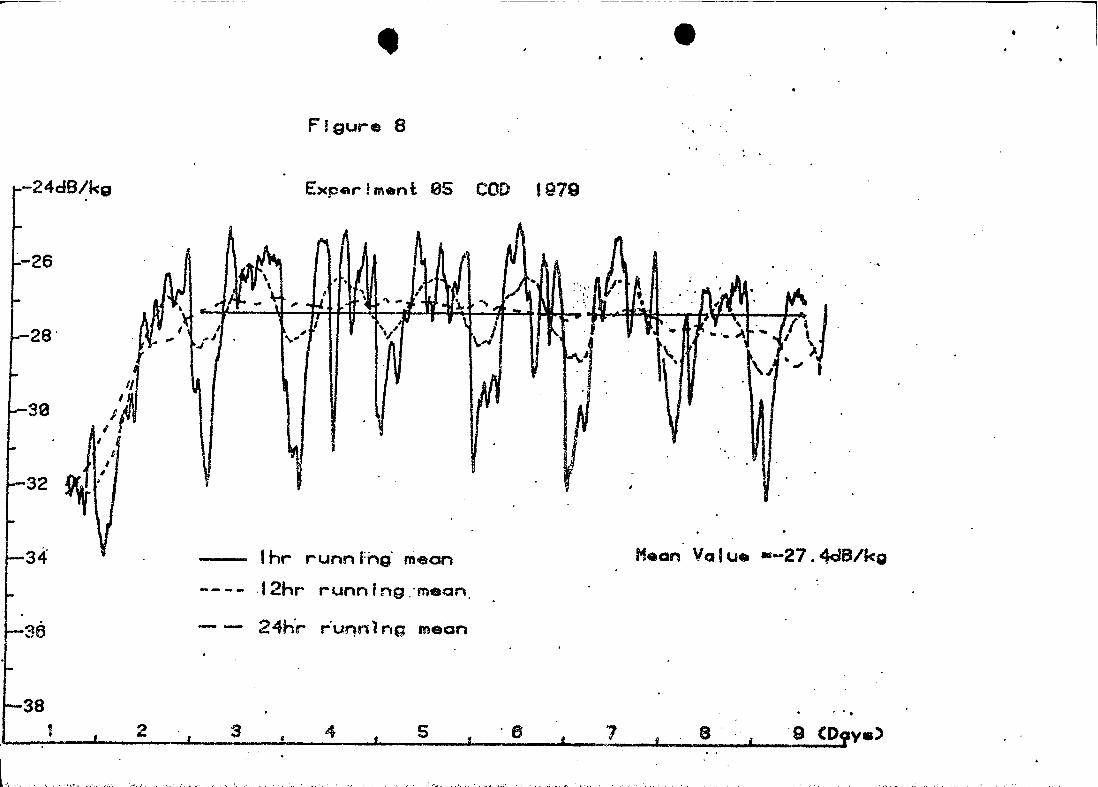
...-..--- ~~ ----~----~ ---- ~------~--~-----------------------------------,F!gure 8
-24dB/kg Exper!ment 05 COD 1919
. '.s·7L'654
1hr r unn rng' meon
---- ·t2hr .... unnlng.·mean.
- - 24hr r'u~nlng mean
1 2
-26