0dwhuldo (6, iru56& $gydqfhv 7klv electroluminescent ... · s1 phenothiazine-based bipolar...
TRANSCRIPT

S1
Phenothiazine-Based Bipolar Green-Emitters Containing
Benzimidazole Units: Synthesis, Photophysical and
Electroluminescent Properties
Govardhana Babu Bodedla,a K. R. Justin Thomas,*,a Sandeep Kumar,a Jwo-Huei
Joub and Chieh-Ju Lib
a Organic Materials Chemistry, Department of Chemistry, Indian Institute of
Technology Roorkee, Roorkee – 247 667, India.
b Department of Material Science and Engineering, National Tsing Hua University,
Hsinchu 30013, Taiwan.
Supporting Information
1 Fig. S1 Absorption spectra of 4a recorded in different solvents. S22. Fig. S2 Absorption spectra of 4b recorded in different solvents. S23. Fig. S3 Absorption spectra of 4c recorded in different solvents. S34. Fig. S4 Absorption spectra of 4d recorded in different solvents. S35. Fig. S5 Absorption spectra of the dyes recorded on thin film. S46. Fig. S6 Emission spectra of 4a recorded in different solvents. S47. Fig. S7 Emission spectra of 4c recorded in different solvents. S58. Fig. S8 Emission spectra of 4d recorded in different solvents. S59. Fig. S9 Emission spectra of the dyes recorded on thin film. S610. Table S1 Absorption data for the dyes (4a-4d) recorded in different
solvents with increasing solvent polarityS6
11. Fig. S10 Differential pulse voltammograms for the dyes (4a-4d) recorded in dichloromethane.
S7
12. Fig. S11 1H NMR spectrum of 4a recorded in CDCl3. S813. Fig. S12 1H NMR (expanded) spectrum of 4a recorded in CDCl3. S914. Fig. S13 13C NMR spectrum of 4a recorded in CDCl3. S1015. Fig. S14 1H NMR spectrum of 4b recorded in CDCl3. S1116 Fig. S15 1H NMR (expanded) spectrum of 4b recorded in CDCl3. S1217. Fig. S16 13C NMR spectrum of 4b recorded in CDCl3. S1318. Fig. S17 1H NMR spectrum of 4c recorded in CDCl3. S1419 Fig. S18 1H NMR (expanded) spectrum of 4c recorded in CDCl3. S1520. Fig. S19 13C NMR spectrum of 4c recorded in CDCl3. S16
Electronic Supplementary Material (ESI) for RSC Advances.This journal is © The Royal Society of Chemistry 2015

S2
21. Fig. S20 1H NMR spectrum of 4d recorded in CDCl3. S1722 Fig. S21 1H NMR (expanded) spectrum of 4d recorded in CDCl3. S1823. Fig. S22 13C NMR spectrum of 4d recorded in CDCl3. S19
280 325 370 415 460 5050.00
0.22
0.44
0.66
0.88
1.10
Abso
rban
ce
Wavelength (nm)
CH TOL DCM THF MeOH ACN DMF
Fig. S1 Absorption spectra of 4a recorded in different solvents.
280 325 370 415 460 5050.00
0.22
0.44
0.66
0.88
1.10
Abso
rban
ce
Wavelength (nm)
CH TOL DCM THF MeOH ACN DMF
Fig. S2 Absorption spectra of 4b recorded in different solvents.
S3
280 325 370 415 460 5050.00
0.22
0.44
0.66
0.88
1.10
Abso
rban
ce
Wavelength (nm)
CH TOL DCM THF MeOH ACN DMF
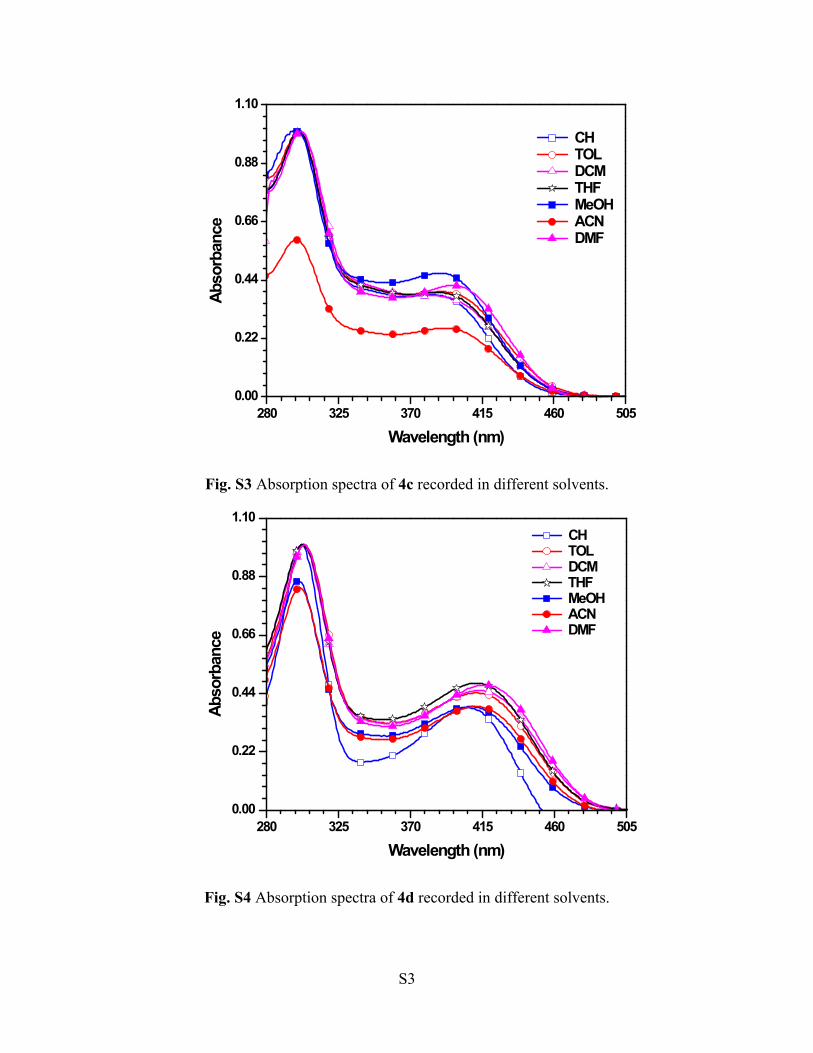
Fig. S3 Absorption spectra of 4c recorded in different solvents.
280 325 370 415 460 5050.00
0.22
0.44
0.66
0.88
1.10
Abso
rban
ce
Wavelength (nm)
CH TOL DCM THF MeOH ACN DMF
Fig. S4 Absorption spectra of 4d recorded in different solvents.

S4
280 325 370 415 460 505 5500.0
0.1
0.2
0.3
0.4
0.5
Abso
rban
ce
Wavelength (nm)
4a 4b 4c 4d
Fig. S5 Absorption spectra of the dyes recorded as thin film.
430 480 530 580 630 6800.00
0.22
0.44
0.66
0.88
1.10
Norm
alize
d Em
issi
on In
tens
ity
Wavelength (nm)
CH TOL DCM THF MeOH ACN DMF
Fig. S6 Emission spectra of 4a recorded in different solvents.

S5
430 480 530 580 630 6800.00
0.22
0.44
0.66
0.88
1.10
Norm
alize
d Em
issi
on In
tens
ity
Wavelength (nm)
CH DCM TOL THF MeOH ACN DMF
Fig. S7 Emission spectra of 4c recorded in different solvents.
430 480 530 580 630 6800.0
0.2
0.4
0.6
0.8
1.0
Norm
aliz
ed E
mis
sion
Inte
nsity
Wavelength (nm)
CH DCM TOL THF MEOH ACN DMF
Fig. S8 Emission spectra of 4d recorded in different solvents.
S6
420 470 520 570 620 670 7200.0
0.2
0.4
0.6
0.8
1.0 4a 4b 4c 4d
Norm
aliz
ed E
mis
sion
Inte
nsity
Wavelength (nm)
Fig. S9 Emission spectra of the dyes recorded as thin film.
Table S1 Absorption data for the dyes (4a-4d) recorded in different solvents with increasing
solvent polarity
Dye λabs, nm (εmax ×103 M-1 cm-1)
CH TOL DCM THF MeOH ACN DMF Filma
4a 375,300
377 (27.5),303 (80.8),
377 (28.4),300(61.0)
375 (31.6),302 (93.5)
374,299
375,300
378 (31.6),302 (90.9)
409, 290
4b 386,301
389 (19.0),303 (56.0)
392 (28.9),303 (82.3)
388 (22.9),302 (65.0)
392,300
387,300
394 (30.0),304 (58.7)
403, 303
4c 385 ,299
382 (26.7),301 (69.9),
389 (29.9),300 (75.5)
388 (23.2),300 (58.9)
388,299
392,298,
397 (23.2),301 (55.2)
405, 290
4d 406302
412 (48.3),305 (108.0)
414 (57.7),303 (126.0)
412 (59.8),303 (128.0)
407,300
411,301
417 (47.3),303 (97.7)
423, 304
a Measured for spin cast thin film.

S7
0.6 0.4 0.2 0.0 -0.2-1.6
-1.4
-1.2
-1.0
-0.8
-0.6
-0.4
-0.2
0.0
Ferrocene
Curr
ent (A
)
Potential vs Ferrocene (V)
4a 4b 4c 4d
Fig. S10 Differential pulse voltammograms for the dyes (4a-4d) recorded in dichloromethane.
S8
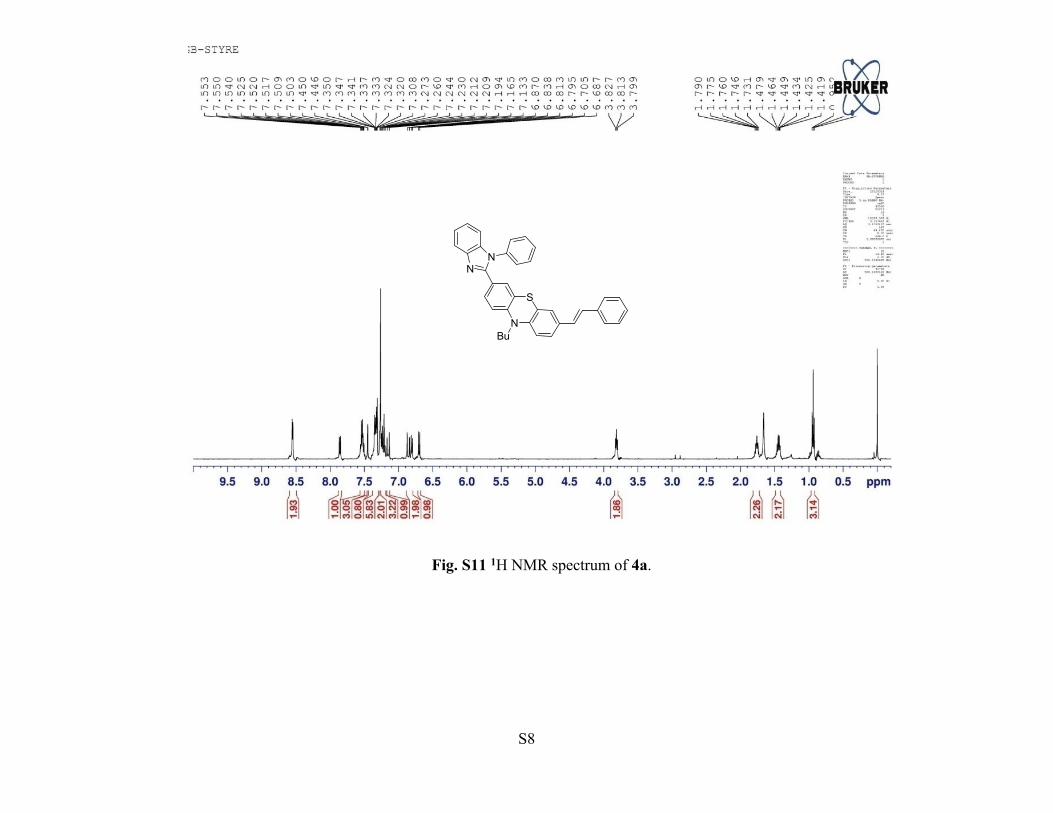
Fig. S11 1H NMR spectrum of 4a.
N
S
NN
Bu

S9
Fig. S12 1H NMR (expanded) spectrum of 4a.
N
S
NN
Bu
S10
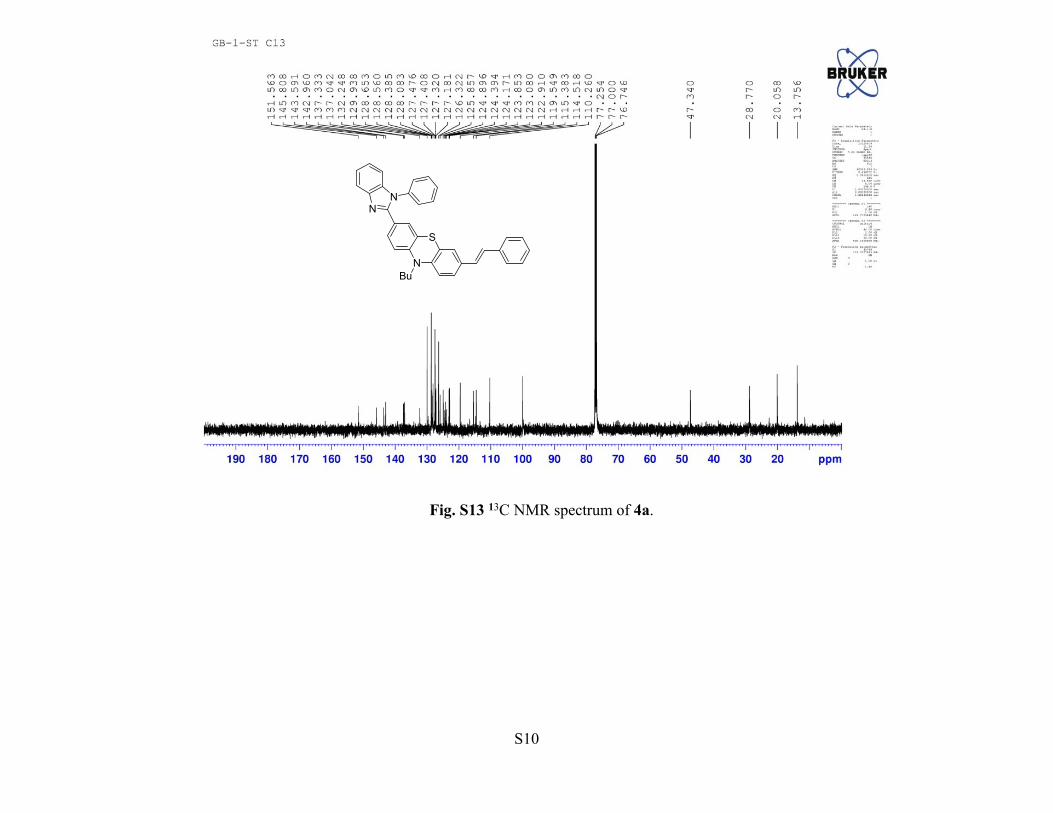
Fig. S13 13C NMR spectrum of 4a.
N
S
NN
Bu

S11
Fig. S14 1H NMR spectrum of 4b.
N
S
NN
Bu
N

S12
Fig. S15 1H NMR (expanded) spectrum of 4b.
N
S
NN
Bu
N
S13
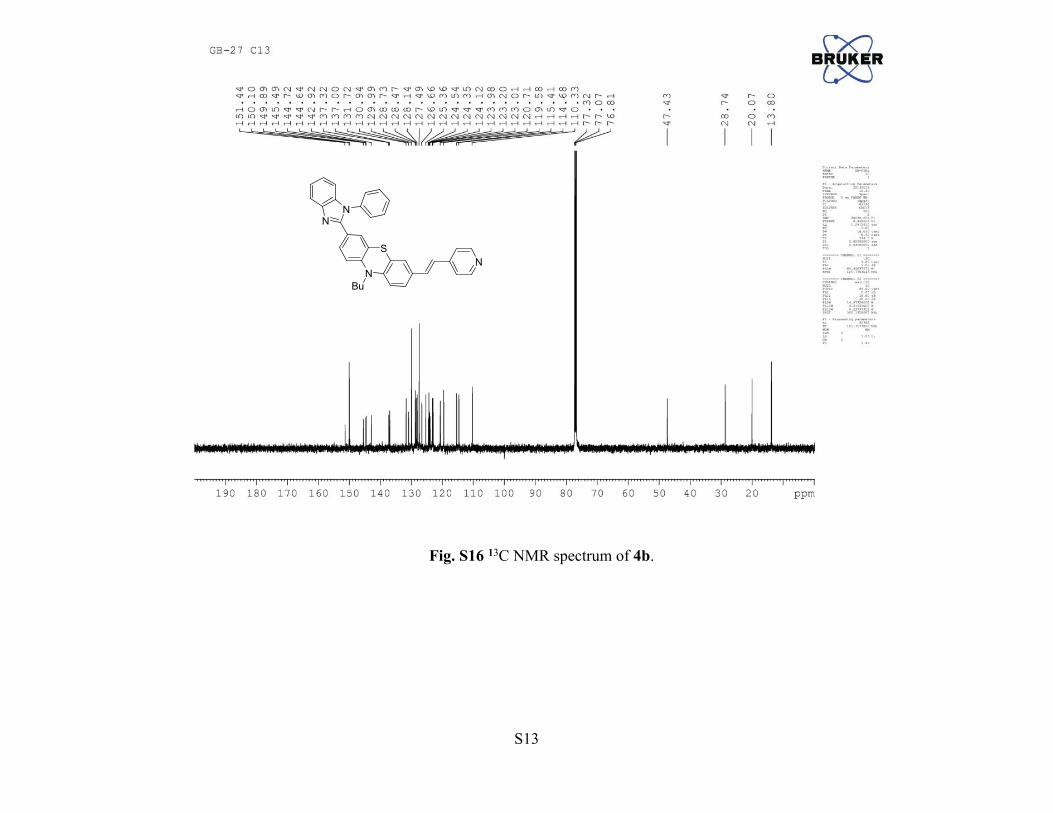
Fig. S16 13C NMR spectrum of 4b.
N
S
NN
Bu
N
S14
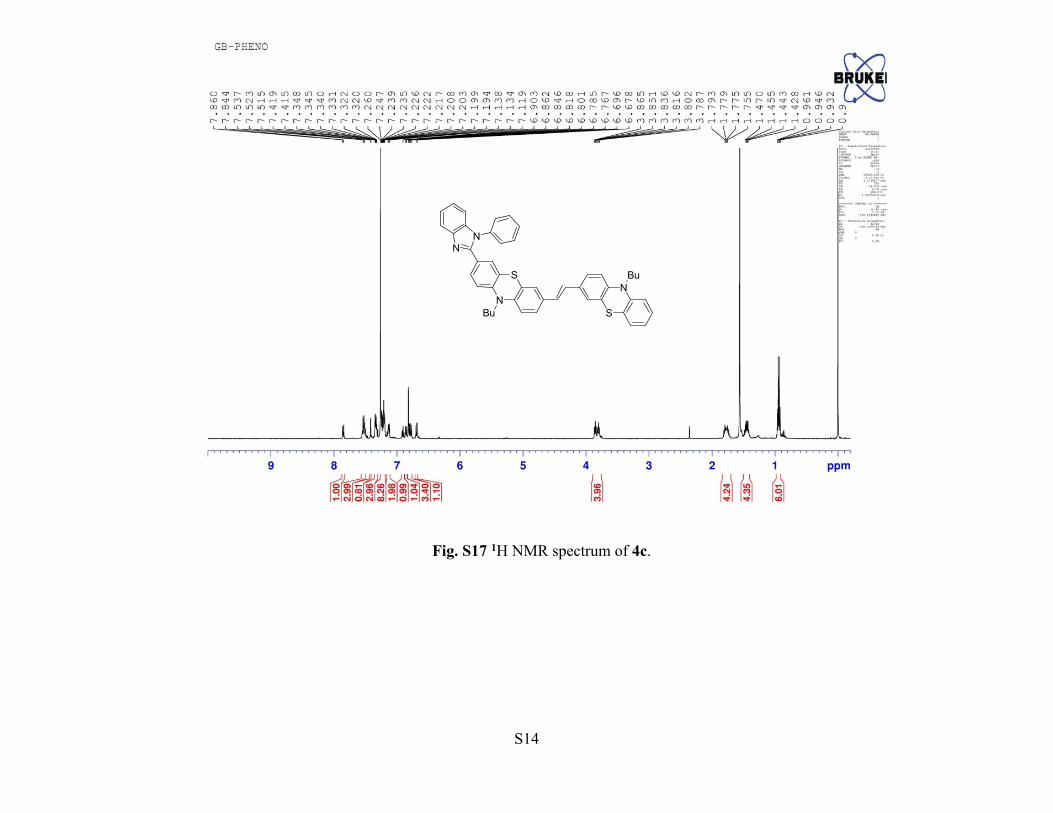
Fig. S17 1H NMR spectrum of 4c.
N
S
NN
Bu S
NBu

S15
Fig. S18 1H NMR (expanded) spectrum of 4c.
N
S
NN
Bu S
NBu
S16
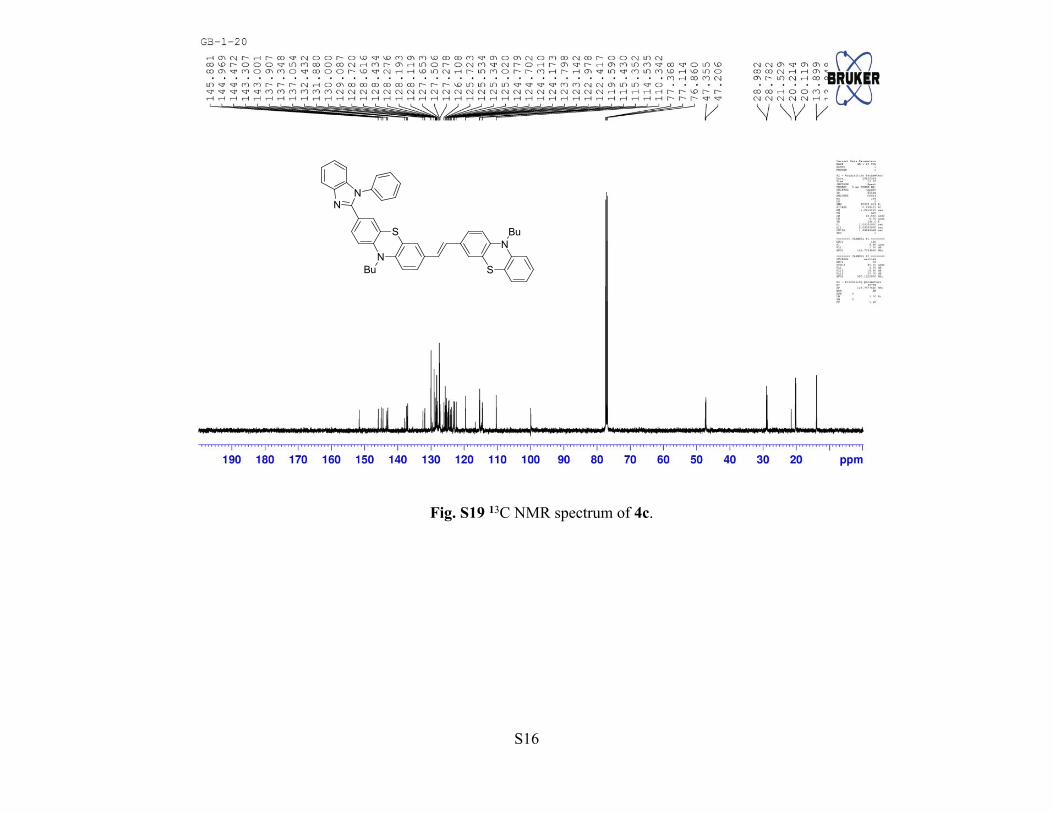
Fig. S19 13C NMR spectrum of 4c.
N
S
NN
Bu S
NBu

S17
Fig. S20 1H NMR spectrum of 4d.
N
S
Bu
N
S
Bu
N
N
N
S
Bu
N
N

S18
Fig. S21 1H NMR (expanded) spectrum of 4d.
N
S
Bu
N
S
Bu
N
N
N
S
Bu
N
N

S19
Fig. S22 13C NMR spectrum of 4d.
N
S
Bu
N
S
Bu
N
N
N
S
Bu
N
N