09 vanuatu domestic market studyfinal report october2011
DESCRIPTION
VanuatuTRANSCRIPT

Vanuatu Domestic Market
Study: The potential impact of increased tourist numbers on the
domestic market for selected fresh vegetable produce
Joshua Tio Mael
September 2011
Port Vila Municipal Market

2
Vanuatu Domestic Market Study:
The potential impact of increased tourist numbers on the domestic market for selected fresh vegetable produce
Prepared by
Joshua Tio Mael
September 2011
The depiction employed and the presentation of material in this paper do not imply the
expression of any opinion whatsoever on the part of the Food and Agricultural
Organization of the United Nations covering the legal or development status of any
country, territory, city or area or its authorities or concerning the deliberations of its
frontiers or boundaries.
The findings, interpretations and conclusions expressed in this report are those of the
author and do not necessarily represent the views of FAO.
This study was prepared as a contribution to the All ACP Agricultural Commodities Programme, with funding from the European Union.

3
Acknowledgements I would like to thank the VNSO and MAQFF for providing support to this study, in particular the
Government Statistician (Simil Johnson), FAO focal point Officer (James Wasi) at DARD, Director
of Forestry (Levo Mele), Secretary General of Shefa Province (Michel Kalorai), Vanuatu National
Tourism Office (Adela Aru). VNSO and DARD provided the facilities of their offices and seconded
their Senior Officers, Pita Toa who had collaborated in the study since its inception and Ms
Quen Tari, Market Information officer, to assist with the work on the Project. Thanks are also
extended to the many contributors to this project, in particular the five enumerators; Mania
Avock, Clarence Banaga, Dorin Tanake, Rishard Tasi, Alphy Ulvenal, and also Angela Tom’taval’
and Margaret Mael (Year 10 students from Malapoa College) who assisted by arranging
interviews, writing official letters and in conducting the Efate roadside market surveys.
Acknowledgement is also accorded to Tuifa’asisina Steve Rogers and Jamie Morrison for useful
guidance on the study and report, and to FAO and the EU All ACP Agricultural Commodities
Programme for funding the study.

4
Table of Contents Acknowledgements ....................................................................................................................................... 3
List of Abbreviations ..................................................................................................................................... 5
Executive Summary ....................................................................................................................................... 6
1. Introduction .......................................................................................................................................... 7
2. Methodology ......................................................................................................................................... 9
3. Survey Results ..................................................................................................................................... 12
3.1. Demand for fresh produce by hotels, restaurants, institutional canteens and kava bars ..... 12
3.2. Demand from restaurants ....................................................................................................... 14
3.3. Demand from institutional canteens ...................................................................................... 14
3.4. Demand from kava bars (nakamals) ....................................................................................... 16
3.5. Relative fresh produce demand from the different consumer segments .............................. 18
4. Supply of fresh produce from PVMM, Efate Ring Road markets and imports ............................... 19
4.1. Port Vila Municipal Market Survey ......................................................................................... 19
4.2. Efate Ring Road market survey ............................................................................................... 20
4.3. Other Markets ......................................................................................................................... 22
4.4. Fresh Produce Imports ............................................................................................................ 22
5. Demand from the hospitality sector as a proportion of total supply ................................................. 23
6. Implications for Policy and Recommendations .................................................................................. 24
References .................................................................................................................................................. 27
Annex 1: Conversion table for CTU to kg weights ...................................................................................... 28
5
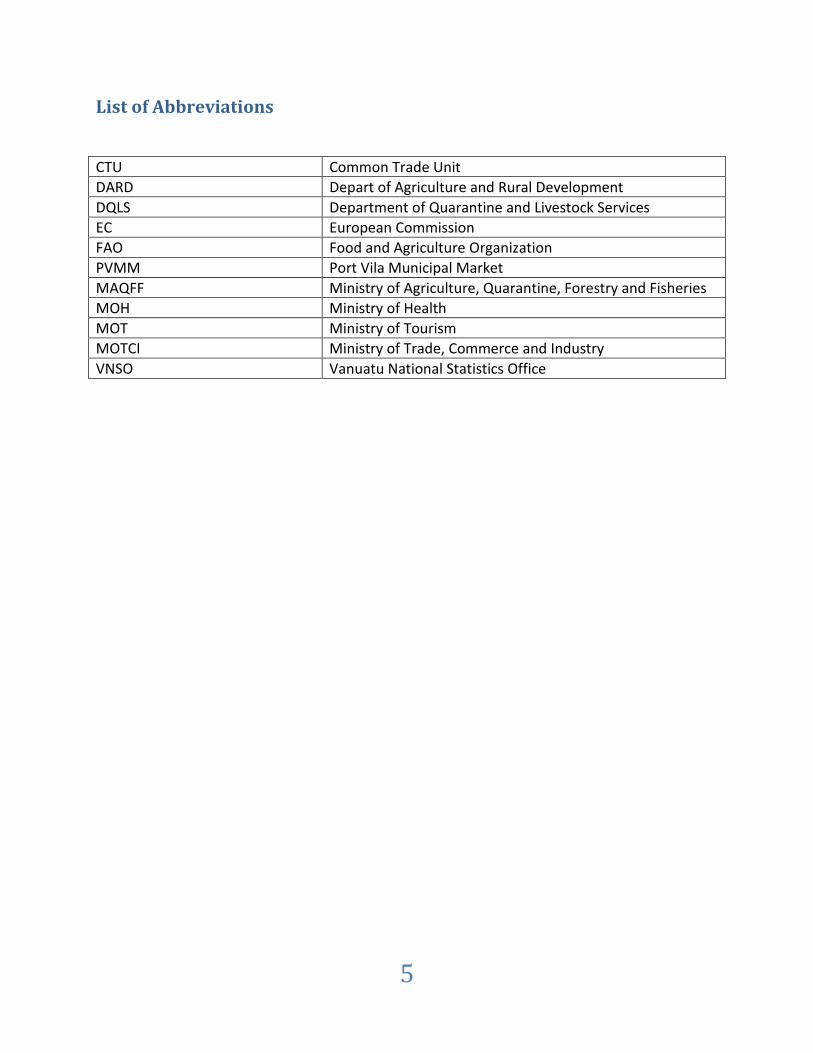
List of Abbreviations
CTU Common Trade Unit
DARD Depart of Agriculture and Rural Development
DQLS Department of Quarantine and Livestock Services
EC European Commission
FAO Food and Agriculture Organization
PVMM Port Vila Municipal Market
MAQFF Ministry of Agriculture, Quarantine, Forestry and Fisheries
MOH Ministry of Health
MOT Ministry of Tourism
MOTCI Ministry of Trade, Commerce and Industry
VNSO Vanuatu National Statistics Office
6
Executive Summary This study was undertaken with the express aim to demonstrate the value of using domestic
market data to better inform policy formation. At the time that the study commenced there
was a near complete absence of data on the fresh produce domestic market in Vanuatu. The
government authorities currently do not implement any regular market surveys and there are
few studies which are easily accessible for use by decision makers. This poses a serious
limitation for evidence-based policy making. It also constrains the analysis and interpretation
that can be achieved from a case study approach such as this one because there is no context
and baseline data to assess and validate assumptions being made.
Acknowledging the data limitations, the study has gone some way to map the supply and
demand channels for the food service sector in Port Vila and determine the potential impact of
increased tourist arrivals. The most plausible estimation is that the hospitality sector (hotels
and restaurants) currently constitute only a small proportion (estimated 2.5%) of total market
demand for fresh produce and therefore even a doubling of tourist numbers would not overall
have a significant impact on supply channels. However, the food service sector as a whole
consuming around 750 tonnes of fresh produce annually is an important market for local
produce. Interestingly, kava bars are the market segment estimated to have the largest share of
demand (35%) with institutional canteens and restaurants both having a 23% share and hotels
only 19% share.
Whilst the study has provided a preliminary snap-shot of the fresh produce market supply and
demand, particularly for the food service sector, there are a number of data collection areas
that need to be more rigorously addressed and recommendations on where further survey and
data collection should be undertaken and strengthened are made.
With growing demands on Port Vila fresh produce markets due principally to rapid urban
population growth, but also to some extent from likely increased demands from the tourist
sector on the one hand, and potential negative impacts of climate change, rising fuel costs and
high global food prices negatively impacting food supply on the other hand; the need for good
data for effective decision making has never been greater.

7
1. Introduction Too often policies are made based on perceptions rather than evidence. In Vanuatu the lack of
well researched information to assist policy making is a significant issue in the agriculture sector
and other productive sectors such as tourism. There is a growing need to obtain reliable data
on food production, marketing and home consumption to assist sound policy making and
improved coordination and linkages with the tourism sector.
A system for a quarterly market survey which is designed to collect quantity of produce (crops,
fruits, vegetables, firewood, and livestock) brought to market, quantity sold and prices has been
prepared. However, this has not to date been implemented because of insufficient resources.
The Vanuatu National Statistics Office (VNSO) recognize that formal market information is
generally lacking and consider that this is one area that has been neglected given its importance
to farmers and for policy makers.
The urban and suburban fresh produce markets in Port Vila are thought to be under increasing
demand-side pressure as a result of growing numbers of the resident population becoming
more reliant on these markets for food and also from potential demand from growing numbers
of tourism visitors. But the current lack of information and understanding of the structure and
functionality of the domestic fresh produce markets inhibits capacity to develop appropriate
policy interventions, be they directly related to the development of these markets or indirectly,
through for example, promotion to increase tourist numbers and how this might impact on
different market stakeholders.
This study is one of a series commissioned by FAO in the region to demonstrate the policy value
of domestic market data to improve evidence-based decision making. The overall aim of the
Vanuatu study is to demonstrate, through the collection of key data on fresh produce market
channels in Port Vila and its use to assess the potential implications of an increase in tourist
numbers on those channels, the value of investing in systems of domestic market data and
analysis in support of improved policy interventions.
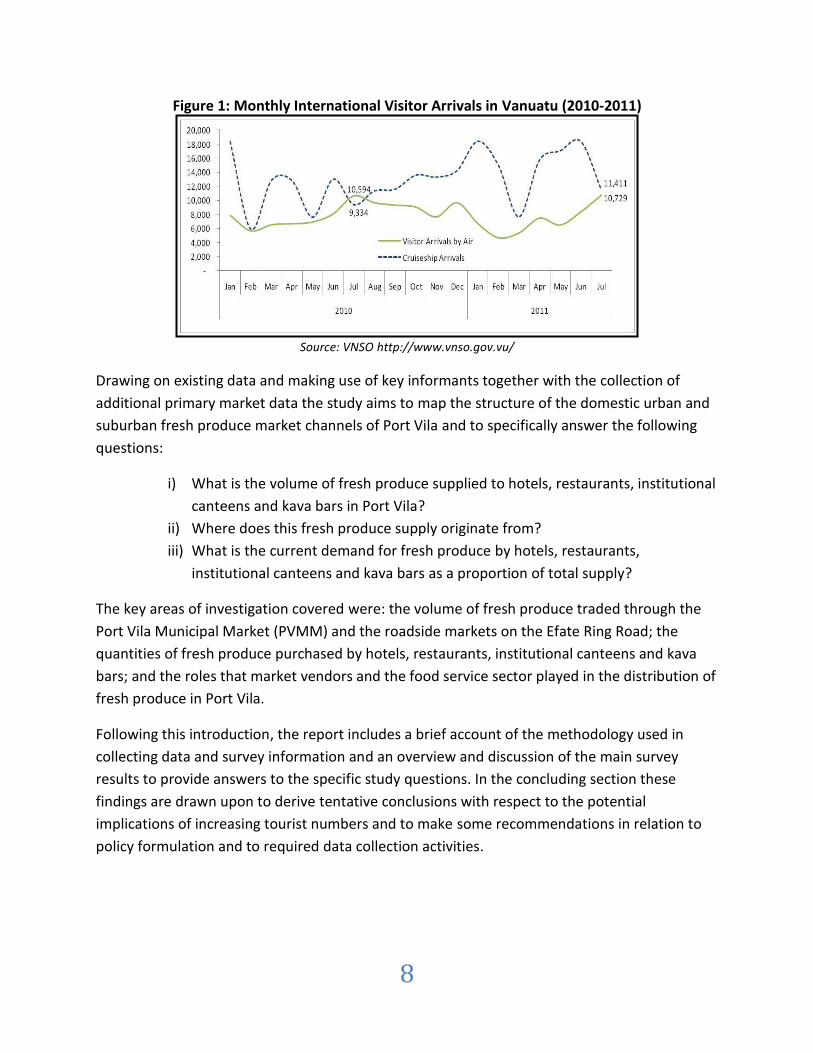
The tourism industry is a vital sector for the Vanuatu economy contributing around 20% of GDP
and is a major source of employment and foreign exchange. A government tourism policy
target is to increase total tourist annual visitors to reach 300,000 by 20151. This means an
almost doubling of current arrivals, excluding cruise ship passengers2 (Figure 1). The focus of
this study therefore is to elaborate on the potential impacts (positive and/or negative) of
increased tourist numbers on the Port Vila markets and the different stakeholders engaging in
those markets.
1 Department of Tourism, Business Plan 2010-2012.
2 Although cruise ship arrivals currently exceed other visitor arrivals this group usually stay for less than a day and
are not considered likely to consume much local food during their stay.
8
Figure 1: Monthly International Visitor Arrivals in Vanuatu (2010-2011)
Source: VNSO http://www.vnso.gov.vu/
Drawing on existing data and making use of key informants together with the collection of
additional primary market data the study aims to map the structure of the domestic urban and
suburban fresh produce market channels of Port Vila and to specifically answer the following
questions:
i) What is the volume of fresh produce supplied to hotels, restaurants, institutional
canteens and kava bars in Port Vila?
ii) Where does this fresh produce supply originate from?
iii) What is the current demand for fresh produce by hotels, restaurants,
institutional canteens and kava bars as a proportion of total supply?
The key areas of investigation covered were: the volume of fresh produce traded through the
Port Vila Municipal Market (PVMM) and the roadside markets on the Efate Ring Road; the
quantities of fresh produce purchased by hotels, restaurants, institutional canteens and kava
bars; and the roles that market vendors and the food service sector played in the distribution of
fresh produce in Port Vila.
Following this introduction, the report includes a brief account of the methodology used in
collecting data and survey information and an overview and discussion of the main survey
results to provide answers to the specific study questions. In the concluding section these
findings are drawn upon to derive tentative conclusions with respect to the potential
implications of increasing tourist numbers and to make some recommendations in relation to
policy formulation and to required data collection activities.

9
2. Methodology The study was conducted in two phases; an inception phase, conducted during
January/February 2011, sought to provisionally map out the urban and suburban fresh produce
market channels in Port Vila and identify key market segments for more detailed study during
the main data collection phase which took place during April/May 2011.
Following a desk review to identify any relevant secondary data and key government policy
pertinent to the study, interviews were carried out with a wide range of key informants.
Amongst those interviewed were representatives of government agencies, farmers, traders,
municipal market vendors, roadside market vendors and different food service groups using
fresh produce. The sub-sectors selected for further detailed study were root crops and fruit and
vegetables.
The primary data collection was through three formal surveys conducted with; (i) the food
service sector (hotels, restaurants, institutional canteens and kava bars), (ii) roadside market
vendors on the main Efate Ring Road and (iii) market vendors at the Port Vila Municipal Market.
Prior to the interviews, each of the selected hotels, restaurants, institutional canteens/kitchens
and kava bars were notified of the survey through official letters sent from the VNSO
Government Statistician. Notification was also sent to the Shefa Provincial Government to
inform the Provincial authority and give notice to all Efate ring road-side market vendors. All
the vendors and food service industry actors were notified of the survey well in advance.
Including training of enumerators and testing of questionnaires the surveys were conducted
over an 18 day period from 17 May to 3 June. Sample size as an absolute value, and as a
percentage of the population for each sub-sector is summarised below in Table 1.
Table 1: Surveyed samples as percentage of overall estimated population
Sector Estimated population Sample size % of population
Main hotels in PV 12 7 58
Main restaurants in town 48 6 12.5
Institutional canteens 8 4 50
Kava bars 53 5 9.4
Efate Ring Road markets 14 8 60
PVMM stalls 188 51 27

10
The seven hotels surveyed were the Melanesian; Hide Away Resort, Erakor Island Resort, Le
Lagoon, Iririki Resort, Chantilly’s and Le Meridian. The Sebel was not included as it was
considered to be under the same management as the Iririki Resort. The Hotels and Others
verification survey was conducted during 3 days in May, Thursday 19th, Friday 20th and Monday
23rd.
Advance notices did not help in having the managers responsible meet enumerators on a
specified day and time, so the survey was prolonged to enable interviews to take place, at a
time convenient to the Purchasing Manager but within the 3 day period. Representatives at all
the selected outlets were interviewed. Considerable effort was made to ensure that the
interview took place with the right people.
The survey of road-side markets on Efate Ring Road-Side were conducted on Friday 27th May.
All 14 market sites were visited. Only 8 out the 14 road markets had vendors selling produce at
the time and these were the sites where vendors were interviewed. Sample size as an absolute
value, and as a percentage of the population for each market site visited is summarised below
in Table 2.
Table 2: Survey samples as percentage of overall estimated population
Road Market Name Estimated population Sample size % of population
Magaliliu N/A - -
Tanoliu 2 2 100
Natapau(lelepa Is.) N/A - -
Ekipe 5 5 100
Meten N/A - -
Malafau N/A - -
Siviri N/A - -
Saama 3 3 100
Emua 4 4 100
Pauganisu 4 4 100
Epule 1 1 100
Matarisu 3 3 100
Epau 8 8 100
Eton N/A - -
N/A refers to no market activity on the day of the survey

11
Interview at the Emua road-side market.
Following a pre-test of the survey form, the survey of the PVMM was conducted on Friday 3
June. Although only one day, a Friday, was selected to conduct the survey, this was very much
representative of a week’s sell as most vendors had already been selling for a few days within
the week and would not be returning again until the following week. The total vendor
population on the day was 188 vendors. Given the size of the vendor population the original 5
enumerators used in the study were assisted by 5 VNSO officers to ensure the survey could be
completed within the allocated time.
A sample size of 70 vendors (30%) was selected to be interviewed. Each enumerator took 14
vendors for interview. Related VNSO surveys conducted on the Port Vila Municipal market
commenced at 11 am to allow time for marketers to have fully started selling produce on the
day, therefore a similar start time was used for this survey.
The interviews went well and were all completed by 5 pm on the same day. However, a setback
discovered at the count of return forms was that 19 of the forms were not completed. Whilst
Friday is always a busy day for the vendors (a key reason for selecting the day for the survey),
quite a number of vendors usually leave before close of business (COB) as they have to travel
long distance back home, particularly those that came from North Efate and Efate off- shore
Islands. Therefore out of the original sample of 70 vendors selected only 51 were interviewed.

12
In each of the market surveys the average weight of produce common trade units (CTU) were
established by first weighting five representative samples. A conversion table for CTU to
weights which is used for establishing total volumes of produce traded is included at Annex 1.
3. Survey Results Fresh food produce is supplied into Port Vila Municipal Market through weekly shipments from
other provinces, and daily transport from Efate and Efate off-shore islands of Moso, Lelepa and
Nguna. They are also supplied from peri-urban areas of Teoma, Etas, Airport area and Snake
Hill. The fresh food produce supplied into PVMM is used to feed the ever growing Port Vila
population, and to meet the increasing demand from hotels, restaurants, institutions and kava
bars.
The provinces have been a source of supply of fresh food produce such as; water (Fiji) taro,
yam, wild yam, sweet potato, cassava and island taro. Vegetable and fruits however are
supplied mainly (but not exclusively) from Efate and peri-urban area such as Teoma, Airport,
Etas, and Snake Hill. North Efate villages of Paunganisu, Saama, Epule, Emua, Taloniu, and Ekipe
and East Efate villages of Eton, Eratap, Pango and Rantapou are also key suppliers. However,
currently there is not enough information to indicate the importance of fresh produce supply
from the provinces. Nor is there sufficient information on fresh food imports through the retail
sector to add to overall picture of supply into the Port Vila market.
3.1. Demand for fresh produce by hotels, restaurants, institutional canteens and kava bars
The Melanesian Hotel buys every day from the PVMM. Iririki Island Resort buys from small
farmers once a week. Le Lagoon buys twice a week from small farmers, traders and other
markets but not the PVMM. Hide Away Resort buys 3 times a week with 50 per cent from the
PVMM, 25 per cent from Mele small farmers and the other 25 per cent from commercial
farmers (NUKRO and TEOMA farms). Le Meridian buys 3 times a week from small farmers,
traders and other markets but not PVMM. Erakor Resort buys twice a week from small farmers
and other markets but not PVMM. Chantey’s buys 3 times a week from other island provinces
and PVMM. The pattern of purchasing by the main hotels therefore varies significantly meaning
that statistics calculated from data collected from the sampled hotels may not be
representative of the total population of hotels. Caution should therefore be taken in
interpreting the average values calculated below.
The most used fresh food items by the hotels are as follows:- sweet potato, yam, pawpaw,
manioc, ripe banana, carrots, Chinese cabbage, Island cabbage, cucumber, lettuce, green
banana/plantain, passion fruit, and Fiji taro.

13
Table 3: Weekly quantities of fresh produce purchased by hotels in Port Vila
Root crops Quantity
(kg)
Fruits Quantity
(kg)
Vegetables Quantity
(kg)
Nuts Quantity
(kg)
Fiji Taro 46 Ripe
Banana
80 Ball
(head)cabbage
36.3 Dry
Coconut
36
Island Taro 17 Grapefruit 37.2 Beans 23 Green
Coconut
10
Manioc 135 Mango 0.5 Brocoli 10.4 Navara 7.5
Sweet potato 184 Orange 37.8 Capsicum
6.5
Yam 180 Passion
fruit
53 Carrot 77.5
Pawpaw 150 Chillies 0.2
Pineapple 2 Chinese
Cabbage
70.8
Melon 5 Cucumber 62.6
Limes 30 Egg plant 5.5
Garlic 19
Ginger 22
Green Onion 31.2
Island Cabbage 70
Lettuce 60
Parsley 0.9
Sugar Cane 23
Pumpkin 34
Sweet Corn 5
Tomatoes 31
Watercress 24
Subtotal 562
395.5
612.9
53.5
Sample Average (s=7) 80
57
88
7.64
Hotel population size.s 12
12
12
12
Total 963
678
1051
92
14
The data in Table 3 on fresh produce bought by hotels is disaggregated according to crop types;
root crops, fruits, vegetables and nuts. The weights of each crop product, the average weight
from each crop sub-group from the hotels surveyed (calculated from total weight divided by
number of hotels in the sample survey i.e. 7) and the estimated total weight for each crop type
demanded by all the hotels (calculated by multiplying the average weights per hotel by the total
population size n=12) are provided in the table.
The estimated total weekly demand by the Port Vila hotel sector for root crops was 963kg, for
fruits 678kg, for vegetables 1051kg and for nuts 92kg
3.2. Demand from restaurants
The six restaurants and food stalls surveyed were La Casa, Rendez Vous, L’oustalet, Harbour
View and two food stalls located by the PVMM. All the 4 restaurants including one of the food
stall bought produce from the PVMM. Harbour View, L’oustalet, La Casa and Rendez Vous all
buy once a week. The food stall buys three times a week from the PVMM. The other food stall
buys twice a week from other market outlets and traders.
Fresh food produce purchased by restaurants is very similar to that bought by hotels. Items
included, Chinese cabbage, manioc, broccoli, ripe banana, mango, cucumber, green onion,
sweet potato, garlic, green banana/plantain, island cabbage, carrot, beans, orange, capsicum,
melon, crabs, lettuce, and island taro.
Further telephone contact with owners and supervisors of the four restaurants surveyed
indicated that of all clients visiting the restaurants, tourist clients represented an estimated 10
per cent, 15 per cent, 20 per cent and 60 per cent for La Casa, Rendez Vous, Harbour view and
L’oustalet respectively. Cross checking this with their turnover shows that the higher their
turnover the higher the proportion of tourist client visitors received by the restaurants.
Results from the survey on weekly quantities of fresh produce purchased by restaurants and
calculations of estimated total use by the total restaurant population in Port Vila town (n=48
restaurants) is shown in Table 4 below. The estimated total weekly demand by the restaurant
sector for root crops was 524 kg, for fruits 757 kg, for vegetables 2022 kg and for nuts 48kg.
3.3. Demand from institutional canteens
The institutions surveyed included the main referral hospital, the USP and the Correctional
Service kitchens and the USP canteen. The Hospitality and Leisure Training centre canteen was
not surveyed although several unsuccessful attempts were made and the three secondary
schools within the town area were on holiday during the time of survey and were not included.
Four institutions, representing fifty per cent of the population, were surveyed.

15
The hospital buys fresh food produce once a week from small farmers on Efate. The
Correctional Service buys once a week mainly from a trader and gets its vegetable from the
PVMM. The USP canteen buys every working day on Monday to Friday from the PVMM whilst
its kitchen buys every day of the week from the PVMM.
Table 4: Weekly quantities of fresh produce purchased by restaurants in Port Vila
Root-Crops Quantity
(kg)
Fruits Qty
(KG)
Vegetables Qty
(kg)
Nuts Quantity
(kg)
Fiji Taro 1 Limes 7 Beans 12.8
D.
coconut
6
Island Taro 7.5 Ripe Banana 26 Brocoli 26
Manioc 35 Mango 25 Capsicum 12.5
Sweet Potato 22 Orange 12.6 Carrot 15.5
Passion fruit 7 Chillies 4
Pawpaw 7
Chinese Cabbage 51.6
Melon 10 Cucumber 32.2
Egg plant 3.5
garlic 21
Ginger 4
Green Onion 22.8
Island Cabbage 16
Lettuce 9.6
Limes 7
Parsley 3.3
Sugar Cane
Pumpkin 2
Sweet Corn 3
Tomatoes 3
Watercress 3
Subtotal: 65.5
94.6 252.8 6
Sample Average (s=6) 11
16 42 1
Restaurant population size 48
48 48 48
Total 524
757 2022 48

16
Table 5: Weekly quantities of fresh produce purchased by canteens in Port Vila
Root-crops Qty(Kg) Fruits QTY(KG) Vegetables Qty(KG) Nuts Qty(Kg)
Fiji Taro 164
Orange 24 Pumpkin 360 D. coconut 12
Is. Taro 117
Pawpaw 58 Is. Cabbage 184
Manioc 117
Melon 40 Tomato 40
S.Potato 117
R.Banana 10 C.cabbage 39
Yam 90
Passion F 10 Cucumber 31
G.Banana 60 Lettuce 31
Beans 28.4
B.Cabbage 22
S.Corn 20
Capsicum 16
E.plant 10
Watercress 10
Carrot 9
G.Onion 7.2
garlic 3
Ginger 2
Subtotal 605
202
812.6
12
Sample Average (s=4) 151
51
203
3
Population size 8
8
8
8
Total 1210
404
1625
24
Results from the survey on weekly quantities of fresh produce purchased by institutional
canteens and calculations of estimated total use by the total canteen population in Port Vila
(n=8 canteens) is shown in Table 5 above. The estimated total weekly demand by the
institutional canteens for root crops was 1210 kg, for fruits 404 kg, for vegetables 1625 kg and
for nuts 24kg.Givern the differences in the relative size of the canteens and their likely
purchasing pattern, these estimates are indicative.
3.4. Demand from kava bars (nakamals)
Nine per cent of the main kava bars in town were surveyed. These were Kalaxy, Chief’s
Nakamal, Green Light nakamal, Renauld nakamal, and Last Flight kava bar. Kalaxy kava bar buys
fresh food produce 5 times in a week from the Fresh Water produce market and not the
PVMM. Chief’s Nakamal buys fresh food items 5 times a week from the PVMM. Green Light

17
nakamal buys 6 times a week, sixty (60) per cent of time from PVMM and forty (40) per cent
from the other markets (Fresh water market). Renauld buys once a week from the PVMM. Last
Flight buys 6 times a week, ninety (90) per cent of time from PVMM and 10 per cent from the
other markets (Fresh Water market).
Fresh food items sold at kava bars included dry coconut meat, sugarcane, navara (the bulb of a
sprouting coconut), sweet potato, island taro, manioc, island cabbage, yam, pawpaw, and Fiji
taro.
Table 6: Weekly quantities of fresh produce purchased by kava bars in Port Vila
Root-Crops Qty (Kg) Fruits Qty (Kg) Vegetables Qty (KG) Nuts Qty(Kg)
S.Potato 76 G.Banana 36 Egg Plant 36 D.Coconut 36
Is.Taro 45.5 R.Banana 17 Sugarcane 34.5 Navara 4.5
Manioc 31 Pawpaw 15.3 Cucumber 32
Yam 27 Passion F 5 Is.Cabbage 30
Fj Taro 9 Mango 2.5 Ball Cab. 8.8
Orange 1.8 C.Cab 7.2
Naus 1.2 G.Onion 7.2
Namambe 0.6 Beans 7.2
Capsicum 3.5
Ginger 3
Carrot 1.4
Garlic 1
Pumpkin Top 0.8
Subtotal 188.5
79.4
172.6
40.5
Sample Average (s=5) 37.7
15.9
34.5
8.1
Population size 53
53
53
53
Total 1998
842
1830
429
Results from the survey on weekly quantities of fresh produce purchased by kava bars and
calculations of estimated total use by the total kava bar population in Port Vila ( n=53 bars) is
shown in Table 6 above. The estimated total weekly demand by the kava bar sector for root
crops was 1998 kg, for fruits 842 kg, for vegetables 1830 kg and for nuts 429kg. However a

18
963
524
1210
1998
0
500
1000
1500
2000
2500
Hotels Restaurants Institutions Kava Bars
kg
Figure 3: Share of weekly demand for root crops
concern in these estimations is that not all kava bars are believed to use fresh produce and
therefore the estimation of total use based on the population of 53 may be inflated.
3.5. Relative fresh produce demand from the different consumer segments
The relative share of total fresh produce demand (14497kg) from the hotel and other outlets is
depicted in Figure 2. The kava bar segment with an overall estimated weekly demand of just
over 5000kg of fresh produce had the largest share (35%) followed by restaurants (3,352kg) and
institutional canteens (3,263kg) both representing about a 23% share and hotels lowest with
about a 19% share (2,784kg).
The relative shares in weekly demand for the four fresh produce sub-groups; root crops (total =
4695kg), fruits (total = 1968kg),
vegetables (total = 2118kg) and nuts (total = 1670kg) is shown in Figures 3 to 6. The kava bar
segment had the largest demand in all of the product sub-groups except for vegetables where
Hotels 19%
Restaurants 23%
Institutions 23%
Kava Bars 35%
Figure 2: Share of total fresh produce demand
678 757
404
842
0
200
400
600
800
1000
Hotels Restaurants Institutions Kava Bars
kg
Figure 4: Share of weekly demand for fruits

19
1051
2022
1625 1830
0
500
1000
1500
2000
2500
Hotels Restaurants Institutions Kava Bars
kg
Figure 5: Share of weekly demand for vegetables
the restaurant sector had the highest demand. But the kava bar estimated must be treated with
some caution as mentioned above.
Restaurants have a strong demand for vegetables and fruit, but the lowest demand for root
crops. The largest demand for root crop was from kava bars and institutional canteens. Hotels
followed restaurants in their demand for local fresh fruits, but had a relatively low share of the
demand in the other product sub-groups. The institutional canteens had the lowest share in
demand for fresh fruits and nuts.
4. Supply of fresh produce from PVMM, Efate Ring Road markets and imports
4.1. Port Vila Municipal Market Survey
The PVMM survey was conducted between 11 am and 5pm on Friday 3 May. A sample size of
51 vendors out of a total population of 188 was interviewed for the survey. The PVMM vendors
in the previous week operated at the market between 1and 6 days a week from Monday to
Saturday but not Sunday. Only 9 % (5 vendors) from the 51 surveyed operated from Monday to
Saturday. Forty three percent of vendors originated from North Efate, thirty one percent from
areas just outside Port Vila, sixteen percent from Efate off-shore islands and ten percent from
East Efate. Around 90% of vendors were farm producers selling their own produce and only
10% were traders.
The types of fresh food produce sold at the PVMM included root crops, vegetables, fruits, nuts,
flowers, plants, herbs, spices and other leafy plants. The data collected on the four fresh
product sub-groups is shown below in Table 7.
The estimated total quantities of produce brought to the market are 5,788kg of root crops,
9,909kg of fruits, 6841kg of vegetables and 11383kg nuts (which comprises largely coconuts).
92 48
24
429
0
100
200
300
400
500
Hotels Restaurants Institutions Kava Bars
kg
Figure 6: Share of weekly demand for nuts

20
Thus the total estimated volume of fresh produce available on the day of the survey was 33.92
tonnes.
Maniok (cassava) and sweet potatoes constituted the largest share of root crops available,
whilst citrus products (grapefruit, mandarin and orange) held the largest share in fruits. Island
cabbage, Chinese cabbage, cucumber, green bean and onion held the largest share for
vegetables. Coconut (dry and green) was the most important in the nut category. Navara was
the next most significant nut available.
Table 7: Quantity of fresh produce brought to the PVMM on the survey day
Root-Crops Qy(KG) Fruits Qty(KG) Vegetables Qty(Kg) Nuts Qty(Kg)
Manioc 684 Grape fruit 851.6 Island Cabbage 760 Dry Coconut 2,574
Sweet potato 639 Naus 354 Chinese Cabbage 357.6 Green coconut 478.7
Fiji Taro 135 Mandarin 303.9 Cucumber 307.2 Navara 30
Island taro 70 Orange 203.8 Beans 118.4 Nangae 3
Yam 42 Ripe banana 157 Green Onion 73.2 Navele 2
Pineapple 112 Lettuce 64
Pawpaw 104.7 Coconut oil 58.5
Limes 94.5 Brocoli 26
Korosol 89.7 Carrots 21
Raspberry 15 Water cress 20
Mango 5 Snake beans 13
G. Banana 397 Sutsut fruit 9
Sutsut top 8.8
Pumpkin top 8
ball cabbage 5.5
Sweet corn 5
Chilly 0.4
Ginger 0.3
Subtotal 1570
2688.2
1855.9
3,088
Sample Average (s=53) 30.9
52.7
36.4
60.5
Population size 188
188
188
188
Total 5787
9909
6841
11383
4.2. Efate Ring Road market survey
Sixty percent of the Efate Ring Road markets were surveyed on Friday 27 May 2011. The 8 road-
side markets operating were Tanoliu, Ekipe, Emua, Matarisu, Paunganisu, Epau, Epule, and

21
Saama. Twenty-nine (97 per cent) vendors sold produce intermittently, either once, twice, 3
times a week or each day except Sunday. Only 1 vendor (3%) sold produce every day of the
week including Sunday. This particular vendor operated from Matarisu road-side market. All the
vendors at Epau, Epule, Ekipe, and Saama market sites sell one time a week except one had no
records of number of days she operated the market in the last week. Paungangisu vendors sell
6 times a week. Tanoliu vendors sell two times a week. One vendor at Matarisu sells 7 times a
week, another sells two times a week and another sells one time a week. At Emua, two vendors
sell two times a week, one sells three times a week and another sells 6 times a week.
Out of the 30 vendors interviewed, 28 (94 per cent) were grower-vendors. The 2 (6%)
exceptions operated as traders who buy produce from farmers and on-sell at the road-side
markets. They originated from Paunangisu and Epau road-side markets. The produce available
for sale at the road-side markets and weights are shown in table 8 below.
Table 8: Quantity of fresh produce brought to the road-side markets on the day of the survey
Root-Crops Qty(Kg) Fruits Qty(Kg) Vegetables Qty(Kg) Nuts Qty(kg)
Fiji Taro 8 Mandarin 56.5 Is.Cab 86 D.Coconut 198
Manioc 135 Grapefruit 126 C.Cabb 31.2 G.Coconut 77
Is.Taro 14 Orange 95.8 Sugarcane 27.6 Navara 28.7
R.Banana 59 Beans 12.8 Navele 3.2
G.Banana 114 Cucumber 5.6 R. Peanut 0.5
Naus 37.8 Parsley 0.1 Nagae 0.5
Kastaple 3
pawpaw 15.3
Korosol 5.2
Subtotal 157
512.6
163.3
307.9
Sample Average 19.6
64.1
20.4
38.5
Population size (s=8) 14
14
14
14
Total 275
897
286
539
The estimated total quantities of produce brought to the market are 275 kg of root crops, 897
kg of fruits, 286 kg of vegetables and 593 kg nuts (which comprises largely dry coconuts). Thus
the total estimated volume of fresh produce available on the day of the survey was 1,997 kg, a
little less than 2 tonnes . Clearly at this time the Efate Ring Road markets represent a very small
supply outlet for fresh produce compared to the PVMM which had available around 34 tonnes

22
on the Friday the survey was conducted which is some 17 times greater than that available
from all the roadside markets combined.
4.3. Other Markets
Marobe Livestock market represents another important supply outlet for fresh produce.
Produce is brought into the Marobe livestock market from Sanma, Penema, Malapma and
Shefa provinces. Some records are available for the period 2010 that imply that the quantity of
fresh produce supplied through the Marobe market was quite substantial. It is estimated that
the volume of produce supplied through Marobe and other markets (e.g. Fresh Water market)
maybe as high as 50% of that supplied through the PVMM and Efate Ring Road markets
combined.
4.4. Fresh Produce Imports
The main types of fresh produce imported are; root & tuber crops (cassava, potato), fruits
(including grapefruit, lemon, mandarin, mango, oranges, pineapple, raspberry, banana, and
melons), vegetables (including beans, head lettuce, potatoes, carrots, cucumbers, tomatoes,
onions, sweet corn and garlic) and a small quantity of nuts (including chestnuts, cashew,
pistachio and walnut). The average weekly fresh produce imports during May 2011 are shown
in Figure 7.
Source: VNSO
Total average weekly imports of fresh produce reached almost 28 tonnes with vegetables
holding the largest share at 15.6 tonnes, followed by almost 9 tonnes of roots and tubers, 2.8
tonnes of fruits and 0.5 tonnes of nuts.
8997
2781
15649
530
0
2000
4000
6000
8000
10000
12000
14000
16000
18000
Root & Tubers Fruits Vegetables Nuts
kg
Figure 7: Fresh produce average weekly imports May 2011

23
5. Demand from the hospitality sector as a proportion of total supply Acknowledging the limitations and probably inaccuracies in the calculation of demand and
supply quantities on a weekly basis, an attempt is made in this section to estimate the
proportion of supply (domestic and imported) that is purchased by the hospitality sector (Table
9). To illustrate the difficulty in determining how to estimate supply on the basis of data
collected from market sellers who often participate intermittently (i.e not on a regular daily
basis), two scenarios are developed.
Table 9: Estimations of proportion of supply that is purchased by the hospitality sector
Hospitality sector weekly demand (kg)
Root crops Fruits Vegetables Nuts Total
Hotels 963 678 1051 92 2784
Restaurants 524 757 2022 48 3351
Canteens 1210 404 1625 24 3263
Kava bars 1998 842 1830 429 5099
Total demand 4695 2681 6528 593 14497
Scenario 1: Supply (kg) assuming data from day of survey represents weekly value
PVMM 5787 9909 6841 11383
Efate roadside 275 897 286 539
Other outlets (plus 50%) 3031 5403 3563.5 5961
Imports 8897 2781 15649 530
Total supply 17990 18990 26339.5 18413 81732.5
Hospitality % share of total supply 26% 14% 25% 3% 18%
Scenario 2: Supply (kg) assuming weekly values = X * day of survey data, where X = 4
PVMM 23148 39636 27364 45532
Efate roadside 1100 3588 1144 2156
Other outlets(plus 50%) 12124 21612 14254 23844
Imports 8897 2781 15649 530
Total supply 45269 67616 58411 72062 243359
Hospitality % share of total supply 10% 4% 11% 1% 6%
In Scenario 1, supply is calculated on the basis that the earlier presented market data values in
this report represent a weekly supply3 (scenario 1, Table 9). In that case, the demand from
hospitality as a proportion of supply is 18%, but with hospitality sector demand for root crops
and vegetables working out at around 25% this seems very high and therefore is considered
unlikely. Indeed, if it is correct then a significant increase in tourist numbers could well prove
problematic for an adequate domestic supply response to meet increased demand.
3 Data at PVMM and Efate Ring Road markets was collected on a single Friday in the month of May

24
In the second calculation scenario, total supply is calculated by multiplying the survey results
for PVMM and Efate by a factor of 4 under the assumption that the data collected equated to
sales on the Fridayand Friday sales are assumed to be disproportionally higher than the other 5
days of the week on which sales could take place. In this case the proportion of supply
demanded by the hospitality sector is 6%, with roots and vegetables at about 10% and nuts at a
more negligible 1%.
Clearly, the calculations are sensitive to how many times daily supply is multiplied, but the
latter scenario (X=4) seems much more realistic. For comparison, in a recent fresh produce
market study conducted in Port Moresby4, calculations estimated that weekly per capita
consumption of fresh produce would be approximately 5.4kg and this figure is close to what
could be estimated by dividing the weekly supply of 243,359 kg by the Port Vila estimated
population of 47,850 to give a per capita consumption of approximately 5.1kg. Clearly, further
research is required in order to determine the quantities of sales in the different market
channels and how these quantities might change for different product groups during the year.
An interesting finding from these surveys is the relatively high proportion of demand for fresh
produce from the kava bar sector. This sector does indeed constitute an important market
segment for the local producers to trade with. However, kava bars are not very much
frequented by tourists, therefore any impacts of increased tourist numbers would most likely
be registered through the restaurants and hotel sector demand which under scenario two
calculations represents only 2.5% of the estimated total supply. Therefore even a doubling of
tourist numbers from the current level would likely not impact significantly total produce
supply and availability in Port Vila. Furthermore, a significant proportion of tourist arrivals are
short-term cruise ships passengers who likely do not consume much local produce during their
visits.
However, seasonality is a distinct feature of the tourism industry – with peaks reflecting the
Australia/NZ winter period (especially school holidays) and summer holiday/ Christmas period
and seasonality is also a feature of fresh produce supply. Therefore a more detailed comparison
of supply and demand patterns for specific crops is needed to ensure maximum supply can be
catered from domestic production.
6. Implications for Policy and Recommendations At the time that this study commenced there was a near complete absence of data on the fresh
produce domestic market in Vanuatu. The government authorities currently do not implement
any regular market surveys and there are few studies which are easily accessible for use by
4 Grant Vinning 2008 Feeding Port Moresby Study

25
decision makers. This poses a serious limitation for evidence-based policy making. It also
constrains the analysis and interpretation that can be achieved from a case study approach
such as this one because there is no context and baseline data to assess and validate
assumptions being made.
Time and resource constraints available for implementing this study have resulted in a number
of areas of weakness which in turn has made drawing firm conclusions and recommendations
from the data problematic.
Whilst the study has provided a preliminary snap-shot of the fresh produce market supply and
demand, particularly for the food service sector, there are a number of data collection areas
that need to be more rigorously addressed. Some of the specific areas where further survey
and data collection should be undertaken and strengthened include:
Collection of data for a full weekly period from the main market outlets to better
estimate daily supply and sales and ascertain how representative a Friday sample day
might be.
A more extensive survey covering also the other markets and supply outlets in Port Vila.
Data collection spread over the calendar year to better account for seasonal supply and
demand trends.
A more representative sample survey of sectors such as kava bars and restaurants to
better understand their demand and purchasing practices.
A more comprehensive survey of hotels because of the apparent wide variation
between hotels on their demand and purchasing practices.
A better appreciation of the supply and purchase of imported foods to identify
opportunities for domestic substitution.
Inclusion of price (and eventually quality) data to see how this impacts demand and
supply.
A clear recommendation for policy is to instigate the implementation of systematic domestic
market data collection led by the VNSO and supported by MAQFF. Gaining a better
understanding of the different market segment demands and the potential to meet these
through domestic supply on a year-round basis is critical for policy and strategic planning in the
agriculture sector, and also for ensuring positive linkages and synergies between the agriculture
and tourism sectors.
With growing demands on Port Vila fresh produce markets due principally to rapid urban
population growth, but also to some extent from likely increased demands from the tourist
sector on the one hand, and potential negative impacts of climate change, rising fuel costs and

26
high global food prices negatively impacting food supply on the other hand; the need for good
data for effective decision making has never been greater.

27
References Government of the Republic of Vanuatu. 2010., Ministry of Agriculture, Livestock and
Quarantine, Forestry and Fisheries, Corporate Plan 2011-2015, Port Vila, Government of the
Republic of Vanuatu, Port Vila.
Government of the Republic of Vanuatu. 2009., Ministries of Trade, Industry and Tourism and
Ni-Vanuatu Business and Cooperatives, Corporate Plan 2009-2017, Government of the
Republic of Vanuatu, Port Vila.
Government of the Republic of Vanuatu 2008. Ministry of Finance and Economic Management,
National Statistics Office, Census of Agriculture 2007-Vanuatu.Instant Colour Press, Australia.
Government of the Republic of Vanuatu 2009. Ministry of the Prime Minister, Department of
Strategic Policy, Planning and Aid Coordination, Planning Long and Acting Short. Government of
Vanuatu, Port Vila.
Vanuatu National Statistic Office( 2010). Oversea Trade, December 2010, Government of
Vanuatu, Port Vila.
Vinning G, 2010. Feeding Port Moresby Study. Fresh Produce Development Agency, Port
Moresby, PNG.

28
Annex 1: Conversion table for CTU to kg weights 1 Basket Fiji taro=9kg 1bundle cabbage=1.1kg
1 piece Fiji taro=1kg 1bundle Chinese Cabbage=1.2kg
1bundle broccoli=1.3kg 1plastic carrot=5kg
1basket Island taro=7 kg 1bundle bean=0.8kg
1 basket manioc=9kg 1bundle chillies=0.2kg
1 small heap manioc=4kg 1 piece cucumber=0.8,1plastic cucumber=1.6kg
1 Basket yam=12kg 1 unit egg plant=0.5kg
1 piece Capsicum=0.5kg 1bundle lettuce=2kg
1 bundle carrot=0.7kg 1 plastic lettuce=0.8kg
1Bundle garlic=1kg 1bdl watercress=1kg
1Bundle Ginger=1kg 1plastic parsley=10 bundles
1 Plastic lime=1kg 10 bundle parsley=1kg,1 bundle=0.1kg
1unit pumpkin=2kg 1 piece Grapefruit=1.2kg
1 piece tomato=0.2kg 1fruit mango=0.5kg
1bdl Island Cabbage=2kg 1 unit onion=0.1kg
1 Bag tomato=1kg 1 basket mango=10kg
1 ring ripe banana=1kg 1 bundle green onion=1.2
1 whole ripe banana=6kg 1 large bag island taro=20kg
1 plastic passion fruit=1kg 1 ball cabbage=1.1kg
1piece pawpaw=1kg 1 piece capsicum=0.5kg
1 bag cucumber=10kg 1 bundle carrot=0.7kg
1 carton Chicken=12kg 1 piece orange=0.6kg
1 basket sweet potato=9kg 1 Unit pawpaw=0.9kg
small bundle sweet potato=4kg 1 carton carrot=20kg
1 bunch banana=6kg 1piece yam=3kg
1bundle yam=6kg