0802china property weekly digest
TRANSCRIPT

ed-JS / sa- AH
Lower sales as expected
Various Tier II cities, including Wuhan, Changsha,
Xi’an etc., attract talent by offering residency and
subsidies, and these policies would support
housing demand in these cities in the long run Last week (24-30 July), GFA sold in 36 cities fell by
2% w-o-w. GFA sold in Tier I/II/III cities changed by
23%/-7%/-3% w-o-w. In July 2017, GFA sold in 36
cities dropped 20.6% y-o-y and 11.6% m-o-m. CRIC
estimates that sales recorded by major listed
developers would drop by c.20% m-o-m in July
compared with 20% m-o-m increase in June ASP of key cities recovered by 4.2% w-o-w, with Tier
I/II/III cities’ ASP changing by 3%/-2%/7% Inventory level of key cities remained at 43 weeks; sell-
through rate of newly launched projects in Tier I & II
cities improved to 86%
Last week, COGO (81 HK) and Shimao (813 HK)
recorded highest growth in southbound
shareholding while China SCE (832 HK) and
Evergrande (3333 HK) saw the largest declines in
southbound shareholding
HSI: 27,540 ANALYST Trista QIN +852 2863 8820 [email protected] Carol WU +852 2863 8841 [email protected] Danielle Wang, CFA +852 2820 4915 [email protected] Ken HE CFA, +86 21 6888 3375 [email protected]
Weekly sales performance of major cities (Jul 24 – Jul 30)
w-o-wYT D v s
2016YTD v s
2015
Avg weekly GFA sold ↓ 2.3% ↓ 15.1% ↑ 0.6%
ASP ↑ 4.2% ↑ 7.6% ↑ 18.0%
Inventory (no. of weeks) ↑ 0.3 ↓ 0.8 ↓ 16.2
v s same period 2016
v s same period 2015
YTD GFA sold ↓ 15.4% ↑ 11.2% Inventory (no. of weeks of sales) of 16 cities*
0102030405060708090
100
Jan
-11
Mar
-12
Jun
-13
Au
g-1
4
No
v-1
5
Jan
-17
Inventory (no. of weeks) 26 weeks rolling avg
New launches in 10 major cities and sell-through rate
0%10%20%30%40%50%60%70%80%90%100%
0
5,000
10,000
15,000
20,000
25,000
32W
1250
W12
14W
1332
W13
50W
1318
W14
35W
142W
1519
W15
36W
151W
1618
W16
35W
1652
W16
17W
17
Total units launched (LHS)Sell-through rate (RHS)6 mths average sell-Through (RHS)
Source: CREIS, Fang.com, DBS Vickers * Rolling 26 weeks inventory
DBS Group Research . Equity 2 Aug 2017
China / Hong Kong
China Property Weekly Digest (Issue No. 230) Refer to important disclosures at the end of this report

China / Hong Kong
China Property Weekly Digest
Page 2
Share price performance
YTD Share price performance
Average short selling interest as percentage of trading volume (Jul 24 – Jul 28)
-100% 0% 100% 200% 300% 400%
EvergrandeZhong An
SunacC Garden
AgileLarge caps
LongforKaisa
CIFICOGO
YuzhouChina SCE
GreentownPoly HK
PowerlongMid caps
ShimaoGreenland HK
Small capsGZ R&F
CR LandBJ Cap Land
YuexiuYanlord
MSCI ChinaBJ North Star
KWGVanke
COLISino-Ocean
HSI IndexGlorious
SOHOShui On Land
HopsonChina South City
First SponsorYing Li
SRERenhe
CC Land
Sector avg: +61%
0% 5% 10% 15% 20% 25% 30% 35%
CR LandShimao PropertyChina Overseas
Renhe CommercialAgile Property
C C LandSunac China
LongforPoly (Hong Kong)
KWG PropertyGlorious Property
Yuzhou PropertiesSino-Ocean LandCountry Garden
Ying LiCOGO
Guangzhou R&FSoho ChinaEvergrandeGreentown
Times PropertyCentral ChinaShui On Land
China South CityLogan Property
China Vanke 'H'BJ Cap Land 'H'
GreenlandYanlord Land
China SCEYuexiu Property
Sector Avearge: 9%
Daily trading volume (Jul 24 – Jul 28)
0
50
100
150
200
250
300
350
400
Sun
ac
Ever
gra
nd
e
CO
LI
C G
ard
en
Van
ke
CR
Lan
d
GZ
R&
F
Lon
gfo
r
Ag
ile
Shim
ao
KW
G
Poly
HK
Ch
ina
SCE
CIF
I
Gre
ento
wn
Ch
ina
Sou
th C
ity
Sin
o-O
cean
Yu
exiu
Shu
i On
Lan
d
Yu
zho
u
CO
GO
SOH
O
Zho
ng
An
BJ C
ap L
and
Yan
lord
Pow
erlo
ng
Gre
enla
nd
HK
Ho
pso
n
BJ N
ort
h S
tar
Glo
rio
us
CC
Lan
d
Yin
g L
i
Ren
he
SRE
Firs
t Sp
on
sor
Source: Bloomberg Finance L.P, HKEx, DBS Vickers

China / Hong Kong
China Property Weekly Digest
Page 3
Overall southbound shareholding in CCASS w-o-w % changes of shareholding by southbound trading
8,100 8,200 8,300 8,400 8,500 8,600 8,700 8,800 8,900 9,000
17-M
ar-1
7
31-M
ar-1
7
14-A
pr-1
7
28-A
pr-1
7
12-M
ay-1
7
26-M
ay-1
7
9-Ju
n-17
23-J
un-1
7
mn
-15% -10% -5% 0% 5% 10% 15% 20%
COGO
Shimao
Sunac
Longfor
Agile
Vanke
CIFI
KWG
China South City
BJ North Star
Greentown
GZ R&F
Shui On Land
Poly HK
COLI
Yuexiu
Hopson
CR Land
SOHO
Sino-Ocean
Country Garden
Evergrande
China SCE
Source: Bloomberg Finance L.P, HKEx, DBS Vickers

China / Hong Kong
China Property Weekly Digest
Page 4
Average weekly trading volume
0
50
100
150
200
250
300
350
400
450
Ever
gra
nd
eC
OLI
CR
Lan
dSu
nac
C G
ard
enV
anke
GZ
R&
FA
gile
Lon
gfo
rSh
imao
KW
GG
reen
tow
nSO
HO
Yu
exiu
Poly
HK
Sin
o-O
cean
Ch
ina
SCE
Yu
zho
uY
anlo
rdC
OG
OSh
ui O
n L
and
BJ C
ap L
and
Gre
enla
nd
HK
BJ N
ort
h S
tar
Zho
ng
An
Yin
g L
iH
op
son
Glo
riou
sC
C L
and
Ren
he
SRE
Ch
ina
Sou
th C
ity
CIF
IFi
rst S
po
nso
rK
aisa
Pow
erlo
ng
YTD 2016 2015
US$ mn
Source: Bloomberg Finance L.P, DBS Vickers
New projects launched (Jul 24 – Jul 30):
31 projects were launched in Major Tier I&II cities. 8 projects were launched in Chengdu
Total of 6.3k units were launched in Major Tier I&II cities. Average sell-through rate for new launches increased to 86%
0%
20%
40%
60%
80%
100%
0
2
4
6
8
10
Bei
jing
Shan
gh
ai
Shen
zhen
Gu
ang
zho
u
Wu
han
Han
gzh
ou
Tian
jin
Ch
on
gq
ing
Nan
jing
Ch
eng
du
Launches (LHS) Sell-through rate (RHS)
Unit
0%10%20%30%40%50%60%70%80%90%100%
0
5,000
10,000
15,000
20,000
25,000
32
W1
25
0W
12
14
W1
33
2W
13
50
W1
31
8W
14
35
W1
42
W1
51
9W
15
36
W1
51
W1
61
8W
16
35
W1
65
2W
16
17
W1
7
Total units launched (LHS)Sell-through rate (RHS)6 mths average sell-Through (RHS)
Source: CREIS, DBS Vickers Source: CREIS, DBS Vickers

China / Hong Kong
China Property Weekly Digest
Page 5
Weekly sales performance of major cities
Tier I cities
Tier I cities: Weekly GFA sales of key cities
G F A % change as compared t o
Cit yLast w eek
(000 sm) w - o- w y - o- y
A v g o f p rev ious 4
w eek s A v g 2016 A v g 2015 A v g 2014 A v g 2013 A v g 2012
Beijing 193 130% -15% 149% 5% -12% 2% -22% -23%
Shanghai 310 10% -44% -1% -26% -29% -1% -10% 12%
Shenzhen 27 -28% -53% -48% -66% -79% -65% -68% -61%
Guangzhou 105 -5% -67% -33% -61% -50% -34% -48% -49%
T ier I t o t al 635 23% - 45% 17% - 37% - 42% - 24% - 37% - 30%
Source: CREIS, DBS Vickers
Tier I cities: Weekly ASP of key cities
A SP % change as compared t o
Cit yLast w eek
(Rmb/sm) w - o- w y - o- y
A v g o f prev ious 4 w eek s A v g 2016 A v g 2015 A v g 2014 A v g 2013 A v g 2012
Beijing 50,218 7% 40% 3% 39% 87% 97% 114% 143%
Shanghai 26,753 -3% -3% -4% 1% 16% 42% 44% 72%
Shenzhen 55,877 13% 3% 4% 3% 69% 137% 153% 199%
Guangzhou 14,985 -5% -16% -11% -9% -1% 1% 17% 25%
T ier I t o t al 36 ,958 3% 6% - 2% 8% 43% 69% 82% 110%
Source: CREIS, DBS Vickers
Tier I cities: YTD GFA sales of key cities Tier I cities: Avg ASP of key cities
-60%
-50%
-40%
-30%
-20%
-10%
0%
02,0004,0006,0008,000
10,00012,00014,00016,000
Shan
gh
ai
Bei
jing
Gu
ang
zho
u
Shen
zhen
Yoy (%)000 sm
2017 (LHS) 2016 (LHS)
-2%0%2%4%6%8%10%12%14%16%18%
0
10,000
20,000
30,000
40,000
50,000
60,000
Bei
jing
Shen
zhen
Shan
gh
ai
Gu
ang
zho
u
Yoy (%)RMB/sm
2017 avg (LHS) 2016 avg (LHS) Yoy (RHS)
Source: CREIS, DBS Vickers Source: CREIS, DBS Vickers
China / Hong Kong
China Property Weekly Digest
Page 6
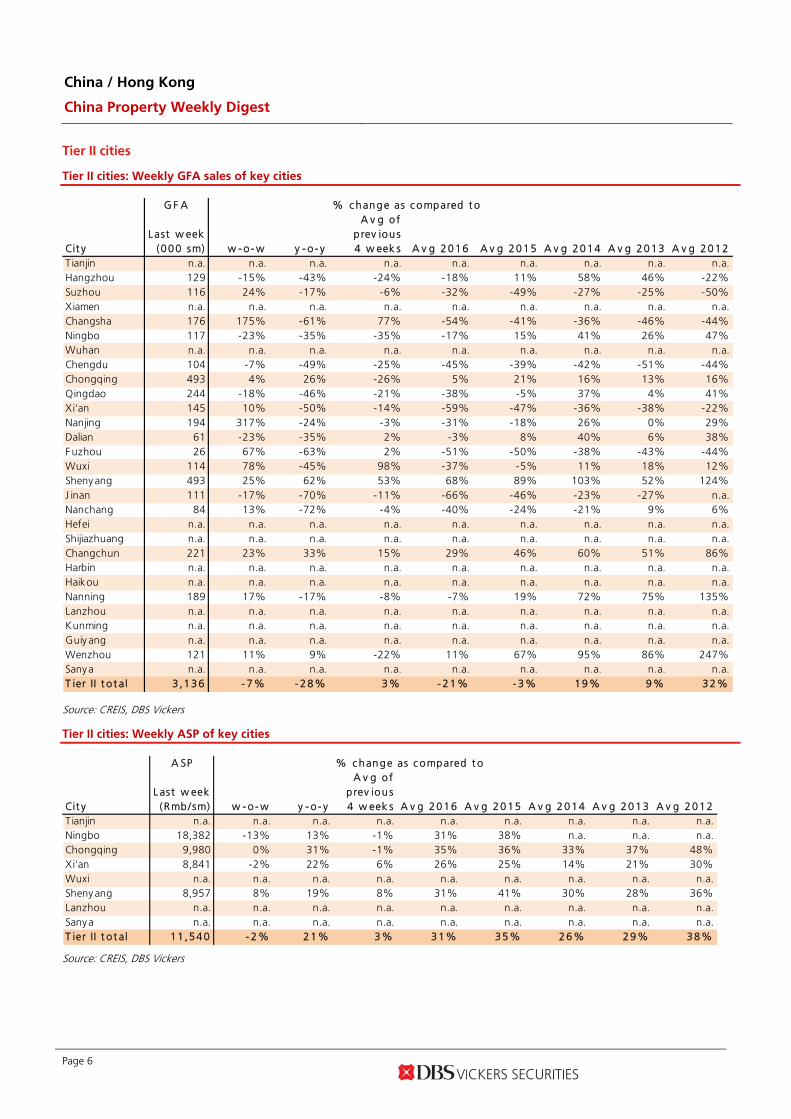
Tier II cities
Tier II cities: Weekly GFA sales of key cities
G F A % c hange as c ompared t o
Cit yL ast w eek
(000 sm) w - o - w y - o - y
A v g o f p rev iou s 4 w eek s A v g 2016 A v g 2015 A v g 2014 A v g 2013 A v g 2012
Tianjin n.a. n.a. n.a. n.a. n.a. n.a. n.a. n.a. n.a.Hangzhou 129 -15% -43% -24% -18% 11% 58% 46% -22%Suzhou 116 24% -17% -6% -32% -49% -27% -25% -50%Xiamen n.a. n.a. n.a. n.a. n.a. n.a. n.a. n.a. n.a.Changsha 176 175% -61% 77% -54% -41% -36% -46% -44%Ningbo 117 -23% -35% -35% -17% 15% 41% 26% 47%Wuhan n.a. n.a. n.a. n.a. n.a. n.a. n.a. n.a. n.a.Chengdu 104 -7% -49% -25% -45% -39% -42% -51% -44%Chongqing 493 4% 26% -26% 5% 21% 16% 13% 16%Qingdao 244 -18% -46% -21% -38% -5% 37% 4% 41%Xi'an 145 10% -50% -14% -59% -47% -36% -38% -22%Nanjing 194 317% -24% -3% -31% -18% 26% 0% 29%Dalian 61 -23% -35% 2% -3% 8% 40% 6% 38%F uzhou 26 67% -63% 2% -51% -50% -38% -43% -44%Wuxi 114 78% -45% 98% -37% -5% 11% 18% 12%Sheny ang 493 25% 62% 53% 68% 89% 103% 52% 124%J inan 111 -17% -70% -11% -66% -46% -23% -27% n.a.Nanchang 84 13% -72% -4% -40% -24% -21% 9% 6%Hefei n.a. n.a. n.a. n.a. n.a. n.a. n.a. n.a. n.a.Shijiazhuang n.a. n.a. n.a. n.a. n.a. n.a. n.a. n.a. n.a.Changchun 221 23% 33% 15% 29% 46% 60% 51% 86%Harbin n.a. n.a. n.a. n.a. n.a. n.a. n.a. n.a. n.a.Haikou n.a. n.a. n.a. n.a. n.a. n.a. n.a. n.a. n.a.Nanning 189 17% -17% -8% -7% 19% 72% 75% 135%Lanzhou n.a. n.a. n.a. n.a. n.a. n.a. n.a. n.a. n.a.Kunming n.a. n.a. n.a. n.a. n.a. n.a. n.a. n.a. n.a.Guiy ang n.a. n.a. n.a. n.a. n.a. n.a. n.a. n.a. n.a.Wenzhou 121 11% 9% -22% 11% 67% 95% 86% 247%Sany a n.a. n.a. n.a. n.a. n.a. n.a. n.a. n.a. n.a.T ier II t o t al 3 ,136 - 7% - 28% 3% - 21% - 3% 19% 9% 32%
Source: CREIS, DBS Vickers
Tier II cities: Weekly ASP of key cities
A SP % c hange as c ompared t o
Cit yL ast w eek
(Rmb /sm) w - o - w y - o - y
A v g o f p rev iou s 4 w eek s A v g 2016 A v g 2015 A v g 2014 A v g 2013 A v g 2012
Tianjin n.a. n.a. n.a. n.a. n.a. n.a. n.a. n.a. n.a.Ningbo 18,382 -13% 13% -1% 31% 38% n.a. n.a. n.a.Chongqing 9,980 0% 31% -1% 35% 36% 33% 37% 48%Xi'an 8,841 -2% 22% 6% 26% 25% 14% 21% 30%Wuxi n.a. n.a. n.a. n.a. n.a. n.a. n.a. n.a. n.a.Sheny ang 8,957 8% 19% 8% 31% 41% 30% 28% 36%Lanzhou n.a. n.a. n.a. n.a. n.a. n.a. n.a. n.a. n.a.Sany a n.a. n.a. n.a. n.a. n.a. n.a. n.a. n.a. n.a.T ier II t o t al 11 ,540 - 2% 21% 3% 31% 35% 26% 29% 38%
Source: CREIS, DBS Vickers

China / Hong Kong
China Property Weekly Digest
Page 7
Tier II cities: YTD GFA sales of key cities
-80%
-60%
-40%
-20%
0%
20%
40%
60%
(1,500)
3,500
8,500
13,500
18,500
23,500
Wu
han
Ch
ongq
ing
Ch
ang
sha
Ku
nm
ing
Xia
n
Qin
gd
ao
Shen
yan
g
Ch
ang
chu
n
Nan
jing
Suzh
ou
Ch
eng
du
Nin
gb
o
Dal
ian
Nan
chan
g
Wu
xi
Han
gzh
ou
Wen
zho
u
Fuzh
ou
San
ya
Nan
nin
g
Hai
kou
Ch
ang
sha
Yoy (%)000 sm
2017 (LHS) 2016 (LHS) Yoy (RHS)
Source: CREIS, DBS Vickers
Tier II cities: Avg ASP of key cities
0%
5%
10%
15%
20%
25%
30%
35%
40%
0
1,000
2,000
3,000
4,000
5,000
6,000
7,000
8,000
9,000
10,000
Changsha Xian Chongqing Shenyang Shenyang
Yoy (%)RMB/sm
2017 avg (LHS) 2016 avg (LHS) Yoy (RHS)
Source: CREIS, DBS Vickers

China / Hong Kong
China Property Weekly Digest
Page 8
Tier III cities
Tier III cities: Weekly GFA sales of key cities
G F A % c hange as c ompared t o
Cit yL ast w eek
(000 sm) w - o - w y - o - y
A v g o f p rev iou s 4
w eek s A v g 2016 A v g 2015 A v g 2014 A v g 2013 A v g 2012Dongguan 82 21% -58% 9% -53% -57% -24% -43% -28%Weifang n.a. n.a. n.a. n.a. n.a. n.a. n.a. n.a. n.a.Baotou 70 -17% 31% -8% 6% 26% 27% 31% -1%Guilin n.a. n.a. n.a. n.a. n.a. n.a. n.a. n.a. n.a.Xuzhou 244 -10% -5% -13% -16% 16% 34% 23% 68%Bengbu 52 8% -32% 16% -25% 56% 42% 20% 123%Yangzhou n.a. n.a. n.a. n.a. n.a. n.a. n.a. n.a. n.a.Huizhou 50 -11% -47% 4% -50% -27% -3% -22% -21%Liany ungang 132 -15% 11% -19% 6% 31% 54% 22% 48%Shantou 99 7% n.a. -18% 62% 185% 441% 355% 425%Zhongshan n.a. n.a. n.a. n.a. n.a. n.a. n.a. n.a. n.a.Dandong n.a. n.a. n.a. n.a. n.a. n.a. n.a. n.a. n.a.J iujiang 85 0% 126% n.a. 62% 78% 103% 162% 279%Shaoguan 24 -13% -65% -24% -35% 5% 23% 14% 55%Luzhou n.a. n.a. n.a. n.a. n.a. n.a. n.a. n.a. n.a.Nanchong n.a. n.a. n.a. n.a. n.a. n.a. n.a. n.a. n.a.Zhoushan 24 3% 0% -10% -13% 7% 48% 18% 99%Dongy ing 46 24% 16% 11% 24% 26% 39% -6% 70%Huaian 2 -97% -98% -98% -99% -98% -98% -98% -97%Wuhu 49 -1% -47% -8% -45% 5% 25% 14% -11%Guan n.a. n.a. n.a. n.a. n.a. n.a. n.a. n.a. n.a.J iaozuo 20 35% 158% 19% 2% 12% 113% 0% -5%Zhaoqing 50 1% 15% -22% -2% 22% 84% 51% 52%T ier III t o t al 1 ,030 - 3% 2% - 11% - 12% 19% 61% 36% 70%
Source: CREIS, DBS Vickers
Tier III cities: Weekly ASP of key cities
A SP % c hange as c ompared t o
Cit yL ast w eek
(Rmb /sm) w - o - w y - o - y
A v g o f p rev iou s 4 w eek s A v g 2016 A v g 2015 A v g 2014 A v g 2013 A v g 2012
Dongguan n.a. n.a. n.a. n.a. n.a. n.a. n.a. n.a. n.a.Weifang n.a. n.a. n.a. n.a. n.a. n.a. n.a. n.a. n.a.Baotou 5,509 2% n.a. 2% 9% 7% 8% 8% 20%Bengbu n.a. n.a. n.a. n.a. n.a. n.a. n.a. n.a. n.a.Shantou 9,452 11% n.a. 8% 15% 17% 17% 6% 34%Dandong n.a. n.a. n.a. n.a. n.a. n.a. n.a. n.a. n.a.J iujiang n.a. n.a. n.a. n.a. n.a. n.a. n.a. n.a. n.a.Shaoguan 5,711 2% 141% -5% 27% 13% 9% 6% 8%Dongy ing n.a. n.a. n.a. n.a. n.a. n.a. n.a. n.a. n.a.Huaian 5,467 24% 15% 19% 26% 31% 25% 25% 35%J iaozuo n.a. n.a. n.a. n.a. n.a. n.a. n.a. n.a. n.a.Zhaoqing 6,641 -4% 23% -10% 23% 27% 17% 11% 28%T ier II I t o t al 6 ,556 7% 60% 3% 20% 19% 15% 11% 25%
Source: CREIS, DBS Vickers

China / Hong Kong
China Property Weekly Digest
Page 9
Tier III cities: YTD GFA sales of key cities
-100%-50%0%50%100%150%200%250%300%
(600)
1,400
3,400
5,400
7,400
9,400
11,400
13,400
Xu
zho
u
Wu
hu
Do
ng
gu
an
Lian
yun
gan
g
Shao
xin
g
Hu
izho
u
Zho
ush
an
Bao
tou
Jiu
jian
g
Yan
gzh
ou
Wu
hu
Ben
gb
u
Zhao
qin
g
Shan
tou
Shao
gu
an
Hu
aian
Do
ngyi
ng
Yoy (%)000 sm
2017 (LHS) 2016 (LHS) Yoy (RHS)
Source: CREIS, DBS Vickers
Tier III cities: Avg ASP of key cities
0%
5%
10%
15%
20%
25%
30%
0
5,000
10,000
15,000
Shaoxing Jiujiang Zhaoqing Baotou Shaoguan
Yoy (%)RMB/sm
2017 avg (LHS) 2016 avg (LHS) Yoy (RHS)
Source: CREIS, DBS Vickers

China / Hong Kong
China Property Weekly Digest
Page 10
Inventory level
No. of weeks to digest inventory
Source: CREIS, DBS Vickers
Trend: No. of weeks to digest inventory
0
20
40
60
80
100
120
140
Jan
-11
Mar
-12
Jun
-13
Au
g-1
4
No
v-1
5
Jan
-17
Tier I average Tier II average Tier III average
Tier 1
Tier 2
Tier 3
weeks
Source: CREIS, DBS Vickers
Notes: 1. Based on 26 weeks average sales
2. Only Huizhou, Jiujiang, Nanchong, Zhoushan and Dongying are included in Tier III cities
China / Hong Kong
China Property Weekly Digest
Page 11
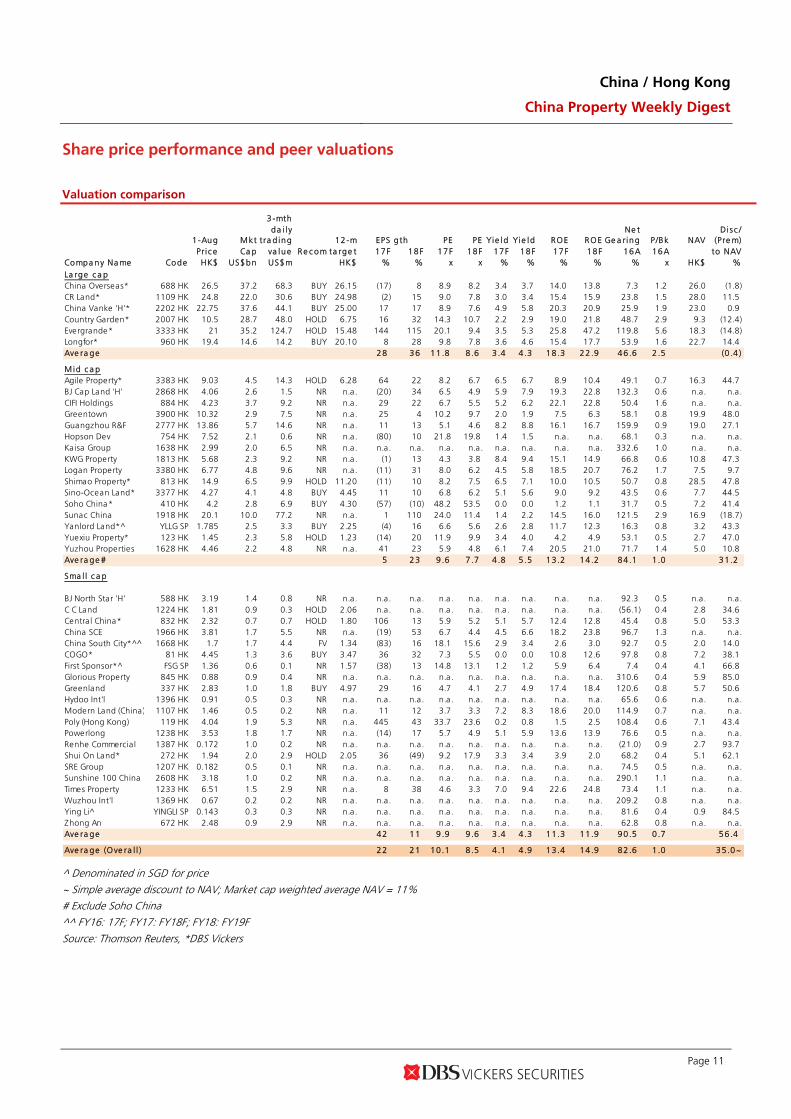
Share price performance and peer valuations
Valuation comparison
3-mthda i l y Ne t Di sc /
Mkt tra d ing 12-m EPS g th PE PE Yie ld Yie ld ROE ROE Ge a ring P/Bk NAV (Pre m)Pri c e Ca p va lue Re c om ta rge t 17F 18F 17F 18F 17F 18F 17F 18F 16A 16A to NAV
Compa ny Na me Code HK$ US$bn US$m HK$ % % x x % % % % % x HK$ %La rge c a pChina Overseas* 688 HK 26.5 37.2 68.3 BUY 26.15 (17) 8 8.9 8.2 3.4 3.7 14.0 13.8 7.3 1.2 26.0 (1.8)CR Land* 1109 HK 24.8 22.0 30.6 BUY 24.98 (2) 15 9.0 7.8 3.0 3.4 15.4 15.9 23.8 1.5 28.0 11.5China Vanke 'H'* 2202 HK 22.75 37.6 44.1 BUY 25.00 17 17 8.9 7.6 4.9 5.8 20.3 20.9 25.9 1.9 23.0 0.9Country Garden* 2007 HK 10.5 28.7 48.0 HOLD 6.75 16 32 14.3 10.7 2.2 2.9 19.0 21.8 48.7 2.9 9.3 (12.4)Evergrande* 3333 HK 21 35.2 124.7 HOLD 15.48 144 115 20.1 9.4 3.5 5.3 25.8 47.2 119.8 5.6 18.3 (14.8)Longfor* 960 HK 19.4 14.6 14.2 BUY 20.10 8 28 9.8 7.8 3.6 4.6 15.4 17.7 53.9 1.6 22.7 14.4Ave ra ge 28 36 11 .8 8 .6 3 .4 4 .3 18 .3 22 .9 46 .6 2 .5 (0 .4 )
M id c a pAgile Property* 3383 HK 9.03 4.5 14.3 HOLD 6.28 64 22 8.2 6.7 6.5 6.7 8.9 10.4 49.1 0.7 16.3 44.7BJ Cap Land 'H' 2868 HK 4.06 2.6 1.5 NR n.a. (20) 34 6.5 4.9 5.9 7.9 19.3 22.8 132.3 0.6 n.a. n.a.CIFI Holdings 884 HK 4.23 3.7 9.2 NR n.a. 29 22 6.7 5.5 5.2 6.2 22.1 22.8 50.4 1.6 n.a. n.a.Greentown 3900 HK 10.32 2.9 7.5 NR n.a. 25 4 10.2 9.7 2.0 1.9 7.5 6.3 58.1 0.8 19.9 48.0Guangzhou R&F 2777 HK 13.86 5.7 14.6 NR n.a. 11 13 5.1 4.6 8.2 8.8 16.1 16.7 159.9 0.9 19.0 27.1Hopson Dev 754 HK 7.52 2.1 0.6 NR n.a. (80) 10 21.8 19.8 1.4 1.5 n.a. n.a. 68.1 0.3 n.a. n.a.Kaisa Group 1638 HK 2.99 2.0 6.5 NR n.a. n.a. n.a. n.a. n.a. n.a. n.a. n.a. n.a. 332.6 1.0 n.a. n.a.KWG Property 1813 HK 5.68 2.3 9.2 NR n.a. (1) 13 4.3 3.8 8.4 9.4 15.1 14.9 66.8 0.6 10.8 47.3Logan Property 3380 HK 6.77 4.8 9.6 NR n.a. (11) 31 8.0 6.2 4.5 5.8 18.5 20.7 76.2 1.7 7.5 9.7Shimao Property* 813 HK 14.9 6.5 9.9 HOLD 11.20 (11) 10 8.2 7.5 6.5 7.1 10.0 10.5 50.7 0.8 28.5 47.8Sino-Ocean Land* 3377 HK 4.27 4.1 4.8 BUY 4.45 11 10 6.8 6.2 5.1 5.6 9.0 9.2 43.5 0.6 7.7 44.5Soho China* 410 HK 4.2 2.8 6.9 BUY 4.30 (57) (10) 48.2 53.5 0.0 0.0 1.2 1.1 31.7 0.5 7.2 41.4Sunac China 1918 HK 20.1 10.0 77.2 NR n.a. 1 110 24.0 11.4 1.4 2.2 14.5 16.0 121.5 2.9 16.9 (18.7)Yanlord Land*^ YLLG SP 1.785 2.5 3.3 BUY 2.25 (4) 16 6.6 5.6 2.6 2.8 11.7 12.3 16.3 0.8 3.2 43.3Yuexiu Property* 123 HK 1.45 2.3 5.8 HOLD 1.23 (14) 20 11.9 9.9 3.4 4.0 4.2 4.9 53.1 0.5 2.7 47.0Yuzhou Properties 1628 HK 4.46 2.2 4.8 NR n.a. 41 23 5.9 4.8 6.1 7.4 20.5 21.0 71.7 1.4 5.0 10.8Ave ra ge # 5 23 9 .6 7 .7 4 .8 5 .5 13 .2 14 .2 84 .1 1 .0 31 .2
Sma l l c a p
BJ North Star 'H' 588 HK 3.19 1.4 0.8 NR n.a. n.a. n.a. n.a. n.a. n.a. n.a. n.a. n.a. 92.3 0.5 n.a. n.a.C C Land 1224 HK 1.81 0.9 0.3 HOLD 2.06 n.a. n.a. n.a. n.a. n.a. n.a. n.a. n.a. (56.1) 0.4 2.8 34.6Central China* 832 HK 2.32 0.7 0.7 HOLD 1.80 106 13 5.9 5.2 5.1 5.7 12.4 12.8 45.4 0.8 5.0 53.3China SCE 1966 HK 3.81 1.7 5.5 NR n.a. (19) 53 6.7 4.4 4.5 6.6 18.2 23.8 96.7 1.3 n.a. n.a.China South City*^^ 1668 HK 1.7 1.7 4.4 FV 1.34 (83) 16 18.1 15.6 2.9 3.4 2.6 3.0 92.7 0.5 2.0 14.0COGO* 81 HK 4.45 1.3 3.6 BUY 3.47 36 32 7.3 5.5 0.0 0.0 10.8 12.6 97.8 0.8 7.2 38.1First Sponsor*^ FSG SP 1.36 0.6 0.1 NR 1.57 (38) 13 14.8 13.1 1.2 1.2 5.9 6.4 7.4 0.4 4.1 66.8Glorious Property 845 HK 0.88 0.9 0.4 NR n.a. n.a. n.a. n.a. n.a. n.a. n.a. n.a. n.a. 310.6 0.4 5.9 85.0Greenland 337 HK 2.83 1.0 1.8 BUY 4.97 29 16 4.7 4.1 2.7 4.9 17.4 18.4 120.6 0.8 5.7 50.6Hydoo Int'l 1396 HK 0.91 0.5 0.3 NR n.a. n.a. n.a. n.a. n.a. n.a. n.a. n.a. n.a. 65.6 0.6 n.a. n.a.Modern Land (China) 1107 HK 1.46 0.5 0.2 NR n.a. 11 12 3.7 3.3 7.2 8.3 18.6 20.0 114.9 0.7 n.a. n.a.Poly (Hong Kong) 119 HK 4.04 1.9 5.3 NR n.a. 445 43 33.7 23.6 0.2 0.8 1.5 2.5 108.4 0.6 7.1 43.4Powerlong 1238 HK 3.53 1.8 1.7 NR n.a. (14) 17 5.7 4.9 5.1 5.9 13.6 13.9 76.6 0.5 n.a. n.a.Renhe Commercia l 1387 HK 0.172 1.0 0.2 NR n.a. n.a. n.a. n.a. n.a. n.a. n.a. n.a. n.a. (21.0) 0.9 2.7 93.7Shui On Land* 272 HK 1.94 2.0 2.9 HOLD 2.05 36 (49) 9.2 17.9 3.3 3.4 3.9 2.0 68.2 0.4 5.1 62.1SRE Group 1207 HK 0.182 0.5 0.1 NR n.a. n.a. n.a. n.a. n.a. n.a. n.a. n.a. n.a. 74.5 0.5 n.a. n.a.Sunshine 100 China 2608 HK 3.18 1.0 0.2 NR n.a. n.a. n.a. n.a. n.a. n.a. n.a. n.a. n.a. 290.1 1.1 n.a. n.a.Times Property 1233 HK 6.51 1.5 2.9 NR n.a. 8 38 4.6 3.3 7.0 9.4 22.6 24.8 73.4 1.1 n.a. n.a.Wuzhou Int'l 1369 HK 0.67 0.2 0.2 NR n.a. n.a. n.a. n.a. n.a. n.a. n.a. n.a. n.a. 209.2 0.8 n.a. n.a.Ying Li^ YINGLI SP 0.143 0.3 0.3 NR n.a. n.a. n.a. n.a. n.a. n.a. n.a. n.a. n.a. 81.6 0.4 0.9 84.5Zhong An 672 HK 2.48 0.9 2.9 NR n.a. n.a. n.a. n.a. n.a. n.a. n.a. n.a. n.a. 62.8 0.8 n.a. n.a.Ave ra ge 42 11 9 .9 9 .6 3 .4 4 .3 11 .3 11 .9 90 .5 0 .7 56 .4
Ave ra ge (Ove ra l l ) 22 21 10 .1 8 .5 4 .1 4 .9 13 .4 14 .9 82 .6 1 .0 35 .0~
1-Aug
^ Denominated in SGD for price
~ Simple average discount to NAV; Market cap weighted average NAV = 11% # Exclude Soho China
^^ FY16: 17F; FY17: FY18F; FY18: FY19F
Source: Thomson Reuters, *DBS Vickers

China / Hong Kong
China Property Weekly Digest
Page 12
PE valuations, 2008 to 2016 trough (based on earnings forecasts)
1-Aug Mkt 17F 18F PE (x)
Compa ny Na me CodePri c eHK$
Ca pUS$bn
PEx
PEx
Trough 2008
Trough 2009
Trough 2010
Trough 2011
Trough 2012
Trough 2013
Trough 2014
Trough 2015
Trough 2016
China Overseas* 688 HK 26.50 37.2 8.9 8.2 9.7 11.1 12.8 6.5 7.1 7.8 6.1 6.7 5.8CR Land* 1109 HK 24.80 22.0 9.0 7.8 15.9 13.1 14.4 7.2 10.1 11.9 7.1 8.2 7.0China Vanke 'H'* 2202 HK 22.75 37.6 8.9 7.6 n.a. n.a. n.a. n.a. n.a. n.a. 6.3 6.8 6.5Country Garden* 2007 HK 10.50 28.7 14.3 10.7 3.6 5.2 10.7 5.2 5.8 6.5 4.0 4.2 4.9Evergrande* 3333 HK 21.00 35.2 20.1 9.4 n.a. n.a. 3.8 2.9 3.3 4.2 3.4 4.3 6.4Longfor* 960 HK 19.40 14.6 9.8 7.8 n.a. 17.8 13.8 6.3 5.6 7.4 5.3 5.4 5.5Ave ra ge 11 .8 8 .6 9 .7 11 .8 11 .1 5 .6 6 .4 7 .6 5 .4 5 .9 6 .0
Agile Property* 3383 HK 9.03 4.5 8.2 6.7 1.5 4.2 7.6 2.5 3.4 3.6 2.2 2.7 3.0BJ Cap Land 'H' 2868 HK 4.06 2.6 6.5 4.9 1.6 3.1 5.1 1.9 2.0 3.3 2.6 3.1 3.5CIFI Holdings 884 HK 4.23 3.7 6.7 5.5 n.a. n.a. n.a. n.a. n.a. 3.8 3.2 2.7 2.8Greentown 3900 HK 10.32 2.9 10.2 9.7 1.9 2.3 6.3 2.0 1.5 3.3 2.3 3.1 3.4Guangzhou R&F 2777 HK 13.86 5.7 5.1 4.6 2.4 4.8 6.8 3.2 3.2 4.7 3.8 3.1 3.5Hopson Dev 754 HK 7.52 2.1 21.8 19.8 1.0 2.2 4.9 2.8 2.8 5.6 3.9 10.7 12.1Kaisa Group 1638 HK 2.99 2.0 n.a. n.a. n.a. n.a. 3.5 3.7 2.9 2.8 1.9 1.7 1.9KWG Property 1813 HK 5.68 2.3 4.3 3.8 2.1 2.8 7.8 3.0 2.8 3.6 2.8 3.1 3.0Logan Property 3380 HK 6.77 4.8 8.0 6.2 n.a. n.a. n.a. n.a. n.a. n.a. 3.5 3.6 3.7Shimao Property* 813 HK 14.90 6.5 8.2 7.5 3.7 4.2 8.5 3.6 3.9 6.4 4.3 3.3 3.1Sino-Ocean Land* 3377 HK 4.27 4.1 6.8 6.2 4.7 9.0 11.3 4.1 5.4 6.7 6.0 5.9 5.1Soho China* 410 HK 4.20 2.8 48.2 53.5 4.5 3.1 3.6 7.0 3.5 4.9 6.9 12.3 14.0Sunac China 1918 HK 20.10 10.0 24.0 11.4 n.a. n.a. 4.5 1.4 1.4 3.1 2.2 2.7 3.1Yanlord Land*^ YLLG SP 1.79 2.5 6.6 5.6 4.1 6.6 9.3 5.0 6.7 9.3 7.5 7.1 7.0Yuexiu Property* 123 HK 1.45 2.3 11.9 9.9 1.9 2.9 8.9 4.5 4.5 5.8 5.9 6.3 5.3Yuzhou Properties 1628 HK 4.46 2.2 5.9 4.8 n.a. 9.6 5.5 2.7 3.6 3.6 2.4 2.1 3.3Ave ra ge # 9 .6 7 .7 2 .8 4 .7 7 .2 3 .6 3 .6 4 .9 4 .0 4 .7 5 .0
BJ North Star 'H' 588 HK 3.19 1.4 n.a. n.a. 3.5 5.0 7.5 3.6 6.5 4.0 3.8 5.0 5.6C C Land 1224 HK 1.81 0.9 n.a. n.a. 18.4 n.a. n.a. 5.1 3.9 6.7 3.4 5.2 7.6Central China* 832 HK 2.32 0.7 5.9 5.2 1.3 1.5 3.9 2.8 2.8 3.5 2.6 2.5 2.3China SCE 1966 HK 3.81 1.7 6.7 4.4 n.a. n.a. 4.7 3.7 2.9 2.4 5.6 4.5 3.7China South City*^^ 1668 HK 1.70 1.7 18.1 15.6 n.a. 17.7 6.9 4.3 5.9 4.3 5.1 5.7 5.8COGO* 81 HK 4.45 1.3 7.3 5.5 n.a. n.a. n.a. 3.6 5.0 6.3 3.1 3.1 2.7First Sponsor*^ FSG SP 1.36 0.6 14.8 13.1 n.a. n.a. n.a. n.a. n.a. n.a. 29.9 13.4 13.6Glorious Property 845 HK 0.88 0.9 n.a. n.a. n.a. 12.9 6.4 2.8 2.8 4.8 4.4 3.6 17.3Greenland 337 HK 2.83 1.0 4.7 4.1 0.7 1.1 3.6 1.2 1.0 0.6 11.7 8.0 4.8Hydoo Int'l 1396 HK 0.91 0.5 n.a. n.a. n.a. n.a. n.a. n.a. n.a. 3.6 2.3 2.3 7.0Modern Land (China) 1107 HK 1.46 0.5 3.7 3.3 n.a. n.a. n.a. n.a. n.a. n.a. 2.4 2.4 2.0Poly (Hong Kong) 119 HK 4.04 1.9 33.7 23.6 10.0 3.8 14.9 4.2 4.9 5.2 3.9 5.4 13.0Powerlong 1238 HK 3.53 1.8 5.7 4.9 n.a. 4.7 5.3 1.5 1.6 3.6 2.8 3.2 2.7Renhe Commercia l 1387 HK 0.17 1.0 n.a. n.a. 10.5 5.7 5.4 3.2 2.7 4.7 7.7 7.7 7.7Shui On Land* 272 HK 1.94 2.0 9.2 17.9 1.7 3.4 9.4 5.6 6.5 9.1 10.6 5.8 6.5SRE Group 1207 HK 0.18 0.5 n.a. n.a. 1.0 1.5 2.0 2.3 0.9 1.1 1.1 1.1 1.1Sunshine 100 China 2608 HK 3.18 1.0 n.a. n.a. n.a. n.a. n.a. n.a. n.a. n.a. 5.7 5.8 5.3Times Property 1233 HK 6.51 1.5 4.6 3.3 n.a. n.a. n.a. n.a. n.a. n.a. 2.5 2.2 1.9Wuzhou Int'l 1369 HK 0.67 0.2 n.a. n.a. n.a. n.a. n.a. n.a. n.a. n.a. 7.3 5.2 22.3Ying Li^ YINGLI SP 0.14 0.3 n.a. n.a. n.a. 64.8 22.4 6.9 4.7 7.8 4.1 5.1 9.5Zhong An 672 HK 2.48 0.9 n.a. n.a. 1.7 2.9 7.8 3.0 9.9 5.3 8.3 8.3 8.3Ave ra ge 9 .9 9 .6 4 .3 9 .0 7 .4 3 .5 3 .8 4 .6 5 .9 5 .0 7 .0
Ave ra ge (Ove ra l l ) 10 .1 8 .5 4 .2 7 .5 7 .8 3 .8 4 .1 5 .1 5 .1 5 .0 6 .1 ^ Denominated in SGD for price # Exclude Soho China
^^ FY16: 17F; FY17: FY18F; FY18: FY19F
Source: Thomson Reuters, *DBS Vickers

China / Hong Kong
China Property Weekly Digest
Page 13
PE valuations, 2008 to 2016 peak (based on earnings forecasts)
1-Aug M kt 17F 18F PE (x)
Compa ny Na me CodePr ic eHK$
Ca pUS$bn
PEx
PEx
Pe a k 2008
Pe a k 2009
Pe a k 2010
Pe a k 2011
Pe a k 2012
Pe a k 2013
Pe a k 2014
Pe a k 2015
Pe a k 2016
China Overseas* 688 HK 26.50 37.2 8.9 8.2 22.7 25.0 17.0 12.1 12.4 11.2 8.5 9.9 8.7CR Land* 1109 HK 24.80 22.0 9.0 7.8 28.6 30.4 21.1 15.2 17.6 16.2 10.7 12.8 9.7China Vanke 'H'* 2202 HK 22.75 37.6 8.9 7.6 n.a. n.a. n.a. n.a. n.a. n.a. 9.0 11.8 11.3Country Garden* 2007 HK 10.50 28.7 14.3 10.7 19.8 20.3 16.7 11.6 9.2 10.0 6.4 7.3 8.8Evergrande* 3333 HK 21.00 35.2 20.1 9.4 n.a. n.a. 9.1 8.9 6.1 6.4 4.6 14.2 13.2Longfor* 960 HK 19.40 14.6 9.8 7.8 n.a. 24.4 21.7 14.2 11.9 10.4 6.9 8.7 8.2Ave ra ge 11 .8 8 .6 23 .7 25 .0 17 .1 12 .4 11 .4 10 .8 7 .7 10 .8 10 .0
Agile Property* 3383 HK 9.03 4.5 8.2 6.7 14.5 19.0 12.4 10.0 6.4 6.9 3.9 5.1 5.6BJ Cap Land 'H' 2868 HK 4.06 2.6 6.5 4.9 9.5 15.9 9.6 5.9 4.7 5.3 3.3 6.3 5.9CIFI Holdings 884 HK 4.23 3.7 6.7 5.5 n.a. n.a. n.a. n.a. n.a. 5.9 4.3 5.1 5.4Greentown 3900 HK 10.32 2.9 10.2 9.7 9.7 18.3 10.2 6.1 6.3 6.6 4.5 6.1 7.8Guangzhou R&F 2777 HK 13.86 5.7 5.1 4.6 16.6 17.8 10.5 8.0 7.4 8.1 4.8 4.8 6.0Hopson Dev 754 HK 7.52 2.1 21.8 19.8 9.6 10.3 7.5 6.4 16.0 13.7 16.1 24.6 22.4Kaisa Group 1638 HK 2.99 2.0 n.a. n.a. n.a. n.a. 8.4 10.0 6.9 5.9 3.9 2.3 8.9KWG Property 1813 HK 5.68 2.3 4.3 3.8 12.1 21.6 13.9 9.6 6.4 6.4 5.0 6.0 4.5Logan Property 3380 HK 6.77 4.8 8.0 6.2 n.a. n.a. n.a. n.a. n.a. n.a. 3.8 6.6 6.0Shimao Property* 813 HK 14.90 6.5 8.2 7.5 14.8 18.3 13.2 9.6 9.5 8.8 6.0 6.1 5.6Sino-Ocean Land* 3377 HK 4.27 4.1 6.8 6.2 13.2 24.8 15.7 10.3 12.1 11.4 7.8 9.9 8.0Soho China* 410 HK 4.20 2.8 48.2 53.5 11.4 8.5 6.1 13.7 4.8 6.0 9.1 18.9 46.7Sunac China 1918 HK 20.10 10.0 24.0 11.4 n.a. n.a. 5.8 3.5 5.5 4.9 5.1 6.3 12.4Yanlord Land*^ YLLG SP 1.79 2.5 6.6 5.6 14.5 19.8 14.5 10.5 15.0 14.4 9.8 12.7 9.4Yuexiu Property* 123 HK 1.45 2.3 11.9 9.9 11.0 25.5 15.7 11.0 9.1 9.5 7.9 11.1 10.6Yuzhou Properties 1628 HK 4.46 2.2 5.9 4.8 n.a. 11.7 9.9 5.8 6.5 6.5 3.3 5.2 5.2Ave ra ge # 9 .6 7 .7 13 .2 18 .4 11 .7 8 .8 8 .7 8 .4 6 .1 8 .1 8 .3
BJ North Star 'H' 588 HK 3.19 1.4 n.a. n.a. 20.6 18.0 12.7 10.5 8.9 7.0 8.2 13.0 10.9C C Land 1224 HK 1.81 0.9 n.a. n.a. n.a. n.a. n.a. 17.5 12.7 10.8 6.4 8.6 7.6Central China* 832 HK 2.32 0.7 5.9 5.2 10.8 9.4 6.6 5.6 6.3 5.2 3.8 4.4 3.9China SCE 1966 HK 3.81 1.7 6.7 4.4 n.a. n.a. 6.9 5.5 3.5 6.6 5.6 5.6 7.6China South City*^^ 1668 HK 1.70 1.7 18.1 15.6 n.a. 19.6 20.4 12.3 6.6 6.9 11.8 9.5 10.8COGO* 81 HK 4.45 1.3 7.3 5.5 n.a. n.a. n.a. 9.8 9.8 10.0 5.1 6.1 6.3First Sponsor*^ FSG SP 1.36 0.6 14.8 13.1 n.a. n.a. n.a. n.a. n.a. n.a. 31.3 13.9 13.6Glorious Property 845 HK 0.88 0.9 n.a. n.a. n.a. 17.7 10.8 7.3 6.3 11.0 9.1 41.0 19.0
Greenland 337 HK 2.83 1.0 4.7 4.1 9.3 11.9 6.7 3.2 7.6 44.8 28.2 21.6 8.6Hydoo Int'l 1396 HK 0.91 0.5 n.a. n.a. n.a. n.a. n.a. n.a. n.a. 5.5 5.9 7.8 7.0Modern Land (China) 1107 HK 1.46 0.5 3.7 3.3 n.a. n.a. n.a. n.a. n.a. n.a. 2.9 5.8 5.8Poly (Hong Kong) 119 HK 4.04 1.9 33.7 23.6 30.0 51.0 25.2 16.1 9.8 9.9 6.4 27.9Powerlong 1238 HK 3.53 1.8 5.7 4.9 n.a. 7.0 8.2 6.5 5.6 6.7 3.8 4.6 5.3Renhe Commercia l 1387 HK 0.17 1.0 n.a. n.a. 12.5 10.7 7.2 7.0 9.4 23.9 7.7 7.7 7.7Shui On Land* 272 HK 1.94 2.0 9.2 17.9 16.2 21.3 16.6 17.6 12.6 17.6 13.8 87.1 11.7SRE Group 1207 HK 0.18 0.5 n.a. n.a. 4.2 4.6 3.7 2.9 1.4 1.1 1.1 1.1 1.1Sunshine 100 China 2608 HK 3.18 1.0 n.a. n.a. n.a. n.a. n.a. n.a. n.a. n.a. 6.7 7.4 8.0Times Property 1233 HK 6.51 1.5 4.6 3.3 n.a. n.a. n.a. n.a. n.a. n.a. 3.5 3.2 3.6Wuzhou Int'l 1369 HK 0.67 0.2 n.a. n.a. n.a. n.a. n.a. n.a. n.a. n.a. 12.4 29.6 22.3Ying Li^ YINGLI SP 0.14 0.3 n.a. n.a. n.a. 196.2 331.2 42.9 13.0 16.1 14.7 16.4 15.3Zhong An 672 HK 2.48 0.9 n.a. n.a. 8.8 22.3 13.8 12.3 14.9 10.3 8.3 8.3 8.3Ave ra ge 9 .9 9 .6 12 .2 28 .1 32 .2 11 .9 8 .2 11 .1 8 .9 14 .5 8 .8
Ave ra ge (Ove ra l l ) 10 .1 8 .5 14 .0 23 .8 21 .6 10 .7 8 .8 10 .0 7 .7 11 .7 8 .8
^ Denominated in SGD for price
# Exclude Soho China
^^ FY16: 17F; FY17: FY18F; FY18: FY19F
Source: Thomson Reuters, *DBS Vickers

China / Hong Kong
China Property Weekly Digest
Page 14
PE valuations, 2008 to 2016 trough (based on reported earnings)
3-mth da i l yMkt tra d ing FY17F FY18F
Pric e Ca p va lue PE PE Avg Trough Trough Trough Trough Trough Trough Trough Trough TroughCompa ny Na me Code HK$ US$bn US$m x x PE (x) 2008 2009 2010 2011 2012 2013 2014 2015 2016China Overseas* 688 HK 26.5 37.2 68.3 8.9 8.2 9.6 9.9 10.0 8.9 5.3 5.3 6.4 5.1 6.1 5.6CR Land* 1109 HK 24.8 22.0 30.6 9.0 7.8 11.4 13.1 8.5 10.6 4.9 6.4 7.3 5.3 6.8 6.0China Vanke 'H'* 2202 HK 22.75 37.6 44.1 8.9 7.6 8.8 n.a. n.a. n.a. n.a. n.a. 6.5 6.3 8.6 6.7Country Garden* 2007 HK 10.5 28.7 48.0 14.3 10.7 13.9 11.3 9.2 6.3 4.3 5.2 5.8 4.4 4.9 4.4Evergrande* 3333 HK 21 35.2 124.7 20.1 9.4 5.3 n.a. 42.7 3.0 2.4 3.6 2.7 2.7 3.9 11.0Longfor* 960 HK 19.4 14.6 14.2 9.8 7.8 6.4 n.a. 11.8 7.2 4.5 5.1 5.8 4.7 4.9 5.0Ave ra ge 11.8 8 .6 11 .4 16 .4 7 .2 4 .3 5 .1 5 .7 4 .7 5 .9 6 .4
Agile Property* 3383 HK 9.03 4.5 14.3 8.2 6.7 6.9 1.2 4.2 3.6 2.9 3.5 4.2 2.6 8.6 5.1BJ Cap Land 'H' 2868 HK 4.06 2.6 1.5 6.5 4.9 7.0 2.3 2.4 3.6 2.3 2.0 2.8 2.5 2.7 3.3CIFI Holdings 884 HK 4.23 3.7 9.2 6.7 5.5 3.7 n.a. n.a. n.a. n.a. 2.4 2.9 3.6 3.7 2.8Greentown 3900 HK 10.32 2.9 7.5 10.2 9.7 10.0 4.2 2.8 6.6 1.7 0.9 3.9 6.7 18.8 6.2Guangzhou R&F 2777 HK 13.86 5.7 14.6 5.1 4.6 6.9 3.3 6.3 6.6 3.7 2.7 3.4 4.0 3.3 3.1Hopson Dev 754 HK 7.52 2.1 0.6 21.8 19.8 6.0 1.1 0.8 2.3 4.6 2.1 3.9 5.1 7.0 3.7Kaisa Group 1638 HK 2.99 2.0 6.5 n.a. n.a. 3.4 n.a. 16.2 1.6 2.8 2.5 2.2 n.a. n.a. (11.3)KWG Property 1813 HK 5.68 2.3 9.2 4.3 3.8 6.7 5.8 3.5 6.0 2.2 2.0 2.6 2.2 3.2 3.1Logan Property 3380 HK 6.77 4.8 9.6 8.0 6.2 3.7 n.a. n.a. n.a. n.a. n.a. 3.6 3.6 3.6 2.2Shimao Property* 813 HK 14.90 6.5 9.9 8.2 7.5 9.3 11.4 3.1 6.6 2.7 3.0 4.9 4.8 4.9 4.6Sino-Ocean Land* 3377 HK 4.27 4.1 4.8 6.8 6.2 10.0 4.5 8.3 9.5 5.2 4.1 5.1 5.4 11.6 5.3Soho China* 410 HK 4.2 2.8 6.9 48.2 53.5 15.5 n.a. n.a. n.a. n.a. n.a. n.a. n.a. 25.3 15.0Sunac China 1918 HK 20.1 10.0 77.2 24.0 11.4 4.6 n.a. n.a. n.a. 1.3 1.5 3.8 3.1 3.6 5.3Yanlord Land*^ YLLG SP 1.785 2.5 3.3 6.6 5.6 9.2 4.1 4.2 7.9 4.7 4.9 7.3 6.8 5.8 3.4Yuexiu Property* 123 HK 1.45 2.3 5.8 11.9 9.9 8.0 3.4 (4.6) 8.0 1.1 2.5 4.2 4.9 12.6 6.4Yuzhou Properties 1628 HK 4.46 2.2 4.8 5.9 4.8 4.0 n.a. 2.6 3.6 2.6 4.2 2.8 3.4 3.0 3.0Ave ra ge # 9.6 7 .7 4 .3 4 .7 6 .0 3 .0 2 .8 3 .9 4 .1 6 .4 3 .5
BJ North Star 'H' 588 HK 3.19 1.4 0.8 n.a. n.a. 7.9 1.6 1.9 4.6 2.3 3.1 5.4 5.8 7.8 7.3C C Land 1224 HK 1.81 0.9 0.3 n.a. n.a. 24.7 n.a. n.a. n.a. n.a. n.a. n.a. n.a. 3.2 (14.2)Central China* 832 HK 2.32 0.7 0.7 5.9 5.2 5.2 1.1 2.4 5.1 3.7 3.3 3.8 3.9 3.7 6.6China SCE 1966 HK 3.81 1.7 5.5 6.7 4.4 4.8 n.a. n.a. 4.0 4.1 5.1 4.4 4.5 4.6 2.2China South City*^^ 1668 HK 1.7 1.7 4.4 18.1 15.6 6.1 n.a. n.a. n.a. 3.6 2.9 3.1 4.3 3.6 2.5COGO* 81 HK 4.45 1.3 3.6 7.3 5.5 7.8 32.9 (3.5) 2.9 2.9 4.0 5.3 6.8 5.9 5.0First Sponsor*^ FSG SP 1.36 0.6 0.1 14.8 13.1 2.4 n.a. n.a. n.a. n.a. n.a. n.a. 13.8 8.8 8.1Glorious Property 845 HK 0.88 0.9 0.4 n.a. n.a. 4.5 n.a. 6.7 3.7 2.9 5.7 23.6 (2.2) (1.4) (1.1)Greenland 337 HK 2.83 1.0 1.8 4.7 4.1 9.5 2.4 1.0 2.9 1.2 (1.1) 71.8 22.8 13.0 4.0Hydoo Int'l 1396 HK 0.91 0.5 0.3 n.a. n.a. 11.9 n.a. n.a. n.a. n.a. n.a. n.a. 10.1 5.1 5.0Modern Land (China) 1107 HK 1.46 0.5 0.2 3.7 3.3 3.5 n.a. n.a. n.a. n.a. n.a. 2.5 2.9 3.1 2.4Poly (Hong Kong) 119 HK 4.04 1.9 5.3 33.7 23.6 12.1 11.4 5.0 11.5 2.9 4.2 5.2 11.1 (2.5) 85.5Powerlong 1238 HK 3.53 1.8 1.7 5.7 4.9 2.6 n.a. 2.6 2.8 1.1 1.8 3.2 2.4 1.8 1.8Renhe Commercia l 1387 HK 0.172 1.0 0.2 n.a. n.a. n.a. 7.8 4.8 6.0 2.5 5.2 (3.6) (3.2) (2.3) (0.5)Shui On Land* 272 HK 1.94 2.0 2.9 9.2 17.9 8.9 1.6 2.1 4.2 1.9 5.1 5.9 6.5 13.1 10.4SRE Group 1207 HK 0.182 0.5 0.1 n.a. n.a. 7.0 3.2 1.5 3.6 2.7 3.8 6.7 (10.6) (0.6) (12.9)Sunshine 100 China 2608 HK 3.18 1.0 0.2 n.a. n.a. 12.9 n.a. n.a. n.a. n.a. n.a. n.a. 5.7 8.3 30.8Times Property 1233 HK 6.51 1.5 2.9 4.6 3.3 2.9 n.a. n.a. n.a. n.a. n.a. 3.6 3.2 2.5 2.0Wuzhou Int'l 1369 HK 0.67 0.2 0.2 n.a. n.a. 10.3 n.a. n.a. n.a. n.a. n.a. 3.7 18.4 (5.7) 32.1Ying Li^ YINGLI SP 0.143 0.3 0.3 n.a. n.a. n.a. 1.8 32.6 18.6 7.8 6.8 18.4 9.5 12.1 18.4Zhong An 672 HK 2.48 0.9 2.9 n.a. n.a. 10.8 4.2 3.4 8.6 5.5 4.2 5.1 5.2 3.6 10.1Ave ra ge 9 .9 9 .6 5 .7 4 .7 6 .1 3 .2 4 .0 9 .2 6 .2 4 .3 9 .0
Ave ra ge (Ove ra l l ) 10 .1 8 .5 5 .7 6 .4 6 .2 3 .3 3 .7 6 .6 5 .3 5 .3 6 .7HSI Inde x HSI 9 .1 9 .0 10 .3 7 .8 8 .8 9 .4 9 .3 10 .4 8 .9
1-Aug
^ Denominated in SGD for price
# Exclude Soho China
^^ FY16: 17F; FY17: FY18F; FY18: FY19F
Source: Thomson Reuters, *DBS Vickers

China / Hong Kong
China Property Weekly Digest
Page 15
PE valuations, 2008 to 2016 peak (based on reported earnings)
3-mth da i l yM kt tra d ing FY17F FY18F
Pr i c e Ca p va lue PE PE Avg Pe a k Pe a k Pe a k Pe a k Pe a k Pe a k Pe a k Pe a k Pe a kCompa ny Na me Code HK$ US$bn US$m x x PE (x) 2008 2009 2010 2011 2012 2013 2014 2015 2016China Overseas* 688 HK 26.5 37.2 68.3 8.9 8.2 9.6 25.2 20.6 11.6 9.4 10.1 8.7 6.9 9.3 7.6CR Land* 1109 HK 24.8 22.0 30.6 9.0 7.8 11.4 35.6 21.6 14.5 10.2 11.5 9.3 7.8 10.9 8.4China Vanke 'H'* 2202 HK 22.75 37.6 44.1 8.9 7.6 8.8 n.a. n.a. n.a. n.a. n.a. 9.9 10.5 12.5 10.9Country Garden* 2007 HK 10.5 28.7 48.0 14.3 10.7 13.9 86.8 25.3 10.6 9.0 8.2 9.5 7.2 8.6 7.1Evergrande* 3333 HK 21 35.2 124.7 20.1 9.4 5.3 n.a. 52.1 7.0 6.6 6.3 4.5 3.9 9.9 15.9Longfor* 960 HK 19.4 14.6 14.2 9.8 7.8 6.4 n.a. 14.8 11.7 9.2 10.2 8.7 6.3 8.3 7.0Ave ra ge 11.8 8 .6 49 .2 26 .9 11 .1 8 .9 9 .3 8 .4 7 .1 9 .9 9 .5
Agile Property* 3383 HK 9.03 4.5 14.3 8.2 6.7 6.9 7.9 20.9 6.1 9.6 5.9 7.2 5.7 17.3 7.3BJ Cap Land 'H' 2868 HK 4.06 2.6 1.5 6.5 4.9 7.0 21.7 13.2 6.3 5.4 4.7 4.0 3.3 7.1 4.6CIFI Holdings 884 HK 4.23 3.7 9.2 6.7 5.5 3.7 n.a. n.a. n.a. n.a. 2.6 4.6 4.7 7.2 5.5Greentown 3900 HK 10.32 2.9 7.5 10.2 9.7 10.0 30.5 18.9 10.7 5.2 4.3 6.2 12.7 42.0 9.5Guangzhou R&F 2777 HK 13.86 5.7 14.6 5.1 4.6 6.9 28.6 20.6 10.2 8.3 6.0 5.2 6.0 5.3 5.7Hopson Dev 754 HK 7.52 2.1 0.6 21.8 19.8 6.0 16.2 4.1 3.9 11.7 7.3 8.2 7.1 14.0 5.0Kaisa Group 1638 HK 2.99 2.0 6.5 n.a. n.a. 3.4 n.a. 20.2 3.2 7.0 4.8 3.9 n.a. n.a. (11.3)KWG Property 1813 HK 5.68 2.3 9.2 4.3 3.8 6.7 n.a. 18.2 11.0 6.4 4.5 4.5 4.3 5.8 4.2Logan Property 3380 HK 6.77 4.8 9.6 8.0 6.2 5.7 n.a. n.a. n.a. n.a. n.a. 3.7 4.5 5.5 3.8Shimao Property* 813 HK 14.90 6.5 9.9 8.2 7.5 9.3 63.7 14.2 9.6 6.7 7.4 7.6 6.8 10.1 6.8Sino-Ocean Land* 3377 HK 4.27 4.1 4.8 6.8 6.2 10.0 25.5 22.5 16.2 12.8 8.5 8.3 7.3 20.1 8.8Soho China* 410 HK 4.2 2.8 6.9 48.2 53.5 15.5 n.a. 6.7 7.9 8.0 2.4 3.8 7.2 52.1 23.7Sunac China 1918 HK 20.1 10.0 77.2 24.0 11.4 4.6 n.a. n.a. n.a. 3.2 5.4 6.0 6.9 9.8 8.2Yanlord Land*^ YLLG SP 1.785 2.5 3.3 6.6 5.6 9.2 27.4 17.6 11.0 11.6 8.0 10.4 8.1 8.3 5.1Yuexiu Property* 123 HK 1.45 2.3 5.8 11.9 9.9 8.0 20.2 n.a. 12.0 2.5 5.7 6.8 6.5 22.2 9.4Yuzhou Properties 1628 HK 4.46 2.2 4.8 5.9 4.8 4.0 n.a. 3.2 4.7 4.6 7.1 4.1 4.5 5.0 5.5Ave ra ge # 9.6 7 .7 26 .9 16 .3 9 .3 7 .4 6 .1 6 .1 6 .2 12 .5 5 .8
BJ North Star 'H' 588 HK 3.19 1.4 0.8 n.a. n.a. 7.9 12.7 6.1 6.9 5.2 5.7 7.7 9.8 15.5 10.2C C Land 1224 HK 1.81 0.9 0.3 n.a. n.a. 24.7 n.a. n.a. 36.3 26.6 13.5 15.9 4.7 5.8 (18.3)Central China* 832 HK 2.32 0.7 0.7 5.9 5.2 5.2 6.7 11.0 7.4 6.6 6.3 6.1 5.9 7.1 9.9China SCE 1966 HK 3.81 1.7 5.5 6.7 4.4 4.8 n.a. n.a. 5.9 6.1 6.3 5.8 5.9 6.2 3.8China South City*^^ 1668 HK 1.7 1.7 4.4 18.1 15.6 6.1 n.a. n.a. n.a. 5.8 4.3 7.0 9.7 8.6 3.5COGO* 81 HK 4.45 1.3 3.6 7.3 5.5 7.8 188.9 n.a. 4.9 8.0 8.9 9.2 13.3 14.1 7.3First Sponsor*^ FSG SP 1.36 0.6 0.1 14.8 13.1 2.4 n.a. n.a. n.a. n.a. n.a. n.a. 16.6 9.7 9.2Glorious Property 845 HK 0.88 0.9 0.4 n.a. n.a. 4.5 n.a. 8.8 6.3 8.5 10.1 39.2 (3.8) (2.3) (2.2)Greenland 337 HK 2.83 1.0 1.8 4.7 4.1 9.5 39.3 7.2 4.9 4.2 (1.8) 364.4 48.0 36.7 7.2Hydoo Int'l 1396 HK 0.91 0.5 0.3 n.a. n.a. 11.9 n.a. n.a. n.a. n.a. n.a. n.a. 28.2 12.4 11.5Modern Land (China) 1107 HK 1.46 0.5 0.2 3.7 3.3 3.5 n.a. n.a. n.a. n.a. n.a. 3.4 3.7 6.5 6.2Poly (Hong Kong) 119 HK 4.04 1.9 5.3 33.7 23.6 12.1 59.7 40.1 18.6 10.8 8.3 9.1 16.4 (6.8) 121.8Powerlong 1238 HK 3.53 1.8 1.7 5.7 4.9 2.6 n.a. 3.0 3.7 3.2 3.1 5.4 4.0 3.5 3.7Renhe Commercia l 1387 HK 0.172 1.0 0.2 n.a. n.a. n.a. 9.3 9.1 9.4 5.7 17.4 (8.4) (5.5) (7.3) (0.9)Shui On Land* 272 HK 1.94 2.0 2.9 9.2 17.9 8.9 11.7 7.8 6.3 4.7 9.1 10.4 9.6 24.7 14.6SRE Group 1207 HK 0.182 0.5 0.1 n.a. n.a. 7.0 20.7 4.7 4.8 6.7 6.8 13.3 (13.9) (2.7) (24.3)Sunshine 100 China 2608 HK 3.18 1.0 0.2 n.a. n.a. 12.9 n.a. n.a. n.a. n.a. n.a. n.a. 7.9 13.0 38.5Times Property 1233 HK 6.51 1.5 2.9 4.6 3.3 2.9 n.a. n.a. n.a. n.a. n.a. 3.7 3.9 3.8 3.1Wuzhou Int'l 1369 HK 0.67 0.2 0.2 n.a. n.a. 10.3 n.a. n.a. n.a. n.a. n.a. 4.2 32.2 (15.0) 35.8Ying Li^ YINGLI SP 0.143 0.3 0.3 n.a. n.a. n.a. 4.8 112.2 33.8 17.6 11.5 26.6 17.7 27.1 26.6Zhong An 672 HK 2.48 0.9 2.9 n.a. n.a. 10.8 29.4 15.4 12.4 10.4 7.2 9.1 16.6 6.1 13.2Ave ra ge 9.9 9 .6 33 .1 19 .8 11 .2 8 .4 7 .8 26 .5 10 .8 8 .0 12 .2
Ave ra ge (Ove ra l l ) 10 .1 8 .5 32 .4 19 .5 10 .5 8 .1 7 .3 16 .1 8 .7 9 .8 9 .5HSI Inde x HSI 23 .1 18 .2 13 .6 11 .7 11 .0 11 .3 11 .1 14 .3 11 .7
1 -Aug
^ Denominated in SGD for price # Exclude Soho China
^^ FY16: 17F; FY17: FY18F; FY18: FY19F
Source: Thomson Reuters, *DBS Vickers

China / Hong Kong
China Property Weekly Digest
Page 16
Share price performance
Price Pe rformance 20071-wk 2-wk 1-mth 2-mth 3-mth 4-mth 5-mth 6-mth YTD 1-yr 2012 2013 2014 2015 2016 high
% % % % % % % % % % % % % % % %Tie r 1 playe rsChina Overseas 688 HK 3.5 3.3 16.0 13.0 17.3 19.4 11.8 14.2 29.0 2.1 78.0 (5.6) 5.7 21.5 (24.4) 41.2CR Land 1109 HK 3.5 1.8 9.0 8.1 14.8 18.1 18.7 26.5 42.2 26.9 69.1 (8.9) 6.4 14.2 (22.8) 19.8China Vanke 'H' 2202 HK 2.9 (1.9) 2.9 11.5 15.2 8.3 15.7 14.9 28.5 26.7 n.a. n.a. n.a. 32.4 (22.7) n.a.Country Garden 2007 HK 10.5 15.5 16.0 12.5 41.9 50.2 85.5 136.5 141.9 227.1 46.4 15.3 (32.8) 2.6 36.5 (18.7)Evergrande 3333 HK 18.6 33.2 49.8 46.6 152.7 191.7 259.6 283.9 334.8 327.7 32.0 (30.4) 6.1 117.2 (29.2) n.a.Longfor Properties 960 HK 3.1 7.1 15.6 21.3 43.9 51.8 55.9 72.3 97.2 79.6 72.9 (28.6) (7.8) 15.7 (14.9) n.a.Ave rage 7.0 9.8 18.2 18.8 47.6 56.6 74.5 91.4 112.3 115.0 59.7 (11.6) (4.5) 33.9 (12.9) 14.1
Tie r 2 playe rsAgile Property 3383 HK 5.0 12.3 26.3 25.1 29.7 34.2 76.0 117.1 128.6 100.7 56.6 (23.8) (46.9) (2.0) (8.6) (54.1)BJ Cap. Land 2868 HK (1.7) (0.2) 9.4 10.9 7.4 15.7 20.8 31.8 39.5 37.2 110.5 (18.0) 11.4 20.7 (18.0) (45.6)CIFI Holdings 884 HK 11.3 14.6 21.9 38.7 50.5 40.1 62.7 88.8 102.4 110.4 n.a. 17.1 (6.1) 12.3 20.8 n.a.Greentown 3900 HK 3.8 5.2 20.0 26.6 38.0 39.5 47.2 61.8 64.3 83.0 321.4 (16.6) (35.0) 0.0 (18.4) (47.2)GZ R&F 2777 HK 2.7 8.8 14.2 9.5 5.8 14.2 28.6 38.3 47.8 19.3 110.1 (12.1) (16.3) 0.6 (1.8) (68.1)Hopson Dev 754 HK (1.1) (2.2) 2.5 2.3 1.3 5.2 8.0 7.9 8.8 5.2 207.2 (24.6) (24.0) 8.7 (10.5) (75.9)Kaisa Group 1638 HK (7.7) (8.6) 21.1 13.7 28.3 8.7 91.7 91.7 91.7 91.7 79.1 4.2 (36.4) (1.9) 0.0 n.a.KWG 1813 HK 1.2 3.6 8.6 (7.9) (3.4) 0.9 18.8 27.6 29.1 19.6 122.2 (26.1) 33.5 13.1 (17.8) (55.2)Logan Property 3380 HK 1.3 6.4 31.5 40.5 51.8 65.1 100.9 108.3 131.1 126.4 n.a. n.a. 10.0 9.1 11.4 n.a.Shimao Property 813 HK 0.7 6.7 11.5 12.0 19.2 20.7 33.5 42.4 46.9 46.1 120.5 21.9 (2.7) (20.5) (26.4) (48.7)Sino-Ocean 3377 HK 2.9 8.4 11.8 10.3 12.4 17.0 9.5 26.0 23.1 28.6 60.8 (12.1) (13.4) 12.7 (30.2) (71.5)SOHO China 410 HK (0.2) 1.9 9.1 8.5 (0.9) 1.0 4.2 6.9 9.9 11.4 20.3 7.4 (18.0) (31.4) 1.6 (64.8)Sunac China 1918 HK 8.1 26.1 23.2 56.8 98.2 99.4 149.1 191.3 211.6 313.6 272.7 (22.5) 69.7 (24.0) 7.5 n.a.Yanlord Land YLLG SP (1.1) 2.0 1.7 (4.0) (4.3) (1.7) 19.0 27.0 35.2 50.0 59.2 (19.4) (15.1) (3.4) 31.3 (57.7)Yuexiu Property 123 HK 0.0 2.8 9.0 6.6 9.8 9.8 15.1 26.1 36.8 43.6 118.8 (22.0) (16.8) (10.1) (20.9) (49.7)Yuzhou Properties 1628 HK (0.9) 1.6 (3.5) 12.6 25.6 37.7 65.2 72.9 65.2 92.2 37.1 2.9 1.0 7.7 28.6 n.a.Ave rage 1.6 5.4 12.9 16.7 22.9 25.2 44.8 57.6 64.3 69.7 119.3 (9.1) (8.1) 4.1 (4.8) (56.6)
Tie r 3 playe rsBJ North Star 588 HK 3.2 1.3 (3.3) 0.0 6.0 10.8 13.5 30.2 34.0 31.8 82.6 (16.7) 41.1 3.6 (7.0) (59.6)C C Land 1224 HK 4.6 2.3 1.7 (6.7) (9.5) (12.1) (22.5) (23.2) (18.8) (10.4) 88.9 (28.3) (30.7) 79.2 (6.6) (89.0)Central China 832 HK (2.9) 10.0 31.1 28.2 22.1 20.8 30.3 35.7 37.3 52.6 76.8 (12.8) (26.8) (7.4) 4.3 n.a.China SCE Property 1966 HK 1.6 3.3 7.3 27.9 29.6 30.0 36.6 53.0 63.5 128.1 20.2 16.2 (12.4) 8.0 33.1 n.a.China South City 1668 HK 0.0 8.3 17.2 15.6 11.8 6.3 5.6 3.0 4.9 5.6 17.0 88.0 60.9 (50.6) (7.4) n.a.COGO 81 HK 0.5 0.9 6.7 7.7 11.5 8.5 56.1 66.7 75.9 98.7 105.6 (20.7) (46.7) (16.8) (22.9) (2.0)First Sponsor FSG SP 0.0 (0.7) 3.0 2.3 2.3 0.0 3.0 1.9 1.9 7.1 n.a. n.a. n.a. 0.8 6.0 n.a.Glorious Property 845 HK (7.4) 2.3 3.5 1.1 (3.3) 1.1 (2.2) 15.8 15.8 18.9 7.4 14.4 (28.1) (25.0) (15.6) n.a.Greenland 337 HK (0.7) (4.4) 5.6 1.4 12.7 35.4 28.6 63.6 46.6 20.9 53.5 90.4 (18.3) (1.9) (36.1) (62.1)Hydoo Int'l 1396 HK 2.2 2.2 0.0 8.3 16.7 35.8 19.7 37.9 56.9 1.1 n.a. n.a. (13.5) (44.0) (46.3) n.a.Modern Land (China) 1107 HK 1.4 9.8 15.9 20.7 15.0 10.6 18.7 25.9 41.7 44.6 n.a. n.a. 1.6 98.4 (53.2) n.a.Poly HK 119 HK 7.4 12.2 17.8 21.3 26.6 24.7 23.9 32.5 57.2 93.3 79.8 (31.7) (22.9) (20.7) 1.6 (64.7)Powerlong 1238 HK (1.9) 0.0 5.1 4.7 (3.6) 19.7 33.7 53.5 54.8 97.2 58.7 0.6 (34.3) 50.5 39.0 n.a.Renhe Commercial 1387 HK (1.1) 6.8 (1.7) (9.9) (13.6) (11.8) (18.9) (14.0) (13.6) (13.6) (8.9) (38.9) (28.1) 5.9 (44.7) n.a.Shui On Land 272 HK 1.0 7.2 2.6 1.0 12.1 10.9 12.8 19.8 16.2 (7.2) 58.9 (31.1) (23.1) 16.4 (21.6) (80.3)SRE Group 1207 HK 0.0 1.7 1.1 (1.6) (3.2) (6.7) (9.0) (8.1) (8.5) (21.2) 24.2 (32.9) (20.8) 73.8 (45.5) (94.7)Sunshine 100 China 2608 HK (0.6) (2.2) 9.7 (3.3) 5.3 (2.8) (7.8) 7.4 (14.1) (3.3) n.a. n.a. n.a. 21.7 4.8 n.a.Times Property 1233 HK 1.7 10.3 33.4 29.2 20.1 18.4 37.9 62.3 71.8 110.0 n.a. n.a. (5.7) (18.2) 40.4 n.a.Wuzhou Int'l 1369 HK (10.7) (16.3) (18.3) (10.7) (15.2) (14.1) (14.1) (14.1) (14.1) (13.0) n.a. n.a. 14.0 (44.9) (3.7) n.a.Ying Li YINGLI SP 2.1 0.7 8.3 6.7 2.1 (7.7) (11.2) (12.8) (4.0) 5.9 45.1 6.8 (38.0) (32.2) (10.2) (88.1)Zhong An 672 HK 0.0 21.6 49.4 254.3 281.5 281.5 281.5 306.6 287.5 259.4 7.5 26.3 (20.8) (28.9) (21.0) (57.1)Ave rage 0.5 3.9 9.6 17.3 18.3 20.5 23.9 34.8 38.2 43.6 48.1 0.8 (13.5) 2.3 (7.9) (63.1)
Ave rage (Ove ra l l ) 1.7 5.2 11.9 17.3 23.7 26.8 38.0 50.4 57.2 62.3 78.8 (4.9) (10.4) 6.9 (7.4) (51.8)
Hang Seng Index 2.6 3.8 6.9 6.7 11.9 14.2 15.8 18.1 25.2 24.5 22.9 2.9 1.3 (7.2) 0.4 (13.0)MSCI China 2.1 3.5 8.4 9.3 15.9 19.1 21.5 26.1 34.7 35.5 18.7 0.4 4.7 (10.1) (1.4) (24.2)
Source: Thomson Reuters

China / Hong Kong
China Property Weekly Digest
Page 17
Historical valuations
1 -Au gCo mp a n y n a me
Co d e Pr i c eHK$
Cu rre n t H i s t a vg
+ 1 s .d .
- 1 s .d .
Cu rre n t(FY1 7 )
H i s t a vg
+ 1 s .d .
- 1 s .d . Cu rre nt
H i s t a vg
+ 1 s .d .
- 1 s .d .
Agile Property 3383 HK 9.03 44.7 54.8 33.7 75.9 8.2 6.9 8.9 4.8 0.7 1.2 2.1 0.4C C Land 1224 HK 1.81 34.6 56.2 35.1 77.4 n.a . 24.7 189.8 (140.5) 0.4 0.8 3.0 (1.4)Centra l China 832 HK 2.32 53.3 67.3 60.5 74.1 5.9 5.2 6.5 3.9 0.8 0.7 0.9 0.5China Overseas 688 HK 26.50 (1.8) 13.8 (2.5) 30.0 8.9 9.6 14.4 4.9 1.2 1.7 2.5 1.0China Vanke-H 2202 HK 22.75 0.9 13.7 5.7 21.7 8.9 5.2 6.5 3.9 1.9 0.7 0.9 0.5China Vanke-A* 000002 CH 23.42 (13.2) (10.4) (33.5) 12.6 10.5 9.6 14.4 4.9 2.3 1.7 2.5 1.0COGO 81 HK 4.45 38.1 52.7 34.9 70.5 7.3 7.8 18.5 (2.9) 0.8 0.8 1.3 0.2Country Garden 2007 HK 10.50 (12.4) 29.4 9.1 49.8 14.3 13.9 31.5 (3.6) 2.9 1.9 3.4 0.3CR Land 1109 HK 24.80 11.5 29.1 15.1 43.0 9.0 11.4 17.9 4.8 1.5 1.3 1.7 0.8China Eve rgrande 3333 HK 21.00 (14.8) 49.4 22.3 76.5 20.1 5.3 7.8 2.9 5.6 1.3 1.7 0.8First Sponsor FSG SP 1.36 66.8 n.a . n.a . n.a . 14.8 2.4 2.7 2.1 0.4 0.4 2.2 (1.4)Longfor 960 HK 19.40 14.4 38.3 30.7 45.9 9.8 6.4 7.5 5.4 1.6 1.3 1.8 0.9Shimao Property 813 HK 14.90 47.8 42.6 25.2 60.0 8.2 9.3 18.1 0.5 0.8 1.2 1.8 0.6Shui On Land 272 HK 1.94 62.1 57.6 47.7 67.5 9.2 8.9 12.4 5.4 0.4 0.6 1.1 0.2Sino-Ocean Land 3377 HK 4.27 44.5 41.3 21.3 61.4 6.8 10.0 14.9 5.0 0.6 0.8 1.2 0.4SOHO China 410 HK 4.20 41.4 38.4 18.3 58.6 48.2 15.5 31.8 (0.9) 0.5 0.8 1.2 0.5Greenland 337 HK 2.83 50.6 44.3 15.2 73.5 4.7 9.5 18.4 0.6 0.8 0.9 1.5 0.4Yanlord Land^ YLLG SP 1.79 43.3 41.9 25.8 58.0 6.6 9.2 14.5 4.0 0.8 1.1 1.9 0.3Yuexiu Property 123 HK 1.45 47.0 57.7 51.7 63.8 11.9 8.0 12.9 3.2 0.5 0.6 0.8 0.4Se c to r a ve ra g e 3 5 .0 * * 4 5 .9 ~ 3 9 .1 ~ 5 2 .8 ~ 1 0 .1 6 .5 ~ 7 .6 ~ 5 .5 ~ 1 .0 0 .8 ~ 0 .9 ~ 0 .6 ~
NAV d i s c o u n t / (p re miu m) (% ) PE (x) PB (x)
* Share price denominated in RMB
^ Share price denominated in SGD
** Exclude Soho China
~ 2010-YTD
Source: Thomson Reuters, DBS Vickers

China / Hong Kong
China Property Weekly Digest
Page 18
DBSVHK recommendations are based an Absolute Total Return* Rating system, defined as follows:
STRONG BUY (>20% total return over the next 3 months, with identifiable share price catalysts within this time frame)
BUY (>15% total return over the next 12 months for small caps, >10% for large caps)
HOLD (-10% to +15% total return over the next 12 months for small caps, -10% to +10% for large caps)
FULLY VALUED (negative total return i.e. > -10% over the next 12 months)
SELL (negative total return of > -20% over the next 3 months, with identifiable catalysts within this time frame)
* Share price appreciation + dividends Completed Date: 2 Aug 2017 08:45:36 (HKT) Dissemination Date: 2 Aug 2017 10:09:32 (HKT)
Sources for all charts and tables are DBS Vickers unless otherwise specified.
GENERAL DISCLOSURE/DISCLAIMER This report is prepared by DBS Vickers (Hong Kong) Limited (“DBSV HK”). This report is solely intended for the clients of DBS Bank Ltd., DBS Bank (Hong Kong) Limited (DBS HK), DBSV HK, and DBS Vickers Securities (Singapore) Pte Ltd. (“DBSVS”), its respective connected and associated corporations and affiliates only and no part of this document may be (i) copied, photocopied or duplicated in any form or by any means or (ii) redistributed without the prior written consent of DBSV HK. The research set out in this report is based on information obtained from sources believed to be reliable, but we (which collectively refers to DBS Bank Ltd., DBS HK, DBSV HK, DBSVS, its respective connected and associated corporations, affiliates and their respective directors, officers, employees and agents (collectively, the “DBS Group”) have not conducted due diligence on any of the companies, verified any information or sources or taken into account any other factors which we may consider to be relevant or appropriate in preparing the research. Accordingly, we do not make any representation or warranty as to the accuracy, completeness or correctness of the research set out in this report. Opinions expressed are subject to change without notice. This research is prepared for general circulation. Any recommendation contained in this document does not have regard to the specific investment objectives, financial situation and the particular needs of any specific addressee. This document is for the information of addressees only and is not to be taken in substitution for the exercise of judgement by addressees, who should obtain separate independent legal or financial advice. The DBS Group accepts no liability whatsoever for any direct, indirect and/or consequential loss (including any claims for loss of profit) arising from any use of and/or reliance upon this document and/or further communication given in relation to this document. This document is not to be construed as an offer or a solicitation of an offer to buy or sell any securities. The DBS Group, along with its affiliates and/or persons associated with any of them may from time to time have interests in the securities mentioned in this document. The DBS Group, may have positions in, and may effect transactions in securities mentioned herein and may also perform or seek to perform broking, investment banking and other banking services for these companies. Any valuations, opinions, estimates, forecasts, ratings or risk assessments herein constitutes a judgment as of the date of this report, and there can be no assurance that future results or events will be consistent with any such valuations, opinions, estimates, forecasts, ratings or risk assessments. The information in this document is subject to change without notice, its accuracy is not guaranteed, it may be incomplete or condensed, it may not contain all material information concerning the company (or companies) referred to in this report and the DBS Group is under no obligation to update the information in this report. This publication has not been reviewed or authorized by any regulatory authority in Singapore, Hong Kong or elsewhere. There is no planned schedule or frequency for updating research publication relating to any issuer. The valuations, opinions, estimates, forecasts, ratings or risk assessments described in this report were based upon a number of estimates and assumptions and are inherently subject to significant uncertainties and contingencies. It can be expected that one or more of the estimates on which the valuations, opinions, estimates, forecasts, ratings or risk assessments were based will not materialize or will vary significantly from actual results. Therefore, the inclusion of the valuations, opinions, estimates, forecasts, ratings or risk assessments described herein IS NOT TO BE RELIED UPON as a representation and/or warranty by the DBS Group (and/or any persons associated with the aforesaid entities), that: (a) such valuations, opinions, estimates, forecasts, ratings or risk assessments or their underlying assumptions will be achieved, and (b) there is any assurance that future results or events will be consistent with any such valuations, opinions, estimates, forecasts, ratings or risk
assessments stated therein. Please contact the primary analyst for valuation methodologies and assumptions associated with the covered companies or price targets. Any assumptions made in this report that refers to commodities, are for the purposes of making forecasts for the company (or companies) mentioned herein. They are not to be construed as recommendations to trade in the physical commodity or in the futures contract relating to the commodity referred to in this report. DBSVUSA, a US-registered broker-dealer, does not have its own investment banking or research department, has not participated in any public offering of securities as a manager or co-manager or in any other investment banking transaction in the past twelve months and does not engage in market-making.

China / Hong Kong
China Property Weekly Digest
Page 19
ANALYST CERTIFICATION The research analyst(s) primarily responsible for the content of this research report, in part or in whole, certifies that the views about the companies and their securities expressed in this report accurately reflect his/her personal views. The analyst(s) also certifies that no part of his/her compensation was, is, or will be, directly or indirectly, related to specific recommendations or views expressed in the report. The research analyst (s) primarily responsible for the content of this research report, in part or in whole, certifies that he or his associate1 does not serve as an officer of the issuer or the new listing applicant (which includes in the case of a real estate investment trust, an officer of the management company of the real estate investment trust; and in the case of any other entity, an officer or its equivalent counterparty of the entity who is responsible for the management of the issuer or the new listing applicant) and the research analyst(s) primarily responsible for the content of this research report or his associate does not have financial interests2 in relation to an issuer or a new listing applicant that the analyst reviews. DBS Group has procedures in place to eliminate, avoid and manage any potential conflicts of interests that may arise in connection with the production of research reports. The research analyst(s) responsible for this report operates as part of a separate and independent team to the investment banking function of the DBS Group and procedures are in place to ensure that confidential information held by either the research or investment banking function is handled appropriately. There is no direct link of DBS Group's compensation to any specific investment banking function of the DBS Group. COMPANY-SPECIFIC / REGULATORY DISCLOSURES 1. DBS Bank Ltd, DBS HK, DBSVS, DBSV HK or their subsidiaries and/or other affiliates have proprietary positions in China Overseas Land
& Investment Limited (688 HK), China Resources Land Limited (1109 HK), China Vanke Company Limited 'H' (2202 HK) and Sino-Ocean Land Holdings Limited (3377 HK) recommended in this report as of 28 Jul 2017. DBS Bank Ltd, DBS HK, DBSVS, DBSV HK or their subsidiaries and/or other affiliates have proprietary positions in Yanlord Land Group Limited (YLLG SP) and Ying Li International Real Estate Limited (YINGLI SP) recommended in this report as of 30 Jun 2017.
2. Neither DBS Bank Ltd, DBS HK nor DBSV HK market makes in equity securities of the issuer(s) or company(ies) mentioned in this Research Report.
3. Compensation for investment banking services: DBS Bank Ltd, DBS HK, DBSVS, DBSV HK, their subsidiaries and/or other affiliates of DBSVUSA have received compensation, within the past 12 months for investment banking services from Yanlord Land Group Limited (YLLG SP), Yuexiu Property Company Limited (123 HK), Central China Real Estate Limited (832 HK), China South City Holdings Limited (1668 HK) and China Overseas Grand Oceans Group (81 HK) as of 30 Jun 2017.
4. DBS Bank Ltd, DBS HK, DBSVS, DBSV HK, their subsidiaries and/or other affiliates of DBSVUSA have managed or co-managed a public offering of securities for Yanlord Land Group Limited (YLLG SP), Yuexiu Property Company Limited (123 HK), China South City Holdings Limited (1668 HK) and China Overseas Grand Oceans Group (81 HK) in the past 12 months, as of 30 Jun 2017. DBSVUSA does not have its own investment banking or research department, nor has it participated in any public offering of securities as a manager or co-manager or in any other investment banking transaction in the past twelve months. Any US persons wishing to obtain further information, including any clarification on disclosures in this disclaimer, or to effect a transaction in any security discussed in this document should contact DBSVUSA exclusively.
5. Disclosure of previous investment recommendation produced: DBS Bank Ltd, DBSVS, DBSVHK, their subsidiaries and/or other affiliates of DBSVUSA may have published other investment recommendations in respect of the same securities / instruments recommended in this research report during the preceding 12 months. Please contact the primary analyst listed in the first page of this report to view previous investment recommendations published by DBS Bank Ltd, DBSVHK, their subsidiaries and/or other affiliates of DBSVUSA in the preceding 12 months.
1 An associate is defined as (i) the spouse, or any minor child (natural or adopted) or minor step-child, of the analyst; (ii) the trustee of a trust of
which the analyst, his spouse, minor child (natural or adopted) or minor step-child, is a beneficiary or discretionary object; or (iii) another person accustomed or obliged to act in accordance with the directions or instructions of the analyst.
2 Financial interest is defined as interests that are commonly known financial interest, such as investment in the securities in respect of an issuer or a new listing applicant, or financial accommodation arrangement between the issuer or the new listing applicant and the firm or analysis. This term does not include commercial lending conducted at arm's length, or investments in any collective investment scheme other than an issuer or new listing applicant notwithstanding the fact that the scheme has investments in securities in respect of an issuer or a new listing applicant.

China / Hong Kong
China Property Weekly Digest
Page 20
RESTRICTIONS ON DISTRIBUTION
General This report is not directed to, or intended for distribution to or use by, any person or entity who is a citizen or resident of or located in any locality, state, country or other jurisdiction where such distribution, publication, availability or use would be contrary to law or regulation.
Australia This report is being distributed in Australia by DBS Bank Ltd. (“DBS”) or DBS Vickers Securities (Singapore) Pte Ltd (“DBSVS”). DBS holds Australian Financial Services Licence no. 475946.
DBSVS is exempted from the requirement to hold an Australian Financial Services Licence under the Corporation Act 2001 (“CA”) in respect of financial services provided to the recipients. Both DBS and DBSVS are regulated by the Monetary Authority of Singapore under the laws of Singapore, and DBSVHK is regulated by the Securities and Futures Commission of Hong Kong under the laws of Hong Kong, which differ from Australian laws.
Distribution of this report is intended only for “wholesale investors” within the meaning of the CA.
Hong Kong This report is being distributed in Hong Kong by DBS Bank Ltd, DBS Bank (Hong Kong) Limited and DBS Vickers (Hong Kong) Limited, all of which are registered with or licensed by the Hong Kong Securities and Futures Commission to carry out the regulated activity of advising on securities.
Indonesia This report is being distributed in Indonesia by PT DBS Vickers Sekuritas Indonesia.
Malaysia This report is distributed in Malaysia by AllianceDBS Research Sdn Bhd ("ADBSR"). Recipients of this report, received from ADBSR are to contact the undersigned at 603-2604 3333 in respect of any matters arising from or in connection with this report. In addition to the General Disclosure/Disclaimer found at the preceding page, recipients of this report are advised that ADBSR (the preparer of this report), its holding company Alliance Investment Bank Berhad, their respective connected and associated corporations, affiliates, their directors, officers, employees, agents and parties related or associated with any of them may have positions in, and may effect transactions in the securities mentioned herein and may also perform or seek to perform broking, investment banking/corporate advisory and other services for the subject companies. They may also have received compensation and/or seek to obtain compensation for broking, investment banking/corporate advisory and other services from the subject companies.
Wong Ming Tek, Executive Director, ADBSR
Singapore This report is distributed in Singapore by DBS Bank Ltd (Company Regn. No. 196800306E) or DBSVS (Company Regn No. 198600294G), both of which are Exempt Financial Advisers as defined in the Financial Advisers Act and regulated by the Monetary Authority of Singapore. DBS Bank Ltd and/or DBSVS, may distribute reports produced by its respective foreign entities, affiliates or other foreign research houses pursuant to an arrangement under Regulation 32C of the Financial Advisers Regulations. Where the report is distributed in Singapore to a person who is not an Accredited Investor, Expert Investor or an Institutional Investor, DBS Bank Ltd accepts legal responsibility for the contents of the report to such persons only to the extent required by law. Singapore recipients should contact DBS Bank Ltd at 6327 2288 for matters arising from, or in connection with the report.
Thailand This report is being distributed in Thailand by DBS Vickers Securities (Thailand) Co Ltd. Research reports distributed are only intended for institutional clients only and no other person may act upon it.
United Kingdom
This report is produced by DBSVHK which is regulated by the Hong Kong Securities and Futures Commission This report is disseminated in the United Kingdom by DBS Vickers Securities (UK) Ltd (“DBSVUK”). DBSVUK is authorised and regulated by the Financial Conduct Authority in the United Kingdom. In respect of the United Kingdom, this report is solely intended for the clients of DBSVUK, its respective connected and associated corporations and affiliates only and no part of this document may be (i) copied, photocopied or duplicated in any form or by any means or (ii) redistributed without the prior written consent of DBSVUK. This communication is directed at persons having professional experience in matters relating to investments. Any investment activity following from this communication will only be engaged in with such persons. Persons who do not have professional experience in matters relating to investments should not rely on this communication.
Dubai International Financial Centre
This research report is being distributed by DBS Bank Ltd., (DIFC Branch) having its office at PO Box 506538, 3rd Floor, Building 3, East Wing, Gate Precinct, Dubai International Financial Centre (DIFC), Dubai, United Arab Emirates. DBS Bank Ltd., (DIFC Branch) is regulated by The Dubai Financial Services Authority. This research report is intended only for professional clients (as defined in the DFSA rulebook) and no other person may act upon it.
United Arab Emirates
This report is provided by DBS Bank Ltd (Company Regn. No. 196800306E) which is an Exempt Financial Adviser as defined in the Financial Advisers Act and regulated by the Monetary Authority of Singapore. This report is for information purposes only and should not be relied upon or acted on by the recipient or considered as a solicitation or inducement to buy or sell any financial product. It does not constitute a personal recommendation or take into account the particular investment objectives, financial situation, or needs of individual clients. You should contact your relationship manager or investment adviser if you need advice on the merits of buying, selling or holding a particular investment. You should note that the information in this report may be out of date and it is not represented or warranted to be accurate, timely or complete. This report or any portion thereof may not be reprinted, sold or redistributed without our written consent.

China / Hong Kong
China Property Weekly Digest
Page 21
United States This report was prepared by DBSVHK. DBSVUSA did not participate in its preparation. The research analyst(s) named on this report are not registered as research analysts with FINRA and are not associated persons of DBSVUSA. The research analyst(s) are not subject to FINRA Rule 2241 restrictions on analyst compensation, communications with a subject company, public appearances and trading securities held by a research analyst. This report is being distributed in the United States by DBSVUSA, which accepts responsibility for its contents. This report may only be distributed to Major U.S. Institutional Investors (as defined in SEC Rule 15a-6) and to such other institutional investors and qualified persons as DBSVUSA may authorize. Any U.S. person receiving this report who wishes to effect transactions in any securities referred to herein should contact DBSVUSA directly and not its affiliate.
Other jurisdictions
In any other jurisdictions, except if otherwise restricted by laws or regulations, this report is intended only for qualified, professional, institutional or sophisticated investors as defined in the laws and regulations of such jurisdictions.
DBS Vickers (Hong Kong) Limited
18th Floor Man Yee building, 68 Des Voeux Road Central, Central, Hong Kong
Tel: (852) 2820-4888, Fax: (852) 2868-1523
Company Regn. No. 31758