08. iron-carbon phase diagrams
DESCRIPTION
Analysis of stable (iron-carbon) and metastable (iron-ironcarbide) ohase diagramsTRANSCRIPT

Equilibrium crystallisation of Iron-Equilibrium crystallisation of Iron-Carbon alloysCarbon alloys
Metallography - Lecture 8.
2012/2013. Academic Year
2013.

Metallography of Iron-Carbon alloysMetallography of Iron-Carbon alloys
Definition of Iron-Carbon alloys – the base metal is iron (Fe);– it is always a multi-component alloy having several
elements inevitably from the manufacturing processes, but it may be regarded as binary Fe-C alloy until the following conditions are fulfilleda Si < 0,5 %, Mn < 0,7 %, S+P < 0,035 %
– in these cases their equilibrium crystallisation can be studied in the iron-carbon binary phase diagram
– the iron-carbon binary phase diagram – or Heyn-Charpy

Characteristic features of Heyn-Charpy Characteristic features of Heyn-Charpy dual phase diagram dual phase diagram
Dual phase diagram since it contains
– the Fe-Fe3C metastable phase diagram (the carbon is chemically bonded in iron-carbide)
– the Fe-C stable phase diagram (the carbon is present in the form of free graphite)

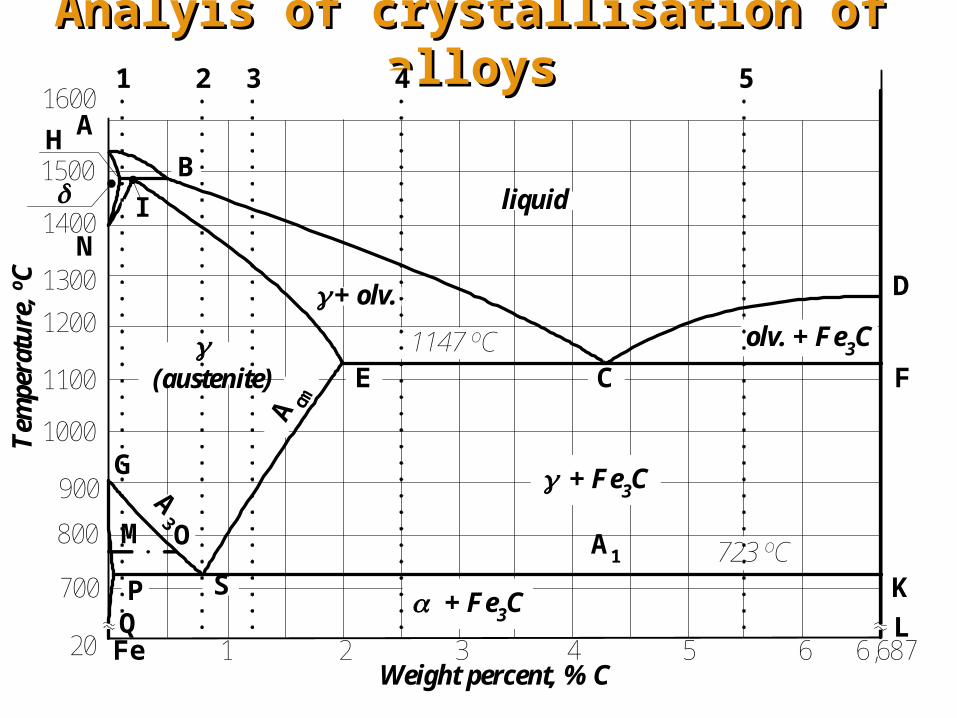
Hein-Charpy dual phase diagramHein-Charpy dual phase diagram
AB
C
D
E F
G
H
I
K
L
M
N
P S
Q
(austenite)
liquid + Fe3C(liquid + graphite)
+Fe 3C
+ graphite)
liquid
+
723 oC
Fe 1 2 3 4 5 6
700
900
1000
1100
1200
1300
1400
1600
769 oC
C'
D'
E'
S'
F'
20
738 oCA1
A cm
A3 O
K'
6.687
800
1500
1147 oC
1153 oC
Weight percent, % C
Temperature oC
Figure 8.1
+ liquid
+Fe 3C
(+ graphite)
+ liquid

Characteristic points of Hein-Charpy dual phase
diagram
Table 8.1.
Point Temperature
T (oC)
Carbon-content
C (%)
A 1536 0,000
B 1493 0,510
C 1147 4,300
C' 1153 4,260
D 1250 6,687
D' * 100,000
E 1147 2,060
E' 1153 2,030
F 1147 6,687
F' 1153 100,000
G 911 0,000
H 1493 0,100
I 1493 0,160
K 723 6,687
K' 738 100,000
L 20 6,687
L' 20 100,000
M 769 0,000
N 1392 0,000
O 769 0,512
P 723 0,025
P' 738 0,020
Q 20 0,006
S 723 0,800
S' 738 0,690

Characteristic features of Heyn-Charpy Characteristic features of Heyn-Charpy dual phase diagramdual phase diagram
Unlimited liquid solubility
– 3 liquidus section 3 primary crystals
-solid solution (along AB-liquidus)
-solid solution (along BC-liquidus)
Fe3C primary cementite ( graphite in the stable system)

Characteristic features of Heyn-Charpy Characteristic features of Heyn-Charpy dual phase diagramdual phase diagram
three solid solution zone
-solid solution (below the GP-curve)
-solid solution (below the IE-solidus curve)
-solid solution (below the AH-solidus curve)

Characteristic features of Heyn-Charpy Characteristic features of Heyn-Charpy dual phase diagramdual phase diagram
Three chemical compounds
– along the DC-curve: I. Fe3C primary cementite
( primary graphite)
– along the ES-curve: II.Fe3C secondary cementite
( secondary graphite)
– along the PQ-curve: III.Fe3C tertiary cementite
( tertiary graphite)

Characteristic features of Heyn-Charpy Characteristic features of Heyn-Charpy dual phase diagramdual phase diagram
In solid state limited solubility
– along the ES-curve: II.Fe3C secondary cementite
( secondary graphite)
– along the PQ-curve: III.Fe3C tertiary cementite
( tertiary graphite)
Characteristic features of Heyn-Charpy Characteristic features of Heyn-Charpy dual phase diagramdual phase diagram
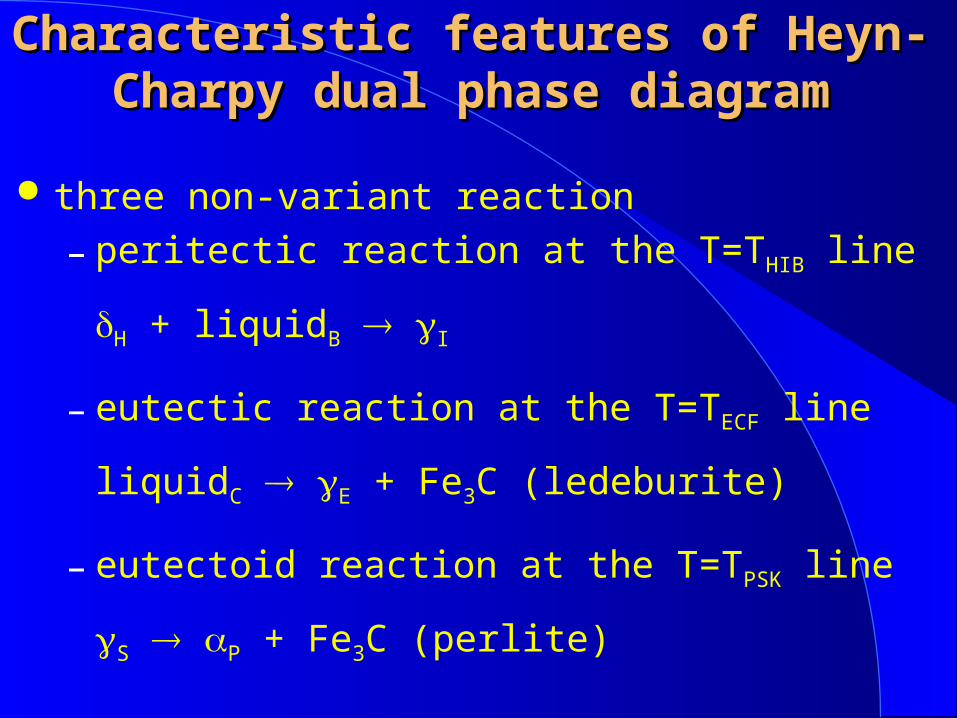
three non-variant reaction
– peritectic reaction at the T=THIB line
H + liquidB I
– eutectic reaction at the T=TECF line
liquidC E + Fe3C (ledeburite)
– eutectoid reaction at the T=TPSK line
S P + Fe3C (perlite)
Analyis of crystallisation of alloysAnalyis of crystallisation of alloys
A
B
C
D
E F
G
H
I
K
L
M
N
P S
Q
(austenite)
+ olv.
olv. + Fe3C
+ Fe3C
+ Fe3C
liquid
723 oC
Fe 1 2 3 4 5 6
700
900
1000
1100
1200
1300
1400
1600
20
A1
A cm
A3O
6,687
1147 oC
1 2 4 53
800
1500
Weight percent, % C
Tem
pera
ture
, o C

Crystallisation of alloy-1 in the metastable Crystallisation of alloy-1 in the metastable system (carbon content C=0,12 %)system (carbon content C=0,12 %)
olvB
T > T
T = T - T
T = THIB + T
T = 20 oC
T = THIB - T
T = TGOS + T
T = TPSK + T
T = TNI - T
T = TPSK - T
olv0,12
0,12
0,12
P S
P P
Fe3C
T = 20 oC
Q III. Fe3C Q
Fe3C
H + olvB I
perliteferrite
Eutectoid
S P + Fe3C
0,12
nuclei
liquid
reaction
tertiarycementite
perlite
ferrite
Peritecticreaction
liquid0,12
tertiarycementite

Crystallisation of alloy-1 in the metastable Crystallisation of alloy-1 in the metastable system (carbon content system (carbon content C=0,12 %)C=0,12 %)
Calculation of quantity of phases
before reaction after reaction
phases participating in the peritectic reaction
.%505,0110,051,0
10,012,0
%,9595,0110,051,0
12,051,0
kgolv
kg
B
H
%.3333,0110,016,0
10,012,0
%,6767,0110,016,0
12,016,0
kg
kg
I
H
IBH kgolvkgkg 33,005,028,0

Crystallisation of alloy-2 in the metastable Crystallisation of alloy-2 in the metastable system (carbon content system (carbon content C=0,8 %)C=0,8 %)
T > T
T = T - T
T = TSol. - T
T = TPSK + T
olv0,8
T = 20 oC
0,8
0,8
P
Fe3C
perliteQ Fe3C)
T = TPSK - T
perlite
0,8
nuclei
liquid liquid

Crystallisation of alloy-3 in the metastable Crystallisation of alloy-3 in the metastable system (carbon content system (carbon content C=1,2 %)C=1,2 %)
perlite
nuclei
T > T
T = T - T
T = Ts - T
T = TES + T
olv1,2
T = 20 oC
1,2
1,2
S II. Fe3C
Q Fe3C)
T = TPSK + T
T = TPSK - T II. Fe3CP Fe3C+
II. Fe3C
II. Fe3C
0,8
II. Fe3C
liquid1,2liquid1,2
perlite

Quantity of microstructural elements in Quantity of microstructural elements in alloy with C=1,2 %alloy with C=1,2 %
Calculations concerning the quantity of secondary cementite
analysis of microstructure
6,687 1,2% 100% 93,2%
6,687 0,8perlite
%8,6%1008,0687,6
8,02,1%. 3
CFeII

Crystallisation of alloy-4 in the metastable Crystallisation of alloy-4 in the metastable system (carbon content system (carbon content C=2,5 %)C=2,5 %)
E
olv2,5
olvC
T > Tl
T = Tl - T
T = TECF + T
T = TECF - T
T = TPSK + T
T = TPSK - T
olv2,5
T = 20 oC
Eutectic reaction
olvc E + Fe3C
II. Fe3C
II. Fe3C
II. Fe3CQ
Fe3C
+
S
PFe3C+
E Fe3C+
(S Fe3C)+
(p Fe3C)+
(Q Fe3C)+
ledeburite
perlite
ledeburite
ledeburite
ledeburite
ledeburite perlite

Crystallisation of alloy-4 in the metastable Crystallisation of alloy-4 in the metastable system (carbon content system (carbon content C=2,5 %)C=2,5 %)
Determination of quantity of microstructural elements at room temperature (3 microstructures - perlite+secondary cementite+ledeburite) therefore we have to find what are they originated from
– II. Fe3C is originated from E : the quantity of E
should be determined at the temperature of eutectic reaction 4,3 2,5
% 100% 80,4%,4,3 2,06
2,5 2,06% 100% 19,6%.
4,3 2,06
E
ledeburit

Crystallisation of alloy-4 in the metastable Crystallisation of alloy-4 in the metastable system (carbon content system (carbon content C=2,5 %)C=2,5 %)
The maximum quantity of II. Fe3C (if the composition of the alloys should correspond to point E)
The real quantity of II. Fe3C
the third microstructural element is the perlite
%4,21%1008,0687,6
8,006,2).( max3
CFeII
3 3 max( . ) ( . ) 0,804 21,3% 17,2%real EII Fe C II Fe C
3% % ( . ) % 80,4 17,2 63,2%E realperlit II Fe C

Micro-Micro-structure-structure-
diagram for diagram for Fe-FeFe-Fe33C C
alloysalloys
Figure 8.8. Figure 8.8.
0 2 4,3
Ferrite
Perlite
Secondary cementite
Ledeburite
Primary cementite
6,687 %C
Tertiary cementite
100
%
AB
C
D
E F
G
H
I
KL
M
N
P SQ
(austenite)
+ liquid
liquid + Fe3C
+ Fe3C
+ Fe3C
liquid
+ liquid
+
723 oC
Fe 1 2 3 4 5 6
700
900
1000
1100
1200
1300
1400
1600
20
A cm
A3
O
6,687
1147 oC
Temperature oC
Weight percent, % Ca) Fe-Fe3C phase diagram
A1
b) Microstructure diagram (T = 20oC)

Phases Phases in the in the
Fe-FeFe-Fe33C C
systemsystem
Figure Figure 8.8. 8.8.
AB
C
D
E F
G
H
I
KL
M
N
P SQ
(austenite)
+ liquid
liquid + Fe3C
+ Fe3C
+ Fe3C
liquid
+ liquid
+
723 oC
Fe 1 2 3 4 5 6
700
900
1000
1100
1200
1300
1400
1600
20
A cm
A3
O
6,687
1147 oC
Temperature oC
Weight percent, % Ca) Fe-Fe3C phase diagram
A1
0
- Ferrite
6,687 %C
Fe3C - Cementite
c) Diagram of phases (T = 20 oC)
100
%

Analysis of crystallisation in the Fe-C Analysis of crystallisation in the Fe-C stable systemstable system
The dotted lines in the Hein-Charpy dual phase diagram relate for the stable system
the basic difference between the stable and metastable system can be found in the form of carbon
– in the metastable system: carbon is present in chemically bonded form of Fe3C (iron-carbide),
– in the stable system: carbon is present in the form of free C (i.e. graphite),

Summary of differences between the Summary of differences between the stable and metastable systemstable and metastable system
metastable stable
Fe3C C (primary, secondary, tertiary)
perlite graphite eutectoid ( + C)
ledeburite graphite eutectic (graphite eutectoid + C)
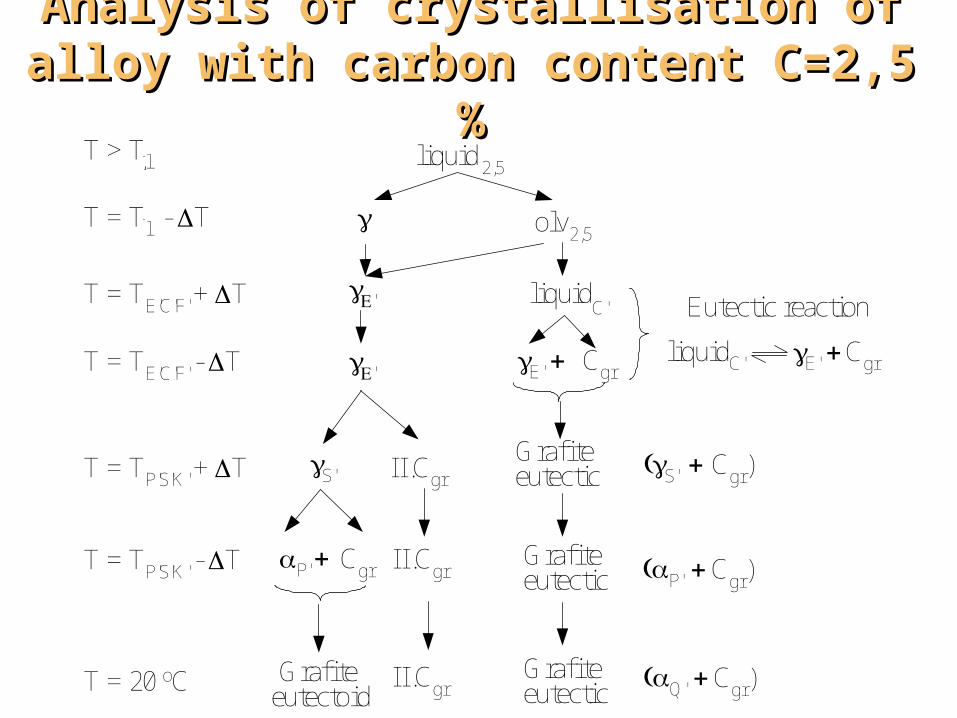
Analysis of crystallisation of alloy with Analysis of crystallisation of alloy with carbon content C=2,5 %carbon content C=2,5 %
liquid 2,5
T > Tl
T = Tl - T
T = TE'C'F' + T
T = TE'C'F' - T
olv2,5
' Eutectic reaction
'E' Cgr liquidC' E' Cgr
T = 20 oC II.Cgr Q' Cgr)
T = TP'S'K' - T P' Cgr P' Cgr)II.Cgr
T = TP'S'K' + T S' II.CgrS' Cgr)
C'liquid
Grafiteeutectic
Grafiteeutectic
Grafiteeutectic
Grafiteeutectoid

ClassiClassi--fication fication of iron-of iron-carbon carbon alloys alloys on the on the
basis of basis of phase phase
diagramdiagram
H y p o - H y p er-
e u tec to id
P ig iro n
H y p o -H y p er
-e u tec tic
AB
C
D
E F
G
H
I
K
L
M
N
P SQ
(a u sten ite )
+ o lv .
o lv . + F e 3C
+ F e 3C
+ F e 3C
liq u id
+ liq u .
+
7 2 3 oC
F e 1 2 3 4 5 6
7 0 0
9 0 0
1 0 0 0
1 1 0 0
1 2 0 0
1 3 0 0
1 4 0 0
1 6 0 0
2 0
A 1
A cm
A3
O
6 ,6 8 7
11 4 7 oC
S te e ls
8 0 0
1 5 0 0
T em p era tu re , oC
w eig h t % C
Figure 8.2.