07.25.2013, report, macroeconomic risks of mongolia and ways to mitigate them, economic research...
TRANSCRIPT

28
MACROECONOMIC RISKS OF MONGOLIA AND WAYS TO MITIGATE THEM
Erdenebat Bataa1
The First Draft was submitted on 30 June 2012 The Last Draft was submitted on 25 June 2013
Abstract
The paper explores some of the most prominent macroeconomic risks Mongolia is facing at this stage of her development and provides recommendations to reduce them. These have been classified into four main themes: Financial market risks, portfolio risk of Mongolian export basket, macroeconomic mismanagement, and institutional deterioration. The most important of these is argued to be the possible deterioration in the institutional quality. Since the point resources are easy to appropriate various interest groups have incentives to distort the institutions so that extracting the rent is easier. Fighting corruption and creating a stable legal environment where the rule of law and the property rights are respected should be high on the agenda.
Keywords: macroeconomic risk, Mongolia, overcrowding, debt overhang, financial risk, export portfolio diversification, pro-cyclicality.
1 I would like to thank the anonymous reviewer for providing me with constructive comments and suggestions.
Macroeconomic risks of Mongolia and ways to mitigate them
29
1. Introduction
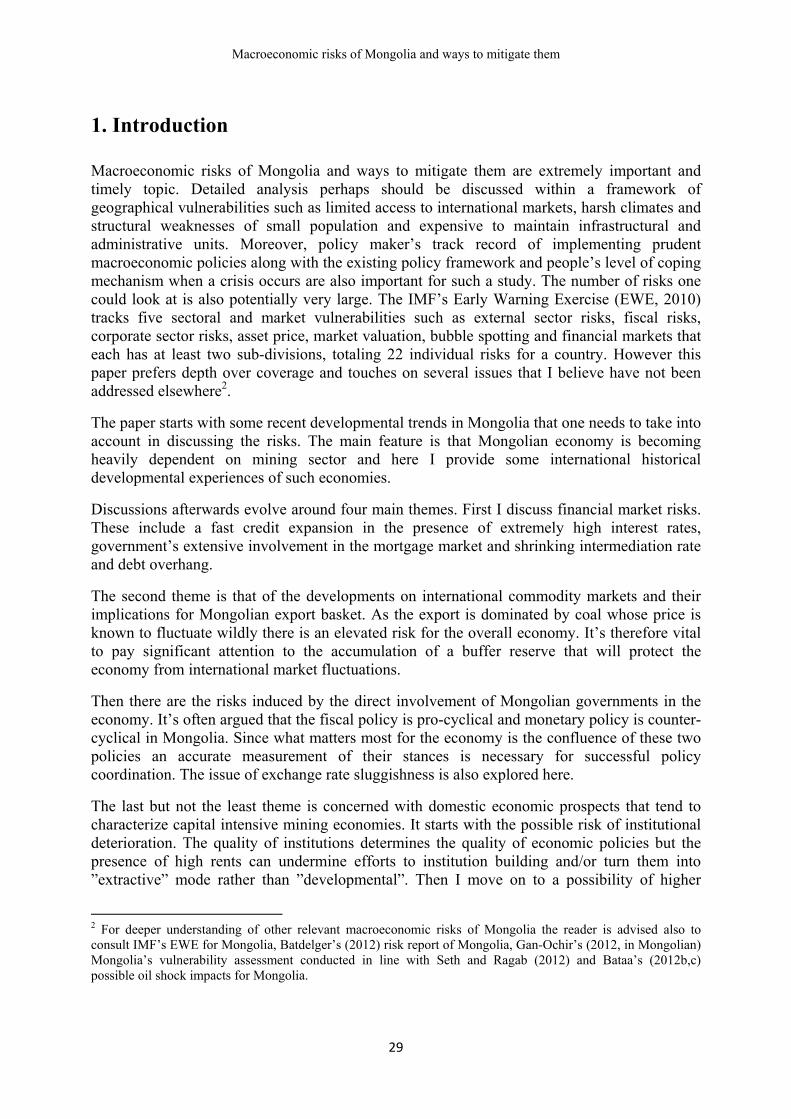
Macroeconomic risks of Mongolia and ways to mitigate them are extremely important and timely topic. Detailed analysis perhaps should be discussed within a framework of geographical vulnerabilities such as limited access to international markets, harsh climates and structural weaknesses of small population and expensive to maintain infrastructural and administrative units. Moreover, policy maker’s track record of implementing prudent macroeconomic policies along with the existing policy framework and people’s level of coping mechanism when a crisis occurs are also important for such a study. The number of risks one could look at is also potentially very large. The IMF’s Early Warning Exercise (EWE, 2010) tracks five sectoral and market vulnerabilities such as external sector risks, fiscal risks, corporate sector risks, asset price, market valuation, bubble spotting and financial markets that each has at least two sub-divisions, totaling 22 individual risks for a country. However this paper prefers depth over coverage and touches on several issues that I believe have not been addressed elsewhere2.
The paper starts with some recent developmental trends in Mongolia that one needs to take into account in discussing the risks. The main feature is that Mongolian economy is becoming heavily dependent on mining sector and here I provide some international historical developmental experiences of such economies.
Discussions afterwards evolve around four main themes. First I discuss financial market risks. These include a fast credit expansion in the presence of extremely high interest rates, government’s extensive involvement in the mortgage market and shrinking intermediation rate and debt overhang.
The second theme is that of the developments on international commodity markets and their implications for Mongolian export basket. As the export is dominated by coal whose price is known to fluctuate wildly there is an elevated risk for the overall economy. It’s therefore vital to pay significant attention to the accumulation of a buffer reserve that will protect the economy from international market fluctuations.
Then there are the risks induced by the direct involvement of Mongolian governments in the economy. It’s often argued that the fiscal policy is pro-cyclical and monetary policy is counter-cyclical in Mongolia. Since what matters most for the economy is the confluence of these two policies an accurate measurement of their stances is necessary for successful policy coordination. The issue of exchange rate sluggishness is also explored here.
The last but not the least theme is concerned with domestic economic prospects that tend to characterize capital intensive mining economies. It starts with the possible risk of institutional deterioration. The quality of institutions determines the quality of economic policies but the presence of high rents can undermine efforts to institution building and/or turn them into ”extractive” mode rather than ”developmental”. Then I move on to a possibility of higher
2 For deeper understanding of other relevant macroeconomic risks of Mongolia the reader is advised also to consult IMF’s EWE for Mongolia, Batdelger’s (2012) risk report of Mongolia, Gan-Ochir’s (2012, in Mongolian) Mongolia’s vulnerability assessment conducted in line with Seth and Ragab (2012) and Bataa’s (2012b,c) possible oil shock impacts for Mongolia.

ERI Discussion Paper Series No. 2
30
unemployment. As the economy progresses from agriculture based economy, which is labor intensive, into capital intensive mineral economy, the natural rate of unemployment is likely to increase. The prospect of industrialization is restricted by the Dutch disease and thus there is resultant loss of competitiveness. This highlights the need for high-investment and high-return educational system. To view it from a different angle Mongolia is moving from a relatively diffuse agricultural economy towards a point-resource based economy. As a consequence more income inequality is expected in the future. This is often followed by socioeconomic instability and this is the next risk discussed. It also re-iterates the need for better education that allows the poor to benefit from the economic boom and abolishment of some existing government regulations that may add to the tension.

Macroeconomic risks of Mongolia and ways to mitigate them
31
2. Changes in industrial structure and macroeconomic risks
Mongolia possesses a large amount of minerals, such as coal, copper, and gold, among others, and is emerging as a large producer and exporter of fuel. It overtook Australia in 2011 as the main coal exporter to China (Credit Suisse, 2012). Mining is emerging as the most vibrant economic sector in terms of GDP contribution (Figure 1), export earnings (Figure 3) and tax bills (Figure 5).
Real GDP is more than doubled in 2011 compared to its 1995 level, implying an annual average growth rate of 6%. The mining and the associated boom in net taxes on products and non-tradable sectors have been the engine of this growth, rising on average by 5.5%, 23% and 7.3% a year respectively. In contrast, agriculture rose only by 0.8% a year.
Figure 1: Real GDP by sectors (in 2005 constant prices). Mining share in GDP is on the right hand side
Source: Appendix to Statistical Bulletin, December 2010 and 2011 Statistical Yearbook.
To the extent that the mining sector is becoming a dominant force in Mongolian economy movements on the international markets are having greater influence (see the first panel of Figure 2). Visually, prior to the collapse of the socialism in the late eighties and early nineties the GDP growth was not that susceptible to the world copper price changes compared to more recent experiences. As a tangible measure of its influence, the second panel of Figure 2 shows the contemporaneous correlation between the real growth rate of the overall economy and the copper price changes at the London Metals Exchange in blue horizontal dashes. On average this correlation is at around 36%. The lagged effect shown in red horizontal line is even stronger at around 40%. There is also some evidence that these correlations have not been stable over the period of 1983-2011. Once we allow for possible changes in the correlations we
0
5
10
15
20
25
30
0.0
20.0
40.0
60.0
80.0
100.0
120.0
140.0
160.0
180.0
Agriculture Manufacturing Mining and quarryingNet taxes on products Non-tradables Financial intermediationMining share (RHS, %)

ERI Discussion Paper Series No. 2
32
obtain the upward trending lines which suggest the contemporaneous correlation has almost doubled since 19833.
Figure 2: Real GDP growth and copper price changes are plotted in the first panel. Contemporaneous and lagged correlations between the real GDP growth and copper price changes are plotted in the second panel. The horizontal lines assume the correlations to be constant while the upward-trending lines allow for time variation.
Source: IMF Financial Statistics and NSO.
Such an upward shift can be explained in two ways. The first is an obvious one: as the mining’s contribution to the GDP increases the more correlation is expected. It’s important to note here that although the copper’s weight in the overall mining portfolio has been overtaken by coal the correlation is still increasing, suggesting that everything in the portfolio is driven by the same global factors.
But the mining share in GDP has never exceeded 30% and it’s around 20% in 2011. Rather unobvious yet important another reason could be that the rest of the Mongolian economy is positioning itself so that they are more dependent on the mining sector than ever before. This would be extremely dangerous on at least two grounds. The first is the lack of diversification; the mining sector pulling down the others in the event of weak global demand for raw materials4. The second is from the arguments based on the Staple theory. Since the mining rent is extremely high during the good times the cost structures of its suppliers and customers are of little relevance to them. Then it loosens a basic market discipline for the other sectors in the Mongolian economy since efficiency will not be encouraged and required of them.
Reflecting its boom, the mining’s share in export earnings rose from 50% in 1992 to 89% in 2011 after substantial and prolonged stagnation in late 90’s and early 2000’s due to the slump in the demand for commodities (Figure 3). During this time the minerals earnings rose on average 20% a year, with 50% increase just in 2011 reflecting the increased coal production; even more growth is expected once Ouy Tolgoi, which is one of the largest undeveloped copper and gold mines in the world, starts operating in 2013.
3 Here I use local projections by calculating correlations between the GDP growth and the copper price changes on weighted data where the weights are centered at each year τ such that an observation at time τ + k has weight λ_|k|, for k =...,-2, -1, 0, 1, 2, ... and λ = 0.9, with the results then plotted for each τ . 4 Two commercial banks ”Zoos” and ”Anod” turned into receiverships during the 2008-2009 global crisis as their exposure to the mining was intolerably high.
-10
-5
0
5
10
15
20
-30
-10
10
30
50
70
90
1981
1983
1985
1987
1989
1991
1993
1995
1997
1999
2001
2003
2005
2007
2009
2011
Copper price change (%, LHS) GDP growth (%, RHS)

Macroeconomic risks of Mongolia and ways to mitigate them
33
Figure 3: Real export income by products in 2011 million USD; Mineral products share in total export is on right hand side
Source: NSO. US CPI is obtained from the Federal Reserve Bank of St Louise.
Cashmere textiles and textile articles contributed 21.4% of export income in 1992 but it reduced to 5% in 2011, perhaps somewhat reflecting economic difficulties in its main markets: European Union and Japan. Real export income from this sector rose 5.5% a year compared to an average growth of 14.1% for the total export.
The composition of main mineral export earners is changing. Figure 4 illustrates export of coal, which was almost non-existent prior to 2008, took over copper, which is traditionally the most important export commodity. Gold, another traditional export commodity, is now in the sixth place after iron, oil and zinc.
Companies associated with mining have played increasingly important roles in the state budget income (Figure 5). Their tax contribution reached about 70% just before the global financial crisis and it recovered to 56% in 20115. Real tax income from these companies rose 15 times (37 times in nominal term) since 2002 which increased the total tax income 4.7 times (11 times in nominal term). However tax income from the mining companies has been extremely volatile as it declined 24% and 36% in 2008 and 2009 respectively in real terms. These large fluctuations in revenue collections and associated complications in public debt management will have an adverse impact on the economy. Without prudent fiscal management Mongolia may be trapped between the boom and bust cycle: borrowing more than is warranted during the good times and being unable to service the debt or paying too high interest rates during the bad times.
5 Mongolian taxes are collected by three different authorities: Mongolian Tax Authority (MTA), responsible for domestic taxes and levies, Mongolian Customs General Administration, in charge of taxes on foreign trade, and General Authority for Social Insurance, that collects social security contributions. Tax income by economic sectors is not reported on a regular basis and figures reported here are from MTA only.
0
15
30
45
60
75
90
0
1000
2000
3000
4000
5000
Mineral products Raw & processed hides, skins etc.Textiles & textile articles Natural or cultured stones, precious metal, jewelleryLive animals, animals origin products Food, vegetable and base metal based productsOthers Mining share (RHS, %)

ERI Discussion Paper Series No. 2
34
Figure 4: Export income from commodities ranked by their size (in thousand USD)
Economic growth, at least as fast as its population growth, is a necessary condition for the sustainability of any society. However it is not a sufficient condition. Despite improvements in growth, export and budget income the poverty, unemployment and income inequality issues either still persists or are on the rise. Although the real growth rate between 1995 and 2010 averaged 5.3%, the poverty headcount actually rose from 36.3% to 39.2%. The number dropped to 29.8% in 2012 perhaps thanks to the Human Development Fund’s cash transfer program of 2010-2012 worth 19% of the 2010 GDP.
The mining boom is being generated by incredible price increases in most of the commodities. However this could very well be just a short term phenomenon. Figure 6 plots the long term copper price as a representative, both in nominal and real terms. Price of copper expressed in terms of a basket of consumer products have reached the current heights only twice before the beginning of the twentieth century but unlikely to continue for long as the high prices encourage developments of both the new mines and cheaper alternatives. According to Cuddington and Jerrett (2008) there is a super cycle in commodities prices and the current hike is being driven by Chinese industrialization and urbanization, whereas earlier super cycles were driven by similar developments in the United States, Europe, and Japan.
0.050000.0
100000.0150000.0200000.0250000.0300000.0350000.0400000.0450000.0500000.0
Coal Copper Iron ore
Oil Zinc ore and concentrate gold
processed cashmere molibdenium ore and concentrate Flour spar
Raw cashmere

Macroeconomic risks of Mongolia and ways to mitigate them
35
Figure 5: Real tax income in 2011 million MNT. Mining companies’ contribution to total tax income is on the right hand side.
Source: Mongolian Tax Authority and Mongol Bank.
To put Mongolia’s current boom in a historical and international context Figure 7 illustrates the dynamics of per capita Gross Domestic Product expressed in 2005 purchasing power parity and real GDP growth by country groups along with that of Mongolia. Each country group is based on 50 countries that best reflect that group.
Figure 6: Real (red dashed, RHS) and nominal (blue line, LHS) prices of copper. USD/ton
Source: U.S. Geological Survey, Federal Reserve Bank of St Louis and LondonMetal Exchange.
Mongolia is specifically compared to countries that depend on ore, minerals and fuel (which includes coal, oil and gas) exports. Ore and mineral dependent countries suffered most from stagnation in their living standards in the mid-seventies and even deterioration in the eighties
-
10.00
20.00
30.00
40.00
50.00
60.00
70.00
80.00
0
200000
400000
600000
800000
1000000
1200000
1400000
1600000
1800000
2000000
2200000
2002 2003 2004 2005 2006 2007 2008 2009 2010 2011Corporate income tax Royalty, land and water feesWindfall tax on gold and copper and progressive royalty Domestic VATPersonal income tax Other domestic taxesOther taxes and fees Non-tax incomeOther income taxes Estate tax
0100020003000400050006000700080009000
10000110001200013000
Nominal Real

ERI Discussion Paper Series No. 2
36
and nineties. The gap between the living standards widened significantly during this period compared to the richest and, more importantly, the most manufacturing dependent countries. Fuel export dependent group suffered from a similar fate and clearly underperformed compared to the world average.
The second panel of Figure 7 shows that from the mid-seventies to the midnineties the ore and mineral dependent countries tended to grow slower than any other countries and suffered the most from global recessions. The picture is reversed starting from the early nineties, perhaps boosted later on by Chinese and India’s industrialization and urbanization.
Mongolia is currently enjoying a mining boom both in terms of new deposit discoveries and high international prices mostly driven by the newly industrialized countries. The boom created a revenue windfall, raising questions about an economy’s absorptive capacity and ways to spend the excess revenue. Price volatility is likely to affect the fiscal balance of Mongolia whose revenue mainly consists of commodity-related taxes, royalties, and dividend income. When commodity prices drop, revenue will fall, forcing Mongolia to cut spending or incur debt. To counter this risk Mongolia has recently established a stabilization fund, on paper, to save commodity related revenue when prices are high and to draw money for budget support when prices are low6.
Figure 7: Logarithms of per capita Gross Domestic Products in 2005 purchasing power parity are plotted in the first panel. A country group is based on 50 countries that best reflect that group. Their 5 year weighted moving averages of real GDP growths are graphed in the second panel. The weights used are 0.33, 0.77, 1, 0.77 and 0.33. Vertical shades represent the U.S. recessions dated by the NBER.
Source of information: World Development Indicators and NBER.
However, making such a fund a success story appears to be a challenge and the mere existence does not guarantee a positive outcome. Fasano (2000) summarizes six economies’ experience with resource funds and examines their contributions to the public financial management. Davis, Ossowski, Daniel, and Barnett (2001) review the shortcomings of nonrenewable resource funds and conclude that such funds are often part of the problem. However, given that Mongolia’s economic growth, budget and export income largely depend on inherently volatile mining sector it’s vital to have a larger buffer. This translates into enlarging the existing 6 Although given the resources are nonrenewable such a fund is often given a inter-temporal saving’s function.

Macroeconomic risks of Mongolia and ways to mitigate them
37
stabilization fund and clarifying its expenditure rules so that it cannot be used for purposes other than its mandated role.

ERI Discussion Paper Series No. 2
38
3. Financial market risks
In this section I review some of the risks in the financial system. These include rapid credit expansion in the presence of extremely high interest rates, decreasing intermediation rate and debt overhang issues.
3.1 Excessive credit expansion
Mongolia has a quite liberal financial system and according to some is even ’overbanked’ (Marshall and Walters, 2010). Currently there are 14 privately owned and 1 state owned commercial banks operating in Mongolia. The 14 banks accounted for 96% of total financial system assets in September 2010 and unlikely to have changed much since. Three of them are 100% foreign owned and another one has foreign ownerships exceeding 50 percent (IMF 2011).
Figure 8. 2010 deposit rate (on the horizontal axis) distribution of the world economies is plotted in the first panel. International deposit rates since the last Mongolian banking crisis of 1998 are graphed in the second panel. Mongolian deposit rate is illustrated by a solid blue line and those of the other countries are plotted by pink dots.
Source: IMF Financial Statistics.
Despite this Mongolia benefitted little from the financial liberalization in terms of the lending rates. In fact Loukoianova (2011) finds high interest rates in Mongolia a puzzle. One reason of high lending rate is the cost of attracting deposits. Mongolian deposit rate is quite high compared to other countries with similar socio-economic conditions and those started the transition to market economy at more or less the same time. A histogram of world’s deposit rates is plotted in the first panel of Figure 8 where the horizontal line has annual deposit rates before taxes and the vertical axis represents the frequency. With an annual deposit rate of 11.9% in 2010 Mongolia is in top 5 percentile of the world countries in terms of savings nominal return, which was lower than just a handful of countries such as Yemen, Congo,
0
5
10
15
20
25
30
35
40
1 2 3 4 5 6 7 8 9 10 11 12 13 14 15 16 17 18 19
Mongolia
CongoAngolaTurkey
Venezuela
Yemen

Macroeconomic risks of Mongolia and ways to mitigate them
39
Venezuela, Turkey and Angola7. Deposit holders have also been benefitting from a tax exemption on interest income that was introduced at the beginning of the transition period from a centrally planned economy to a market oriented one with the purpose of encouraging savings and supporting newly created banking sector. There is also a Government-funded blanket deposit guarantee that started in 20088. Anecdotal evidence provided by the Mongol Bank officials however, is that 5% of the holders, some of whom are non-residents, hold 95% of all the term-deposits in Mongolia9. Such concentration of deposits can create a hostage-taking situation for the individual banks as well as the whole banking sector, as the consequences of possible capital flights are significant.
Relatively high deposit rate in Mongolia is not just a reflection of the fact that the other countries have reduced their interest rates in wake of the word economic recession and financial crisis. Comparatively high deposit rate is a persistent phenomenon in Mongolia as the second panel of Figure 8 shows. Here the time series dynamics of the Mongolian deposit rate is illustrated by a solid blue line and those of the other countries are plotted by pink dots. Rather worrisome feature here is that the deposit rate have dropped significantly in early 2000 and had been there for quite some time as if it has reached its ”natural rate”
Figure 9: Real deposit and lending rates
Source: IMF and Bank of Mongolia
7 The international comparison is for 2010, among 145 IMF member countries due to data avail-ability. Mongolian domestic currency nominated, weighted average rate decreased to 10.5% in 2011 and increased to 11% in the second quarter of 2012. 8 The state guarantee coverage is reduced in June 2010. This includes an elimination of coverage for interbank deposits, restrictions on deposits of related parties and limiting coverage on interest earned on deposits in excess of the policy rate. However, as late as March 2011, MNT 3 trillion were covered by this blanket guarantee (IMF, 2011). Unless extended it will expire by the end of 2012. 9 An official recent statistic on savings holdings is that 52.2% of all deposits belong to 0.4% of the deposit holders (Bayardavaa, Munkhbayar, Lkhagvajav, 2010).

ERI Discussion Paper Series No. 2
40
High deposit rate is likely to be the reflection of the inflation premium as inflation often makes real rates turn negative (Figure 9). Unfortunately this is currently thecase and will likely to reduce deposit and make funding more expensive in the near future.
Reflecting to some extent the high deposit rate loans have been quite expensive. With an annual rate of 20.1% in 2010 Mongolia is ranked among the top 13 percentile of world economies (the first panel, Figure 10)10. Again this is not just a manifest of the fact that other countries have been implementing quantitative easing after the Global Financial Crisis, as can be seen from the second panel of Figure 10.
At this high level of interest rates the loan decomposition is predictably geared towards consumption, mining and quarrying and non-tradable sectors such as mortgages, wholesale and retail trade, repair of vehicles, and construction where the returns are the highest during the mining boom (Figure 11). These sectors accounted for three quarters of the outstanding loan by the end of 2011. Manufacturing sector used to wield 32% of total loans but now accounts for only a third of that which is mainly concentrated in capital intensive mineral processing plants. As the mortgage comprises increasingly larger share of the loan portfolio the maturity of the average loan is likely to increase. Proportion of real estate, construction and consumer loans in the total loan portfolio increased from less than 5% in the first quarter of 2000 to about a half in the second quarter of 201211. During which time loans with maturities greater than 5 years have shot up from none to 75% for the real estate (for the total loan portfolio corresponding increase was from 9% to 17%). Since most loan rates, especially those for the mortgages, are fixed the stability in the banking sector depends on the stability in the deposit rates. Any future hike in inflation will force the deposit rate to increase and exacerbate the maturity mismatch problem. A recent estimate of the weighted average duration for the banking sector’s liabilities is 3.8 months (Bayardavaa, Munkhbayar, Lkhagvajav, 2010).
Banking sector’s own response to the maturity mismatch problem was the establishment of the Mongolian Mortgage Corporation (MMC) in 2006 that buys mortgages from the commercial banks and then securitizes and sells them off to investors. The bad reputation its U.S. quasi-government counterparts created after the Global financial crisis and the lack of strong credibility in the absence of investment ratings for its securities will likely hinder its future development as a solution to the mismatch problem. However its growth is not to be underestimated. It had made 8 purchases of MNT 7.2 bln of mortgage loans from the commercial banks by the end of 2011 (slightly less than 1% of the mortgage loans in the banking sector). But as of Sep 2012 it claims to have 20 purchases worth MNT 30 bln which is 3.4% of the mortgage loans12. It’s not apparent how the mortgage loans are adjusted at the Bank of Mongolia’s (BoM) bookkeeping after the deal between the MMC and commercial banks. Moreover there is a potential conflict of interest, as the MMC is regulated by the Financial Regulatory Commission yet the BoM is one of the MMC’s founders.
10 133 countries whose data were available are included in comparison. Mongolia’s weighted average lending rate declined to 16.6% in 2011 but increased to 17.9% by June, 2012. 11 Mortgage loans used to be classified under consumer loans (the category Other) prior to Quarter 3 of 2008. 12 2011 MMC Annual Report and Anniversary Notice on Daily News 2012.9.4, p7.

Macroeconomic risks of Mongolia and ways to mitigate them
41
Figure 10. 2010 lending rate (on the horizontal axis) distribution of the world economies is plotted in the first panel. International lending rates since the last Mongolian banking crisis of 1998 is plotted in the second panel.
Source: IMF Financial Statistics. Another response is that banks are increasingly trying to raise medium and long term funds from the international market, the most recent one being the Trade and Development Bank’s 3 year, $300 mln bond issue with 8.9% coupon rate. Success of these initiatives however depends on Togrog not depreciating during this period and/or availability of hedging.
Deposits are not only short term but also significantly denominated in foreign currency, implying any devaluation in Togrog would entail exchange rate losses. Foreign currency denominated accounts make up for almost a third of the current and savings accounts and proved to be extremely volatile: within 5 months after July 2008 37% of the former and 16% of the latter had been withdrawn. It’s also particularly alarming that the credit expansion is happening in the exceptional period of low interest rates in the international markets. Ten-year government bond yields are marked at historic lows at around 1.5% a year for the US, UK and German bonds while that for the Japanese is below 1%. This temporary period of low interest rates is sustained by two international factors that are crucial to Mongolia and clearly not sustainable in the longer term. The first is the savings glut due to the baby-boomer retirement savings and the reserves accumulated in China, as a result of its exchange rate interventions, and in Arab countries following the run up in oil prices. But pensioners in Japan and Germany have already started to draw down their savings. Prospects of hard landing in China and slower demand growth for Arab countries’ export commodities might soon make them to cash out their savings to support their economies. Secondly, the developed countries have been implementing extensive quantitative easing to combat the global financial crisis and boost up their economies. Future reversal on policy stance could increase interest rates sharply.
0
2
4
6
8
10
12
14
16
18
1 3 5 7 9 11 13 15 17 19 21 23 25 27 29 31M
ore
CongoMadagascar
Kyrgiz
YemenZambia
UgandaTajikstan
Sierra LioneParaguay
MalawiLao
JamaicaGeorgia

Figure 1Others iservices, administr12% (in selected s
Risks asinterventhe magthe biggfor the rbe achie60% forinvolvemalready h
13 Intentiosuch as Gapartmentthe latter r14 30% mo
1: The first pnclude loanFinance, In
ration and ddescending
sectors and t
ssociated wntions. Althognitude of Mgest. Howevreal estate ineved even ir the rest oment whichhigh in Mon
on of the ”100
Gegeenten and ts that could bresidential disortgage rate is
panel is the ns in Transpnformation a
defense, Watorder). The
their cumulat
So
with the moough it’s no
Mongolia’s ver good then the presenin the deveof Europe
h turned intongolia, witn
0000 apartmeKhansvill can
be bought withstricts, are advs from Mongo
ERI Discu
cumulative tportation, Aand communer supply ane panels b) tive shares in
urce: Mongol
ortgage expot unusual f”100000 ap
e intention13
nce of supploped counand reache
o sub-primenessed by co
ent” program in be bought wh the Governm
vertising theirol bank’s loan
ussion Paper S
42
total loans oAgriculture, nication, Ednd Professionand c) repo
n the total loa
l Bank Quarle
pansion arefor the govpartment pr3 is, the 6%ply bottlenentries; homeed 69% in e mortgage ommercial b
is not clear aswith the programent loan somproperties as report 2012Q
Series No. 2
outstanding inHousing an
ducation, Henal services
ort proportionan portfolio.
erly Loan Repo
e being elevvernments torogram” wo
% mortgage pecks. Univere ownership
the US afcrisis. Givebank mortg
s even luxurioam loan. Althme building c”can be merg
Q2.
n real term (nd food servealth, Electri
which accouns of mid to
ort.
vated throuo support thould certainprogram is rsal home op is 40% fofter the exten the demagage rates as
ous apartmenthough there is ompanies, inced afterwards
(in descendinvices, Admiicity and gaunt for the ro long term
ugh the govhe first timely qualify aincreasing
ownership cor Germanytensive govand for mors high as 30
ts in residentia size restrict
cluding the on”.
ng order). inistrative as, Public remaining
m loans of
vernment e buyers, as one of demands
could not y, around vernment rtgages is 0%14, any
ial districts tion for the ne building
additionfinancialis also csupply15
school, buyers aincreaseeven per
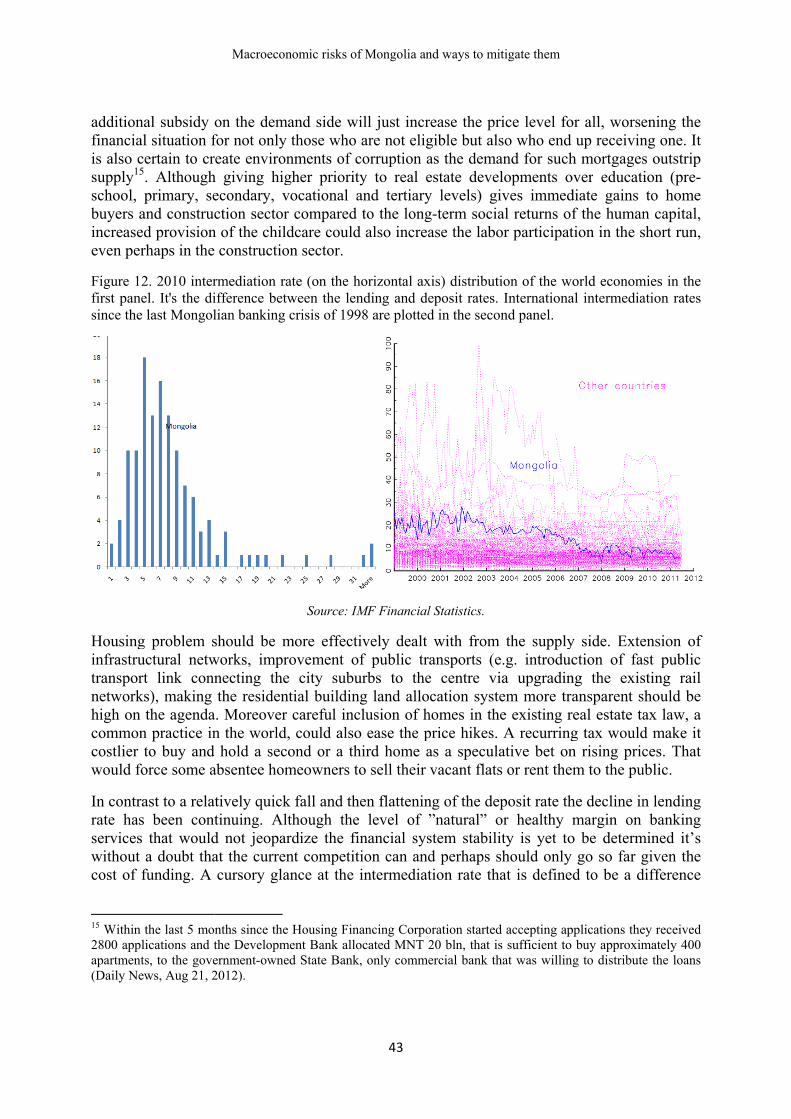
Figure 12first panesince the
Housinginfrastrutranspornetworkhigh on commoncostlier would fo
In contrarate hasservices without cost of f
15 Within 2800 applapartment(Daily Ne
nal subsidy l situation f
certain to cr5. Althoughprimary, se
and construcd provisionrhaps in the
2. 2010 interel. It's the dilast Mongol
g problem suctural netwrt link connks), making
the agendan practice into buy and orce some a
ast to a relas been cont
that woulda doubt tha
funding. A
the last 5 mo
lications and tts, to the goveews, Aug 21, 2
Macroecon
on the demfor not onlyreate enviroh giving higecondary, vction sector
n of the chil constructio
rmediation raifference betlian banking
should be mworks, imprnecting thethe residen
a. Moreovern the world
d hold a secabsentee hom
atively quicktinuing. Ald not jeopaat the currecursory gla
nths since thethe Developmernment-owne2012).
nomic risks of
mand side wy those who nments of cgher prioritvocational ar compared dcare could
on sector.
ate (on the htween the lencrisis of 199
Source: IM
more effectrovement oe city subuntial buildinr careful incd, could alsocond or a thmeowners t
k fall and thlthough theardize the fint competitance at the
e Housing Finment Bank alloed State Bank
f Mongolia an
43
will just incrare not elig
corruption aty to real eand tertiaryto the long
d also increa
horizontal axnding and de98 are plotted
MF Financial
tively dealt of public trurbs to theng land alloclusion of ho ease the phird home ato sell their
hen flattenine level of ”inancial systion can andintermediat
nancing Corpoocated MNT 2k, only comme
nd ways to mi
rease the prgible but alsas the demaestate devely levels) gig-term sociaase the labo
xis) distributieposit rates. d in the seco
l Statistics.
with from ansports (e
e centre vication syste
homes in theprice hikes. as a speculavacant flats
ng of the dep”natural” ostem stabilid perhaps stion rate tha
oration started20 bln, that isercial bank th
tigate them
rice level foso who end and for suchlopments oives immedal returns ofor participat
ion of the wInternationand panel.
the supplye.g. introducia upgradinem more tre existing rA recurring
ative bet ons or rent the
posit rate thor healthy ity is yet toshould only at is define
d accepting aps sufficient to hat was willin
or all, worseup receivin
h mortgagesover educatidiate gains f the humantion in the s
orld economal intermedia
y side. Extection of fa
ng the exisansparent s
real estate tag tax wouldn rising pricm to the pu
he decline inmargin on
o be determgo so far g
d to be a d
pplications thebuy approxim
ng to distribute
ening the ng one. It s outstrip ion (pre-to home
n capital, short run,
mies in the ation rates
ension of st public sting rail should be ax law, a d make it ces. That
ublic.
n lending banking
mined it’s given the
difference
ey received mately 400 e the loans

ERI Discussion Paper Series No. 2
44
between the lending and the deposit rates reveal that the current margin is not unusually large compared to other countries. Cross sectional histogram as shown in the first panel of Figure 12 Mongolia is in the 31st percentile and the second panel shows that there is still a downward trend. Therefore relatively higher rates in Mongolia could be a reflection of her inherent risk premium for inflation and exchange rate fluctuations, and not because her banks charge too much for their services. But the explosion in credits in the presence of high interest rates does point to i) increased exposure of the whole banking sector to the inherently volatile mining and non-tradable sectors where the rent is sufficiently high, ii) possible deterioration in the quality of the loans.
The share of nonperforming loans, a popular banking system indicator, has substantially declined overall from the peak of 23% in the third quarter of 2009 to 6% in the second quarter of 2012 after taking two commercial banks into receiverships in the process16. These two bankruptcies are thought to be caused by their excessive exposures to mining industry, with the proportion of non-performing loans increasing unprecedentedly in the last three quarters of 2008. In fact non-performing loans almost tripled for the consumer and wholesale-retail loans and doubled for the real estate within three quarters. Mongol bank’s two main policy instruments have been tightened recently but the impact is yet to be seen. The reserve requirement was increased twice and policy rate was raised five times since the first quarter of 2010 yet the total credit grew by 78% in real term since then.
Therefore, the amount and speed of concentration of the consumer and real estate related loans should be capped through prudential banking regulations. It’s recommended to require commercial banks to put aside additional reserves on the basis of maturity mismatch between its deposits and loans. Unified customer loan database and deposit insurance system should be implemented as soon as possible. It’s also vital to keep inflation at low and stable level to enable financial deepening.
3.2 Debt overhang
Mongolian debt dynamics from 1991 to the first quarter of 2012 is shown in Figure 1317. Prior to 2006 only public debt information is available, as the Mongol Bank started to publicize detailed information only in 201018.
The level of investment loans, which was almost non-existent before 2008, increased 1.4 times in 2009, tripled in 2010, again increased 5.4 times in 2011 and now constitutes 60% of all debt. These loans are mainly concentrated on big mining projects and are likely to increase even further. Mongol Bank reiterates that mining companies could internalize these investment loans.
16 Here non-performing loan includes past due in arrears, substandard, doubtful and bad loans. 17 Public debt information is from IMF (2005) and IMF (2008) for the periods 1991-2001 and 2002-2006 respectively. The rest is from the Mongol Bank. 18 It’s assumed that other sectors had no access to international debt markets.

Macroeconomic risks of Mongolia and ways to mitigate them
45
Figure 13: Mongolian external debt dynamics in thousand USD
Source: Mongol Bank and IMF.
Government sector’s borrowing rose 31% in the first quarter of 2012 after the Development Bank’s bond sales. The debt is on commercial terms which are more stringent than the long term concessional loans that Mongolia used to be eligible for as a low-income country. The management of this new type of debt will complicate macroeconomic management and increase country’s risk level, especially when the government’s repayment ability is affected by the commodity price volatility.
The confluence of degrading quality of institutions and the availability of the external funding due to the short term potential income gives the authority a dangerous leverage, if used inappropriately that could harm the long term growth of the economy. There is an ample historical experience of debt overhang problems in Latin American countries.
Some legal guards against Mongolian governments accumulating too much debt is within the Fiscal Stability Law to be fully implemented in 2013. These include a cap on public debt (not to exceed 40 percent of GDP in net present value), a structural budget deficit ceiling of 2% of GDP, and speed limit on budget expenditure growth (not to exceed non-mining GDP growth)19. There are some questions that need to be answered before implementing the law such as what discount rate to use in the NPV calculation, why the expenditure is restricted by non-mining GDP growth (given that non-tradable sectors are likely to grow faster than the mineral GDP). Moreover Mongolian government is engaged in multiple activities that may create uncertain demands on future fiscal resources and, therefore, complicate fiscal policy. These include loan guarantees, loans taken for the purpose of on-lending to state owned enterprises and local governments, Public Private Partnerships, and the Development Bank of Mongolia. These activities and related risks are claimed to be growing in terms of type, complexity and size.
Some debt instruments could address this concern by linking debt payment to commodity prices and the GDP or its growth rate. Coupons and principal payment of commodity-linked bonds are linked to a stated amount of a reference commodity. Because the volume is fixed, a country’s debt payment is positively related to its export commodity prices; as a result, its debt burden declines following the plunge of commodity prices. O’Hara (1984) studied the use of
19 For more views on Mongolian Fiscal Stability Law see Isakova, Plekhanov, and Zettelmeyer (2012).

ERI Discussion Paper Series No. 2
46
commodity bonds to stabilize consumption. Claessens (1991) pointed out that commodity bonds can be used to hedge debt management problems associated with volatile export earnings. However, the pool of investors willing to have exposure to commodity risks is smaller than those invest in traditional bonds.
Stable and profitable functioning of the Development Bank of Mongolia should be maintained as its potential to affect Mongolia’s financial sector standing on the international market is significant. Therefore, payments associated with its bonds could be linked with GDP growth or commodities to reduce its risk.
To conclude this section the main risk of debt overhang is not in the private sector, as some recent statistics might indicate, but in the government sector. I see the foreign investors’ reluctance not to internalize their investments as equity but keeping them as a loan is some form of a ”defense mechanism” against the rent seeking as the investment project failure will impact on Mongolia’s international credit rating. A stable legal environment where these investors can operate for longer periods will hopefully induce them to change strategy.

Macroeconomic risks of Mongolia and ways to mitigate them
47
4. Portfolio risk of Mongolian export basket
The markets for minerals, oil and its related products, and many other commodities are characterized by high levels of volatility. This is mainly associated with the production sluggishness, therefore almost vertical supply curve, in the short run. This volatility is claimed to have a negative impact on economic growth, export volatility, income distribution, and poverty alleviation (Larson, Varangis, Yabuku, 1998). Dawe (1996) calculates instability indices for a cross-section of countries by taking account of the share of exports in any given economy and finds that export instability is negatively associated with growth and investment. Hausman and Gavin (1996) found that volatility decreased economic growth and investment and adversely affects income distribution and raises poverty rates in Latin America.
Precisely because commodity markets are volatile, hence risky, governments, producers and consumers seek ways of managing and transferring risk. In response to this need, markets for commodity risk trading arose, and their use has become increasingly widespread. Instruments traded in these markets include futures and forward contracts, options, swaps, and other derivatives (Kletzer, Newbery and Wright, 1990). Rolfo (1980) investigated the use of futures for cocoa producing prices and provided a framework to calculate the optimal hedge ratio in the presence of both production (output) and price volatility. He showed that a limited usage of the futures market for hedging would be optimal when there is production variability. However, because of the huge losses incurred on derivative markets in mid nineties by traders at the Bank of Mongolia, the subject nowadays is almost a taboo. This is however in contrast to the international trend of increased government participation in derivative markets despite important barriers to access including counterparty risk, and basis risk (no correlation of local and international prices).
Figure 14: Commodity price dynamics in USD, January 1979-May 2012
Source: IMF Financial Statistics and http://www.indexmundi.com.
For a country that depends on a basket of commodities the volatility can be moderated if there is so called a portfolio effect, i.e. if price fluctuations of commodities offset each other. However Pindyck and Rotemberg (1990) find that many commodity markets experience short
010002000300040005000600070008000900010000
020406080
100120140160180200
1979
m01
1980
m02
1981
m03
1982
m04
1983
m05
1984
m06
1985
m07
1986
m08
1987
m09
1988
m10
1989
m11
1990
m12
1992
m01
1993
m02
1994
m03
1995
m04
1996
m05
1997
m6
1998
m7
1999
m8
2000
m9
2001
m10
2002
m11
2003
m12
2005
m1
2006
m2
2007
m3
2008
m4
2009
m5
2010
m6
2011
m7
Coal (metric ton, lhs) Oil (barrel, lhs)

ERI Discussion Paper Series No. 2
48
sharp price spikes followed by extended periods of considerably lower prices at the same time. Mongolia is not only becoming heavily dependent on mining industry as described in the Background section but also its export basket is concentrating on fewer commodities. Therefore it’s important to assess the extent to which Mongolian export is diversified and its evolution over time.
Figure 15: Time varying residual correlation coefficients of VAR(1) model estimated over February 1973 to March 2012. The results are obtained by estimating VAR models with weights centered at each month τ such that an observation at time τ + k has weight λ|k|, for k=...,-2, -1, 0, 1, 2, ... and λ = 0.99, with the results then plotted for each τ .
As can be seen from the prices of the four main commodities plotted in Figure 14 they have different statistical characteristics such as growth rates and variability. It would be ideal for Mongolia if the prices of its commodities grow over time, with as little fluctuations as possible. Moreover since commodities market is known for its fluctuations it’s ideal if the price drops of some commodities are offset by increases in others. To gauge the extent of such counter-movements in commodity prices I run a simple VAR and calculate the correlation coefficients of its residuals in Figure 15. When a local projection analysis is carried out there appears hardly any counter movements but an increase in contemporaneous correlation among them in recent years.
Price dynamics of Mongolian export commodities are plotted in four panels of Figure 16 along with their international counterparts. Also illustrated in the graphs are prices of futures with maturities that go as far into the future as they are currently sold in New York Metal Exchange. These futures contracts, along with forward contracts, are among the most important instruments for risk management and their markets should provide a convenient way for Mongolia to reduce risk20. The longest maturity of futures contract was December 2019 for 20 A forward contract is an agreement to deliver a specified quantity of a commodity at a specified future date, at a price (the forward price) to be paid at the time of delivery. The commodity specifications and point of delivery (as well as the quantity, price, and date of delivery) are spelled out in the contract. There are two parties to a forward
Macroeconomic risks of Mongolia and ways to mitigate them
49
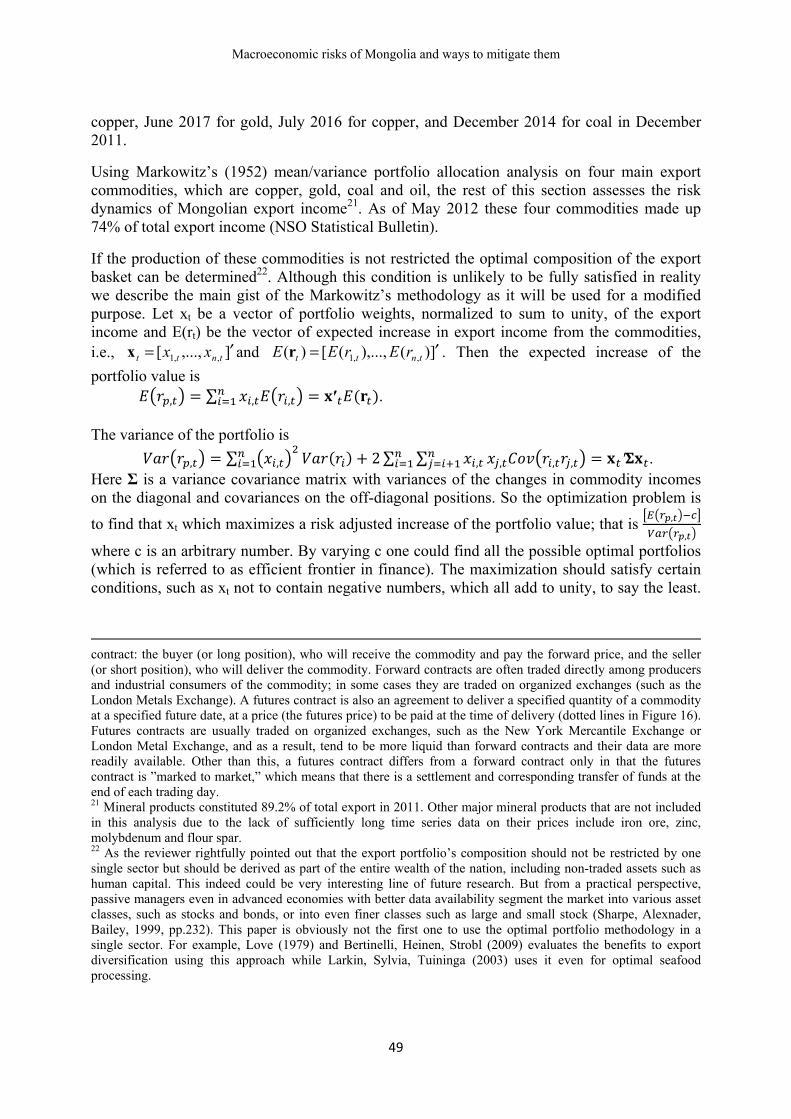
copper, June 2017 for gold, July 2016 for copper, and December 2014 for coal in December 2011.
Using Markowitz’s (1952) mean/variance portfolio allocation analysis on four main export commodities, which are copper, gold, coal and oil, the rest of this section assesses the risk dynamics of Mongolian export income21. As of May 2012 these four commodities made up 74% of total export income (NSO Statistical Bulletin).
If the production of these commodities is not restricted the optimal composition of the export basket can be determined22. Although this condition is unlikely to be fully satisfied in reality we describe the main gist of the Markowitz’s methodology as it will be used for a modified purpose. Let xt be a vector of portfolio weights, normalized to sum to unity, of the export income and E(rt) be the vector of expected increase in export income from the commodities, i.e., ],...,[ ,,1 ′= tntt xxx and ])(),...,([)( ,,1 ′= tntt rErEE r . Then the expected increase of the
portfolio value is , ∑ , , ′ . The variance of the portfolio is
, ∑ , 2 ∑ ∑ , , , , ′ . Here Σ is a variance covariance matrix with variances of the changes in commodity incomes on the diagonal and covariances on the off-diagonal positions. So the optimization problem is
to find that xt which maximizes a risk adjusted increase of the portfolio value; that is , ,
where c is an arbitrary number. By varying c one could find all the possible optimal portfolios (which is referred to as efficient frontier in finance). The maximization should satisfy certain conditions, such as xt not to contain negative numbers, which all add to unity, to say the least.
contract: the buyer (or long position), who will receive the commodity and pay the forward price, and the seller (or short position), who will deliver the commodity. Forward contracts are often traded directly among producers and industrial consumers of the commodity; in some cases they are traded on organized exchanges (such as the London Metals Exchange). A futures contract is also an agreement to deliver a specified quantity of a commodity at a specified future date, at a price (the futures price) to be paid at the time of delivery (dotted lines in Figure 16). Futures contracts are usually traded on organized exchanges, such as the New York Mercantile Exchange or London Metal Exchange, and as a result, tend to be more liquid than forward contracts and their data are more readily available. Other than this, a futures contract differs from a forward contract only in that the futures contract is ”marked to market,” which means that there is a settlement and corresponding transfer of funds at the end of each trading day. 21 Mineral products constituted 89.2% of total export in 2011. Other major mineral products that are not included in this analysis due to the lack of sufficiently long time series data on their prices include iron ore, zinc, molybdenum and flour spar. 22 As the reviewer rightfully pointed out that the export portfolio’s composition should not be restricted by one single sector but should be derived as part of the entire wealth of the nation, including non-traded assets such as human capital. This indeed could be very interesting line of future research. But from a practical perspective, passive managers even in advanced economies with better data availability segment the market into various asset classes, such as stocks and bonds, or into even finer classes such as large and small stock (Sharpe, Alexnader, Bailey, 1999, pp.232). This paper is obviously not the first one to use the optimal portfolio methodology in a single sector. For example, Love (1979) and Bertinelli, Heinen, Strobl (2009) evaluates the benefits to export diversification using this approach while Larkin, Sylvia, Tuininga (2003) uses it even for optimal seafood processing.

ERI Discussion Paper Series No. 2
50
It’s informative to plot the realizations of expected increase in income, , against its
associated risk measure , .
Figure 16: Spot prices of Mongolian gold (kg), oil (barrel), coal (ton) and copper (ton) in USD, along with their international counterparts. Futures prices are plotted by pink dots.
A. Gold price B. Oil price
C. Coal price D. Copper price
Source: IMF financial Statistics, DataStream and NSO.
Rather than optimizing with respect to tx here I use the actual export income composition of
Mongolia for tx and track the portfolio’s value increase with its associated risk over time. For

Macroeconomic risks of Mongolia and ways to mitigate them
51
that we need estimates of the means, variances and covariances. Equation (1) provides with a VAR model that is used to estimate these statistical measures.
t
p
iitit urAδr ++=
=−
1
(1)
where Ai (i = 1, …, p) are n×n coefficient matrices and δ is a n×1 vector of intercepts. The error term tu in (1) has mean zero and variance-covariance matrix E(utut') = Σ, and is
temporally uncorrelated. Further, defining D to be the diagonal matrix containing the standard deviations of tu and P to be the corresponding correlation matrix, then by definition Σ = D P
D. The methodology proposed in Bataa et al. (2013a) dates structural breaks in each of the three components of equation (1): that is, firstly, the VAR coefficients Ai (i = 1, …, p) and δ, which together capture mean effects as well as dynamics; secondly, (conditional) volatility measured by D; and finally, contemporaneous (conditional) correlations in P. In addition to dating any breaks found to occur in equation (1), I also examine the statistical significance of commodity relations by conducting inference on Ai and P. To conserve space the reader is referred to the above paper for the details of the testing methodology.
Unconditional mean of the growth rates is given by
δAIμ-1
1
−=
=
p
ii (2)
When the system of equations in (1) is estimated on data from January 1979 to March 2012 and tested for structural breaks I find no breaks in the mean coefficients but 3 breaks in covariance matrix. WDmax test statistic for the null hypothesis of no breaks against unknown number of breaks up to 5 in the conditional mean assumes 39.89, which is lower than the 5% critical value of 47.08. However the same statistic is statistically significant for the covariance matrix as the test statistics 198.5 is much higher than the corresponding critical value of 28.72. Since the null of no breaks is rejected it’s important to identify the number of breaks and their locations. The sequential test statistics that identify the number of breaks rejects the null of one break against two breaks (the statistic 206.83 is higher than the critical value of 30.29) and the null of two breaks is rejected against three breaks (the statistic is 44.95 and the critical value is 31.44). It was impossible to continue this further because of the lack of the data that satisfy the methodology’s requirements. Thus I conclude there are 3 breaks.
The identified structural breaks in the volatilities and comovements of the commodities prices are dated at September 1981 and June 1991 and April 2000 in Table 1. It also provides the 95 confidence intervals for these dates.
Table 2 provides the Granger causality test results. First of all there is statistically significant persistence (or inertia) in the price movements of all commodities ranging from 0.26 for oil and coal to 0.17 for gold. More interestingly it’s found that copper Granger causes oil and oil Granger causes coal. The latter link, although weak in magnitude, is understandable as they are often used as substitutes for heating. A 10 percentage point increase in oil price leads to 0.6 percentage point increase in coal prices. But the 10 percentage point increase in copper prices

ERI Discussion Paper Series No. 2
52
indicates 1.3 percentage point increase in oil prices in the following month. This portfolio effect is an interesting finding given that the mining uses a large amount of oil products which are currently imported from Russia23.
Table 1: Iterative Structural Break Test Results. It shows asymptotic WDmax and asymptotic sequential test statistics resulting from Bataa et al.’s (2013a) procedure, with the latter comparing l + 1 versus l breaks, beginning with l = 1, with the respective 5 percent critical value in brackets. N.C. indicates that the test cannot be computed because no additional break can be inserted while satisfying the minimum regime length requirement. Estimated break dates (in bold) are based on the iterative bootstrap algorithm; this is followed by the 90 percent confidence interval for this date. The value in parentheses is the bootstrap percentage p−value for the specific break at convergence. The VAR lag lengths is p = 1 chosen by HQ information criteria.
Coefficients Covariance Matrix Asymptotic WDmax Test Statistics [and Critical Values]
39.89 [47.08] 198.50 [28.72] Asymptotic Sequential Test Statistics [and Critical Values]
206.83 [30.29] 44.95 [31.44] N.C.
Break Dates, Confidence Intervals (and Bootstrap p-values) 1981.09
1980.11 1981.11 (0.00)
1991.06 1991.03 1992.03 (0.00)
2000.04 2000.01 2001.05 (0.00)
Conditional on the break dates in Table 1 and Granger causality test results in Table 2 the origins of the covariance matrix breaks are examined in Table 3. At all three break dates the volatility changes. The correlation structure also changes at the first two break dates but the break date on April 2000 is not statistically significant at 5 percent significance level. But the finding is only marginal. Looking at the correlation numbers in the current regime one can see that the synchronous movements have never been so strong in the past (especially so if one looks at the correlation matrices defined by all the covariance matrix breaks in Table 4). The null hypothesis that the price movements of oil and coal are not correlated with any of the other commodities used to be accepted with high probability of 73% and 46% in the seventies and early eighties, but not anymore. Although these high and positive correlations imply amplified income generation during the price increase it also means a drying-up of income during bad times. 23 See Bataa (2012b) for detailed and current information on Mongolia’s fuel import and consumption situation with respect to mining sector.

Macroeconomic risks of Mongolia and ways to mitigate them
53
Table 2: Individual Coefficient Estimation Results. Columns represent equations. The first value in each cell reports the estimated coefficients of the VAR. The values in parentheses are bootstrap p-values (expressed as percentages) for the null hypothesis that the corresponding true value is zero. ** indicates significance at the 5% level and * significance at the 10% level, both using the bootstrap p-value.
Explan. Variables
Dependent Variable Copper Gold Coal Oil
Intercept 0.24** 0.40** 0.17** 0.24** (0.0) (0.0) (0.0) (0.0)
Copper 0.34** -0.03 0.06 0.13** (0.0) (54.3) (12.7) (4.5)
Gold 0.05 0.17** 0.03 -0.03 (43.5) (1.0) (55.4) (69.7)
Coal 0.04 0.01 0.26** 0.04 (57.0) (87.5) (0.0) (56.5)
Oil 0.01 0.02 0.06** 0.26** (74.7) (44.7) (2.8) (0.03)
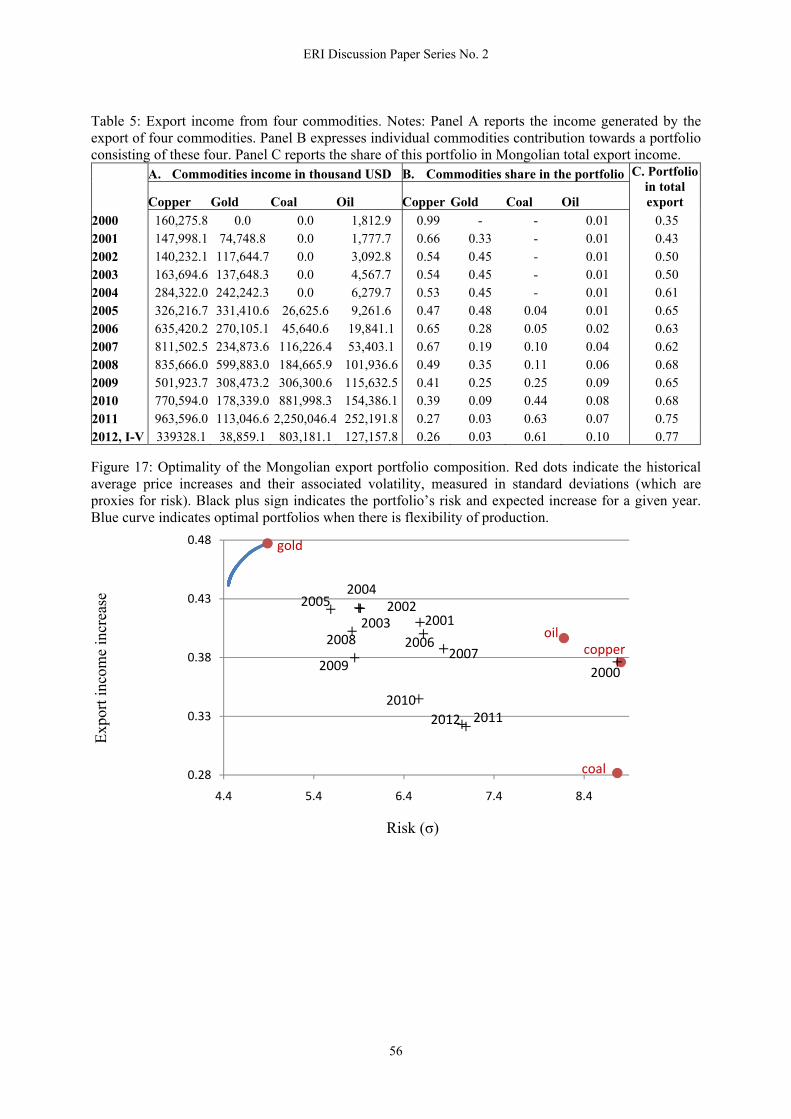
Tables 4 and 5 provide all the necessary information for the analysis of the portfolio analysis, which is summarized in Figure 17. Vertical axis represents the historical average price increases and the horizontal axis has volatility, which is a proxy for risk, measured in standard deviations. Here red dots indicate the risk-return profile of the individual commodities. Obviously gold is the best commodity as its value has the least historical fluctuation and has been steadily increasing since 1979. In contrast copper and coal, the most important commodities for Mongolian economy, are characterized by the most price fluctuations; the price trend has been better for copper. Black plus sign indicates the portfolio’s risk and expected increase for a given year. I track the optimality of export portfolio since 2000 due to the break in covariance matrix in 2000. Portfolio has the same characteristics as copper that year since the portfolio is almost fully consists of it. The following year gold increases its share to a third as a result of the ”Gold Program” implemented by the government of Mongolia. It has to be said that a substantial amount of tax and non-tax favors were generously handed out to attract investors. The portfolio risk and return improved significantly. That situation is further improved until 2006 when gold’s contribution is receded to 28%, 20 percentage points decrease from a year earlier. This deterioration in portfolio performance is improved in 2008 before falling back again. Since then coal has been dominating the portfolio and will be so in the near future given the developments of OT and TT; it has some unfavorable historical performance as can be seen from the graph and Mongolian economy’s risk level will be heightened.

ERI Discussion Paper Series No. 2
54
Table 3: Volatility and Correlation Results. Notes: Panel A reports the significance of structural break tests for the diagonal elements of the covariance matrix of the VAR (Volatility) and for the off-diagonal elements of the correlation matrix (Correl), showing bootstrap p-values (expressed as percentages) for the test of no change over adjacent Covariance Matrix subsamples identified in Table 2, with the result placed against the dates of the later subsample. The values reported are the final ones computed in the respective general to specific procedures of Bataa et al. (2013a). The corresponding sub-sample residual standard deviations are reported in Panel B and subsample contemporaneous residual correlations in Panel C. The standard deviations and correlations are computed after merging subsamples based on the respective break test results in Panel A (using 5% significance). The final column of Panel C reports the bootstrap p-value for a test of the joint hypothesis test that all contemporaneous correlations relating that commodity are zero. All results are obtained from a VAR in which the restrictions implied by the results of coefficient breaks and persistence/dynamic interaction tests (at 5% significance) are imposed.
A. Significance
of Breaks B. Subsample Residual
Standard Deviations C. Subsample Contemporaneous Correlations
Subsample Volatility Correl. Copper Gold Coal Oil Copper Gold Coal Zero
Correlation
72.02 –81.09 5.43 7.23 4.01 8.29
Copper 0.1
Gold 44.15 0.1 Coal -5.49 -6.15 73.2
Oil -4.86 10.08 7.62 45.6
81.10 –91.06 0.0 0.7 6.27 2.54 2.61 7.43
Copper 3.5
Gold 13.33 0.9
91.07 –00.04 0.0 0.0 4.21 3.34 4.57 8.34
Coal 24.7 5.28 1.5
Oil 3.41 29.99 -
15.24 0.3
00.05 –12.03 0.0 5.6 8.87 4.84 8.82 8.23
Copper 0.0
Gold 29.95 0.1 Coal 24.39 16.97 0.0 Oil 39.97 14.28 26.91 0.0
Blue curve indicates optimal portfolios when there is flexibility of production; that is the best level of return for a given level of risk had Mongolia the choice over the weights of its export basket. Experiences of the last 13 years indicate however Mongolia is diverging further from such a concept.
It’s true that once a project starts the Government has no right to dictate the company about how much to produce. However the government has the right to choose what type of licenses to give away to the mining companies. When making such decisions the government could use similar analysis as here. Moreover this framework could be extended to become more dynamic such that the means, the variances and the covariances are predicted beforehand and used for forecasting. Alternatively, one could refine the data into monthly frequency and create a framework of precautionary buffer accumulation dependent on the estimated level of risk.

Macroeconomic risks of Mongolia and ways to mitigate them
55
Table 4: Quantities for export portfolio. Notes: Panel A reports the expected price growth obtained by equation (2) and imposing the Granger causality test results (at 5% significance). Panel B reports the estimated variance-covariance matrices where the diagonal elements are the variances and the off-diagonal elements are the covariances, over the sub-samples. The corresponding sub-sample contemporaneous residual correlations are reported in Panel C.
Subsample A.
Expected growth
B. Variance-Covariance matrix C. Correlation matrix
Copper Gold Coal Oil Copper Gold Coal
72.02 –81.09 Copper 0.38 29.26
Gold 0.48 17.14 51.84 44.15
Coal 0.28 -1.08 -1.81 16.08 -5.49 -6.15
Oil 0.40 -2.05 5.94 2.66 68.2 -4.86 10.08 7.62
81.10 –91.06 Copper 0.38 38.99
Gold 0.48 2.13 6.78 13.33
Coal 0.28 4.01 0.34 6.78 24.70 5.28
Oil 0.40 1.59 5.76 -2.94 54.8 3.41 29.99 -15.2
91.07 –00.04 Copper 0.38 17.6
Gold 0.48 3.84 11.03 27.60
Coal 0.28 3.38 2.78 20.64 17.72 18.42
Oil 0.40 8.26 1.59 6.7 69.1 23.52 5.80 17.7
00.05 –12.03 Copper 0.38 77.57
Gold 0.48 14.55 23.88 33.96
Coal 0.28 26.56 6.5 76.88 34.34 14.50
Oil 0.40 46.31 10.95 29.15 66.8 64.30 27.11 40.5
ERI Discussion Paper Series No. 2
56
Table 5: Export income from four commodities. Notes: Panel A reports the income generated by the export of four commodities. Panel B expresses individual commodities contribution towards a portfolio consisting of these four. Panel C reports the share of this portfolio in Mongolian total export income.
A. Commodities income in thousand USD B. Commodities share in the portfolio C. Portfolioin total export Copper Gold Coal Oil Copper Gold Coal Oil
2000 160,275.8 0.0 0.0 1,812.9 0.99 - - 0.01 0.35 2001 147,998.1 74,748.8 0.0 1,777.7 0.66 0.33 - 0.01 0.43 2002 140,232.1 117,644.7 0.0 3,092.8 0.54 0.45 - 0.01 0.50 2003 163,694.6 137,648.3 0.0 4,567.7 0.54 0.45 - 0.01 0.50 2004 284,322.0 242,242.3 0.0 6,279.7 0.53 0.45 - 0.01 0.61 2005 326,216.7 331,410.6 26,625.6 9,261.6 0.47 0.48 0.04 0.01 0.65 2006 635,420.2 270,105.1 45,640.6 19,841.1 0.65 0.28 0.05 0.02 0.63 2007 811,502.5 234,873.6 116,226.4 53,403.1 0.67 0.19 0.10 0.04 0.62 2008 835,666.0 599,883.0 184,665.9 101,936.6 0.49 0.35 0.11 0.06 0.68 2009 501,923.7 308,473.2 306,300.6 115,632.5 0.41 0.25 0.25 0.09 0.65 2010 770,594.0 178,339.0 881,998.3 154,386.1 0.39 0.09 0.44 0.08 0.68 2011 963,596.0 113,046.6 2,250,046.4 252,191.8 0.27 0.03 0.63 0.07 0.75 2012, I-V 339328.1 38,859.1 803,181.1 127,157.8 0.26 0.03 0.61 0.10 0.77
Figure 17: Optimality of the Mongolian export portfolio composition. Red dots indicate the historical average price increases and their associated volatility, measured in standard deviations (which are proxies for risk). Black plus sign indicates the portfolio’s risk and expected increase for a given year. Blue curve indicates optimal portfolios when there is flexibility of production.
Exp
ort i
ncom
e in
crea
se
Risk (σ)
0.28
0.33
0.38
0.43
0.48
4.4 5.4 6.4 7.4 8.4
2000
copper
coal
oil
gold
20052004
2012 20112010
2009
20082007
20032006
20012002
Macroeconomic risks of Mongolia and ways to mitigate them
57
5. Risks induced by government macroeconomic policies
5.1 Pro-cyclicality of Mongolian macroeconomic policies
Economists agree that macroeconomic policies should be directed to smooth out the business cycle fluctuations; that is counter-cyclical24. It’s important to determine the actual stance of fiscal and monetary policy because what matters to the economy is the confluence of their impacts. Therefore wrong identification of the business cycle stance might result in a stronger or weaker response than is warranted by the Ministry of Finance and the Bank of Mongolia.
It’s often argued that fiscal policy is pro-cyclical in Mongolia yet monetary policy is regarded as countercyclical. The criticism is however not only specific to Mongolia but also to all developing countries (Gavin and Perrotti, 1997). Kaminsky, Reinhart and Vegh (2004) report some evidence that Mongolia has the most pro-cyclical fiscal policy in terms of inflation tax among 104 countries they studied.
Various theoretical models have been proposed to explain this phenomenon and many of which seem to be relevant for Mongolia. The most widely shared explanation is the credit market imperfection. Developing countries can borrow at relatively affordable interest rates only when their economies are doing good allowing them to increase the public spending and run deficits. When their economic prospects are bleak the credit market is shut so they have to cut spending when they are supposed to do the opposite.
Another strand of theory is based on political economy models. Alesina, Tabellini and Campante (2008) argue that when the economy is booming and the government is assumed to be corrupt the public demands more public goods, lower taxes or cash transfers. This is because the public do not observe the rents generated by the boom and fear the isappropriation by the corrupt elites. As a result the government increases borrowing more than is warranted and run deficits when the economy is already overheating. Hence the procyclicality is the result of an agency problem.
To determine the extent to which macroeconomic policies are procyclical and whether that has been changing over time I use the following models. The first model is Model 2 of Ilzetzki and Vegh (2008)25:
ttt yg εβ += (3)
tttt ugyy ++= − φα 1 (4)
where tg and ty are cyclical components of government spending and output, tε and tu are
i.i.d. white noise with 0)( =ttuE ε . The cyclical components are obtained from the quarterly
24 The opposite type of policy to the counter-cycle one that ”adds fuel to fire” is termed pro-cyclical and a policy in between that stays neutral to the business cycle fluctuations is called acyclical. 25 More comprehensive analysis is the subject of an ongoing project but early results show that conclusions reached here remain the same.

ERI Discussion Paper Series No. 2
58
data using the Hodrick Prescott filter with a smoothing parameter of 1600. The data coverage spans from Q1 of 1998 to Q2 of 201226. If 0>β fiscal policy is procyclical, if 0=β , fiscal policy is acyclical, and if 0<β , fiscal policy is countercyclical. Since the government expenditure is a part of the GDP, equation (4) will be used to assess the size and trend of its contribution. If φ > 0 then the government expenditure contributes to the cyclical fluctuations and detracts otherwise. To account for more possible lagged effects of output on government spending I use heteroskedasticity and autocorrelation consistent standard error estimates.
In terms of monetary policy’s stance over the business cycle and its evolution I use the following version of Taylor rule from Kaminsky et al. (2004); which they borrowed from Clairida, Gali and Gertler (1999):
ttt yi λππθγ +−+= )( (5)
where ti is the policy controlled short term interest rate (here I use the weighted average of
Central Bank Bill rate), ππ −t represents deviations of actual inflation from its sample
average. If 0>λ , monetay policy is countercyclical, if 0=λ , monetary policy is acyclical, and if 0<λ , monetary policy is procyclical. Again I use heteroskedasticiy and autocorrelation consistent standard errors for inference.
All specifications require a measure of output gap while equations (3) and (4) also use a deviation of the expenditure from its long term trend. Here I use Hodrick and Prescott (HP) filter for consistency, with a smoothing parameter of 1600. Prior to applying the HP filter I deseasonalize all the time series as in Bataa (2013a), that implements an iterative procedure suggested in Bataa et al. (2013b). Going back to estimation of equation (1), ideally one has to use policy instrument variables rather than outcome variables to assess fiscal policy stance, as argued in Kaminsky et al. (2004). Since the central government’s consumption data that excludes non-discretionary components such as loan interest repayments and transfers were available only from 2000 I also complement this with the current expenditure, capital expenditure and their combinations.
To assess whether macroeconomic policy stance changed over time I use a simple technique of local projection as a descriptive analysis. The results are obtained by estimating models for (3) and (4) with weights centered at each month τ such that an observation at time τ+k has weight λ|k|, for k =...,-2, -1, 0, 1, 2, ... and λ = 0.99, with the following results then plotted for each τ . To be specific, for each τ a general form of the model, either (3) to (4), is estimated and plotted against τ (Figure 18).
Final results corresponding to the fiscal policy is reported in the first panel of Table (6) which shows strong evidence of pro-cyclicality. When the output increases from its long term trend by 1 percentage point the expenditures also increase by 1.29 to 3.61 percentage points, depending on the type of expenditures, from their trends in the following quarter. The strongest cyclicality is observed for the capital expenditures and the weakest cyclicality is present in the
26 Since government spending decisions can plausibly be made with only a certain lag I assume here that the most recent economic condition affects the current expenditure; thus two equations are estimable by OLS as the error terms in both equations are uncorrelated with the right hand side variables. More comprehensive analysis of cyclicality is the subject of more focused future research.
current payment
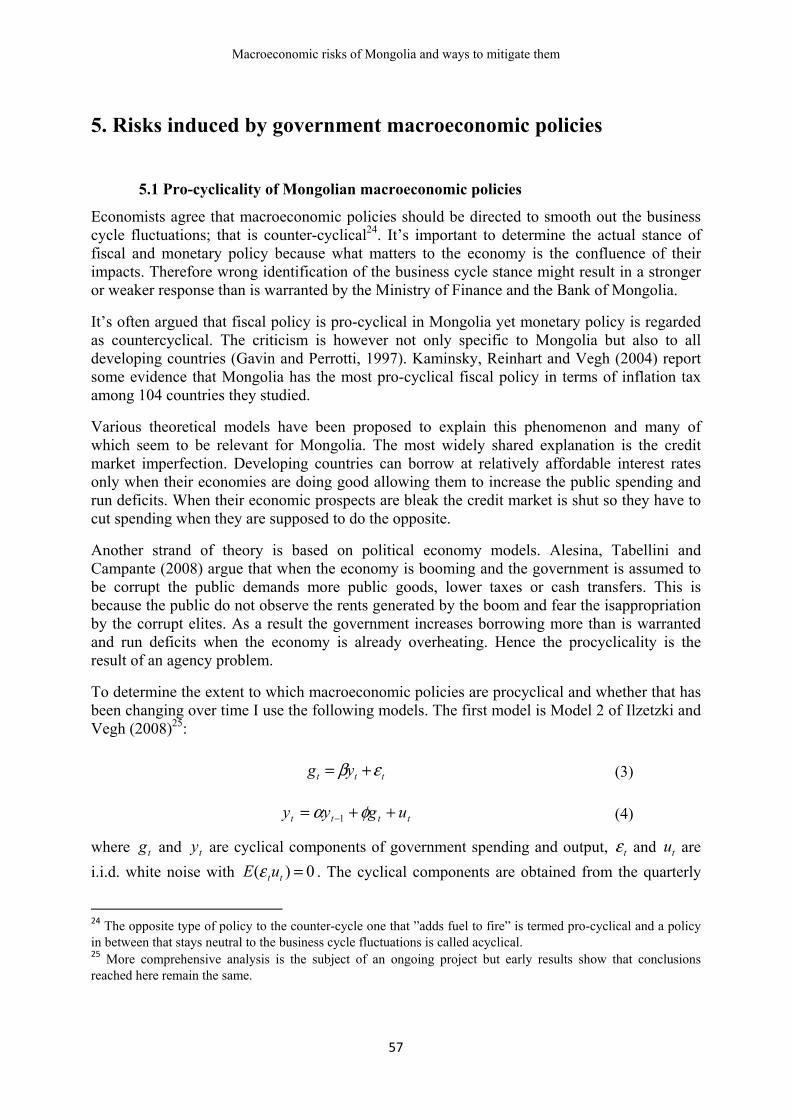
Figure 1policy’s (red horiare plotte
Local prcyclicali
There isfluctuatigovernm
Monetarregressio
27 The rev”ConsumpThis coulcombined
expenditurets and trans
8: Pro-cyclicontributionzontal lines)
ed by blue do
rojection grity might be
also a signions in the G
ment expend
ry policy eqon non sign
viewer wondeption+ capitalld be due the
d. Moreover, th
Macroecon
e, perhaps fers. All reg
icality coeffin to the cycli). Local projotted curves.
raphs in the on the rise
nificant reveGDP growthditures on gr
quation revenificance ca
ered why R2 l expenditure”e seasonal prhe governmen
nomic risks of
due to thgressions ar
icient for fisical fluctuatijection count
he first colue.
erse causalith. Interestinrowth.
eals insigniannot be re
increased sub” compared toroperties of tnt consumptio
f Mongolia an
59
e inclusionre highly sig
scal policy on of the outerparts of th
umn of Fig
ty: expenditngly, local p
ficant coeffejected. Ac
bstantially in o the cases of the individualn is 8 quarter
nd ways to mi
n of non-cygnificant27.
is plotted inutput growthhese coeffici
gure 18 mo
ture cyclicaprojections a
ficient of 0.cording to
the cases off ”Current expl series are bshorter than t
tigate them
yclical item
n the first ch is graphed ients that all
reover sugg
ality contribalso reveal i
.176 and ththis result
f ”Current+ cpenditure” andbeing differenthe rest due to
ms such as
column and in the secon
low for time
gest that th
buting to theincreasing i
he null hypomonetary
apital expendd ”Capital expnt from when data availabi
s interest
the fiscal nd column variation
hese pro-
e cyclical impact of
othesis of policy is
diture” and penditure”. n they are lity.

ERI Discussion Paper Series No. 2
60
acyclical. Failure to find significant relationship between the output fluctuation and the monetary policy response could be the use of the Central Bank Bill rate as a proxy for the policy variable. Mongol bank started to announce policy rates only in 2010 the use of which resulted in highly insignificant estimation. Table 6: Estimation results for equations 3-4. Columns 2-4 report estimated coefficients. ** indicates significant at 1% . Also reported are the regression R2 and F statistic for the regression significance.
β φ λ R2 F A. Procyclical fiscal policy
Current expenditure 1.29** 7.83** Capital expenditure 3.61** 9.07**
Current+capital expenditure 2.02** 16.26**
Consumption+ capital expenditure 2.17** 15.58**
B. Output growthCurrent expenditure .081** .170 5.54** Capital expenditure .034** .174 5.68**
Current+capital expenditure .104** .248 8.90**
Consumption+ capital expenditure .103** .275 8.91**
C. Countercyclical monetary policy C. Central Bank bill rate .176 .07 2.28
From the estimations one can see that the government expenditure growth is playing increasingly larger role in the overall economic fluctuations. Therefore it should be recommended to take into account the exiting business cycle measurements such as output gap before implementing these government programs. Moreover, the government initiatives in fighting corruption, enforcing contracts and improving institutional quality are expected to have broad impact.
5.2 Inflation and Real Appreciation of Togrog
Money supply has been showing a boom and bust cycle. M2 grew by 56% in 2007, before shrinking by 5.5% in the following year, and increased again by 26.9% and 62.5% in 2009 and 2010 before moderating to 37% in 2011. The 2010 increase was the fastest in the world and similar growth was observed only in 1994 (79%) as a part of the “shock therapy” transition from the centrally planned economy to a market oriented one.
Figure 19 illustrates a well documented long run relationship between money growth and inflation using all the available data since 1961. Mongolia seems to follow this relationship well having 23% inflation in 2008 and already 10.6% by July 2012. Prospect of this higher inflation do not necessarily translate into real exchange rate appreciation if the nominal exchange rate is kept flexible.

Macroeconomic risks of Mongolia and ways to mitigate them
61
But the Central Bank appears to prefer maintaining the nominal exchange rate stability, although the effectiveness of such policy has been controversial. The exchange rate is one of the automatic stabilizers for commodity dependent countries, appreciating during the boom, thus reducing export and depreciating during the bust thus encouraging export, but Mongolia has been quite adamant using this buffer. Figure 20 plots the dynamics of the so-called commodity currencies, i.e. those of countries that heavily depend on commodities (Cashin, Cespedes and Sahay, 2004).
During the early phases of the Great Financial Crisis of 2008, global economic perspectives became bleak and commodity prices declined. Central banks of commodity currency countries accepted depreciation given the negative terms of trade shocks originating from the global factors. In contrast, Mongolia defended its currency by selling from its official foreign reserve to maintain the exchange rate. Given that the length of such policy cannot be maintained for extended period of time this invites some form of speculative move: borrow in Mongolian Togrog, buy U.S. dollars from the Central bank and hold them until the eventual currency depreciation, when the initial loan is repaid. Figure 19: Relationship between the average money growth and average inflation. There are 178 countries; beginning dates differ. Logarithms were applied to ease comparison.
Source: World Bank.
After losing a half of its foreign reserve of 1 billion USD, Mongolia devalued its currency by a quarter and approached IMF with a request of Stand-By arrangement with amount of USD 450 million and obtained the loan. This was of exceptionally large size compared to its quota28.
28 A related policy risk appears to be the lack of ownership of macroeconomic policies in Mongolia. Mongolia had implemented several IMF programs before the 2008 request, since joining the organization in 1991 and immediately receiving a Stand-By program. In 1993 Mongolia made a three year arrangement under the Enhanced Structural Adjustment Facility (ESAF) in an amount equivalent to SDR 40.81 million. Another three year
-1
0
1
2
3
4
5
6
7
0 1 2 3 4 5 6 7
Money growth (1961-2010)
Infla
tion
(196
1-20
10)
Mongolia (2010)
Congo, D.R.Brazil
AngoliaPeruBolivia
Ukrain
ArgentinAzerbaijan
Belarus
KazakhstanArmenia
Mongolia

ERI Discussion Paper Series No. 2
62
Figure 20: Commodity currency dynamics by countries. USD rate on 2007.6.29 is set to unity. If the
rate moves above it that means exchange rate appreciation and vice versa.
Source: Bloomberg.
Figure 21 shows the evolution of official foreign exchange reserves of commodity dependent countries. The June 2007 amount is set to unity. As can be seen from the graph Mongolia has the most activist policy. After the devaluation of late 2008 the commodity prices recovered so did the values of the commodity currencies. Mongolia preferred to build its foreign exchange reserve aggressively that was almost depleted earlier, rather than allowing its currency to appreciate to fend off the commodity boom-bust cycle. Sterilization process that followed may have contributed to inflation, sustained domestic interest rates at high levels, and stimulated even greater capital inflows and worsening the credit affordability. However it’s worth noticing that the exchange rate has become relatively flexible after the crisis, as that was one of the conditions of the Stand-By program. By the third quarter of 2011 the official reserve had almost tripled compared to its pre-crisis level. Interestingly, when the Euro crisis deepened in the third quarter of 2011 and commodity prices declined as a result of that, Mongolia repeated its previous mistake by not allowing its currency to adjust to this new reality. Togrog did depreciate but far more sluggishly than others and that meant when the others had already been stabilized Mongolian currency was still continuing its slide29. arrangement under ESAF/PRGF in an amount equivalent to SDR 33.4 million was approved in 1997. Again in 2001 a three-year arrangement under the PRGF in an amount equivalent to SDR 28.49 million was approved in 2001. But IMF involvement has been shown to effect the economic growth negatively (e.g. Przeworski and Vreeland 2000, Hutchison 2003, and Dreher 2006). The IMF can influence economic outcomes by its money, the policy conditions attached to its loans and, more generally, its policy advice. Barro and Lee (2005) argued that greater involvement in IMF programs tends to lower the rule of law and democracy and conclude that a typical country would be better off economically if it committed itself not to be involved with IMF loan programs. Dreher and Walter (2010) find however that the IMF does help the crisis stricken countries to preserve exchange rate stability and correct macroeconomic imbalances. 29 Given the Mongol Bank’s independence is relatively weak this discretionary policy environment has a danger of attracting possible political influences, hence increases investment uncertainty.
0.6
0.7
0.8
0.9
1
1.1
1.2
1.3
29/0
6/20
07
29/0
8/20
07
29/1
0/20
07
29/1
2/20
07
29/0
2/20
08
29/0
4/20
08
29/0
6/20
08
29/0
8/20
08
29/1
0/20
08
29/1
2/20
08
01/0
3/20
09
01/0
5/20
09
01/0
7/20
09
01/0
9/20
09
01/1
1/20
09
01/0
1/20
10
01/0
3/20
10
01/0
5/20
10
01/0
7/20
10
01/0
9/20
10
01/1
1/20
10
01/0
1/20
11
01/0
3/20
11
01/0
5/20
11
01/0
7/20
11
01/0
9/20
11
01/1
1/20
11
01/0
1/20
12
Canada Australia Chile Russia Mongolia South Africa
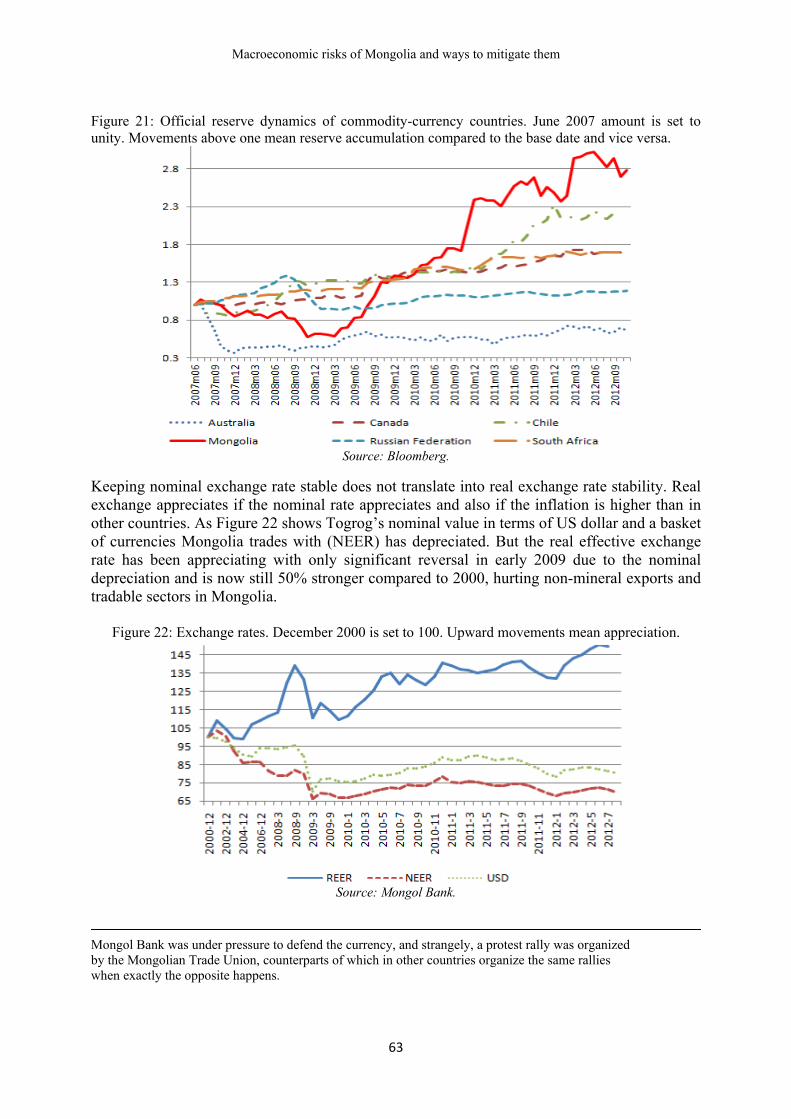
Macroeconomic risks of Mongolia and ways to mitigate them
63
Figure 21: Official reserve dynamics of commodity-currency countries. June 2007 amount is set to unity. Movements above one mean reserve accumulation compared to the base date and vice versa.
Source: Bloomberg.
Keeping nominal exchange rate stable does not translate into real exchange rate stability. Real exchange appreciates if the nominal rate appreciates and also if the inflation is higher than in other countries. As Figure 22 shows Togrog’s nominal value in terms of US dollar and a basket of currencies Mongolia trades with (NEER) has depreciated. But the real effective exchange rate has been appreciating with only significant reversal in early 2009 due to the nominal depreciation and is now still 50% stronger compared to 2000, hurting non-mineral exports and tradable sectors in Mongolia.
Figure 22: Exchange rates. December 2000 is set to 100. Upward movements mean appreciation.
Source: Mongol Bank.
Mongol Bank was under pressure to defend the currency, and strangely, a protest rally was organized by the Mongolian Trade Union, counterparts of which in other countries organize the same rallies when exactly the opposite happens.

ERI Discussion Paper Series No. 2
64
6. Mining dependency, macroeconomic risks and institutions
Institutions are vital for understanding macroeconomic risks as they determine what the policies would be. Good institutions create an environment that promotes economic activity, inventiveness, growth, and development. Bad institutions typically result in economic stagnation. Mongolia’s vast mineral and fuel resources promise major economic benefits, but experiences in Africa and Latin America suggest that an abundance of such appropriable resources can lead to poor policies and hinder long-term development; this is the so-called ”Resource curse” phenomenon.
In an American Political Scientists’ Society Meeting its president is said to have claimed that Mongolia is an outlier that the existing political system theories could not explain (Rossabi, 2005). Fish (2001) described Mongolia as a remarkable puzzle among the post-communist countries in terms of its political experience. While most of the countries in the Central Asia, which had similar social-economic backgrounds, slipped into personalistic rule and authoritarianism” Mongolia was the only post-communist country outside of East Europe to receive a rating that entitled it to a classification as a free polity”. He attributed Mongolia’s success in democratization to five main features: lack of natural endowments, low strategic value for external players, a modesty not to become a great or regional power, an absence of national father figure and a dilution of central power.
These all changed now. Mongolia has now discovered huge mineral and fuel deposits and has already started relying on extractive industries for economic growth. According to Fish’s (2001) prediction this would entail enormous political dangers and Mongolia may quickly become little more than a battleground for actors seeking control over the resource rents. The following two sub-sections provide some further discussions.
6.1 Institutional quality and macroeconomic risks
Resource rich countries have faced political problems ranging from greater levels of corruption and rent seeking to internal conflict (Collier and Hoeffler, 1998, 2004, Lane and Tornell, 1999 and Torvik, 2002). The issue is of significant importance for Mongolia: governance problems are more visible than in the past and corruption and rent-seeking seem to be on the rise.
Institutional quality is found to be the key to avoiding the resource curse (Mehlum, Moene, and Torvik, 2006). Knack and Keefer (1995) conclude that the rule of law is a better measure of institutional quality than others such as Gastil indices (measures of democracy) and political violence measures. Adherence to the rule of law is manifested by maintenance of property rights and absence of corruption. Maintenance of property rights is considered one of the most important pillars of a free market economy and an important determinant of economic growth through their effects on the level of investment (North, 1990; North and Weingast, 1989). There is also overwhelming evidence that indicates corruption is detrimental for economic growth (See e.g. Shleifer and Vishny, 1993; Ehrlich and Lui, 1999)30.
30 See Knack and Keefer, 1995; Mauro, 1995; Sala-i-Martin, 1997; for more evidence supporting the idea that some measure of the rule of law or property rights or corruption is significantly correlated with growth of per

Macroeconomic risks of Mongolia and ways to mitigate them
65
Figure 23: Heritage foundation and World Bank institutional quality indicators. They range between 0 and 100 and the higher the better.
Source: 2012 Index of Economic Freedom and Worldwide Governance Indicators.
Unfortunately, exactly these measures of Mongolia’s institutional quality have been deteriorating in the recent years, as can be seen from the World Bank and Heritage Foundation indices illustrated in Figure 2331. In particular, the World Bank’s control of corruption index has shot down within just a decade: the country ranked at 57th percentile in 2002 but the latest index is at mere 27th (the higher the rank the better). Heritage Foundation’s index also points to similar amount of deterioration. The World Bank’s rule of law measure, however picked up slightly in 2011, shows a resounding downward trend since the mining boom started.
Figure 24 illustrates the dynamics in the Heritage Foundation’s freedom from corruption and property rights indices of the world countries. Countries above the red line are those whose indicators improved and those below the line are the losers. In 1996 Mongolia shared more or less the same position with world average countries such as Spain, Ireland, Chile and Cyprus for the corruption control and Switzerland, France and Sweden for property rights, perhaps thanks to its relatively liberal laws and regulations. But the control of corruption has almost collapsed in Mongolia, as witnessed by the fastest drop in the index in the sample of 181
capita real income, based on various institutional quality measures such as those in International Country Risk Guide (ICRG) data and/or World Bank supported Kaufmann, Kraay, and Mastruzzi (2010) project data. 31 World Bank’s control of corruption measure reflects perceptions of the extent to which public power is exercised for private gain, including both petty and grand forms of corruption, as well as ”capture” of the state by elites and private interests while its rule of law measure reflects perceptions of the extent to which agents have confidence in and abide by the rules of society, and in particular the quality of contract enforcement, property rights, the police, and the courts, as well as the likelihood of crime and violence. Both are percentile ranks among all countries (ranges from 0 (lowest) to 100 (highest) ranks). Heritage foundation’s protection of property rights measures the degree to which a country’s laws protect private property rights and the degree to which its government enforces those laws. It also assesses the likelihood that private property will be expropriated and analyzes the independence of the judiciary, the existence of corruption within the judiciary, and the ability of individuals and businesses to enforce contracts. Its freedom from corruption index relies upon Transparency International’s Corruption Perception Index that measures the extent to which corruption prevails in a country.

ERI Discussion Paper Series No. 2
66
countries only after two countries, Italy and Argentina, since the Heritage Foundation started publicizing the index. In terms of property rights Mongolia’s deterioration is only exceeded by Argentina, Saudi Arabia, Thailand and Venezuela among the world’s 181 countries. Failing to reverse this trend in institutional deterioration would result in not only the failure to tackle all the macroeconomic risks discussed in this paper, but also endanger social stability in Mongolia. Another disturbing sign is the recent change of election rule; from being a majoritarian into mixed one. The new rule, which allows 28 out of 76 Members of the Parliament getting elected through the Party list and was used for the 2012 Election, opened doors for those with good connections with party leaders and/or contributed most financially. But Anderson and Aslaken (2008) show natural resources are more likely to reduce growth when exactly this type of proportional electoral systems are in place than when the electoral systems are majoritarian. Moreover Kunikova and Rose-Ackerman (2005) show the proportional or mixed election rules tend to create environments where corruption and rent-seeking flourish compared to the majoritarian system
Figure 24: Dynamics in Heritage Foundation indices. Each dot represents a country
Source: World Bank.
Thus, although the advantages of the new proportional election rule adopted in Mongolia could be significant compared to the earlier rule, the country needs to rethink in terms of the current economic reality where decisions about her point resource based rents being made by ever decreasing number of political elites.
6.2 Resource dependency and prospects for higher unemployment
Currently important labor market adjustments are happening in Mongolia. Agriculture has been dominating Mongolian labor market since the collapse of the socialism in early 1990’s and still is the biggest single employer. Figure 25 shows the dynamics of the Mongolian labor force by economic sectors.
0
20
40
60
80
100
0 20 40 60 80 100
1996
2012
Freedom from corruption
IrelandQatarChileUruguayEstoniaCyprus
Spain BhutanCosta Rica
BelizePapua New GuineaKenyaNigeria
ArmeniaMongolia
0
20
40
60
80
100
0 20 40 60 80 100
1996
2012Property rights
BelizeMongolia
SwitzerlandSwedenFranceEstoniaSpainSt.VincentPortugalSt.Lucia
Israel CzechHungaryBotswana
NamibiaGambia
UgandaPakistan

Since thmining a2011 (ancommunemploymPublic auninterruto its pr4% of tintensity Figure 25order accdifferencwithout c
In contrabeen strrespectiv2001, retransitio
This expthe resouintensiveexpectedpotential11.6%, 9 32 Only ex33 Bersch and Quahreal GDP.years withfrom a VAAs can be
he NSO starand quarryinnual grownication secment was thadministratiupted growtre 2009 levethe total any.
5: First panecording to t
ce between tcreating infla
ast, the agriruggling tovely in the leversing then related un
pansion of murce pull efe agriculturd to rise. Thl output, is9.9% and 7
xception for thand Sinclair (
h’s (BQ, 1989. Here I replich only three epAR on real GDe seen from Fig
Macroecon
rted producing separate
wth of 1.9%ctor due to thhe second ion and deth32 while eel. Notwith
nd is not ex
el shows thetheir size inthe actual anationary pres
iculture ando retain itslast 17 yeare earlier minemployme
mining andffects of there and induhe current ms largely po7.7% in the
he unabated gr(2011) compa) method as i
cate their resulpisodes of theDP growth angure 25 BQ’s
nomic risks of
cing a compely from the
%). The highe birth of Ifastest and efense shruemploymenthstanding thxpected to
e number of n 2011. Thend potential sures and po
d manufactus employmrs. Employmigration trennt.
d non-tradab Dutch dise
ustry erodesmeasure of tositive sinc
e last three
rowth in the pare various meit yielded morlt with a longee economy pernd inflation w
output gap is
f Mongolia an
67
prehensive le manufactuhest increaIT and mobother non-
unk almost t in the min
his growth trise signifi
f employees e second pan
output. A zositive gap in
uring, whichment: the ement in the nd from the
bles at the eease phenoms the naturathe output gce late 200years (Figu
public sector eeasures of outpre robust resuer sample. BQrforming unde
with a lag leng reasonably id
nd ways to mi
labor classiuring the lase was in t
bile phone c-tradable em
by 9% inning grew bythe mining icantly in t
in thousandsnel shows a
zero gap meandicates the e
h make up mploymentagricultura
e urban to
expense of tmenon. As tal rate of ungap, the dif
09 but the uure 25, seco
employment prput gaps for M
ults whether itQ output gap her its potentia
gth of 4, selectdentifying dzu
tigate them
ification in abor force inthe transpo
companies. Tmployment n 2011 revy 28% in 20employmen
the long run
s. They are an estimate ans that the economy is o
Mongolia’st grew onlal sector starrural areas
the tradablethe competinemploymefference betunemploymond panel)3
rior to that waMongolia and t’s applied to has been largeal. This outputted with Akaiud’s of 1999 a
1994 that tncreased by
ortation, stoThe rise in is also on
versing its 011 almost rnt accounts n due to it
ranked in deof the outpeconomy is
overheating.
s tradable sly 2.1% anrted to declto escape
es is consistiveness in
ent in the cotween the acment level h33. Accordin
as in 1998. recommends mineral or no
ely positive in t gap measureike Informatioand 2001 as w
treats the y 37% in rage and mining’s the rise. trend of returning for only
ts capital
escending ut gap, a s growing
ector has nd 2.5% line since from the
tent with the labor ountry is ctual and has been ng to the
Blanchard on-mineral the last 15
e is derived on Criteria. ell as 2009

ERI Discussion Paper Series No. 2
68
well known Okun’s law any mechanic attempt to reduce unemployment when the economy is above its potential results in nothing but overheating. This reflects itself in price increases including that for labor. Although the merit of the law is often debated the basic idea is hard to dismiss: improve the quality of and access to the education.
Figure 26: The first panel plots the number of families involved in herding by herd size (LHS) and the number of livestock per family (RHS). The second panel graphs herder dynamics (in thousands, LHS) by age decomposition and the number of herders in a herder family (RHS).
Source: NSO Statistical Yearbooks.
This labor market adjustment is however increasing the vulnerability in the agricultural sector. The first panel of Figure 26 illustrates the number of herder families in terms of their herd-size. It reached a peak of 301474 in 1992 after the collapse of socialism and related closures of factories in urban areas. Since then the number of herding families declined significantly, perhaps with faster speed during the dzuds, to 211743 in 2011. Families with unsustainably few or, economically unprofitable livestock tended to leave herding before 2007 but that trend seems to have stalled perhaps due to the lack of opportunities elsewhere. But the youth defies this trend and is progressively leaving herding as witnessed by their reduced proportion of 41% compared to 58% in 1995 (second panel of Figure 26).
However this decline is happening against the rising number of livestock, thus increasing the vulnerability of this sector in the absence of corresponding technological and/or organizational improvements. The number of livestock was 25.7 mln in 1992 and reached 44 mln by 2009, which translated into more than 190 livestock per herding family and more than 16 animals per population. Such a large number of livestock was never heard of in Mongolia even during the centrally planned economy when it kept at 12 livestock per person (Boone, 1994). This increase conflated with a shift in herd composition in favor of pasture-hostile goats, due to their valuable cashmere, brought with them over-grazing problems and sustainability issues (so called tragedy of the commons). Large number of herds neither meant more productive livestock sector nor cheaper meat as slaughtered meat weight per livestock has been on the
recession as below potential periods. Interestingly it also picks up a near potential output in the first quarter of 2011. I use quarterly data from the first quarter of 1998 to the second quarter of 2012 that have been seasonally adjusted according to Bataa (2013a). When the VAR model is subjected to structural break test as in Bataa et al. (2013a) no break is detected.

Macroeconomic risks of Mongolia and ways to mitigate them
69
decline since 1991 and the real mutton price has been on the rise (Figure 27). The record large number of livestock per person in 2008 coincided with a record high meat price in real terms. It appears that whenever the number of livestock exceeds the long term average of 12 per person it corrects itself (Figure 27). The herd size build-ups of 1994-1998 and 2005-2009 reversed by the loss of approximately 11 million adult animals in each case during the dzuds (extremely cold winters). The build-up seems to be happening again, witnessed by the soaring meat prices and sharp increase in livestock per family in 2011. Universal cash transfers, subsidization of the tuition fees and monthly allowances for the students, including those from rural areas, are contributing to this trend as they act to deter economic engagements of otherwise self sufficient herders. Current disconnect between the herders and the state should be restored through taxes in return for private ownership of pasture land, improved access to markets and better public goods.
Figure 27: Selected agricultural indicators
Source: NSO Statistical Yearbooks.
Lack of engagements in market transactions translates into the lowest growth of income opportunities for the agricultural sector. Figure 28 shows the real wage dynamics in Mongolian economy by sectors. Real wages have been increasing significantly throughout the economy, spearheaded by the financial sector where the wages have increased almost 14 times since the last quarter of 2001. Mining wages have been growing fast and are predicted to takeover those in the financial sector. This will increase the wage pressure for the rest of the economy as the employment size is almost three times bigger than the latter. Such a large sudden increase reflects a skills mismatch among the graduates Mongolian educational system is providing and the mining sector’s demand for qualified staff on a timely basis.
This may entail a further loss of competitiveness in the tradable sectors such as manufacturing and agriculture. Real wages in Chinese manufacturing has been increasing over the years yet

ERI Discussion Paper Series No. 2
70
their monthly wage is very competitive compared to what’s offered in Mongolia34. In fact when their hourly wage is converted into Mongolian Togrog using 160 working hours per week (Mongolian normal employment hours) only agriculture, hotels and trade sector has cheaper labor compared to the Chinese manufacturing sector.
Figure 28: Real wages in thousand MNT per month (expressed in 2012.Q2 ? using Mongolian CPI). These are ordered according to their latest level. Chinese manufacturing hourly rate is multiplied by 160 hours a month and converted to MNT using the Yan/MNT exchange rate and weighed using Mongolian CPI. It’s also deflated using Mongolian CPI to allow comparison.
However Mongolia needs competitive manufacturing, that is claimed to have many social fringe benefits (Matsuyama, 1992) and is able to accommodate large amounts of labor. If the current trend is left on its own, the natural rate of unemployment will go up as the mining is not labor intensive. Given that Chinese manufacturing wage is extremely competitive it’s hard to see Mongolia enter into labor-intensive manufacturing with low-skills requirements. However improved quality and accessibility of education at all levels compared to what’s currently offered in Mongolia and elsewhere in the region can increase the chances of high-skilled manufacturing and/or knowledge based economy. Increased flexibility of foreign workers entering Mongolia’s labor market and seasonal nature of the mining and construction sectors are likely to pose further challenges in maintaining the economic competitiveness of the Mongolian workforce without jeopardizing the current pace of expansion.
34 Banister, J. and Cook, G. China's employment and compensation costs in manufacturing through 2008. Monthly Labor Review, March 2011, 39-52.

Macroeconomic risks of Mongolia and ways to mitigate them
71
6.3 Income inequality, weak institutions, and resource dependent economy
Mongolian population had relatively equal opportunities just after the collapse of the socialism, like any other post communist countries that started the transition to the market system more or less simultaneously. As the economy shifts from a labor intensive agricultural sector not to its preferred next stage of manufacturing based economy but to capital intensive one more unemployment and income divergence is expected. Moreover a point-based nature of the resources will contribute even further to this trend.
But this widening gap in income and opportunities among the population might endanger the social and economic stability. Mongolia’s latest measured Gini coefficient of income inequality was 36.6 (the higher the coefficient the more inequality) in 2006 compared to its first measurement of 33.2 in 1995 indicates a rising inequality; there is every indication that it’s gone up significantly since then. Chile and Botswana that Mongolia sees as role model economies in terms of its resource management have Gini coefficients of 52.3 and 61 respectively.
According to Guriev, Plekhanov and Sonin (2009) there is an important interaction between resource wealth and inequality. When resource rents are large, it is easier to buy off the voters without achieving real redistribution or implementing development-friendly policies. Conversely, when total rents are appropriated by fewer individuals, rent-seeking (and weak institutions that make rent-seeking possible) become even more attractive to the members of the elite. In this way, weak institutions and high inequality can feed off each other in an economy with large natural resources.
High inequality can be harmful for growth for several reasons. In an unequal society with imperfect capital markets, many talented people will have no access to capital or education, resulting in individual poverty traps. High inequality may also bias government policies towards redistribution policies that hurt growth, as the relatively poor median voter would prefer to have more redistribution (Persson and Tabellini, 2000, and Acemoglu, Robinson, and Verdier, 2004), which may result in procyclical fiscal policy (Alessina, Tabellini, and Campante, 2008).
Figure 29 shows the changes in the income inequality of a group of countries that have similar socio-economic backgrounds as Mongolia35. As a rough indication, the countries above the red line are those that have deteriorating income inequality.
Increasing the quality of and access to education, especially the primary education, can improve the labor force competitiveness and encourage manufacturing that requires higher-skills. Moreover, there are some policy measures that are outdated and could even exacerbate income inequality. These include de-facto exemption of dividend and interest income from the income tax law and that of the residential properties from the real estate tax law.
35 Note that the dates the countries first measured their Gini coefficients are different but the most recent ones are always in 2006.
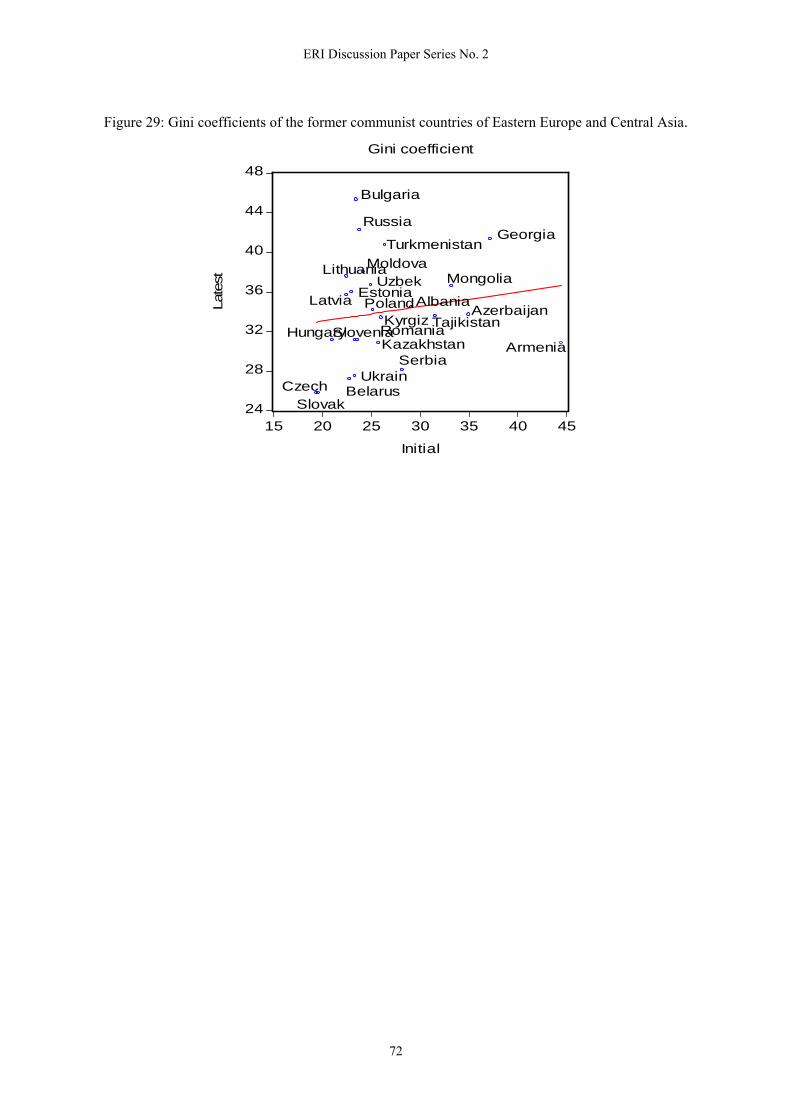
ERI Discussion Paper Series No. 2
72
Figure 29: Gini coefficients of the former communist countries of Eastern Europe and Central Asia.
24
28
32
36
40
44
48
15 20 25 30 35 40 45
Initial
Late
st
Gini coefficient
AlbaniaAzerbaijan
Armenia
Belarus
Bulgaria
Czech
Estonia
Georgia
HungaryKazakhstan
KyrgizLatvia
LithuaniaMoldovaMongolia
Poland
Romania
Russia
Serbia
Slovak
SloveniaTajikistan
Turkmenistan
Ukrain
Uzbek

Macroeconomic risks of Mongolia and ways to mitigate them
73
7. Conclusion and policy recommendations
This paper identifies and discusses some macroeconomic risks of Mongolia and possible way to mitigate them. These risks have been classified into four main themes: Financial market risks, portfolio risk of Mongolian export basket, macroeconomic mismanagement, and institutional deterioration.
The most important of these, in my view, is the possible deterioration in the institutional quality. Since the point resources are easy to appropriate various interest groups have incentives to distort the institutions so that extracting the rent is easier. Fighting corruption and creating a stable legal environment where the rule of law and the property rights are respected should be high on the agenda. The author fears that the recent change in the election law from being majoritarion based system into mixed one is a step towards a wrong direction. Existing empirical evidence show that natural resources are more likely to reduce growth when proportional electoral systems are in place than when the electoral systems are majoritarian and the proportional or mixed election rules tend to create environments where corruption and rent-seeking compared to the majoritarian system. What is missing for Mongolia is the checks and balances of democracy and active participation by informed agents not a wrong election rule. More economic internal risks discussed were higher unemployment due to the capital intensive mining’s prominence in the economy, income inequality due to the point-source nature of the income generator, financial sector’s limited ability to handle the influx of foreign capital (some of which are speculative), and mis-coordination between monetary and fiscal policies.
Finally, current developments on the composition of Mongolia’s export basket are explored. Increased importance of coal in Mongolia’s export basket is seen as a negative development in a sense that it’s price has been more volatile historically and price increases over the years were more erratic. This begs the question of should Mongolia start thinking about optimal extraction policy of its mineral reserves, given their non-renewable nature. The following are recommended on the basis of the above discussion:
1. Given that Mongolia’s economic growth, budget and export income largely depend on
inherently volatile mining sector it’s vital to have a larger buffer. This translates into enlarging the existing stabilization fund and clarifying its expenditure rules so that it cannot be used for purposes other than its mandated role.
2. The amount and speed of concentration of the consumer and real estate related loans should be capped through prudential banking regulations. It’s recommended to require commercial banks to put aside additional reserves on the basis of maturity mismatch between its deposits and loans. Properly designed and managed unified customer loan database and deposit insurance system should be implemented as soon as possible. It’s also vital to keep inflation at low and stable level to enable financial deepening.
3. It’s important to note that the government expenditure growth is playing increasingly larger role in the overall economic fluctuations. Therefore it should be recommended to take into account the exiting business cycle measurements such as output gap before implementing government expenditure programs. The government initiatives in

ERI Discussion Paper Series No. 2
74
fighting corruption, enforcing contracts and improving institutional quality are expected to have broad impact.
4. As Mongolia’s comparative advantage lies in the mining the competitiveness of the other traditional economic sectors are being eroded. Retraining the labor force for this new environment and improving the quality and access to education should be high on the agenda. In the meantime the government should abstain from attempting to identify economic sectors that could be successful in the future as history shows this often leads to wrong identification.
5. It’s important to encourage the herders to actively participate in economic transactions. Improving the infrastructure and access to markets, introducing the pasture ownership in return for taxes and other regulations to curb the excessive livestock are important steps to that end.
6. Stable and profitable functioning of the Development Bank of Mongolia should be maintained as its potential to affect Mongolia’s financial sector standing on the international market is significant. Payments associated with its bonds could be linked with GDP growth or commodities to reduce its risk.
7. It’s vital not to exacerbate income inequality through legal means: these include exemption of dividend and interest income from the income tax law and that of the residential properties from the real estate tax law. Abolition of these exemptions will not only improve the fairness of the tax system but also reduce Mongolia’s future reliance on debt issuance.
Macroeconomic risks of Mongolia and ways to mitigate them
75
References
Acemoglu, D., Robinson, J.A. and Verdier, T. 2004. Kleptocracy and divide-and-rule: a model of personal rule. Journal of the European Economic Association 2(2-3), 162-192.
Alesina, A., Tabellini, G., and Campante, F.R. 2008. Why is fiscal policy often procyclical? Journal of the European Economic Association 6(5), 1006-1036,
Andersen, J.J., and Aslaksen, S. 2008. Constitutions and the resource curse. Journal of Development Economics 87, 227-246.
Barro, R. J. & Lee, J. W. 2005. IMF-programs: Who is chosen and what are the effects? Journal of Monetary Economics 52(7), 1245-1269.
Bataa, E., Osborn, D.R., Sensier, M. and van Dijk, D. 2013a. Structural breaks in the international dynamics of inflation. Review of Economics and Statistics 95(2), 646-659.
Bataa, E., Osborn, D.R., Sensier, M. and van Dijk, D. 2013b. Identifying changes in mean, seasonality, persistence and volatility for G7 and Euro area inflation, forthcoming in Oxford Bulletin of Economics and Statistics.
Bataa, E. 2012a. Structural changes in the components of Mongolian macroeconomic aggregates. Mimeo, National University of Mongolia (in Mongolian, available at http://www.eri.mn/index.php/en/l?task=view&catid=49&id=622)
Bataa, E. 2012b. Oil shock and Mongolia. Mimeo, National University of Mongolia (in Mongolian, available at http://www.eri.mn/index.php/en/l?task=view&catid=54&id=413)
Bataa, E. 2012c. Philips curve and Mongolia. Mimeo, National University of Mongolia (in Mongolian, available at http://www.eri.mn/index.php/en/l?task=view&catid=49&id=621)
Batdelger, T. 2012. Risk report of Mongolia. mimeo.
Becker, T. I., Jeanne, O., Mauro P., Ostry, J.D., and Ranciere, R. 2007, Country insurance: the role of domestic policies. IMF Occasional Paper 254.
Bersch, J. and Sinclair, T.M. 2011. Mongolia: Measuring the output gap. IMF Working paper WP/11/79
Bertinelli, L., Heinen, A., Strobl, E. 2009. Export diversification and price uncertainty in developing countries: A Portfolio theory approach. Mimeo.
Boone, P. 1994. Grassroots macroeconomic reform in Mongolia. Journal of Comparative Economics 18, 329-356,
Cashin, P., Cespedes, L. F. & Sahay, R. 2004. Commodity currencies and the real exchange rate. Journal of Development Economics 75(1), 239-268,
Claessens, Stijn. 1991. Integrating commodity and exchange rate risk management: Implications for external debt management in Priovolos and Duncan, eds. Commodity risk management and finance. Oxford; New York; Toronto and Melbourne: Oxford University Press for the World Bank, pp. 95-114

ERI Discussion Paper Series No. 2
76
Clairida, R., Gali, J. and Gertler, M. 1999. The science of monetary policy: A New Keynesian perspective. Journal of Economic Literature 37, 1161-1707.
Collier, P. and Hoeffler, A. 1998. On Economic causes of civil war. Oxford Economic Papers 50, 563-573.
Collier, P. and Hoeffler, A. 2004. Greed and grievance in civil war. Oxford Economic Papers 56, 563-595.
Credit Suisse, 2012. Commodities Forecast Update: The pause that refreshes.
Cuddington, J.T., and Jerrett, D. 2008. Super cycles in real metals prices? IMF Staff Papers 55(4), 541-565.
Davis, J., Ossowski, R., Daniel, T., and Barnett, S. 2001. Stabilization and savings funds for nonrenewable resources: experience and fiscal policy implications. IMF Occasional Paper 205.
Davis, J., Ossowski, R., Daniel, T., and Barnett, S. 2001. Oil funds: problems posing as solutions? Finance and Development 38(4)
Dawe, D. A New look at the effects of export instability on investment and growth. World Development 24(12), 1905-1914.
Dreher, A. 2006. IMF and Economic Growth: The Effects of Programs, Loans, and Compliance with Conditionality. World Development 34, 5: 769-788.
Dreher, A. , and Walter, S. 2010. Does the IMF Help or Hurt? The Effect of IMF programs on the likelihood and outcome of currency crises. World Development 38(1), 1-18.
Ehrlich, I. and Lui, F.T. 1999. Bureaucratic corruption and endogenous economic growth. Journal of Political Economy 107(6), S270S293.
Fasano, U. 2000. Review of the experience with oil stabilization and savings funds in selected countries. IMF Working Paper 00/112.
French. K.R. 1983. A Comparison of futures and forward price. Journal of Financial Economics 12, 311-342.
Gan-Ochir, D. 2012. Economic vulnerability of Mongolia, Mimeo (in Mongolian, available at http://www.eri.mn/index.php/en/l?task=view&catid=49&id=623).
Guriev, S., Plekhanov, A., and Sonin, C. 2009. Development based on commodity revenues. EBRD Working Paper 108.
Hausmann, R., and Gavin, Securing stability and growth in a shock-prone region: the policy challenge in Latin America. In Security, Stability and Growth in Latin America, Hausmann, R., and Reisen, H. eds. OECD.
Hendry, D.F. 1995. Dynamic econometrics, Oxford University Press.
Knack, S. and Keefer, P. 1995. Institutions and economic performance: cross-country tests using alternative institutional measures. Economics and Politics 7, 207227.
O’Hara, M. 1984. Commodity bonds and consumption risks. Journal of Finance 39, 193-206.
Ilzetzki, E. and Vegh, C.A. 2008. Procyclical fiscal policy in developing countries: Truth or fiction? NBER working paper series 14191,

Macroeconomic risks of Mongolia and ways to mitigate them
77
IMF. 2005. Mongolia: Ex-post assessment of longer term program engagement. Country report No. 05/407.
IMF. 2008. Mongolia: Selected Issues and Statistical Appendix. Country report No. 08/201.
IMF. 2011. Mongolia: Financial system stability assessment. Country report No. 11/107.
IMF. 2010. IMF-FSB Early warning excercise.
IMF. 2012. Mongolia: Second post-program monitoring discussions. Country report No. 12/52.
IMF. 2012. Mongolia: Second post-program monitoring discussions. Country report No. 12/52.
Isakova, A., Plekhanov, A., and Zettelmeyer, J. 2012. Managing Mongolia’s resource boom. EBRD working paper No.138.
Hutchison, M. M. and Noy, I. 2003. Macroeconomic Effects of IMF-sponsored Programs in Latin America: Output Costs, Program Recidivism and the Vicious Cycle of Failed Stabilization. Journal of International Money and Finance 22 (7), 991-1014
Kletzer, Kenneth, David Newbery and BrianWright. 1990. Alternative instruments for smoothing the consumption of primary commodity exporters. Policy, research, and external affairs working papers WPS 558. Washington, D.C.: World Bank.
Kaminsky, G.L., Reinhart, C.M., and Vegh, C.A. 2004. When it rains, it pours: Procyclical capital flows and macroeconomic policies. NBER Macroeconomics Annual 19,
Kaufmann, D., Kraay, A. and Mastruzzi, M. 2010. The Worldwide governance indicators: A Summary of methodology, data and analytical issues”. World Bank Policy Research Working Paper No.5430
Kunicova, J., and Rose-Ackerman, S. 2005. Electoral rules and constitutional structures as constraints on corruption. British Journal of Political Science 35(4), 573-606.
Lane, P R and A Tornell.1999. The Voracity Effect. American Economic Review 89(1), 22-46.
Larkin, S., G. Sylvia and C. Tuininga. 2003. Portfolio analysis for optimal seafood product diversification and resource management. Journal of Agricultural and Resource Economics 28(2). 252-271.
Larson, D.F., Varangis, P. and Yabuku, N. 1998. Commodity risk management and development. World Bank Policy Research Working paper 1963.
Lee, E. 1992. Initiating transition in a low-income dualistic economy: the case of Mongolia. International Labour Review 132, 623-638,
Loukoianova. E. 2011. A Puzzle of high interest rates in Mongolia. In Mongolia FSAP Note.
Love, J. 1979. Model of trade diversification based on the Markowitz model of portfolio analysis. Journal of Development Studies 15(2), 233- 241.
Markowitz, H. M. 1952. Portfolio selection, Journal of Finance 7, 77-91.
Marshall, R. and B. Walters. 2010. Financial Crises in an Asian Transitional Economy: the Case of Mongolia. In: Tavasci, D and J. Toporowski, editor(s). Minsky, Crisis and Development. 1st ed. London: Palgrave Macmillan;

ERI Discussion Paper Series No. 2
78
Matsuyama, K. 1992. Agricultural productivity, comparative advantage, and economic growth. Journal of Economic Theory 58, 317-334.
Mauro, P. 1995. Corruption and growth. Quarterly Journal of Economics 110, 681-712.
Mehlum, H, Moene, K and R Torvik. 2006. Institutions and the resource curse. Economic Journal 116(508), 1-20.
North, D. 1990. Institutions, institutional change and economic performance. Cambridge University Press, Cambridge.
North, D. and Weingast, B. 1989. Constitutions and commitment: the evolution of institutions governing public choice in seventeenth-century England. Journal of Economic History 49,803-832.
Persson, T and G Tabellini, 2003. The Economic Effects of Constitutions. MIT Press, London.
Pindyck. R.S. 1994. Inventories and short-run dynamics of commodity prices. Rand Journal of Economics 25, 141-159.
Pindyck, R. S., and Rotemberg, J. J. 1990. The Excess co-movement of commodity prices. Economic Journal 100(403), 1173-1189.
Persson, T. and Tabellini, G. 2000, Political economics, MIT Press, Cambridge, MA.
Przeworski, A. & Vreeland, J. R. 2000. The Effect of IMF programs on economic growth. Journal of Development Economics, 62, 385-421.
Rossabi, M. 2005. Modern Mongolia: From Khans to commissars to capitalists. University of California Press.
Rolfo, J. 1980. Optimal hedging under price and quantity uncertainty: The case of a cocoa producer. Journal of Political Economy 88(11), 100-116.
Sala-i-Martin, Xavier X., 1997. I just ran two million regressions. American Economic Review 87, 178-183.
Sharpe, W.F., Alexnader, G.J., Bailey, J.V. 1999. Investments. 6th edition, Prentice-Hall.
Shleifer, A. and Vishny, R. W. 1993. Corruption. Quarterly Journal of Economics 108, 599-617.
Seth, A., and Ragab, A. 2012. Macroeconomic vulnerability in developing countries: approaches and issues. Working paper 94, International Policy Centre for Inclusive Growth.
Torvik R. 2002. Natural resources, rent seeking and welfare. Journal of Development Economics 67, 455-470.
Wall Street Journal Asia Blog. Dec. 2010. MNT best-performing currency against USD