05 frequency response functions
TRANSCRIPT

Department of Mechanical Engineering, NTU
National Taiwan UniversityENGINEERINGMechatronic and Robotic Systems Laboratory
System Dynamics
Yu-Hsiu Lee
5. Frequency Response Functions

11/24/2021 2Mechatronic and Robotic Systems Laboratory, Department of Mechanical Engineering, NTU
Outline
• Frequency response function
Mechanical resonance
• Bode plot
Basic elements
Bode plot of basic elements
Examples
Frequency Response Function
11/24/2021 4Mechatronic and Robotic Systems Laboratory, Department of Mechanical Engineering, NTU
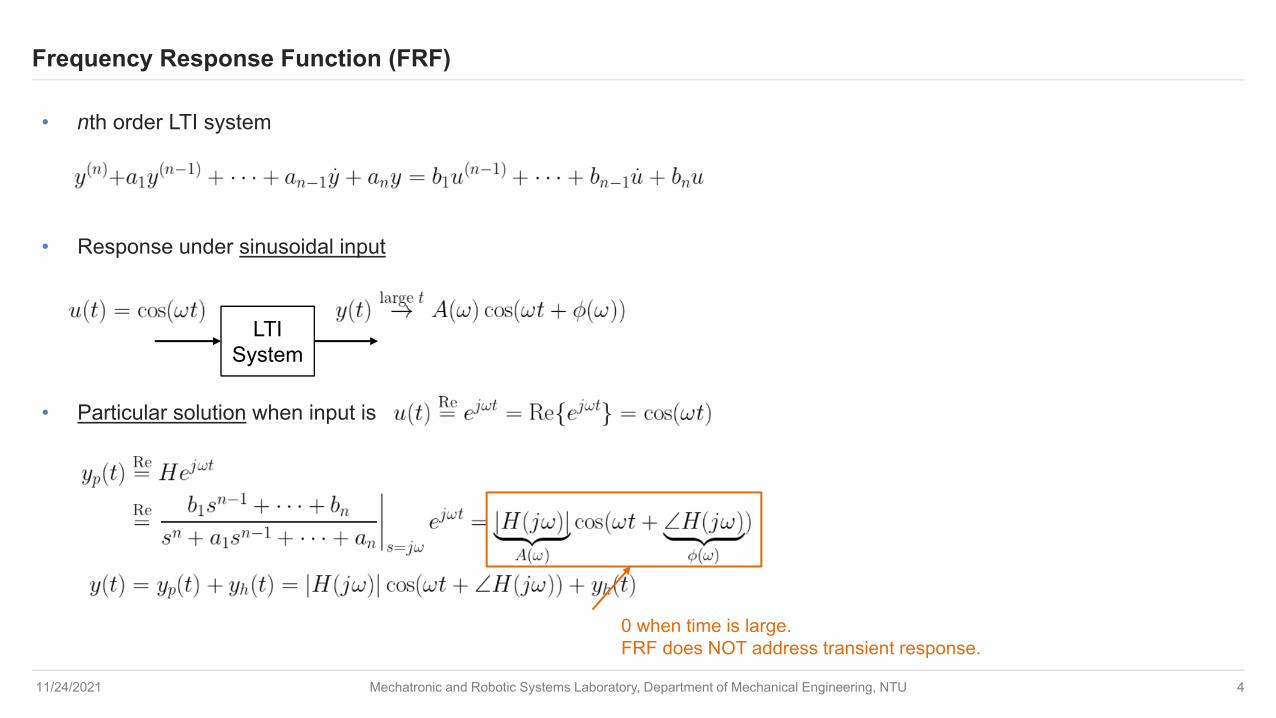
Frequency Response Function (FRF)
• nth order LTI system
• Response under sinusoidal input
• Particular solution when input is
LTISystem
0 when time is large.FRF does NOT address transient response.
11/24/2021 5Mechatronic and Robotic Systems Laboratory, Department of Mechanical Engineering, NTU
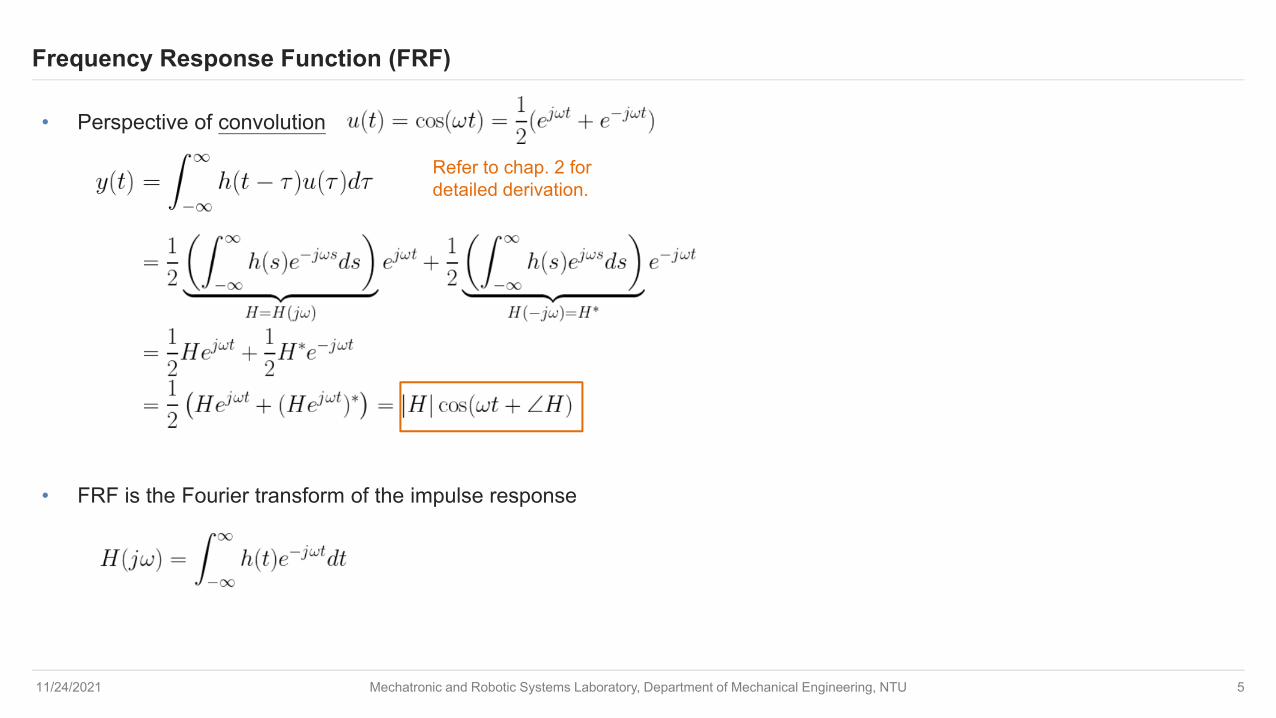
Frequency Response Function (FRF)
• Perspective of convolution
• FRF is the Fourier transform of the impulse response
Refer to chap. 2 fordetailed derivation.

11/24/2021 6Mechatronic and Robotic Systems Laboratory, Department of Mechanical Engineering, NTU
Frequency Response Function (FRF)
• Example: flapping wing
Substitute
• Magnitude and phase plot
Gain = 1.29
Delay = 15 [deg]
11/24/2021 7Mechatronic and Robotic Systems Laboratory, Department of Mechanical Engineering, NTU
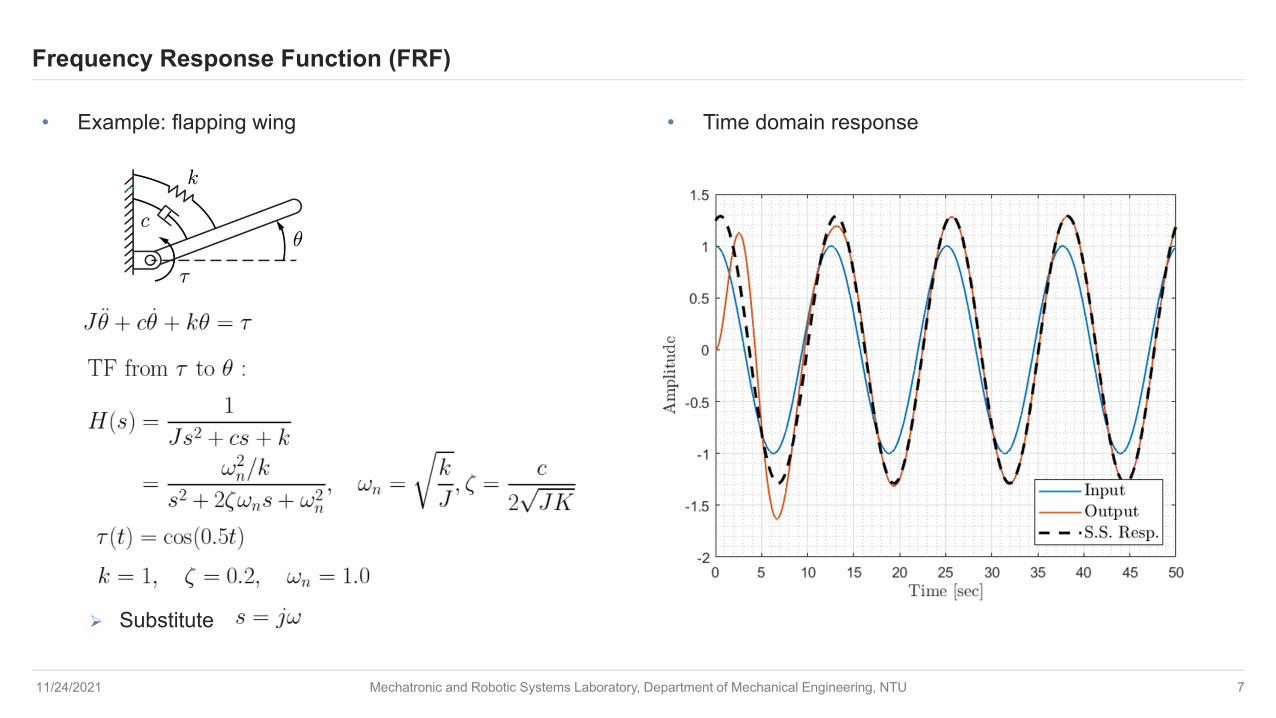
Frequency Response Function (FRF)
• Example: flapping wing
Substitute
• Time domain response
11/24/2021 8Mechatronic and Robotic Systems Laboratory, Department of Mechanical Engineering, NTU
Mechanical Resonance
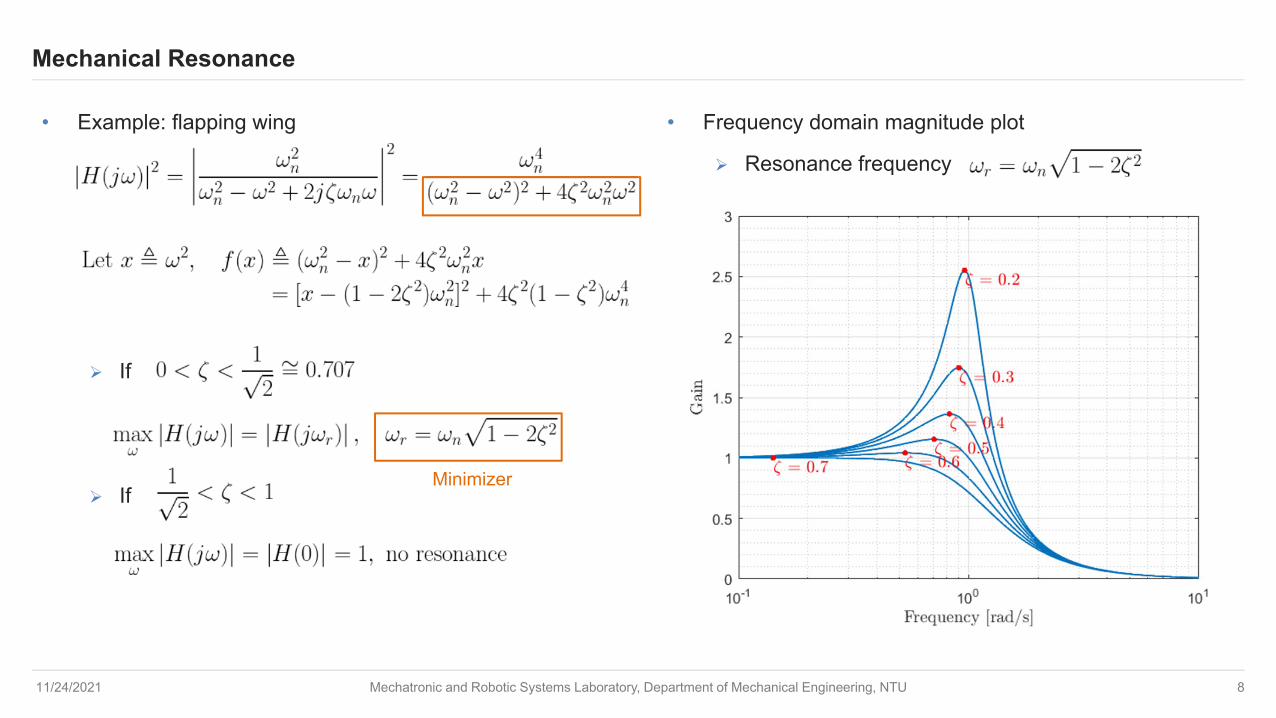
• Example: flapping wing
If
If
• Frequency domain magnitude plot
Resonance frequency
Minimizer

Bode Plot

11/24/2021 10Mechatronic and Robotic Systems Laboratory, Department of Mechanical Engineering, NTU
Bode Plot
• A special way of plotting FRF
Magnitude and phase plot
Log x-axis: display a wide range of frequencies
Log y-axis: multiplication is addition in log scale
Reason for using dB: originates from power ratio:
• Hand sketch and verify the trend in software rapidly.
MATLAB routines: bode, freqs, evalfr, …
• Example: flapping wing

11/24/2021 11Mechatronic and Robotic Systems Laboratory, Department of Mechanical Engineering, NTU
Basic Elements
• 1st order denominator • Bode plot
11/24/2021 12Mechatronic and Robotic Systems Laboratory, Department of Mechanical Engineering, NTU
Basic Elements
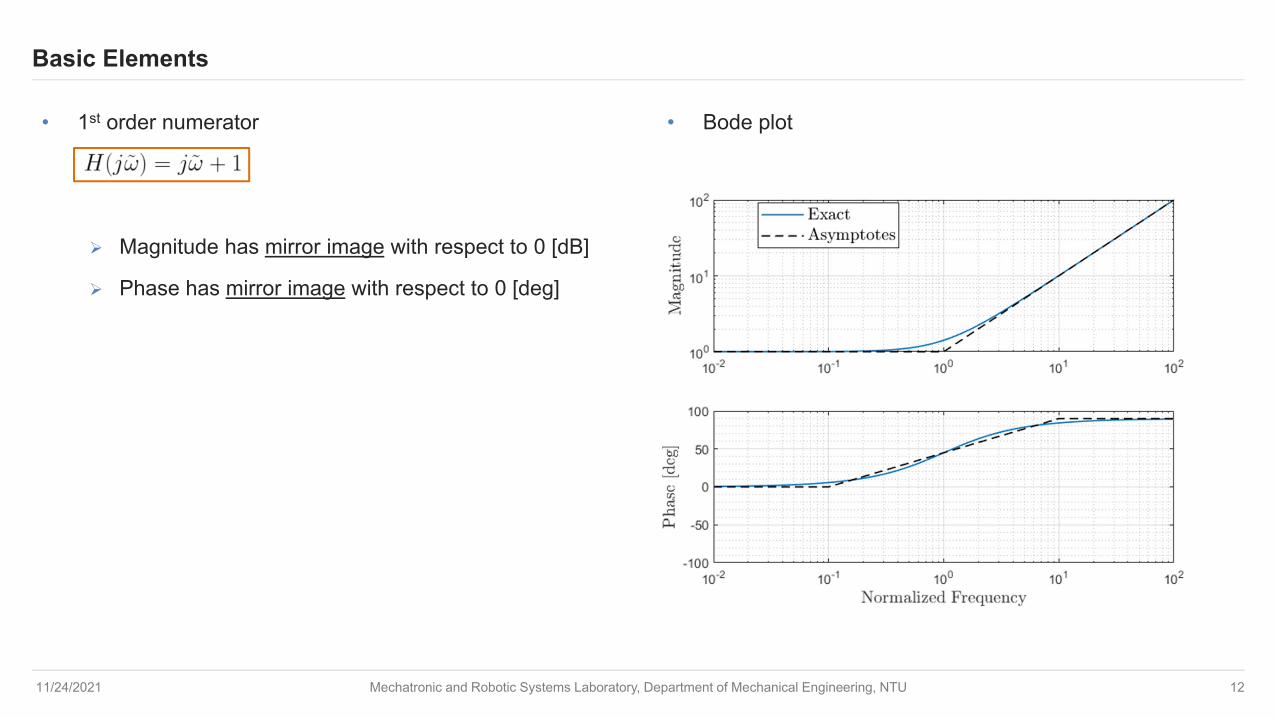
• 1st order numerator
Magnitude has mirror image with respect to 0 [dB]
Phase has mirror image with respect to 0 [deg]
• Bode plot

11/24/2021 13Mechatronic and Robotic Systems Laboratory, Department of Mechanical Engineering, NTU
Basic Elements
• Integrator • Bode plot

11/24/2021 14Mechatronic and Robotic Systems Laboratory, Department of Mechanical Engineering, NTU
Basic Elements
• Differentiator • Bode plot
11/24/2021 15Mechatronic and Robotic Systems Laboratory, Department of Mechanical Engineering, NTU
Basic Elements
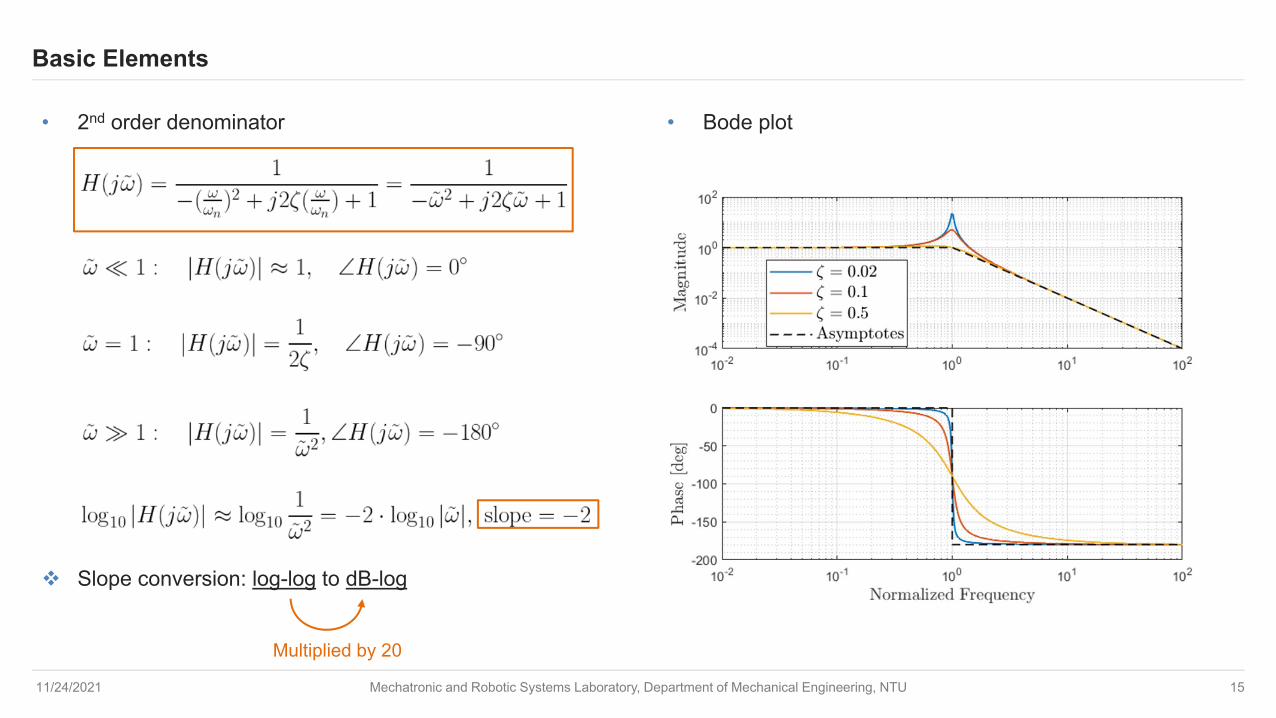
• 2nd order denominator
Slope conversion: log-log to dB-log
• Bode plot
Multiplied by 20

11/24/2021 16Mechatronic and Robotic Systems Laboratory, Department of Mechanical Engineering, NTU
Basic Elements
• 2nd order numerator
Magnitude has mirror image with respect to 0 [dB]
Phase has mirror image with respect to 0 [deg]
• Bode plot

11/24/2021 17Mechatronic and Robotic Systems Laboratory, Department of Mechanical Engineering, NTU
Examples
• Example: band-pass filter • Bode plot
11/24/2021 18Mechatronic and Robotic Systems Laboratory, Department of Mechanical Engineering, NTU
Examples
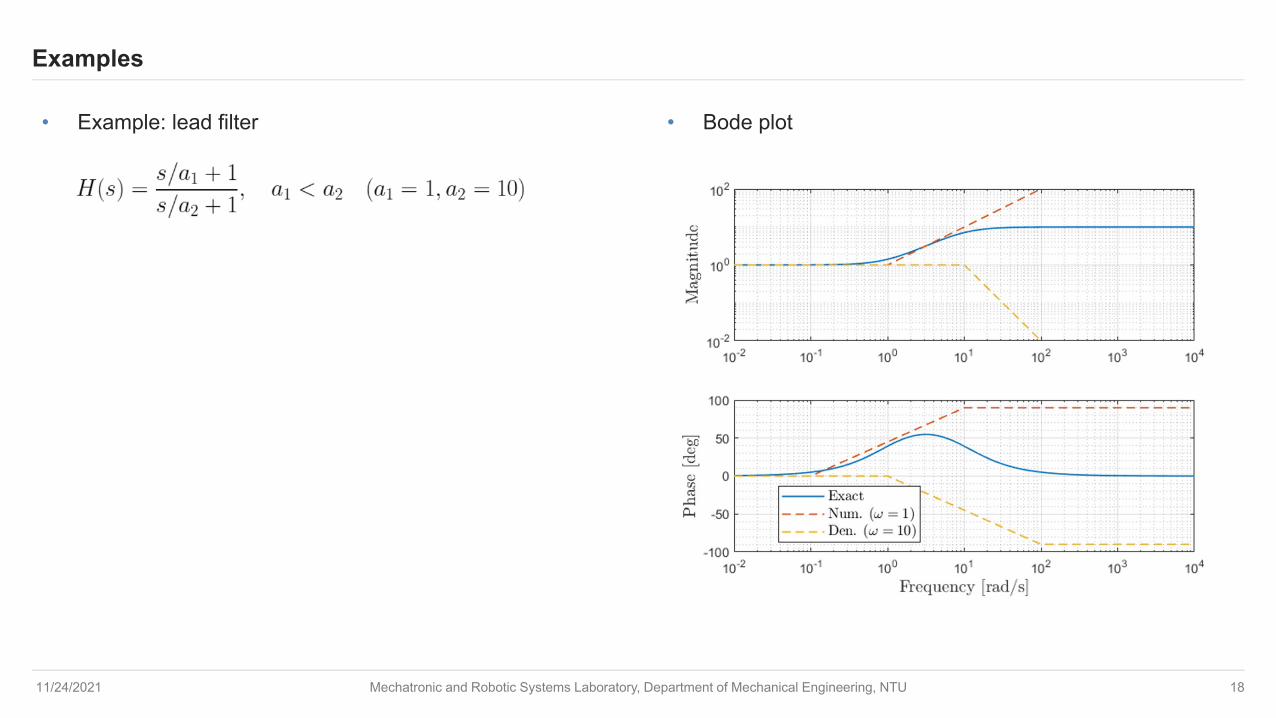
• Example: lead filter • Bode plot

11/24/2021 19Mechatronic and Robotic Systems Laboratory, Department of Mechanical Engineering, NTU
Examples
• Example: notch filter • Bode plot