04102012-press publication-2011 annual report-uk (1)
DESCRIPTION
m ,.TRANSCRIPT

This Registration Document was filed in the French language with the Autorité des marchés financiers on
April 10 , 2012 in accordance with article 212-13 of its General Regulations. It may be used to support a financial
transaction if accompanied by an information memorandum (note d’opération) approved by the AMF. It has been
prepared by the issuer and is the responsibility of the person whose signature appears herein.
This document is a translation of the original French document and is provided for information purposes only. In all matters of interpretation of
information, views or opinions expressed therein, the original French version takes precedence over this translation.
12
3
4
5
6
SELECTED FINANCIAL DATA 7
RISK FACTORS 112.1 Presentation of the principal risks 12
2.2 Risk management 20
2.3 Insurance and risk coverage 23
INFORMATION ON LAFARGE 253.1 The Group 26
3.2 Our strategy 27
3.3 Innovation 29
3.4 Our businesses 32
3.5 Intra-Group Relationships 44
OPERATING AND FINANCIAL REVIEW AND PROSPECTS 474.1 Overview 48
4.2 Accounting policies and definitions 49
4.3 Results of operations for the fiscal years
ended December 31, 2011 and 2010 52
4.4 Liquidity and capital resources 63
CORPORATE GOVERNANCE AND COMPENSATIONS 675.1 Board of Directors - Corporate Officers 68
5.2 Board and Committee rules and practices 86
5.3 Executive Officers 94
5.4 Compensations and benefits 95
5.5 Long-term incentives
(stock-options and performance share plans) 99
5.6 Share ownership 106
5.7 Implementation of the principle
“Comply or Explain” of the Afep-Medef Code 106
SHAREHOLDERS AND LISTING 1076.1 Major shareholders and share capital
distribution 108
6.2 Shareholders’ agreement 109
6.3 Threshold notifications imposed by law
and declarations of intent 110
6.4 Employee Share Ownership 111
6.5 Listing 112
7
8
9
10
F
SOCIAL AND ENVIRONMENTAL RESPONSIBILITY 1137.1 Introduction 114
7.2 Health and safety 117
7.3 Social information 119
7.4 Communities 122
7.5 Environment 124
7.6 Sustainable construction 134
7.7 Table of Key Performance Indicators 136
7.8 Reporting methodology 138
7.9 Independent assurance report
on environmental and social information
by Ernst & Young 140
ADDITIONAL INFORMATION 1438.1 Share Capital 144
8.2 Shares owned by the Company 145
8.3 Securities non representative
of share capital – Bonds 146
8.4 Authorizations delegated to the Board
of Directors 147
8.5 Articles of Association (Statuts) 148
8.6 Change of control 151
8.7 Material contracts 151
8.8 Documents on display 152
INTERNAL CONTROL PROCEDURES 1559.1 Report of the Chairman of the Board
of Directors on internal control
procedures and on corporate governance
(article L. 225-37 of the French
Commercial Code) 156
9.2 Statutory auditors’ Report, prepared
in accordance with Article L. 225-235
of the French Commercial Code
(Code de commerce) on the report prepared
by the Chairman of the Board
of Directors of Lafarge 159
AUDITING MATTERS 16110.1 Auditors 162
10.2 Auditors’ fees and services 163
10.3 Auditors’ reports 164
CERTIFICATION 165
FINANCIAL STATEMENTS F1
CROSS-REFERENCE TABLES 263
GLOSSARY 267
TABLE OF CONTENTS
GROUP PROFILE

1Lafarge | Registration Document | 2011
In 2011, the Group was operating in a highly contrasting economic environment.
The expected recovery of the construction sector in mature markets failed to
materialize. Meanwhile, the majority of emerging countries drove world growth
and sustained the construction sector. In this context, the Group announced a
current operating income of more than 2 billion euros with an operating margin
of over 14% and net income Group share of almost 600 millions euros .
During this past year we maintained our performance and accomplished
three major objectives: we met our debt reduction target of 2 billion euros; we
refocused on our core businesses of Cement, Aggregates and Concrete through
the divestment of the majority of the Gypsum Division; and we undertook a
project to profoundly reorganize the Group.
Lafarge enters 2012 with caution and determination, intending to establish a
new dynamic built on three key priorities:
• A 500 million euros cost savings program, with a target of at least 400 million euros
of savings generated by the end of 2012. After having delivered 250 million euros
of savings in 2011, we will further accelerate our efforts on all levers: reducing
overhead costs, improving industrial performance and logistics, and cutting our
energy bill;
• Action on our sale prices in response to cost inflation;
• Deleveraging our balance sheet by improving our cash flows, capping our
investments at 800 million euros and pressing ahead with our divestment
program, which should raise more than 1 billion euros.
Reinforced by a new organization and sustained by volume growth in emerging
countries where we operate, these actions will enable us to reduce our debt
substantially in 2012, strengthen our financial structure and differentiate our
offer still further to the construction markets .
REVENUES in million euros
1 5,284
PRODUCTION SITES
1,600
EMPLOYEES
68,000PRESENT IN
64 countries
Key figures at December 31, 2011
BRUNO LAFONT Chairman & Chief Executive Offi cer of Lafarge
BRUNO LAFONT
Editorial

Registration Document | 2011 | Lafarge2
GROUP PROFILE
Lafarge Board of DirectorsThe Boards of Directors has 17 members, of whom 10 are independent.
Lafarge Executive Committee
Michel Rollier, Michel Bon, Bertrand Collomb, Baudouin Prot, Philippe Charrier, Jérôme Guiraud, Ian Gallienne, Paul Desmarais, Jr. Philippe Dauman, Véronique Weill, Nassef Sawiris, Juan Gallardo
Hélène Ploix,Thierry de Rudder, Bruno Lafont, Colette Lewiner, Oscar Fanjul
Jean-Jacques Gauthier, Thomas Farrell, Christian Herrault, Jean-Carlos Angulo. Eric Olsen, Gérard Kuperfarb, Bruno Lafont, Alexandra Rocca, Jean Desazars de Montgailhard, Guillaume Roux
3Lafarge | Registration Document | 2011
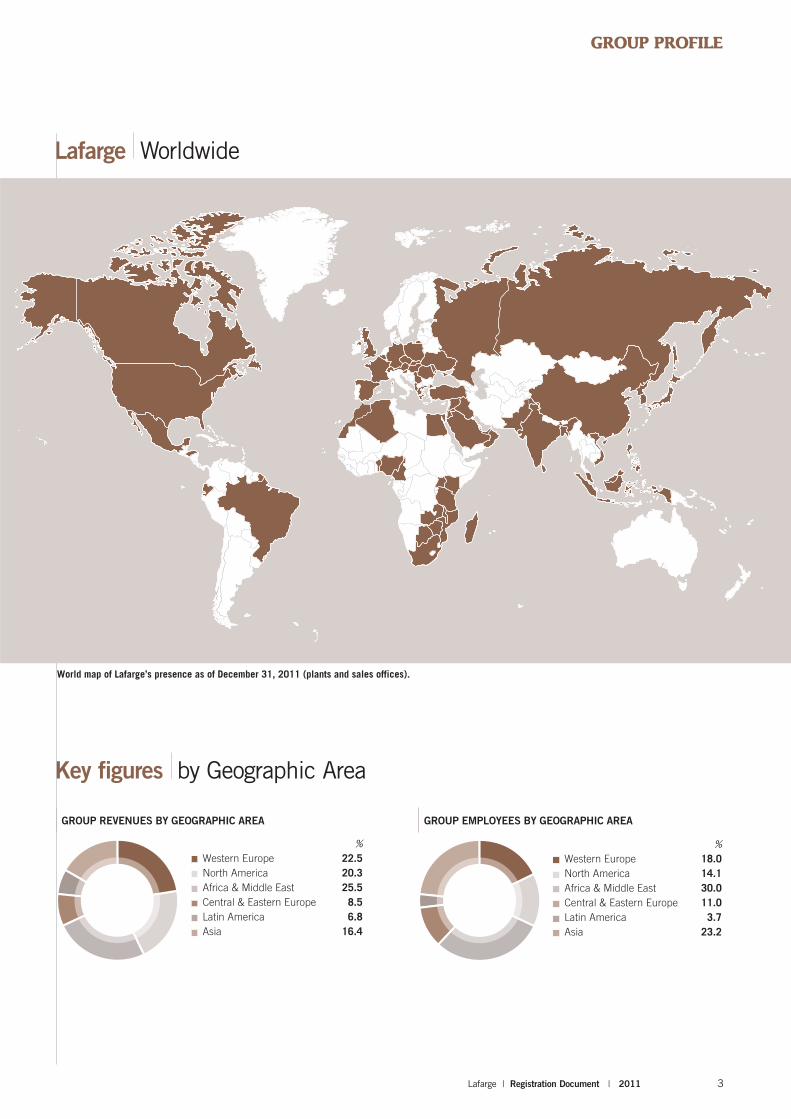
% Western Europe 22.5
North America 20.3
Africa & Middle East 25.5
Central & Eastern Europe 8.5
Latin America 6.8
Asia 16.4
GROUP REVENUES BY GEOGRAPHIC AREA
World map of Lafarge’s presence as of December 31, 2011 (plants and sales offices).
Key figures by Geographic Area
Lafarge Worldwide
GROUP PROFILE
% Western Europe 18.0
North America 14.1
Africa & Middle East 30.0
Central & Eastern Europe 11.0
Latin America 3.7
Asia 23.2
GROUP EMPLOYEES BY GEOGRAPHIC AREA

Registration Document | 2011 | Lafarge4
Cement 65.3%
Aggregates & Concrete 34.2%
Other 0.5%
GROUP REVENUES BY DIVISION
REVENUES in million euros
9,975NUMBER OF PLANTS
166NUMBER OF EMPLOYEES
43,400PRESENT IN
58 countries
REVENUES in million euros
5,227NUMBER OF PLANTS
1 ,438NUMBER OF EMPLOYEES
23,200PRESENT IN
35 countries
Cement World Leader
Aggregates & Concrete No. 2 & No. 4 Worldwide
Key figures by Division
Cement, hydraulic binders and lime for construction, renovation and public works.
Aggregates, ready-mix and precast concrete products, asphalt and paving for engineering structures, roads and buildings.
Cement 63.9%
Aggregates & Concrete 34.2%
Other 1.9%
GROUP EMPLOYEES BY DIVISION
GROUP PROFILE
Registration Document | 2011 | Lafarge4

5Lafarge | Registration Document | 2011
REVENUES in million euros
2011 15,284
2010 14,834 (2)
2009 15,884 (3)
EBITDA (1) in million euros
2011 3,217
2010 3,488 (2)
2009 3,600 (3)
OPERATING INCOME BEFORE CAPITAL GAINS, IMPAIRMENT, RESTRUCTURING AND OTHERS (1) in million euros 2011 2,179
2010 2,393 (2)
2009 2,477 (3)
FREE CASH FLOW (1) in million euros
2011 1,208
2010 1,761 (2)
2009 2,834 (3)
GROUP NET DEBT (1) in million euros
2011 11,974
2010 13,993
2009 13,795
NET INCOME GROUP SHARE in million euros
2011 593
2010 827
2009 736
NET EARNINGS PER SHARE in euros
2011 2.07
2010 2.89
2009 2.77
DIVIDEND PER SHARE in euros
2011 0.50
2010 1.00
2009 2.00
(1) See section 4.2 (Accounting Policies and Definitions).
(2) 2010 figures have been restated following the disposal of Gypsum activities as mentioned in Note 3 (Significant events) of Gypsum activities in discontinued operations. The free
cash flow includes the 338 million euros one-time payment for the Gypsum competition fine.
(3) Data published in 2010 for 2009 and not restated following the disposal of Gypsum activities.
Sales growth driven by emerging markets.
Resilience of EBITDA in an environment of higher cost inflation.
The achievement of 250 million euros of structural cost savings partially offset the impact of higher cost inflation on our results.
Cost reduction actions, control of the capital expenditure and working capital optimization mitigated the impact of the strong inflation on costs.
Significant reduction of Group net debt by 2 billion euros.
Net income includes significant gains on disposals, but was impacted by cost inflation and goodwill impairment losses .
Net earnings per share decrease 28%.
Dividend of 0.50 euro per share, proposed at General Assembly meeting on May 15, 2012.
Lafarge In Figures
GROUP PROFILE

Registration Document | 2011 | Lafarge6

1
SELECTED FINANCIAL DATA
7Lafarge | Registration Document | 2011

1SELECTED FINANCIAL DATA
8
Following European Regulation no. 1606/2002
issued on July 19, 2002, the Group has
prepared consolidated financial statements
for the year ending December 31, 2011
in accordance with International Financial
Reporting Standards (“IFRS”) adopted by
the European Union at December 31, 2011.
The tables below show selected consolidated
financial data under IFRS for the years ending
December 31, 2011, 2010, and 2009. The
selected financial information is derived
from our consolidated financial statements,
which were audited by Deloitte & Associés
and Ernst & Young Audit. The audited
consolidated financial statements for the years
ending December 31, 2011 and 2010 appear
in part F at the end of this report.
KEY FIGURES FOR THE GROUP
(million euros, unless otherwise indicated) 2011 2010 (1) 2009 (2)
CONSOLIDATED STATEMENTS OF INCOME
Revenues 15,284 14,834 15,884
EBITDA (3) 3,217 3,488 3,600
Operating income before capital gains, impairment, restructuring and other 2,179 2,393 2,477
Operating income 1,683 2,134 2,250
Net income 736 1,114 1,046
Out of which Net Income from continuing operations 244 1,094
Net income from discontinued operations 492 20
Out of which part attributable to:
Owners of the parent of the Group 593 827 736
Non-controlling interests 143 287 310
Earnings per share – attributable to the owners of the parent company:
Basic earnings per share (euros) 2.07 2.89 2.77
Diluted earnings per share (euros) 2.06 2.89 2.77
Earnings per share of continuing operations
Basic earnings of continuing operations per share (euros) 0.36 2.83
Diluted earnings of continuing operations per share (euros) 0.35 2.83
Basic average number of shares outstanding (thousands) 286,514 286,087 265,547
(1) 2010 figures have been restated as mentioned in Note 3 (Significant events) to our cons olidated financial statements following the disposal of Gypsum activities.
(2) Data published in 2010 for 2009 and not restated following the disposaf of Gypsum activities.
(3) See Section 4.2.4 (Reconciliation of non GAAP financial measures) for the definition of these indicators.
(million euros) 2011 2010 2009
CONSOLIDATED STATEMENTS OF FINANCIAL POSITION
ASSETS
Non-current assets 31,172 34,752 32,857
Current assets 9,547 7,742 6,640
Out of which assets held for sale * 2,195
TOTAL ASSETS 40,719 42,494 39,497
EQUITY AND LIABILITIES
Equity attributable to the owners of the parent company 16,004 16,144 14,977
Non-controlling interests 2,197 2,080 1,823
Non-current liabilities 15,260 16,765 16,652
Current liabilities 7,258 7,505 6,045
Out of which liabilities associated with assets held for sale * 364
TOTAL EQUITY AND LIABILITIES 40,719 42,494 39,497
* See Note 3 (Significant events) to our consolidated financial statements for more information.
Registration Document | 2011 | Lafarge8

SELECTED FINANCIAL DATA
1
(million euros) 2011 2010 * 2009 **
CONSOLIDATED STATEMENTS OF CASH FLOWS
Net cash provided by operating activities 1,619 2,172 3,206
Net operating cash generated by continuing operations 1,597 2,098
Net operating cash generated by discontinued operations 22 74
Net cash provided by/(used in) investing activities 843 (1,244) (1,074)
Net cash provided by/(used in) investing activities from continuing operations 891 (1,186)
Net cash provided by/(used in) investing activities from discontinued operations (48) (58)
Net cash provided by/(used in) financing activities (2,529) 38 (1,489)
Net cash provided by/(used in) financing activities from continuing operations (2,455) 59
Net cash provided by/(used in) financing activities from discontinued operations (74) (21)
Increase (decrease) in cash and cash equivalents (67) 966 643
* 2010 figures have been restated as mentioned in Note 3 (Significant events) to our cons olidated financial statements following the disposal of Gypsum activities.
** Data published in 2010 for 2009 and not restated following the disposal of Gypsum activities.
(million euros, unless otherwise indicated) 2011 2010 2009 (1)
ADDITIONAL FINANCIAL INDICATORS(2)
Free Cash-Flow 1,208 1,761(3) (4) 2,834
Return on capital employed before tax (%) 6.8 7.4 (3) 7.6
Group Net Debt 11,974 13,993 13,795
(1) Data published in 2010 for 2009 and not restated following the disposal of Gypsum activities.
(2) See Section 4.2.4 (Reconciliation of non GAAP financial measures) for the definition of these indicators. The indicator Return on capital employed is now calculated before tax,
including for years 2010 and 2009.
(3) 2010 figures have been restated as mentioned in Note 3 (Significant events) to our consolidated financial statements following the disposal of Gypsum activities.
(4) Including the 338 million euros one-time payment for the Gypsum competition fine.
(euros, unless otherwise indicated) 2011(1) 2010 2009
DIVIDENDS
Total dividend (million euros) 145 (3) 288 575
Basic dividend per share 0.50 1.00 2.00
Loyalty dividend per share (2) 0.55 1.10 2.20
(1) Proposed dividend.
(2) See Section 8.5 (Articles of Association (Statuts) – Rights, preferences and restrictions attached to shares) for an explanation of our “Loyalty dividend”.
(3) Based on an estimation of 287,014,070 shares eligible for dividends.
9Lafarge | Registration Document | 2011

1SELECTED FINANCIAL DATA
Registration Document | 2011 | Lafarge10
RISK FACTORS
2.1 PRESENTATION OF THE PRINCIPAL RISKS 122.1.1 Risks related to our business 12
2.1.2 Financial and market risks 16
2.2 RISK MANAGEMENT 202.2.1 Risk identifi cation and analysis 20
2.2.2 Risk management systems 20
2.3 INSURANCE AND RISK COVERAGE 23
2
11Lafarge | Registration Document | 2011

2RISK FACTORS2.1 Presentation of the principal risks
12
2.1 Presentation of the principal risks
Lafarge operates in a constantly evolving
environment, which exposes the Group to
risk factors and uncertainties in addition
to the risk factors related to its operations.
The materialization of the risks described
below could have a material adverse effect
on our operations, our financial condition,
our results, our prospects or the Lafarge
S.A. share price. There may be other risks
that have not been identified yet or whose
occurrence is not considered likely to have
such material adverse effect as of the date of
this Registration Document. The information
given below is based on certain assumptions
and hypotheses, which could, by their nature,
prove to be inaccurate.
2.1.1 Risks related to our business
a) Risks related to our worldwide presence
Operations and cycle
Our products are used in buildings and civil
works. Demand for our products in the different
markets in which we operate is dependent on
the level of activity in the construction sector.
The construction sector tends to be cyclical
and depends on various factors such as the
level of infrastructure spending, the level of
residential and commercial construction
activity, interest rates, and generally, the level
of economic activity in a given market. The
cyclicality of the construction sector together
with its dependence on economic activity
could have a negative impact on our financial
results and the profitability of our operations.
We manage this risk by operating in
geographically diverse markets, with a portfolio
of operations both in developed markets and
in emerging countries, thereby minimizing our
exposure to risk in a given country, although
we might be significantly affected by global
downturns or in individual significant markets.
See Risks relating to the global economic
conditions on page 13 .
Emerging markets
Approximately 57% of our revenues are
derived from emerging markets, defined as
countries outside Western Europe and North
America.
Even though all these risks may not be specific
to emerging countries, o ur increased presence
in emerging markets exposes us to risks such
as gross domestic product (GDP) volatility,
significant currency fluctuations, political,
financial and social uncertainties and turmoil,
high inflation rates, exchange control systems,
less certainty concerning legal rights and their
enforcement and the possible nationalization
or expropriation of privately-held assets, any of
which could damage or disrupt our operations
in a given market.
By way of example, we estimate the negative
impact of the political events in Egypt in the
first quarter of 2011 to be approximately 30
million euros on our current operating income
in Egypt. The nationalisation of our Cement
activity in Venezuela in 2009 is another
illustration of the country risk.
See Section 2.2.2 (Management of the
Group’s assets portfolio) page 21 .
While we attempt to manage these risks by
spreading emerging markets operations
among a large number of countries, our
diversification efforts will not enable us to avoid
risks that affect multiple emerging markets
at the same time. No individual emerging
country represents over 5% of our sales.
If such risks were to materialise in the future
in a significant and lasting manner, this could
have a negative impact on the recoverable
value of some of our assets.
See Risk on Acquisition-related accounting
issues on page 15 and Note 10 (Goodwill)
to our consolidated financial statements on
page F31 for further information on main
goodwill and the analysis on the sensibility
of recoverable amounts and on impairment
losses.
Climate and natural disasters
Our presence in a large number of countries
increases our exposure to meteorological and
geological risks such as natural disasters,
climate hazards, or earthquakes which could
damage our property or result in business
interruptions, and which could have a material
adverse effect on our operations.
In addition to the natural events modelling
process which had been put in place within
the Group in the last years, an assessment
program was launched in 2011. This program ,
which will be rolled out over a three-year
period and will cover all the Group’s industrial
sites, is aimed at classifying sites according to
their risk exposure and identifying potential
losses depending on their financial impact
by event, country or financial year as well as
the probability of occurrence. The current
outcome of the modelling process and of
the assessment program is that the following
countries where Lafarge is present are
currently believed to present a natural disaster
risk: Algeria, Saudi Arabia, Bangladesh,
China, Egypt, Greece, Indonesia, Iraq,
Jordan, Morocco, the Philippines, Romania,
Syria and United Arab Emirates. These
countries represent approximately 22% of
our consolidated sales. In the future, other
countries may be exposed to meteorological
and geological risks.
See Section 2.2.2 (Risk management systems)
on page 20 and Section 2.3 (Insurance and
risk coverage) on page 23 for more information
on risk management by the Group.
Seasonality and weather
Construction activity, and thus demand for
our products, decreases during periods of
very cold weather, snow, or sustained rainfall.
Consequently, demand for our products is
lower during the winter in temperate countries
and during the rainy season in tropical
countries. Our operations in Europe, North
America and other markets are seasonal, with
sales generally increasing during the second
and third quarters because of usually better
weather conditions. However, high levels of
rainfall or low temperatures can adversely
affect our operations during these periods as
well. Such adverse weather conditions can
materially affect our operational results and
profitability if they occur with unusual intensity,
during abnormal periods, or last longer than
usual in our major markets, especially during
peak construction periods.
Registration Document | 2011 | Lafarge12

RISK FACTORS
2
2.1 Presentation of the principal risks
b) Risks relating to the global economic conditions
Our results depend mainly on residential,
commercial, and infrastructure construction
activity, and spending levels. The economic
crisis which started in the second half of 2008
has significantly impacted the construction
business in developed markets. To varying
degrees depending on the market, this has
had, and may continue to have, a negative
impact on product demand as well as our
business and operational results.
By way of example, our operations in Greece
and Spain suffered from tougher economic
conditions since 2009, resulting in particular
from governmental austerity measures in the
context of the sovereign debt crisis in the
Euro zone. Both countries represent together
approximately 3% of our sales.
We have prepared internal analysis of potential
worldwide demand for our products for
purposes of internal planning and resource
allocation. Our analysis of worldwide demand
for cement is described in Sections 3.2
(Our Strategy) on page 27 and 4.1.2 (Trend
information and 2012 perspectives on
page 48 ). We estimate that cement demand
in our markets will grow between 1% to 4%
in 2012 versus 2011. Emerging markets
should continue to be the main driver of
demand, supported by long-term trends of
demographical growth and urbanization, and
Lafarge should benefit from its well balanced
geographic spread of high quality assets.
Overall pricing is expected to increase over
the year while costs are anticipated to increase
at a lower rate than in 2011.
In this environment, we have continued to
implement proactive measures, such as our
divestments program and the launch of an
additional 500 million euros cost savings
plan. As the result of the disposal of most of
our Gypsum operations, we have announced
in November 2011 a project to establish
a new, country-based, organization for the
Group, centered on the markets of Cement,
Aggregates and Concrete. This strategic
change will enable us to accelerate our organic
growth, in particular through the development
of innovative systems and solutions for our
clients.
However, if economic conditions worsen
they might continue to negatively affect our
business operations and financial results.
In particular, if such risks were to materialise in
the future in a significant and lasting manner,
they could have a negative impact on the
recoverable value of some of our assets.
See Risk on Acquisition-related accounting
issues on page 15 and Note 10 (Goodwill)
to our consolidated financial statements on
page F31 for further information on main
goodwill and the analysis on the sensibility
of recoverable amounts and on impairment
losses.
c) Energy costs
Our operations consume significant amounts
of energy (electricity, coal, petcoke, natural
gas, fuel, diesel), the cost of which can
fluctuate significantly, largely as a result of
market conditions and other factors beyond
our control.
The markets in which we operate are
competitive and in this environment the
evolution of our selling prices depends largely
on offer and demand fluctuations. In this
context, we pay a particular attention to the
impact of energy price variations on the selling
price of our products, although situations can
vary greatly from one country to another or
even within the same country, as our markets
are local and heavy products cannot easily be
transported. It is therefore difficult to provide
meaningful data on such impact.
Energy markets may be regulated in some
of the countries where we operate and the
evolution of prices could have an adverse
impact on the profitability of the operations of
our subsidiaries.
We take a number of steps to manage our
energy costs:
• we sometimes enter into medium-term
supply contracts. In addition, our centralized
purchasing organization at Group level also
gives us more leverage with our suppliers,
enabling us to obtain the most competitive
terms and conditions. Nonetheless, if
our supply contracts contain indexation
clauses, they will not always protect us from
fluctuations in energy prices. Similarly, if we
enter into fixed price contracts when prices
are high, we will not benefit if energy prices
subsequently decline;
• we also use derivative instruments, such as
forward energy agreements on organized
markets or on the over the counter (OTC)
market, to manage our exposure to risk
related to energy cost fluctuations;
• in addition, we encourage our plants to
use a variety of fuel sources, including
alternative fuels such as biomass, used oil,
recycled tires and other recycled materials
or industrial by-products, which has
resulted in less vulnerability to fossil fuel
price increases and enables us to reduce
our energy costs.
While these measures are useful, they may
not fully protect us from exposure to energy
price volatility. As a result, material increases
or changes in energy and fuel costs have
affected, and may continue to affect, our
financial results.
See Sections 2.1.2 (Financial and market
risks) on page 16 and 3.4.1 (Our businesses –
Cement – Composition and Production of
Cement) on page 33 for further information.
d) Sourcing and access to raw materials
Quarries and permits
We generally maintain reserves of limestone,
gypsum, aggregates and other raw materials
that we use to manufacture our products.
Access to the raw materials necessary for
our operations is a key consideration in our
investments. Failure to obtain, maintain or
renew these land and mining rights (as well
as more generally any other permits, licences,
rights and titles necessary to carry out our
operations) or expropriation as a result of
local legislative, regulatory or political action
could have a material adverse effect on the
development of our operations and results.
For an illustration of this risk in relation to
our operations in Bangladesh, see Note 29
(Legal and arbitration proceedings) to
our consolidated financial statements on
page F65. The final "Stage 2" permit for our
quarrying operations in India was obtained on
February 29, 2012.
We actively manage the quarries and
production plants we operate or expect to
operate, and the related permits, licences,
rights and titles, in order to secure our
operations in the long-term. We usually own
or hold long-term land and mining rights on
the quarries of raw materials essential to
our operations spread in a large number of
countries across the world, and are managing
with the necessary care the lengthy and
complex process to obtain or renew our
various permits, licences, rights and titles.
13Lafarge | Registration Document | 2011

2RISK FACTORS2.1 Presentation of the principal risks
See Section 3.4.4 (Mineral reserves and
quarries) on page 42 for further information.
Other raw materials
In addition, we increasingly use certain
by-products of industrial processes, such as
synthetic gypsum, slag and fly ash, produced
by third parties as raw materials. In general,
we are not dependent on our raw materials
suppliers and we try to secure the supply
of these materials needed through long-
term renewable contracts and framework
agreements, which ensure better management
of our supplies. We do, however, have short-
term contracts in certain countries. Should our
existing suppliers cease operations or reduce
or eliminate production of these by-products,
our sourcing costs for these materials may
increase significantly or we may be required
to find alternatives for these materials.
See Sections 3.4.1 (Our businesses –
Cement – Composition and Production of
Cement) on page 33 and 3.4.4 (Mineral
reserves and quarries) on page 42 for further
information on our quarries and Section 2.2.2
(Risk management systems) on page 20 for
more information on how the Group manages
this risk.
e) Competition – Competition Law Investigations
Competition is strong in the markets in
which we operate . Competition, whether
from established market participants or new
entrants could cause us to lose market share,
increase expenditure or reduce pricing, any
one of which could have a material adverse
effect on our business, financial condition,
results of operations or prospects. This
risk is partially compensated by certain
characteristics of our markets which are not
limited to trade-off between price and volume.
Among these characteristics, it should be
noted the significant barriers to entry which
are the result of a capital intensive industry.
A greenfield cement plant represents an
investment of several hundred millions of
euros.
Regulatory constraints for the obtention of
licenses to operate in some of the countries
where we are present is another barrier to
entry. Our marketing and innovation actions
enable us to develop new products, services
and solutions which are also differentiating
factors.
Finally, the significant impact of transport
costs, and the low technical obsolescence of
our industrial equipment, lead us to establish
market positions which are both close to the
customers and sustainable for the long term.
Given our worldwide presence and the fact that
we sometimes operate in markets where the
concentration of market participants is high,
we are currently, and could in the future be,
subject to investigations and civil or criminal
proceedings by competition authorities for
alleged infringement of antitrust laws. These
investigations and proceedings can result in
fines, or civil or criminal liability, which may
have a material adverse effect on our image,
financial condition and results of operations
of some of the Group’s Divisions, particularly
given the level of fines imposed by European
authorities in recent cases.
In November 2008, the major European
cement companies, including Lafarge, were
placed under investigation by the European
Commission for alleged anti-competitive
practices. In December 2010, the European
Commission launched an official investigation,
while indicating that this only meant that
the Commission intends to pursue this as
a matter of priority but does not imply that
the Commission has conclusive evidence
of any infringement. At this stage, given the
fact-intensive nature of the issues involved
and the inherent uncertainty of such litigation
and investigation, we are not in a position
to evaluate the possible outcome of this
investigation.
We are committed to the preserving of
vigorous, healthy and fair competition as well
as complying with relevant antitrust laws in
countries where we operate.
In line with this objective, the Group has
a competition policy and a competition
compl iance program descr ibed in
Section 2.2.2 (Risk management systems)
of the present Chapter. Nonetheless,
these procedures cannot provide absolute
assurance against the risks relating to these
issues.
See Section 3.4 (Our Businesses) on page 32
for a description of our competitors in each
of our markets. See Note 29 (Legal and
arbitration proceedings) to our consolidated
financial statements on page F65 for
further information on material legal and
arbitration proceedings. This Note sets out
the most significant or material competition
investigations or litigations, including the
one in "South Africa – Cement" for which
a settlement was reached beginning of March
2012, with Lafarge agreeing to pay 15 million
euros in consideration for termination of
the proceedings. See Section 2.2.2 (Risk
management systems) on page 20 for more
information on our competition policy and on
how the Group manages this risk.
f) Industrial risks relating to safety and the environment
While our industrial processes are very well
known and are dedicated to the production
of cement, aggregates and concrete, which
are not usually considered to be hazardous
materials, our operations are subject to
environmental and safety laws and regulations,
as interpreted by relevant agencies and
courts, which impose increasingly stringent
obligations, restrictions and protective
measures regarding, among other things,
land and products use, remediation, air
emissions, noise, waste and water, health
and safety. The costs of complying with these
laws and regulations could increase in some
jurisdictions, in particular as a result of new or
more stringent regulations or change in their
interpretation or implementation. In addition,
non-compliance with these regulations could
result in sanctions, including monetary fines,
against our Group.
Registration Document | 2011 | Lafarge14

RISK FACTORS
2
2.1 Presentation of the principal risks
The risks faced by the Group regarding the
environment can be illustrated by the following
examples relating to our operations in the
United States:
• the cement industry air emissions regulation
in the United States is under review by
the US Environmental Protection Agency
(“EPA”). This new set of rules primarily
relates to the content of air emissions,
including fine particles, mercury, and
chlorine. These regulations are still in the
process of being finalized by the EPA and
the federal courts, but stricter limits on
mercury emissions are expected industry-
wide. This is part of a global trend in
different countries as part of the United
Nations Environment Programme to strictly
limit mercury emissions and the impact of
industry on the environment. We are active
in developing solutions in anticipation of
such changes. However, at this stage, it is
still difficult to foresee the impact of such
potential changes on our results;
• on January 21, 2010, our subsidiary
Lafarge North America Inc. and certain
of its subsidiaries (“LNA”) entered into a
settlement of certain alleged violations of
the US Clean Air Act with the EPA and a
number of US States. Under this settlement,
LNA is required to decrease s ulfur dio xide
(SO2) and n itrogen o xides (NO
x) emanating
from its US cement manufacturing plants
by making the necessary investments over
a period of five years. LNA has also agreed
to pay a civil penalty of 5 million US dollars,
which was paid in April 2010.
We have implemented internal standards at
Group level whereby environmental risks are
taken into account in our management cycle
and have developed a unified and consistent
reporting system in each Division to measure
and control our environmental performances.
See Section 7.5 (Environment) on page 12 4
for more information on the impact of
environmental matters on our operations,
our environmental policy and our various
environmental initiatives. See Section 2.2.2
(Risk management systems) on page 20 for
more information on how the Group manages
these risks.
See also Notes 2.3 (Use of estimates and
judgments) on page F11 and Note 24
(Provisions) to our consolidated financial
statements on page F53.
g) Legal risk – Litigation
Our Group has worldwide operations and
our subsidiaries are required to comply
with applicable national and local laws and
regulations, which vary from one country to
another. As part of our operations, we are, or
could be, involved in various claims, and legal,
administrative and arbitration proceedings
and class action suits. New proceedings may
be initiated against the Group’s entities in the
future.
See Note 29 (Legal and arbitration
proceedings) to the consolidated financial
statements on page F65 for more information
on material legal and arbitration proceedings.
h) Risks related to our structure
Financial and tax issues
Lafarge S.A. is a holding company with
no significant assets other than direct and
indirect interests in its numerous subsidiaries.
A number of our subsidiaries are located
in countries that may impose regulations
restricting the payment of dividends outside
the country through exchange control
regulations.
To the best of our knowledge, aside from
North Korea, there are currently no countries
in which we operate that prohibit the payment
of dividends.
Furthermore, the continued transfer of
dividends and other income from our
subsidiaries may be limited by various credit
or other contractual arrangements and/or tax
constraints, which could make such payments
difficult or costly.
Should such regulations, arrangements
and constraints restricting the payment of
dividends be significantly increased in the
future simultaneously in a large number of
countries where we operate, it might impair
our ability to make shareholder distributions.
In addition, our subsidiaries are open to tax
audits by the respective tax authorities in
the jurisdictions in which they are located.
Various tax authorities have proposed or levied
assessments for additional taxes for prior
years. Although we believe that the settlement
of any or all of these assessments will not
have a material and unfavorable impact on
its results or financial position, we are not in a
position to evaluate the possible outcome of
these proceedings.
See Section 2.2.2 (Risk management
systems) on page 20 for more information
on how the Group manages these risks and
Note 22 (Income tax) to the consolidated
financial statements on page F47 .
Acquisition-related accounting issues
As a result of significant acquisitions, many
of our tangible and intangible assets are
recorded in our consolidated statement
of financial position at amounts based on
their fair value as of the acquisition date.
We have also recorded significant goodwill
(we had 12.7 billion euros of goodwill on our
consolidated statement of financial position as
of December 31, 2011).
In accordance with IFRS, we test non-current
assets, including goodwill, for impairment,
as described in Note 2.12 (Impairment of
non-current assets) to our consolidated
financial statements on page F16 and
further detailed in Note 10 (Goodwill) to our
consolidated financial statements on page F31
for goodwill. In particular, an impairment test
of goodwill is performed at least annually
and a specific analysis is performed at the
end of each quarter in case of impairment
indications. The key assumptions used
to perform our impairment tests take into
consideration the market level and forecasts
on the evolution of prices and costs. They
are further described in Note 10 (Goodwill)
to our consolidated financial statements
on page F31. These assumptions take into
account the specific country environments of
each of our operations, such as the recent
political instability in Egypt , or the sovereign
debt crisis in the Euro zone (Greece and
Spain). They do not however anticipate any
15Lafarge | Registration Document | 2011

2RISK FACTORS2.1 Presentation of the principal risks
breakdown in the current economical or
geopolitical environment.
Depending on the evolution of the recoverable
value of Cash Generating Units (CGU)/
groups of CGUs, which is mostly related to
future market conditions, further impairment
charges might be necessary and could have
a significant impact on our results.
By way of example, the material drop in
demand in Greece in the context of the
tougher economic environment resulted in the
Group recording an impairment loss of 185
million euros for the CGU Cement Greece as
at December 31, 2011.
See Note 10 (Goodwill) to our consolidated
financial statements on page F31 for further
information on impairment losses recorded in
2011 and on the analysis on the sensibility of
recoverable amounts of our significant assets.
Minority shareholders
We conduct our business through subsidiaries.
In some instances, third-party shareholders
hold minority interests in these subsidiaries.
While we generally consider this positive as
it may result in partnership or investment
agreements, various disadvantages may
also result from the participation of minority
shareholders whose interests may not
always coincide with ours. Some of these
disadvantages may, among other things,
result in our difficulty or inability to implement
organizational efficiencies and transfer cash
and assets from one subsidiary to another in
order to allocate assets most effectively.
See Section 3.5 (Intra-G roup R elationships)
on page 44 for further information on our
relationship with minority shareholders within
our subsidiaries and Section 2.2.2 (Risk
management systems) on page 20 for more
information on how the Group manages these
risks.
2.1.2 Financial and market risks
a) Financial risks
Indebtedness
We are exposed to different market risks,
which could have a material adverse effect
on our financial condition or on our ability to
meet our financial commitments. In particular,
our access to global sources of financing to
cover our financing needs or repayment of our
debt could be impaired by the deterioration
of financial markets or downgrading of our
credit rating. On December 31, 2011, our net
debt (which includes put options on shares
of subsidiaries granted to non-controlling
interests and derivative instruments) amounted
to 11,974 million euros. On that date, our
gross debt amounted to 15,286 million euros,
of which 2,974 million euros was due in one
year or less. As part of our strict financial
policies, we are implementing actions to
improve our financial structure. Depending on
the evolution of the economic environment,
w e cannot, however, give any assurance that
we will be able to implement these measures
effectively or that further measures will not be
required in the future.
The financing contracts of Lafarge and its
subsidiaries contain various commitments.
Some of our subsidiaries are required to
comply with certain financial covenants and
ratios. At the end of 2011, these agreements
represented approximately 6% of the Group’s
consolidated financial liabilities. Our main
covenants are described in Note 25 (e)
(Particular clauses in financing contracts)
to our consolidated financial statements on
page F56.
Our agreements and those of our subsidiaries
also include cross-acceleration clauses. If
we, or under certain conditions, our material
subsidiaries, fail to comply with our or their
covenants, then our lenders could declare an
event of default and accelerate the repayment
of a significant part of our debt.
If the construction sector economically
deteriorates further, the reduction of our
operating cash flow could make it necessary
to obtain additional financing. Changing
conditions in the credit markets and the level
of our outstanding debt could impair our ability
to obtain additional financing for working
capital, capital expenditures, acquisitions,
general corporate purposes or other purposes,
or make access to this financing more
expensive than anticipated. This could result
in greater vulnerability, in particular by limiting
our flexibility to adjust to changing market
conditions or withstand competitive pressures.
Our financial costs and our ability to raise
new financing can be significantly impacted
by the level of our credit ratings. The rating
agencies could downgrade our ratings either
due to factors which are specific to us, or
due to a prolonged cyclical downturn in the
construction sector. On the filing date of
this Registration Document, our long-term
corporate credit rating is BB+ (negative
outlook) according to Standard & Poor’s
Rating Services, further to a downgrading
on March 17, 2011 and the revision of our
outlook from stable to negative on March 13,
2012. It is Ba1 (stable outlook) according
to the rating agency Moody’s, further to a
downgrading on August 5, 2011. The impact
of such downgradings is an increase of our
net finance costs by 25 million euros in 2011,
mainly due to the “coupon step up” clause
included in our bonds issued since 2009. This
impact will reach approximately 69 million
euros on a full-year basis starting from 2012,
if our rating is maintained and on the basis
of our existing debt at December 31, 2011.
Any new decline in our ratings could have a
negative impact on our financial condition,
our results, and our ability to refinance our
existing debt.
See Section 4.4 (Liquidity and c apital
r esources) on page 63 for more information.
Liquidity risk
We are exposed to a risk of insufficient
financial resources, which could impact our
ability to continue our operations. The Group
implements policies to limit its exposure to
liquidity risk. As a result of these policies,
a significant portion of our debt has a long-
term maturity. The Group also maintains
committed credit lines with various banks,
which are primarily used as a back-up for the
debt maturing within one year as well as for
the Group’s short-term financing, and which
contribute to the Group’s liquidity. Based on
our current financial outlook, we believe that
we have sufficient resources for our ongoing
operations in both the short term and the long-
term.
See Section 4.4 (Liquidity and c apital
r esources) on page 63 and Note 26 (g)
(Liquidity risk) to the consolidated financial
statements on page F63 for more information
on liquidity risk and such risk management.
Pension plans
We have obligations under defined benefit
pension plans, mainly in the United Kingdom
and North America. Our funding obligations
depend upon future assets performance,
the level of interest rates used to measure
Registration Document | 2011 | Lafarge16

RISK FACTORS
2
2.1 Presentation of the principal risks
future liabilities, actuarial assumptions
and experience, benefit plan changes, and
government regulations. Due to the large
number of variables that determine pension
funding requirements, which are difficult
to predict, as well as any legislative action,
future cash funding requirements for our
pension plans and other post-employment
benefit plans could be higher than currently
estimated amounts. If so, these funding
requirements could have a material adverse
effect on our financial condition, results of
operations or prospects.
See Section 4.2 (Accounting policies and
definitions) on page 49 and Note 23 (Pension
plans, termination benefits and other post
-employ ment benefits) to our consolidated
financial statements on page F49 for
more information on pension plans. See
Section 2.2.2 (Risk management systems)
on page 20 for more information on how the
Group manages these risks.
b) Market risks
In this Section, debt figures are presented
excluding put options on shares of subsidiaries
granted to non-controlling interests.
Currency exchange risks and exchange rate sensitivity
CURRENCY EXCHANGE RISK
We are subject to foreign exchange risk as a
result of our subsidiaries’ purchase and sale
transactions in currencies other than their
functional currency.
With regard to transaction-based foreign
currency exposures, our policy is to hedge all
material foreign currency exposures through
derivative instruments no later than when a
firm commitment is entered into or becomes
known to us. These derivative instruments
are generally limited to forward contracts
and standard foreign currency options, with
terms of generally less than one year. From
time to time, we also hedge future cash flows
in foreign currencies when such flows become
highly probable. We do not enter into foreign
currency exchange contracts other than for
hedging purposes.
Each subsidiary is responsible, with the
assistance of the Group Treasury Department,
for managing the foreign exchange positions
arising from its commercial and financial
transactions performed in currencies other
than its domestic currency. Subsidiaries’
exposures are centralized by the Group
Treasury department and hedged using
foreign currency derivative instruments
contracted with Lafarge S.A., when local
regulations allow it. Otherwise, exposures are
hedged through local banks. After netting
when feasible purchases and sales in the
same currency on a global basis, Lafarge
S.A. then covers its own net exposure in the
market.
As far as financing is concerned, our general
policy is for subsidiaries to borrow and invest
excess cash in the same currency as their
functional currency, except for subsidiaries
operating in emerging markets, where
“structural” cash surpluses are invested,
wherever possible, in US dollars or in euros.
A portion of our financing is in US dollars and
British pounds, in particular as a result of our
operations located in these countries. Part of
this debt was initially raised in euros at parent
company level then converted into foreign
currencies through currency swaps.
We hold assets, earn income and incur
expenses and liabilities directly and through
our subsidiaries in a variety of currencies.
Our consolidated financial statements are
presented in euros. Therefore, we convert
our assets, liabilities, income and expenses in
other currencies into euros at then-applicable
exchange rates.
See Note 25 (Debt) on page F54 and Note 26
(Financial instruments) on page F57 to our
consolidated financial statements for more
information on debt and financial instruments.
Additional information on the Group policies
in place to mitigate this risk can be found in
Section 2.2 (Risk management ) on page 20 .
EXCHANGE RATE SENSITIVITY
If the euro increases in value against a
currency, the value in euros of assets,
liabilities, income and expenses originally
recorded in the other currency will decrease.
Conversely, if the euro decreases in value
against a currency, the value in euros of
assets, liabilities, income, and expenses
originally recorded in that other currency
will increase. Consequently, increases and
decreases in the value of the euro may affect
the value in euros of our non-euro assets,
liabilities, income, and expenses, even though
the value of these items has not changed in
their original currency.
In 2011, we generated approximately 82% of
our sales in currencies other than the euro,
with approximately 20% denominated in
US or Canadian dollars. As a result, a 10%
change in the US dollar/euro exchange rate
and in the Canadian dollar/euro exchange
rate would have an impact on our sales of
approximately 311 million euros.
In addition, on December 31, 2011, before
currency swaps, 17% of our total debt was
denominated in US dollars and 11% in British
pounds. After taking into account the swaps,
our US dollar denominated debt amounted
to 13% of our total debt, while our debt
denominated in British pounds represented
5% of the total. A +/-5% fluctuation in the
US dollar/euro and in the British pound/
euro exchange rate would have an estimated
maximum impact of -/+ 122 million euros
on our debt exposed to these two foreign
currencies as of December 31, 2011.
The table below provides information about
our debt and foreign exchange derivative
financial instruments that are sensitive to
exchange rates. The table shows:
• for debt obligations, the principal cash flows
in foreign currencies by expected maturity
dates and before swaps;
• for foreign exchange forward agreements,
the notional amounts by contractual
maturity dates. These notional amounts are
generally used to calculate the contractual
payments to be exchanged under the
contract.
17Lafarge | Registration Document | 2011

2RISK FACTORS2.1 Presentation of the principal risks
MATURITIES OF NOTIONAL CONTRACT VALUES ON DECEMBER 31, 2011
(million euros) 2012 2013 2014 2015 2016 > 5 YEARS TOTAL FAIR VALUE
DEBT IN FOREIGN CURRENCIES*
US dollar 379 438 32 463 657 518 2,487 2,432
British pound 508 423 - - - 658 1,589 1,634
Other currencies 720 208 301 69 26 62 1,386 1,316
TOTAL 1,607 1,069 333 532 683 1,238 5,462 5,382
FOREIGN EXCHANGE DERIVATIVES**
Forward contract purchases and currency swaps
US dollar 1,158 - - - - - 1,158 22
British pound 1,040 - - - - - 1,040 17
Other currencies 217 - - - - - 217 -
TOTAL 2,415 - - - - - 2,415 39
Forward contract sales and currency swaps
US dollar 645 23 - - - - 668 (23)
British pound 55 - - - - - 55 -
Other currencies 424 1 - - - - 425 (2)
TOTAL 1,124 24 - - - - 1,148 (25)
* The fair value of long-term debt was determined by estimating future cash flows on a borrowing-by-borrowing basis, and discounting these future cash flows using an interest rate that takes
into account the Group’s incremental borrowing rate at year-end for similar types of debt arrangements. Market price is used to determine the fair value of publicly traded instruments.
** The fair value of foreign currency derivative instruments has been calculated using market prices that the Group would pay or receive to settle the related agreements.
Based on outstanding hedging instruments
on December 31, 2011, a +/-5% shift in
exchange rates would have an estimated
maximum impact of respectively -/+3 million
euros on equity in respect of foreign currency
derivatives designated as hedging instruments
in a cash flow hedge relationship. The
net income statement impact of the same
exchange rate fluctuations on the Group’s
foreign exchange derivative instruments is
not material. Fair values are calculated with
internal models that rely on market observable
data (currency spot rate, forward rate,
currency rate curves, etc.).
Interest rate risks and sensitivity
INTEREST RATE RISKS
We are exposed to interest-rate risk through
our debt and cash. Our interest rate exposure
can be sub-divided among the following risks:
• price risk for fixed-rate financial assets and
liabilities.
By contracting a fixed-rate liability, for
example, we are exposed to an opportunity
cost in the event of a fall in interest rates.
Changes in interest rates impact the market
value of fixed-rate assets and liabilities, leaving
the associated financial income or expense
unchanged;
• cash flow risk for floating-rate assets and
liabilities.
Changes in interest rates have little impact on
the market value of floating-rate assets and
liabilities, but directly influence the future
income or expense flows of the Company.
In accordance with the general policy
established by our senior management, we
seek to manage these two types of risks,
including the use of interest-rate swaps and
forward rate agreements. Our corporate
Treasury department manages our financing
and interest rate risk exposure in accordance
with rules defined by our senior management
in order to keep a balance between fixed rate
and floating rate exposure.
Although, we manage our interest rate
exposure to some extent, it cannot immunize
us fully from interest rate risks.
See Note 25 (Debt) on page F54 and Note 26
(Financial instruments) on page F57 to our
consolidated financial statements for more
information. Additional information on the
Group policies in place to mitigate this risk can
be found in Section 2.2 (Risk management )
on page 20 .
INTEREST RATE SENSITIVITY
Before taking into account interest rate swaps,
on December 31, 2011, 76% of our total debt
carried a fixed rate. After taking into account
these swaps, the portion of fixed-rate debt
amounted to 67%.
A +/-1% change in short-term interest rates
calculated on the net floating rate debt, taking
into account derivative instruments would
have a maximum impact on the Group’s
2011 consolidated income before tax of
-/+18 million euros.
The table below provides information about
our interest-rate derivative instruments and
debt obligations that are sensitive to changes
in interest rates and presents:
• for debt obligations, the principal cash flows
by expected maturity dates and related
weighted average interest rates before
swaps;
• for interest-rate derivative instruments,
notional amounts by contractual maturity
dates and related weighted average
interest rates. Notional amounts are used
to calculate the contractual payments to be
exchanged under the contract. Weighted
average floating rates are based on effective
rates at year-end.
Registration Document | 2011 | Lafarge18

RISK FACTORS
2
2.1 Presentation of the principal risks
MATURITIES OF NOTIONAL CONTRACT VALUES ON DECEMBER 31, 2011
(million euros) AVERAGE RATE (%) 2012 H1 2012 H2 2013 2014 2015 2016 > 5 YEARS TOTAL FAIR VALUE
DEBT (1)
Long-term debt (2) 6.3 279 1,529 1,802 1,990 1,368 2,187 4,869 14,024 13,569
Fixed-rate portion 6.7 38 451 1,148 1,834 1,316 1,884 4,826 11,497 11,121
Floating-rate portion 4.2 241 1,078 654 156 52 303 43 2,527 2,448
Short-term debt 4.6 936 98 1,034 1,034
INTEREST-RATE DERIVATIVES (3)
Pay Fixed
Euro 4.5 - 70 58 42 - - - 170 (8)
Other currencies 7.2 9 25 67 104 - - - 205 52
Pay Floating
Euro 1.7 200 1,000 300 - - - - 1,500 3
Other currencies 1.8 - - 77 240 - - - 317 4
Other interest-rate derivatives
Euro - - - - - - - - - -
Other currencies 2.2 - 19 332 - - - - 351 (2)
(1) The fair value of long-term debt was determined by estimating future cash flows on a borrowing-by-borrowing basis, and discounting these future cash flows using an interest rate that
takes into account the Group’s incremental borrowing rate at year-end for similar types of debt arrangements.
(2) Including the current portion of long-term debt.
(3) The fair value of foreign interest rate derivative instruments has been calculated using market prices that the Group would pay or receive to settle the related agreements.
Based on outstanding hedging instruments
on December 31, 2011, a +/-100 basis point
shift in yield curves would have an estimated
maximum impact of respectively -/+ 6 million
euros on equity in respect of interest-rate
derivatives designated as hedging instruments
in a cash flow hedging relationship. The
impact on the income statement related to
interest-rate derivative instruments designated
as hedging instruments in a fair value hedging
relationship is netted off by the revaluation
of the underlying debt. Furthermore, the
income statement impact of the same yield
curve fluctuations on interest-rate derivative
instruments, not designated as hedges for
accounting purposes, would have a maximum
impact of -/+ 1 million euros in income. Fair
values are calculated with internal models that
rely on observable market data (interest rates
curves, “zero coupon” curves, etc.).
Commodity risk and sensitivity
We are subject to commodity risk with respect
to price fluctuations mainly in the electricity,
natural gas, petcoke, coal, fuel, diesel and also
maritime freight markets.
We attempt to limit our exposure to fluctuations
in commodity prices and to increase our use
of alternative fuels and renewable energies.
From time to time, and if a market exists, we
hedge our commodity exposures through
derivative instruments at the latest when a
firm commitment is entered into or known, or
where future cash flows are highly probable.
These derivative instruments are generally
limited to swaps and options, with maturities
and terms adaptable on a case by case basis.
We do not enter into commodities contracts
other than for hedging purposes.
Based on outstanding hedging instruments
on December 31, 2011, a +/-20% change
in the commodity indexes against which
Lafarge is hedged, i.e. mainly power,
natural gas (Nymex), heating oil (Nymex),
gas oil (IPE), maritime freight (Panamax),
and coal (Newcastle FOB), would have an
estimated maximum impact of respectively
-/+11 million euros on equity in respect of
commodity derivative instruments designated
as hedging instruments in a cash flow hedging
relationship. The net income statement impact
of the same commodity index fluctuations on
the Group’s commodity derivative instruments
is not material. Fair values are calculated with
internal models that rely on observable market
data (raw materials spot and forward rates,
etc. ).
See Note 26 (e) - (Commodity risk) to our
consolidated financial statements on page F62
for more information on financial instruments
and commodity risk.
Counterparty risk for financial operations
We are mainly exposed to credit risk in the
event of default by a counterparty (mainly
banks and other financial institutions). We
attempt to limit our exposure to counterparty
risks by rigorously selecting the counterparties
with whom we trade, by regularly monitoring
the ratings assigned by credit rating agencies,
and by taking into account the nature
and maturity of our exposed transactions,
according to internal Group policies. We
establish counterparty limits that are regularly
reviewed. We believe our counterparty
management risk cautious and in line with
market practises but this may not prevent us
from being significantly impacted in case of
systemic crisis.
For further information on our exposure
to credit and counterparty risks and our
management thereof, see Note 26 (Financial
instruments) to our consolidated financial
statements on page F57 as well as Section 2.3
(Insurance and risk coverage) on page 23 .
Listed shares risk
QUOTED EQUITY
After the disposal of all of our investment
in Cimpor (Portugal) in February 2010, the
Group no longer holds non consolidated
investments in listed companies which could
have a significant impact on the Group’s profit
and financial situation.
See Section 3.2.2 (Recent acquisitions,
partnerships and divestitures) on page 28
for further details on the disposal of our
participation in Cimpor in February 2010.
19Lafarge | Registration Document | 2011

2RISK FACTORS2.2 Risk management
The Group’s principal defined benefits pension
plans, which are situated in the United
Kingdom and in North America, are managed
by pension funds that invest their assets in
listed securities. The fair value of these assets
as well the split of the investments between
stock, bonds and others can be found in
Note 23 (Pensions plans, termination benefits
and other post-employ ment benefits) to our
consolidated financial statements on page F49 .
In the United Kingdom, the pension assets
are principally administered through a unique
pension fund, governed by an independent
board.
See Pension Plans risk on page 16 .
TREASURY SHARES
On December 31, 2011 the Group held
233,448 treasury shares. These shares are
assigned to cover stock-option or performance
share grants. The risk exposure regarding our
self-owned shares is considered not significant
by the Group.
2.2 Risk management
In order to ensure the sustainability of its
business development and to meet its targets ,
the Group makes ongoing efforts to prevent
and control the risks to which it is exposed.
Risk management requires establishing
standard procedures to identify and analyze
the main risks to which the Group is exposed
and continually deploying and managing risk
management systems designed to eliminate
or reduce the probability that risks will arise
and to limit their impact.
2.2.1 Risk identification and analysis
Risk identification and analysis is structured
around several coordinated approaches
conducted within the Group under the
responsibility of the Group Executive
Committee.
A detailed update of the Group risk mapping
was carried out at the end of 2011 and
the outcome will be presented to the Audit
Committee in 2012. The main areas identified
have been subjected to in-depth analysis and
development of actions plans, which will be
progressively implemented. The update
also included a follow-up of action plans
implemented to mitigate key risks reported
through the previous risk mapping.
As part of the Group’s management cycle,
strategic reviews of all Group business units
are conducted periodically by the heads of the
business units, the Divisions and the Group.
These strategic reviews include an analysis of
the main risks to which the operational entities
are exposed.
Every year, an analysis of risks related to
the reliability of financial information, asset
protection, and fraud detection and prevention
is performed at the Group level by the Internal
Control department, in conjunction with the
relevant functional departments. This analysis
serves as a basis for updating the Group’s
internal control standards, which are deployed
across the Group’s main business units, the
Divisions and within the Group’s functional
departments.
The annual audit plan drawn up by the Group
Internal Audit department takes into account
the various analyses described above. In
preparing this plan, Group Internal Audit also
conducts a large number of interviews and
corroborates or supplements these analyses.
Implementation of this plan and the summary
of work presented to the Group Executive
Committee and Audit Committee lead to
more in-depth analyses in certain areas and
contribute to the ongoing risk identification
process.
2.2.2 Risk management systems
An active risk management plan based on the
risk identification and analysis work described
above has been in place within the Group for
several years. It is continually adjusted in
response to new issues and risks to which
the Group is exposed.
General risk management framework and Code of Business Conduct
RESPONSIBILITY AND PRINCIPLES UNDERLYING RISK MANAGEMENT
Generally speaking, the heads of the Divisions,
Business Units and functional departments
are responsible for defining and/or applying
the measures required to reduce the Group’s
risk exposure.
Risk management is based primarily on
certain defining principles, such as:
• the Group’s Principles of Action, which
define the Group’s commitments to
customers, employees, local community
institutions, and shareholders, and
explain the “Lafarge Way”, i.e. the Group’s
management philosophy;
• the principles of organization, which define
responsibilities at different levels within the
organization and the different factors in the
management cycle .
These principles are communicated on an
ongoing basis and are a major component of
the Group’s preventive management of main
risks by defining the Group’s fundamental
values and clearly identifying responsibilities.
In addition, the Group and each functional
department have defined a set of
complementary policies and rules. The
functional managers, their staff, and the
business unit managers are in charge of
disseminating and applying these policies and
rules to ensure that practices are consistent at
Registration Document | 2011 | Lafarge20

RISK FACTORS
2
2.2 Risk management
each level of the organization. All these rules
have been gradually assembl ed to facilitate
their implementation.
LAFARGE EMPLOYEE CODE OF CONDUCT
As a core part of its policies, in 2004, the Group
adopted a Code of Business Conduct that
sets out the principles of conduct that each
individual is to adopt in every day business
situations. The Code of Business Conduct is
essential in preventing the main risks faced
by the Group, by setting out the issues,
recommendations, and prohibitions pertaining
primarily to the following: compliance
with laws and regulations, abiding by free
competition, corruption prevention, insider
trading, conflicts of interest, participation
in politics, health and safety, discrimination
and harassment prevention, respect for the
environment, protection of assets, reliability of
information, importance of internal control and
application of sanctions in case of violations.
The action to strengthen the dissemination
of the Code of Business Conduct and its
appropriation by all Group employees was
largely completed in 2009. This training
program , which is based on concrete case
studies drawn from business examples, was
reviewed by Transparency International and
the International Chamber of Commerce in
2008, and a complete presentation was made
to the Group Stakeholders’ Panel. The Group
continued in 2011 the active promotion of this
program and will implement in 2012 training
tools, accessible through the Group intranet in
all countries where the Group operates.
ASSET PROTECTION
For many years, the Group has been defining
policies and practices implemented for the
purpose of protecting its assets, both tangible
(property, plant and equipment , inventories,
accounts receivable, financial assets,
etc.) and intangible (brand, information,
know-how, patents, etc.). The application
of these policies has been strengthened by
establishing internal control standards in the
Group’s main business units and functional
departments, with one main objective being
the safeguarding of assets.
FRAUD PREVENTION PROGRAM
The Group has a program designed to
prevent, deter, and detect fraud. This program
has been gradually reinforced since 2004 and
encompasses:
• the Code of Business Conduct, which
provides a general framework in this area;
• a procedure that was defined and deployed
for reporting and monitoring cases of fraud
and breaches of the Code of Business
Conduct, which requires that each case
be reported to Group through the various
channels set out in this procedure and
defines the role of the different parties
involved (Group heads of the business
units, Legal, Internal Audit, and Internal
Control departments), the various types of
fraud and the course to be followed in case
of suspected fraud;
• an ethics line set up to enable employees,
anywhere in the world to anonymously
exercise their whistleblowing rights, to
report any breach of the rules laid down in
the Code of Business Conduct and, more
specifically, to report fraud cases. The
guidelines issued by the Cnil (the French
national data protection and privacy agency)
were used to set up this system, including
the most recent developments related to
the decision of the Cassation Court, which
ensures strict adherence to specific rules
implemented in France regarding reporting
mechanisms;
• the Group’s internal control standards,
which cover many key controls that directly
and indirectly target the risk of fraud and
have been widely deployed;
• and, more generally, the body of rules,
procedures, and controls applied within
the Group’s organizations.
Systems for managing specific risks
In particular, risk management systems have
been developed and applied in the following
areas:
• management of the Group’s asset portfolio;
• actions to secure access to raw materials;
• environmental risk management and safety
program;
• antitrust compliance program;
• financial and market risks management.
These systems are defined by precise
objectives, which are approved by the Group’s
governing bodies, the use of dedicated tools
and resources to achieve these objectives,
and a set of oversight and monitoring actions
to ensure that they are properly implemented.
MANAGEMENT OF THE GROUP’S ASSET PORTFOLIO
Management of the Group’s asset portfolio
mainly entails:
• actively monitoring country risks, particularly
those arising from the economic, political
and social climate;
• a process for geographically modeling
natural disaster risks;
• a structured decision-making process for
investments and divestments;
• a system to optimize the flows of funds into
the Group.
The Group Strategy department has defined
a methodology for measuring and monitoring
country risk trends over time. This analysis
is conducted annually and is taken into
account when defining the Group’s asset
management strategy. With the support of
these analyses, we continue to diversify our
portfolio geographically and exercise care to
manage the respective weight of each country
for the Group.
The Group’s Risks and Insurance department
has developed a process for modeling natural
event risks with the primary aim of setting
up insurance programs to secure optimum
coverage for such risks.
Acquisitions and disposals are subject to
review and approval at various levels as a
function of their materiality, upon completion
of each phase – economic opportunity study,
feasibility study and detailed study. The Risk
and Portfolio Committee reviews the risks and
rewards of each acquisition or disposal project
submitted thereto, based on an assessment
report that covers the strategic, business and
financial, legal, tax, Human Resources, and
technical aspects (status of assets and mineral
reserves, energy access conditions), as well as
aspects related to sustainable development. A
risk and opportunity analysis is performed in
each of these areas.
Lastly, a Dividends Committee, in which the
Group’s Tax, Legal, Control and Consolidation
and Financing and Treasury departments
are represented, determines how to optimize
returns of cash to the Group.
21Lafarge | Registration Document | 2011

2RISK FACTORS2.2 Risk management
ACTIONS TO SECURE ACCESS TO CERTAIN RAW MATERIALS
Managing the risk associated with access
to raw materials is organized upstream in
the Group’s development process, primarily
through actions to secure long-term access
to resources via acquisitions and development
projects and ongoing management of land
resources and other supply sources.
See Section 3.4.4 (Mineral reserves and
quarries) on page 42 for further information.
MANAGEMENT OF ENVIRONMENTAL, HEALTH AND SAFETY RISKS
The Group takes many measures to manage
the environmental impact of its business
operations. The Group’s Environmental
and Public Affairs department monitors
the application of its environmental policy
throughout all Group entities. This policy
covers managing production facilities in
compliance with the law, minimizing quantities
of non-renewable resources used, minimizing
waste production, and implementing quarry
rehabilitation plans. Audits and performance
controls are carried out to ascertain that
standards and performance targets are met.
The Group is engaged in an ambitious program
to improve its performance in terms of the
health and safety of persons who work on its
sites. This is being accomplished by defining a
risk management standard, deploying specific
operational rules and standards, as well as
through systematic analyses of the causes
of serious incidents, and by disseminating
information on experiences and good practices
throughout the sites. All Group business units
have been mobilized to implement these
standards, which are gradually reducing
accident risks. The Health and Safety
Management System (HSMS) has the main
following governance Standards: Incident
Reporting and Investigation, Contractor Safety
Management, Risk Management. On top of
these, the HSMS has the following operational
standards: Work at Height, Personal protective
Equipment, Energy Isolation, transport of
people and loads and Confined Space. This
list is not exhaustive.
ANTITRUST COMPLIANCE PROGRAM
The Group antitrust compliance program
(“Compliance Program”), which has been
in place since 2007, aims to ensure that
Group employees strictly abide by antitrust
rules and regulations. It is applicable in all
countries where the Group has operations
and covers all of its activities, including those
conducted jointly with third parties in the
context of partnerships. The Compliance
Program is being deployed steadily and
continuously worldwide through a number of
awareness-building and training actions for
the Group’s employees, as well as verifications
that the rules of the Compliance Program are
being followed at the business unit level and
information reporting through a dedicated
network of antitrust coordinators based in
every country where the Group operates.
In general, in the event of allegations of
breach of compliance with antitrust rules and
regulations made against the Group or one of
its subsidiaries, the Group’s policy is to fully
collaborate with the local antitrust authorities.
In 2011, the Group Competition Team and
local lawyers continued the promotion of this
program with specific trainings performed
worldwide. In addition, to the foregoing,
several Group guidelines are available with the
objective to increase the awareness of Group
employees towards specific competition
risks and to support them in effectively
managing risks in line with the Compliance
Program. Pursuant to the sustainability
ambitions undertaken by the Group, 100%
of its significant business units were tested
for compliance with the Compliance Program
by the end of 2011.
FINANCIAL AND MARKET RISK MANAGEMENT
Management of financial and market risks
(currency and interest rate risk, liquidity risk,
equity risk and risk of price volatility for energy
sources used in the production cycle) is
centralized by the Group Finance department,
which works jointly with the Group Purchasing
department for energy source issues. A set of
strict policies and procedures is determined
at Group l evel to cover these risks and define
the responsibilities of the different parties
involved.
Approval must be obtained from the Group
Finance department for all operations or
transactions involving setting up financing and
guarantees for a term of more than one year
or above a certain amount, the use of some
hedging instruments or derivatives, and the
distribution of dividends.
Our policies do not allow for any speculative
positions on the market. We have instituted
management rules based on the segregation
of duties, financial and administrative
control and risk measurement. We have
also introduced an integrated system for all
operations managed at corporate level that
permits real-time monitoring of hedging
strategies.
Our policy is to use derivative instruments to
hedge our exposure to exchange rate and
interest rate risks. We also use derivative
instruments from time to time to manage our
exposure to commodity risks.
We use financial instruments only to
hedge existing or anticipated financial and
commercial exposures. We undertake this
hedging in the over-the-counter market
with a limited number of highly rated
counterparties. Our positions in derivative
financial instruments are monitored using
various techniques, including the fair value
approach.
To reduce our exposure to currency risks
and interest rate fluctuations, we manage
our exposure both on a central basis through
our Treasury department and in conjunction
with some of our subsidiaries. We use various
standard derivative financial instruments,
such as forward exchange contracts, interest
rate, currency swaps, and forward rate
agreements, to hedge currency, and interest
rate fluctuations on assets, liabilities and future
commitments, in accordance with guidelines
established by our senior management.
We are subject to commodity risk with respect
to price changes principally in the energy and
maritime freight markets. From time to time,
we use derivative financial instruments to
manage our exposure to these commodity
and energy risks.
A follow-up of risks related to financial
instruments is regularly carried out based on
indicators provided to the management team
through internal reporting.
Lafarge participates in the selection and
monitoring of financial assets covering
pension benefit obligations in conjunction with
the entities that manage these funds.
Registration Document | 2011 | Lafarge22

RISK FACTORS
2
2.3 Insurance and risk coverage
2.3 Insurance and risk coverage
The Group’s general insurance policy is based
on the following key principles:
• implement prevention and protection
actions in order to mitigate risks;
• retain exposure to frequency risks through
Group captives;
• transfer only severity risks, above the self-
retention threshold, to the leading insurers
and reinsurers. Special attention is given to
the financial strength of market participants;
• cover subsidiaries in which we own a
majority shareholding under Group-
wide insurance policies, subject to
local regulatory constraints and specific
geographical exclusions.
In 2011, the total cost of the Group’s insurance
programs, including the risks self-insured
via the captives, amounted to about 3.9 per
thousand of the revenues of the insured
perimeter.
Property damage and business interruption insurance
These insurance programs cover property
losses resulting from fire, explosion, natural
disasters, machinery breakdown, etc. and
related business interruption, if any. These
programs provide worldwide coverage. Group
assets are insured at their actual cash value.
Total insured values amount to 27,433 million
euros.
Potential fire loss scenarios for the largest
sites are regularly evaluated with specialized
engineers from an external consulting firm.
The highest “Maximum Foreseeable Loss” for
fire per site is lower than 200 million euros
except for the Group’s Egyptian cement
plant where it could reach 230 million euros
taking into consideration this plant’s very large
production capacity. Accordingly, the Group
“Property Damage and Business Interruption”
program limit remains at 200 million euros
per claim, with the usual sub-limits set by
insurance companies. Due to the highest
“Maximum Foreseeable Loss” in Egypt, an
additional 30 million euros of coverage is still
in force for this plant in 2011.
The Group has implemented a regular
modelization process of risks linked to natural
disasters, based on the best tools used by
international insurers and reinsurers. This
process aims at identifying the sites with
main exposure, classifying potential losses
according to their financial impact per event,
country and occurrence probability, in order to
adjust the coverage of the Group’s assets. This
process covers risks which can be modeled
(earthquake, flood, etc. ) on the basis of
available models and data.
The number and diverse geographical
locations of the Group’s industrial sites all
over the world help mitigate the risk of high
business interruption exposure.
In accordance with the plan decided by the
Group, fire risk protection standards are
progressively implemented in all cement
plants with the support of prevention engineers
from an external consulting firm.
Liability insurance
Public liability, product liability and
environmental impairment liability policies
are the main liability-type policies within the
Group. They cover amounts commensurate
with the nature of Lafarge’s business activities,
the relevant countries, loss experience and
available capacity in the insurance and
reinsurance markets. Within our global public
and product liability program, Lafarge North
America Inc., our subsidiary in North America,
has its own stand-alone primary casualty
insurance program designed to cover the
specific liability risks in North America.
Captive insurance
The Group has one insurance and one
reinsurance captive insurance companies
located in Europe to manage the frequency
risk of the Group’s subsidiaries. The amount of
liability retained by these captives stands at a
maximum of 2 million euros per casualty claim
and 5 million euros per property damage
claim.
In North America, the Group has two
insurance captive companies covering
workers compensation, automobile liability
and general liability coverage. The maximum
liability retained by these captives ranges from
2 million US dollars to 5 million US dollars per
loss, depending on the type of coverage.
23Lafarge | Registration Document | 2011

2RISK FACTORS
Registration Document | 2011 | Lafarge24

3.1 THE GROUP 26General presentation 26
3.1.1 History and development of the Group 26
3.1.2 Organizational structure 27
3.2 OUR STRATEGY 273.2.1 Strategic objectives and priorities 27
3.2.2 Recent acquisitions, partnerships and divestitures 28
3.3 INNOVATION 293.3.1 Innovation, Research & Development (R&D) 29
3.3.2 Intellectual property 31
3.4 OUR BUSINESSES 32Overview 32
3.4.1 Cement 32
3.4.2 Aggregates & Concrete 37
3.4.3 Gypsum 41
3.4.4 Mineral reserves and quarries 42
3.4.5 Summary of our capital expenditures in 2011
and 2010 44
3.4.6 Capital expenditures planned for 2012 44
3.5 INTRA-GROUP RELATIONSHIPS 44
INFORMATION ON LAFARGE
3
25Lafarge | Registration Document | 2011

3INFORMATION ON LAFARGE3.1 The Group
26
3.1 The Group
General presentation
Lafarge S.A. is a Limited Liability Company
(Société Anonyme) incorporated in France
under French law. We produce and sell
building materials – cement, aggregates and
ready-mix concrete principally – worldwide,
mostly under the “Lafarge” brand name.
Our products are used to build and renovate
residential, commercial and public works
throughout the world. Based on sales, we
are the world leader in building materials.
Based on internal and external research,
we are believed to be the world leader in the
cement market, the second largest producer
of aggregates and the fourth largest producer
of ready-mix concrete worldwide.
Lafarge shares have been traded on the
Paris Stock Exchange (NYSE Euronext Paris)
since 1923. They are a component of the
CAC 40, the principal market index in France
(and have been in such index calculation
since the beginning).
Our reporting currency is the euro (€).
In 2011, the Group generated 15,284 million
euros in sales, and posted a current operating
income (as defined in Section 4.2 (Accounting
policies and definitions)) of 2,179 million
euros and net income, Group share of 593
million euros. At year-end 2011, its assets
totalled 40,719 million euros and the Group
employed approximately 68,000 people in 64
countries.
Lafarge S.A. was incorporated in 1884
under the name “J. et A. Pavin de Lafarge”.
Our corporate term is due to expire on
December 31, 2066 and may be extended
pursuant to our by-laws. Our registered office
is located at 61, rue des Belles Feuilles, 75116
Paris, France, and our telephone number is
+ 33 1 44 34 11 11. We are registered under
the number “542 105 572 RCS Paris” with
the registrar of the Paris Commercial Court
(Tribunal de commerce de Paris).
3.1.1 History and development of the Group
We began operating in France around 1833
when Joseph-Auguste Pavin de Lafarge set
up a lime operation in Le Teil (Ardèche), in
the Valley of the Rhône. Through sustained
internal growth and numerous acquisitions
of lime and cement companies throughout
France, we became France’s largest cement
producer by the late 1930s. Our first foray
outside France took place in 1864 when
we supplied lime for construction of the
Suez Canal, which was the prelude to our
expansion in the Mediterranean Basin. Our
international expansion continued in the
20th century when we set up operations in
North Africa and later when we began doing
business in Brazil and Canada in the fifties.
Through our 1981 acquisition of General
Portland Inc., we became one of the largest
cement manufacturers in North America.
In 1989, the acquisition of the Swiss group
Cementia brought a number of new positions,
including in Europe and East Africa. We
further expanded internationally, in particular
in Asia, with our first operations in China and
India in the nineties. Through the purchase
of the British cement company Blue Circle
Industries plc (“Blue Circle”) in 2001 we
became the world leader in cement and
strengthened our position in emerging
markets. The January 2008 acquisition of
Orascom Building Materials Holding S.A.E
(“Orascom Cement”), the Cement activities of
the Orascom group, provided us with a leading
position and unparalleled presence in Middle
East and Africa. This transaction represented
a decisive step in the Group’s Cement strategy,
diversified our worldwide presence, and
accelerated our growth in emerging markets.
We have also broadened our other
product lines of aggregates, concrete and
gypsum plasterboard. Our Aggregates and
Ready-Mix Concrete business developed
progressively over the years and made a
significant leap forward in 1997 with the
acquisition of Redland plc, one of the principal
manufacturers of Aggregates and Ready-Mix
Concrete worldwide at the time, and to a lesser
extent through our acquisition of Blue Circle
in 2001.
During the second half of 2011, we sold the
major part of our Gypsum operations, which
had first started in 1931 with the production
of plaster powder in France.
We also draw on a shared culture and shared
ambitions with all our employees, which are
expressed in our Principles of Action.
KEY DATES
1833
February2007
Beginning
of operations
in France
1956 1981Acquisition of General
Portland, making
Lafarge one of the largest
cement manufacturers
in North America
1994Lafarge enters
the Chinese market
Sale of
the Roofing Division
1864Lafarge delivers
110,000 tonnes of lime
for the construction
of the Suez Canal
1959First operations in Brazil
1989Acquisition
of Cementia
1997Acquisition of Redland plc,
one of the principal
manufacturers
of aggregates
and concrete worldwide
2001Acquisition
of Blue Circle
Industries plc.
2011Sale of
our Gypsum
operations
2006Lafarge owns 100 %
of Lafarge North
America Inc.
January 2008Acquisition
of Orascom
Cement
Lafarge builds
its 1 cement plant
in Richmond, Canada
st
1998First operations
in India
Registration Document | 2011 | Lafarge26

INFORMATION ON LAFARGE
3
3.2 Our strategy
3.1.2 Organizational s tructure
In 2011, the G roup was organized in Divisions,
each with decentralized local oper ations and
strong corporate expert departments, involved
in strategic decisions.
To reinforce its efficiency in its markets
and accelerate its development, Lafarge
establishes, in 2012, a new, country based,
organization, more agile, reactive and
customer and market-oriented.
This organization is characterized by three
major changes:
• the implementation of a country- based
s t r uc tu r e , w i t h coun t r y CEOs ’
responsibilities covering all Cement,
Aggregates & Concrete activities, and
using common support functions;
• the removal of one hierarchical layer, the
regions;
• the resulting transformation of the structure
and responsibilities of the Executive
Committee, including the creation of a
Performance function and an Innovation
function.
The new Executive Committee comprises
the Chairman and Chief Executive Officer, an
Executive Vice-President (EVP) Innovation,
an EVP Performance, three EVPs Operations
responsible for supervising business units,
an EVP Strategy, Development and Public
Affairs, an EVP Finance, an EVP Organization
and Human Resources, and one Senior Vice-
President Group Communications.
This constitutes the natural next step following
Lafarge’s geographical expansion and its
recent refocusing on Cement, Aggregates &
Concrete, particularly after the disposal of
most of its Gypsum activities.
Its aim is to increase Lafarge’s differentiation
through the development of higher value-
added products and higher added value
solutions for construction, associating all
competencies, Cement, Aggregates and
Concrete in each country, and thus reinforce
Lafarge position as a key actor in sustainable
construction.
3.2 Our strategy
3.2.1 Strategic objectives and priorities
Our goal is to create shareholder value. To
achieve this, the Group’s strategy aims at
strengthening our position as world leader
in building materials, in terms of market
share, innovation, recognition by customers,
geographical portfolio, and profitability.
We have two strategic priorities: cement,
primarily in emerging markets, and
innovative products and solutions, particularly
construction systems, including sustainable
construction solutions.
Over the past twenty years, world cement
consumption has significantly increased with
an average rate of growth above 5% per year.
Despite the economic and financial crisis,
global cement demand grew by approximately
8% in 2011, supported by the dynamism of
most large emerging markets, particularly
China, Brazil, India and Sub Saharan Africa.
Mid and long-term prospects for cement
demand remain favorable, especially in these
markets, where demography, urbanization and
economic growth drive the needs for housing
and infrastructure. Emerging markets account
for 71% of Group’s current operating income
(76% for the Cement Division) in 2011.
We believe that we are in a very good position
to benefit from this long-term fundamental
growth thanks to our well diversified
geographical portfolio, strengthened during
recent years by our cement capacity increase
program and the acquisition of Orascom
Cement in January 2008. Most of our new
production capacity projects are located in
emerging markets.
EVOLUTION OF THE CEMENT WORLD MARKET
Million tonnes
Year
1992
1993
1994
1995
1996
1997
1998
1999
2000
2001
2002
2003
2004
2005
2006
2007
2008
2010
2009
1,200 1,250 1,300 1,350 1,420 1,470 1,495
5 % per annum
1,570 1,620 1,7001,800
1,9002,100
2,3002,500
2,740 2,8002,980
3,290
3,540
0
500
1,000
1,500
2,000
2,500
3,500
3,000
Lafarge estimate
2011
27Lafarge | Registration Document | 2011

3INFORMATION ON LAFARGE3.2 Our strategy
Our second strategic priority is to develop our
sales of innovative building materials, systems
and services that meet the expectations of our
clients in terms of sustainable construction,
aesthetics and cost.
The experience accumulated by the Group
in the developed markets was considerably
enriched by our development in emerging
countries. The combined effect of the
cross-fertilization between our various
geographies and the increase of our
Research & Development capabilities has
led to a broadening of our product range
and services. These higher value-added
products and systems aim at meeting the
increased expectations of our clients in
terms of performance, ease of use, reduced
application time and recycling.
Sustainable development is core to the
Group’s strategy. It encompasses:
• preservation of the environment and
combating climate change (limited raw
materials extraction, emissions reduction –
notably CO2 – and biodiversity promotion);
• health protection and medical care for our
employees and neighboring communities;
and
• more generally the Group’s social
involvement, as illustrated by the Group’s
actions following natural disasters.
Furthermore, Lafarge has three operational
priorities:
• the first is the day-to-day health and safety
of the women and men who work for
the Group, be they on the payroll or with
sub-contractors, on site or on the road.
Between 2008 and 2011 (based on our
2008 business scope), we managed to
reduce by 57% the number of workplace
lost time-incidents , demonstrating our
commitment to deliver in this area;
See Section 7.2 (Health and Safety) for
more information.
• the Group’s second operational priority
is cost-reduction. After having delivered
250 million euros of savings in 2011,
the Group adopted a new objective of
500 millions euros, of which at least
400 millions by the end of 2012;
• the third priority is People Development
with a focus on filling our talent pipeline,
developing our talents, leveraging diversity,
and ensuring effective organization.
We estimate that the Group’s strategy strongly
supports our goal of being recognized as the
best creator of value by our shareholders,
the best supplier of products and services
by our customers, the best employer by
our employees and the best partner for the
communities in the regions where we operate.
3.2.2 Recent acquisitions, partnerships and divestitures
Significant recent acquisitions
See Notes 3 (Significant events) and 10 (b)
(Acquisitions and Disposals) to our
consolidated financial statements for more
information on these acquisitions.
Brazil. In February 2010, the Group sold
its 17.28% stake in Cimpor (Portugal) to
Votorantim (Brazil) in exchange for Cement
operations in Brazil. These operations located
in North East and Mid-West Brazil and around
Rio de Janeiro include two grinding stations,
one cement plant, slag and clinker supply
agreements to grinding stations. These
operations, valued at 755 million euros, were
transferred to the Group on July 19, 2010.
In addition, over the past two years, we
have acquired a limited number of small-to-
medium size businesses.
Acquisitions during the last two years had
an overall positive effect on our revenues of
198 million euros in 2011 compared with
2010.
Significant recent partnerships
See Notes 3 (Significant events) and 20
(Equity) to our consolidated financial
statements for more information on these
transactions.
United Kingdom. On February 18, 2011,
Lafarge and Anglo American plc announced
an agreement to combine their cement,
aggregates, ready-mix concrete, asphalt
and contracting businesses in the United
Kingdom. The transaction will form a 50-50
joint venture and will create a leading UK
construction materials company, with a
portfolio of high quality assets drawing on
the complementary geographical distribution
of operations and assets, the skills of two
experienced teams and a portfolio of well-
known and innovative brands. The closing of
this transaction is subject to approval by the
competition authorities.
Central and Eastern Europe. On May 25, 2010,
Lafarge and STRABAG announced their
agreement to combine their cement activities
in several Central European countries. Lafarge
brought its cement plants in Mannersdorf
and Retznei in Austria, Cížkovice in Czech
Republic and Trbovlje in Slovenia, while
STRABAG contributed the plant built in Pécs
in Hungary. Lafarge holds a 70% interest in
the joint venture, and STRABAG holds 30%.
After obtaining the approval by the competition
authorities in February 2011 and the fulfilment
of other conditions precedent, the transaction
became final on July 29, 2011.
Significant recent divestitures
See Notes 3 (Significant events), 5 (Net gains
(losses) on disposals) and 32 (Supplemental
cash flow disclosures) to our consolidated
financial statements for more information on
these transactions.
Asia. On December 9, 2011, Lafarge sold
its stake in LBGA (Lafarge Boral Gypsum
Asia) to its partner Boral. LBGA was a joint
venture owned 50/50 by Lafarge and Boral
and dedicated to Gypsum activities in Asia.
Europe and South America. On November 4,
2011, Lafarge completed the sale of its
Gypsum activities in Europe and South
America to the Etex group. Lafarge retains a
20% stake in the new entities that combine
gypsum operations of both companies in
Europe and South America.
Australia. On August 5, 2011, Lafarge sold
its gypsum operations in Australia to Knauf,
composed of two plants of plasterboard and
other related products and of a national
network of distribution and sales.
The United States. On October 3, 2011,
Lafarge completed the sale of its Cement and
Concrete businesses in the South East of the
United States to the Colombian conglomerate
Cementos Argos. The Cement business
sold includes Harleyville cement plant in
South Carolina and Roberta cement plant in
Alabama, a cement grinding station in Atlanta,
Georgia, and the associated distribution
terminals. Lafarge also sold its ready-mix
concrete business units in this region of the
United States.
Registration Document | 2011 | Lafarge28

INFORMATION ON LAFARGE
3
3.3 Innovation
Switzerland and Alsace (France). On
December 31, 2010, Lafarge sold its
Aggregates & Concrete business in Alsace and
Switzerland, including 8 concrete production
plants (4 in Alsace and 4 in Switzerland) and
8 aggregates quarries in Alsace. The Swiss-
based concrete operations have been sold
to Holcim and the French-based Aggregates
& Concrete activities have been sold to Eiffage
Travaux Publics and Holcim.
Portugal. On December 27, 2010, Lafarge
entered into an agreement for the sale of its
entire Aggregates & Concrete business in
Portugal (29 concrete plants and 4 aggregates
quarries) to the Portuguese construction
group Secil. Approval by the competition
authorities was obtained on June 2011 and
the transaction closed on June 30, 2011.
Malaysia. On July 16, 2010, Lafarge sold a
11.2% interest in Lafarge Malayan Cement
Berhad (“LMCB”) by way of placement done
on Bursa Malaysia Securities Berhad. Lafarge
keeps the management control of the Malayan
activities and remains the majority shareholder
with a 51% controlling shareholding in LMCB.
Portugal. On February 3, 2010, Lafarge sold
its 17.28% minority interest in the Portuguese
company Cimpor to the Brazilian company
Votorantim. This transaction is an exchange
of Cimpor shares held by Lafarge for some
of Votorantim’s cement assets in Brazil,
as described above in Significant recent
acquisitions.
In addition, during 2010 and 2011, we
carried out several small-to-medium sized
divestments.
In total, divestitures during the last two years
reduced the Group’s sales by 186 million
euros in 2011 compared to 2010.
3.3 Innovation
3.3.1 Innovation, Research & Development (R&D)
Innovation is one of the Group’s two strategic
priorities. The Group’s R&D activities focus
on three main objectives: researching new
products and systems that offer increased
value-added solutions to our customers,
developing our product ranges to respect
our commitments in terms of sustainable
construction, and implementing processes
and products that help reduce CO2 emissions.
In 2011, the overall Group expenditure for
product innovation and industrial process
improvement was 129 million euros,
compared to 153 million euros in 2010.
High level research teams and international network
The Group’s Research investments are mainly
based at the Lafarge Research Center (LCR),
located near Lyon in France. Today, this
research center is made up of approximately
240 talented men and women: engineers and
technicians who come from various scientific
and international backgrounds. LCR is an
acknowledged leader and continues to attract
researchers from all over the world.
LCR’s research activity is organized in a matrix
structure based on scientific competencies
and management of different project portfolios.
The organization of LCR’s expertise and
scientific management was strengthened
in 2011 and international partnerships
were significantly increased, particularly
in emerging markets. More specifically, in
March 2011, the Group signed a partnership
agreement with IIT Madras, India to set up a
new research laboratory on concrete durability.
It also concluded a research partnership
agreement with Chongqing University, China
in September.
In addition, a Symposium jointly organized in
July in Beijing with Tsinghua University and
China Ceramic Society brought together over
150 representatives from China’s construction
industry as well as a panel of international
scientific leaders (from China, USA and
Europe) specializing in our domains. They
presented the latest scientific breakthroughs
in concrete science as well as the wide
scope for the use of concrete in sustainable
construction.
Finally, the Lafarge Academic and Research
Chair (École des Ponts ParisTech) on Materials
Science for Sustainable Construction was
renewed in 2011. After MIT in 2007, Berkeley
in 2008, Georgia Tech in 2009 and Delft in
2010, students from the Master’s supported
by this Chair attended a three-day seminar
at MIT. This confirms the interest of foreign
universities in a doctorate program which
remains today the only one of its kind in the
world.
Well-established innovation dynamics
Informed through their responsibilities of
trends and expectations of the markets, the
members of the Executive Committee share
a dialog with researchers about “the field
of possibilities” and the results within the
research programs.
The dynamics for boosting our project portfolio
is sustained by the impetus of a Creativity
team composed of volunteer engineers and
technicians. They have carte blanche to
stimulate the emergence of new ideas in line
with our strategic goals and in liaison with our
marketing teams.
Furthermore, we are continuing to widen
our sources of innovation, in particular with
the second edition of our “Lafarge Invention
Awards 2011” contest open this time to
construction scientists and inventors in
India. Over 60 submissions were collected
and 3 winners were awarded prizes at an
awards ceremony in Mumbai in March 2012.
The objective of the contest was to reward
innovative Indian projects related to Lafarge
materials and contributing to sustainable
construction. It was also an opportunity to
broaden the Group’s scientific network in India
and to establish contacts with the best Indian
research teams.
29Lafarge | Registration Document | 2011

3INFORMATION ON LAFARGE3.3 Innovation
Innovative research focuses
Our research work for the Business Divisions
in 2011 was directed as follows:
CEMENT
We pursued our work to reduce the carbon
footprint of our products. We successfully
performed an industrial trial to produce
Aether™ clinker, which allowed us to confirm
a 25% reduction of carbon emissions per ton
of clinker, as well as a 15% reduction in the
energy needed for burning, achieved without
any significant process modifications. The
European Union has lent us its financial
support for this project as part of the Life+
program.
We continued to support the Novacem
start-up, whose objective is to produce a
magnesium silicate binder (an alternative to
limestone and clay with which our cements are
manufactured) via a process with potentially
low carbon emissions.
Increasing the percentage of mineral additives
in our cements remains a priority as it helps
to reduce the environmental impact. This
research work is based on the fundamental
research results obtained by the Nanocem
European research network. We also
accelerated our research on the impact
that high percentages of additives have on
concrete durability.
We pursued a number of programs aiming to
differentiate our products for specific segments
of the construction market. The priority was
given to bagged cement for masonry work and
low cost binders for affordable housing.
We also began new research work into the
cement manufacturing process, especially
grinding and the preparation of alternative
fuels used in our kilns, as well as new design
concepts for our installations to reduce our
investment costs.
We are fostering an active partnership with the
MIT (Massachussetts Institute of Technology)
as part of the CSHub (Concrete Sustainability
Hub). This ambitious project aims to describe
the fundamental mechanisms governing
cement performances and to identify the
innovation levers for reducing environmental
impact, using the most advanced tools from
materials science, in particular molecular
computing methods.
Amid the economic conditions currently
prevailing, cutting production costs and
raising operational performance are more than
ever major priorities for our Cement business.
To this end, the Division is backed up by
our network of Technical Centers providing
plants with the permanent support of their
high-caliber experts in all the key areas of the
cement industry, i.e. Safety, Environment,
Geology, Processes, Products and Equipment.
Aside from providing strong support to
operations with the deployment of a genuinely
safety-oriented culture and assisting in the
reduction of the environmental footprint of
our plants, the Technical Centers particularly
support the rapid deployment of the
performance programs launched by the
Cement activity , such as Excellence 2010. By
focusing on the principal levers of industrial
performance, including reducing power and
heat consumption, increasing the use of
cheap alternative fuels and cement additives,
and cutting fixed costs, this program focuses
the Cement activity ’s attention on objectives
that will pave the way for cost reductions in
the short to medium term.
Likewise, the continuous improvement
programs to enhance plant reliability, the
installation of automatic control systems for
kilns and grinding plants, assistance with
the development of new products and the
industrialization of the R&D’s results also
form part of the Technical Centers’ role.
Late 2010, we launched a program for
further improving our plant’s mastery and
technical performances. This program is
based on worldwide implementation of a
single operational model, on competency
certification programs and on clear and simple
industrial standards. The implementation is
monitored by the Technical Centers and will be
audited on a regular basis. This new program
will not only increase our performances rapidly
but will also help to sustain them more reliably
over the long term.
The Technical Centers are also responsible
for integrating recently built plants and newly
acquired units, which can thus adopt the
Group’s standard practices and rapidly deliver
high performances.
Generally speaking, the Technical Centers
continuously analyze and benchmark the
results of the plants and are able to respond
very rapidly to the slightest dip in performance,
sending in their experts promptly in the event
of a serious incident in order to analyze and
resolve the underlying problems. Lastly,
the Technical Centers are responsible for
capitalizing, sharing and implementing best
practices and technical standards, which aim
to sustain the benefits of short-term initiatives
over time.
AGGREGATES & CONCRETE
Research on aggregates was pursued in
2011: product performances were optimized
according to their destination and certain
by-products were upgraded, thus contributing
to the preservation of this natural resource.
The “Road” program focused its efforts on
road material recycling. The aim is to reduce
energy production costs and the carbon
footprint of asphalts.
The 2011 priority was to widen the range of
Thermedia™ concretes for thermal insulation,
contributing to improved energy efficiency
in buildings. We have also completed our
research work on new concretes with high-
performance environmental characteristics
such as low carbon concretes and
Hydromedia™ pervious concretes, which
help to better manage storm and rain water
runoffs. Hydromedia™ was launched in
several countries and its deployment will
continue in 2012.
World-wide transfers of recent concrete
innovations (Extensia™ large slabs without
joints, Chronolia™ rapid-setting concrete,
Agilia® self-leveling concrete, Artevia™
architectonic concretes) were pursued at a
rapid pace thanks to the dedicated team of
engineers and technicians and supported
by the facilities in the technological building
inaugurated in 2008. We are pursuing
the development of our material Ductal®,
belonging to the family of UHPFRC (Ultra-High
Performance Fiber Reinforced Concrete).
Many job sites using this material are currently
in progress.
GYPSUM
Our Gypsum research team worked more
particularly on improving fundamental
knowledge of water and humidity resistance
of gypsum board systems and on how to
make the boards lighter. They also worked
on reinforcing our system offer in terms of
acoustic comfort and thermal insulation in
buildings.
Registration Document | 2011 | Lafarge30
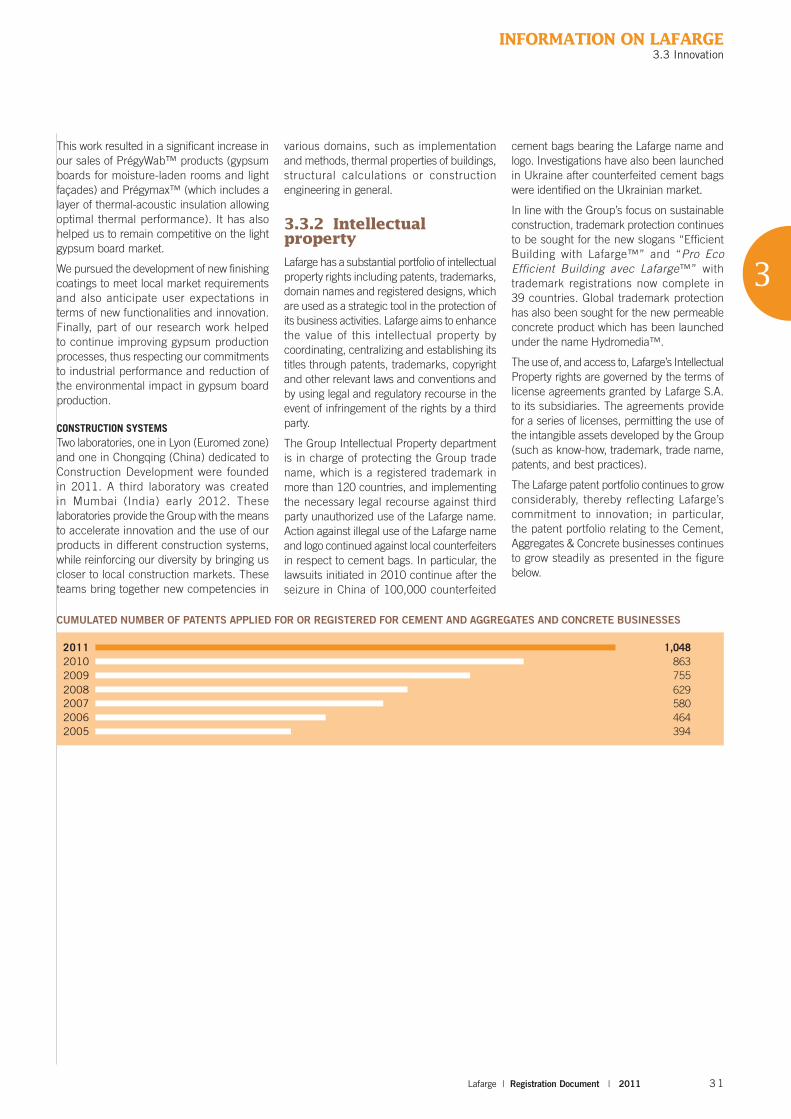
INFORMATION ON LAFARGE
3
3.3 Innovation
This work resulted in a significant increase in
our sales of PrégyWab™ products (gypsum
boards for moisture-laden rooms and light
façades) and Prégymax™ (which includes a
layer of thermal-acoustic insulation allowing
optimal thermal performance). It has also
helped us to remain competitive on the light
gypsum board market.
We pursued the development of new finishing
coatings to meet local market requirements
and also anticipate user expectations in
terms of new functionalities and innovation.
Finally, part of our research work helped
to continue improving gypsum production
processes, thus respecting our commitments
to industrial performance and reduction of
the environmental impact in gypsum board
production.
CONSTRUCTION SYSTEMS
Two laboratories, one in Lyon (Euromed zone)
and one in Chongqing (China) dedicated to
Construction Development were founded
in 2011. A third laboratory was created
in Mumbai (India) early 2012. These
laboratories provide the Group with the means
to accelerate innovation and the use of our
products in different construction systems,
while reinforcing our diversity by bringing us
closer to local construction markets. These
teams bring together new competencies in
various domains, such as implementation
and methods, thermal properties of buildings,
structural calculations or construction
engineering in general.
3.3.2 Intellectual property
Lafarge has a substantial portfolio of intellectual
property rights including patents, trademarks,
domain names and registered designs, which
are used as a strategic tool in the protection of
its business activities. Lafarge aims to enhance
the value of this intellectual property by
coordinating, centralizing and establishing its
titles through patents, trademarks, copyright
and other relevant laws and conventions and
by using legal and regulatory recourse in the
event of infringement of the rights by a third
party.
The Group Intellectual Property department
is in charge of protecting the Group trade
name, which is a registered trademark in
more than 120 countries, and implementing
the necessary legal recourse against third
party unauthorized use of the Lafarge name.
Action against illegal use of the Lafarge name
and logo continued against local counterfeiters
in respect to cement bags. In particular, the
lawsuits initiated in 2010 continue after the
seizure in China of 100,000 counterfeited
cement bags bearing the Lafarge name and
logo. Investigations have also been launched
in Ukraine after counterfeited cement bags
were identified on the Ukrainian market.
In line with the Group’s focus on sustainable
construction, trademark protection continues
to be sought for the new slogans “Efficient
Building with Lafarge™” and “Pro Eco
Efficient Building avec Lafarge™” with
trademark registrations now complete in
39 countries. Global trademark protection
has also been sought for the new permeable
concrete product which has been launched
under the name Hydromedia™.
The use of, and access to, Lafarge’s Intellectual
Property rights are governed by the terms of
license agreements granted by Lafarge S.A.
to its subsidiaries. The agreements provide
for a series of licenses, permitting the use of
the intangible assets developed by the Group
(such as know-how, trademark, trade name,
patents, and best practices).
The Lafarge patent portfolio continues to grow
considerably, thereby reflecting Lafarge’s
commitment to innovation; in particular,
the patent portfolio relating to the Cement,
Aggregates & Concrete businesses continues
to grow steadily as presented in the figure
below.
CUMULATED NUMBER OF PATENTS APPLIED FOR OR REGISTERED FOR CEMENT AND AGGREGATES AND CONCRETE BUSINESSES
2011
2010
2008
2009
2007
2006
2005
863
1,048
629
755
580
464
394
31Lafarge | Registration Document | 2011

3INFORMATION ON LAFARGE3.4 Our businesses
3.4 Our businesses
Overview
The 2011 contribution to the Group’s consolidated sales by Division and by region was as follows compared with 2010:
SALES BY DIVISION *
2011 2010 **
(million euros) (%) (million euros) (%)
Cement 9,975 65.3 9,656 65.1
Aggregates & Concrete 5,227 34.2 5,088 34.3
Other 82 0.5 90 0.6
TOTAL 15,284 100.0 14,834 100.0
* After elimination of inter-Division sales.
** 2010 figures have been restated as mentioned in Note 3 (Significant events) to the Consolidated Financial Statements following the disposal of the Gypsum Division.
SALES BY GEOGRAPHIC AREA (1)
2011 2010 (3)
(million euros) (%) (million euros) (%)
Western Europe (2) 3,431 22.5 3,482 23.5
North America 3,110 20.3 3,153 21.3
Central & Eastern Europe(2) 1,302 8.5 1,066 7.2
Middle East & Africa 3,897 25.5 3,883 26.2
Latin America 1,035 6.8 838 5.6
Asia 2,509 16.4 2,412 16.2
TOTAL 15,284 100.0 14,834 100.0
(1) By destination.
(2) Austria was reclassified from Western Europe to Central & Eastern Europe.
(3) 2010 figures have been restated as mentioned in Note 3 (Significant events) to the Consolidated Financial Statements following the disposal of the Gypsum Division.
For each Division, the following schedule presents the contribution made to current operating income in years ending December 31, 2011
and 2010:
CONTRIBUTION TO GROUP CURRENT OPERATING INCOME *
(%) 2011 2010 **
Cement 90.3 93.2
Aggregates & Concrete 10.9 9.0
Other (1.2) (2.2)
TOTAL 100.0 100.0
* As defined in Section 4.2 (Accounting Policies and Definitions).
** 2010 figures have been restated as mentioned in Note 3 (Significant events) to the Consolidated Financial Statements following the disposal of the Gypsum Division.
In the following pages of this Section 3.4:
• sales figures are presented “by destination”
market. They include all the amounts both
produced and sold in the market, as well
as any quantities imported into the market
by our operations, and exclude any exports
to other markets. They are presented
before elimination of inter-Division sales
and calculated following applicable
consolidation rules;
• data regarding the number of sites and
production capacity include 100% of all
its subsidiaries’ facilities and production
capacity, whether fully or proportionately
consolidated;
• the percentage of sales for each region is
computed in relation to the total sales of
the relevant Division, before elimination of
inter-Division sales.
When operating our business, we may face
risks presented in Section 2 (Risks Factors).
3.4.1 Cement
Cement is the principal hydraulic binder. It
is the principal strength-giving and property-
controlling component of concrete. It is a
high quality, cost-effective building material
that is a key component of construction
projects throughout the world, including
the 58 countries in which we have cement
operations. Based on both internal and
external research, we believe that we are the
world’s leading producer of cement, taking
into account sales, production capacity,
geographical positions, technological
development and quality of service. At
year-end 2011, the Group’s consolidated
businesses operated 124 cement, 36 clinker
grinding and 6 slag grinding plants, with an
annual production capacity of 225 million
tonnes, (total capacity of entities controlled
by Lafarge, of which 202 million tonnes
after deduction of our partners’ share in
joint ventures). Consolidated sales for 2011
reached approximately 145.3 million tonne s.
Registration Document | 2011 | Lafarge32

INFORMATION ON LAFARGE
3
3.4 Our businesses
Products
We produce and sell an extensive range
of cements and hydraulic binders for the
construction industry, including basic Portland
and masonry cements and a variety of other
blended and specialty cements and binders.
We offer our customers a broad line, which
varies somewhat by market. Our cement
products (all of which are referred to as
“cement” in this report) include specialty
cements suitable for use in a variety of
environmental conditions (e.g. exposure to
seawater, sulfates and other natural conditions
hostile to concrete) and specific applications
(e.g. white cement, oil-well cements, blended
silica fume, blended fly-ash, blended
pozzolan, blended slag cements and road
surfacing hydraulic binders), natural lime
hydraulic binders, masonry cements, and
ground blast furnace slag.
We design our cements to meet the diverse
needs of our customers, including high-
performance applications for which enhanced
durability and strength are required. We
also offer our customers a number of extra
services, such as technical support in
connection with the use of our cements,
ordering and logistical assistance to ensure
timely delivery to the customers, plus
documentation, demonstrations and training
relating to the properties and appropriate use
of our cements.
Production and f acilities i nformation
COMPOSITION AND PRODUCTION OF CEMENT
Cement is made by extracting, crushing and grinding
calcium carbonate (limestone), silica (sand), alumina
and iron ore in appropriate proportions and heating the
resulting mixture in a rotary kiln to approximately 1,500°C.
In the more modern “dry process” used by around 88%
of Lafarge’s plants, the ore mixture enters the kiln dry, as
opposed to the older process in which it is mixed with water.
Each process produces “clinker”, which is then finely
ground with gypsum to make cement powder. An average
breakdown of the production cost of cement (before
distribution and administrative costs) is approximately:
energy 33%, raw materials and consumables 28%,
labor, maintenance and other production costs 27%, and
depreciation 12%.
Raw materials for making cement (calcium carbonate,
silica, alumina, and iron ore) are usually present in
limestone, chalk, marl, shale and clay, and are available
in most countries. Cement plants are normally built close
to large deposits of these raw materials. For most of our
cement plants, we obtain these materials from nearby
land that we either own or over which we hold long-term
quarrying rights. The quantity of proven and permitted
reserves at our cement plants is believed to be adequate
to operate the plants at their current levels for their planned
service life.
See Section 3.4.4 (Mineral reserves and quarries) for more
information.
Where technically and economically feasible,
we substitute ground blast furnace slag,
pozzolan or fly ash for certain raw materials
when making cement, or mix slag, pozzolan or
fly ash with cement at the end of the process.
Ground blast furnace slag is a by-product of
steel manufacturing, and fly ash is a product
of burning coal in electric thermal utility plants.
Whether and how they are used depends on
the physical and chemical characteristics
of the slag or ash and on the physical and
chemical properties required of the cement
being produced. These materials help
lower our capital costs per tonne of cement
produced. Their use is environmentally
friendly since it increases cement supplies
by recycling post-industrial material and
helps to limit CO2 emissions. We measure
improvement by the cement over clinker
ratio which reached 1.32 in 2011 compared
to 1.30 in 2010 and 1.29 in 2009.
ENERGY OPTIMIZATION
Energy is the largest expense item among
the Group’s production costs (33% of total,
excluding distribution and administrative
costs).
Wherever possible, we use advanced plant
designs (such as preheaters to heat raw
materials prior to entering the kiln) and waste
materials (e.g. tires, used oils) to curb the use
of fossil fuels. In 2011, fuel waste materials
accounted for close to 14% of our worldwide
Blasting
Crusher
Grinder
Clinkerstorage
Grinder
Storage silos
Kiln
Preheating
Truck
Train
Boat
Quarry
Additives
Cooler
12
3
4
5
6
7
33Lafarge | Registration Document | 2011

3INFORMATION ON LAFARGE3.4 Our businesses
cement manufacturing fuel consumption,
with almost two-thirds of our cement plants
using some form of fuel waste materials.
The availability of fuel waste materials varies
widely from region to region, and in particular
between developed markets (where they are
more abundant) and emerging markets (where
they are at an early stage of development).
In addition, many of our plants can switch
between several fuels with minimal disruption
to production, allowing us to enjoy the benefit
of lower cost fuels.
MANUFACTURING EXPERTISE
We have developed significant expertise in
cement manufacturing through our experience
of operating numerous cement production
facilities worldwide for over 175 years. This
expertise has been formally documented
and is passed on via our Technical Centers .
We strive to share our collective knowledge
throughout the Group to improve our asset
utilization, lower our production costs, and
increase the product efficiency. Through
this culture of knowledge-sharing, we also
endeavor to disseminate best production
practices and employ benchmarking tools
worldwide to drive superior performance and
unlock continuous operating improvements.
Customers
In each of the major regions in which we
operate, we sell cement to several thousand
customers, primarily concrete producers,
precast concrete product manufacturers,
contractors, builders and masons, as well
as building materials wholesalers. Our
cement is used in three major segments of
the construction industry: residential, non
residential construction and infrastructure
projects.
Cement performance characteristics and
service requirements from our customers
vary widely depending on the projects for
which our cement is used, as well as their
experience and expertise. We strive to meet
our customers’ diverse requests and to deliver
quality, distinctive and targeted solutions
enabling them to create more value in their
businesses.
Our customers generally purchase cement
from us through current orders in quantities
sufficient to meet the needs of their building
or renovation projects.
Markets
CEMENT INDUSTRY
Historically, the global cement industry was
fragmented, with most markets served by a
local producer.
Beginning in Europe in the 1970s, then
continuing in the United States during
the 1980s and later in Asia , the cement
industry underwent significant worldwide
consolidation which opened many markets
to competition and technical progress.
Today, there are many international
cement groups, including Lafarge and its
major worldwide competitors, i.e. Holcim
(Switzerland), Italcementi (Italy), Buzzi
(Italy), Cemex (Mexico), Cimpor, (Portugal),
HeidelbergCement (Germany), Taiheiyo
(Japan), Votorantim (Brazil), and many
medium- size groups.
In the various markets around the world, these
companies compete one against another
and also against strongly established local
producers
It results that the cement industry is highly
competitive in our major markets. Some
countries or regions are more exposed during
certain periods than others due to factors such
as the strength of demand, market access,
and raw material reserves.
Cement production is capital intensive.
Construction of a new dry process cement
line represents more than two years of its full
capacity sales .
CEMENT MARKETS
Emerging markets represent approximately
90% of the worldwide market, with North
America and Western Europe accounting for
most of the remainder. We have substantial
operations in many of these markets, along
with other multinational cement companies
and local cement producers.
A country’s cement demand is generally
driven by the growth in per capita income.
Demographic growth, industrialization and
urbanization progress tend to trigger a rapid
growth in housing and infrastructure needs,
leading to increased cement consumption.
LOCATION OF OUR CEMENT PLANTS AND MARKETS
Cement is a product that is rather costly
to transport over land. Consequently, the
radius within which a typical cement plant
is competitive extends for no more than
300 kilometers for the most common types
of cement. However, cement can be shipped
more economically by sea and inland
waterway over great distances, significantly
extending the competitive radius of cement
plants with access to waterborne shipping
lanes. Thus, the location of a cement plant
and the cement’s transportation cost produced
through our distribution network significantly
affect the plant’s competitiveness .
CEMENT QUALITY AND SERVICES
The reliability of a producer’s deliveries
and the quality of our cement and support
services are also factors influencing a cement
producer’s competitiveness. Accordingly, the
Group strives to deliver consistent cement
quality over time, to maintain a high standard
and quality of support service and to offer
special-purpose cements .
BREAKDOWN BY REGION
We produce and sell cement in the regions
and countries listed in the tables below.
The following presentation shows each region’s
percentage contribution to our 2011 cement
sales in euros, as well as the number of plants
we operate, our cement production capacity,
and approximate market share in each country
over the year ending December 31, 2011.
SALES BY DESTINATION 2011
%
Western Europe
Middle East & Africa
North America
Central & Eastern Europe
15
10
33
11
Latin America
Asia
TOTAL
9
22
100
In the following section, stated production
capacities are reported on the basis of 100%
of operating plants controlled by Lafarge in
the indicated countries, disregarding the
percentage of ownership. V olumes sold
are reported on a stand alone basis before
elimination of intra-group sales.
Our approximate market share has been
calculated per country based on information
contained in the Industrial Building Materials
Sector report published by Jefferies in
February 2012 (the “Jefferies Report”) and
internal estimates.
Comparable information for the year 2010 is
available in the 2010 Registration Document.
Registration Document | 2011 | Lafarge34

INFORMATION ON LAFARGE
3
3.4 Our businesses
WESTERN EUROPE (15% OF THE DIVISION’S 2011 SALES)
COUNTRIES
NUMBER OFCEMENT PRODUCTION
CAPACITYAPPROXIMATE MARKET
SHARECEMENT PLANTS GRINDING PLANTS
(million tonnes) (%)
France 10 4 10.2 34
United Kingdom 5 - 5.1 40
Greece 3 - 9.8 50
Spain 3 2 6.8 10
Germany 3 - 3.4 10
TOTAL WESTERN EUROPE 24 6 35.3
Austria was reclassified to Central and Eastern Europe in 2010 and 2011.
In 2011, France, Germany and United
Kingdom registered volume increases,
Austria remained flat while Greece and Spain
experienced significant declines, reflecting
the macro-economic trends. The region as a
whole consumed close to 155 million tonnes
of cement in 2011, according to the Jefferies
Report. We sold 18.4 million tonnes of cement
in Western Europe in 2011 and 18.8 million
tonnes in 2010.
NORTH AMERICA (11% OF THE DIVISION’S 2011 SALES)
COUNTRIES
NUMBER OFCEMENT PRODUCTION
CAPACITYAPPROXIMATE MARKET
SHARECEMENT PLANTS GRINDING PLANTS
(million tonnes) (%)
United States 10 2 12.8 12
Canada 7 2 6.4 33
TOTAL NORTH AMERICA 17 4 19.2
Our markets remained flat in 2011 reflecting
the uncertain economic environment. Sales
are seasonal in Canada and much of the East
Coast and Mid West of the United States,
because temperatures in the winter fall below
minimum setting temperatures for concrete.
The Jefferies Report estimated that the region
as a whole experienced a flat consumption of
cement (81 million tonnes) in 2011. We sold
13.5 million tonnes of cement in North
America in 2011 and 13.6 million tonnes in
2010.
We finalized in October 2011 the sale of our
United States South East activities to Argos,
which included two cement plants in South
Carolina and in Alabama as well as a grinding
station in Georgia and the related terminals.
CENTRAL AND EASTERN EUROPE (10% OF THE DIVISION’S 2011 SALES)
COUNTRIES
NUMBER OFCEMENT PRODUCTION
CAPACITYAPPROXIMATE MARKET
SHARECEMENT PLANTS GRINDING PLANTS
(million tonnes) (%)
Austria 2 - 2.0 32
Poland 3 - 5.7 20
Romania 2 1 4.9 31
Russia 2 - 4.1 7
Moldova 1 - 1.4 62
Ukraine 1 - 1.3 12
Serbia 1 - 2.0 45
Slovenia 1 - 0.6 38
Hungary 1 - 1.0 8
Czech Republic 1 - 1.2 9
TOTAL CENTRAL AND EASTERN EUROPE 15 1 24.2
Austria was reclassified to Central and Eastern Europe in 2010 and 2011.
After two years of depressed residential
market due to the economic crisis, Central
and Eastern Europe experienced in 2011 a
very positive market trend. Estimates from
the Jefferies Report for the region give a 2011
cement consumption close to 110 million
tonnes. We sold 14.2 million tonnes of cement
in Central and Eastern Europe in 2011 and
12.6 million tonnes in 2010.
35Lafarge | Registration Document | 2011

3INFORMATION ON LAFARGE3.4 Our businesses
MIDDLE EAST AND AFRICA (33% OF THE DIVISION’S 2011 SALES)
COUNTRIES
NUMBER OFCEMENT PRODUCTION
CAPACITYAPPROXIMATE MARKET
SHARECEMENT PLANTS GRINDING PLANTS
(million tonnes) (%)
Morocco 3 1 6.8 43
Nigeria 3 - 5.7 32
Algeria 2 - 8.6 36
Iraq 3 - 5.8 24
Jordan 2 - 4.8 47
Zambia 2 - 1.3 75
Egypt 1 - 10.0 20
United Arab Emirates 1 - 3.0 6
Syria 1 - 2.6 23
South Africa 1 2 3.6 17
Tanzania 1 - 0.3 22
Kenya 1 1 2.0 48
Uganda 1 - 0.8 62
Cameroon 1 1 1.7 92
Benin 1 - 0.7 37
Zimbabwe 1 - 0.5 38
Malawi - 1 0.2 76
TOTAL MIDDLE EAST AND AFRICA 25 6 58.4
In this region with a consumption close
to 316 million tonnes of cement in 2011
(according to the Jefferies Report estimates),
we have sold 44. 0 million tonnes of cement
in 2011, compared to 40.2 million tonnes
of cement in 2010. Sustained demographic
growth and significant needs for housing and
infrastructures support the strong potential of
this region.
In Morocco, the Group develops its cement
business through a joint venture with Société
Nationale d’Investissement.
The Group also operates through a joint
venture in the United Arab Emirates.
In Saudi Arabia, the Group holds a 25% stake
in Al Safwa Cement which operates 2 million
tonnes capacity plant.
LATIN AMERICA (9% OF THE DIVISION’S 2011 SALES)
COUNTRIES
NUMBER OFCEMENT PRODUCTION
CAPACITYAPPROXIMATE MARKET
SHARECEMENT PLANTS GRINDING PLANTS
(million tonnes) (%)
Brazil 5 3 7.1 11-12
Mexico 2 - 0.8 NS
Ecuador 1 - 1.4 20
Honduras 1 1 1.3 55
French West Indies/Guyana - 3 1.0 100
TOTAL LATIN AMERICA 9 7 11.6
Latin America as a whole consumed about 155 million tonnes of cement in 2011 according to the Jefferies Report. W e sold 10.5 million tonnes
of cement in Latin America in 2011, compared to 8.4 million tonnes in 2010.
Registration Document | 2011 | Lafarge36

INFORMATION ON LAFARGE
3
3.4 Our businesses
ASIA (22% OF THE DIVISION’S 2011 SALES)
COUNTRIES
NUMBER OFCEMENT PRODUCTION
CAPACITYAPPROXIMATE MARKET
SHARECEMENT PLANTS GRINDING PLANTS
(million tonnes) (%)
China 20 12 33.6 6–22 (1)
Philippines 5 - 6.0 33
Malaysia 3 1 12.5 37
South Korea 1 2 9.6 13
India 2 2 8.4 20 (2)
Pakistan 1 - 2.1 6
Indonesia 1 - 1.6 4
Bangladesh (3) 1 - 1.6 7
Vietnam - 1 0.5 1
TOTAL ASIA 34 18 75.9
(1) Depending on region where Lafarge is operating.
(2) For the North East region.
(3) See Note 29 (Legal and arbitration proceedings) to the Consolidated Financial Statements for more information on Lafarge Surma Cement.
We believe that the long-term growth prospects
for Asia are very promising. According to
the Jefferies Report, the region as a whole
consumed about 2,560 million tonnes of
cement in 2011. We sold 44.7 million tonnes
of cement in the region in 2011 and 42.1
million tonnes in 2010.
In China, the Group operates through a joint
venture with Hong Kong based company
Shui On. This joint venture is currently the
market leader in Southwest China (Sichuan,
Chongqinq, Guizhou, and Yunnan).
Our cement business in Bangladesh is held
through a joint venture with Cementos Molins
(Spain).
CEMENT TRADING ACTIVITIES
The Group also manages worldwide cement
trading activities, which help us to meet
fluctuations in demand in certain countries,
without building plants that may result in
excess capacity. We conduct these activities
primarily through our Cementia Trading
subsidiary. In addition, our Marine Cement
subsidiary acts mainly as an importer and
distributor of cement in the Indian Ocean and
the Red Sea countries.
3.4.2 Aggregates & Concrete
Aggregates and concrete, like cement, are
key components of the building industry.
Based on internal and external analysis, in
2011 Lafarge was the world’s second largest
producer of aggregates and the world’s fourth
largest producer of ready-mix concrete. On
December 31, 2011, we had production
facilities and sales offices in 35 countries.
In the year ending December 31, 2011,
our consolidated businesses operated
392 aggregates industrial sites, which
sold approximately 193 million tonnes of
aggregates, and 1,046 concrete plants, which
sold approximately 34 million cubic meters of
concrete. We also produce pre-cast concrete
products and asphalt .
We are vertically integrated to varying
degrees with our Cement Division which
supplies substantial volumes to our concrete
operations in several markets. Also within
our Aggregates & Concrete Division, our
aggregates operations supply a substantial
volume of aggregates required for our concrete
and asphalt operations.
Products
AGGREGATES
Aggregates are used as raw materials for
concrete, masonry, asphalt, and other
industrial processes, and as base materials
for roads, landfills, and buildings. The primary
aggregates we produce and sell are hard rock
(usually limestone and granite), but we also
produce natural sand and gravel. Additionally,
depending on the market, we process and sell
recycled asphalt and concrete. Aggregates
differ in their physical and chemical properties,
granularity and hardness. Local geology
determines the type of aggregates available in
a given market, and not all types of aggregates
are available in every market. Through our
Research & Development (Lafarge Research
Center, LCR) we have greatly increased our
understanding of the impact that the various
properties of aggregates have in their final
applications. Consequently, we have been
able to refine our product offerings and step
up innovation in our downstream products.
See Section 3.3 (Innovation ) for more
information on the R&D in the Group.
READY- MIX CONCRETE
Concrete is a mix of aggregates, cement,
admixtures, and water that hardens to form the
world’s most used building material. Tensile
strength, resistance to pressure, durability, set
times, ease of placing, aesthetics, workability
under various weather and construction
conditions as well as environmental impact are
the main characteristics that our customers
consider when buying concrete. From the very
basic to the cutting edge, we produce and sell
a wide range of concrete and masonry mixes
to meet our customers’ diverse needs.
Through our internal Research center we
have introduced innovative products such
as: Agilia® which offers superior coverage and
filling abilities and self-levelling capability, with
enhanced durability and aspect; Extensia®,
flooring concrete which significantly reduces
saw joints; Chronolia® whose drying speed
allows to remove formworks four hours
after placing. In addition, we continue to
successfully develop in all our markets our
Artevia® range of decorative concretes.
37Lafarge | Registration Document | 2011

3INFORMATION ON LAFARGE3.4 Our businesses
Demand for new products and for a broader
range of products is accelerating due to
sustainability initiatives and new customer
needs. In association with a leading partner,
Bouygues Construction, we launched in
2009 a new generation of concrete to
boost buildings’ energy performance: the
Thermedia® range. In 2011, the Group has
introduced Hydromedia™, a new generation
pervious concrete, the result of 2 years’
research in collaboration with university
laboratories, civil engineering companies and
project owners. This fast-draining concrete
pavement solution limits the urban impact on
the natural water cycle and reduces the risk
of flooding. We believe our strong Research &
Development program gives us a distinct
advantage over our competitors.
See Section 3.3 (Innovation) for more
information on the R&D in the Group.
ASPHALT
In North America and the United Kingdom,
we produce asphalt which we sell either as
a stand-alone product, or in conjunction
with contracted paving. Asphalt consists of
90-95% dried aggregates mixed with 5-10%
heated liquid bitumen, a by-product of oil
refining that acts as a binder.
In Asphalt, we are using our internal Research
center to develop new products, such as
the Durapave® with enhanced appearance,
placing and energy efficiency properties.
Demand for new products and for a broader
range of products is accelerating due to
environmental initiatives and new customer
needs.
Production and Facilities Information
AGGREGATES
Aggregates production involves primarily
blasting hard rock from quarries and then
crushing and screening it to various sizes
to meet our customer’s needs. Aggregates
production also involves the extraction of
sand and gravel from both land and marine
locations, which generally requires less
crushing but still needs screening to different
sizes. The production of aggregates involves
intensive use of heavy equipment and regular
use of loaders, haul trucks, crushers and other
equipment at our quarries. After mineral
extraction, we restore our sites to a high
standard so that they may be used for other
purposes: agricultural, commercial or natural.
In a world of growing environmental
pressures, where it is increasingly difficult to
obtain extraction permits, and where mineral
resources are becoming more scarce, mineral
reserve management is a key to success in
the aggregate business. Consequently, we
emphasize mineral and land management
in our activity. Across our existing markets,
we regularly search for new material reserves
to replace depleting deposits well in advance
of their exhaustion, and we work to obtain
necessary government permits allowing the
extraction of our raw materials.
We seek to position new reserves as close to
our markets as possible.
See Section 3.4.4 (Mineral reserves and
quarries) for more information.
READY-MIX CONCRETE
Ready-mix concrete is produced by mixing
aggregates, cement, chemical admixtures
and water in varying proportions at concrete
production plants and placing the resulting
mixture in concrete trucks where it is usually
mixed further and delivered to our customers.
We obtain most of our concrete raw materials
(e.g. cement and aggregates) from internal
sources. Concrete is produced with equipment
that mixes raw materials in desired ratios,
checks the quality of the product obtained,
and places the mixture into concrete trucks.
Concrete plants can be either fixed permanent
sites or portable facilities, which may be
located at our customers’ construction sites.
Many concrete mixes are designed to achieve
various performance characteristics desired
by our customers. Cement and aggregate
chemistries may be varied, chemical
admixtures may be added (such as retarding
or accelerating agents) and other cementitious
materials (such as fly ash or slag) may be
substituted for portions of cement to adjust the
concrete performance characteristics desired
by the customer. Consequently, significant
technical expertise and quality control are
required to address the many construction
issues our customers face, such as concrete
setting time, pumpability, placeability,
weather conditions, shrinkage and structural
strength. Through our extensive Research &
Development activities, we focus on supplying
concrete that meets these various needs.
Because of concrete’s limited setting time,
logistics is key to ensure timely delivery of our
product.
Raw material prices account for approximately
70% of the cost to supply concrete and may
vary considerably across the many markets in
which we operate. Given the significantly high
percentage of raw materials costs, we strive to
adjust concrete mix designs to optimize our
raw material usage. Delivery represents the
second largest cost component, accounting
for approximately 20% of the costs to supply
concrete.
PRE-CAST CONCRETE PIPES, WALL PANELS AND OTHER PRODUCTS
These products are manufactured by pouring
the proper type of concrete into molds and
compacting the concrete through pressure
or vibration, or a combination of both. In
order to limit the transport costs ,the pre-cast
plants are usually located close to aggregates
resources which are themselves close to
principal markets.
ASPHALT
As described above, asphalt is produced by
blending aggregates with liquid bitumen at
asphalt production plants. We obtain much
of the aggregates needed to produce asphalt
from internal sources and purchase the
bitumen from third party suppliers. Bitumen
is a by-product of petroleum refining, the
price of which is tied to oil prices. Asphalt
is produced at low capital-intensive plants
consisting of raw material storage facilities and
equipment for combining raw materials in the
proper proportions at a high temperature. Our
asphalt plants range in output from 5,000 to
500,000 tonnes per year and are located in
North America and the United Kingdom.
Customers
We sell our aggregates, concrete and asphalt
to thousands of unaffiliated customers in local
markets throughout the world.
Registration Document | 2011 | Lafarge38

INFORMATION ON LAFARGE
3
3.4 Our businesses
We sell aggregates primarily to concrete
producers, manufacturers of pre-cast
concrete products, asphalt producers, road
contractors, and construction companies of
all sizes. In some markets, we sell aggregates
for use in various industrial processes, such
as steel manufacturing. We sell concrete
primarily to construction and road contractors
ranging from major international construction
companies to small residential builders,
farmers, and do-it-yourself individuals. We
sell asphalt primarily to road contractors for
the construction of roads, driveways, and
parking lots, as well as directly to state and
local authorities.
Our customers generally purchase aggregates,
concrete, and asphalt in quantities sufficient
to meet their immediate requirements.
Occasionally, we enter into agreements to
supply aggregates to certain plants which
produce concrete, asphalt, or pre-cast
concrete products. These contracts tend to
be renegotiated annually. Backlog orders for
our aggregates, concrete, and asphalt are
normally not significant.
Markets
DESCRIPTION OF MARKETS AND OF OUR POSITION IN THESE MARKETS
Most local aggregates, concrete, and asphalt
markets are highly fragmented and are served
by a number of multinational, regional, and
local producers.
Globally, the aggregates industry is in the early
stages of consolidation, mainly in developed
markets. We face competition in our local
markets from independent operators, regional
producers (such as Martin Marietta Materials
and Vulcan Materials in the United States)
and international players (Cemex, CRH,
HeidelbergCement and Holcim).
Environmental and planning laws in many
countries restrict new quarry development.
In addition, excluding the cost of land and
mineral rights, the plant and equipment
costs for a new quarry range from around 2
to 4 million euros for a small quarry to several
tens of million euros for a very large quarry. We
have implemented standards for the design
and construction of our plants.
We believe we have a strong competitive
position in aggregates through our well
located reserves in key markets and our
logistic networks. Our worldwide experience
allows us to develop, employ, and refine
business models through which we share and
implement best practices relating to strategy,
sales and marketing, manufacturing and land
management; this gives us a superior quality
product to offer the market. In addition, we
have a strong understanding of the needs of
most of our aggregates customers since we are
vertically integrated in their predominant lines
of business. Finally, we believe that we have
a reputation for responsible environmental
stewardship and land restoration, which
assists us in obtaining new permits more easily
and encourages landowners to deal with us as
the operator of choice.
Consolidation in the global concrete industry is
less pronounced and, as with aggregates, we
face competition from numerous independent
operators throughout our markets. However,
we often compete with multinational groups
such as Cemex, CRH, HeidelbergCement,
Holcim and Italcementi depending on their
geographical portfolio.
An essential element of our strategy is
innovation. We have developed substantial
technical expertise relating to concrete.
Consequently, we can provide significant
technical support and services to our
customers to differentiate us from competitors.
Furthermore, as a consequence of this
technical expertise, we recently developed
several new products, such as Agilia®,
Artevia®, Chronolia®, Extensia®, Thermedia®
and the new Hydromedia® lines. Again, our
worldwide experience permits us to further
differentiate ourselves based on product
quality and capability.
To improve our competitive position in local
concrete markets, we situate our plants to
optimize our delivery flexibility, production
capacity and backup capability. We evaluate
each local market periodically and may realign
our plant positioning to maximize profitability
when market demand declines or capacity
rises too high. We developed our use of mobile
plants in a number of markets to improve our
flexibility in redeploying plants in response
to market changes and to meet customers’
needs.
Like concrete, asphalt must be delivered
quickly after it is produced. Thus, asphalt
markets tend to be very local. Generally
speaking, asphalt is sold directly by the
asphalt producer to the customer, with only
very limited use of intermediate distributors
or agents since prompt and reliable delivery
in insulated vehicles is essential.
LOCATION OF OUR MARKETS
Shipping aggregates over long distances is
costly, and concrete and asphalt cannot be
transported over distances that involve more
than about one hour of transportation time.
Consequently, markets for these products
tend to be local in nature. However, where
our quarries have access to shipping lanes
or railroads, we may ship aggregates over
significant distances. W hile brand recognition
and loyalty play a role in sales of these products,
local customers tend to choose producers
based on location, quality of product, reliability
of service, and price. Furthermore, demand
for aggregates, concrete, and asphalt depends
mostly on local market conditions, which can
vary dramatically within and across a broader
regional or national market.
The majority of our aggregates, concrete,
and asphalt operations are located in
Western Europe and North America, where
national demand generally moves in line
with the country’s level of infrastructure and
construction spending. In these countries
the nature and enforcement of applicable
regulations provide a balanced playing field.
However, during the recent years, we have
more actively searched opportunities to
penetrate fast growing markets in emerging
countries, to the extent that rules of the game
allowing us to operate soundly are established.
PORTFOLIO MANAGEMENT
In line with the Group’s strategy, we continued
this year our selective divestment policy with
the sale of the Aggregates & Concrete activity
in Portugal as well as our Concrete assets the
39Lafarge | Registration Document | 2011

3INFORMATION ON LAFARGE3.4 Our businesses
South East United States. We also started to
operate in a few countries that we believe
are offering growing opportunities: Iraq and
Ku wa it for Concrete and for Aggregates
Russia in partnership with the EBRD. We also
announced in February 2011, the formation of
a 50/50 joint venture with Anglo American plc
which will combine our Cement, Aggregates,
Ready-mix Concrete, Asphalt and Paving
businesses in the United Kingdom. The latter
still requires regulatory approval.
BREAKDOWN BY REGION
We produce and sell aggregates and concrete
in the regions and countries of the world
listed in the table below. The table shows
the number of industrial sites we operated
on December 31, 2011 and the volume
of aggregates and concrete sold by our
consolidated operations in 2011.
Volumes sold take into account 100% of
volumes from fully consolidated subsidiaries
and the consolidated percentage of volumes
for proportionately consolidated subsidiaries.
REGION/COUNTRY
NUMBER OF INDUSTRIAL SITES VOLUMES SOLD
AGGREGATES* CONCRETE AGGREGATES CONCRETE
(million tonnes) (million cubic meters)
WESTERN EUROPE
France 114 260 37.4 7.2
United Kingdom 35 96 14.2 1.8
Spain 12 77 4.2 1.5
Greece 9 24 1.9 0.7
Portugal - - 0.7 0.4
Others - 2 - 0.2
NORTH AMERICA
Canada 97 132 51.8 4.1
United States 52 52 45.6 2.9
CENTRAL & EASTERN EUROPE
Poland 14 33 13.2 1.0
Romania 13 15 2.6 0.4
Russia 4 1 1.5 -
Ukraine 3 - 3.8 -
Hungary 1 - 0.6 -
MIDDLE EAST & AFRICA
South Africa 20 54 4.4 1.2
Reunion/Mauritius 3 10 1.0 0.4
Egypt 4 18 2.3 1.2
Algeria - 18 - 0.5
Morocco 1 24 0.4 0.4
Qatar 1 14 0.8 0.6
Iraq - 16 - 0.5
Oman - 10 - 0.2
Jordan - 8 - 0.7
Saudi Arabia - 3 - 0.2
United Arab Emirates - 3 - 0.2
Kuwait - 3 - 0.1
OTHER
Malaysia/Singapore 4 33 2.8 1.7
Brazil 3 41 2.2 0.9
India - 84 0.4 3.6
Others 2 15 0.9 1.2
TOTAL 392 1,046 192.7 33.8
* Industrial sites for the production of aggregates from one or more quarries.
In 2011, our asphalt operations produced and sold a total of 5.1 million tonnes in the United States, Canada and the United Kingdom.
Registration Document | 2011 | Lafarge40

INFORMATION ON LAFARGE
3
3.4 Our businesses
3.4.3 Gypsum
During 2011, most of the Group gypsum
activities were disposed of (Asia, Europe and
South America, Australia).
See Section 3.2.2 (Recent acquisitions,
partnerships and divestitures) and Note
3 (Significant events) to our consolidated
financial statements for more information on
these disposals.
Gypsum wallboard (also known as
“plasterboard”) and other gypsum-based
products (e.g. plaster, joint compounds, plaster
blocks) and related products (such as metal
studs and accessories) are used primarily
to offer gypsum-based building solutions
for constructing, finishing, or decorating
interior walls and ceilings in residential,
commercial and institutional construction
projects throughout the world, as well as for
sound and thermal insulating partitions. Other
gypsum-based products include industrial
plaster (used for special applications such as
mouldings or sculptures), medical plasters,
and self-levelling floor-screeds.
We believe that, before the disposal of
these activities, we were among the three
largest manufacturers of gypsum wallboard
worldwide. At the end of 2010, we had
production facilities in 30 countries. Our
consolidated businesses operated 41
wallboard plants (with an annual production
capacity of over 1 billion square meters) and
36 other plants which produced primarily
plaster, plaster blocks, joint compounds, or
metal studs as well as paper (2 wallboard
paper plants).
Products
WALLBOARD
The principal gypsum product is wallboard.
Wallboard is produced in a number of
standard lengths, widths and thicknesses and
with a variety of characteristics depending on
the intended use of the board. We offered a
full line of wallboard and finishing products:
“standard” wallboard; and technical
wallboards – e.g. fire retardant, water-resistant,
sag-resistant, resistant to mold, high humidity,
“design and decoration” and very high traffic
areas. Some of these wallboards combine two
or more of these properties.
OTHER PRODUCTS
Production also includes gypsum plaster,
plaster blocks, joint compounds, metal
studs, anhydrite binders for self-levelling floor-
screeds and industrial plasters, which are also
intended for the construction and decorating
industries. Sales of such products accounted
for approximately one third of our Gypsum
sales in 2011.
Production and facilities information
Gypsum manufacturing uses the crystalline
structure of gypsum (calcium sulfate dihydrate
– a naturally occurring mineral common in
sedimentary environments), within which
water molecules are physically retained. Plaster
is made by grinding and heating gypsum
to release the trapped water molecules,
wallboard is made by mixing the plaster with
water to form a slurry, extruding the slurry
between two continuous sheets of paper, and
then drying and cutting the resulting board
into proper sizes. When recombining with
water, the slurry is transformed into gypsum
crystals which interlock with each other and
“grow” into the liner paper, giving the board
its strength. Both naturally occurring gypsum
and synthetic gypsum are used to produce
wallboard. Synthetic gypsum is a by-product
of certain chemical manufacturing and fossil
fuels power production operations.
At the end of 2010, our businesses operated
and owned 21 gypsum quarries worldwide,
including 16 in Europe. Some of our plants
have entered into long-term supply contracts
with third parties to supply natural gypsum.
The plants using synthetic gypsum are
supplied through long-term contracts, most
of which contain one or more options to renew.
We believe our current supply of gypsum, both
natural and synthetic, is adequate for current
and foreseeable operating levels.
Paper and gypsum account for approximately
25% and 15% of wallboard production costs,
respectively. Before the sales, we produced
approximately half of our wallboard paper
requirements at our own mills in France and
at a joint venture the United States. All of our
paper production is based on recycled waste
paper fibers.
Customers
Gypsum wallboard products are mostly sold
to general building materials distributors,
plasterboard installers, wallboard specialty
dealers, do-it-yourself home centers and
transforming industries. In some markets,
prescribers (such as architects) may influence
which products are to be used to construct
given projects.
Markets
DESCRIPTION OF MAIN MARKETS AND
POSITION IN THESE MARKETS
We believe that at the end of 2010, before the
sales, we shared approximately 75% of today’s
worldwide wallboard market with six other
producers in a sector which is increasingly
concentrated (Saint-Gobain, Knauf, US
Gypsum, Yoshino, National Gypsum, BNBM).
These companies operate gypsum wallboard
plants and usually own the gypsum reserves
they use to produce their wallboard.
In the gypsum wallboard market, companies
compete, on a regional basis, on price,
product quality, product range, solution
design, efficiency, flexibility, and customer
service. Our largest competitors in Western
Europe are Knauf and Saint-Gobain, and in
the United States National Gypsum, Saint-
Gobain, and US Gypsum.
This sector is highly competitive in Western
Europe and North America with production
mostly concentrated among several national
and international players.
Western Europe
Western Europe is the world’s third largest
regional wallboard market. The technical
performance of products and systems plays
a critical role in this market. The region as a
whole consumed close to one billion square
meters of wallboard in 2010, based on our
estimates. We sold over 250 million square
meters of wallboard in Western Europe in
2010. Additionally, we had a minority interest
in Yesos Ibericos (Grupo Uralita) in Spain.
North America
North America is the world’s largest regional
wallboard market. The region as a whole
consumed close to 2 billion square meters of
wallboard in 2009, based on our estimates.
We sold over 150 million square meters of
wallboard in North America in 2010.
41Lafarge | Registration Document | 2011

3INFORMATION ON LAFARGE3.4 Our businesses
Asia
In Asia, the world’s second largest regional
wallboard market, we conducted gypsum
wallboard and related operations through
a 50/50 joint venture managed jointly with
the Australian company Boral Limited.
The joint venture operates three wallboard
plants in South Korea, four in China, one in
Malaysia, two in Thailand, two in Indonesia,
one in Vietnam, and one in India. It also has
several plaster and metal stud plants in these
countries.
At December 31, 2011, Lafarge was present in
Gypsum actitvies in Algeria, Canada, Mexico,
Morocco, South Africa, Turkey and USA.
See Note 3 (Significant events) to our
consolidated financial statements for more
information.
3.4.4 Mineral reserves and quarries
Willing to secure the availability of raw
materials necessary to produce our products,
we are implementing internal procedures for
the management of land control and permits
and the follow-up and control of the reserves
of our quarries.
Objectives
Our businesses belong to heavy industry, and
as such, are built to last. Therefore, they must
own or have control over substantial reserves
of raw materials which represent a major
competitive asset in terms of their location,
quantity and quality.
All business units must follow the Group policy
concerning the acquisition and preservation of
its reserves (limestone, marl, clay, sand, etc. ),
within the constraints of local regulation.
In particular they must ensure to have
adequate reserves for:
• plants currently in operation;
• plants projected for the relatively near
future;
• long-term projects to assure growth,
restructuring or strategic positioning.
The exploration for deposits must be based on
rigorous geological investigations.
Requirements
• Each business unit has to define its
“proven”, “probable” and “potential”
reserves in terms of years of production
of aggregates or clinker (for cement)
production as compared to the production
of previous years. The target is to maintain
fifty years of proven and probable reserves
except justifiable cases such as constraints
due to local regulations.
• For each deposit, business units must
establish a long term plan for obtaining or
extending mining rights, land control and
administrative permits. This plan must
contain the following information for all
areas impacted by the long term mining
plan including buffer zones:
– property limits;
– expiry dates of mining permits;
– tonnage and chemistry of reserves;
– characteristics of the deposits and their
environmental constraints;
– action plans and necessary budget.
Definitions
The raw material deposits are considered as
reserves when the technical and economical
operability is confirmed. Reserves of raw
materials are certified by the technical centres
and classified as follows:
1) PROVEN AND PROBABLE RESERVES
The reserves are defined as proven when we
have the full control over them through the
following parameters:
• the mining rights and necessary
administrative permits for mining operations
are obtained;
• the full control of the land (surface rights)
for which we have the mining rights is
achieved;
• the reserve evaluation is validated based
on representative core drilling or equivalent
and reliable geochemical analyses.
Reserves are defined as probable if one of
the above parameter is not fully achieved,
such as:
• the mining rights could be limited in
duration or some necessary administrative
permits for mining operations could be
incomplete;
• the control of the land for which we have the
mining rights could be incomplete;
• the geology is not defined well enough.
2) POTENTIAL RESERVES
The reserves are considered as potential if
they are in a land which is not fully controlled,
but recognized as potentially mine-able
after obtaining the necessary permits. The
necessary geological investigations are not
fully carried out.
Remarks on the impact of local regulations for permitting
• In some countries, permits are given for
a limited period of time. Reserves are
therefore proven for the duration of the
permits and probable for the remaining
time. Local regulations may therefore
impact proven reserves. In France for
example, the mining right duration is not
more than 30 years; in the most favorable
case, the reserves can only be proven for 30
years. In other countries the mining rights
could be obtained for a very long period of
time but the surface rights are limited to
5 years. In this case, reserves are proven
for 5 years and probable for the remaining
duration of the mining rights. For this
reason, proven and probable reserves are
reported together.
• The mining rights procedures in each
country may also influence the land control
strategy that is implemented locally. For
example, a limited duration of mining
rights provides less visibility on the future.
Surface rights will be granted until expiry of
this period but not necessarily beyond. As
a consequence, the surface rights control
actions may be staged over time. In that
hypothesis, the corresponding reserves
are only potential. Land management is
therefore specific to each situation.
Internal yearly reporting
A senior geologist in the technical centre must
approve the report for all the reserves for
cement production in his area. For aggregates,
the calculation of reserves is approved by the
real property director of each business unit.
Ownership titles, mining permits and others
legal issues (environment, parks, historical,
etc.) must be clear and validated namely by
a Lafarge legal manager.
The reserves are expressed in years of
production (of clinker for cement, or of
aggregates) as compared to the average
production of the previous year (for
aggregates) or of the three previous years (for
cement).
Registration Document | 2011 | Lafarge42

INFORMATION ON LAFARGE
3
3.4 Our businesses
Every year the reserves table is updated in
the yearly internal reporting. The numbers
are worked out between the geologists and
the quarry managers according to the latest
quarry model including reserves estimation
and plant raw materials consumption.
1. The technical centre raw material expert
obtains the tonnage mined during the
previous year from the quarry manager.
2. The reserve calculation is done by the
technical centre raw material expert for
cement and by the business unit geologist
for aggregates:
– simple yearly calculation by subtracting
quarry production from the last reserve
estimation;
– full reserves reconciliation using accurate
topographic survey, deposit block model
and production fi gures (each 3-5 years).
3. For cement the result is validated through
an exchange between the plant quarry
manager, the country raw material manager
and the technical centre raw material expert.
For aggregates, the calculation is validated
by the quarry manager, the business unit
raw material manager and the real property
manager of the business unit.
Even if a rigorous process is in place internally
in order to assess the reserves, the results are
subject to small variations resulting from minor
inaccuracies of the block model, which can
affect the global consolidation.
For the purposes of the tables below, the
reserves are consolidated region by region
with the total tonnage of raw material reserves
available divided by the total production of the
plants in each region. As explained above,
the production taken as a reference is the
production of the previous year for aggregates
and the average of the production of the past
3 years for cement. Mothballed plants are
included in this computation. All the plants
technically managed by Lafarge at the end of
December 2011 are fully taken into account,
even if Lafarge is not the majority shareholder.
In very few particular cases, the plants
don’t control their raw-materials but have
to purchase them. Those plants are not
included into the following table considering
the reserve duration. Three Lafarge plants
have to purchase their main raw-materials
for a volume representing less than 1% of the
limestone used in cement.
CEMENT
AVERAGE PRODUCTION 2009-2011 (MT CLINKER)
PROVEN + PROBABLE RESERVES (YEARS)
POTENTIAL RESERVES (YEARS)
NUMBER OF CLINKER PRODUCTION SITES
Western Europe 13.6 43 60 24
North America 10.7 125 85 17
Central and Eastern Europe 11.2 146 25 15
Middle East & Africa 34.3 62 31 25
Latin America 5.3 116 170 9
Asia 39.0 58 32 34
TOTAL 114.1 76 46 124
AGGREGATES
AVERAGE PRODUCTION 2009-2011 (MT)
PROVEN + PROBABLE RESERVES (YEARS)
POTENTIAL RESERVES (YEARS) NUMBER OF QUARRIES
Western Europe 58.1 33 8 170
North America 89.3 117 3 149
Central and Eastern Europe 15.9 34 92 35
Middle East & Africa 13.2 32 8 29
Latin America 2.4 93 56 4
Asia 4.2 36 0 5
TOTAL 183.2 75 13 392
43Lafarge | Registration Document | 2011

3INFORMATION ON LAFARGE3.5 Intra-Group Relationships
3.4.5 Summary of our capital expenditures in 2011 and 2010
The following table presents the Group’s
capital expenditures for each of the two
years ending December 31, 2011 and
2010. Sustaining expenditures serve to
maintain or replace equipment, while internal
development expenditures are intended to
enhance productivity, increase capacity,
or build new production lines. External
development expenditures are devoted to the
acquisition of production assets and equity
interests in companies. Amounts presented
below are net of cash and cash equivalents
of companies acquired.
(million euros)
SUSTAINING AND INTERNAL DEVELOPMENT EXPENDITURES EXTERNAL DEVELOPMENT EXPENDITURES
2011 2010 * 2011 2010 *
Western Europe 208 193 6 23
North America 92 154 7 5
Central & Eastern Europe 159 158 40 33
Middle East & Africa 305 431 11 24
Latin America 54 37 2 (26)
Asia 236 279 5 10
TOTAL 1,054 1,252 71 69
* 2010 figures have been restated as mentioned in Note 3 (Significant events) to the Consolidated Financial Statements following the disposal of the Gypsum Division.
See Section 4.4 (Liquidity and Capital
Resources) for more information on 2011
investments.
The Group generally owns its plants and
equipment. The legal status of the quarries
and lands depends on the activity of the
Division:
• in the Cement Division, we own our quarries
or hold long-term operating rights;
• in the Aggregates Division, we favor mineral
lease contracts in order to minimize the
capital employed.
See Section 3.4.4 (Mineral reserves and
quarries) for more information.
3.4.6 Capital expenditures planned for 2012
Capital expenditures for 2012 are expected to
be approximately:
• 0.4 billion euros for sustaining capital
expenditure;
• 0.4 billion euros for development capital
expenditure, mainly related to the building
of new capacities for the Cement Division
in emerging markets.
These capital expenditures will be financed
notably by the cash provided by operating
activities, the cash provided by the issuance of
debt, and establishment of short and medium
term credit lines.
3.5 Intra-Group Relationships
See Note 35 to our consolidated financial
statements for more information on our
significant subsidiaries.
Lafarge S.A. is a holding company. We
conduct our operations through nearly
1,000 subsidiaries, out of which 75% are
consolidated. We have a large number of
operating companies because we conduct
our operations through several Divisions, our
businesses are local in nature, and we have
facilities in 64 countries.
Lafarge S.A.’s relationship with its subsidiaries
Lafarge S.A.’s relationship with its subsidiaries
is that of an industrial holding and includes
a financial component and an assistance
component.
The financial component covers the financing
by Lafarge S.A. of most subsidiaries’
operations and the transfer of dividends from
subsidiaries.
On December 31, 2011, Lafarge S.A.
held approximately 82% of the Group’s
debt excluding put options on shares of
subsidiaries. Lafarge S.A. is subject to a
quotation by Standard & Poor’s and by
Moody’s. The Company has access to
short-term and long-term financial markets
and large banking networks, and provides
financing to its subsidiaries through inter-
company loans. To fund such loans, we draw
primarily on our Euro Medium Term Note
program for medium to long-term financing
and the related Commercial Paper program
for short-term financing.
Nevertheless, this general financing rule
has some exceptions. As an example, if
we cannot obtain financing through these
programs in a subsidiary’s local currency, we
secure local funding to ensure the subsidiary’s
operations are financed in the relevant
local currency. Furthermore, certain of our
consolidated subsidiaries, which have minority
shareholders, can access the financial
Registration Document | 2011 | Lafarge44

INFORMATION ON LAFARGE
3
3.5 Intra-Group Relationships
markets on their own and, thus, obtain and
carry their own financing.
For those subsidiaries for which it is possible
(most subsidiaries located in the euro-zone,
Hungary, Poland, Romania, Switzerland and
the United Kingdom), Lafarge S.A. uses a
cash pooling program, through which cash
generated by such subsidiaries is consolidated
and managed by Lafarge S.A. in connection
with the financing of the subsidiaries’
operations.
See Section 4.4 for more information on
Liquidity and c apital resources.
The assistance component relates to the
supply by Lafarge S.A. of administrative and
technical support to the subsidiaries of the
Group. Lafarge S.A. also grants rights to use
its brands, patents, and industrial know-how
to its various subsidiaries. The Research &
Development activities are managed by the
Lafarge Research Center located in Lyon
(L’Isle-d’Abeau), France. In the Cement
Division, technical support services are
provided by our various Technical Centers
located in Lyon, Vienna, Montreal, Atlanta,
Beijing, Kuala Lumpur and Cairo.
Subsidiaries are charged for these various
services and licenses under patent license,
support, or brand licensing contracts.
See Section 3.3 (Innovation) for more
information.
Group relationship with minority shareholders of its subsidiaries
In addition to our listed subsidiaries that
have a broad base of minority shareholders,
certain other controlled subsidiaries may have
industrial or financial partners, government
entities, prior employees or prior owners as
minority shareholders. In some cases, such
minority shareholdings are required by local
law or regulations (e.g. in the case of a partial
privatization, mergers, local regulations, listing
on capital markets). In other instances, we
have partnered with them to share our
business risk. In many cases, we have
entered into shareholder agreements with
such minority shareholders providing for
Board membership or other similar provisions,
shareholders’ information rights and control
provisions. We have not recently experienced
any difficulties in managing these subsidiaries
with our partners, which could present a risk
to our financial structure.
A limited number of these shareholder
agreements contain exit provisions for our
minority shareholders that may be exercised
at any time, at certain fixed times, or under
specific circumstances, such as a continuing
disagreement between Lafarge S.A. and
the shareholder or a change in control of
the relevant subsidiary or Lafarge S.A. In
particular, our shareholder agreement relating
to our Cement operations in Morocco contains
provisions that enable our partners to buy
back our shareholding in this business in the
event of a change in control of Lafarge S.A.
Similarly, the shareholder agreement with
Strabag in the Cement activities in Eastern
Europe (Austria, Hungary, Czech Republic,
Slovenia and Slovakia) allows our partner to
acquire our stake should we lose the control
of our subsidiary carrying the Group’s interest
in this joint venture.
See Note 25 (f) (Debt) to our consolidated
financial statements for more information on
put options on shares of subsidiaries.
45Lafarge | Registration Document | 2011

3INFORMATION ON LAFARGE
Registration Document | 2011 | Lafarge46

OPERATING AND FINANCIAL REVIEW AND PROSPECTS
4.1 OVERVIEW 484.1.1 Summary of our 2011 results 48
4.1.2 Trend information and 2012 perspectives 48
4.1.3 Recent events 48
4.2 ACCOUNTING POLICIES AND DEFINITIONS 494.2.1 Critical accounting policies 49
4.2.2 Effects on reported results of changes in the scope
of operations and currency fl uctuations 50
4.2.3 Defi nition 50
4.2.4 Reconciliation of our non-GAAP fi nancial measures 51
4.3 RESULTS OF OPERATIONS FOR THE FISCAL YEARS ENDED DECEMBER 31, 2011 AND 2010 524.3.1 Consolidated sales and current operating income 52
4.3.2 Cement 55
4.3.3 Aggregates & Concrete 59
4.3.4 Other (including holdings) 61
4.3.5 Consolidated operating income and consolidated
net income 61
4.4 LIQUIDITY AND CAPITAL RESOURCES 634.4.1 Group funding policies 63
4.4.2 Cash fl ows 63
4.4.3 Level of debt and fi nancial ratios 65
4.4.4 Rating 65
4
47Lafarge | Registration Document | 2011

4OPERATING AND FINANCIAL REVIEW AND PROSPECTS4.1 Overview
48
4.1 Overview
4.1.1 Summary of our 2011 results
The results of 2011 show as follows:
• Current operating income grew in the
fourth quarter from higher sales volumes,
higher pricing, and cost cutting measures.
For the year, 9% reduction of current
operating income; higher cost inflation and
the negative impact of foreign exchange
lowered overall results.
• The Group successfully achieved its 2
billion euros net debt reduction target and
strengthened its liquidity situation, which
was already solid. Net non recurring gains
from discontinued operations of 466 million
euros mainly result from the strategic
divestment of Gypsum assets.
• Cost savings accelerated at the end of
2011, with 100 million euros delivered in
the fourth quarter achieving 250 million
euros for the full year, well above the 200
million euros target.
• Net earnings were impacted by a non-cash
goodwill impairment losses of 285 million
euros, mainly in Greece.
4.1.2 Trend information and 2012 perspectives
Further to the divestment of a majority of the
gypsum assets and the fundamental changes
to the management structure, the Group
has fully refocused on its core businesses
of cement, aggregates and concrete. This
strategic shift will accelerate growth and
innovation.
Overall the Group sees cement demand
moving higher and estimates market growth
of between 1 to 4 percent in 2012 versus
2011. Emerging markets are the main driver
of demand growth and Lafarge benefits from
its well balanced geographic spread of high
quality assets. We expect higher average
pricing for the year and that cost inflation will
increase at a lower rate than in 2011.
Additional debt reduction is targeted in 2012
as the Group maximizes its operational cash
flows.
The Group will drive its 500 million euros
cost reduction program, of which at least
400 million euros of savings will be delivered
in 2012, and will implement price actions as a
response to cost inflation. We will also further
reduce capital expenditures to 800 million
euros, and execute strategic divestments for
more than 1 billion euros.
The above trends and targets do not constitute
forecasts. They are by nature subject to the
risks and uncertainties (see section 2 (Risk
factors)). These statements do not reflect
future performance of the Company and
the Group, which may materially differ. The
Company does not undertake to provide
updates of theses statements.
4.1.3 Recent events
See Section 3.2.2 (Recent acquisitions,
partnerships and divestitures) for more
information.
Registration Document | 2011 | Lafarge48

OPERATING AND FINANCIAL REVIEW AND PROSPECTS
4
4.2 Accounting policies and definitions
4.2 Accounting policies and definitions
4.2.1 Critical accounting policies
See Note 2 (Summary of significant
accounting policies) to our consolidated
financial statements for more information.
Impairment of goodwill
In accordance with IAS 36 – Impairment of
Assets, goodwill is tested for impairment,
whose purpose is to take into consideration
events or changes that could have affected
the recoverable amount of these assets, at
least annually and quarterly when there are
some indications that an impairment loss may
have been identified. In case there are some
indications that an impairment loss may have
occurred during interim periods, a specific
analysis is then performed. The annual
impairment test is performed during the last
quarter of the year, in relation with the budget
process. The recoverable amount is defined
as the higher of the fair value less costs to sell
and the value in use.
For the purposes of the goodwill impairment
test, the Group’s net assets are allocated to
Cash Generating Units (“CGUs”) or groups
of CGUs. A CGU is the smallest identifiable
group of assets generating cash inflows
independently and represents the level used
by the Group to organize and present its
activities and results in its internal reporting.
CGUs generally represent one of our two
Divisions in a particular country. When it is not
possible to allocate goodwill on a non-arbitrary
basis to individual CGUs, goodwill can
be allocated to a group of CGUs at a level
not higher than the operating segment
(denominated business segment), as defined
in Note 4 (Business segments and geographic
area information) to our consolidated financial
statements.
Impairment tests are carried out in two steps:
• first step: the Group compares the
recoverable amount of CGUs or groups of
CGUs with an EBITDA multiple (t he industry-
specific multiple used is determinated every
year on the basis of a sample of companies
in our industry). EBITDA is defined as the
operating income before capital gains,
impairment, restructuring and other, before
depreciation and amortization on tangible
and intangible assets ;
• second step: for CGUs or groups of CGUs
presenting an impairment risk according
to this first step approach, the Group
determines the recoverable amount of the
CGU or group of CGUs as its fair value less
costs to sell or its value in use.
Fair value is the best estimate of the amount
obtainable from the sale in an arm’s length
transaction between knowledgeable, willing
parties. This estimate is based either on
market information available, such as
market multiple, on discounted expected
market cash fl ows, or any other relevant
valuation method.
Value in use is estimated based on
discounted cash flows expected over a
10-year period. This period reflects the
characteristics of our activities where
operating assets have a high lifespan and
where technologies evolve very slowly.
If the recoverable amount of the CGU or group
of CGUs is less than its carrying value, the
Group records an impairment loss, first to
reduce the carrying amount of any goodwill
allocated to the CGU or group of CGUs, then
to reduce the carrying amount of the other
assets of the CGU or group of CGUs.
See Note 10 (Goodwill) to our consolidated
financial statements for more information.
Pension plans, termination benefits and other post-employment benefits
Accounting rules for pension plans and other
post-employment benefits require us to make
certain assumptions that have a significant
impact on the expenses and liabilities that we
record for pension plans, termination benefits,
and other post-employment benefits.
The main defined benefit pension plans and
other post-employment benefits provided
to employees by the Group are in the
United Kingdom and North America (the
United States of America and Canada). The
related projected benefit obligations as of
December 31, 2011 represent 54% and 35%,
respectively, of the Group’s total obligations in
respect of pension plans, termination benefits
and other post-employment benefits.
See Note 23 to our consolidated financial
statements for more information on the
primary assumptions made to account for
pension plans, termination benefits and other
post retirement benefits.
Our pension and other post-employment
benefit obligations are impacted by the 2011
discount rates, which reflect the rate of long-
term high-grade corporate bonds. The impact
of decreasing the discount rate assumption by
one percentage point at December 31, 2011
for the valuation of the most significant benefit
plans located in the United Kingdom and
North America would have been to increase
the total benefit obligation by approximately
735 million euros.
Environmental costs
Costs incurred that result in future economic
benefits, such as extending useful lives,
increasing capacity or safety, and those
costs incurred to mitigate or prevent future
environmental contamination are capitalized.
When we determine that it is probable that
a liability for environmental costs exists and
that its resolution will result in an outflow
of resources, an estimate of the future
remediation cost is recorded as a provision
without contingent insurance recoveries being
offset (only quasi-certain insurance recoveries
are recognized as an asset). When we do not
have a reliable reversal time schedule or
when the effect of the passage of time is not
significant, the provision is calculated based
on undiscounted cash flows.
Environmental costs, which are not included
above, are expensed as incurred.
See Note 24 (Provisions) to the consolidated
financial statements for more information.
49Lafarge | Registration Document | 2011

4OPERATING AND FINANCIAL REVIEW AND PROSPECTS4.2 Accounting policies and definitions
Site restoration
Where we are legally, contractually or implicitly
required to restore a quarry site, we accrue
the estimated costs of site restoration and
recogn ize them under cost of sales on the
basis of production levels and depletion
rates of the quarry . The estimated future
costs for known restoration requirements
are determined on a site-by-site basis and
are calculated based on the present value of
estimated future costs.
See Note 24 (Provisions) to the consolidated
financial statements for more information.
Income tax
In accordance with IAS 12 – Income tax
and deferred income tax are accounted for
by applying the liability method to temporary
differences between the tax basis of assets
and liabilities and their carrying amounts
(including tax losses available for carry
forward). Deferred taxes are measured by
applying currently enacted or substantially
enacted tax laws. Deferred tax assets are
recognized, and their recoverability is then
assessed. If it is unlikely that a deferred
tax asset will be recovered in future years,
we record a valuation allowance to reduce
the deferred tax asset to the amount that is
likely to be recovered.
We offset deferred tax assets and liabilities
if the entity has a legally enforceable right to
offset current tax assets against current tax
liabilities, and the deferred tax assets and
deferred tax liabilities relate to income taxes
levied by the same taxing authority.
We calculate our income tax obligations in
accordance with the prevailing tax legislation
in the countries where the income is earned.
See Note 22 (Income tax) to our consolidated
financial statements for more information.
4.2.2 Effects on reported results of changes in the scope of operations and currency fluctuations
Changes in the scope of our operations, such
as acquisitions and divestitures, changes
in how we account for our business units,
such as a change from proportionate to full
consolidation, or changes in exchange rates
used for the conversion of accounts of foreign
subsidiaries to euros, may increase or decrease
our consolidated sales and operating income
before capital gains, impairment, restructuring
and other in comparison to a prior year and
thus make it difficult to determine trends in
the underlying performance of our operations.
Changes in the scope of our operations
In order to provide a meaningful analysis
between any two years (referred to below
as the “current” year and the “prior” year),
sales and operating income before capital
gains, impairment, restructuring and other are
adjusted to compare the two years at constant
scope. With respect to businesses entering the
scope of consolidation at any time during the
two years under comparison, current year
sales and operating income before capital
gains, impairment, restructuring and other are
adjusted to take into account the contribution
made by these businesses during the current
year only for a period of time identical to the
period of their consolidation in the prior year.
With respect to businesses leaving the scope
of consolidation at any time during the two
years under comparison, prior-year sales
and operating income before capital gains,
impairment, restructuring and other are
adjusted to take into account the contribution
of these businesses during the prior year only
for a period of time identical to the period of
their consolidation in the current year.
Currency fluctuations
Similarly, as a global business operating in
numerous currencies, changes in exchange
rates against our reporting currency, the
euro, may result in an increase or a decrease
in the sales and operating income before
capital gains, impairment, restructuring and
other reported in euros not linked to trends
in underlying performance. Unless stated
otherwise, we calculate the impact of currency
fluctuations as the difference between the
prior year’s figures as reported (adjusted if
necessary for the effects of businesses leaving
the scope of consolidation) and the result of
translating the prior year’s figures (adjusted if
necessary for the effects of businesses leaving
the scope of consolidation) using the current
year’s exchange rates.
4.2.3 Definition
The Group has included the “Operating
income before capital gains, impairment,
restructuring and other” subtotal (which
we commonly refer to as “current operating
income” hereinafter) on the face of
consolidated statement of income. This
measure excludes aspects of our operating
performance that are by nature unpredictable
in their amount and/or in their frequency, such
as capital gains, asset impairment charges
and restructuring costs. While these amounts
have been incurred in recent years and may
recur in the future, historical amounts may not
be indicative of the nature or amount of these
charges, if any, in future periods. The Group
believes that the “Operating income before
capital gains, impairment, restructuring and
other” subtotal is useful to users of the Group’s
financial statements, as it provides them with
a measure of our operating performance
that excludes these items, enhancing the
predictive power of our financial statements
and providing information regarding the
results of the Group’s ongoing trading activities
that allows investors to better identify trends in
the Group’s financial performance.
In addition, operating income before capital
gains, impairment, restructuring and other
is a major component of the Group’s key
profitability measure, return on capital
employed.
The Group’s subtotal shown under operating
income may not be comparable to similarly
titled measures used by other entities.
Furthermore, this measure should not be
considered as an alternative for operating
income as the effects of capital gains,
impairment, restructuring and other amounts
excluded from this measure ultimately
affect our operating performance and cash
flows. Accordingly, the Group also presents
“operating income” on the consolidated
statement of income, which encompasses all
the amounts affecting the Group’s operating
performance and cash flows.
Registration Document | 2011 | Lafarge50

OPERATING AND FINANCIAL REVIEW AND PROSPECTS
4
4.2 Accounting policies and definitions
4.2.4 Reconciliation of our non-GAAP financial measures
Net debt and cash flow from operations
To assess the Group’s financial strength, we
use various indicators, in particular the net
debt-to-equity ratio and the cash flow from
operations to net debt ratio. We believe that
these ratios are useful to investors as they
provide a view of the Group-wide level of debt
in comparison with its total equity and its cash
flow from operations.
See Section 4.4 (Liquidity and capital
resources – Level of debt and financial ratios
at December 31, 2011 and 2010) for the
value of these ratios in 2011 and 2010.
As shown in the table below, our net debt is
defined as the sum of our long-term debt,
short-term debt and current portion of long-
term debt, derivative instruments, liabilities
– non-current and derivative instruments,
liabilities – current less our cash and cash
equivalents, derivative instruments, assets –
non-current and derivative instruments, assets
- current.
(million euros) 2011 2010
Long-term debt 12,266 14,096
Short-term debt and current portion of long-term debt 2,940 3,184
Derivative instruments, liabilities – non-current 46 57
Derivative instruments, liabilities – current 34 84
Cash and cash equivalents (3,171) (3,294)
Derivative instruments, assets – non-current (80) (78)
Derivative instruments, assets – current (61) (56)
NET DEBT 11,974 13,993
We calculate the net debt-to-equity ratio
by dividing the amount of our net debt, as
computed above, by our total equity as shown
on our consolidated statement of financial
position.
We calculate the cash flow from continuing
operations to net debt ratio by dividing our
cash flow from continuing operations by our
net debt as computed above. Cash flow from
continuing operations (after interest and
income tax paid) is the net cash provided by
operating activities from operations, before
changes in operating working capital items,
excluding financial expenses and income
taxes, as follows:
(million euros) 2011 2010 *
Net operating cash generated by continuing operations ** 1,597 2,098
Changes in operating working capital items, excluding financial expenses and income taxes (20) (361)
CASH FLOW FROM CONTINUING OPERATIONS 1,577 1,737
* Figures have been adjusted as mentioned in Note 3 (Significant events) following the disposal operations of Gypsum activities.
** Including payment during 2010 of the 338 million euros Gypsum competition fine.
Free cash flow
Free cash flow is defined as net operating
cash generated by operations less sustaining
capital expenditures.
EBITDA
EBITDA is defined as the current operating
income before depreciation and amortization
on tangible and intangible assets. The EBITDA
margin is calculated as the ratio EBITDA on
revenue.
Return on capital employed before tax
One of the key profitability measures used
by our Group and Division management
for each Division is the “return on capital
employed before tax”. This non-GAAP
measure is calculated by dividing the sum
of “Operating income before capital gains,
impairment, restructuring and other” and
share of net income (loss) of associates by
the average of “capital employed” at the end
of the current and prior year. This measure is
used by the Group internally to manage and
assess the results of its operations and those
of its business segments, make decisions
with respect to investments and resource
allocations and assess the performance of
the management. However, because this
measure has the limitations outlined below,
the Group restricts the use of this measure to
these purposes.
See Note 4 (Business segment and geographic
area information) to our consolidated financial
statements for more information on current
operating income, share of “net income
(loss) of associates” and “capital employed”
by Division.
51Lafarge | Registration Document | 2011

4OPERATING AND FINANCIAL REVIEW AND PROSPECTS4.3 Results of operations for the fiscal years ended December 31, 2011 and 2010
For 2011 and 2010, return on capital employed before tax for each Division and the Group was calculated as follows:
2011
(million euros)
CURRENT OPERATING
INCOME
SHARE OFNET INCOME
(LOSS) OF ASSOCIATES
CURRENT OPERATING
INCOME WITH INCOME FROM
ASSOCIATES
CAPITAL EMPLOYED AT
DECEMBER 31, 2011**
CAPITAL EMPLOYED AT
DECEMBER 31, 2010 *
AVERAGE CAPITAL EMPLOYED
RETURN ON CAPITAL
EMPLOYED BEFORE TAX (%)
(A) (B) (C) = (A)+(B) (D) (E) (F) = ((D)+(E))/2 (G) = (C)/(F)
Cement 1,968 (10) 1,958 25,836 26,780 26,308 7.4
Aggregates & Concrete 237 3 240 5,024 5,200 5,112 4.7
Other (26) (1) (27) 574 372 473 N/A
TOTAL FOR OPERATIONS 2,179 (8) 2,171 31,434 32,352 31,893 6.8
* Figures 2010 have been adjusted for 1,410 million euros following the disposal operations of Gypsum activities mentioned in Note 3 (Significant events) to our consolidated financial
statements.
** Of which 1,492 million euros related to Lafarge UK capital employed presented as assets held for sale in our consolidated financial statements.
2010
(million euros)
CURRENT OPERATING
INCOME
SHARE OF NET INCOME
(LOSS) OF ASSOCIATES
CURRENT OPERATING
INCOME WITH INCOME FROM ASSOCIATES*
CAPITAL EMPLOYED AT
DECEMBER 31, 2010
CAPITAL EMPLOYED AT
DECEMBER 31, 2009
AVERAGE CAPITAL EMPLOYED
RETURN ON CAPITAL
EMPLOYED BEFORE TAX (%)
(A) (B) (C) = (A)+(B) (D) (E) (F) = ((D)+(E))/2 (G) = (C)/(F)
Cement 2,230 (26) 2,204 26,780 24,924 25,852 8.5
Aggregates & Concrete 216 5 221 5,200 5,102 5,151 4.3
Other (out of which Gypsum) (5) 5 - 1,782 1,810 1,796 N/A
TOTAL FOR OPERATIONS 2,441 (16) 2,425 33,762 31,836 32,799 7.4
* Out of which 2,370 million euros related to continuing operations.
4.3 Results of operations for the fiscal years ended December 31, 2011 and 2010
All data presented regarding sales, current
operating income and sales volumes,
include the proportional contributions of our
proportionately consolidated subsidiaries.
Demand for our Cement and Aggregates
& Concrete products is seasonal and tends
to be lower in the winter months in temperate
countries and in the rainy season in tropical
countries. We usually experience a reduction
in sales on a consolidated basis in the first
quarter during the winter season in our
principal markets in Western Europe and
North America, and an increase in sales in
the second and third quarters, reflecting the
summer construction season.
In order to reflect its divestment intentions
and announcements, the activities in Europe,
North America, Asia and Latin America
of the Gypsum Division are presented as
discontinued operations in the Group’s
consolidated financial statements. In
compliance with IFRSs, the presentation of
the Gypsum discontinued activities in the
Group’s consolidated statements of income
and statements of cash flows, has been
reclassified to specific lines for all the years
presented. In the Group’s consolidated
statements of financial position, Gypsum
assets and liabilities are shown on separate
lines for December 2011, only, with no
restatement for prior periods.
Additionally, we have reclassified our Austrian
activities from Western Europe to Central and
Eastern Europe. This reflects the contribution
of our Austrian operations into a new company
with Strabag which strengthens our industrial
network in Central Europe.
4.3.1 Consolidated sales and current operating income
Sales
Compared to 2010, consolidated sales
increased 3.0% to 15,284 million euros from
14,834 million euros for the full year.
Net changes in the scope of consolidation
had a positive impact on our sales of 1.5%
year-to-date, with the combined effect of the
consolidation of our new cement Brazilian
assets from July 2010 and the incremental
contribution of our new cement plant in
Syria, partly offset by the divestment of our
South East assets in the United States from
October 2011. Currency fluctuations were
unfavorable (-3.0% year-to-date), driven
by the depreciation against the euro of the
Registration Document | 2011 | Lafarge52

OPERATING AND FINANCIAL REVIEW AND PROSPECTS
4
4.3 Results of operations for the fiscal years ended December 31, 2011 and 2010
Egyptian pound and most currencies in Middle
East and Africa, along with the depreciation of
the US dollar and Indian rupee.
At constant scope and exchange rates,
consolidated sales increased 4.5% year- to- date,
helped by volume increases throughout all our
emerging markets while volumes in mature
markets showed mixed trends. Western Europe
benefited from higher volumes in France and
the United Kingdom, helped by favorable fourth
quarter weather, but was negatively impacted
by the tougher economic environment in
Greece and Spain. In North America, subdued
growth was experienced in the United States
while Canada showed more positive trends.
Contribution to our sales by Division (before elimination of inter-Division sales) for the years ended December 31, 2011 and 2010, and the
related percentage changes between the two periods were as follows:
SALES
2011 VARIATION 2011/2010 2010
(million euros) (%) (million euros)
Cement 10,622 3.3 10,280
Aggregates & Concrete 5,238 2.8 5,093
Other 82 N/A 90
Elimination of inter-division sales (658) N/A (629)
TOTAL 15,284 3.0 14,834
Contribution to our consolidated sales by Division (after elimination of inter-Division sales) for the years ended December 31, 2011 and 2010,
and the related percentage changes between the two periods were as follows:
SALES
2011 VARIATION 2011/2010 2010
(million euros) (%) (%) (million euros) (%)
Cement 9,975 65.3 3.3 9,656 65.1
Aggregates & Concrete 5,227 34.2 2.7 5,088 34.3
Other 82 0.5 N/A 90 0.6
TOTAL 15,284 100.0 3.0 14,834 100.0
At constant scope and exchange rates, the changes in sales by Division between the years ended December 31, 2011 and 2010 were as follows:
(million euros)
2011 2010 % VARIATION
ACTUALSCOPE IN EFFECT *
ON A COMPARABLE
BASIS ACTUAL
SCOPE EFFECT OF
DISPOSALS
AT CONSTANT
SCOPE
CURRENCY FLUCTUATION
EFFECTS
ON A COMPARABLE
BASIS
% OF GROSS CHANGE ACTUAL
% CHANGE AT
CONSTANT SCOPE AND EXCHANGE
RATES
(A) (B) (C) = (A)-(B) (D) (E) (F) = (D)+(E) (G) (H) = (F)+(G)(I) = (A-D)/
(D)(J) = (C-H)/
(H)
Cement 10,622 292 10,330 10,280 (43) 10,237 (326) 9,911 3.3 4.2
Aggregates &
Concrete 5,238 117 5,121 5,093 (149) 4,944 (87) 4,857 2.8 5.4
Other 82 - 82 90 - 90 (5) 85 nm** nm**
Elimination of inter-
Division sales (658) - (658) (629) 6 (623) 6 (617) nm** nm**
TOTAL 15,284 409 14,875 14,834 (186) 14,648 (412) 14,236 3.0 4.5
* Including acquired and new production capacities
** not meaningful
Current operating income
Current operating income decreased 9%
in 2011 versus 2010, at 2,179 million euros
from 2,393 million euros in 2010.
Net changes in the scope of consolidation
has a positive net effect of 83 million euros
on the current operating income on a full year
basis, benefiting from the effect of the new
cement capacities and with the stopping of
depreciation of the UK assets as of March 1,
2011 due to their scheduled contribution to
the joint-venture with Tarmac UK (50 million
euros(1), see Note 3 (Significant event s to our
consolidated financial statements)), but they
were more than offset by the effect of adverse
currency fluctuations of 86 million euros.
(1) Impact of 32 million euros for cement and 18 millions euros for A&C.
53Lafarge | Registration Document | 2011

4OPERATING AND FINANCIAL REVIEW AND PROSPECTS4.3 Results of operations for the fiscal years ended December 31, 2011 and 2010
At constant scope and exchange rates,
current operating income decreased by
9% for the full year, mostly due to high cost
inflation that was only partially offset by higher
volumes and strong cost reductions across the
Divisions. An improvement was experienced
in the fourth quarter, with current operating
income up by 1%, reflecting the combined
effect of improved prices, higher volumes
helped by a mild winter, and a strong focus
on cost containment.
Our Cement division benefited from higher
volumes, with brisk construction activity in
most emerging markets while mature markets
experienced contrasted trends. In general,
rising costs lowered overall earnings. Cement
prices moved up 1% compared to the fourth
quarter 2010, and were marginally higher
than 2010 average levels.
Our Aggregates and Concrete division
benefited from growth in France, in the United
Kingdom, in Central and Eastern Europe and
in Canada. Solid prices overall and strong cost
cutting helped to partially offset cost inflation.
As a percentage of sales, current operating
income margin was 14.3% in 2011, compared
to 16.1% in 2010, primarily reflecting the
impact of higher cost inflation.
Group return on capital employed was 6.8%
compared to 7.4% in 2010, reflecting lower
earnings.
See Section 4.2.4 (Reconciliation of our
non-GAAP financial measures) for more
information on capital employed.
Contribution to our current operating income by Division for the years ended December 31, 2011 and 2010, and the related percentage
changes between the periods were as follows:
CURRENT OPERATING INCOME
2011 VARIATION 2011/2010 2010
(million euros) (%) (%) (million euros) (%)
Cement 1,968 90.3 (11.7) 2,230 93.2
Aggregates & Concrete 237 10.9 9.7 216 9.0
Other (26) (1.2) nm (53) (2.2)
TOTAL 2,179 100.0 (8.9) 2,393 100.0
At constant scope and exchange rates, the changes in consolidated current operating income by Division between the years ended December 31,
2011 and 2010 were as follows:
(million euros)
2011 2010 % VARIATION
ACTUALSCOPE IN EFFECT*
ON A COMPARABLE
BASIS ACTUAL
SCOPE EFFECT OF
DISPOSALS
AT CONSTANT
SCOPE
CURRENCY FLUCTUATION
EFFECTS
ON A COMPARABLE
BASIS
% OF GROSS CHANGE ACTUAL
% CHANGE AT
CONSTANT SCOPE AND EXCHANGE
RATES
(A) (B) (C) = (A)-(B) (D) (E) (F) = (D)+(E) (G) (H) = (F)+(G)(I) = (A-D)/
(D)(J) = (C-H)/
(H)
Cement 1,968 55 1,913 2,230 10 2,240 (83) 2,157 (11.7) (11.3)
Aggregates &
Concrete 237 17 220 216 2 218 (2) 216 9.7 1.9
Other (26) (1) (25) (53) - (53) (1) (54) nm nm
TOTAL 2,179 71 2,108 2,393 12 2,405 (86) 2,319 (8.9) (9.1)
* Including acqui red and new production capacities
Sales and current operating income by d ivision
METHOD OF PRESENTATION
Sales before elimination of inter-D ivision sales
Figures for individual Divisions are stated below
prior to elimination of inter-Division sales. For
sales by each Division after elimination of inter-
Division sales, see the table under “Sales and
Current Operating Income” above.
Geographic market information: by “domestic” origin of sale and by destination
Unless stated otherwise, we analyze our sales
for each region or country by origin of sale.
“Domestic sales” and “domestic volumes”
concern only sales and volumes both
originating and completed within the relevant
geographic market, and thus exclude export
sales and volumes. When not described
as “domestic”, this information includes
domestic sales or volumes plus exports to
other geographic markets. Unless stated
otherwise, all “domestic” information is
provided at constant scope and exchange
rates.
Certain volume information is also presented
“by destination market”. Such information
represents domestic volumes for the relevant
market plus imports into this market. Exports
to other markets are then excluded.
Registration Document | 2011 | Lafarge54
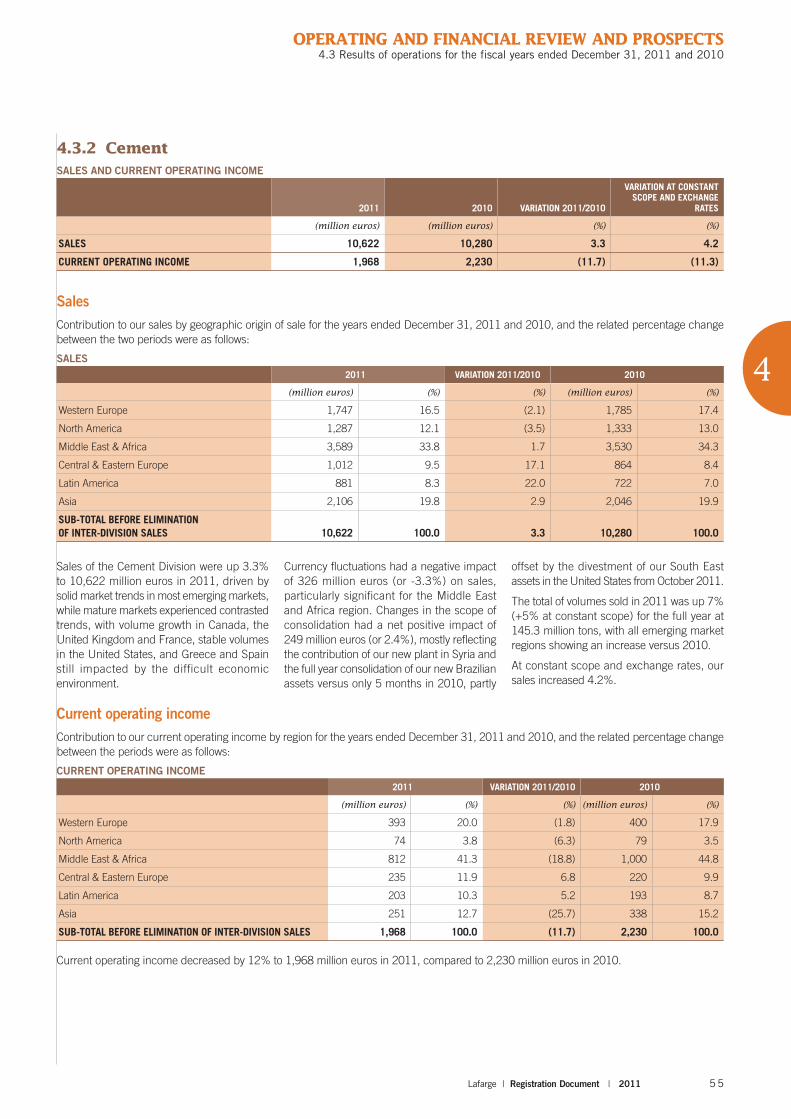
OPERATING AND FINANCIAL REVIEW AND PROSPECTS
4
4.3 Results of operations for the fiscal years ended December 31, 2011 and 2010
4.3.2 Cement
SALES AND CURRENT OPERATING INCOME
2011 2010 VARIATION 2011/2010
VARIATION AT CONSTANT SCOPE AND EXCHANGE
RATES
(million euros) (million euros) (%) (%)
SALES 10,622 10,280 3.3 4.2
CURRENT OPERATING INCOME 1,968 2,230 (11.7) (11.3)
Sales
Contribution to our sales by geographic origin of sale for the years ended December 31, 2011 and 2010, and the related percentage change
between the two periods were as follows:
SALES
2011 VARIATION 2011/2010 2010
(million euros) (%) (%) (million euros) (%)
Western Europe 1,747 16.5 (2.1) 1,785 17.4
North America 1,287 12.1 (3.5) 1,333 13.0
Middle East & Africa 3,589 33.8 1.7 3,530 34.3
Central & Eastern Europe 1,012 9.5 17.1 864 8.4
Latin America 881 8.3 22.0 722 7.0
Asia 2,106 19.8 2.9 2,046 19.9
SUB-TOTAL BEFORE ELIMINATION
OF INTER-DIVISION SALES 10,622 100.0 3.3 10,280 100.0
Sales of the Cement Division were up 3.3%
to 10,622 million euros in 2011, driven by
solid market trends in most emerging markets,
while mature markets experienced contrasted
trends, with volume growth in Canada, the
United Kingdom and France, stable volumes
in the United States, and Greece and Spain
still impacted by the difficult economic
environment.
Currency fluctuations had a negative impact
of 326 million euros (or -3.3%) on sales,
particularly significant for the Middle East
and Africa region. Changes in the scope of
consolidation had a net positive impact of
249 million euros (or 2.4%), mostly reflecting
the contribution of our new plant in Syria and
the full year consolidation of our new Brazilian
assets versus only 5 months in 2010, partly
offset by the divestment of our South East
assets in the United States from October 2011.
The total of volumes sold in 2011 was up 7%
(+5% at constant scope) for the full year at
145.3 million tons, with all emerging market
regions showing an increase versus 2010.
At constant scope and exchange rates, our
sales increased 4.2%.
Current operating income
Contribution to our current operating income by region for the years ended December 31, 2011 and 2010, and the related percentage change
between the periods were as follows:
CURRENT OPERATING INCOME
2011 VARIATION 2011/2010 2010
(million euros) (%) (%) (million euros) (%)
Western Europe 393 20.0 (1.8) 400 17.9
North America 74 3.8 (6.3) 79 3.5
Middle East & Africa 812 41.3 (18.8) 1,000 44.8
Central & Eastern Europe 235 11.9 6.8 220 9.9
Latin America 203 10.3 5.2 193 8.7
Asia 251 12.7 (25.7) 338 15.2
SUB-TOTAL BEFORE ELIMINATION OF INTER-DIVISION SALES 1,968 100.0 (11.7) 2,230 100.0
Current operating income decreased by 12% to 1,968 million euros in 2011, compared to 2,230 million euros in 2010.
55Lafarge | Registration Document | 2011

4OPERATING AND FINANCIAL REVIEW AND PROSPECTS4.3 Results of operations for the fiscal years ended December 31, 2011 and 2010
Currency fluctuations had a negative impact
of -4% or -83 million euros on our current
operating income, partially offset by the
positive effect of net changes in the scope of
consolidation of 65 million euros (or 3%).
At constant scope and exchange rates, and
excluding the impact of the Egyptian clay tax
provision reversal in 2010 (67 million euros),
current operating income decreased 9% for
the year. As a percentage of the Division’s
sales, current operating income margin
declined to 18.5% in 2011, from 21.0%
in 2010, under the pressure of cost inflation,
despite higher volumes and significant cost-
cutting measures.
Return on capital employed was 7.4% in 2011
compared to 8.5% in 2010, reflecting lower
earnings.
See Section 4.2.4 (Reconciliation of our
non-GAAP financial measures) for more
information on return on capital employed.
Western Europe
SALES
In Western Europe, sales decreased by 2% to
1,747 million euros compared to 2010.
At constant scope and exchange rates,
domestic sales decreased by 2%, with highly
contrasted trends within the region. Volumes
sold in Western Europe were 18.4 million
tonnes in 2011 versus 18.8 million tonnes
in 2010, a decrease of 2%.
• In France, domestic sales were up 4%,
driven by volume growth, while average
prices were slightly down mostly due to the
mix of project work. The country benefited
from improved market conditions mainly
due to the residential segment and mild
weather versus 2010.
• In the United Kingdom, domestic sales
increased a strong 10%, helped by Olympic
construction and more favorable weather in
fourth quarter versus last year. Prices were
solid overall.
• In Spain, domestic sales experienced
a drop of 15% due to lower volumes in
the context of a significant decline in the
Spanish construction sector with reductions
in civil works and a weak residential sector.
Prices were stable overall, in a context of
high cost inflation .
• In Greece, the overall economic situation
and austerity measures continued to impact
the construction market. As a consequence,
domestic volumes were down 31% with
lower prices.
CURRENT OPERATING INCOME
Current operating income in Western Europe
slightly decreased in 2011, at 393 million
euros. Results for 2011, include the 32 million
euros effect of the stopping of depreciation
of the UK assets as of March 1, 2011 due
to their scheduled contribution to the joint-
venture with Tarmac UK.
S ee Note 3 (Significant events) to our
consolidated financial statements .
At constant scope and exchange rates, current
operating income decreased by 11%. For the
year 2011, reduced CO2 emissions combined
with lower sales volumes allowed the Group
to sell 136 million euros of carbon credit,
compared with 113 million euros in 2010.
• In France, higher volumes helped mitigate
a higher cost of petcoke and slightly lower
prices.
• The United Kingdom benefited from
stronger construction volumes and
contained costs.
• Despite cost reduction measures, Spain’s
earnings were affected by the impact of
the challenging residential construction
market conditions, austerity measures, and
increased input costs.
• In Greece, kiln shutdowns and other cost
containment actions were successfully
implemented to reduce fixed costs in
response to the difficult market conditions,
and partially mitigated the strong impact of
lower sales.
North America
SALES
Sales decreased 3% to 1,287 million euros
compared to 1,333 million euros in 2010, with
a negative effect of currency fluctuations and
the impact of the divestment of our assets in
the South East of the United States.
At constant scope and exchange rates,
domestic sales increased by 1% for the full
year. Volumes sold in North America were
rather stable versus 2010, at 13.5 million
tonnes. Domestic volumes in Canada
increased 5% helped by project work and
continuing demand in the oil sector, while
domestic volumes in the United States were
stable. Average prices were below 2010 levels
mostly due to declines that occurred in the
second half of 2010 in the United States, while
prices in Canada were solid overall.
CURRENT OPERATING INCOME
Current operating income in North America
moved slightly down to 74 million euros
in 2011, helped by a strong increase in fourth
quarter results reflecting an acceleration in
cost containment measures. At constant
exchange rates, current operating income
for the year was slightly lower as the higher
volumes and continued cost cutting measures
only partially offset the combined effect of
lower prices and higher fuel and transportation
costs.
Emerging Markets
SALES
Sales in emerging markets increased
6% to 7,588 million euros in 2011 from
7,162 million euros in 2010, representing
more than two-third of our cement sales. The
currency translation effects lowered our sales
by 280 million euros, more than offsetting
the positive net effect of changes in scope
of 259 million euros. At constant scope and
exchange rates, sales in emerging markets
grew 7% for the full year.
Registration Document | 2011 | Lafarge56

OPERATING AND FINANCIAL REVIEW AND PROSPECTS
4
4.3 Results of operations for the fiscal years ended December 31, 2011 and 2010
In the Middle East and Africa region, our sales
increased 2%, to 3,589 million euros, against
3,530 million euros in 2010. Solid markets
overall and the increasing contribution of our
new plants in Syria and Nigeria were partly
offset by lower sales in Egypt and Jordan and
a particularly negative impact of currency
fluctuations.
At constant scope and exchange rates,
domestic sales increased 4% for the full
year. Volumes sold in Middle East and Africa
increased to 44.0 million tonnes, against
40.2 million tonnes in 2010.
• In Algeria, solid market trends, improved
industrial performance and satisfactory
evolution of prices due to new product
launch led domestic sales to increase a
strong 24%.
• In Egypt, our domestic sales decreased 23 %
due to a decrease in volumes attributable less
to the slight decrease of the market than to the
arrival of new capacities on the market, and to
the decrease of average prices of slightly more
than 20% vs 2011 highest prices. Prices have
been very volatile during the second half of
2011 .
• In Morocco, domestic sales were up 3%
helped by public spending, particularly
for social housing, in a stable price
environment.
• In Iraq, domestic sales were stable for the
year; the strong increase in volumes in the
first semester was indeed offset by lower
volumes in the second half of the year, due
to high temperatures in the third quarter,
higher imports and slightly lower prices.
• In Jordan, domestic sales dropped by 25%,
still affected by new capacities that entered
the market.
• In Nigeria, our domestic sales increased
by 33% on the back of strong market
trends and with the start-up of our new
production line in September 2011.
Production levels were also improved due
to the implementation of a captive power
plant securing our sourcing of electricity at
Ewekoro, helping us to further capture the
market growth opportunities.
• In Kenya, our domestic sales were up 7%
driven by a strong domestic demand, even
after the rise in interest rates decided by the
Central Bank in September 2011 to contain
inflation.
• In South Africa, domestic sales increased
5%, with good market trends and prices
well oriented.
• Also during the year we benefited from two
new plants started in Uganda and Syria, in
the second quarter and the fourth quarter
2010, respectively.
Our sales in Central and Eastern Europe were
up 17% in 2011 to 1,012 million euros from
864 million euros in 2010.
At constant scope and exchange rates,
domestic sales increased 17% for the full
year, helped by market recovery in Russia
and Poland and overall mild weather in winter.
Volumes sold in Central and Eastern Europe
were up 10% to 14.2 million tons.
• Poland benefited from the European
Union Funding for infrastructure projects
and the structural deficit in housing. As a
result, domestic sales increased 27%, with
significant volume increases all along the
year and positive prices.
• In Russia, our domestic sales increased
a strong 46% versus last year, helped by
recovering economic environment and well-
oriented prices progressively recovering
from low levels.
• Romania experienced a 4% domestic sales
increase, with positive volumes driven by
non-residential and infrastructure works
and lower prices partially due to a negative
mix effect .
• In Serbia, domestic sales were slightly
down, with positive volume trends on the
back of increased public infrastructure
spending offset by lower average prices.
In Latin America, our sales jumped by 22%
to 881 million euros, from 722 million euros
in 2010, benefiting from well-oriented markets
and acquisition of Votorantim assets in Brazil .
At constant scope and exchange rates, full
year domestic sales increased by 10%.
Volumes sold in Latin America increased
to 10.5 million tons from 8.4 million tons
in 2010.
• In Brazil, domestic sales rose 7%, bolstered
by good market trends and well-oriented
prices. Additionally, the region continued
to benefit from the contribution of our new
Brazilian assets located in the north-east
region and consolidated from the end
of July 2010. Production issues at one
plant lowered the potential incremental
contribution for the year, but improved
going into the fourth quarter.
• In Ecuador, domestic sales increased 14%
with good market conditions and solid
prices.
• Honduras sales strongly increased after
a challenging 2010 year in terms of the
economic and political environment.
Our sales in Asia grew by 3% to 2,106 million
euros, despite the depreciation of most of the
Asian currencies against the euro.
At constant scope and exchange rates,
domestic sales increased 7% versus last year.
Volumes sold in Asia were up 8% versus last
year at 44.7 million tonnes.
• In China, our domestic sales were up 21%
on the back of continuous strong demand
and the full effect of the start-up of the
new plants that started at the end of 2010.
Prices progressively improved throughout
the year versus the year-end 2010 levels.
The fourth quarter was somewhat marked
by a slowdown in demand growth due to
the government’s monetary policy actions
to reduce inflation.
• In India, domestic sales slightly contracted
2%, with a subdued market growth in our
regions due to a slowdown in government
spending that also weighed on price levels.
57Lafarge | Registration Document | 2011

4OPERATING AND FINANCIAL REVIEW AND PROSPECTS4.3 Results of operations for the fiscal years ended December 31, 2011 and 2010
• In Malaysia, domestic sales increased 11%,
driven by positive market trends across all
sub-sectors and price increases advanced
in the second quarter.
• In the Philippines, domestic sales
decreased 10%, market trends and
prices were affected by the Government’s
temporary suspension of key infrastructure
projects in the first half of the year. Some
improvements were experienced in the
second half of the year with a double-digit
volume growth and prices stabilizing.
• In South Korea, our domestic sales grew
4% mostly due to price gains.
• In Indonesia, the ramp-up of our Aceh plant
started in 2010 allowed us to fully capture
market growth opportunities.
CURRENT OPERATING INCOME
Current operating income in emerging
markets decreased by 14% in 2011 to
1,501 million euros compared to 1,751 million
euros in 2010, representing 76% of the
Cement Division’s current operating income.
Currency fluctuations had a negative impact of
84 million euros on current operating income.
At constant scope and exchange rates, and
when restating the one-time reversal of a
regulatory fee provision in Egypt for 67 million
euros in the fourth quarter 2010, current
operating income decreased by 8% over the
year, but improved 5% in the fourth quarter.
In Middle East and Africa, current operating
income in 2011 decreased by 19% to
812 million euros compared to 1,000 million
euros in 2010. The impact of the currency
fluctuations was particularly negative as most
currencies within the region depreciated
against the euro and was only partly offset by
the increasing contribution of our new plant
in Syria.
At constant scope and exchange rates,
and when restating the one-time reversal
of a regulatory fee provision in Egypt for
67 million euros in the fourth quarter 2010,
current operating income decreased by 8%,
mostly due to cost inflation and a challenging
situation in Egypt.
• In Egypt, earnings were strongly impacted
by higher cost inflation and lower prices and
volumes since January 2011 that lowered
our sales; we estimate the impact of the
disruptions of the first quarter 2011 due
to political events to be roughly 30 million
euros on our earnings.
• In Algeria, earnings strongly increased with
higher sales, lower clinker purchases due
to improved industrial performance, partly
offset by higher raw material costs.
• In Morocco, higher volumes almost offset
higher petcoke and other costs in a stable
pricing environment.
• Nigeria earnings benefited from the
incremental contribution of our new line
started in September 2011, good market
trends and the strong improvements
achieved in energy costs.
• In Iraq, earnings slightly decreased under
the combined effect of slightly lower
prices and the start-up costs for our new
operations in the south of the country.
• In Jordan, our results declined due to the
impact of lower volumes and higher fuel
costs. Significant cost reduction measures,
including temporary kiln shutdowns were
implemented to limit this impact.
• In Kenya, higher sales were more than
offset by higher costs of coal, power and
transport.
• In South Africa, higher sales fully
compensated for higher variable production
costs, notably an increase in the power
tariff.
In Central and Eastern Europe, current
operating income was up 7% to 235 million
euros compared to 220 million euros in 2010.
At constant scope and exchange rates,
current operating income increased 12%
in 2011, under the combined effect of higher
sales, cost inflation and slightly lower carbon
credit sales. For the full year 2011, we sold
41 million euros of carbon credit, compared
with 44 million euros in 2010.
• In Poland, the strong increase in volumes
was the primary driver for earnings increase,
while prices progressively improved in a
cost inflationary context.
• In Russia, significant price gains recovering
from historical low levels more than offset
higher energy, wages and maintenance
costs.
• In Romania, despite an improvement in
volumes, earnings decreased with lower
prices and higher petcoke costs.
• In Serbia, increased volumes helped to
partially offset lower prices and increased
input costs.
In Latin America, current operating income was
up 5% to 203 million euros from 193 million
euros in 2010.
At constant scope and exchange rates, current
operating income decreased 2% year-to-date
but was up 5% in the fourth quarter, as the
effect of positive market trends in the region
progressively helped to offset significantly
higher variable costs.
• Brazil benefited from higher sales, but
earnings were strongly impacted by large
variable costs increases, particularly for
petcoke and transport.
• In Ecuador, higher volumes drove the
current operating income improvement.
• In Honduras, earnings strongly increased
due to higher sales and contained costs.
In Asia, current operating income decreased
by 26% to 251 million euros in 2011 from
338 million euros in 2010.
At constant scope and exchange rates, current
operating income decreased by 24% for the
year, mostly reflecting higher variable costs,
but improved 15% in the last quarter, with a
progressive improvement of price trends along
the year.
Registration Document | 2011 | Lafarge58

OPERATING AND FINANCIAL REVIEW AND PROSPECTS
4
4.3 Results of operations for the fiscal years ended December 31, 2011 and 2010
• In China, the increase in sales was sufficient
to absorb the impact of higher coal prices,
with some coal shortages in certain locations
due to temporary mining stoppages after
some accidents have occurred.
• In India, our earnings were impacted by
lower average prices for the year and higher
energy and transportation costs.
• In Malaysia, well-oriented prices, higher
volumes and actions to cut fixed costs
more than offset the strong increase in input
costs, mostly fuel.
• In the Philippines, a slowdown in
government construction spending in the
first part of the year, lower prices and higher
energy costs put pressure on earnings.
• In South Korea, the improvements
experienced in both volume and prices only
partly mitigated the impact of increased fuel
prices.
• In Indonesia, higher sales and improved
operational performance only partially
offset higher fixed costs, higher costs of
cement imports during the ramp-up phase
and higher depreciation charge due to the
start-up of the plant at the end of 2010.
4.3.3 Aggregates & Concrete
SALES AND CURRENT OPERATING INCOME
2011 2010 VARIATION 2011/2010
VARIATION AT CONSTANT SCOPE AND EXCHANGE
RATES
(million euros) (million euros) (%) (%)
SALES 5,238 5,093 2.8 5.4
CURRENT OPERATING INCOME 237 216 9.7 1.9
Sales
Contribution to our sales by activity and geographic origin for the years ended December 31, 2011 and 2010, and the related percentage
change between the two periods were as follows:
SALES
2011 VARIATION 2011/2010 2010
(million euros) (%) (%) (million euros) (%)
AGGREGATES & RELATED PRODUCTS 2,647 5.4 2,511
Of which pure aggregates:
Western Europe 829 38.3 3.0 805 39.5
North America 931 43.0 2.0 913 44.9
Emerging Markets 404 18.7 27.0 318 15.6
TOTAL PURE AGGREGATES 2,164 100.0 6.3 2,036 100.0
READY MIX CONCRETE & RELATED PRODUCTS 2,971 0.8 2,946
Of which ready-mix:
Western Europe 1,127 39.6 (2.3) 1,153 40.6
North america 783 27.6 (1.3) 793 28.0
Emerging Markets 933 32.8 4.6 892 31.4
TOTAL READY MIX CONCRETE 2,843 100.0 0.2 2,838 100.0
Elimination of intra Aggregates & Concrete sales (380) (4.4) (364)
TOTAL AGGREGATES & CONCRETE BEFORE ELIMINATION
OF INTER-DIVISIONS SALES 5,238 2.8 5,093
Sales of the Aggregates & Concrete Division
were up 3% to 5,238 million euros in 2011
compared to 5,093 million euros in 2010.
Net scope effects and net impact of currency
fluctuations were -32 million euros and
-87 million euros on sales, respectively.
The effect of the divestment of some of our
activities in France, Portugal or in the South
East of the United States was partly offset
by the development of our Aggregates and
Ready-mix concrete activities in some targeted
emerging markets.
At constant scope and exchange rates, sales
increased 5% year-on-year, benefiting from
improved volumes in France, the United
Kingdom , Canada and Central and Eastern
Europe, with contrasted trends in the other
regions.
Sales of pure aggregates increased by 6%
to 2,164 million euros in 2011 compared
with 2,036 million euros in 2010. Currency
59Lafarge | Registration Document | 2011

4OPERATING AND FINANCIAL REVIEW AND PROSPECTS4.3 Results of operations for the fiscal years ended December 31, 2011 and 2010
fluctuations had a negative impact on sales
of 33 million euros, partially offset by the
net impact of scope changes of 19 million
euros. At constant scope and exchange
rates, sales increased by 7% year-to-date.
Aggregates sales volumes in 2011 were stable
at 192.7 million tonnes; at constant scope,
sales volumes increased by 1%.
Sales of ready-mix concrete were 2,843 million
euros in 2011, stable versus 2010. Currency
fluctuations and changes in scope of
consolidation had a negative impact on sales
of 50 million euros and 26 million euros,
respectively. At constant scope and exchange
rates, sales increased by 3% year-to date.
Sales volumes of ready-mix concrete were
stable at 33.8 million cubic meters.
Current operating income
Contribution to our current operating income by activity and by region for the years ended December 31, 2011 and 2010, and the related
percentage change between the periods were as follows:
CURRENT OPERATING INCOME
2011 VARIATION 2011/2010 2010
(million euros) (%) (%) (million euros) (%)
Aggregates & related products 192 81.0 9.7 175 81.0
Ready-mix concrete & concrete products 45 19.0 9.8 41 19.0
TOTAL BY ACTIVITY 237 100.0 9.7 216 100.0
Western Europe 82 34.6 32.3 62 28.7
North America 122 51.5 27.1 96 44.4
Emerging Markets 33 13.9 (43.1) 58 26.9
TOTAL BY REGION 237 100.0 9.7 216 100.0
Current operating income of the Aggregates
& Concrete Division increased by 10% to
237 million euros in 2011 from 216 million
euros in 2010. Changes in scope had a
positive impact of 19 million euros while the
effect of currency fluctuations was negligible.
At constant scope and exchange rates, current
operating income was up 2% year-to-date.
As a percentage of the Division’s sales, current
operating income margin improved to 4.5%
in 2011, compared to 4.2% in 2010, reflecting
cost containment and further helped by the
18 million euros effect of the stopping of
depreciation of the UK assets as of March 1,
2011 due to their scheduled contribution to
the joint-venture with Tarmac UK (see Note 3
( Significant events) to our consolidated
financial statements ).
Current operating income for aggregates
& related products increased by 10% to
192 million euros in 2011 from 175 million
euros in 2010. Excluding the 15 million
euros impact of the stopping of depreciation
of the UK assets, current operating income
stabilized, as higher sales and significant cost
cutting measures implemented in all regions
helped limit the impact of production and
shipping costs increases.
Current operating income for ready-mix
concrete & concrete products was up 10%
in the year, at 45 million euros in 2011,
from 41 million euros in 2010. Excluding
the 3 million euros impact of the stopping
of depreciation of the UK assets, current
operating stabilized, under the combined
effect of higher delivery costs and other costs
partially passed on to customers, the value-
added products incremental contribution and
cost containment measures.
Return on capital employed increased to 4.7%
in 2011 from 4.3% in 2010, reflecting the
improving current operating income.
See Section 4.2.4 (Reconciliation of our
non-GAAP financial measures) for more
information on return on capital employed.
Western Europe
SALES
Pure aggregates sales increased 4% like
for like to 829 million euros compared with
805 million euros in 2010. France, and to a
lesser extent the UK, benefited from higher
volumes partly due to a particularly low base
level of activity in the fourth quarter 2010
versus a favorable weather in fourth quarter
2011. Spain and Greece suffered from
difficult economic conditions with reduced
public spending and the impact of austerity
measures. Overall, prices were solid. Asphalt
and paving sales increased, helped by several
infrastructure projects in the UK.
Ready-mix concrete sales increased 3%
like for like to 1,127 million euros compared
with 1,153 million euros in 2010. Ready-mix
concrete volumes were 9% up in France
driven by large projects and also favorable
weather, and continued to grow in the UK. In
other parts of Western Europe, and noticeably
in Greece and Spain, depressed market
conditions drove volume declines. Prices were
well oriented overall.
CURRENT OPERATING INCOME
Current operating income in Western Europe
was up 32% to 82 million euros in 2011
versus 62 million euros in 2010. Excluding
the 18 million euros impact of the stopping
of depreciation of the UK assets, current
operating income stabilized for the year,
as higher sales and significant cost cutting
measures implemented in all regions helped
limit the impact of production costs and
delivery costs increases.
Registration Document | 2011 | Lafarge60

OPERATING AND FINANCIAL REVIEW AND PROSPECTS
4
4.3 Results of operations for the fiscal years ended December 31, 2011 and 2010
North America
SALES
At constant scope and exchange rates, pure
aggregates sales and ready-mix concrete sales
increased 5% and 3% respectively for the
year, with positive market trends and projects
works in West Canada and in some regions
of the United States. Overall, the market
demand remained subdued due to constraints
with federal and States funding. Prices were
solid for aggregates, and were slightly lower
for ready-mix concrete, partly due to adverse
product and geographical mix.
At constant scope and exchange rates,
Asphalt and paving sales benefited from
positive market trends in most of our regions
and benefited from price gains.
CURRENT OPERATING INCOME
In North America, current operating income
strongly increased to 122 million euros in 2011
from 96 million euros in 2010. At constant
scope and exchange rates, the increase in
current operating income was driven by strong
cost cutting measures, higher aggregates
prices and higher ready-mix volumes that fully
compensated for cost inflation, mostly due to
higher energy costs.
Emerging Markets
SALES
At constant scope and exchange rates, pure
aggregates sales and ready-mix concrete sales
in emerging markets increased 21% and 3%
like for like, respectively.
The strong pure aggregates sales increase was
driven by the marked positive trends in Poland
all along the year, while South Africa was down
5%. The ready mix concrete sales benefited
from higher volumes in Central and Eastern
Europe, Brazil and India, while South Africa
was mostly stable and Egypt down due to the
slowdown of infrastructure projects.
CURRENT OPERATING INCOME
Current operating income decreased by
43% to 33 million euros in 2011, as higher
volumes and price gains in some countries
only partially mitigated strong cost inflation
and lower earnings in Middle East and Africa.
4.3.4 Other (including holdings)
Sales
Sales from other operations, mainly comprised
of sales from our Gypsum activities in Middle
East and Africa, decreased to 82 million
euros in 2011 compared to 90 million euros
in 2010, mostly due to adverse foreign
exchange fluctuations.
Current operating income (loss)
Current operating loss of our other operations,
which notably includes central unallocated
costs and the results of our Gypsum operations
in Middle East and Africa was 26 million euros
in 2011 compared to a loss of 53 million
euros in 2010. Excluding a one time gain
for a pension curtailment of 66 million euros
in 2011, a net change in captive insurance
results of -20 million euros, and the gain from
a change in the pension indexation in the
United Kingdom in 2010, current operating
loss was 72 million euros for 2011 versus
73 million euros in 2010.
4.3.5 Consolidated operating income and consolidated net income
The table below shows our consolidated operating income and net income for the years ended December 31, 2011 and 2010:
2011 VARIATION 2011/2010 2010
(million euros) % (million euros)
CURRENT OPERATING INCOME 2,179 (8.9) 2,393
Net gains (losses) on disposals 45 0.0 45
Other operating income (expenses) (541) (78.0) (304)
OPERATING INCOME 1,683 (21.1) 2,134
Finance (costs) income (999) (40.3) (712)
Of which:
Finance costs (1,142) (8.2) (1,055)
Finance income 143 (58.3) 343
Share of net income (loss) of associates (8) 65.2 (23)
INCOME BEFORE INCOME TAX 676 (51.7) 1,399
Income tax (432) (41.6) (305)
NET INCOME FROM CONTINUING OPERATIONS 244 (77.7) 1,094
Net income from discontinued operations 492 nm 20
NET INCOME 736 (33.9) 1,114
Of which attributable to:
Owners of the parent company 593 (28.3) 827
Non-controlling interests 143 (50.2) 287
61Lafarge | Registration Document | 2011
4OPERATING AND FINANCIAL REVIEW AND PROSPECTS4.3 Results of operations for the fiscal years ended December 31, 2011 and 2010
Net gains (losses) on disposals were 45 million
euros in 2011, stable versus 2010, and mainly
include the gain of the divestment of our
operations in the South East of the United
States and our A&C business in Portugal.
Other operating expenses primarily reflect the
impact of impairments, restructuring, and
legal actions. They were 541 million euros
in 2011 versus 304 million euros in 2010.
This is mainly comprised of an impairment of
goodwill in Greece and United Arab Emirates
for a total of 285 million euros, given the
strained economic environment in those two
countries, accelerated depreciation of some
assets in Western Europe, restructuring costs
for 61 million euros in various locations, and
costs of on-going disposals. In 2010, the
Group recorded closure and impairment costs
of a paper plant in Sweden, the impairment of
assets located in Western Europe and South
Korea, and restructuring costs primarily in
Western Europe.
Operating income decreased by 21% to
1,683 million euros, from 2,134 million euros
in 2010.
Finance costs, comprised of financial expenses
on net debt, foreign exchange results and
other financial income and expenses, were
999 million euros versus 712 million euros
in 2010.
The financial expenses on net debt increased
10% from 766 million euros to 841 million
euros, reflecting the higher average cost of
debt. The decisions of Standard & Poor’s
and Moody’s to downgrade our credit rating
on March 17, 2011 and August 8, 2011
respectively, triggered step-up clauses on
certain of our bonds, increasing the rate
of interest to be paid. The impact of the
application of these step-up clauses was
21 million euros of additional financial costs
for 2011, and will be 65 million euros in 2012.
The average interest rate on our gross debt
was 5.7% in 2011, as compared to 5.3%
in 2010.
Foreign exchange resulted in a loss of
79 million euros in 2011 compared with a loss
of 24 million euros in 2010, mostly relating to
loans and debts denominated in currencies
for which no hedging market is available.
Other finance income and expenses included
the gain of the disposal of Cimpor shares
for 161 million euros in 2010. Excluding
this one-off item, other financial costs
slightly decreased from 83 million euros to
79 million euros, and mainly comprise bank
commissions and the amortization of debt
issuance costs.
The contribution from our associates
represented in 2011 a net loss of 8 million
euros, versus a loss of 23 million euros
in 2010.
Income tax increased to 432 million euros
in 2011 from 305 million euros in 2010.
The effective tax rate for 2011 increased to
63% from 21% in 2010, mostly reflecting the
non-deductibility of impairments of goodwill,
the one-off impact on the Egyptian deferred
tax position to reflect the newly applicable tax
rate and some other one-off elements such as
the impact of the divestment of our South East
US assets, while 2010 benefited from the non
taxable gain on the disposal of Cimpor shares.
Net income from continuing operations was
244 million euros versus 1,094 million euros
in 2010, mostly due to a significant impact
from impairments in 2011, a lower current
operating income, higher net financial
expenses, some one-time negative effects on
income tax and a difficult comparison basis
due to a one time gain of 161 million euros
relating to the sale of the investment in Cimpor
in 2010.
Net income from discontinued operations
increased to 492 million euros from 20 million
euros, with a net non-recurring gain of
466 million euros, mostly due the gain of
the divestments of our Gypsum operations in
Europe, South America, Asia and Australia.
Net income Group Share(1) decreased 28% to
593 million euros in 2011 from 827 million
euros in 2010.
2011 and 2010 were impacted by significant
one-off items. In 2011, they included a net
non-recurring gain of 466 million euros on
discontinued operations, and impairments
on goodwill for 285 million euros whereas
in 2010, they comprised the gain on the
disposal of Cimpor shares for 161 million
euros.
Non- controlling interests were 143 million
euros in 2011, halved versus 2010, under
the combined effect of lower volumes, notably
in Egypt and Jordan, and the one-off impact
of the increase in the Egyptian tax rate, with
a reevaluation of the opening deferred tax
position.
Basic earnings per share decreased 28% for
2011 to 2.07 euros, compared to 2.89 euros
in 2010, reflecting the decrease in net income
- attributable to the owners of the parent
company, while the average number of shares
was relatively stable at 286.5 million versus
286.1 million in 2010.
(1) Net income/loss attributable to the owners of the parent company.
Registration Document | 2011 | Lafarge62

OPERATING AND FINANCIAL REVIEW AND PROSPECTS
4
4.4 Liquidity and capital resources
4.4 Liquidity and c apital r esources
4.4.1 Group funding policies
Our Executive Committee establishes our
overall funding policies. The aim of these
policies is to safeguard our ability to meet
our obligations and to maintain a strong
financial structure. These policies take into
consideration our expectations concerning
the required level of leverage, coverage ratios,
the average maturity of debt, interest rate
exposure and the level of committed credit
lines. These targets are monitored on a regular
basis. As a result of these policies, a significant
portion of our debt has a long-term maturity.
We constantly maintain unused medium term
committed credit lines.
We are subject to foreign exchange risks
as a result of our subsidiaries’ transactions
in currencies other than their operating
currencies. Our general policy is for
subsidiaries to borrow and invest excess
cash in the same currency as their functional
currency. However, we encourage the
investment of excess cash balances in
US dollars or euros in emerging markets.
A portion of our subsidiaries’ debt funding
is borrowed at the parent company level
in foreign currencies or in euros and then
converted into foreign currencies through
currency swaps.
4.4.2 Cash flows
During the periods presented, our main
sources of liquidity were:
• cash provided by operating activities;
• cash provided by the divestment of assets;
• cash provided by the issuance of bonds and
commercial paper, of our share capital, and
set up of short and medium term credit lines.
COMPONENTS OF CASH FLOW
(million euros) 2011 2010 (1)
CASH FLOW FROM CONTINUING OPERATIONS 1,577 1,737 (2)
Changes in operating working capital items excluding financial expenses and income taxes 20 361
Net operating cash generated/(used) by continuing operations 1,597 2,098
Net operating cash generated/(used) by discontinued operations 22 74
Net operating cash generated/(used) by operations 1,619 2,172
Net cash provided by/(used in) investing activities from continuing operations 891 (1,186)
Net cash provided by/(used in) investing activities from discontinued operations (48) (58)
Net cash provided by/(used in) investing activities 843 (1,244)
Net cash provided by/(used in) financing activities from continuing operations (2,455) 59
Net cash provided by/(used in) financing activities from discontinued operations (74) (21)
Net cash provided by/(used in) financing activities (2,529) 38
INCREASE/(DECREASE) IN CASH AND CASH EQUIVALENTS (67) 966
(1) 2010 figures have been restated as mentioned in Note 3 (Significant events) to our consolidated financial statements following the disposal of Gypsum activities.
(2) Including the 338 million euros one-time payment for the Gypsum competition fine.
a) Net cash provided by operating activities
Net cash provided by continuing operating
activities was 1,597 million euros in 2011,
versus 2,098 million euros in 2010.
Excluding the non-recurring payment of the
Gypsum competition fine for 338 million
euros in July 2010, net cash provided by
the operations decreased 839 m illion euros,
reflecting the decrease of cash flows from
operations and the evolution of the change in
working capital requirements.
The decrease of cash flows from operations
primarily comes from the decrease in
operating earnings and higher income taxes
paid, notably in North America and because
of the progressive withdrawal of temporary tax
holidays in certain emerging countries.
Due to the particularly optimized level of
the working capital level at the end of 2010,
the working capital requirements were
stable at the end of December 2011 versus
December 2010 level, while it decreased by
361 m illion euros between December 2009
and December 2010. In 2011, we pursued
our actions to optimize our strict working
capital requirements* that further decreased 2
days to 31 days when expressed as a number
of days sales at the end of December 2011.
See Section 4.2.4 (Reconciliation of our
non-GAAP financial measures) for more
information on cash flow from operations.
b) Net cash provided by investing activities
Net cash provided by investing activities from
continuing operations was 891 million euros
in 2011, while in 2010, 1,186 million euros
were used by investing activities.
* Strict working capital requirements defined as trade receivables plus inventories less trade payables.
63Lafarge | Registration Document | 2011

4OPERATING AND FINANCIAL REVIEW AND PROSPECTS4.4 Liquidity and capital resources
Sustaining capital expenditures were
contained at 389 million euros in 2011
compared to 337 million in 2010.
Capital expenditures for the building of new
capacity decreased to 665 million euros from
914 million euros in 2010, and reflect mainly
major cement projects such as the extension
of our capacities in Eastern India, China and
Nigeria.
Including the acquisitions of ownership
interests with no gain of control, acquisitions
had a net impact of 145 million euros on our
net debt, versus 83 million euros in 2010.
Acquisitions of ownership interests with no
gain of control were 49 million euros in 2011,
excluding two third-party puts, already
recorded as debt, that were exercised in
the period (a 51 million euros third-party
put exercised in the first quarter, and a 111
million euros third-party put exercised in the
third quarter).
Net of debt disposed of, and including the
proceeds of the disposals of ownership
interests with no loss of control, the divestment
operations performed in 2011 have reduced,
net of selling costs the Group’s net financial
debt by 2,226 million euros (362 million euros
in 2010). In addition to the proceeds of the
sale of some minority interests, disposals
mainly comprise the proceeds of the sale our
Gypsum operations in Australia, Asia, Europe
and South America, the proceeds of the
divestment of our Cement and Concrete South
East US assets, the proceeds of the sale of our
Aggregates and concrete business in Portugal,
the third instalment of the divestment of
our Venezuelan operations and the sale of
industrial assets. In 2010, in addition to the
proceeds of the sale of the minority stake in
Lafarge Malayan Cement Berhad, disposals
mainly included the second instalment of the
divestment of our Venezuelan operations and
the sale of several industrial assets.
See Section 3.2.2 (Recent acquisitions,
partnerships and divestitures) for more
information.
c) Net cash used in financing activities
At December 31, 2011, the Group’s net
debt amounted to 11,974 million euros
(13,993 million euros at December 31, 2010).
This two billion euros net debt reduction
was achieved through the execution of our
divestment program, while net cash provided
by operating activities was used to fund
dividends and targeted investments.
In 2011, we continued to maintain a solid
liquidity position. Indeed, in addition to our
level of cash of 3,171 million euros, we
increased the level of unused committed
credit lines to 4.0 billion euros with an average
maturity of 2.2 years at December 31, 2011.
See Note 25 (Debt) to our consolidated
financial statements for more information on
our financing.
Long and medium term debt
In general, we meet our medium and long-
term financing needs through bond issues and
the use of long-term instruments, such as our
Euro Medium Term Notes (EMTN) program
and bank loans. Under our EMTN program,
we have a maximum available amount of
12,000 million euros of which 8,748 million
euros is used at December 31, 2011.
LONG AND MEDIUM-TERM DEBT SECURITIES ISSUANCES IN 2011 AND 2010
Lafarge S.A. has not issued any bond or other
related security in 2011, either under the
EMTN program or otherwise. On March 15,
2012, we issued a 50 million euros private
placement under our EMTN Program,
bearing a fixed interest rate of 5.25% with a
5-year maturity.
Under the EMTN Program
• on November 29, 2010, a 1,000 million
euros bond bearing a fixed interest rate of
5.375% with an 8-year maturity;
• on April 13, 2010, a 500 million euros bond
bearing a fixed interest rate of 5.000% with
an 8-year maturity.
Outside the EMTN Program
• on July 6, 2010, the Group placed a
550 million US dollars bond on the
American market, bearing a fixed interest
rate of 5.500% with a 5-year maturity.
PRINCIPAL DEBT REPAYMENTS IN 2011
• on July 15, 2011, Lafarge S.A. repaid a
600 million US dollars bond;
• on May 27, 2011, Lafarge S.A. repaid a
750 million euros bond.
Short term debt
Short-term needs are met mainly through
the use of bank loans, particularly on our
subsidiaries, the use of bank credit lines, the
issuance of domestic commercial paper, as
well as the use of our securitization programs.
We currently have a euro-denominated
commercial paper program, with a maximum
available amount of 3,000 million euros. At
December 31, 2011, 57 million euros in
commercial paper were outstanding under
this program.
We also currently have securitization
programs, for which detailed information is
given in Note 17 (Trade receivables) to our
consolidated financial statements.
Committed credit lines
In addition to credit lines set up for specific
purposes (as for the acquisition of Orascom
Cement), we maintain committed credit lines
with various banks (mainly at parent company
level) to ensure the availability of funding on
an as-needed basis. At December 31, 2011,
these committed credit lines amounted
to 4,023 million euros (compared with
3,852 million euros at December 31, 2010).
Of this amount, 4,010 million euros were
available at December 31, 2011 (compared
with 3,839 million euros at December 31,
2010). The average maturity of these credit
facilities was approximately 2.2 years at the
end of 2011 versus 2.7 years at the end
of 2010.
Cash and cash equivalents
Our cash and cash equivalents amounted to
3,171 million euros at year-end 2011, with
close to half of this amount denominated in
euros and the remainder in a large number of
other currencies.
Cash management
In order to ensure that cash surpluses are
used efficiently, we have adopted cash pooling
structures on a country-by-country basis in
a number of cases. We have established a
centralized cash management process for
most of the euro-zone countries, and we
have also extended the centralization of cash
management to significant European non-euro
countries (such as Hungary, Poland, Romania,
Switzerland and the United Kingdom). Local
Registration Document | 2011 | Lafarge64

OPERATING AND FINANCIAL REVIEW AND PROSPECTS
4
4.4 Liquidity and capital resources
cash pools have also been set up in other
parts of the Group.
Owing to legal or regulatory constraints or
national regulations, we do not operate a
fully global centralized cash management
program. However, the policies set by our
senior management tend to maximize cash
recycling within the Group. Where cash
cannot be recycled internally, cash surpluses
are invested in liquid, short-term instruments,
with at least half of any cash surplus invested
in instruments with a maturity of less than
three months.
Share capital
See Section 8.1 (Share capital), Note 15
(Net equity) to our statutory accounts and
Note 20 (Equity) to our consolidated financial
statements for information on the share capital
of Lafarge S.A.
4.4.3 Level of debt and financial ratios
See Note 25 (Debt) to our consolidated
financial statements for more information on
debt.
Total debt
On December 31, 2011, our total debt
amounted to 15,058 million euros (compared
with 17,013 million euros in 2010) excluding
put options on shares of subsidiaries and
impact of derivative instruments. At the end
of 2011, we reclassified 57 million euros of
short-term debt (724 million euros at the end
of 2010) as long-term debt on the basis of our
ability to refinance this obligation using the
available funding provided by medium and
long-term committed credit lines.
Long-term debt totalled 12,216 million euros at
year-end 2011 compared with 14,033 million
euros at year-end 2010. Approximately 40% of
the 2011 long-term debt is due to mature after
2016. Long-term debt mainly comprises fixed-
rate debt (after taking into account interest
rate swaps). Most of this debt is denominated
in euros, US dollars and British pounds.
At December 31, 2011, our short-term
debt (including the current portion of long-
term debt) amounted to 2,842 million euros
(compared with 2,980 million euros in 2010).
At December 31, 2011, the average spot
interest rate on our total debt after swaps was
6.2%, compared to 5.5% at December 31,
2010. The average annual interest rate
on debt after swaps was 5.7% in 2011
(compared with 5.3% in 2010). This average
interest rates increase in 2011 is mainly due
to the “step-up” impact following our credit
rating downgrade (see Section 4.4.4 - Rating).
See Section 2.1.2 (Financial and market
risks) and Notes 25 (Debt) and 26 (Financial
instruments) to our consolidated financial
statements for more information.
Net debt and net debt ratios
Our net debt, which includes put options
on shares of subsidiaries and derivative
instruments, totalled 11,974 million euros
at December 31, 2011 (compared with
13,993 million euros at December 31, 2010).
Our net-debt-to-equity ratio stood at 66% at
December 31, 2011 (compared with 77% at
December 31, 2010).
Our cash flow from operations to net debt
ratio stood at 13% at December 31, 2011
(compared with 12% at December 31, 2010,
including exceptional Gypsum competition
fine of 338 million euros).
See Section 4.2.4 (Reconciliation of our
non-GAAP financial measures) for more
information on these ratios.
Loan agreements
Some of our loan agreements contain
restrictions on the ability of subsidiaries
to transfer funds to the parent company in
certain specific situations. The nature of these
restrictions can be either regulatory, when the
transfers of funds are subject to approval by
local authorities, or contractual, when the loan
agreements include restrictive provisions,
such as negative covenants on the payment
of dividends. However, we do not believe that
any of these covenants or restrictions, which
relate to just a few loans, will have any material
impact on our ability to meet our obligations.
See Section 2.1.2 (Financial and market
risks).
At December 31, 2011, the financing
contracts of Lafarge S.A. do not contain any
financial covenants. A few of our subsidiaries’
loan agreements include such provisions.
These subsidiaries are located in the following
countries: Bangladesh, China, Ecuador,
India, Jordan, Nigeria, Pakistan, Qatar, Syria,
United Arab Emirates, United Kingdom and
Vietnam. Debt with such financial covenants
represents approximately 6% of the total
Group debt excluding put options on shares of
subsidiaries at December 31, 2011. For most
of them, these financial covenants have a low
probability of being triggered. Given the split
of these contracts on various subsidiaries and
the quality of the Group’s liquidity through its
access to committed credit lines, the existence
of such clauses cannot materially affect the
Group’s financial situation.
See Note 25 (e) (Debt) to our consolidated
financial statements.
4.4.4 Rating
Because we use external sources to finance a
significant portion of our capital requirements,
our access to global sources of financing
is important. The cost and availability of
unsecured financing are generally dependent
on our short-term and long-term credit
ratings. Factors that are significant in the
determination of our credit ratings or that
otherwise could affect our ability to raise
short-term and long-term financing include:
our level and volatility of earnings, our relative
positions in the markets in which we operate,
our global and product diversification, our risk
management policies and our financial ratios,
such as net debt to total equity and cash flow
from operations to net debt. We expect credit
rating agencies to focus, in particular, on our
ability to generate sufficient operating cash
flows to cover the repayment of our debt.
Deterioration in any of the previously stated
factors or a combination of these factors
may lead rating agencies to downgrade our
credit ratings, thereby increasing our cost of
obtaining unsecured financing. Conversely,
an improvement in these factors may prompt
rating agencies to upgrade our credit ratings.
65Lafarge | Registration Document | 2011

4OPERATING AND FINANCIAL REVIEW AND PROSPECTS4.4 Liquidity and capital resources
Since the previous filing, the credit ratings for our short and long-term debt evolved as follows:
12/31/2010 03/17/2011(1) 08/05/2011(2) 12/31/2011 03/13/2012(3)
S&P Short-term rating A-3 B B
Long-term rating
BBB-
(negative outlook)
BB+
(stable outlook)
BB+
(stable outlook)
BB+
(negative outlook)
Moody’s Short-term rating Not rated Not rated
Long-term rating
Baa3
(negative outlook)
Ba1
(stable outlook)
Ba1
(stable outlook)
(1) On February 23, 2011, the rating agency Standards & Poor’s Ratings Services placed our long-term credit rating BBB- and our short-term credit rating
A-3 under negative watch. On March 17, 2011, Standard & Poor’s Rating Services downgraded our long-term credit rating to BB+ (stable outlook) and our
short-term credit rating to B.
(2) On August 2, 2011, the rating agency Moody’s placed our long-term credit rating Baa3 under review for downgrade. On August 5, 2011, Moody’s
downgraded our long-term rating to Ba1 (stable outlook).
(3) On March 13, 2012, Standard & Poor’s Ratings Services revised its oultook on our longterm rating from stable to negative.
See Section 2.1.2 (a) (Financial risks - indebtedness) for information on the financial impact of changes to our credit ratings.
Registration Document | 2011 | Lafarge66

CORPORATE GOVERNANCE AND COMPENSATIONS
5.1 BOARD OF DIRECTORS - CORPORATE OFFICERS 685.1.1 Form of organization of the management –
Board of Directors – Chairman and Chief Executive
Offi cer – Vice-Chairman of the Board 68
5.1.2 Information on Directors 70
5.1.3 Independent Directors – Parity within the Board 83
5.1.4 Director’s charter 85
5.2 BOARD AND COMMITTEE RULES AND PRACTICES 865.2.1 Board of Directors 86
5.2.2 Board of Directors’ Committees 87
5.2.3 Self-assessment by the Board, Committees,
Chairman and Chief Executive Offi cer 91
5.2.4 Summary table on the attendance at Board
and Committee meetings 92
5.2.5 Powers of the Chairman and Chief Executive Offi cer 93
5.3 EXECUTIVE OFFICERS 94
5.4 COMPENSATIONS AND BENEFITS 955.4.1 Compensations paid to Directors – Director’s fees 95
5.4.2 Compensation and benefi ts paid to the Chairman
and Chief Executive Offi cer 96
5.4.3 Total compensation of the Chairman and Chief
Executive Offi cer and Executive Offi cers in 2011
and 2010, pension and other retirement benefi ts 99
5.5 LONG-TERM INCENTIVES (STOCK-OPTIONS AND PERFORMANCE SHARE PLANS) 995.5.1 Grant policy – Performance conditions
and holding rule 99
5.5.2 Stock-option plans 101
5.5.3 Performance share plans 104
5.6 SHARE OWNERSHIP 1065.6.1 Directors, Chairman and Chief Executive Offi cer
and Executive Offi cers share ownership 106
5.6.2 Trading in Lafarge shares by Directors, Chairman
and Chief Executive Offi cer and Executive Offi cers 106
5.7 IMPLEMENTATION OF THE PRINCIPLE “COMPLY OR EXPLAIN” OF THE AFEP-MEDEF CODE 106
5
67Lafarge | Registration Document | 2011

5CORPORATE GOVERNANCE AND COMPENSATIONS5.1 Declaration in terms of corporate governance – Governance Code of reference
68
Declaration in terms of corporate governance – Governance Code of reference
The Code of Corporate Governance which
the Company refers to is the “Code of the
Corporate Governance of Listed Corporations”
published by the Afep (Association française
des entreprises privées) and the Medef
(Mouvement des entreprises de France),
named the “Afep-Medef Code”.
This Code, which is available online on
www.code-afep-medef.com, consolidates
the various corporate governance principles
and recommendations of the Afep and the
Medef in its December 2008 version. It was
recently modified in April 2010 to incorporate
recommendations for an increased
participation of women on Boards of Directors.
The Lafarge Board of Directors considers
that the recommendations of the Afep-Medef
Code are in line with the corporate governance
principles of the Company.
In accordance with the Afep-Medef Code,
companies which refer to this Code must state
in their Registration Document how these
recommendations have been implemented
and explain, if need be, the reasons why they
have not been complied with fully. If relevant,
such explanations regarding compliance
by Lafarge will be mentioned in the present
Chapter 5.
See Section 5.7 (Implementation of the
principle “comply or explain” of the Afep-
Medef Code).
5.1 Board of Directors - Corporate Officers
At present, the Board of Directors of Lafarge
consists of 17 members with various
complementary profiles and experience. Its
composition has been modified during the
2011 financial year as a result of the following
events:
• Mr Pierre de Lafarge and Mr Michel
Pébereau did not ask for the renewal of
their offices as Directors upon expiry of their
offices at the end of the General Meeting of
May 12, 2011;
• the General Meeting of May 12, 2011
approved the nomination of Mr Baudouin
Prot as a Director and re-appointed Mr
Philippe Dauman as a Director, both
of which are classified as independent
Directors;
• at its meeting of November 3, 2011, the
Board of Directors decided to co-opt Mr
Ian Gallienne as a Director of Lafarge, in
remplacement of Mr Gérald Frère further
to the latter’s resignation, for the remaining
term of his office (namely until the gathering
of the General Meeting called to approve the
2011 financial statements).
Several Board members have held positions
within the Group or have had professional
dealings with the Group and therefore have a
good understanding of the Group’s activities.
Other Directors are not as close to our business
and bring to the table other experience, a
global understanding of business matters
and the ability to benchmark the Group’s
activities against practices and standards in
other industries.
In accordance with the Director’s Charter,
each Board member must carry out his duties
with full independence of mind. Proposals
for the election of a new Director when their
nomination is on the agenda, are made by
the Corporate Governance and Nominations
Committee.
According to the Company’s Articles of
Association, the Directors are appointed for
a 4-year office term.
Mr Bruno Lafont is the only Board member
exercising executive functions within the
Group.
Directors must not be over 70 years old, and
each Director must hold a minimum of 1,143
shares of the Company.
There is no Director representing either the
employee shareholders or the employees.
See Section 8.5 (Articles of Association)
(statuts) for more information on the rules
governing the Board of Directors.
5.1.1 Form of organization of the management – Board of Directors – Chairman and Chief Executive Officer – Vice-Chairman of the Board
Chairman of the Board and Chief Executive Officer
At its May 3, 2007 meeting, and further to
the recommendations of the Remunerations
Committee, the Lafarge Board of Directors
resolved that it was in the best interest of the
Company to unify the functions of Chairman
of the Board and Chief Executive Officer. On
the same date, it decided to confer these
functions to Mr Bruno Lafont.
This type of governance is very common in
French issuing companies with a Board of
Directors. It is deemed appropriate given the
organization and operating mode of Lafarge,
and complies with the prerogatives of each
governing body (General Meetings, Board of
Directors, Executive Officers), in particular
regarding control of Group’s activity.
The Board’s internal regulations ensure
compliance with corporate governance
best practices in the framework of such
governance structure, in particular through
the election of a Vice-Chairman of the Board
(Lead Independent Director).
Registration Document | 2011 | Lafarge68

CORPORATE GOVERNANCE AND COMPENSATIONS
5
5.1 Board of Directors - Corporate Officers
See Section 5.2.5 (Powers of the Chairman
and Chief Executive Officer) for further
information regarding the powers of the
Chairman and Chief Executive Officer and
their limitations.
Vice-Chairman of the Board (Lead Independent Director)
This office is currently held by Mr Oscar
Fanjul.
In accordance with its internal regulations,
which were last amended on this particular
topic at the February 16th, 2012 Board
meeting, the Board elects a Vice-Chairman of
the Board (Lead Independent Director) from
amongst the Directors who are classified as
independent for a one-year renewable term of
office upon recommendation by the Corporate
Governance and Nominations Committee.
He is elected at the Board of Directors meeting
following the annual shareholders’ meeting of
the Company.
The Vice-Chairman of the Board is a
member of the Corporate Governance
and Nominations Committee and of the
Remuneration Committee.
He chairs meetings of the Board in the
absence of the Chairman and Chief Executive
Officer and, in particular, chairs the Board
of Directors’ discussions at least once per
year to assess the performance and set the
remuneration of the Chairman and Chief
Executive Officer, such discussions taking
place in the absence of the latter.
Likewise, should he consider it necessary,
the Vice-Chairman may arrange, in advance
of the meeting of the Board of Directors
during which the assessment of the Board is
scheduled to take place, a separate meeting
of the independe nt Directors to consult on,
coordinate and facilitate the communication
of any recommendations by these Directors.
More generally, as provided for in the Articles
of Association (Article 16), a meeting of the
Board may be convened and then chaired by
the Vice- Chairman if the Chairman and Chief
Executive Officer is unavailable.
Since the agenda of Board meetings is
prepared in conjunction with the Vice-
Chairman, the Chairman and Chief Executive
Officer will send him a draft version before
convening the meeting. Where appropriate
after consulting with the other Committee
Chairmen, the Vice-Chairman may propose
adding further points to this agenda. The Vice-
Chairman may also propose convening an
unscheduled meeting of the Board of Directors
to the Chairman and Chief Executive Officer to
consider a particular issue, the importance or
urgent nature of which would justify holding
such an exceptional meeting.
Such requests may not be dismissed without
good reason.
On an annual basis, the Vice-Chairman draws
up and presents to the Board an activity report
helping it to assess the performance of his
role and duties, particularly with regard to
monitoring all the corporate governance-
related issues in conjunction with the
Chairman and Chief Executive Officer, and the
use made of his prerogatives. The principal
findings of this report can be incorporated
in the description of corporate governance
published in the Registration Document.
As part of this role of monitoring corporate
governance-related issues, the Vice-
Chairman’s duties include coordinating within
the Corporate Governance and Appointments
Committee the proper implementation
of procedures to identify, analyze and
provide information about situations that
could possibly fall within the scope of the
management of conflicts of interest within
the Board of Directors.
69Lafarge | Registration Document | 2011

5CORPORATE GOVERNANCE AND COMPENSATIONS5.1 Board of Directors - Corporate Officers
5.1.2 Information on Directors
The table below outlines the respective management experience and expertise of the Directors.
Presentation of the Directors – Expertise and experience
BRUNO LAFONTBRUNO LAFONT(born on June 8, 1956)
French citizen
BUSINESS ADDRESS:
61, rue des Belles Feuilles, 75116 Paris, France
NUMBER OF LAFARGE SHARES HELD:
24,006
EXPERIENCE AND EXPERTISE
Chairman of the Board of Directors and Chief Executive Officer
Bruno Lafont was appointed as Chairman of the Board of Directors in May 2007. He has held the office of Director since May 2005 and Chief
Executive Officer since January 1, 2006. He graduated from the Hautes Études Commerciales business school (HEC 1977, Paris) and the École
Nationale d’Administration (ENA 1982, Paris). He began his career at Lafarge in 1983 and held various positions in finance and international
operations. In 1995, Mr Lafont was appointed Group Executive Vice-President, Finance, then Executive Vice-President of the Gypsum Division
in 1998. Mr Lafont joined the Group’s General Management as Chief Operating Officer between May 2003 and December 2005. He also acts
as Director for EDF and ArcelorMittal (Luxembourg).
POSITION (APPOINTMENT/RENEWAL/EXPIRY OF TERM OF OFFICE)
Appointment as Director of Lafarge in 2005. Expiry of his term of office after the General Meeting called to approve the 2012 financial statements.
Chief Executive Officer since January 2006. Chairman and Chief Executive Officer since May 2007.
POSITIONS HELD IN FRANCE AND ABROAD OVER THE LAST FIVE YEARS
CURRENT POSITIONS: OVER THE LAST FIVE YEARS THAT HAVE ENDED, IN FRANCE
AND INTERNATIONAL:
In France:
Director, Chairman and Chief Excutive Officer of Lafarge (listed
company)
Director of EDF (listed company)
Abroad:
Director of ArcelorMittal (Luxemburg) (listed company)
Positions in various subsidiaries of the Group:
Director of Lafarge India Private Limited (India)
Director of Lafarge Shui On Cement Limited (China)
Abroad:
Positions in various subsidiaries of the Group
Registration Document | 2011 | Lafarge70

CORPORATE GOVERNANCE AND COMPENSATIONS
5
5.1 Board of Directors - Corporate Officers
OSCAR FANJULOSCAR FANJUL(born on May 20, 1949)
Spanish citizen
BUSINESS ADDRESS:
Paseo de la Castellana, 28-5, ES-28046 Madrid, Spain
NUMBER OF LAFARGE SHARES HELD:
6,193
EXPERIENCE AND EXPERTISE
Vice-Chairman of the Board and Director, member of the Corporate Governance and Nominations Committee, member of the Remunerations Committee
Oscar Fanjul was appointed to the Lafarge Board of Directors in 2005 and has been Vice-Chairman of the Board since August 1, 2007. He
began his career in 1972 working for the industrial holding I.N.I. (Spain), then acted as Chairman Founder and Chief Executive Officer and
Founder of Repsol (Spain) until 1996. He acts as Chairman of Deoleo, S.A. (Spain) and Vice-Chairman of Omega Capital, SL (Spain). Oscar
Fanjul also is a Director of Marsh & McLennan Companies (United States) and Acerinox (Spain).
POSITION (APPOINTMENT/RENEWAL/EXPIRY OF TERM OF OFFICE)
Appointment as Director of Lafarge in 2005. Expiry of his term of office after the General Meeting called to approve the 2012 financial statements.
POSITIONS HELD IN FRANCE AND ABROAD OVER THE LAST FIVE YEARS
CURRENT POSITIONS: OVER THE LAST FIVE YEARS THAT HAVE ENDED, IN FRANCE
AND INTERNATIONAL:
In France:
Director and Vice-Chairman of the Board of Lafarge (listed company)
Abroad:
Vice-Chairman of Omega Capital (Spain)
Director of Marsh & McLennan Companies (USA) (listed company)
Director of Acerinox (Spain) (listed company)
Chairman of Deoleo, S.A. (Spain) (listed company)
In France
Director of Areva (listed company) until 2011
Abroad:
Director of Unilever (United Kingdom) (listed company)
Director of Colonial (Spain) (listed company)
Director of the London Stock Exchange (United Kingdom)
(listed company)
MICHEL BONMICHEL BON(born on July 5, 1943)
French citizen
BUSINESS ADDRESS:
86, rue Anatole-France, 92300 Levallois-Perret, FranceNUMBER OF LAFARGE SHARES HELD:
6,800
EXPERIENCE AND EXPERTISE
Director, member of the Audit Committee, member of the Strategy, Investment and Sustainable Development Committee
Michel Bon was appointed to the Lafarge Board of Directors in 1993. He is Chairman of the Supervisory Board of Devoteam and Éditions du
Cerf. He is also a Director of Sonepar and senior adviser to Roland Berger and Vermeer Capital. He previously served as Chairman and Chief
Executive Officer of France Telecom from 1995 to 2002, and Chief Executive Officer then Chairman and Chief Executive Officer of Carrefour
from 1985 to 1992.
POSITION (APPOINTMENT/RENEWAL/EXPIRY OF TERM OF OFFICE)
Appointment as Director of Lafarge in 1993. Expiry of his term of office after the General Meeting called to approve the 2012 financial statements.
POSITIONS HELD IN FRANCE AND ABROAD OVER THE LAST FIVE YEARS
CURRENT POSITIONS: OVER THE LAST FIVE YEARS THAT HAVE ENDED, IN FRANCE
AND INTERNATIONAL:
In France:
Director of Lafarge (listed company)
Director of Sonepar
Chairman of the Supervisory Board of Éditions du Cerf
Chairman of the Supervisory Board of Devoteam (listed company)
Abroad:
Director of SONAE (Portugal)
In France:
Director of Provimi until 2010
Director of Editis until 2009
Censor of Asterop until 2008
Director of Banque Transatlantique until 2007
Abroad:
Director of Myriad (Switzerland) until 2011
Director of Cie Européenne de Téléphonie (Luxembourg) until 2011
71Lafarge | Registration Document | 2011

5CORPORATE GOVERNANCE AND COMPENSATIONS5.1 Board of Directors - Corporate Officers
PHILIPPE CHARRIERPHILIPPE CHARRIER(born on August 2, 1954)
French citizen
BUSINESS ADDRESS:
60-62, rue d’Hauteville, 75010 Paris, France
NUMBER OF LAFARGE SHARES HELD:
5,382
EXPERIENCE AND EXPERTISE
Director, member of the Remunerations Committee, member of the Strategy, Investment and Sustainable Development Committee
Philippe Charrier was appointed to the Lafarge Board of Directors in 2005. He acts as President of Labco, Chairman of the Board of Directors
of Alphident and Dental Emco S.A. He is also a Founder member of the Club Entreprise et Handicap and a Director of Rallye. He is President
of the association Cap’ Cités established in 2010 and President of the Clubhouse established in 2011. He was Vice-President, Chief Executive
Officer and Director of Œnobiol from 2006 to 2010 and Chairman and Chief Executive Officer of Procter & Gamble France from 1999 to
2006. He joined Procter & Gamble in 1978 and held various financial positions before serving as Chief Financial Officer from 1988 to 1994,
Marketing Director in France from 1994 to 1996, and Chief Operating Officer of Procter & Gamble Morocco from 1996 to 1998.
POSITION (APPOINTMENT/RENEWAL/EXPIRY OF TERM OF OFFICE)
Appointment as Director of Lafarge in 2005. Expiry of his term of office after the General Meeting called to approve the 2012 financial statements.
POSITIONS HELD IN FRANCE AND ABROAD OVER THE LAST FIVE YEARS
CURRENT POSITIONS: OVER THE LAST FIVE YEARS THAT HAVE ENDED, IN FRANCE
AND INTERNATIONAL:
In France:
Director of Lafarge (listed company)
President of Labco
Chairman of the Board of Directors of Alphident and Dental Emco S.A.
(subsidiary of Alphident)
Director of Rallye (listed company)
Director and Vice-president of the UNAFAM
In France:
Vice-President, Chief Executive Officer and Director of Œnobiol
from 2006 to 2010
Chairman of the Supervisory Board of Spotless Group until 2010
Chairman of Entreprise et Progrès until 2009
Chairman and Chief Executive Officer of Procter & Gamble in France
from 1999 to 2006
BERTRAND COLLOMBBERTRAND COLLOMB(born on August 14, 1942)
French citizen
BUSINESS ADDRESS:
61, rue des Belles Feuilles, 75116 Paris, France
NUMBER OF LAFARGE SHARES HELD:
112,942
EXPERIENCE AND EXPERTISE
Director and Honorary Chairman
Bertrand Collomb was appointed to the Lafarge Board of Directors in 1987 and served as Chairman and Chief Executive Officer from 1989 to
2003 and Chairman of the Board of Directors from 2003 to 2007. He previously held various executive positions with the Group, namely in
North America, from 1975 to 1989 and in the French Ministry of Industry and government cabinets from 1966 to 1975. He is a Director of
Total, Atco Ltd. (Canada) and DuPont (US). He is also a Chairman of the Institut des hautes études for Science and Technology and member
of the Executive Committee of the European Institute of Innovation and Technology. He is a member of the Institut de France and Deputy
Chairman of the “Académie des sciences morales et politiques”.
POSITION (APPOINTMENT/RENEWAL/EXPIRY OF TERM OF OFFICE)
Appointment as Director of Lafarge in 1987. Expiry of his term of office after the General Meeting called to approve the financial statements
for 2011, in accordance with the Articles of Association of Lafarge governing the Directors’ age limit. Honorary Chairman of Lafarge.
POSITIONS HELD IN FRANCE AND ABROAD OVER THE LAST FIVE YEARS
CURRENT POSITIONS: OVER THE LAST FIVE YEARS THAT HAVE ENDED, IN FRANCE
AND INTERNATIONAL:
In France:
Director of Lafarge (listed company)
Director of Total (listed company)
Abroad:
Director of Atco Ltd. (Canada) (listed company)
Director of DuPont (USA) (listed company)
Abroad:
Positions in various subsidiaries of the Group until 2007
Registration Document | 2011 | Lafarge72

CORPORATE GOVERNANCE AND COMPENSATIONS
5
5.1 Board of Directors - Corporate Officers
PHILIPPE DAUMANPHILIPPE DAUMAN(born on March 1, 1954)
American citizen
BUSINESS ADDRESS:
1515 Broadway, New York, NY 10036, USA
NUMBER OF LAFARGE SHARES HELD:
1,143
EXPERIENCE AND EXPERTISE
Director, member of the Corporate Governance and Nominations Committee, member of the Strategy, Investment and Sustainable Committee,
Philippe Dauman was appointed to the Lafarge Board of Directors in May 2007. He has been President and Chief Executive Officer of
Viacom Inc. (US) since September 2006. He was previously Joint Chairman of the Board and Managing Director of DND Capital Partners
LLC (US) from May 2000. Before creating DND Capital Partners, Philippe Dauman was Vice-Chairman of the Board of Viacom from 1996
to May 2000, Executive Vice-President from 1995 to May 2000, and Chief Counsel and Secretary of the Board from 1993 to 1998. Prior to
that, he was a partner in New York law firm Shearman & Sterling. He served as Director of Lafarge North America from 1997 to 2006. He is
currently a Director of Viacom Inc. and National Amusements Inc. (US), a member of the Dean’s Council for the University of Columbia Law
School, a member of the Business Roundtable (US), a member of the Executive Committee of the National Cable & Telecommunications
Association (US), and Vice-president of the Partnership for New York (US). He is also a member of the Board of Kipp Foundation (US), a
member of The Paley Center for Media’s Council (US), and a member of the Executive Committee of Lenox Hill Hospital (US).
POSITION (APPOINTMENT/RENEWAL/EXPIRY OF TERM OF OFFICE)
Appointment as Director of Lafarge in 2007. Expiry of his term of office after the General Meeting called to approve the 2014 financial statements.
POSITIONS HELD IN FRANCE AND ABROAD OVER THE LAST FIVE YEARS
CURRENT POSITIONS: OVER THE LAST FIVE YEARS THAT HAVE ENDED, IN FRANCE
AND INTERNATIONAL:
In France:
Director of Lafarge (listed company)
Abroad:
Director, President and Chief Executive Officer of Viacom Inc. (USA)
(listed company)
Director of National Amusements Inc. (USA) (listed company)
PAUL DESMARAIS, JR.PAUL DESMARAIS, JR.(born on July 3, 1954)
Canadian citizen
BUSINESS ADDRESS:
751, Square Victoria, Montreal, Quebec H2Y 2J3, Canada
NUMBER OF LAFARGE SHARES HELD:
6,715
EXPERIENCE AND EXPERTISE
Director, member of the Strategy, Investment and Sustainable Development Committee
Paul Desmarais, Jr. was appointed to the Lafarge Board of Directors in January 2008. He has been Chairman and Co-Chief Executive Officer
of Power Corporation of Canada (PCC) since 1996 and Co-Chief Executive Office and Chairman of the Board of Power Financial Corporation
(PFC). Prior to joining PCC in 1981, he was at SG Warburg & Co. in London and Standard Brands Incorporated in New York. He was President
and Chief Operating Officer of PFC from 1986 to 1989 and Chairman from 1990 to 2005. He is a Director and member of the Executive
Committee of many Power group companies in North America. He is also Executive Director and Vice-Chairman of the Board of Pargesa
Holding S.A. (Switzerland), and a Director of Groupe Bruxelles Lambert (Belgium), Total S.A. and GDF-Suez (France). Paul Desmarais, Jr.
is Chairman of the Board of Governors of the International Economic Forum of the Americas, Founder and Chairman of the International
Advisory Committee of the école des Hautes Études Commerciales (HEC) in Montreal and Founder and member of the International Advisory
Board of the McGill University Faculty of Management. He is a member of the International Council and a Director of the INSEAD, and one of
the trustees and Vice-president of the Brookings Institution (Washington, US). Paul Desmarais, Jr. is a member of the Economic Consultative
Council directed by minister Flaherty (Canada), member of the Board of the Trudeau Foundation, Vice-Chairman of the Board and member
of the Executive Committee of the CCCE (Conseil canadien des chefs d’entreprise). He is also member of the Honorary Council of the Peres
Center for peace, member of the “National Strategy Concil” of the Mazankowski Alberta Heart Institute, member of the BAC and Co-President
of the national campaign for the preservation of nature in Canada (NCC). Paul Desmarais, Jr. studied at McGill University where he obtained
a Bachelor’s degree in Commerce. He then graduated from the European Institute of Business Administration (INSEAD) in Fontainebleau,
France, with an MBA.
POSITION (APPOINTMENT/RENEWAL/EXPIRY OF TERM OF OFFICE)
Appointment as Director of Lafarge in 2008. Expiry of his term of office after the General Meeting called to approve the 2011 financial statements.
The renewal of his term of office will be proposed at the Shareholders General Meeting to be held on May 15, 2012.
73Lafarge | Registration Document | 2011

5CORPORATE GOVERNANCE AND COMPENSATIONS5.1 Board of Directors - Corporate Officers
PAUL DESMARAIS, JR.PAUL DESMARAIS, JR.(born on July 3, 1954)
Canadian citizen
BUSINESS ADDRESS:
751, Square Victoria, Montreal, Quebec H2Y 2J3, Canada
NUMBER OF LAFARGE SHARES HELD:
6,715
POSITIONS HELD IN FRANCE AND ABROAD OVER THE LAST FIVE YEARS
CURRENT POSITIONS: OVER THE LAST FIVE YEARS THAT HAVE ENDED, IN FRANCE
AND INTERNATIONAL:
In France:
Director of Lafarge (listed company)
Director of Total S.A. (listed company)
Director of GDF-Suez (listed company)
Abroad:
Chairman of the Board and Co-Chief Executive Officer of Power
Corporation of Canada (listed company)
Co-Chief Executive Officer and Director of Power Financial Corporation
(Canada) (listed company)
Vice-Chairman of the Board of Directors and Deputy Managing Director
of Pargesa Holding (Switzerland) (listed company)
Director and member of the Executive Committee of Great-West,
Compagnie d’assurance-vie (Canada)
Director and member of the Executive Committee of Great-West Life &
Annuity Insurance Company (USA)
Director and member of the Executive Committee of Great-West
Lifeco Inc. (Canada) (listed company)
Director and member of the Executive Committee of Groupe Bruxelles
Lambert S.A. (Belgium) (listed company)
Director and member of the Executive Committee of Groupe
Investors Inc. (Canada)
Director and member of the Executive Committee of London Insurance
Group Inc. (Canada)
Director and member of the Executive Committee of London Life
Compagnie d’assurance-vie (Canada)
Director and member of the Executive Committee of Mackenzie Inc.
(Canada) (listed company)
Director and member of the Executive Committee of Canada Life
Assurance Company (Canada)
Director and member of the Executive Committee of Canada Life
Financial Corporation (Canada)
Director and member of the Executive Committee of Canada Life Capital
Corporation (Canada)
Director and member of the Executive Committee of Power Corporation
International (Canada)
Director and Vice-president of the Board of Square Victoria
Communications Group Inc. (Canada)
Director and member of the Executive Committee of Crown Life
Insurance Company (Canada)
Director and member of the Executive Committee of IGM Financial Inc.
(Canada)
Member of the Supervisory Board of Parjointco N.V. (Netherlands)
Director of Gesca Ltée (Canada)
Director of La Presse Ltée (Canada)
Director of Power Communications Inc. (Canada)
Member of the Board of Directors of Putnam Investments LLC (USA)
Director of Power Financial B.V. (Netherlands)
In France:
Vice-Chairman of the Board of Imérys (listed company)
Member of the International Advisory Board of the Group La Poste
Abroad:
Director of GWL Properties (Canada) until 2007
Director of Les Journaux Trans-Canada (1996) Inc. (Canada)
Registration Document | 2011 | Lafarge74

CORPORATE GOVERNANCE AND COMPENSATIONS
5
5.1 Board of Directors - Corporate Officers
JUAN GALLARDOJUAN GALLARDO(born on July 28, 1947)
Mexican citizen
BUSINESS ADDRESS:
Monte Caucaso 915 - 4 piso, Col. Lomas de Chapultepec C.P.,
MX 11000 Mexico, Mexico
NUMBER OF LAFARGE SHARES HELD:
1,500
EXPERIENCE AND EXPERTISE
Director, member of the Audit Committee, member of the Corporate Governance and Nominations Committee, member of the Remunerations Committee
Juan Gallardo was appointed to the Lafarge Board of Directors in 2003. He has been Chairman of Grupo Embotelladoras Unidas S.A. de
C.V. (Mexico) since 1985. He is the Chairman of Grupo Azucarero Mexico S.A., a Director of IDEA S.A. and Caterpillar Inc. (USA). He is a
member of the Mexican Business Roundtable. He was previously a member of the International Advisory Council of Lafarge, the Chairman
of the Fondo Mexico, Vice-President of Home Mart Mexico and Director of Grupo Mexico S.A. de C.V. (Mexico).
POSITION (APPOINTMENT/RENEWAL/EXPIRY OF TERM OF OFFICE)
Appointment as Director of Lafarge in 2003. Expiry of his term of office after the General Meeting called to approve the 2012 financial statements.
POSITIONS HELD IN FRANCE AND ABROAD OVER THE LAST FIVE YEARS
CURRENT POSITIONS: OVER THE LAST FIVE YEARS THAT HAVE ENDED, IN FRANCE
AND INTERNATIONAL:
In France:
Director of Lafarge (listed company)
Abroad:
Chairman of the Board of Directors of Grupo Embotelladoras
Unidas, S.A. de C.V. (Mexico) (listed company)
Chairman of Grupo Azucarero Mexico S.A. (Mexico) (listed company)
Director of IDEA S.A. (Mexico)
Director of Caterpillar Inc. (USA) (listed company)
In France:
Member of the International Advisory Board of Textron Inc.
(listed company)
Abroad:
Director of Mexicana de Aviacion (Mexico) until 2010
Director of Grupo Mexico S.A. de C.V. (Mexico) (listed company)
75Lafarge | Registration Document | 2011

5CORPORATE GOVERNANCE AND COMPENSATIONS5.1 Board of Directors - Corporate Officers
IAN GALLIENNEIAN GALLIENNE(born on January 23, 1971)
French citizen
BUSINESS ADDRESS:
Avenue Marnix 24, 1000 Bruxelles, Belgium NUMBER OF LAFARGE SHARES HELD:
1,143
EXPERIENCE AND EXPERTISE
Director, member of the Remunerations Committee
Ian Gallienne was appointed as a Director by the Board of Directors of Lafarge on November 3, 2011. Ian Gallienne is Managing Director of
Groupe Bruxelles Lambert (Belgium) since January 1, 2012. He has a degree in Management and Administration, with a specialization in
Finance, from the E.S.D.E. in Paris and an MBA from INSEAD in Fontainebleau. He began his career in Spain, in 1992, as co-founder of a
commercial company. From 1995 to 1997, he was a member of management of a consulting firm specialised in the reorganization of ailing
companies in France. From 1998 to 2005, he was Manager of the private equity funds Rhône Capital LLC in New York and London. From 2005
to 2012, he founded and served as Managing Director of the private equity funds Ergon Capital Partners, Ergon Capital Partners II and Ergon
Capital Partners III in Brussels. He has been a Director of Groupe Bruxelles Lambert (Belgium) since 2009 and of Imerys (France) since 2010.
POSITION (APPOINTMENT/RENEWAL/EXPIRY OF TERM OF OFFICE)
Cooptation as a Director of Lafarge in 2011. Expiry of his term of office after the General Meeting called to approve the 2011 financial statements.
The ratification of his cooptation by the Board of Directors and the renewal of his term of office will be proposed at the Shareholders General
Meeting to be held on May 15, 2012.
POSITIONS HELD IN FRANCE AND ABROAD OVER THE LAST FIVE YEARS
CURRENT POSITIONS: OVER THE LAST FIVE YEARS THAT HAVE ENDED, IN FRANCE
AND INTERNATIONAL:
In France:
Director of Lafarge (listed company)
Director of Imerys (listed company)
Director of PLU Holding S.A.S
Abroad:
Managing Director of Ergon Capital Partners S.A. (Belgium), Ergon
Capital Partners II S.A. (Belgium) and Ergon Capital Partners III S.A.
(Belgium)
Director of Ergon Capital S.A. (Belgium)
Director of Steel Partners N.V. (Belgium)
Director of Gruppo Banca Leonardo SpA (Italy)
Managing Director of Egerton S.à r.l (Luxemburg) and Ergon Capital II
s.à r.l (Luxemburg)
Managing Director of Groupe Bruxelles Lambert S.A (Belgium)
(listed company)
In France:
Director of Central Parc Villepinte S.A (until July 31, 2011)
Director of EliTech Group S.A.S (until December 31, 2011)
Director of the “Fonds de dotations du Palais”
Abroad:
Director of Arno Glass S.A (Luxemburg) until June 1, 2009
Director of La Gardenia Beauty SpA (Italy) until December 31, 2011
Director of Seves Spa (Italy) until December 31, 2011
Director of Groupe De Boeck S.A (Belgium) until December 31, 2011
Registration Document | 2011 | Lafarge76

CORPORATE GOVERNANCE AND COMPENSATIONS
5
5.1 Board of Directors - Corporate Officers
JÉRÔME GUIRAUDJÉRÔME GUIRAUD(born on January 7, 1961)
French citizen
BUSINESS ADDRESS:
4 Cork street, London W1S 3LB, United KingdomNUMBER OF LAFARGE SHARES HELD:
3,948
EXPERIENCE AND EXPERTISE
Director, member of the Audit Committee
Jérôme Guiraud was appointed to the Lafarge Board of Directors in 2008. He graduated from Hautes Études Commerciales (HEC 1984 – Paris).
Jérôme Guiraud started his career at the French Embassy in Zagreb (Croatia) in 1985 as Deputy to the Attaché Commercial. He joined the
Société Générale group, at the Inspection Générale, department in 1986. From 1993 he has held various managing positions abroad, in Europe
and in emerging countries on capital markets, then as Country Manager and Director of the Société Générale group’s listed subsidiaries. He
joined the NNS group in 2008. He is currently a Director Chief Executive Officer of NNS Capital and a Director and Audit Committee’s member
of Orascom Construction Industries (significant construction and in fertilizer company, listed on London, N.Y. and Cairo stock exchanges).
POSITION (APPOINTMENT/RENEWAL/EXPIRY OF TERM OF OFFICE)
Appointment as Director of Lafarge in 2008. Expiry of his term of office after the General Meeting called to approve the 2011 financial statements.
The renewal of his term of office will be proposed at the Shareholders General Meeting to be held on May 15, 2012.
POSITIONS HELD IN FRANCE AND ABROAD OVER THE LAST FIVE YEARS
CURRENT POSITIONS: OVER THE LAST FIVE YEARS THAT HAVE ENDED, IN FRANCE
AND INTERNATIONAL:
In France:
Director of Lafarge (listed company)
Abroad:
Director Chief Executive Officer of NNS Capital (United Kingdom)
Director of Orascom Construction Industries S.A.E (Egypt)
(listed company)
Abroad:
Chairman of the Executive Board of Société Générale Marocaine de
Banque (Morocco) and Director of Morocco subsidiaries of the Groupe
Société Générale from 2004 to 2008 (Morocco)
Director of Maphars (Morocco subsidiary of Sanofi-Aventis) from 2006
to 2008
Director of JET4YOU (Morocco subsidiary of TUI) from 2006 to 2008
77Lafarge | Registration Document | 2011

5CORPORATE GOVERNANCE AND COMPENSATIONS5.1 Board of Directors - Corporate Officers
COLETTE LEWINERCOLETTE LEWINER(born on September 19, 1945)
French citizen
BUSINESS ADDRESS:
Tour Europlaza-La Défense 4, 20 avenue André Prothin, 92927
Paris-La Défense, France
NUMBER OF LAFARGE SHARES HELD:
1,653
EXPERIENCE AND EXPERTISE
Director, member of the Strategy, Investment and Sustainable Development Committee
Colette Lewiner was appointed to the Lafarge Board of Directors in 2010. She is currently Vice-President at Capgemini, and Global Leader of the
“Energy, Utilities & Chemicals” sector that she created in 1998 when she joined the Group. She is also non executive Chairman of TDF. She is also
Director of Bouygues, Colas (Groupe Bouygues), Eurotunnel, Nexans and TGS Nopec (Norway). From 1992 to 1998, she was Chairman and CEO
of SGN-Réseau Eurisys, a subsidiary of Cogema (Areva group). From 1979 to 1992, Colette Lewiner held various positions within the EDF Group,
at the Research & Development department, and then at the fuel procurement department that she managed in 1987. In 1989, she created the
Development and Commercial Strategy Division and became the first woman Executive Vice-President at EDF. Colette Lewiner is also a member
of the French Academy of Technologies and of the European Union Advisory Group on Energy. After entering the École normale supérieure and
graduating as a Doctor in Physics (PhD), she started her career as an Associate Professor and Researcher at the Denis Diderot University in Paris.
POSITION (APPOINTMENT/RENEWAL/EXPIRY OF TERM OF OFFICE)
Appointment as Director of Lafarge in 2010. Expiry of her term of office after the General Meeting called to approve the 2013 financial
statements.
POSITIONS HELD IN FRANCE AND ABROAD OVER THE LAST FIVE YEARS
CURRENT POSITIONS: OVER THE LAST FIVE YEARS THAT HAVE ENDED, IN FRANCE
AND INTERNATIONAL:
In France:
Director of Lafarge (listed company)
Director of Nexans (listed company)
Director of Bouygues (listed company)
Director of Colas (Groupe Bouygues)
Director of Eurotunnel
Chairman of TDF (SAS)
Abroad:
Director of TGS-Nopec (Norway) (listed company)
In France:
Director of La Poste until May 2011
Abroad:
Director of Ocean Rig (Norway) until 2010
Registration Document | 2011 | Lafarge78

CORPORATE GOVERNANCE AND COMPENSATIONS
5
5.1 Board of Directors - Corporate Officers
HÉLÈNE PLOIXHÉLÈNE PLOIX(born on September 25, 1944)
French citizen
BUSINESS ADDRESS:
162, rue du Faubourg-Saint-Honoré, 75008 Paris, FranceNUMBER OF LAFARGE SHARES HELD:
1,971
EXPERIENCE AND EXPERTISE
Director, member of the Audit Committee
Hélène Ploix was appointed to the Lafarge’s Board of Directors in 1999. Hélène Ploix is Chairman of Pechel Industries SAS and Pechel Industries
Partenaires SAS. She is also Chairman of FSH SAS. She was previously Deputy Chief Executive Officer of Caisse des Dépôts et Consignations
(France) and Chairman and Chief Executive Officer of CDC Participations from 1989 to 1995, Chairman of the Caisse Autonome de
Refinancement and Chairman of the Supervisory Board of CDC Gestion. She previously served as Special Counsel for the single currency
at KPMG Peat Marwick from 1995 to 1996 and as Director of Alliance Boots plc (UK) from 2000 to July 2007. She is a member of the
Supervisory Board of Publicis Groupe, a non-executive Director of BNP Paribas, Ferring S.A. (Switzerland), Sofina (Belgium) and, as Pechel
Industries Partenaires’ permanent representative, she is also a Director of SES (Store Electronic System) and member of the Supervisory
Board of other non-listed companies.
POSITION (APPOINTMENT/RENEWAL/EXPIRY OF TERM OF OFFICE)
Appointment as Director of Lafarge in 1999. Expiry of her term of office after the General Meeting called to approve the 2012 financial
statements.
POSITIONS HELD IN FRANCE AND ABROAD OVER THE LAST FIVE YEARS
CURRENT POSITIONS: OVER THE LAST FIVE YEARS THAT HAVE ENDED, IN FRANCE
AND INTERNATIONAL:
In France:
Director of Lafarge (listed company)
Director of BNP Paribas (listed company)
Member of the Supervisory Board of Publicis Groupe (listed company)
Director of SES (Store Electronic Systems ) ( representing Pechel
Industries Partenaires)
Chairman of Pechel Industries SAS
Chairman of Pechel Industries Partenaires SAS
Chairman of FSH SAS
Director of Ypso Holding S.A. (as legal representative of Pechel
Industries Partenaires)
Manager of Hélène Ploix SARL
Manager of HMJ (Hélène Marie Joseph) SARL
Manager of Sorepe Société Civile
Member of the Supervisory Board of Goëmar Développement (as
permanent representive of Pechel Industries Partenaires SAS)
Member of the Supervisory Board of Laboratoires Goëmar (as
permanent representive of Pechel Industries Partenaires SAS)
Abroad:
Director of Ferring S.A. (Switzerland)
Director of Sofina (Belgium)
Managing Director of Goëmar Holding (Luxemburg) – representing
Pechel Industries Partenaires
In France:
Chairman of Pechel Services SAS
Various positions as Director in relation with her position in Pechel
Industries Partenaires (Xiring, Quinette Gallay, CVGB-Dourthe
Kressman S.A., HFR6 S.A., SVP Management et Participations S.A.)
Abroad:
Director of Alliance Boots plc (United Kingdom) from 2000 to 2007
Director of Completel NV (Netherlands) (end of the term of office
December 31, 2010)
79Lafarge | Registration Document | 2011

5CORPORATE GOVERNANCE AND COMPENSATIONS5.1 Board of Directors - Corporate Officers
BAUDOUIN PROTBAUDOUIN PROT(born on M ay 24, 1951)
French citizen
BUSINESS ADDRESS:
3 rue d’Antin, 75002 Paris, FranceNUMBER OF LAFARGE SHARES HELD:
1,250
EXPERIENCE AND EXPERTISE
Director, member of the Strategy, Investment and Sustainable Development Committee and member of the Corporate Government and Nomi-nations Committee
Baudouin Prot has been appointed as Director of Lafarge in 2011. He is Chairman of BNP Paribas since December 2011. After graduating
from the French business school HEC in 1972 and from ENA in 1976, Baudouin Prot joined the French Ministry of Finance where he stayed
for four years. He then became Deputy Director of Energy and Raw Materials at the French Ministry of Industry for three years. He joined
BNP in 1983 as Deputy Director of the intercontinental branch of Banque Nationale de Paris and became Director for Europe in 1985. In
1987, he joined the Central Networks Department, was promoted to Central Director in 1990, and became Executive Vice President of BNP
in charge of networks in 1992. Baudouin Prot was appointed Chief Executive Officer of BNP in 1996 and Chief Operating Officer (Directeur
général délégué) of BNP Paribas in 1999. In May 2000, he was appointed Director and Chief Operating Officer (Directeur général délégué)
of BNP Paribas, and became Director and Chief Executive Officer of the bank in May 2003.
POSITION (APPOINTMENT/RENEWAL/EXPIRY OF TERM OF OFFICE)
Appointment as Director of Lafarge in 2011. Expiry of his term of office after the General Meeting called to approve the 2014 financial statements.
POSITIONS HELD IN FRANCE AND ABROAD OVER THE LAST FIVE YEARS
CURRENT POSITIONS: OVER THE LAST FIVE YEARS THAT HAVE ENDED, IN FRANCE
AND INTERNATIONAL:
In France:
Director of Lafarge (listed company)
Chairman of BNP Paribas (listed company)
Director of Pinault-Printemps-Redoute (listed company)
Director of Veolia Environnement (listed company)
Abroad:
Director of Erbé SA (Belgium)
Director of Pargesa Holding SA (Switzerland) (listed company)
In France:
Director of Accor (from January 2006 to February 2009) (listed
company)
Chairman of the “Fédération Bancaire Française” (from
September 2009 to August 2010)
Abroad:
Director of BNL S.p.A (Italy) (from February 2007 to
September 2008)
Registration Document | 2011 | Lafarge80

CORPORATE GOVERNANCE AND COMPENSATIONS
5
5.1 Board of Directors - Corporate Officers
MICHEL ROLLIERMICHEL ROLLIER(born on September 19, 1944)
French citizen
BUSINESS ADDRESS:
23, place des Carmes-Déchaux, 63000 Clermont-Ferrand, France
NUMBER OF LAFARGE SHARES HELD:
1,758
EXPERIENCE AND EXPERTISE
Director, member of the Audit Committee, member of the Corporate Governance and Nominations Committee
Michel Rollier was appointed to the Lafarge Board of Directors in 2008. He has been Managing Partner of the Compagnie Générale des
Établissements Michelin since May 2005. He graduated from the Institut d’études politiques (1967) and the Université de Droit of Paris
(1968). He previously held several positions with Aussedat-Rey (International Paper Group) starting in 1971, including controller until 1982,
Unit Operational Manager from 1982 to 1987, Chief Financial Officer between 1987 and 1994 and Deputy Managing Director from 1994
to 1996. Michel Rollier joined Michelin as Chief Legal Officer and Head of Financial Operations. He was appointed member of the Michelin
Group Executive Council and Chief Financial and Legal Officer in 1999.
POSITION (APPOINTMENT/RENEWAL/EXPIRY OF TERM OF OFFICE)
Appointment as Director of Lafarge in 2008. Expiry of his term of office after the General Meeting called to approve the 2011 financial statements.
The renewal of his term of office will be proposed at the Shareholders General Meeting to be held on May 15, 2012.
POSITIONS HELD IN FRANCE AND ABROAD OVER THE LAST FIVE YEARS
CURRENT POSITIONS: OVER THE LAST FIVE YEARS THAT HAVE ENDED, IN FRANCE
AND INTERNATIONAL:
In France:
Director of Lafarge (listed company)
Managing Partner of the Compagnie Générale des Établissements
Michelin (listed company)
Abroad:
Managing Partner of la Compagnie Financière Michelin (Switzerland)
In France:
Director of Moria (until September 2011)
THIERRY DE RUDDERTHIERRY DE RUDDER(born on September 3, 1949)
Belgian citizen
BUSINESS ADDRESS:
Avenue Marnix 24, 1000 Bruxelles, BelgiumNUMBER OF LAFARGE SHARES HELD:
10,842
EXPERIENCE AND EXPERTISE
Director, member of the Audit Committee, member of the Remunerations Committee
Thierry de Rudder was appointed to the Lafarge Board of Directors in January 2008. He is a graduate in Mathematics from the University
of Geneva and the Université Libre de Bruxelles and has an MBA from Wharton School (Philadelphia, USA). Thierry de Rudder starts his
carreer in the United-States at Citibank in 1975 where he helds various positions in New York and Europe. He is currently Vice-Chairman of
the Board of Director and Chairman of the Permanent Committee of Groupe Bruxelles Lambert which he joined in 1986 and was Director
until December 2011. He is also Director of Electrabel (Belgium) and GDF-Suez (France).
Gérald Frère and Thierry de Rudder are brothers-in-law.
POSITION (APPOINTMENT/RENEWAL/EXPIRY OF TERM OF OFFICE)
Appointment as Director of Lafarge in 2008. Expiry of his term of office after the General Meeting called to approve the 2011 financial statements.
POSITIONS HELD IN FRANCE AND ABROAD OVER THE LAST FIVE YEARS
CURRENT POSITIONS: OVER THE LAST FIVE YEARS THAT HAVE ENDED, IN FRANCE
AND INTERNATIONAL:
In France:
Director of Lafarge (listed company)
Director of GDF-Suez (listed company)
Abroad:
Vice-Chairman of the Board and Chairman of the Permanent Committee
of Groupe Bruxelles Lambert (Belgium)
Director of Electrabel (Belgium)
In France:
Director of Total S.A. (listed company)
Director of Imerys until 2010 (listed company)
Abroad:
Various positions as Director in relation with his position in the Groupe
Bruxelles Lambert (GBL Finance SA until 2009 and Immobilière Rue
de Namur until 2007, GBL Participations until 2010)
Director of Suez-Tractebel S.A. (Belgium) until 2010
81Lafarge | Registration Document | 2011

5CORPORATE GOVERNANCE AND COMPENSATIONS5.1 Board of Directors - Corporate Officers
NASSEF SAWIRISNASSEF SAWIRIS(born on January 19, 1961)
Egyptian citizen
BUSINESS ADDRESS:
61, rue des Belles Feuilles, 75116 Paris, France
NUMBER OF LAFARGE SHARES
HELD: 1,671 (this figure does
not take into account the
shares owned by NNS Holding
Sàrl) (See Section 6 – Major
shareholders)
EXPERIENCE AND EXPERTISE
Director, member of the Remunerations Committee, member of the Strategy, Investment and Sustainable Development Committee
Nassef Sawiris was appointed to the Lafarge Board of Directors in January 2008. Nassef Sawiris is the major shareholder, Chairman and
the Chief Executive Officer of Orascom Construction Industries (OCI), currently the largest listed company on the Egyptian Stock Exchange.
Mr Sawiris joined the Orascom Group in 1992 and became the Chief Executive Officer of Orascom Construction Industries in 1998 ahead of
its initial public offering, which was successfully completed in 1999. He leads the company in devising its investment strategies. He led the
establishment of its cement business, investments in natural gas industries and significant geographic expansion of the construction group.
Through investment in complementary business, Mr Sawiris has grown the family business into an international corporation. He is also a
Director of the BESIX Group (Belgium) and of NNS holding, a privately-owned investment group in Luxembourg and a Director of the Dubai
international Financial Exchange (Nasdaq DIFC). He joined Citigroup’s international Adisory Board in 2010. Nassef Sawiris holds a BA in
Economics from the University of Chicago, USA.
POSITION (APPOINTMENT/RENEWAL/EXPIRY OF TERM OF OFFICE)
Appointment as Director of Lafarge in 2008. Expiry of his term of office after the General Meeting called to approve the 2011 financial statements.
The renewal of his term of office will be proposed at the Shareholders General Meeting to be held on May 15, 2012.
POSITIONS HELD IN FRANCE AND ABROAD OVER THE LAST FIVE YEARS
CURRENT POSITIONS: OVER THE LAST FIVE YEARS THAT HAVE ENDED, IN FRANCE
AND INTERNATIONAL:
In France:
Director of Lafarge (listed company)
Abroad:
Chairman and Chief Executive Officer of Orascom Construction
Industries S.A.E (OCI) (Egypt) (listed company)
Director of Besix (Belgium)
Director of NNS Holding (Luxembourg)
Director of Nasdaq DIFX (Dubai International Stock Exchange) (United
Arab Emirates)
Director and General Manager of several subsidiaries of OCI Group
(Egypt)
Chairman of Lafarge Cement Egypt (Egypt) and positions in various
subsidiaries of the Group
Abroad:
Director of OBMH (Orascom Building Material Holding S.A.E)
Director of the Caire and Alexandria Stock Exchange from 2004 to 2007
Registration Document | 2011 | Lafarge82

CORPORATE GOVERNANCE AND COMPENSATIONS
5
5.1 Board of Directors - Corporate Officers
VÉRONIQUE WEILLVÉRONIQUE WEILL(born on September 16, 1959)
French citizen
BUSINESS ADDRESS:
25, avenue Matignon, 75008 Paris, France
NUMBER OF LAFARGE SHARES HELD:
1,200
EXPERIENCE AND EXPERTISE
Director, member of the Audit Committee
Véronique Weill was appointed to the Lafarge Board of Directors in 2010. Madam Weill is currently Chief Operating Officer of the AXA group,
in charge of Marketing, Distribution, IT, Operational Excellence, Procurement and GIE AXA since December 10, 2009. Since January 1, 2009,
she is a member of the Executive Committee of the AXA group. Véronique Weill joined AXA in June 2006 as a Chief Executive Officer of AXA
Business Services and Group Executive Vice-President of Operational Excellence. In January 2008, she was appointed Executive Vice-President
IT and Operational Excellence of the group, including the worldwide management of the companies AXA Technology Services, AXA Group
Solutions, AXA Business Services and transversal departments AXA Way Group (Group strategy of operational excellence and service quality)
and Group IS (Group IT Strategy). Véronique Weill is also a member of the Scientific Board of the AXA Research Fund. She had previously
spent more than 20 years at JP Morgan and has notably served as Group head of Operations for Business Banking and global head of IT &
Operations for Asset Management and Private Clients. Véronique Weill graduated from the Institut d’Etudes Politiques of Paris and from the
Université la Sorbonne (Licence de Lettres).
POSITION (APPOINTMENT/RENEWAL/EXPIRY OF TERM OF OFFICE)
Appointment as Director of Lafarge in 2010. Expiry of her term of office after the General Meeting called to approve the 2013 financial
statements.
POSITIONS HELD IN FRANCE AND ABROAD OVER THE LAST FIVE YEARS
CURRENT POSITIONS: OVER THE LAST FIVE YEARS THAT HAVE ENDED, IN FRANCE
AND INTERNATIONAL:
In France:
Director of Lafarge (listed company)
Chairman of the Board of AXA Group Solutions (SA)
Chairman and member of the Supervisory Board of GIE AXA Group Solutions
Chairman and member of the Executive Committee, AXA Technology Services (SAS)
Abroad:
Director of AXA Business Services Privates Ltd. (India)
In France:
Chief Executive Officer of AXA Business Services
Sanctions applicable to the Directors
To the Company’s knowledge, no Director was, over the previous five years, convicted of fraud, involved in a bankruptcy, receivership or
liquidation, subject to official public incrimination and/or sanctions, or disqualified by a court from acting as Director or in management or
conducting the affairs of any issuer.
5.1.3 Independent Directors – Parity within the Board
Independence
DIRECTORS QUALIFIED AS INDEPENDENT
Michel Bon Colette Lewiner
Philippe Charrier Hélène Ploix
Philippe Dauman Baudouin Prot
Oscar Fanjul Michel Rollier
Juan Gallardo Véronique Weill
Percentage of independent Directors: 59%
DIRECTORS NON-QUALIFIED AS INDEPENDENT/JUSTIFICATION
Bruno Lafont Corporate officer of Lafarge – Chairman and CEO.
Bertrand Collomb
Former Chairman and Chief Executive Officer of Lafarge, as well as former
corporate officer of various companies within the Group during the last
five years.
Paul Desmarais, Jr. – Thierry de Rudder – Ian Gallienne
Connected to Group Brussels Lambert, a shareholder holding more than
10% of the capital and voting rights of the Company.
Jérôme Guiraud - Nassef Sawiris
Connected to NNS Holding Sàrl, a shareholder holding more than 10% of
the capital and voting rights of the Company.
83Lafarge | Registration Document | 2011
5CORPORATE GOVERNANCE AND COMPENSATIONS5.1 Board of Directors - Corporate Officers
In accordance with the recommendations of
the Afep-Medef Code and the Board’s internal
regulations, the Board regularly reviews
the situation of the Directors in light of the
independence criteria.
The Board of Directors, after an individual
assessment of each Director’s situation in
light of the independence criteria applicable
to the Company, considers that ten Directors,
out of the seventeen members of the Board,
are independent, corresponding to 59% of the
Board being independent Directors.
In accordance with the recommendations
of the Afep-Medef Code, the Board’s
internal regulations provide that a majority
of the members of the Board, the Corporate
Governance and Nominations Committee and
the Remuneration Committee must qualify as
“independent” and that at least two-thirds of
the members of the Audit Committee must
qualify as “independent”.
The Board of Directors considers that the
composition of the Board and its Committees
is compliant with its internal regulations.
The formal non-qualification as “independent
Director” in no way challenges the
professionalism or freedom of judgment that
characterize all Directors.
See Section 5.2.2 (Board of D irectors’
Committees) for more information on the
involvement of Independent Directors in the
Committees.
Independence criteria
The Board of Directors has applied the
following recommendations of the Afep-
Medef Code in its assessment of independent
Directors:
• not to be an employee or Corporate
Officer of the Company, or an employee or
Director of its parent or a company that it
consolidates and not having been in such a
position over the previous five years;
• not to be a Corporate Officer of a company
in which the Company holds a directorship,
directly or indirectly, or in which an
employee appointed as such or a Corporate
Officer of the Company (currently in office
or having held such office going back five
years) is a Director;
• not to be a customer, supplier, investment
banker or commercial banker:
– that is material for the Company or its
group,
– or for a signifi cant part whose business
the Company or its group accounts;
• not to be related by close family ties to a
Corporate Officer;
• not to have been an auditor of the Company
over the previous five years;
• not to have been a Director of the Company
for more than twelve years;
• finally, as regards to Board members
representing shareholders holding 10% or
more of the capital or voting rights of the
Company, the Afep-Medef Code provides
that the Board should systematically
examine their qualifications as independent
Directors. The Lafarge’s Directors linked to
the Company’s two major shareholders
(Groupe Bruxelles Lambert and NNS
Holding) are not qualified as independent
Directors.
The Board of Directors did not apply the
recommended 12-year limitation on length
of service as Director. The Board considers
that in a long-term business such as ours,
where management is stable, serving as
Director for a long period of time can bring
more experience and authority, increasing the
Directors’ independence. Mr Michel Bon and
Mrs Héléne Ploix have served as Directors of
Lafarge for over 12 years.
Materiality tests on business relationships between the Company and its Directors
During the annual review of the classification
of Directors as independent, the Corporate
Governance and Nominations Committee
as well as the Board of Directors, during its
meeting on February 16, 2012, conducted
materiality tests on business relationships
between the Company and some of its
Directors. These tests consists in verifying
that the value of transactions between the
Company and one of its Directors or a company
with which such Director is associated (as
customer, supplier, investment banker or
commercial banker) does not exceed specific
thresholds, which have been set in advance,
of the Group’s revenues, equity, assets or debt.
In particular, the Board reviewed the
relationship between Lafarge and BNP
Paribas, one of the Group’s corporate and
investment banks, of which Baudouin Prot
is Chairman. Lafarge can rely on a pool of
competitive banks preventing the likelihood of
a relationship of dependency on BNP Paribas.
Likewise, the fees that BNP Paribas receives
from the Group account for an infinitesimal
percentage of the bank’s revenues and do
not create a relationship of dependency
for Lafarge. In addition, the results of the
materiality test show that the value of the
committed credit facilities of BNP Paribas
towards the Group represents less than 5% of
the Group’s gross debt, while the value of the
transactions between the Company and BNP
Paribas is less than 1% of the revenues, less
than 10% of the equity and less than 5% total
assets of both the Group and BNP Paribas.
In the light of these factors, and given the
independent thinking that Baudouin Prot has
shown in his capacity as Director, the Board
considers him to be an independent Director.
The Board of Directors also conducted
materiality tests on the business relationships
existing between the Company and Capgemini,
of which Colette Lewiner is Vice-President, and
the Company and AXA, of which Véronique
Weill is Group Chief Operating Officer. The
results of these tests showed in both instances
that the value of the transactions between the
Company and Capgemini or AXA is less than
1 % of the revenues, less than 10% of the
equity and less than 5% of the total assets of
the Group, Capgemini and AXA. The Board
of Directors therefore resolved to classify
Mrs Colette Lewiner and Véronique Weill as
independent Directors. The same conclusion
applies to Michel Rollier, managing partner
of Michelin.
Management of conflicts of interests
As provided in the Lafarge Director’s Charter, a
Director is required to inform the Board of any
situation involving a conflict of interests, even
one of a potential nature, and must refrain
from taking part in any vote on any resolution
of the Board where he finds himself in any
such situation.
The Charter also provides that Directors are
required to inform the Chairman promptly
of any relations that may exist between the
companies in which they have a direct interest
and the Company. The Directors must also,
in particular, notify the Chairman of any
agreement covered by article L. 225-38 et seq.
of the French Commercial Code that either
they themselves, or any company of which
they are Directors or in which they either
directly or indirectly hold a significant number
of shares, have entered into with the Company
or any of its subsidiaries. These provisions do
Registration Document | 2011 | Lafarge84

CORPORATE GOVERNANCE AND COMPENSATIONS
5
5.1 Board of Directors - Corporate Officers
not apply to agreements made in the ordinary
course of business.
See the Special Report of the statutory
auditors on related-party agreements and
committments on page F 94 .
The internal regulations of the Board of
Director specify that the Vice-Chairman’s
duties include, as part of his role of
monitoring corporate governance-related
issues, coordinating within the Corporate
Governance and Nominations Committee
the proper implementation of procedures
to identify, analyze and provide information
about situations that could possibly fall within
the scope of the management of conflicts of
interest within the Board.
On the number of corporate offices held
by Directors, the internal regulations of the
Board of Director provide that the Corporate
Governance and Nominations Committee and
the Board of Directors must give their prior
approval before the Chief Executive Officer
accepts a corporate office of a listed company
that does not belong to the Group.
In addition, all Directors certify on an annual
basis the existence, or absence, of specific
items and indicate that there are no potential
conflicts of interests between their duties as
a Director and their private interests or other
duties.
To the best of Lafarge’s knowledge, there are
no conflicts between the duties of the Group
Board members and their private interests
and other duties.
Lafarge has not entered into service contracts
providing for the granting of future benefits.
Parity
The proportion of women elected to the Board
is 18%, with three women out of 17 members
composing the Board of Directors.
As part of its work on the Board’s composition,
and with the support of the Corporate
Governance and Nominations Committee,
the Board of Directors is aiming at increasing
the number of women on the Board by 2013.
5.1.4 Director’s charter
The full text of the Lafarge Director’s Charter
is set out below.
Preamble
In accordance with the principles of corporate
governance, a Director carries out his duties
in good faith, in such a manner as, in his
opinion, best advances the interests of the
Company, applying the care and attention
expected of a normally careful person in the
exercise of such office.
1. COMPETENCE
Before accepting office, a Director must
ascertain that he is acquainted with the
general and specific obligations assigned to
him. He must, in particular, acquaint himself
with legal and statutory requirements, the
Company articles of association (statuts),
current internal rules and any supplementary
information that may be provided to him by
the Board.
2. DEFENDING CORPORATE INTEREST
A Director must be an individual shareholder
and hold the number of Company shares
required by the articles of association (statuts),
i.e., a number representing in total a nominal
value of at least 4,572 euros which amounts
to 1,143 shares, recorded in the share register
in nominal form.
Every Director represents the body of
shareholders and must in all circumstances
act in their interest and in that of the Company.
3. CONFLICTS OF INTEREST
A Director is required to inform the Board of
any situation involving a conflict of interests,
even one of a potential nature, and must
refrain from taking part in any vote on any
resolution of the Board where he finds himself
in any such situation.
4. DILIGENCE
A Director must dedicate the necessary time
and attention to his office, while respecting the
legal requirements governing the accumulation
of several appointments. He must be diligent
and take part, unless impeded from doing
so for any serious reason, in all meetings
of the Board and, where necessary, in any
Committee to which he may belong.
5. INFORMATION – CONFIDENTIALITY
A Director is bound by obligation to keep
himself informed to be able to contribute in a
useful manner on the issues under discussion
on the Board agenda.
With regard to information outside of the public
domain and which he has acquired while in
office, a Director must consider himself bound
by a duty of confidentiality, which goes beyond
the simple obligation to maintain discretion as
provided for by law.
6. TRAINING
Every Director may, in particular at the
time of his election to the Board and where
he deems it necessary, take advantage of
training on specific aspects of the Company
and the Group, its business activities, field of
activity, organization and particular financial
circumstances.
7. LOYALTY
A Director is bound by an obligation of loyalty.
He must not, under any circumstances,
do anything liable to damage the interests
of the Company or those of any of the
other companies in the Group. He may not
personally take on any responsibilities, within
any undertakings or businesses having any
activity competing with those of Lafarge
without first notifying the Board of Directors
thereof.
8. PRIVILEGED INFORMATION – TRADING IN SHARES
A Director must not carry out any transactions
involving Company shares except within the
framework of the rules determined by the
Company. He must make a statement to
Lafarge concerning any transactions involving
Lafarge shares carried out by him within five
days of any such transaction.
9. INDEPENDENCE
A Director undertakes, in all circumstances,
to maintain his independence of thought,
judgment, decision and action and will resist
all pressure, whatever the nature or origin.
A Director undertakes to refrain from seeking
or accepting from the Company, or any
other company linked to it, either directly
or indirectly, any personal benefits likely to
be deemed to be of such a nature as might
compromise his freedom of judgment.
10. AGREEMENTS IN WHICH DIRECTORS HAVE AN INTEREST
The Directors are required to inform the
Chairman promptly of any relations that may
exist between the companies in which they
have a direct interest and the Company.
The Directors must also, in particular, notify
the Chairman of any agreement covered
by article L. 225-38 et seq. of the French
Commercial Code that either they themselves,
or any company of which they are Directors
or in which they either directly or indirectly
hold a significant number of shares, have
entered into with the Company or any of its
subsidiaries. These provisions do not apply
to agreements made in the ordinary course
of business.
85Lafarge | Registration Document | 2011

5CORPORATE GOVERNANCE AND COMPENSATIONS5.2 Board and Committee rules and practices
11. INFORMATION OF DIRECTORS
The Chairman ensures that the Directors
receive in a timely manner, the information
and documents needed to perform the full
extent of their duties. Similarly, the Chairman
of each of the said Committees ensures that
every member of his Committee has the
information needed to perform his duties.
Prior to every meeting of the Board (or of every
Committee), the Directors must thus receive in
a timely manner a file setting out all the items
on the agenda. Any Director who was unable
to vote because he was not fully apprised of
the issue has to inform the Board and insist
on receiving the critical information. Generally,
every Director receives all the information
necessary to perform his duties and may
arrange to have all the relevant documents
delivered to him by the Chairman. Similarly,
the Committee Chairmen must supply the
members of the Board, in a timely manner,
with the reports they have prepared within the
scope of their duties.
The Chairman ensures that members of the
Board are apprised of all the principal relevant
items of information, including any criticism
concerning the Company, in particular, any
articles of press or financial research reports.
Meetings, during which any Director may
make presentations and discuss with the
Directors his field of activity, are held on a
regular basis by the Chairman during or
outside Board meetings.
Every Director is entitled to request from the
Chairman the possibility of special meetings
with Group management in the fields of
interest to them, without his presence.
5.2 Board and Committee rules and practices
5.2.1 Board of Directors
Indicators
Number of meetings in 2011 7
Average attendance rate in 2011 93%
Number of Directors* 17
Percentage of independent Directors* 59% (10 out of 17)
* Information as of the date of this Registration Document
Duties and r esponsibilities
In accordance with law and Lafarge’s
articles of association, the Board of Directors
determines the strategic direction of the
Company’s operations and supervises the
implementation of such strategy. Subject
to the powers expressly granted by law to
Shareholders’ Meetings and within the scope
of the Company’s corporate purpose, the
Board is vested with the power to deliberate
and take decisions on any matter relating to
the operations and business of the Company.
The Board can conduct any audits and
investigations as it deems appropriate.
The Board of Directors is also granted
specific powers by law, such as the calling
of Shareholders’ Meetings, the approval
of statutory and consolidated financial
statements, the approval of management
reports, the authorization of “regulated
agreements”, the appointment of Directors
in case of vacancy, the appointment of the
Chairman and Chief Executive Officer and the
power to set the Chief Executive Officer’s and
the Directors’ compensation.
It is a collegial body representing all the
shareholders collectively, and is required to
act at all times in the interests of the Company.
Board’s internal regulations
The Board’s internal regulations define the
respective roles and duties of the Chairman
and Chief Executive Officer and of the Vice-
Chairman of the Board of Directors, the
restrictions to the powers of the Chairman
and Chief Executive Officer, the composition of
the Board of Directors and its Committees, as
well as the responsibilities of the various Board
Committees. The internal regulations also
specify the applicable rules for the evaluation
of the Chairman and Chief Executive Officer,
of the Board of Directors and of the Board
Committees. They are amended on a regular
basis to take into account changes to the
Company’s organization and to keep in line
with the best governance practice in the
market.
As regards the information presented to
the Board, the Board’s internal regulations
state that “at each meeting of the Board, the
Chairman and Chief Executive Officer will
give a summary of the Company’s business
during the previous period and of its financial
situation, cash flow position and commitments.
In addition, the Chairman and Chief Executive
Officer will make a presentation of the main
development projects in progress, and,
depending on their state of advancement,
of the principal industrial and financial data
relating to such projects.” In addition, the
Director’s Charter presented in Section 5.1.4
describes in its article 11 the terms for the
information for Directors. In particular, it
provides that Directors are apprised of the
financial research reports.
See Section 5.1 (Board of Directors-C orporate
O fficers).
Cases where prior approval of the Board
is required for significant investments,
divestments or financial transactions are
described in the Board’s internal regulations.
They are presented in Section 5.2.5 relating
to the limitations of the Chairman and Chief
Executive Officer’s powers.
See Section 5.2.5 (Powers of the Chairman
and Chief Executive Officer).
Main a ctivities
Approximately one week prior to every
Board meeting, every Director receives a
file containing the agenda for the meeting,
the minutes of the previous meeting and
documentation relating to each topic on the
agenda.
Registration Document | 2011 | Lafarge86

CORPORATE GOVERNANCE AND COMPENSATIONS
5
5.2 Board and Committee rules and practices
In accordance with the Board’s internal
regulations, certain topics, depending on their
nature, are first discussed within the relevant
Committees before being submitted to the
Board for approval. These mainly relate to:
the review of financial statements, internal
control procedures, auditor assignments and
financial transactions for the Audit Committee;
the election of new Directors, the appointment
of senior managers and the composition of
the Committees as regards the Corporate
Governance and Nominations Committee;
Directors and senior managers’ compensation
as regards the Remuneration Committee and
general strategic priorities of the Company and
the Group for the Strategy, Investment and
Sustainable Development Committee. The
Committees carry out their duties under the
supervision of the Board of Directors.
In 2011, in addition to the approval of the
quarterly, interim and annual financial
statements, the composition of the Board
and its Committees, the assessment
of the independence of the Directors,
the preparation of the General Meeting,
determination of the compensation of the
Chairman and Chief Executive and other
decisions in the ordinary course of business,
the Board notably worked on: the follow
up of developments and divestments and
of the Group’s financial situation, grants of
stock-options and performance shares, the
decision to maintain the Chairman and Chief
Executive’s employment contract and the
LEA 2011 employee share scheme.
For further information on developments and
divestments, please refer to Section 3.2.2
(Recent acquisitions, partnerships and
divestures).
Grants of stock-options and performance
shares in 2011 are described in Section 5.5
(Long-term incentives) and a description of
the LEA 2011 employee share scheme can
be found in Section 6.4 (Employee Share
Ownership).
The compensation of the Chairman and Chief
Executive and the position of the Board of
Directors on the employment contract of the
Chairman and Chief Executive are described
in Section 5.4.2 (Compensation and benefits).
5.2.2 Board of Directors’ Committees
The Board of Directors has defined, in
its internal regulations, the duties and
responsibilities of its various Standing
Committees, which are:
• the Audit Committee;
• the Corporate Governance and Nominations
Committee;
• the Remuneration Committee;
• the Strategy, Investment and Sustainable
Development Committee.
The Committees are composed of a minimum
of three members and a maximum of ten
members nominated by the Board of Directors
from among its members.
The term of office of the Committee members
is aligned with their Director office. These
positions can be renewed simultaneously.
The Committees are convened by their
Chairmen or at the request of the Chairman
and Chief Executive Officer by any means
possible, including orally. The Committees
may meet anywhere and using whatever
means, including videoconference or
teleconference. A quorum consists of at
least one-half of members present. At least
2 meetings are held per year.
The agenda for Committee meetings is drawn
up by its Chairman. Minutes of the Committee
meetings are drafted after each meeting.
For the purpose of their work, the Committees
may interview members of Executive Officers
of the Group or any other Group manager. The
Committees may also engage any expert and
interview him about his report.
The Committees report on their work to
the next meeting of the Board, by way
of verbal statement, opinion, proposals,
recommendations or written reports.
The Committees may not handle on their own
initiative any issue outside of their terms of
reference, as defined below. They have no
decision-making powers, merely the power
to make recommendations to the Board of
Directors.
a) Audit Committee
Indicators
Number of meetings in 2011 5
Average attendance rate in 2011 86%
Number of members * 7
Percentage of independent Directors * 71% (5 out of 7)
* Information as of the date of this Registration Document.
Composition
The Audit Committee is chaired by Mrs Hélène
Ploix. It is composed of the following members:
• Hélène Ploix, Chairman (independent
Director);
• Michel Bon (independent Director);
• Juan Gallardo (independent Director);
• Jérôme Guiraud;
• Michel Rollier (independent Director);
• Thierry de Rudder;
• Véronique Weill (independent Director).
There has been no change to the Committee’s
composition during the 2011 financial year.
Upon the Audit’s Committee’s proposal, the
Board of Directors resolved on February 16,
2012, (in line with its previous resolution of
July 29, 2010) that each member of the Audit
Committee had the required level of expertise
in finance or accounting with regards to their
education and professional experience,
as described in the biographies set out in
paragraph 5.1.2 (Information on Directors).
87Lafarge | Registration Document | 2011

5CORPORATE GOVERNANCE AND COMPENSATIONS5.2 Board and Committee rules and practices
Duties and Responsibilities
The Audit Committee has the following duties:
FINANCIAL STATEMENTS
• to ensure that the statutory auditors
assess the relevance and consistency
of accounting methods adopted for the
preparation of the consolidated or statutory
financial statements, as well as appropriate
treatment of the major transactions at
Group level;
• when the financial statements are prepared,
to carry out a preliminary review and give
an opinion on the draft statutory and
consolidated financial statements, including
quarterly, semi-annual and annual
statements prepared by management, prior
to their presentation to the Board; for those
purposes, the draft financial statements
and all other useful documents and
information must be provided to the Audit
Committee at least 3 days before the review
of the financial statements by the Board.
In addition, the review of the financial
statements by the Audit Committee must
be accompanied by (i) a memorandum
from the statutory auditors highlighting the
key points of the results and the accounting
options adopted; and (ii) a memorandum
from the Finance Director describing the
Company’s exposure to risk and the major
off-balance sheet commitments. The Audit
Committee interviews the statutory auditors,
the Chairman and Chief Executive Officer
and financial management, in particular
concerning depreciation, reserves, the
treatment of goodwill and consolidation
principles;
• to review the draft interim financial
statements, the draft half-year report and
the draft report on results of operations prior
to publication, together with all the accounts
prepared for specific transactions (asset
purchases, mergers, market operations,
prepayments of dividends, etc.);
• to review, where necessary, the reasons
given by the Chairman and Chief Executive
Officer for not consolidating certain
companies;
• to review the risks and the major off-balance
sheet commitments.
INTERNAL CONTROL AND INTERNAL AUDIT
• to be informed by the Chairman and
Chief Executive Officer of the definition
of internal procedures for the gathering
and monitoring of financial information,
ensuring the reliability of such information;
• to be informed of procedures and action
plans in place in terms of internal control
over financial reporting, to interview the
persons in charge of internal control
every half-year and at the end of each
financial year and to examine the terms of
engagement of the statutory auditors;
• to examine the Group’s internal audit plan
and interview the persons in charge of
internal audit for the purposes of taking note
of their programs of work and to receive the
internal audit reports of the Company and
Group or an outline of those reports, and
provided the Chairman and Chief Executive
Officer has been informed in advance,
these hearings may take place, if necessary,
without the Chairman and Chief Executive
Officer being in attendance.
STATUTORY AUDITORS
• to listen regularly to the statutory auditors’
reports on the methods used to carry out
their work;
• to propose to the Board, where necessary,
a decision on the points of disagreement
between the statutory auditors and the
Chairman and Chief Executive Officer,
likely to arise when the work in question
is performed, or because of its contents;
• to assist the Board in ensuring that the
rules, principles and recommendations
safeguarding the independence of the
statutory auditors are applied and, for such
purposes, the members of the Committee
have, by way of delegation by the Board of
Directors, the following duties:
– supervising the selection or renewal
procedure (by invitation to tender) of
statutory auditors, while taking care to
select the “best bidder” as opposed to
the “lowest bidder”, formulating an
opinion on the amount of the fees sought
for carrying out the statutory audit
assignments, formulating an opinion
stating the reasons for the selection of
statutory auditors and notifying the
Board of its recommendation in this
respect,
– supervising the questions concerning the
independence, fees and duties of the
statutory auditors.
FINANCIAL POLICY
• to be informed by the Chairman and Chief
Executive Officer of the financial standing
of the Group, the methods and techniques
used to lay down financial policy, and to be
regularly informed of the Group’s financial
strategy guidelines in particular with regard
to debt and the hedging of currency risks;
• to be informed of the contents of official
financial statements prior to their release;
• to be informed in advance of the conditions
of the financial transactions performed by
the Group; if a meeting of the Committee
cannot be held owing to an emergency,
the Audit Committee is informed of such
reasons;
• to review any financial or accounting issue
submitted to it by the Board, the Chairman
and Chief Executive Officer or the statutory
auditors;
• to be informed by the Chairman and Chief
Executive Officer of all third party complaints
and of any internal information criticizing
accounting documents or the Company’s
internal control procedures, as well as of
procedures put in place for this purpose,
and of the remedies for such complaints
and criticism.
FRAUD
• to ensure that procedures are put in place
for the receipt, retention and treatment of
accounting and financial related complaints
received by the Company;
• to be informed of possible cases of fraud
involving management or employees who
have a significant role in internal controls
concerning financial reporting.
RISK MANAGEMENT
• to ensure that appropriate means and
measures are put in place by, or at the
initiative of, the general management
to enable identi f icat ion, analysis
and continuing improvement in the
management of risks to which the Group
may be exposed as a result of its operations;
• every year, to dedicate one of its meetings
to Internal Control, Internal Audit and risk
management.
To enable the Audit Committee to carry out
the full extent of its duties, the Board’s internal
rules state that all pertinent documents and
information must be provided to it by the
Chairman and Chief Executive Officer on a
timely basis.
The Audit Committee is given the opportunity
to listen to the Chairman and Chief Executive,
the Chief Financial Officer, members of the
financial management (control, consolidation
and treasury), the Internal Audit Director, the
Group General Counsel and the statutory
auditors on a regular basis during its meetings.
In addition, during each of its meetings, the
Committee always has the possibility to listen
to the statutory auditors without the Chairman
and Chief Executive Officer or members of the
management being in attendance, and vice-
versa.
Registration Document | 2011 | Lafarge88

CORPORATE GOVERNANCE AND COMPENSATIONS
5
5.2 Board and Committee rules and practices
Main Activities
In 2011, the Audit Committee conducted a
preliminary review of the 2010 statutory and
consolidated annual financial statements, our
statutory interim financial statements and of
the quarterly financial consolidated statements
for the first three quarters of 2011. The Audit
Committee also reviewed the press releases
and analyst slides concerning the publication
of these financials statements as well as the
auditors’ budget for 2011.
The Audit Committee discussed the statutory
auditors’ appointments, which were renewed
after a competitive bidding process in 2006,
and are due to expire in 2012. After noting
the high quality of the services provided by
the auditors, the Committee decided to make
a recommendation to the Board of Directors
that the current principal and deputy statutory
auditors should have their appointment
renewed.
The Committee worked on the Group’s
financing, liquidity and debt situation, with
a specific focus on the Company’s credit
ratings. It also reviewed particular accounting
and financial aspects of some of the Group’s
strategic projects.
The Committee also supervised the Group’s
internal control, risk management and internal
audit. In particular, the Audit Committee
reviewed the management’s update of the
Group’s risk mapping and followed up the
different action plans relating to the Group’s
priority risks. It also made regular updates on
fraud, the Group’s fraud prevention program
and the annual certification process.
During the year, the Audit Committee also
conducted an assessment of its practices,
as further described in paragraph 5.2.3
(Self-assessment by the Board, Committees,
Chairman and Chief Executive Officer).
As part of its preliminary review of the
2011 statutory and consolidated financial
statements in February 2012, and on the
basis of presentations made by the finance
management and external auditors, the Audit
Committee reviewed the principal items of the
closing, with a special focus on other operating
income and expense, finance costs, tax,
goodwill impairment tests, as well as major
off-balance sheet commitments and exposure
to risks. It also reviewed the management’s
assessment on internal controls over financial
reporting which are described in detail in
the Chairman’s report on internal control
procedures and considered the description
of the Group’s risk factors in the Registration
Document. It also examined the auditors’
assessment on accounting options selected
at closing, fairness of our financial statements
and on our internal control over financial
reporting. Finally, the Audit Committee
reviewed the draft dividend payout plan for
2011 and issued recommendations to the
Board.
See Chapter 9 (International c ontrols
pr ocedures).
b) Corporate Governance and Nominations Committee
Indicators
Number of meetings in 2011 5
Average attendance rate in 2011 89%
Number of members* 7
Percentage of independent Directors* 71% (5 out of 7)
* Information as of the date of this Registration Document.
Composition
The Corporate Governance and Nominations
Committee is chaired by Mr Oscar Fanjul. It is
composed of the following members:
• Oscar Fanjul, Chairman (Vice-Chairman –
independent Director);
• Philippe Dauman (independent Director);
• Juan Gallardo (independent Director);
• Ian Gallienne;
• Baudouin Prot (independent Director);
• Michel Rollier (independent Director);
• Nassef Sawiris.
Mr Michel Pébereau was a member of the
Corporate Governance and Nominations
Committee until the term of his office, which
ended at the General Meeting of May 12,
2011.
Mr Baudouin Prot became a member of the
Corporate Governance and Nominations
Committee further to his appointment as
Director by the General Meeting held on
May 12, 2011.
Mr Ian Gallienne was appointed as member of
the Corporate Governance and Nominations
Committee by the Board on November 3,
2011 further to his cooptation by the Board
in replacement of Mr Gerald Frère, resigning.
This appointment was made after the
Committee’s final session for fiscal year 2011.
Mr Gérald Frère was a member of the
Corporate Governance and Nominations
Committee until the term of his office,
which ended at the Board of Directors of
November 3, 2011.
Duties and Responsibilities
The Corporate Governance and Nominations
Committee is responsible, in cooperation with
the Chairman and Chief Executive Officer, for
ensuring compliance with the Company’s
corporate governance rules. In particular, it
is responsible for:
• monitoring governance practices in the
market, submitting to the Board the
corporate governance rules applicable
by the Company and ensuring that the
Company’s governance rules remain among
the best in the market;
• reviewing proposals to amend the internal
regulations or the Director’s Charter to be
submitted to the Board;
• submitting to the Board the criteria to be
applied to assess the independence of its
Directors;
89Lafarge | Registration Document | 2011

5CORPORATE GOVERNANCE AND COMPENSATIONS5.2 Board and Committee rules and practices
• submitting to the Board, every year before
publication of the Registration Document,
a list of Directors qualifying as independent;
• preparing assessment of the work of the
Board provided for by the Board’s Internal
Regulations;
• preparing changes in the composition of the
Company’s management bodies;
• giving its prior approval before the Corporate
Executive Officer accepts a corporate office
of a listed company that does not belong to
the Group.
The Committee has special responsibility for
examining the succession plans for senior
management members and the selection of
new Directors. It also makes recommendations
to the Board for the appointment of the Vice-
Chairman and the Chairmen of other Standing
Committees.
The choices made by the Corporate
Governance and Nominations Committee on
the appointments of the candidates to the
office of Director are guided by the interests
of the Company and all its shareholders. They
take into account the balance of the Board’s
composition, in accordance with the relevant
rules laid down in its internal regulations.
They ensure that each Director possesses
the necessary qualities and availability,
and that the Directors represent a range
of experience and competence, thereby
enabling the Board to perform its duties
effectively, while maintaining the requisite
objectivity and independence with regard
to the Chairman and Chief Executive Officer
and any shareholder or any particular group
of shareholders.
Main Activities
In 2011, the Corporate Governance and
Nominations Committee focused mainly on:
• the composition of the Board and its
Committees;
• the assessment of the independence of the
Directors (and materiality tests, beginning
of 2012);
• the evaluation of the Chairman and Chief
Executive Officer’s performance;
• the reappointment of the Vice-Chairman of
the Board;
• the decision to maintain the Chairman and
Chief Executive’s employment contract;
• the review of the Corporate Governance
section in the 2011 Registration Document
(beginning of 2012); and
• the amendment of the internal regulations
of the Board of Directors at the beginning
of 2012.
c) Remunerations Committee
Indicators
Number of meetings in 2011 5
Average attendance rate in 2011 93%
Number of members* 6
Percentage of independent Directors* 67% (4 out of 6)
* Information as of the date of this Registration Document.
Composition
The Remunerations Committee is chaired
by Mr Oscar Fanjul. It is composed of the
following members:
• Oscar Fanjul, Chairman (Vice-Chairman –
independent Director);
• Philippe Charrier (independent Director);
• Juan Gallardo (independent Director);
• Thierry de Rudder;
• Nassef Sawiris;
• Véronique Weill (independent Director).
Mr Michel Pébereau was a member of the
Corporate Governance and Nominations
Committee until the term of his office, which
ended at the General Meeting of May 12,
2011.
Mrs Véronique Weill was appointed to the
Corporate Governance and Nominations
Committee by the Board of Directors on
May 12, 2011.
Duties and Responsibilities
The Remunerations Committee is responsible
for examining the compensation and benefits
paid to Directors and members of senior
management, and providing the Board with
comparisons and benchmarking with market
practices, in particular:
• to review and make proposals in relation
to the remuneration of senior management
members, both with regard to the fixed
portion and the variable portion of said
remuneration, and all benefits in kind, stock
subscription and purchase options granted
by any Group company, provisions relating
to their retirements, and all other benefits
of any kind;
• to define and implement the rules for the
determination of the variable portion of their
remuneration, while taking care to ensure
these rules are compatible with the annual
evaluation of the performances of senior
management and with the medium-term
strategy of the Company and Group;
• to deliver the Board with an opinion on
the general allocation policy for stock
subscription and/or purchase options and
on the stock-option plans set up by the
Chairman and Chief Executive Officer, and
submit the allocation of stock subscription
or purchase options to the Board;
• to be informed of the remuneration policy
concerning the principal management
personnel (aside from senior management)
of the Company and other Group
companies, and to examine the consistency
of this policy;
• to suggest to the Board the total amount
of Directors’ fees for proposal at the
Company’s Shareholders’ Meeting;
• to suggest to the Board the allocation
rules for Directors’ fees and the individual
payments to be made to the Directors,
taking into account the attendance rate
of the Directors at Board and Committee
meetings;
• to examine every matter submitted to it by
the Chairman and Chief Executive Officer,
relating to the questions above, as well as
plans for increases in the number of shares
outstanding owing to the implementation of
employee stock ownership;
Registration Document | 2011 | Lafarge90

CORPORATE GOVERNANCE AND COMPENSATIONS
5
5.2 Board and Committee rules and practices
• to approve the information disclosed to the
shareholders in the Registration Document
on the remuneration of senior management
members and the principles and methods
determining the compensation of said
persons, as well as on the allocation and
exercize of stock subscription or purchase
options by senior management.
Main Activities
During the course of 2011, the work of the
Remunerations Committee was primarily
focused on:
• a review of the Group’s long term incentives
policy;
• a review of the variable pay structure of the
Group’s employees;
• stock-options and performance shares
(2011 grants and validation of the
performance conditions applicable to the
2010 grants);
• a review of the Directors’ fees budget and
distribution for 2011;
• the Chairman and Chief Executive Officer’s
compensation (fixed compensation,
the criteria for the variable part of his
compensation as well as his long term
incentived based compensation);
• a review of the Group’s pension plans;
• the share capital increase reserved for
employees as part of the LEA 2011
employee share scheme;
• payment of an additional amount within the
scope of the profit-sharing scheme; and
• the review of the Compensation and
b enefits section in the 2011 Registration
Document (beginning of 2012).
d) Strategy, Investment and Sustainable Development Committee
Indicators
Number of meetings in 2011 2
Average attendance rate in 2011 87%
Number of members* 7
Percentage of independent Directors* 71% (5 out of 7)
* Information as of the date of this Registration Document.
Composition
The Strategy, Investment and Sustainable
Development Committee is chaired since
May 12, 2011 by Mr Michel Bon. It is
composed of the following members:
• Michel Bon, Chairman (independent
Director);
• Philippe Charrier (independent Director);
• Philippe Dauman (independent Director);
• Paul Desmarais, Jr;
• Colette Lewiner (independent Director);
• Baudouin Prot (independent Director);
• Nassef Sawiris.
Mr Michel Pébereau chaired the Strategy,
Investment and Sustainable Development
Committee until the term of his office, which
ended at the General Meeting of May 12,
2011.
Mr Baudouin Prot became a member of
the Strategy, Investment and Sustainable
Development Committee further to his
appointment as Director by the General
Meeting held on May 12, 2011.
Duties and Responsibilities
The Strategy, Investment and Sustainable
Development Committee is responsible for:
• advising the Board on the main strategic
priorities of the Company and Group and
on the investment policy and important
strategic issues put before the Board;
• reviewing in detail and giving the Board its
opinion on the issues submitted to it relating
to major investments, the creation and
upgrading of equipment, external growth,
or divestments and asset or share sales;
• ensuring that sustainable development and
societal responsibility are a component of
Lafarge’s long-term strategy and constitute
one of the aspects of its economic
development.
Main Activities
Since 2004, the Strategy, Investment and
Sustainable Development Committee has
been open to all Directors wishing to attend
its meetings.
In 2011, the Strategy, Investment and
Sustainable Development Committee focused
on the following:
• optimization and mid-term evolution of the
Group’s portfolio of assets;
• the strategies to differentiate the Group’s
products and services;
• the Group’s strategic orientations for 2015.
5.2.3 Self-assessment by the Board, Committees, Chairman and Chief Executive Officer
The Board’s internal regulations provide that
the Board is to hold a discussion at least
once a year about its practices with a view to
assessing and improving their efficiency and
to proceed with the evaluation of the Chairman
and Chief Executive Officer. A formal
assessment of its operations, the verification
that important issues are properly prepared
and debated within the Board, and the
effective participation and involvement in the
deliberation of each Director, is to take place
at least every 2 years using a questionnaire
approved by the Board.
91Lafarge | Registration Document | 2011

5CORPORATE GOVERNANCE AND COMPENSATIONS5.2 Board and Committee rules and practices
In 2010, the Board initiated a formal
debate on its organization and practices in
accordance with its internal regulations. This
debate was led by the Vice-Chairman of the
Board, first within the Corporate Governance
and Nominations Committee and then within
the Board of Directors, following interviews
with each of the Directors. This review also
included an assessment of each of the
Committees.
The outcome of the comments and
discussions resulting from this assessment
was that the Directors consider that the
organization and practices of the Board and
its Committees are globally very satisfactory.
The principal findings and recommendations
for potential optimization were as follows:
• concerning the composition of the Board,
the Directors noted the sufficient diversity
of background of its various members
and how the necessary balance between
Directors qualifying as independent and
shareholder representatives had been
successfully achieved. A reduction in
the overall number of Directors as well
as an increase in the number of women
appointed to the Board was identified as a
potential improvement for the future;
• the organization of the Board and
its Committees was considered very
satisfactory. The breadth of topics covered
during meetings was considered adequate,
topics being handled effectively although the
length of debates could be optimised further
depending on the nature of topics under
discussion. The involvement of the Board
in the definition of the Group’s strategy and
the level of information received on the
financial condition of the Company were
perceived as very positive. The Committees’
organization and in particular the allocation
of work between Committees and the Board
as well as the nature and extent of reported
information were considered appropriate.
A reinforcement of the role of the Strategy
Committee and of the frequency of
discussions on remunerations could be
envisaged;
• members of the Board noted their
appreciation of how discussions of the
Board were chaired by the Chairman
and Chief Executive Officer regarding
direction of debates as well as the quality
of his contributions, in particular on the
Company’s strategy, position and global
organization.
Based on a formal presentation of the Board’s
and Committes’s activities, the Board of
Directors discussed its practices during the
year 2011 at the Board of Directors meeting
held on February 16, 2012. The principal
findings and recommendations made in 2010
were upheld.
The Audit Committee also conducted a
self-assessment on its practices in 2011
through a separate questionnaire. The
results showed that the organization of the
Committee was considered very satisfactory
and that Committee’s specific requests to the
management were taken into account.
5.2.4 Summary table on the attendance at Board and Committee meetings
The following table shows the number of Board and Committee meetings during fiscal year 2011, as well as Director membership and attendance
at these various meetings.
BOARD OF DIRECTORS
ATTENDANCERATE (%)
AUDIT COMMITTEE
ATTENDANCERATE (%)
CORPORATEGOVERNANCE
AND NOMINATIONS
COMMITTEEATTENDANCE
RATE (%)
REMUNE-RATIONS
COMMITTEEATTENDANCE
RATE (%)
STRATEGY, INVESTMENT
AND SUSTAINABLE
DEVELOPMENT COMMITTEE
ATTENDANCERATE (%)
Number of meetings
in 2011 7 93 5 86 5 89 5 93 2 87
Bruno Lafont 7 100
Oscar Fanjul 7 100 5 100 5 100
Michel Bon 7 100 5 100 2 100
Philippe Charrier 7 100 5 100 2 100
Bertrand Collomb 7 100
Philippe Dauman 6 86 5 100 2 100
Paul Desmarais Jr. 6 86 1 50
Gérald Frère 5 71 4 80
Juan Gallardo 7 100 4 80 4 80 4 80
Jérôme Guiraud 7 100 5 100
Pierre de Lafarge (1) 3/3 100 1/1 100
Colette Lewiner 7 100 2 100
Michel Pébereau (1) 3/3 100 3/3 100 3/3 100 1/1 100
Hélène Ploix 6 86 5 100
Baudouin Prot (2) 4/4 100 1/2 50 0/1 0
Michel Rollier 6 86 3 60 4 80
Thierry de Rudder 7 100 5 100 5 100
Nassef Sawiris 5 71 5 100 4 80 2 100
Véronique Weill (3) 6 86 3 60 2/2 100
(1) Directors whose term of office ended on May 12, 2011.
(2) Directors appointed on May 12, 2011.
(3) Director appointed to the Remunerations Committee on May 12, 2011.
Registration Document | 2011 | Lafarge92

CORPORATE GOVERNANCE AND COMPENSATIONS
5
5.2 Board and Committee rules and practices
5.2.5 Powers of the Chairman and Chief Executive Officer
The Chairman and Chief Executive Officer
represents the Company in its relations with
third parties. He has broad powers to act on
behalf of our Company in all circumstances.
In addition, as Chairman of the Board,
the Chairman and Chief Executive Officer
represents the Board of Directors. He
organizes and directs the work of the Board in
accordance with the provisions of its internal
regulations.
The Company’s strategic priorities are
proposed by the Chairman and Chief
Executive Officer and are discussed annually
by the Board of Directors. Specific strategic
presentations may be submitted to the Board
of Directors as often as necessary. The
Company’s strategic priorities are approved
by the Board of Directors.
Limitations of the Chairman and Chief
Executive Officer’s powers are contained in
the Board’s internal regulations and concern
investment and divestment decisions, as well
as certain financial transactions.
Investments and divestments
The Board’s internal regulations stipulate that
investment and divestment decisions must be
submitted to the Board of Directors as follows:
• as regards transactions, in line with our
strategies as previously approved by the
Board:
– submission for information purposes
following the closing of the transaction:
for transactions below 200 million euros,
– submission for approval of the principle
of the transaction, either during a Board
meeting or in writing, enabling Directors
to comment on the proposed transaction
or request a Board decision: for
t r ansac t i ons be tween 200 and
600 million euros,
– submission for prior approval of the
t r ansac t i on and i t s t e rms : f o r
transactions in excess of 600 million
euros;
• as regards transactions that do not fall
within the scope of the Company’s strategy
as previously defined by the Board:
submission for prior approval of transactions
exceeding 100 million euros.
The above amounts refer to the Company’s
total commitment including assumed debt
and deferred commitments.
Financial transactions
The Board’s internal regulations provide that
transactions relating to the arrangement
of debt, financing and liquidity that can be
decided by Chief Executive Officers by law,
or pursuant to a delegation by the Board
of Directors and the General Meeting, are
subject to the following rules:
• financing transactions carried out through
bilateral or syndicated credit facilities for an
amount below 2 billion euros are submitted
to the Board of Directors by the Chairman
and Chief Executive Officer for information
purposes when the transaction closes.
Those transactions exceeding 2 billion
euros are submitted to the Board for prior
approval;
• bond issues, which may be decided by
the Chairman and Chief Executive Officer
pursuant to a Board delegation, must be
submitted to the Board as follows:
– for information purposes following the
closing of the issue: for bond issues
below 300 million euros,
– for information purposes prior to the
launch of the issue: for bond issues
between 300 million and 1 billion euros,
the Chief Executive Offi cer is in charge
of defi ning the terms and conditions of
the issue,
– for prior approval of the issue and its
terms: for bond issues in excess of
1 billion euros,
– for prior approval of the issue and its
terms for bond issues convertible or
exchangeable into shares.
93Lafarge | Registration Document | 2011

5CORPORATE GOVERNANCE AND COMPENSATIONS5.3 Executive Officers
The Executive Officers include Bruno Lafont,
our Chairman and Chief Executive Officer, and
the members of the Executive Committee.
The Executive Committee includes the
following members:
Jean-Carlos Angulo: Operations Executive Vice-
President, 61, rue des Belles Feuilles, 75116
Paris, France.
Jean-Carlos Angulo (born in 1949) is a
graduate from the École des mines de Nancy
(France) and from the European Business
Institute, and has been with the Group
since 1975. From 1971 to 1974, he was a
project engineer in the aeronautics industry
with the Société Européenne de Propulsion
in Bordeaux. He joined Lafarge in 1975 as
Project Manager then as Project Director
of the Group’s subsidiaries specialized in
engineering and later as Director of Lafarge
Consulteria e Estudos in Brazil. In 1984,
he joined Lafarge Aluminates as Head of
Development. From 1990 to 1996, he served
as Chief Executive Officer of Lafarge in Brazil
and as President for South and Latin America.
In 1996, he was appointed Chief Executive
Officer of Lafarge Ciments France. From 2000
to August 2007, he was President of Cement
Division operations in Western Europe and
Morocco. On September 1, 2007, he became
a member of the Executive Committee and
Executive Vice-President, Co-President of the
Cement business. Since January 1, 2012 he is
Operations Executive Vice-President.
Jean Desazars de Montgailhard: Executive
Vice-President for Strategy, Development and
Public Affairs, 61, rue des Belles Feuilles,
75116 Paris, France.
Jean Desazars de Montgailhard (born
in 1952) graduated from the Institut d’études
politiques de Paris and the École Nationale
d’Administration (ENA) with a Master’s degree
in economics. He joined the Group in 1989.
He began his career at the French Ministry
of Foreign Affairs in Madrid, Stockholm,
Washington DC and Paris, before joining
Lafarge Cements as Strategy Director in
Paris and then Lafarge Asland in Spain as
Communication and Marketing Director.
From 1996 to 1999, he acted as Regional
President for Asia in Singapore, then in Paris
until 2006 for Africa. He was appointed
as Executive Vice-President, Strategy and
Development for the Group in 2006. He
has been Executive Vice-President Strategy,
Development & Public Affairs and a member
of the Executive Committee since January 1,
2008. He is a Director of COE Rexecode
(France).
Thomas Farrell: Operations Executive Vice-
President, 61, rue des Belles Feuilles, 75116
Paris, France.
A graduate from Brown University with a PhD
from Georgetown University (J.D), Thomas
Farrell (born in 1956) began his career as a
lawyer with Shearman & Sterling. He joined
Lafarge in 1990 as Director of Strategic
Studies for the Group. From 1992 to 1994,
he managed an operating unit of Lafarge
Aggregates & Concrete in France. In 1996,
he became Vice-President/General Manager
of Aggregates, Concrete & Asphalt Division’s
operations in South Alberta (Canada). In 1998,
he was appointed Chief Executive Officer of
Lafarge in India. From 2002 to 2006, he
was Executive Vice-President of Lafarge
North America Inc. and President of the
Aggregates, Concrete & Asphalt Division’s
operations for Western North America. From
2006 to August 2007, he was President of
the Aggregates, Concrete & Asphalt Division
in North America. On September 1, 2007,
he was appointed Executive Vice-President,
Co-President of the Aggregates & Concrete
business, and a member of the Executive
Committee. On January 1, 2012, he became
Operations Executive Vice-President He is
a Director of the National Stone Sand and
Gravel Association and of the American Road
and Transportation Builders Association, both
US industry associations.
Jean-Jacques Gauthier: Chief Financial Officer
and Executive Vice-President, 61, rue des
Belles Feuilles, 75116 Paris, France.
Jean-Jacques Gauthier (born in 1959) joined
the Group in February 2001. After graduating
in law and economics, he began his career
with Arthur Young. Between 1986 and 2001,
he held several positions at the Matra group
in France and the United States. In 1996, he
was appointed Chief Financial Officer of the
Franco-British venture Matra Marconi Space
and between 2000 and 2001 he served
as CFO for Astrium. After joining Lafarge
in 2001, Jean-Jacques Gauthier became
Chief Financial Officer and a member of the
Executive Committee.
Christian Herrault: Operations Executive Vice-
President, 61, rue des Belles Feuilles, 75116
Paris, France.
A graduate of the École Polytechnique
(1972) and the École nationale supérieure
des mines de Paris, Christian Herrault (born
in 1951) joined the Group in 1985, taking over
responsibility for strategy and development
at the Bioactivities Unit. Between 1987
and 1992, he acted as Chief Operating Officer
for the Seeds Unit, initially in the United States,
then in France, and managed the Glutamates
business from 1992 to 1994. In 1995, he
was appointed Chief Executive Officer of the
Aluminates & Admixtures Unit (no longer part
of the Group). In 1998, he was appointed
Executive Vice-President Organization and
Human Resources and joined the Executive
Committee. On September 1, 2007, he
became President of the Gypsum business.
Still a member of the Executive Committee, he
is Operations Executive Vice-President since
January 1, 2012. He is the Chairman of the
Board of Directors of the École des mines de
Nantes.
Gérard Kuperfarb: Executive Vice-President in
charge of the Innovation function, 61 rue des
Belles Feuilles, 75116 Paris, France.
Gérard Kuperfarb (born in 1961) graduated
from the École des mines de Nancy (France).
He also holds a Master’s degree in Materials
Science from the École des mines de Paris
and a MBA from the école des Hautes Études
Commerciales (HEC). He has been with
the Group since 1992. He began his career
in 1983 as an engineer at the Centre de mise
en forme des matériaux of the École des
mines de Paris, before joining the Composite
materials Division at Ciba group in 1986,
where he held sales and marketing functions.
In 1989, he joined a strategy consulting firm in
Brussels and Paris. He joined Lafarge in 1992
as Marketing Director for the Refractories
business then became Vice-President for
strategy at Lafarge Specialty Materials.
In 1996, he became Vice-President Ready-mix
Concrete strategy in Paris. In 1998, he was
appointed Vice-President/General Manager
for the Aggregates & Concrete business in
Southwest Ontario (Canada) before heading
the Performance group at Lafarge Construction
Materials in North America in 2001. He
joined the Aggregates & Concrete Division in
Paris as Senior Vice-President Performance
in 2002. From 2005 to August 2007, he
was President of the Aggregates & Concrete
business for Eastern Canada. On September 1,
2007, he became Executive Vice-President,
Co-President of the Aggregates & Concrete
business and a member of the Executive
Committee. Since January 1, 2012, he is
Executive Vice-President in charge of the
Innovation function.
5.3 Executive Officers
Registration Document | 2011 | Lafarge94

CORPORATE GOVERNANCE AND COMPENSATIONS
5
5.4 Compensations and benefits
Eric Olsen: Executive Vice-President
Organization and Human Resources, 61, rue
des Belles Feuilles, 75116 Paris, France.
Eric Olsen (born in 1964) is a graduate
in finance and accounting from Colorado
University and holds a Master’s degree
awarded by the école des Hautes Études
Commerciales (HEC). He has been with the
Group since 1999. He began his career as
a senior auditor with Deloitte & Touche in
New York. From 1992 to 1993, he worked
as senior associate at Paribas bank in Paris
and partner at the consulting firm Trinity
Associates in Greenwich, Connecticut,
from 1993 to 1999. He joined Lafarge North
America Inc. in 1999 as Senior Vice-President
Strategy and Development. In 2001, he was
appointed President of the Cement Division for
Northeast America and Senior Vice-President
Purchasing for Lafarge North America Inc. He
was appointed Chief Finance Officer of Lafarge
North America Inc. in 2004. He was appointed
Executive Vice-President for Organization and
Human Resources and became a member
of the Executive Committee on September 1,
2007.
Alexandra Rocca: Senior Vice-President,
Communications of Lafarge, 61, rue des Belles
Feuilles, 75116 Paris, France.
Alexandra Rocca (born in 1962) is a
graduate of the école des Hautes Études
Commerciales (HEC), the Institut d’études
politiques in Paris and has a degree in French
language and literature. She began her
career with the Printemps group from 1986
to 1990, and then joined Air Liquide where,
from 1990 to 2001, she was notably in
charge of client communications and
international brand management, before
being appointed Deputy Communications
Director of the group. Alexandra Rocca was
then Communications Director for Galeries
Lafayette from 2001 to 2005. She then joined
the Crédit Agricole S.A. group in 2005 to work
as Communications Director for LCL (formerly
Crédit Lyonnais) before being appointed Head
of Communications for the Crédit Agricole S.A.
group. Alexandra Rocca has been appointed
as Senior Vice-President, Communications of
Lafarge, in September 2010. She joined the
Executive Committee on January 1, 2012.
Guillaume Roux: Executive Vice-President in
charge of the Performance function, 61, rue
des Belles Feuilles, 75116 Paris, France.
A graduate of the Institut d’études politiques in
Paris, Guillaume Roux (born in 1959) joined
the Group in 1980 as an internal auditor with
Lafarge Ciment, France. He was Chief Financial
Officer of the Biochemicals Unit in the United
States from 1989 to 1992, before returning
to Lafarge headquarters as Project Manager
for the Finance department. In 1996, he
returned to the United States as Vice-President
of Marketing for Lafarge North America Inc.
In 1999, he was appointed Chief Executive
Officer of Lafarge’s operations in Turkey and
then in 2001, Executive Vice-President of the
Cement Division’s operations in South-East
Asia. Guillaume Roux joined the Executive
Committee when he was appointed Executive
Vice-President, Co-President of the Cement
business in January 2006. On January 1,
2012, he became Executive Vice-President,
in charge of the Performance function.
There are no conflicts of interest affecting
members of the Executive Committee between
any duties owed to us and their private
interests.
To our knowledge, during the previous five
years, no member of the Executive Committee
has been convicted of fraudulent offences,
involved in a bankruptcy, receivership
or liquidation, subject to official public
incrimination and/or sanctions or disqualified
by a court from acting as a Director or from
acting in the management or conduct of the
affairs of any issuer.
5.4 Compensations and benefits
5.4.1 Compensations paid to Directors – Director’s fees
Maximum amount
The General Meeting held on May 6, 2010 set
the maximum aggregate amount of Directors’
fees at 700,000 euros. The envelope had not
been increased since the General Meeting
held on May 28, 2001. This increase of 15%
of the maximum aggregate amount reflects
the Board’s willingness to continue to offer
Lafarge a high standard of governance with
high profile and committed Directors.
Allocation rules
In addition, the Board of Directors adopted
on March 24, 2010 the following rules on the
allocation of Directors’ fees:
• each Director is currently entitled to
receive a fixed fee of 17,000 euros per
year (increased by 5,000 euros for the
Committee Chairmen and by 15,000 for
the Vice-Chairman). A Director who is
appointed or whose office ends during the
course of the year is entitled to 50% of the
fixed fee;
• a variable fee of 1,200 euros is payable to
each Director for every Board of Directors
or Committees meeting attended. Some
Directors who must travel from distant
locations are eligible for a double variable
fee.
95Lafarge | Registration Document | 2011

5CORPORATE GOVERNANCE AND COMPENSATIONS5.4 Compensations and benefits
2011 Fees
The total amount of Directors’ fees paid in 2012 (with respect to the 2011 fiscal year) was 656,500 euros. In 2011 (with respect to the 2010
fiscal year) it amounted to 683,000 euros, while the total amount paid in 2010 (with respect to the 2009 fiscal year) was 609,787 euros.
DirectorsDIRECTORS’ FEES FOR 2011 PAID
IN 2012 (EUROS)DIRECTORS’ FEES FOR 2010 PAID
IN 2011 (EUROS)DIRECTORS’ FEES FOR 2009 PAID
IN 2010 (EUROS)
Bruno Lafont 25,400 26,600 23,326
Oscar Fanjul 62,400 60,000 45,152
Michel Bon 36,300 37,400 31,407
Philippe Charrier 33,800 33,800 32,562
Bertrand Collomb 25,400 26,600 23,326
Philippe Dauman 48,200 50,600 40,643
Paul Desmarais, Jr. 33,800 38,600 29,098
Gérald Frère 27,800 31,400 26,789
Juan Gallardo 62,600 62,600 63,732
Jérôme Guiraud 31,400 33,800 29,098
Pierre de Lafarge (1) 13,300 30,200 25,635
Colette Lewiner 27,800 14,500 N/A
Michel Pébereau (1) 23,000 41,200 37,528
Hélène Ploix 35,200 38,800 32,910
Baudouin Prot (2) 14,500 N/A N/A
Michel Rollier 32,600 35,000 30,253
Thierry de Rudder 37,400 36,200 36,025
Nassef Sawiris 55,400 38,600 49,879
Véronique Weill 30,200 15,700 N/A
TOTAL 656,500 683,000 (3) 609,787 (3)
(1) Directors whose term of office expired on May 12, 2011.
(2) Directors appointed on May 12, 2011.
(3) Including fees paid to Directors whose term of office expired before 2011.
According to the Group’s policy, no Directors’ fees have been paid with respect to the 2011 fiscal year either to Lafarge S.A. Senior Officers or
to Group Executive members for offices they may hold in any Group subsidiary.
The compensation paid to Lafarge Directors with respect to the 2011 fiscal year comprised only fees (excluding Chairman’s compensation).
5.4.2 Compensation and benefits paid to the Chairman and Chief Executive Officer
Fixed and variable compensation paid to the Chairman and Chief Executive Officer
Our Remuneration Committee is responsible
for submitting to our Board of Directors a
remuneration policy for our Chairman and
Chief Executive Officer. The Remuneration
Committee, in establishing the policy, seeks
guidance from outside consultants on the
market practices of comparable companies.
These Board of Directors decisions are
taken with Bruno Lafont not attending the
discussion.
The compensation paid to the Chairman and
Chief Executive Officer comprises a fixed
portion and a performance-related portion.
2011 FIXED COMPENSATION
In 2011, his fixed annual compensation has
remained at 950,000 euros.
2011 PERFORMANCE-RELATED PORTION
The performance-related portion could be a
maximum of 160% of his fixed compensation.
62.5% of the performance-related pay is
based on the financial results of the Group in
comparison to objectives set at the beginning
of the year, and 37.5% is based on his
individual performance also determined by
reference to qualitative objectives set at the
beginning of the year.
The Board of Directors decided to set the
percentage of the 2011 performance-related
pay due to our Chairman and Chief Executive
Officer at 42.6% of his maximum performance-
related portion, which amounts to 648,375
euros, paid in 2012. This percentage refletcs
the demanding nature of the Group’s financial
objectives in 2011’s economic environment,
but also the achievement by Bruno Lafont of
all his individual objectives.
The 2011 financial objectives were:
• evolution of the earnings per share;
• generation of Free cash flow;
• Ebitda;
• Roce (Return on capital employed);
• change in Lafarge’s performance compared
to competitors.
The 2011 qualitative objectives were related
to:
• health and safety;
• beginning of the recovery;
• portfolio improvement;
• development of the management team;
• financial communication;
• definition of sustainability ambitions
for 2020.
Registration Document | 2011 | Lafarge96

CORPORATE GOVERNANCE AND COMPENSATIONS
5
5.4 Compensations and benefits
Long-term incentive based on the Company’s performance
On November 5, 2009, the Board of Directors
decided to grant a long-term incentive to the
Chairman and Chief Executive Officer Bruno
Lafont, based on the Company’s performance
over a period of three to seven years.
Such compensation will be due and payable
between 2012 and 2016 insofar as the
Company’s performance as benchmarked
against a group of peer companies in the
sector remains in the top half (external
performance condition).
Provided this external performance condition
is met, the amount of the long-term incentive
will depend on the achievement of free
cash flow and return on capital employed
(Roce) pre-defined objectives over a given
period, such objectives corresponding to
the Company’s strategic objectives as set
by the Board and already used in relation
to the Group’s senior management (internal
performance conditions). The amount of
the long-term incentive will be reduced by
a quarter for each internal performance
condition which remains unsatisfied. Each
performance condition (external and internal)
will be tested every two years over the period
until it is declared as being fulfilled.
If all performance conditions are satisfied,
the long-term incentive will amount to
1,500,000 euros as positively or negatively
adjusted based on the evolution of the total
shareholder return since the beginning of
2010 (percentage calculated by taking into
account dividend and share price evolution).
A first performance test has been calculated
on basis of 2011 results. No payment is due
at this stage.
THE COMPENSATION PAID TO OUR CHAIRMAN AND CHIEF EXECUTIVE OFFICER FOR 2011 AND 2010 WAS AS FOLLOWS:
2011 AMOUNT 2010 AMOUNT
(thousand euros) DUE PAID DUE PAID
Bruno Lafont, Chairman
and Chief Executive Officer
Fixed compensation 950 950 950 950
Variable compensation 648 796 796 1,016
Exceptional compensation N/A N/A N/A N/A
Lafarge S.A. Directors’ fees 25 27 27 23
Benefits in kind (Company car) 5 5 5 5
TOTAL 1,628 1,778 1,778 1,994
STOCK-OPTIONS AND PERFORMANCE
SHARES GRANTED IN 2011
The information on stock-options and
performance shares granted in 2011 to
the Chairman and Chief Executive Officer
(as well as their valuation) are detailed in
Sections 5.5.2. and 5.5.3. (Stock-Options and
Performance Shares plans). The Company
considers that these items must not be
aggregated with the above compensation
because the amount of stock-options and
performance shares’ valuation at fair value at
the grant date is not a compensation paid to
the beneficiary.
2011 GRANT(number)
VALUATION(euros) *
Bruno Lafont
Stock-options ** 70,000 536,200
Performance shares ** 20,000 597,200
* Stock-options and performance shares fair value are calculated at grant date using the Black & Scholes model. See Notes to the consolidated statements No. 2.24 and 21 (Share-
based payments).
** These stock-options and performance shares are all subject to performance conditions.
Employment contract and Severance arrangements for the Chairman and Chief Executive Officer
EMPLOYMENT CONTRACT OF BRUNO LAFONT
At their meeting on July 27, 2011, further to a
recommendation by the Corporate Governance
Committee, the Board of Directors decided to
maintain Bruno Lafont’s employment contract
and amend said employment contract in order
to remove Mr Bruno Lafont’s commitment not
to leave the Company before June 30, 2011
in consideration for which the dismissal notice
period may run up until this date. The Board
considers that its decision to maintain Bruno
Lafont’s employment contract initially entered
into on January 1, 1983 is warranted:
• in view of his 29 years’ service with the
Group (and 24 years’ performance of
his employment contract until it was
suspended in 2006 when he was appointed
Chief Executive Officer);
• as it encourages an internal promotion
policy allowing for the appointment of
Corporate Officers (mandataires sociaux)
from among experienced senior executives
(cadres dirigeants) with in-depth knowledge
of the industry and markets on which
Lafarge operates and for whom the loss
of rights deriving from their employment
contracts and length of service (e.g.,
contractual severance compensation under
the collective bargaining agreement) would
act as a drawback.
In addition, the amendment of the accordingly
maintained employment contract will be put
to a shareholder vote at the Company’s next
General Meeting in the scope of the related-
party agreements’ procedure.
These decisions do not change Bruno Lafont’s
position in particular with regard to his pension
plan or severance compensation entitlement.
97Lafarge | Registration Document | 2011

5CORPORATE GOVERNANCE AND COMPENSATIONS5.4 Compensations and benefits
SEVERANCE COMPENSATION AND AMENDMENTS TO THE EMPLOYMENT CONTRACT
If Bruno Lafont’s contract were to become
valid again after his term of office as Chairman
and Chief Executive Officer, in the event of
dismissal (for any reason other than serious
misconduct or gross negligence), he would
receive contractual severance compensation,
the conditions of which have been reviewed
by the Board in order to take into account the
Afep-Medef recommendations on the subject.
Such severance compensation would
therefore be due only insofar as all terms have
been fulfilled:
• the first condition is the event giving rise
to the right to severance compensation.
The dismissal must take place after a
change of control (meaning (i) a change
in the Company’s capital distribution
characterized by the holding by Groupe
Bruxelles Lambert and NNS Holding Sàrl
of in total, not acting in concert, more than
50% of the Company’s voting rights or (ii)
the fact that another shareholder or several
shareholders acting in concert hold more
than 50% of the Company’s voting rights)
or after a change in the Company’s strategy;
• the second condition is performance based.
This term will be satisfied and severance
compensation would be paid if two of
the following three criteria are satisfied.
If only one criterion out of the three is
satisfied, the condition will only be partially
satisfied and only one half of the severance
compensation would be paid. If none of
the criteria are satisfied, the condition
would not be satisfied and no severance
compensation would be paid. The three
criteria to be satisfied, over the last three
fiscal years preceding the employment
contract’s termination, are as follows:
– on average, over the last three fiscal
years: the after-tax return on invested
capital is greater than the Average
Weighted Cost of the Capital. Here, the
term Average Weighted Cost of the
Capital means the sum of the cost of
debt multiplied by the total debt divided
by the total of the capital and cost of
equity multiplied by the equity and
divided by the total of capital (Group
fi gures),
– on average, over the last three fiscal
years: the ratio Ebitda/Turnover is strictly
greater than 18% (Group fi gures),
– on average, over the last three fiscal
years: the average percentage of given
bonuses under the Employment Contract
or the Term of Offi ce is greater than 60%
of the maximum bonus.
The amount of such severance compensation
is a maximum equal to two years of total
gross remuneration received by Bruno Lafont
for the most favorable of the three years
preceding the date of his dismissal notice.
In order to ensure that the total amount of
the compensation due to Bruno Lafont in
case of a departure is within such limit,
such severance compensation would be
reduced by the amount of the contractual
dismissal compensation due pursuant and in
compliance with the terms of the applicable
collective bargaining agreement.
A job elimination or a decrease in the level
of responsibilities would also constitute a
case of dismissal creating a right to dismissal
compensation.
Pensions and other retirement benefits for the Chairman and Chief Executive Officer
Bruno Lafont is eligible for a supplementary
defined benefits plan (through two collective
plans applicable to Senior Management). In
principle, a person is eligible for this plan
only if he is still working in the Company
upon his retirement date or if he ends his
career in the Company after 55 years old
on the initiative of the latter. As far as Bruno
Lafont is concerned, and due to his 29 years
of service within the Group, this plan would
provide him with a pension equal to 26% of
his reference salary (average of the variable
and fixed compensation over the last 3 years)
in excess of 8 times the annual French social
security cap to which an additional 13% would
be added in excess of 16 times the annual
French social security cap.
In February 2009, the Board of Directors
reviewed the recommendations of the Afep-
Medef Code, and checked that the estimated
pension amount paid to the Chairman and
Chief Executive Officer related to these two
plans would remain below 40% of his last total
cash compensation (variable and fixed). This
cap will be applied as the rule adopted by the
Board of Directors for any future Corporate
Officer.
There is no specific pension plan for Corporate
Officers.
SUMMARY
CORPORATE OFFICER EMPLOYMENT CONTRACT SUPPLEMENTARY PENSION PLAN
SEVERANCE ARRANGEMENTS PAID OR TO BE PAID IN CASE OF
TERMINATION OR CHANGE OF POSITION
NON COMPETITION CLAUSE PAYMENTS
Yes No Yes No Yes No Yes No
Bruno Lafont *
Chairman and Chief
Executive Officer
(see above) (see above) (see above)
* Bruno Lafont was appointed as Director on May 25, 2005, Chief Executive Officer on January 1, 2006 and Chairman and Chief Executive Officer on May 3, 2007. His Director office
was renewed by the General Meeting on May 6, 2009.
Registration Document | 2011 | Lafarge98

CORPORATE GOVERNANCE AND COMPENSATIONS
5
5.5 Long-term incentives (stock-options and performance share plans)
5.4.3 Total compensation of the Chairman and Chief Executive Officer and Executive Officers in 2011 and 2010, pension and other retirement benefits
THE EXECUTIVE OFFICERS INCLUDE BRUNO LAFONT, CHAIRMAN AND CHIEF EXECUTIVE OFFICER, AND THE MEMBERS
OF THE EXECUTIVE COMMITTEE.
2011 2010
Average number of persons (1) 10.0 10.7
Amount paid (million euros) (2) 8.9 10.1
Pension commitment (million euros) (3) 35.9 30.2
(1) All those who were Executive Officers for the period of the year during which they were Executive Officers.
(2) This amount includes:
- the fixed compensation of Executive Officers for the related year;
- a qualitative performance component, a financial performance component and a collective performance component as the variable portion paid for the preceding year;
- directors’ fees paid by Lafarge S.A. to Bruno Lafont.
(3) The evolution of the global commitment between 2011 and 2010 is mainly explained by a normal increase linked to a closer retirement date and by a discount rate fluctuation.
5.5 Long-term incentives (stock-options and performance share plans)
5.5.1 Grant policy – Performance conditions and holding rule
Grant policy
The objective of the Group’s remuneration
policy is to reward and retain key talent
while providing managers and employees
with an opportunity to share in the success
of the Group’s business through the grant of
stock-options and performance shares (free
allotment of shares), which are connected
to the Group’s long-term strategy. Stock-
options are granted to senior management
and the Chairman and Chief Executive
Officer. Performance shares are granted to
middle management, expatriates and other
employees in recognition of their commitment
and achievements for the Group. Since the
Board of Directors’ meeting held on March 15,
2011, performance shares may also be
granted to the Chairman and Chief Executive
Officer and senior management.
Stock-options and performance shares are
granted by the Board of Directors upon
a recommendation of the Remuneration
Committee. Grants are made annually, usually
during a Board of Directors meeting held in
March.
Regarding stock-options, the Group’s practice
since 2002 is to allocate share subscription
options. No discount is applied to the exercise
price.
Fo l l ow ing the A fep -Mede f Code
recommendations, the Board of Directors
decided to limit the number of stock-
options or performance shares attributable
to Corporate Officers. Under this rule, the
proportion of options and performance shares
attributable to Corporate Officers may not
exceed respectively 10% of the total amount
of options and 10% of the total amount of
performance shares granted during any given
fiscal year.
Performance conditions
PROPORTION OF OPTIONS OR PERFORMANCE SHARES SUBJECT TO PERFORMANCE CONDITIONS
In line with the Afep-Medef Code, the Group’s
policy approved by the Board of Directors in
2009 is that all stock options granted to the
Chairman and Chief Executive Officer must be
conditional upon performance requirements.
This is also the case for performance shares,
which may now be granted also to the
Chairman and Chief Executive Officer.
All stock options granted to the Chairman and
Chief Executive Officer since 2010 are subject
to performance requirements (as the Board
of Directors did not grant any stock options
to the Chairman and Chief Executive Officer
in 2009).
In addition stock options and performance
shares, granted to members of the Executive
Committee are also conditional upon
performance requirements, in an increasing
proportion since 2003, which reached 100%
in 2012.
Stock options and performance shares
granted to other employees is also conditional
upon performance requirements, in a
proportion depending on the employee’s
level of responsibility. In 2011 and 2012, the
proportion of grants subject to performance
requirements was at least 25%.
PROPORTION OF THE GRANTS OF THE CHAIRMAN AND CHIEF EXECUTIVE OFFICER AND EXECUTIVE COMMITTEE MEMBERS WHICH ARE
CONDITIONAL UPON PERFORMANCE REQUIREMENTS
2003 AND 2004 2005 TO 2007 2008 2009 2010 2011 2012
Chairman and Chief Executive
Officer and other Corporate
Officers
43% 50% 50% No grant 100% 100% 100%
Executive Committee members 30% 50% 63% 70% 70% 80% 100%
99Lafarge | Registration Document | 2011

5CORPORATE GOVERNANCE AND COMPENSATIONS5.5 Long-term incentives (stock-options and performance share plans)
APPLICABLE PERFORMANCE CONDITIONS
Performance shares and stock-options
granted in 2012 and 2011 are conditional
upon several performance criteria which have
been set in advance, and this applies to all
beneficiaries.
2011 grants
The performance conditions for 2011
grants are both external and internal. These
conditions must be met over a three year
period. The level of achievement of each
condition is to be measured at the end of
2011, 2012 and 2013 and achievement is
calculated as an average of these three years.
The external condition is based on the
Group’s relative performance compared to its
competitors in relation to the following: return
on capital employed (Roce), total shareholder
return (TSR) and free cash flow (FCF). The
Group’s relative performance on these three
criteria must be within the top tier of the
benchmark for the performance condition
to be met. If not, entitlement to half of the
grant submitted to performance conditions is
cancelled.
The internal performance conditions, which
apply to the other half of the grant subject
to performance conditions, are based on
free cash flow (FCF) and return on capital
employed (Roce) targets. Three levels have
been set for each of these two targets, in
line with the Group’s strategic plan. The
percentage of entitlement to the grant which
is subject to performance conditions depends
on the level of achievement of each target. The
percentages are as follows, for each target:
12.5% if the first level is achieved, 18.75% if
the second level is achieved and 25% if the
third level is achieved.
The levels set to achieve 100% of the internal
performance conditions are ambitious and
can represent up to 150% of annual objectives
set in the Group’s strategic plan.
The proportion of performance shares and
stock-options subject to these performance
criteria depends on the level of responsibility
of the eligible population.
Prior grants
In 2009 and 2010, stock-options granted to
members of the Executive Committee and
some senior executives were also conditional
upon several performance criteria, which were
external based on the Group’s performance
compared to competitors and internal based
on free cash flow, return on capital employed,
Ebitda or cost reduction targets. These criteria
were alternate or combined in part, depending
on the grant year and on the level of
responsibility of the eligible population. These
criteria also applied to stock-options granted
to the Chairman and Chief Executive Officer
in 2010 (as the Chairman and Chief Executive
Officer did not receive any stock-options in
2009). Part of the performance conditions
applicable to the grants made in 2010 to the
Chairman and Chief Executive Officer as well
as to the members of the Executive Committee
were not met and the corresponding stock-
options have been cancelled.
In 2007 and 2008, stock-options granted to
the Chairman and Chief Executive Officer,
members of the Executive Committee
and some senior executives had for sole
performance condition cost reduction targets
as part of the Excellence 2008 program.
From 2007 until 2010, the performance
condition applicable to stock-options and
performance shares granted to employees
(other than members of the Executive
Committee and some senior executives) was
the achievement of cost reduction targets as
part of the Excellence 2008 program (for 2007
and 2008 grants) and the Excellence 2010
program (for 2009 and 2010 grants).
All performance conditions based on
the cost reduction targets set out in the
Excellence programs have been met.
SUMMARY OF THE PERFORMANCE CONDITIONS APPLICABLE TO THE GRANTS OF THE CORPORATE OFFICERS AND MEMBERS
OF THE EXECUTIVE COMMITTEE
Corporate Officers Executive Committee Members
2007
and 2008 Internal Conditions “Excellence 2008” cost reduction targets
2009
External Condition
No grant
Lafarge’s relative performance compared to peers (2009, 2010 and 2011 average).
If the external condition is not met in 2012, a new test will be implemented in 2013 and 2015.
Internal Conditions FCF and Roce targets (2009, 2010 and 2011 average).
2010 External Condition Lafarge’s relative performance compared to peers (2010, 2011 and 2012 average).
Internal Conditions FCF and Roce targets (2010, 2011 and 2012 average).
2011 External Condition Lafarge’s relative performance compared to peers (2011, 2012 and 2013 average).
Internal Conditions
FCF and Roce targets (2011, 2012 and 2013 average).
The percentage of entitlement to the grant subject to performance conditions depends on the level of achievement
(there are 3 levels for each of the FCF and Roce targets).
2012 External Condition Lafarge’s relative performance compared to peers (2012, 2013 and 2014 average).
Internal Conditions
FCF and Roce targets (2012, 2013 and 2014 average). The percentage of entitlement to the grant subject to
performance conditions depends on the level of achievement (there are 3 levels for each of the FCF and Roce targets).
Part of the grant of members of the Executive Committee is subject to an internal performance condition relating
to 2012 cost reduction targets.
Holding rule – hedging instruments
The Chairman and Chief Executive Officer
is required to hold 50% of shares resulting
from the exercise of stock-options for each
allocation and 50% of performance shares
acquired at the end of the holding period
for each allocation, until the shares held by
the Chairman and Chief Executive Officer
(whatever their origin) represent an aggregate
amount equivalent to 3 years of their last fixed
pay (based on a calculation taking in account
the share price (i) at the time of each exercise
of stock-options or (ii) at the end of the holding
period for performance shares). This rule is
applicable to all exercises of options carried
out for options awarded that have not yet
been exercised and to all performance shares
granted yet to be acquired, until the end of
the Chairman and Chief Executive Officer’s
mandate.
Registration Document | 2011 | Lafarge100

CORPORATE GOVERNANCE AND COMPENSATIONS
5
5.5 Long-term incentives (stock-options and performance share plans)
In addition, each member of the Executive
Committee is required to (i) invest one third of
the net theoretical gain after tax realized upon
exercise of his stock purchase or subscription
options in Lafarge shares each year and (ii)
hold one third of the performance shares
acquired at the end of the holding period for
each allocation, until each holds in aggregate
the equivalent in value of his fixed annual
remuneration in Lafarge shares and until the
term of his position as member of the Group
Executive Committee.
The Chairman and Chief Executive Officer and
members of the Executive Committee are not
allowed to use hedging instruments in relation
to options and performance shares granted.
Insider dealing rules relating to the sale of shares resulting from stock option and performance share plans
Specific insider dealing rules apply to the
sale of performance shares and to the sale
of shares obtained through the exercise
of stock options, when the sale and the
exercise are simultaneous. In these cases,
Group Executives (including Directors and
members of the Executive Committee) are
prohibited from trading in the Company’s
securities during non authorized periods.
These periods start twenty days prior to the
date of publication of quarterly, half-yearly or
annual results and end ten trading days after
such publication.
5.5.2 Stock-option plans
Total stock-options outstanding at the end of
December 2011 were 8,511,063 representing
approximately 2.96% of our outstanding
shares on that date.
As of the date of this Registration Document all
the stock-option exercise prices of the options
attributed and capable of being exercised are
above the Lafarge share price.
Main terms
STOCK-OPTION TERMS
All stock-options are valid for a period of
10 years.
The exercise price of options is set as the
average of the share price during the twenty
trading days preceding the date of grant by the
Board of Directors. No discount is applied to
the exercise price.
TERMS OF EXERCISE
Stock-options granted are subject to a vesting
period. Since December 2001, the vesting
period corresponds to 4 years.
This vesting period also applies to the stock-
options granted by the Board as part of the
LEA 2002 plan (share offering reserved
for employees enabling them to subscribe
between 1 and 110 shares, with the right to
receive one option for every share purchased
beginning with the eleventh share).
For stock options granted since 2007, this
restriction on availability of the stock options
will automatically cease to apply if, within this
4 year period, there is a public offering for
Lafarge S.A.’s shares or Lafarge S.A. merges
with or is absorbed by another company.
CANCELLATION OF OPTIONS
Stock-options not exercised within 10 years of
their date of grant are cancelled.
Since 2007, stock-options are also cancelled
in specific circumstances, such as resignation
or termination of employment. The right
to stock-options may be maintained if the
beneficiary’s employing company is sold
outside the Group.
Fiscal year 2011: stock-options granted to the Chairman and Chief Executive Officer and to largest beneficiaries
The tables below set forth the following
information related to Mr Bruno Lafont,
Chairman and Chief Executive Officer:
• options granted by Lafarge and Group
subsidiaries in 2011;
• options exercised in 2011;
• total number of options outstanding at
December 31, 2011.
OPTIONS GRANTED IN 2011 TO THE CHAIRMAN AND CHIEF EXECUTIVE OFFICER
PLAN NO. AND DATE OF GRANT
TYPE OF OPTIONS
VALUATION OF OPTIONS PER ACCOUNTING TREATMENT USED IN THE CONSOLIDATED
ACCOUNTS *(EUROS)
TOTAL NUMBER OF OPTIONS
EXERCISE PRICE (EUROS)
EXERCISE PERIOD
Bruno Lafont
OSA 2011
03/15/2011 Subscription 536,200 70,000 44.50
03/15/2015 to
03/14/2021
OPTIONS EXERCISED BY THE CHAIRMAN AND CHIEF EXECUTIVE OFFICER
PLAN NO. AND DATE OF GRANT TOTAL NUMBER OF OPTIONS EXERCISEDEXERCISE PRICE
(EUROS)
Bruno Lafont The Chairman and Chief Executive Officer did not exercise any option in 2011
OPTIONS GRANTED BY US AND OUR CONSOLIDATED SUBSIDIARIES TO THE CHAIRMAN AND CHIEF EXECUTIVE OFFICER
OUTSTANDING AT DECEMBER 31, 2011
OPTIONS EXERCISABLE AT DECEMBER 31, 2011 OPTIONS NOT EXERCISABLE AT DECEMBER 31, 2011 TOTAL
Bruno Lafont 284,309 * 308,834 * 593,143 *
* Including options, exercisability of which is conditional upon performance conditions.
Mr Bruno Lafont, Chairman and Chief Executive Officer, does not use hedging instruments in relation to options granted.
As of the date of this Registration Document all the stock-option exercise prices of the options attributed and capable of being exercised are
above the Lafarge share price.
101Lafarge | Registration Document | 2011

5CORPORATE GOVERNANCE AND COMPENSATIONS5.5 Long-term incentives (stock-options and performance share plans)
THE FOLLOWING TABLE SHOWS THE TOTAL OF THE TEN LARGEST OPTION GRANTS MADE TO THE GROUP’S EMPLOYEES OTHER
THAN THE CHAIRMAN AND CHIEF EXECUTIVE OFFICER, AND THE TOTAL OF THE TEN LARGEST OPTION EXERCISES
TOTAL NUMBER OF OPTIONS GRANTED/SHARES SUBSCRIBED OR PURCHASED EXERCISE PRICE PLAN NO.
Options granted during the financial year by the issuer and its consolidated subsidiaries for stock-option grant purposes to the ten employees
of the issuer and its subsidiaries having received the largest grants (global information)
Lafarge 169,500 44.50 euros OSA 2011 03/15/2011
Shares* subscribed or purchased during the financial year as a result of the exercise of stock-options of the issuer and its consolidated subsidiaries
for stock-option grant purposes, by the ten employees of the issuer and its subsidiaries having subscribed or purchased the largest number of shares
(global information)
Lafarge The Group’s employees did not exercise any option in 2011
* One share per option.
Directors, Chairman and Chief Executive Officer and Executive Officers’ stock-options
At December 31, 2011, the Directors,
Chairman and Chief Executive Officer and
Executive Officers (listed in Section 5.3
(Executive Officers)) held 20.68% of
unexercised options, of which 6.97% were
held by the Chairman and Chief Executive
Officer.
Stock-options outstanding in 2011
The total number of shares that could be
subscribed or purchased upon exercise of the
options, and the exercise price set forth in the
following tables have been readjusted since
the date of grant to reflect transactions that
have affected option value, such as certain
increases in the share capital or the issue of
performance shares to existing shareholders,
to maintain a constant total option value for
each beneficiary as provided by law.
OPTIONS TO SUBSCRIBE FOR SHARES GRANTED FROM DECEMBER 13, 2001 TO DECEMBER 16, 2005
OSA 2001 12/13/2001
OSA 2002-LEA 05/28/2002**
OSA 2002-2 12/11/2002
OSA 2003 12/10/2003
OSA 2004 12/14/2004
OSA 2005 12/16/2005
Allotment authorized by the Shareholders’ Meeting of 05/28/2001 05/28/2001 05/28/2001 05/20/2003 05/20/2003 05/25/2005
Date of allotment by the Board of Directors 12/13/2001 05/28/2002 12/11/2002 12/10/2003 12/14/2004 12/16/2005
Type of options subscription subscription subscription subscription subscription subscription
The total number of shares that could be subscribed
upon exercise of the options 1,403,607 539,000 545,730 1,427,604 791,575 1,466,294
Of which by Directors and Chairman and Chief
Executive Officer
Bruno Lafont 12,296 124 12,296 28,925 34,709 69,418
Bertrand Collomb 147,549 - - 92,556 46,279 46,278
Initial beneficiaries (total) 1,703 14,364 421 1,732 479 1,916
Available for exercise from 12/13/2005 05/28/2006 12/11/2006 12/10/2007 12/14/2008 12/16/2009
Option exercise period lapses 12/13/2011 05/28/2012 12/11/2012 12/10/2013 12/14/2014 12/16/2015
Exercise price (euros) 83.12 87.98 64.38 57.00 61.19 62.78
Total number of options subscribed
as at December 31, 2011 328,717 104,831 218,427 263,473 9,134 45,975
Total number of options cancelled or that have lapsed* 1 074 890 5 763 8,726 55 790 35 485 74 526
OPTIONS OUTSTANDING AT DECEMBER 31, 2011 0 428,406 318,577 1 108 341 746 956 1 345 793
* In accordance with the terms of the plan.
** Plan “Lafarge en action 2002”.
Registration Document | 2011 | Lafarge102

CORPORATE GOVERNANCE AND COMPENSATIONS
5
5.5 Long-term incentives (stock-options and performance share plans)
OPTIONS TO SUBSCRIBE FOR SHARES GRANTED FROM MAY 24, 2006 TO MARCH 15, 2011
OSA 2006-1 05/24/2006
OSA 2006-2 05/24/2006
OSA 2007 06/15/2007
OSA 2008 03/26/2008
OSA 2009 03/25/2009
OSA 2010 03/24/2010
OSA 2011 03/15/2011
Allotment authorized by the
Shareholders’ Meeting of 05/25/2005 05/25/2005 05/03/2007 05/03/2007 05/03/2007 05/06/2009 05/06/2011
Date of allotment by the Board of
Directors 05/24/2006 05/24/2006 06/15/2007 03/26/2008 03/25/2009 03/24/2010 03 /15 /2011
Type of options subscription subscription subscription subscription subscription subscription subscription
The total number of shares that
could be subscribed upon exercise
of the options 768,626 171,980 621,865 819,487 744,045 1,203,500 781,980
Of which by Directors and the
Chairman and Chief Executive
Officer
Bruno Lafont 69,418 - 69,418 138,834 - 100,000 70 000
Bertrand Collomb - - - - - - -
Initial beneficiaries (total) 536 33 169 184 197 596 206
Available for exercise from 05/24/2010 05/24/2010 06/15/2011 03/26/2012 03/25/2013 03/24/2014 03 /15 /201 5
Option exercise period lapses 05/24/2016 05/24/2016 06/15/2017 03/26/2018 03/25/2019 03/24/2020 03 /15 /2021
Exercise price (euros) 84.42 84.42 110.77 96.18 30.74 51.30 44.5
Total number of options subscribed
as at December 31, 2011 3,050 0 0 0 0 0 0
Total number of options cancelled or
that have lapsed* 35 853 15 785 53 205 45 217 39 115 342 193 14,075
OPTIONS OUTSTANDING
AT DECEMBER 31, 2011 729 723 156 195 568 660 774 270 704 930 861 307 767,905
* In accordance with the terms of the plan.
OPTIONS TO PURCHASE SHARES GRANTED
OAA 2001 12/13/2001
Allotment authorized by the Shareholders’ Meeting of 05/27/1999
Date of allotment by the Board of Directors 05/28/2001
Type of options purchase
The total number of shares that could be purchased upon exercise of the options 14,756
Of which by Directors and Chairman and Chief Executive Officer
Bruno Lafont -
Bertrand Collomb -
Initial beneficiaries (total) 1
Available for exercise from 05/28/2006
Option exercise period lapses 05/28/2011
Exercise price (euros) 88.27
Total number of options purchased as at December 31, 2011 0
Total number of options cancelled or that have lapsed* 14,756
OPTIONS OUTSTANDING AT DECEMBER 31, 2011 0
* In accordance with the terms of the plan.
Fiscal year 2012 : Stock-options grant
On March 15, 2012, the Board of Directors granted 789,920 options to subscribe for shares to 214 beneficiaries at an exercise price of 36
euros, out of which 70,000 options were granted to the Chairman and Chief Executive Officer.
103Lafarge | Registration Document | 2011

5CORPORATE GOVERNANCE AND COMPENSATIONS5.5 Long-term incentives (stock-options and performance share plans)
5.5.3 Performance share plans
The total number of outstanding performance
shares at the end of December 2011 was
679 ,510 , representing approximately 0.24 %
of our outstanding shares at December 31,
2011 .
Main terms
PERFORMANCE SHARE TERMS
Performance shares are definitively allotted
to beneficiaries upon expiry of a two-year
or three-year vesting period for French
tax residents or upon expiry of a four-year
vesting period for non-French tax residents. In
addition, French tax residents must also hold
the performance shares for a further period of
2 years following definitive allotment.
LOSS OF RIGHTS TO THE PERFORMANCE SHARES
Under certain circumstances, such as
resignation or termination of employment, the
right to performance shares will be lost during
the vesting period. The right to performance
shares may be maintained if the beneficiary’s
employer company is sold outside the Group.
Fiscal year 2011: performance shares granted to the Chairman and Chief Executive Officer
Performance shares were granted to the
Chairman and Chief Executive Officer for the
first time in 2011.
The table below sets out the information
relating to the performance shares granted to
the Chairman and Chief Executive Officer by
Lafarge S.A during fiscal year 2011.
PERFORMANCE SHARES GRANTED TO THE CHAIRMAN AND CHIEF EXECUTIVE OFFICER IN 2011
PLAN N° AND DATE OF GRANT
NUMBER OF SHARES
GRANTED
VALUATION OF SHARES PER ACCOUNTING
TREATMENT USED IN THE CONSOLIDATED ACCOUNTS
(EUROS)DATE OF
VESTING
DATE OF DEFINITIVE
ALLOTMENT PERFORMANCE CONDITIONS
Bruno Lafont
AGA 2011
05/12/2011 20,000 29.86 05/12/2014 05/12/2016
100 % of the shares granted are subject the
performance conditions, as described above
Fiscal year 2011: performance shares granted to largest beneficiaries
TOTAL OF THE TEN LARGEST PERFORMANCE SHARES GRANTS MADE TO THE GROUP’S EMPLOYEES OTHER THAN THE CHAIRMAN
AND CHIEF EXECUTIVE OFFICER
TOTAL NUMBER OF OPTIONS GRANTED/SHARES SUBSCRIBED OR PURCHASED PLAN
Performance shares granted during the financial year by the issuer and its consolidated subsidiaries for performance shares grant purposes to the ten
employees of the issuer and its subsidiaries having received the largest grants (global information)
Lafarge 17,775 AGA 2011 03/15/2011
Registration Document | 2011 | Lafarge104

CORPORATE GOVERNANCE AND COMPENSATIONS
5
5.5 Long-term incentives (stock-options and performance share plans)
Performance shares plans outstanding in 2011
PERFORMANCE SHARES GRANTED FROM JUNE 15, 2007 TO MAY 12, 2011
AGA 2007 06/15/2007
AGA 2008 03/26/2008
AGA 2009 03/25/2009
AGA 2010 03/24/2010
AGA 2011 03/15 /2011
AGA 2011 05/12 /2011
Allotment authorized by the Shareholders’ Meeting of 05/03/2007 05/03/2007 05/03/2007 05/06/2009 05/06/2009 05/12/2011
Date of allotment by the Board of Directors 06/15/2007 03/26/2008 03/25/2009 03/24/2010 03/15/2011 05/12/2011
Performance shares initially granted (total) 143,090 52,250 230,758 169,605 328,755 20,000
Of which to Directors and Chairman and Chief Executive Officer
Bruno Lafont - - - - - 20,000
Bertrand Collomb - - - - - -
Initial beneficiaries (total) 2,040 628 2,461 2,032 2,257 1
French tax residents 741 201 693 547 516 1
Non-French tax residents 1,299 427 1,768 1,485 1,741 0
Date of definitive allotment
French tax residents 06/15/2009 03/26/2010 03/25/2011 03/24/2012 03/15/2014 05/12 /2014
Non-French tax residents 06/15/2011 03/26/2012 03/25/2013 03/24/2014 03/15/2015 N/A
Date performance shares can be transferred
French tax residents 06/15/2011 03/26/2012 03/25/2013 03/24/2014 03/15/2016 05/12/2016
Non-French tax residents 06/15/2011 03/26/2012 03/25/2013 03/24/2014 03/15/2015 N/A
Performance shares cancelled* 15,835 4,875 19,698 12,695 8,500 0
Performance shares definitively alloted at December 31, 2011* 127,255 16,470 59,620 0 0 0
PERFORMANCE SHARES OUTSTANDING
AT DECEMBER 31, 2011 0 30,905 151,440 156,910 320,255 20,000
* According to the plan rules.
Directors, Chairman and Chief Executive Officer and Executive Officers’ performance shares
At December 31, 2011, the Directors,
Chairman and Chief Executive Officer and
Executive Officers (listed in Section 5.3
(Executive Officers)) held 5.26% of the
performance shares granted by the Group
(whether defintively alloted or not), of which
2.94% were held by the Chairman and Chief
Executive Officer.
Fiscal year 2012 : Performance shares grant
On March 15, 2012, the Board of Directors
granted 483,967 performance shares to
1,950 beneficiaries, of which 20,000 were
granted to the Chairman and Chief Executive
Officer.
105Lafarge | Registration Document | 2011

5CORPORATE GOVERNANCE AND COMPENSATIONS5.6 Share ownership
5.6 Share ownership
5.6.1 Directors, Chairman and Chief Executive Officer and Executive Officers share ownership
The Directors, Chairman and Chief Executive Officer and Executive Officers (listed in Section 5.3) held together 0.07% of our share capital and
0.10% of voting rights at December 31, 2011.
5.6.2 Trading in Lafarge shares by Directors, Chairman and Chief Executive Officer and Executive Officers
The following transactions in Lafarge shares were carried out by our Directors, Chairman and Chief Executive Officer and Executive Officers in 2011:
NAMENATURE
OF TRANSACTIONUNIT PRICE
(EUROS)
TOTAL AMOUNT OF TRANSACTION
(EUROS)TYPE OF FINANCIAL
INSTRUMENTPLACE
OF TRANSACTION DATE OF TRANSACTION
Philippe Charrier Acquisition 44.7139 90,064.76 Lafarge shares Euronext Paris March 4, 2011
Jean-Carlos Angulo Subscription 36.98 11,094.00 Lafarge shares Euronext Paris July 29, 2011
Jean Desazars de Montgailhard Subscription 36.98 5,177.20 Lafarge shares Euronext Paris July 29, 2011
Thomas Farrell Subscription 36.98 9,245.00 Lafarge shares Euronext Paris July 29, 2011
Jean-Jacques Gauthier Subscription 36.98 3,698.00 Lafarge shares Euronext Paris July 29, 2011
Christian Herrault Subscription 36.98 11,648.70 Lafarge shares Euronext Paris July 29, 2011
Gérard Kuperfarb Subscription 36.98 3,698.00 Lafarge shares Euronext Paris July 29, 2011
Isidoro Miranda Subscription 36.98 9,245.00 Lafarge shares Euronext Paris July 29, 2011
Eric Carl Olsen Subscription 36.98 25,886.00 Lafarge shares Euronext Paris July 29, 2011
Guillaume Roux Subscription 36.98 554.70 Lafarge shares Euronext Paris July 29, 2011
Isidoro Miranda Acquisition 28.435 4,265.25 Lafarge shares Euronext Paris August 31, 2011
Michel Bon Acquisition 26.0831 32,671.00 Lafarge shares Euronext Paris September 20, 2011
5.7 Implementation of the principle “Comply or Explain” of the Afep-Medef Code
The summary table below is a list of main exceptions to recommendations of the Afep-Medef Code.
RECOMMENDATIONS AFEP – MEDEF LAFARGE’S POSITION – EXPLANATIONS REFERENCE
Summary table of the compensations added to
the options and shares granted to the CEO
The total compensation paid to the CEO is
not added to the valuation of options and
performance shares granted to him
5.4.2 – Summary table and subsequent
paragraph
Independence criteria of the Directors The recommended 12-year limitation on
length of service as Director is ruled out
5.1.3 – paragraph “Independence Criteria”
Employment contract of the legal representative The employment contract of the CEO is
maintained
5.4.2 – paragraph “Employment contract
and Severance arrangements for the
Chairman and Chief Executive Officer”
Registration Document | 2011 | Lafarge106

SHAREHOLDERS AND LISTING
6.1 MAJOR SHAREHOLDERS AND SHARE CAPITAL DISTRIBUTION 1086.1.1 Major shareholders 108
6.1.2 Share capital distribution 108
6.1.3 Pledge of our shares 109
6.2 SHAREHOLDERS’ AGREEMENT 109Shareholders’ agreement with the Sawiris family
and NNS Holding Sàrl 109
6.3 THRESHOLD NOTIFICATIONS IMPOSED BY LAW AND DECLARATIONS OF INTENT 110Groupe Bruxelles Lambert 110
NNS Holding Sàrl and Nassef Sawiris 110
Dodge & Cox 110
Southeastern Asset Management, Inc. 110
Others 111
6.4 EMPLOYEE SHARE OWNERSHIP 111Employee Stock Ownership Policy 111
LEA 2011 – Share capital increase for employees 111
Summary table 111
6.5 LISTING 112Listing on NYSE Euronext (Paris) 112
Transactions and market capitalization 112
American Depository Receipts (ADRs) Program 112
6
107Lafarge | Registration Document | 2011

6SHAREHOLDERS AND LISTING6.1 Major shareholders and share capital distribution
108
6.1 Major shareholders and share capital distribution
The following tables set out, to the best of our knowledge, the principal holders of Lafarge S.A.’s share capital at December 31, 2011 and 2010,
their percentage ownership and geographic distribution:
6.1.1 Major shareholders
At December 31,
2011 2010
Number of shares held
Number of votes held
% of total shares issued
% of total voting rights
Number of shares held
Number of votes held
% of total shares issued
% of total voting rights
Groupe Bruxelles Lambert 60,307,265 109,614,530 20.9 27.4 60,307,265 90,568,625 21.1 24.6
NNS Holding Sàrl 40,063,011 79,853,128 13.9 19.9 39,827,277 69,862,917 13.9 19.0
Dodge & Cox 17,214,899 24,077,032 5.9 6.0 13,405,899 20,165,524 4.7 5.5
Southeastern Asset
Management, Inc. 14,846,018 14,846,018 5.2 3.7 - - - -
Other institutional
shareholders * 121,255,950 129,545,022 42.4 32.4 140,687,036 148,758,866 49.1 40.5
Individual shareholders 33,326,927 41,847,772 11.6 10.5 31,862,744 37,928,003 11.1 10.3
Treasury shares 233,448 233,448 ** 0.1 0.1 363,558 363,558 ** 0.1 0.1
TOTAL 287,247,518 400,016,950 100.0 100.0 286,453,779 367,647,493 100.0 100.0
Source: King Worldwide.
* Including 51,581 Lafarge S.A. shares currently held by Cementia Holding AG for the benefit of shareholders who have not yet requested the delivery of their Lafarge S.A. shares,
following the squeeze-out procedure carried out by Lafarge S.A. in 2002 with respect to the Cementia Holding AG shares.
** Theoretical voting rights; at a General Meeting these shares bear no voting right.
6.1.2 Share capital distribution
DISTRIBUTION BY TYPE OF SHAREHOLDER
%
* Including 1.77% of the share capital held by Group employees.
TOTAL
Individual shareholders* 11.6
Treasury shares 0.1
French institutions 15.7
Non-French institutions 72.6
100.0
Based on our knowledge, eight institutional shareholders held between 1% and 4% of our outstanding shares at December 31, 2011. Of these
institutional shareholders, seven held between 1% and 2% of our shares and 1 held between 2% and 3% of our shares.
Registration Document | 2011 | Lafarge108

SHAREHOLDERS AND LISTING
6
6.2 Shareholders’ agreement
GEOGRAPHICAL DISTRIBUTION
At December 31,
2011 2010
Number of shares held % of total shares issued Number of shares held % of total shares issued
France 78,141,197 27.2 79,421,530 27.7
Belgium * 61,844,821 21.5 63,824,239 22.3
United States of America 50,583,969 17.6 43,269,341 15.1
Luxembourg ** 40,880,143 14.2 41,310,813 14.4
Rest of the World 55,797,388 19.5 58,627,856 20.5
TOTAL 287,247,518 100.0 286,453,779 100.0
Source: King Worldwide.
* Including shares held by Groupe Bruxelles Lambert.
** Including shares held by NNS Holding Sàrl.
GEOGRAPHICAL DISTRIBUTION
%
France
Belgium
TOTAL 100.0
United States of America
Luxembourg
27.2
17.6
21.5
14.2
Rest of the world 19.5
6.1.3 Pledge of our shares
25,838,437 of our shares held in registered form were pledged at December 31, 2011, representing 9% of our share capital and 13% of our
voting rights. 99.75% of these pledged shares were held by NNS Holding Sàrl.
6.2 Shareholders’ agreement
Shareholders’ agreement with the Sawiris family and NNS Holding Sàrl
A 10-year shareholders’ agreement was
entered into with certain members of the
Sawiris family and NNS Holding Sàrl on
December 9, 2007, following the acquisition
of Orascom Cement (the cement activity of
Orascom Construction Industries S.A.E.,
acquired by the Group on January 23, 2008).
This agreement contains certain commitments
regarding the shares issued for their benefit
as a result of the reserved capital increase of
2008.
In particular, the shareholders’ agreement
contained (i) a lock-up commitment of four
years (with limited exceptions) followed by
a three-year period for phased disposals;
(ii) a standstill commitment for a four-year
period not to acquire more than 8.5% of
the share capital in addition to their current
shareholding, such holding in any case not
to exceed a total of 20% of the share capital
or any other higher level of shareholding
that would come to be held by another
shareholder acting alone or in concert; and
(iii) a commitment not to act in concert with
a third party in relation to Lafarge S.A. shares
for a 10-year period.
In consideration of these commitments, the
Company has undertaken to make its best
efforts to ensure that NNS Holding Sàrl is
entitled to nominate two of its representatives
as members of the Board of Directors as long
as NNS Holding Sàrl and the Sawiris family
together hold more than 10% of the share
capital of the Company and comply with all
their obligations under this agreement.
From March 27, 2012 onwards, the shares
held by NNS Holding Sàrl and certain
members of the Sawiris family will no longer
be subject to the lock-up commitment and
acquisitions of Lafarge S.A. shares will be
unrestricted. The only remaining covenants
will be information covenants as well as the
commitment not to act in concert with a
third party.
109Lafarge | Registration Document | 2011

6SHAREHOLDERS AND LISTING6.3 Threshold notifications imposed by law and declarations of intent
6.3 Threshold notifications imposed by law and declarations of intent
Groupe Bruxelles Lambert
In 2011, Groupe Bruxelles Lambert declared
having exceeded the threshold of 25% of
Lafarge S.A. voting rights on April 28, 2011
and holding 60,307,265 Lafarge S.A. shares
representing 109,614,530 voting rights
(corresponding to 21.05% of the share capital
and 28.46% of the voting rights), as a result of
the allotment of double voting rights.
It was specified that there was no financing or
securities borrowing associated to this threshold
crossing as it resulted from the allotment of
double voting rights and Groupe Bruxelles
Lambert confirmed that it was not party to any
agreement for the temporary transfer of its
Lafarge S.A. shares or voting rights.
As part of this notification, Groupe Bruxelles
Lambert declared that it was acting in concert
with those controlling Groupe Bruxelles
Lambert (legal presumption) but not with any
other third party, that it was not contemplating
further acquisitions (without excluding the
possibility of arbitrage) and that it had no
intention of taking control of Lafarge S.A.
Groupe Bruxelles Lambert also confirmed
supporting the strategy of the Board of
Directors of Lafarge S.A., that it had no
intention of either soliciting the appointment
of additional Directors other than its existing
three representatives to the Lafarge Board of
Directors or implementing the transactions
listed in paragraph 6 of article 223-17 of the
general regulations of the AMF, ie any of the
following:
• merger, restructuring, liquidation or transfer
of a substantial part of the Company’s
assets, or of any controlled person as
defined by article L. 233-3 of the French
Code of Commerce;
• change to the Company’s articles of
association;
• change to the Company’s business;
• delisting of a category of securities issued
by the Company;
• issue of Lafarge S.A. securities.
In 2010, Groupe Bruxelles Lambert declared
having fallen below the 25% threshold of
the voting rights of Lafarge S.A. on June 17,
2010 and holding 60,307,265 Lafarge S.A.
shares representing 85,762,580 voting rights
(corresponding to 21.05% of the share capital
and 23.85% of the voting rights).
NNS Holding Sàrl and Nassef Sawiris
In 2011, Mr Nassef Sawiris declared
having exceeded the threshold of 20% of
Lafarge S.A. voting rights on April 28, 2011,
acting in concert with NNS Holding Sàrl
(the Sawiris family holding company) and
holding in concert 40,297,995 Lafarge S.A.
shares representing 80,126,943 voting rights
(corresponding to 14.07% of the share capital
and 21.14% of the voting rights), as a result of
the allotment of double voting rights.
It was specified that since the threshold was
crossed as a result of the allotment of double
voting rights, as opposed to the acquisition of
shares, there was no financing or securities
borrowing associated to this threshold
crossing.
NNS Holding Sàrl and Nassef Sawiris declared
acting in concert, it being specified that as
a result of the shareholders agreement of
December 9, 2007 entered into between
Lafarge S.A. and NNS Holding Sàrl, they had
undertaken not to act in concert with any
third party (with the exception of members of
Nassef Sawiris’ family and related companies)
for the duration of the shareholders agreement
(10 years).
NNS Holding Sàrl and Nassef Sawiris also
declared reserving their right to proceed to
further acquisitions (within the limits set by
the shareholders agreement of December 9,
2007, described further in 6.2 Shareholder
agreement with the Sawiris family and NNS
Holding Sàrl), having no intention of taking
control of Lafarge S.A. and renewing their
support to the management of the Company.
NNS Holding Sàrl and Nassef Sawiris further
declared that they were not party to any
agreement for the temporary transfer of
Lafarge S.A. shares or voting rights and had
no project for any:
• merger, restructuring, liquidation or transfer
of a substantial part of the Company’s
assets;
• change to the Company’s articles of
association or business;
• delisting of a category of securities issued
by the Company;
• issue of Lafarge S.A. securities;
• request for the appointment of further
Board members.
In addition, it was noted for information that
a cash-settled share forward transaction had
been entered into by NNS Holding (Cayman),
the indirect majority shareholder of NNS
Holding Sàrl. This forward transaction, which
allows for early termination, does not give NNS
Holding (Cayman) any right to Lafarge S.A.
shares nor voting rights in the Company.
In 2010, Mr Nassef Sawiris declared having
exceeded the threshold of 15% of the voting
rights in Lafarge S.A. on March 27, 2010,
acting in concert with NNS Holding Sàrl
(the Sawiris family holding company) and
holding in concert as at March 31, 2010
39,828,948 Lafarge S.A. shares representing
65,362,911 voting rights (corresponding to
13.90% of the share capital and 17.75% of
the voting rights), as a result of the allotment
of double voting rights.
As part of this notification, NNS Holding Sàrl
and Nassef Sawiris made declarations of
intent similar to the ones made in 2011 as
set out above.
Dodge & Cox
In 2011, Dodge & Cox, acting for client
accounts, declared having exceeded
the 5% threshold of the share capital of
Lafarge S.A. on August 30, 2011 and holding
for the accounts of the above mentioned
clients 14,375,379 shares representing
21,135,004 voting rights, corresponding to
5.04% of the share capital and 5.33% of the
voting rights of Lafarge S.A. This threshold
crossing results from the acquisition of
Lafarge S.A. shares on the market.
In 2010, Dodge & Cox, acting for client
accounts, declared having exceeded the 5%
threshold of the voting rights of Lafarge S.A.
on January 11, 2010, and holding for the
accounts of the above mentioned clients
12,942,274 Lafarge S.A. shares representing
19,626,899 voting rights corresponding to
4.52% of the share capital and 5.83% of the
voting rights as a result of the allotment of
double voting rights.
Southeastern Asset Management, Inc.
I n 2 0 1 1 , S o u t h e a s t e r n A s s e t
Management, Inc., acting for client accounts,
declared having exceeded the 5% threshold
of the share capital of Lafarge S.A. on
Registration Document | 2011 | Lafarge110

SHAREHOLDERS AND LISTING
6
6.4 Employee Share Ownership
November 24, 2011 and holding for the
accounts of the above mentioned clients
14,846,018 shares representing 14,846,018
voting rights, corresponding to 5.17% of the
share capital and 3.75% of the voting rights
of Lafarge S.A. This threshold crossing results
from the acquisition of Lafarge S.A. shares on
the market and off market.
Southeastern Asset Management, Inc., did
not notify any threshold crossing during 2010.
Others
To our knowledge, there is no shareholder
holding more than 5% of our share capital
or voting rights other than those mentioned
above.
6.4 Employee Share Ownership
As at December 31, 2011, Lafarge employees
held 1.77% of the share capital and 2.14%
of voting rights. The employee savings fund
Lafarge 2000 represented 0.52% of the
share capital and the balance was held by
employees in direct ownership (registered
account).
Employee Stock Ownership Policy
Since 1961, date of the first share offering
reserved for employees, Lafarge has developed
an active employee share ownership program.
The Group is convinced that being both an
employee and a shareholder strengthens the
tie with the Company and wishes to provide
this opportunity on a regular basis to the
largest possible number of employees on a
worldwide basis.
Lafarge launched six employee stock
ownership programs called “Lafarge en
action” (LEA) since 1995, enabling employees
participating in these plans to subscribe
to Lafarge S.A. shares, with a discount and an
employer matching contribution. The amount
of the employer contribution, applied to the
first shares purchased, depends on the gross
domestic product of the relevant country. The
shares are subject to a five year holding period
save for early unblocking events.
The plans launched in 1995 and 2002 gave
employees the additional right to receive one
option for every share purchased beginning
with the eleventh share.
Lafarge also set up an employee savings fund
in 1990 for its French employees, part of the
Group Savings Plan, called Lafarge 2000,
and under which participating employees can
contribute to a savings plan linked to the value
of the Lafarge S.A. shares and benefit from an
employer contribution.
LEA 2011 – Share capital increase for employees
On May 12, 2011, the Board of Directors,
acting by virtue of a delegation of the Annual
Shareholders Meeting of May 12, 2011,
decided on the terms of the LEA 2011 scheme.
The goal of this employee stock ownership
plan was to reach all employees of Lafarge,
meaning that it was offered in all countries
where it was legally feasible. The subscription
price for the shares was set at 36.98 euros,
corresponding to 80% of the reference price
calculated on the basis of the average opening
share price on Euronext Paris S.A. over the
twenty trading days preceding May 12,
2011. With LEA 2011, each employee
was offered the possibility to subscribe for
Lafarge S.A. shares while benefiting from a
matching contribution from their employer
on the first 15 shares purchased. The
share capital increase reserved to eligible
employees was realized on July 29, 2011;
the total amount of the share capital increase
was 3,174,956 euros, corresponding to the
issuance of 793,739 shares. The subscription
rate was 44%.
In the case where it was not possible to offer
the LEA program in a country, employees
could subscribe to an alternative plan
providing the same economical benefits.
Summary table
The following table sets out the main terms of employee stock ownership plans:
LEA 2011 LEA 2009 LEA 2005 LEA 2002 LEA 1999 LEA 1995
Number of countries covered 58 55 46 47 33 21
Number of eligible employees 57,588 70,085 51,150 53,818 40,570 20,113
Subscription rate 44% 53.0% 48.8% 53.3% 51.6% 74.6%
Total number of shares subscribed 793,739 1,101,834 576,125 708,718 493,954 482,582
Maximum number of shares offered to
each employee Unlimited* Unlimited* 110 110 110 110
Subscription price (euros) 36.98 48.80 57.31 81.84 73.17 39.94
Associated stock-option grant No No No Yes No Yes
TOTAL NUMBER OF STOCK-OPTIONS
GRANTED N/A N/A N/A 437,373 N/A 331,060**
* Except for local regulations.
** These stock-options may no longer be exercised.
111Lafarge | Registration Document | 2011

6SHAREHOLDERS AND LISTING6.5 Listing
6.5 Listing
Listing on NYSE Euronext (Paris)
The Company’s shares are listed on
NYSE Euronext (Paris), under code ISIN
FR0000120537 and symbol “LG”.
Lafarge’s shares are traded on the Paris stock
exchange since 1923 and have been part of
the French CAC 40 index since its creation on
December 31, 1987.
All of our shares are subject to the same
voting right conditions, except for our treasury
shares, which at General Meetings bear no
voting rights, and our shares held in registered
form for over two years, which carry double
voting rights.
See Section 8.5 (Articles of association
(statuts))
Transactions and market capitalization
Our market capitalization totalled 7.8 billion
euros at December 31, 2011.
The following tables show the volume and high
and low closing price of our shares of common
stock, as reported by NYSE Euronext (Paris).
FIVE MOST RECENT FINANCIAL YEARS
2007 2008 2009 2010 2011
22.28
99.51
32.13 26.06
1,235
1,554 1,509
48.76
137.20125.45
66.59
35.57
1,4671,596
63Average daily volume (in thousands of shares)
High intraday (in euros)
Low intraday (in euros)
Source: NYSE Euronext (Paris).
THE LAST SIX MONTHS
Sept. 11 Oct. 11 Nov. 11 Dec. 11 Jan. 12 Feb. 12
Average daily volume (in thousands of shares)
High intraday (in euros)
Low intraday (in euros)
1,8061,718
1,841
1,210 1,265
1,573
29.39
22.28
31.82
23.37
31.88
22.82
28.78
25
32.87
26.07
35.93
31.08
Source: NYSE Euronext (Paris).
American Depository Receipts (ADRs) Program
Lafarge voluntarily delisted its American
Depository Receipts (ADRs) from the New
York Stock Exchange on September 13,
2007. The delisting became effective on
September 24, 2007. Since its delisting, the
Lafarge ADR program has been maintained
and ADRs continue to be traded over the
counter (level one program).
Each ADR represents a quarter of a share.
As of December 31, 2011, 5,864,427 ADRs
existed.
Since October 8, 2007, Lafarge is deregistered
from the Securit ies and Exchange
Commission.
Registration Document | 2011 | Lafarge112

SOCIAL AND ENVIRONMENTAL RESPONSIBILITY
7
7.1 INTRODUCTION 1147.1.1 Introduction 114
7.1.2 Ambitions 115
7.2 HEALTH AND SAFETY 1177.2.1 Safety results 117
7.2.2 Preparing the future 118
7.2.3 Providing a healthy environment for our employees 118
7.3 SOCIAL INFORMATION 1197.3.1 Headcount 119
7.3.2 Labor organization and working conditions 120
7.3.3 Social dialogue 121
7.3.4 Developing people 121
7.3.5 Diversity and inclusion 121
7.3.6 Sixth employee share ownership plan: LEA 2011 122
7.4 COMMUNITIES 1227.4.1 Community programs and partnerships 123
7.4.2 Working in partnership 123
7.5 ENVIRONMENT 1247.5.1 Climate change 124
7.5.2 Managing our emissions 126
7.5.3 Biodiversity at our sites 129
7.5.4 Water footprint 130
7.5.5 Resource management 132
7.6 SUSTAINABLE CONSTRUCTION 1347.6.1 Designing buildings for sustainability 134
7.6.2 Access to housing 134
7.6.3 Shaping Lafarge R&D 135
7.6.4 Lafarge Invention Awards 135
7.7 TABLE OF KEY PERFORMANCE INDICATORS 136
7.8 REPORTING METHODOLOGY 1387.8.1 Reporting standards 138
7.8.2 Scope of consolidation
and reporting methodologies 138
7.8.3 Control and assurance 139
7.9 INDEPENDENT ASSURANCE REPORT ON ENVIRONMENTAL AND SOCIAL INFORMATION BY ERNST & YOUNG 140
113Lafarge | Registration Document | 2011

7SOCIAL AND ENVIRONMENTAL RESPONSIBILITY7.1 Introduction
114
7.1 Introduction
7.1.1 Introduction
This year we present for the first time our most
important sustainable development indicators
together with our financial results. This type
of reporting mirrors the trend of integrating
sustainable development into the business
and therefore they are reported together.
Regulatory reporting is moving in the same
direction and this report precedes by one year
the «Environmental Grenelle» timeline (new
French regulations relating to sustainable
development). For many years Lafarge has
published a separate Sustainability Report,
but with the integration of the data into this
Registration Document, plus an expansion of
other sustainable development information on
our web site, we are not publishing a separate
Sustainable Development report for 2011 . The
comments from our independent Stakeholder
Panel that have traditionally appeared in our
Sustainability Report will now be available on
our web site.
Lafarge has continued to improve in 2011 by
being focused on our global priorities while
accelerating our actions within each country
where we operate.
The difficult economic context of 2011 did not
slow our progress in achieving our 2012 set
of ambitions. In 2011, we have been ranked
10th by the Carbon Disclosure Project, one
of the highest rankings of any industrialized
company and as we did the year before, once
again, obtained an A+ Reporting from Global
Reporting Initiative (GRI).
Lafarge announced its new CO2 objectives for
2020: in 2010, after fulfilling our previous goal
for 2011, we have committed to reduce our
net emissions by 33% in 2020 (compared to
1990 baseline), and in addition have included
specific targets on innovation and sustainable
construction.
In order for Lafarge to accelerate its contribution
towards a more sustainable world, more than
half of our Research and Development effort
has been devoted to sustainable development
this year. We have extended our offer of low
carbon materials/products and solutions and
have developed products that provide more
comfort, energy efficency, or aesthetic with
sustainable products such as Hydromedia,
a new generation concrete that allows for
better rain water management. We have also
opened laboratories devoted to sustainable
construction in India and China.
Our social and societal actions were
recognized in 2011 by Boursorama. In
2011 we have continued work on a tool to
measure our socio-economic impact around
our sites and have launched some pilot
projects on affordable housing. In order to
address young people unemployment, we
have been increasing the number of student
apprentices we employ in order to give them
work experience. Lafarge continues to fulfill
its obligations as a signatory to United Nations
Global Compact through the implementation
of its 10 principles*.
We have continued our trend towards reaching
our Diversity and Health and Safety targets.
Although we cannot be satisfied until we reach
zero fatalities, progress has been made in
making our activities safer. Our program to
improve diversity through an atmosphere of
inclusion is starting to gain some momentum
as the number of senior executive women has
risen to almost 16%.
Having reached the term of its 2007-2012
ambitions , Lafarge has projected itself into
the year 2020 and a new set of ambitions
will be released in June 2012. Through an
interactive process that can only be achieved
through trust developed over many years, we
have worked extensively with our stakeholder
panel, our social partners and our long time
partners, WWF and Care.
Our commitment to sustainability is more than
ever enshrined in our DNA and we intend to
play a leading role for the industry and in
particular the Construction Material sector in
the coming years. The life cycle analysis of our
products, the solutions to provide affordable
housing, and the major role that we can
take in local economic development and job
creation around our sites will be at the heart
of our priorities.
To improve the accessibility of key data
presented in the body of this chapter as
well as other indicators that comprise GRI
and WBCSD CSI (World Business Council
for Sustainable Development - Cement
Sustainability Initiative) reporting, a data
table has been included as Section 7.7 of
this chapter. As described more fully in the
Reporting Methodology Section 7.8, Ernst &
Young performed a review on the statements
and data presented in this Chapter 7, including
a selection of important quantitative indicators
as indicated in the Reporting Methodology
section of this chapter, in order to issue a
limited assurance report. Ernst & Young’s
report can be found in Section 7.9.
* Business should (1) support and respect the protection of internationally proclaimed human rights; (2) make sure that they are not complicit in human rights abuses; (3) uphold
the freedom of association and the effective recognition of the right to collective bargaining; (4) support the elimination of all forms of forced and compulsory labor; (5) support the
effective abolition of child labour; (6) support the elimination of discrimination with respect to employment and occupation; (7) support a precautionary approach to environmental
challenges; (8) undertake initiatives to promote greater environmental responsibility; (9) encourage the development and diffusion of environmentally friendly technologies; (10) work
against corruption in all its forms, including extortion and bribery.
Registration Document | 2011 | Lafarge114

SOCIAL AND ENVIRONMENTAL RESPONSIBILITY
7
7.1 Introduction
7.1.2 Ambitions
Target Deadline2011Performance
2010Performance
Why is Lafarge pursuing this ambition? What will change?How are we progressing against this ambition?
Management
On safety, reduce the employee Lost Time
Injury Frequency Rate (LTIFR) for Lafarge
employees to 0.94 or below in 2010.
2010 0.63 0.76 We continue to make progress with both our own
employees and with contractors. Our contractor’s LTIFR
has also improved to the point where it also is better than
the original target we set for our own employees.
Continue to check the implementation of
our Competition compliance program in our
business units. 100% of all significant business
units tested for compliance by end of 2010.
2010 96% 96% In past years we have reported on the implementation
of our competition compliance program in all countries
where we operate, with a special emphasis on competition
trainings and verification of proper implementation by our
business units. We now continue to follow-up this worldwide
program with a self-assessment competition compliance
questionnaire, which also includes Code of Business
Conduct matters (such as anti-corruption rules). 100% of
our operations submitted this survey in 2011, allowing the
Group to consolidate all results and monitor compliance
with our high business ethics standards. Further tools will
be established in 2012, including a worldwide e-learning
dedicated to Code of Business Conduct at large.
Manage and improve our local stakeholder
relationship management by:
Cement:
76%
A&C: 80%
Training workshops focus on the key drivers for stakeholder
engagement: Cement Plant Managers and Aggregates &
Concrete (A&C) Area/Regional Managers. In 2011, over
260 people participated in trainings dedicated to this
topic. For A&C, there is an improvement from the 22%
reported in 2009 (no figure was reported for 2010 due
to realignment undertaken during that year). The slight
decrease for trained Cement Plant Managers reflects
a change in personnel. The other objectives have been
previously completed.
■ training 100% of units in the local
stakeholder relationship methodology;
2012 Cement:
81%
■ full reporting of the three new indicators; 2009 done
■ three additional targets (undertaking self-
assessment on stakeholder relationships,
launching a dedicated intranet site and
providing an internal audit screening tool)
were completed in 2009.
On customers, by 2012, the Group will achieve
€3bn annual sales in new products.
2012 €2.3bn €1.9bn Although all sales were affected by the recession, sales of
new products showed more resilience in the developed
countries where they are primarly sold.
Reach 20% of women in senior and executive
management (Lafarge grades 18+) by 2012.
2012 15.8% 13.5% At end of 2011, 15.8% of positions in senior management
were held by women, a 16% improvement over 2010.
Although it may be difficult for us to reach our target of
20% by end-2012, our program of inclusion which is used
to attract and maintain women in both senior management
and throughout the organization is making great progress.
Social
By end 2010, establish a comprehensive
Group-wide occupational health program
including, at a minimum, regular medical
examinations.
2010 Completed Plan
rolled-out
A protocol for Health Assessment (HASOP) has been
developed and broadened in all business units to provide
a standardized approach to risk-based medicals. This
protocol will ensure that the relevant occupational and
personal health risks are identified and managed.
Assessments are now under implementation at business
units level, and should be finished by 2014.
115Lafarge | Registration Document | 2011

7SOCIAL AND ENVIRONMENTAL RESPONSIBILITY7.1 Introduction
Target Deadline2011Performance
2010Performance
Why is Lafarge pursuing this ambition? What will change?How are we progressing against this ambition?
For HIV/AIDS and malaria, by end 2010,
Lafarge will have extended to major emerging
countries where it operates, its best practice
implemented in Africa.
2010 Completed Completed Based on its experience in Africa, the Group has developed
a manual and user guide to assess and manage relevant
public health issues. Our public health methodology has
been extended to Russia and Ukraine, where we have
broadened our approach to reflect better the public health
issues that are prevalent in these countries.
Environment
Have 100% of our sites audited
environmentally within the last four years.
Permanent 88% 89% We need to progress further to reach this objective.
By end 2010 reach a rate of 85% of quarries
with a rehabilitation plan complying with
Lafarge standards.
2010 86% 84.5% We have reached this objective in 2011.
By end of 2010, all our quarries will have
been screened according to a criteria
validated by WWF International.
2010 97% 91% (3) Building on the screening program, in 2011 Lafarge
mapped the location of all its quarries and screened them
to confirm locations that are inside internationally protected
areas or within 500m of them using IBAT (Integrated
Biodiversity Assessment Tool).
Sites in sensitive areas (1) will have developed
a site biodiversity program by 2012.
2012 49% Use of the IBAT tool resulted in a reassessment of the list
sites in sensitive areas.
■ By end 2010, cut our worldwide net (2)
CO2 emissions per ton of cementitious by
20% compared to 1990. During 2011,
a new objective of reduction of 33% vs
1990 by 2020 was set.
2010 (23.3%) (21.7%) Our new CO2 emission reductions objective was made
public in June 2011 after having widely consulted our
stakeholders and our partner WWF.
By end of 2011, we have made significant progress, in line
with our new objective.
Cut our dust emissions in cement plants by
30% over the period 2005-2012.
2012 (38.9%) (33.5%) Although cement plants generate dust, we have continued
to make significant progress in lowering emissions through
revamping or replacing less efficient air pollution control
devices.
Cut our NOx emissions in our cement plant by
20% over the period 2005-2012.
2012 (33.4%) (26.2%) NOx is emitted from virtually every combustion, including
cement manufacture. Since achieving our targeted
reduction in 2009 we have continued to implement NOx
abatement technologies such as SNCR (Selective non
catalytic reduction) and many of our newer kilns are
designed with low-NOx precalciners.
Cut our SO2 emissions in our cement plant by
20% over the period 2005-2012
2012 (51.3%) (52.0%) SO2 can be another unwanted product of some cement
kilns. After reducing emissions by around 50% since 2007;
in 2011 we started to install abatement systems whose
reductions will be seen in future years.
By end 2010 have a baseline for persistent
pollutants in our cement plants for 100% of
kilns and reinforce our Best Manufacturing
Practices to limit emissions
2010 100% 100% Persistent pollutants are emitted by cement kilns. Lafarge
is working with WWF to achieve significant reductions in
emissions.
The program has completed measurement of persistent
pollutants in all operating kilns.
Plant specific action plans have been developed to reduce
emissions from a group of top-emitting plants.
Progress with reducing emissions will be monitored and
reported.
Progress on our Sustainability Ambitions:
Fully achieved;
Partially achieved;
In progress.
(1) Sensitive areas are defined as IUCN Category I to VI sites.
(2) Net CO2 emissions are the gross emissions less the emissions that come from burning waste.
(3) The change from the figure reported in 2010 is due to a change in definition of active quarries.
Registration Document | 2011 | Lafarge116

SOCIAL AND ENVIRONMENTAL RESPONSIBILITY
7
7.2 Health and safety
7.2 Health and s afety
Lafarge’s objective is to reach zero incidents
over the long-term and across all the units, with
contractors working to the same standards
as employees. Moreover, Lafarge wants to
be recognized by NGOs and the business
community as a world leader in safety.
7.2.1 Safety r esults
Lafarge has continued to make progress in the
Lost-time Incidents Frequency Rate (LTIFR)
since the inception of its Health and Safety
journey Since 2010 we have started to track
the LTIFR for contractors on site however there
is no baseline before 2010. A LTIFR is the
number of lost time injuries per one million
work hours.
EVOLUTION OF THE EMPLOYEE - LTIFR OVER THE YEARS
3.1
2.57
1.66 1.57
0.980.63
LTIFR
Year0
1
4
8
9
6
7
5
3
2
2006 2007 2008 2009 2010 20112005
Objective 2011: 0.70
4.68
6.56
8.35
200420032002
0.76
For 2011, contractor on site LTIFR is 0.58 vs.
0.94 in 2010.
This improvement was achieved by having
management teams at all levels focus
on Health and Safety and implement
clear worldwide standards and advisories
throughout the Group.
Unfortunately, Lafarge still has too many
fatalities and cannot be satisfied until they all
have been eliminated. However, the overall
number of fatalities has decreased in 2011
vs 2010, mostly as a result of a decrease in
transport fatalities.
In 2011, Lafarge had thirteen fatalities on
our operating sites. To avoid future fatalities,
the Group is producing “Key Learnings” for
each fatal incident that are shared within
every operation. The main take-away from
the learnings of these on site incidents is that
insufficient management time in the field to
understand the risks involved in performing
a task, a lack of understanding of the risks
by the employees doing the task, changes
in process not sufficiently taking into account
Health and Safety and a lack of learning from
each other are all key components that can
lead to serious incidents.
The Group also had fourteen road accident
fatalities in 2011. The Group is working on
implementing two Advisories launched at
the end of 2010 on transportation: one for
people and one for loads. There is progress
in transport safety as many operations worked
hard to start implementing these Advisories.
This will imply a change in strategic direction
in the way Lafarge contracts transport in the
future. As a comparison, in 2010 the Group
had thirty road fatalities.
Three third party fatalities on Customer job
sites where Lafarge was delivering concrete
and three fatalities on construction projects
in China are as well to be deplored.
Lafarge is convinced that all these tragic
events could have been avoided by training
all employees in risk assessment, by pushing
everyone to think Health and Safety first
and embedding Health and Safety in all our
processes. Lafarge is currently working on
this.
For the fourth year in a row, June Health and
Safety Month was an opportunity to engage all
personnel at every site and in every function,
to make a step change improvement in
awareness, behavior and Health and Safety
performance.
Recognizing and celebrating successes is
always a part of Health and Safety Month, as
well as engagement with families, customers,
contractors and local stakeholders. The Group
theme for 2011 was transport, covering
anything linked to the movement of vehicles,
equipment, people including pedestrians
on-site and off-site.
117Lafarge | Registration Document | 2011

7SOCIAL AND ENVIRONMENTAL RESPONSIBILITY7.2 Health and safety
Risk assessment will be the theme of the Health and Safety month in 2012 as it is one of the major cause of Lafarge’s incidents.
Lost time injuries and fatalities 2011 2010
Number of lost time injuries among Lafarge employees 93 120
Number of lost time injuries among contractors employees 63 111
Lafarge employee fatalities - on site 8 1
Lafarge employee fatalities - transport 0 7
Lafarge employee fatalities - customer job sites 0 1
Contractors employee fatalities - on site 5 8
Contractors employee fatalities - transport 10 14
Contractors employee fatalities - customer job sites 0 2
Contractors employee fatalities - project sites 2 0
Third-Parties fatalities (customer job sites, transport) 9 11
Lafarge employee fatality rate (number of fatal accidents per 10,000) 1.11 1.18
Since 2010, we include fatalities of persons
travelling to or from a non-home location or
operational site or when transport is provided.
7.2.2 Preparing the f uture
Lafarge’s Health and Safety Management
System (HSMS) was issued in 2010. It is
Lafarge’s belief that the full and successful
implementation of the HSMS elements will
enable the Group to achieve world class H&S
performance.
In line with the HSMS, the Group is moving to
a Risk Based Approach.
The business units will assess their risks,
prioritize them and then address them
to comply with the Group Standards and
Advisories. This move is an evolution from the
current state, giving more responsibility to line
managers and having them manage Health
and Safety from an operational standpoint.
To strengthen this approach, Lafarge has
recently launched several tools to support
the business units: a Governance Standard
on Risk Management providing the Group
expectation on how to analyse and control
risks, a HSMS Self-Assessment Maturity Tool
to help the business units understand their
current state vs the Group expectation and
a H&S Group Entity Audit. This H&S Entity
Audit is expected to harmonize the Health and
Safety Audits within the Group and involves
line management across all product lines.
The operations continue to implement
Standards and Advisories already launched
according to a set schedule.
7.2.3 Providing a h ealthy e nvironment for our e mployees
Lafarge has developed a Health strategy
supporting its goal of providing a healthy work
environment and preventing occupational
illness.
Lafarge’s approach is to not only consider the
effects of work on health but also the effects
of health on work. This holistic approach is
illustrated by a Health strategy predicated on
the three pillars of Prevention, Reintegration
and Promotion.
A protocol for Health Assessment (HASOP)
has been developed and its implementation
has started across the Group ensuring that all
employees have a standardized approach to
risk-based medicals. This protocol will ensure
that the relevant occupational and personal
health risks which can have impact on
Health and Safety at work are identified and
managed. All countries are expected to finish
their implementation by the end of 2014.
As part of the Risk Management Standard, the
health aspect was piloted in several business
units.
The key findings of the pilots are: a large
amount of remediation actions can be
taken by managing with little or no capital
expenditure, the Group faces the same three
top risks at most plants (noise, dust and
ergonomics), there is a lack of internal health
expertise and availability of external health
resources, and lastly, the process is more
resource intensive than planned due to a lack
of data from previous assessments as most
business units are addressing these risks for
the first time and there are other competing
operational priorities.
Lafarge is currently working on defining
new Group Health Standards to address
the following risks: noise, dust including
respirable silica, ergonomics, hand and arm
vibration, whole body vibration, alternative
fuels and raw materials, working in extreme
temperatures, chemical agents and biological
agents. The intent through these Standards
is to ensure that the main occupational
health risks linked to Lafarge’s operations are
effectively controlled. The requirements of
the Risk Management Standard and the risk
based approach to implementation of these
specific Health Standards will be phased in
as determined by a prioritization process. The
implementation phase is expected to be a few
years.
Lafarge is working on the development of
leading indicators for measuring our Health
performance since lagging indicators
do not reflect current risk management.
The establishment of baseline exposure
characteristics as required by the Risk
Management and Health Standards will
enable management to track and improve
control measures; and at the same time
ensure that we meet our ambition to prevent
occupational disease.
Registration Document | 2011 | Lafarge118

SOCIAL AND ENVIRONMENTAL RESPONSIBILITY
7
7.3 Social information
7.3 Social information
7.3.1 Headcount
Employees by Geographical Area – Employees by Business
The Group had 67,924 employees at the end
of 2011, which represents a decrease of 7,753
employees compared to December 2010.
This reduction mainly reflects the change of
scope of the Group as a result of divestments:
• mainly Gypsum operations in Europe, Latin
America and Asia;
• part of Cement and Aggregates and
Concrete operations in the United States;
• to a lesser extent, our Aggregates and
Concrete operations in Portugal and
Switzerland.
This reduction was partially offset by
acquisitions: mainly Cement, Aggregates and
Concrete operations in Hungary, Iraq, Poland
and Russia.
Like for like, the headcount was reduced by
2.6% from end of 2010 to end of 2011, which
represents a decrease of 1,984 employees.
The change is primarily due to reorganisations
in Asia, in North America and Europe, which
were not offset by increases in headcount in
emerging countries: Algeria, Brazil, Hungary,
Nigeria and Russia for example.
Both tables account for 100% of the
employees of our fully consolidated and
proportionately consolidated subsidiaries.
EMPLOYEES BY GEOGRAPHICAL AREA
2011 2010
Headcount % 11 VS 10% Headcount %
Western Europe 12,202 18.0% (21.9%) 15,626 20.6%
North America 9,604 14.1% (10.6%) 10,748 14.2%
Middle East and Africa 20,376 30.0% 8.1% 18,843 24.9%
Central and Eastern Europe 7,464 11.0% (2.4%) 7,652 10.1%
Latin America 2,535 3.7% (24.5%) 3,355 4.4%
Asia 15,742 23.2% (19.1%) 19,454 25.7%
TOTAL 67,924 100% (10.2%) 75,677 100%
EMPLOYEES BY BUSINESS
2011 2010
Headcount % 11 VS 10% Headcount %
Cement 43,392 63.9% (1.9%) 44,253 58.5%
Aggregates and Concrete 23,242 34.2% (0.8%) 23,438 31.0%
Others 1,289* 1.9% (83.9%) 7,986** 10.6%
TOTAL 67,924 100% (10.2%) 75,677 100%
* Including headcount of our residual Gypsum activities and Gypsum activities held for sale.
** Including headcount of our Gypsum activities the majority of which was sold in 2011.
Employment
2011 2010
Percentage of full-time employees 99% 99%
Percentage of part-time employees 1% 1%
Percentage of permanent employees 97% 96%
Percentage of fixed-term contract employees 3% 4%
2011 2010
Percent of employees aged under 30 16.1% 16.7%
Percentage of employees from 30 to 50 years 63.0% 63.3%
Percentage of employees over 50 years 20.9% 20.0%
119Lafarge | Registration Document | 2011

7SOCIAL AND ENVIRONMENTAL RESPONSIBILITY7.3 Social information
Job evolution
2011 2010
Number of hirings 7,400 5,991
Number of resignations 3,770 3,752
Number of retirements 776 1,057
Number of redundancies 4,308 3,986
Number of deaths 125 142
We endeavoured to limit or postpone headcount reductions, and to assist every affected employee as prescribed in our Employment Policy.
Measures to mitigate job changes
2011 2010
Percentage of business units having implemented significant headcount reduction impacting more than 5% of
workforce
20% 28%
Of which % of business units with headcount reduction having set up an employment channel for employees 38% 58%
Of which % of business units with headcount reduction having set up a local economic development channel for
local communities
14% 30%
Number of Lafarge employees re-employed outside the Group (in another company or in their own business) 305 1,393
7.3.2 Labor organization and w orking conditions
Well-being at work
Further to an initiative of the European Works Council, three additional surveys were carried out in 2011, two in Austria and one in France, to
help maintain dialogue with our employees. In order to give these results a wide communication, the survey results were debriefed both locally
and with the European Works Council.
Although the overall outcome is very positive, in particular on stress-related issues, in order to keep improving well-being at work, action plans
are always implemented.
Staff performance assessment
2011 2010
Percentage of manager staff having an annual performance review 91% 94%
Percentage of non-manager staff having an annual performance review 62% 64%
Outsourcing
OUTSOURCING BY FIELD OF ACTIVITY
(%) 2011 2010
Production 36% 38%
Maintenance and Clearing 27% 26%
Transport 20% 19%
Security and Guarding 11% 10%
Others (IT, accounting, etc. ) 6% 7%
In 2011, Lafarge worked with 33,432 out-sourced contractors accounting for some 33% of the workforce (in 2010: 30%). Many examples
gathered from Business Units show that our awareness of health and safety for these people has increased in 2011, whether working on our
sites or outside (eg in transports).
Registration Document | 2011 | Lafarge120

SOCIAL AND ENVIRONMENTAL RESPONSIBILITY
7
7.3 Social information
7.3.3 Social dialogue
Employees representation
EMPLOYEES COVERED BY COLLECTIVE AGREEMENTS
(%) 2011 2010
Health and Safety 59% 51%
Restructuring 57% 47%
Compensation and benefits 58% 52%
Others 35% 25%
Staff employees represented by staff representatives or trade union organizations 70% 67%
Business units with collective agreements 74% 71%
The number of employees covered by
collective agreements has steadily increased
year on year. The section «Others» includes
namely employment protection and working
hours.
In 2011 several new business units, most
of them in emerging countries, negotiated
collective agreements for the first time.
In 2011 an additional 6% of business units
engaged in staff representation, some through
formal trade unions.
Agreements signed in 2011 with social partners
In 2011 we signed a revision of the European
Works Council Agreement with our European
social partners. We also signed a Joint
declaration concerning Health, Safety and
Hygiene.
Furthermore, many other agreements were
signed locally with social partners (collective
agreements, wage agreements, etc.).
Number of business units with strike action
There were substantially less strikes this year
(in 9 business units compared with 14 in
2010). Of those which occurred, most were
in the general context of the country (Egypt,
Greece). Some social unrest was specifically
linked to our operations (Algeria, France).
7.3.4 Developing people
AVERAGE NUMBER OF HOURS OF TRAINING
2010 2011
45
31
Non-manager staff
Manager staff
41
29
20
50
30
40
10
0
Average training hours for our Employees
decreased slightly in 2011, but overall still
remain high. Increased emphasis is being
placed towards informal on-the-job training.
In addition to the formal training program,
a cultural change occurred this year with
the promotion of the iLearn mindset (I
Learn Everyday Acting and Reflecting
with my Network). This approach gives a
broader spectrum to learning, empowering
the individuals to be active in their own
on-the-job development, interacting with
Team, or through an increased offer of training
programs catering to their specific needs.
Training naturally becomes part of everyone’s
job, more embedded in the business, and
contributes to driving change to be closer to
its markets and customer needs.
On e-learning, a 30% increase in single-users
was recorded in 2011, while new Lafarge-
tailored modules were released (Health and
Safety, Sustainable Construction, etc.), both
enriching the offer and delivering to a wider
employee base.
7.3.5 Diversity and inclusion
In Lafarge we strongly believe that having
diverse teams and an inclusive mindset
represents today a real competitive advantage.
Diversity and Inclusion is therefore considered
one of the levers that will enable us to become
an employer of choice specifically in emerging
countries, to increase business performance
and consolidate our leadership position.
This year we promoted behavior and mindset
change as a key success factor, supported
by on-going communication and awareness
raising, as well as changes to business and
human resources processes.
121Lafarge | Registration Document | 2011

7SOCIAL AND ENVIRONMENTAL RESPONSIBILITY7.4 Communities
INCREASING WOMEN IN SENIOR MANAGEMENT
(in %) 2011 2010
Boards of D irectors 17.6 17.0
Senior executives and managers (Lafarge grades 18+) 15.8 13.5
Senior executives (Lafarge grades 23+) 10.8 9.9
Senior managers (Lafarge grades 18-22) 16.2 13.9
Managers (all categories) 18.8 18.7
Non-managers e mployees 15.0 16.0
In 2011, the percentage of women in senior
management increased significantly, which is
encouraging.
Inclusion
Inclusion means a way of working together
where all profiles and forms of diversity are
able to bring their unique value. Numerous
local initiatives were implemented that reflect
the start of change, and at the Group Level a
Roadmap was designed in order to set clear
targets and measure progress.
7.3.6 Sixth employee share ownership plan : LEA 2011
Employee ownership is a key element of our
social strategy. Our 2011 LEA share ownership
plan reached a subscription rate of 44%,
versus 53% in 2009. 30% of participating
countries saw their subscription rate increase
above their 2009 performance. We are
particularly proud of the high participation
rates achieved in some countries: 80% of
employees subscribed in Ecuador, 90%
in Romania and Cameroon, over 90% in
Zimbabwe.
7.4 Communities
Lafarge has a methodology for sites to engage
with its communities, to drive maximum
benefit from this engagement for both
the company and the communities. This
methodology ensures that any engagement
is planned and emphasizes the importance
of dialogue and feedback with stakeholders,
including representatives of surrounding
communities. This approach is vital in helping
our sites co-exist with their neighbours in a
constructive manner during day-to-day
operations and periods of change.
For Lafarge’s 2012 Ambitions, agreed with
the Group’s Stakeholder Panel, the priority
was placed on ensuring that the key drivers
on stakeholder engagement were trained
on this methodology to help drive positive
and meaningful community interaction.
The key drivers for Lafarge are defined as
Plant Managers in Cement Division and
Area/Regional/Business Unit Managers in
Aggregates and Concrete (A&C) Division (the
job title for this role varies across countries,
although in most cases, refers to the post to
which site managers’ report).
Training on the tools and techniques to
engage with stakeholders and communities
effectively are delivered through internal
professional development program s and
workshops commissioned by countries, which
are run and facilitated by Lafarge’s dedicated
team on the topic, along with members of
the Group and country environment and
communications teams.
It can be seen that, currently, 80% of all
A&C Area/Regional Managers and 76% of
Cement Plant Managers have participated in
training on stakeholders. For A&C, this is an
improvement on the figure reported in 2009,
22% (no figure was reported for 2010 due
to organisational realignment undertaken
during that year). For Cement, there is a slight
decrease from last year’s reporting (81%),
reflecting changes of managers of cement
plants.
Indicators Aggregates Concrete Asphalt Cement
Number of target population (regional & area
managers) who have been trained on the
Group stakeholder methodology (1) 80% 76%
Number of sites that organize regular meetings
with their stakeholders/local communities (2) 79% 3% 18% 88%
Number of sites with an annual local
action plan detailing planned stakeholder
engagement (3) 32% 2% 8% 69%
(1) Trained on stakeholder engagement would mean that engagement with stakeholders is part of the site’s annual plan (and documented) and that there is some awareness of the Group’s
four-step methodology on stakeholder management. Although training on stakeholder engagement takes place for Asphalt units, this particular data cannot currently be verified.
(2) Meetings refers to sites that are proactively arranging to meet stakeholders. Meetings can vary from individual meetings to liaison committees and open door events at the site. Regular
would be defined as at least 2 meetings with stakeholders proactively organised per year.
(3) A documented plan detailed planned actions for engaging with stakeholders in the following period (at least 6 months).
Registration Document | 2011 | Lafarge122
SOCIAL AND ENVIRONMENTAL RESPONSIBILITY
7
7.4 Communities
The effectiveness of this training is measured
through two outputs: the number of sites
developing local action plans for engaging
with their stakeholders and sites meeting
regularly with their communities. These were
identified to demonstrate that both planning
and dialogue were involved when activities are
launched in this area.
This year’s results reflect the trend that
would be expected: Aggregates and Cement
operations typically have larger footprints
and remain in the same location for the long-
term so would be expected to have these
mechanisms in place. This can be contrasted
with Concrete and Asphalt operations, whose
operational footprints are usually smaller and
who can be mobile as well as fixed in their
locations.
Nevertheless, it is clear that work will be
required in 2012 in developing tools that will
help sites in the A&C activity plan their actions
more effectively, alongside helping operations
in concrete and asphalt develop mechanisms
to engage with their communities more
regularly (in the context of doing so on a short-
term basis).
It is also important to note that the Group’s
methodology and training also encourages
other ways to engage with stakeholders, in
addition to the KPIs noted. These include
open door events (undertaken by 60% of
sites in 2011) and media relations (53%
of sites sent proactive news releases in the
last 12 months). An update on progress in
the key areas of community program s and
partnerships is detailed below.
During 2011, 44% of sites reported difficult
relations or even conflict with one or more
local stakeholders, which is consistent with
the level recorded for 2010. Examples of these
types of situations drawn from Slovenia, India
and the United States, are available on the
Lafarge website.
7.4.1 Community programs and partnerships
A key area of Lafarge’s methodology is to
ensure that our sites engage in effective
programs with their communities. Toolkits
and guidance are provided to the sites to
help them develop dialogue and involve their
local communities in developing long-term
program s that address the needs of both the
area and the company. (When addressing
the needs of the company, examples could
include schemes that help develop skills and
experience of the local Lafarge team as well as
program s that address key issues at the site,
such as visual impact).
It has been calculated that, for 2011, over 20
million euros was spent on community actions
and program s (this figure does not include the
financial element of program s developed at
Group level). To put into context: data reported
by sites showed that financial resources
dedicated to this work ranged across a wide
spectrum (from 0 to 782,000 euros) although
Lafarge’s approach in this area aims for sites
to balance financial support with non-financial
support (which could include employee
volunteering, donation of product and loans
of key equipment).
More than 1,330 community program s were
reported by Lafarge sites in 2011. Notable
examples highlighted include: providing
drinkable water to the community (Algeria
and Indonesia), supporting community-owned
transport company (Ecuador), biodiversity and
safety educational project (Greece), alongside
long running initiatives, such as public health
program s in South Africa, Uganda and
Zambia.
To ensure that these program s are effective,
KPIs can be developed to evaluate progress.
Aggregates and Concrete units in West USA
have developed a measurement tool that
identifies specific financial and non-financial
contributions provided towards program s,
which allows the region to benchmark
performance in this area and review and
evaluate future partnerships and contributions.
In 2012, the Group’s policies and tools will be
reviewed to ensure the Group’s effectiveness
in this field.
7.4.2 Working in partnership
Lafarge maintains partnerships with WWF
International and CARE France. Lafarge’s work
with CARE France has particularly focused on
understanding societal’s long-term interests
through the joint development of a tool to
measure sites’ socio-economic footprints.
This footprint tool allows a site to understand
its interdependencies with surrounding areas
and track the progress of its activities in this
field. During 2011, the tool was tested by four
sites; in 2012, it is intended that the tool will be
widely used by sites across the Group.
Lafarge is also engaging in other types of
partnerships to help it evolve its approach
and rethink the way it can interact with other
organisations. An example of new ways to
participate in local partnerships can be seen in
China: the company’s CEO participates in the
advisory council for the Mayor of Chongqing
and the local unit is a member of the ‘Green
Chongqing’ initiative.
These initiatives have been developed by the
local government to help the city, which is the
world’s most populous, to meet the demand
for housing, building and infrastructure in a
sustainable manner. To facilitate its work in
helping the city achieve these ambitions,
Lafarge opened its first regional R&D lab in
Chongqing in 2011, dedicated to promoting
sustainable construction methods, to work
alongside the Group’s worldwide R&D centre
in France.
Numerous other examples of partnerships at
a local level include: working in partnership
with other material manufacturers to develop
construction solutions adapted for more
extreme climates (for example, in Russia);
developing facilities with local energy
companies to allow excess onsite power
generated to be supplied elsewhere (Nigeria)
and; partnering with public and specialized
waste companies to process waste into a fuel
that can be used in the power generation or
cement manufacturing process (worldwide).
123Lafarge | Registration Document | 2011

7SOCIAL AND ENVIRONMENTAL RESPONSIBILITY7.5 Environment
7.5 Environment
7.5.1 Climate c hange
One of the main priorities of Lafarge’s
sustainable development strategy is to actively
contribute to climate change mitigation and
adaptation. For the past decade, our efforts
have been focused on improving our industrial
performance to reduce the carbon emissions
from our operations and from all the cement
industry. In 2011 we released our second
generation CO2 objectives. They demonstrate
our commitment to adopt a value chain
approach, and to address climate adaptation
issues, especially in emerging economies.
Reduce the carbon emissions induced by our operations across our value chain (scope 3)
An accurate monitoring and transparent
reporting of carbon emissions from our
operations are at the heart of our approach to
managing climate change. In 2011, we ranked
10th in the Carbon Disclosure Project, which
positions Lafarge as the leader of French
companies and global industrial companies. In
2012, our ambition is to account for “scope 3”
emissions from our operations (transportation,
suppliers’ carbon emissions, etc.).
After having reached our initial carbon
emissions reduction objectives one year in
advance, Lafarge publicly committed in 2011
to reduce carbon emissions per ton of cement
by 33% in 2020 compared to 1990 (reference
year).
Develop product solutions for climate adaptation, especially in emerging countries
Taking into consideration our Stakeholder
Panel’s comments, we focused our efforts in
2011 on emissions linked to the use of our
products, especially in emerging economies.
In 2011 Lafarge inaugurated two research
centres dedicated to sustainable construction,
in China and in India; two of the world’s most
dynamic markets. In addition, the Group has
appointed local “climate correspondents” in
nine operating units: China, India, Indonesia,
Republic of Korea, Saudi Arabia, Russia,
South Africa, Brazil and Mexico.
Our second generation CO2 objectives take into
account our ambition and aim at developing
ten innovative product ranges by 2015, and at
contributing to 500 sustainable construction
projects by 2020.
LAFARGE TOTAL GROSS CO2 EMISSIONS
(millions of tons/year)
1990 2009 2010 2011
25
51
62
31
61
32
66
32
Developed
countries
Emerging
markets
Our gross emissions have increased by 5%
in 2011, mainly as a result of the cement
volumes increase in emerging countries
(10%), consistent with the geographical
development of Lafarge. Overall our gross
emissions have grown by 29% over 1990.
However, our gross emissions in industrialized
countries have seen a reduction of 37%, partly
due to the impact of the economic downturn.
LAFARGE TOTAL NET CO2 EMISSIONS
(millions of tons/year)
1990 2009 2010 2011
25
50
61
30
61
30
65
30
Developed
countriesEmerging
markets
Our net emissions have increased by 5%
in 2011, mainly as a result of the cement
volumes increase in emerging countries
(10%). Since 1990, net emissions have
increased by 26%. Industrialized countries
saw a 41% decline while emerging economies
net emissions are more than two and a half
times higher than in 1990.
GROSS CO2 EMISSIONS
(kg per ton of cementitious product)
1990 2009 2010 2011
780
628 621 611
In 2011, our gross emissions per ton were
21.7% lower than 1990 levels.
Registration Document | 2011 | Lafarge124

SOCIAL AND ENVIRONMENTAL RESPONSIBILITY
7
7.5 Environment
NET CO2 EMISSIONS
(kg per ton of cementitious product)
1990 2009 2010 2011
774
613 604 593
In 2011, our net emissions per ton of cement
were 23.3% lower than 1990 levels, so well on
track towards our 2020 target of a reduction
of 33% versus 1990.
CARBON EFFICIENCY IN OPERATIONS
(trend o n net emissions and cement produced)
100
155
120
155
121126
167
80
100
120
160
180
140
2009 20101990 2011
Metric tons of cement produced
Metric tons of CO2 emitted net
In 2011 we produced 67% more cement than
in 1990 but our CO2 emissions increased by
only 26% over the same period.
Lead cement sector efforts in measuring the carbon footprint of its products
In 2011 our engagement in the CSI (Cement
Sustainability Initiative) has been dedicated
to the facilitation of the integration of Chinese
and Indian cement producers (notably
by helping them improve their emissions
reporting capacities).
In addition, our efforts have been geared
toward the development of a common
methodology to measure the environmental
footprint of concrete products. By taking into
account our impact beyond carbon emissions,
we are able to account for the sustainable
construction performance of our products.
FUEL MIX IN THE CEMENT BUSINESS
(% of total) 1990 2009 2010 2011
Coal 55.1% 43.3% 45.1% 46.5%
Coke 8.4% 20.0% 19.4% 17.0%
Oil 13.6% 8.4% 7.1% 6.8%
High Viscosity Fuels 2.1% 0.1% 0.1% 0.2%
Gas 18.1% 17.4% 16.7% 16.5%
Waste 2.0% 6.9% 7.6% 8.3%
Biomass 0.7% 3.9% 4.0% 4.7%
TOTAL 100.0% 100.0% 100.0% 100.0%
Since 1990 the part of the alternative fuels in
our fuel mix has grown while coal and oil have
declined. We have virtually eliminated the use
of high viscosity fuels. Gas, which use remains
stable, has a CO2 emission factor 40% lower
than coal.
Integrate climate change initiatives to an ambitious sustainable development strategy
Our actions on climate change mitigation and
adaptation are part of a wider sustainable
development strategy to create shared value
locally, and ensure that our operations make
a positive contribution to local communities.
Therefore, Lafarge has invested so that its
cement plant kilns are able to burn waste
and biomass. In so doing, Lafarge reduces its
carbon emissions, creates direct local jobs,
and helps emerging countries to address the
issue of waste.
EXAMPLE:
Jatropha cultivation in Nigeria: a project that benefits to everyone.
The Lafarge Ashaka business unit, situated in
the North East of Nigeria, has set up a project
for the cultivation of biofuel in partnership
with local farmers. In accordance with local
customs, Lafarge supports the cultivation
of Jatropha, a biomass fuel, by providing
farmers with agronomic skills and purchasing
the crops. This project ensures additional
revenues to local farmers, since all the
production of Jatropha is bought by our local
plant. The plant uses this crop as biomass fuel
in the kilns, a carbon neutral fuel which is less
expensive than fossil fuel.
Our goal is to involve 5,000 farmers - up to
a third of local farmers - in the short and
medium term.
The project simultaneously promotes the
development of local economic activity,
environmental protection and cost reduction.
125Lafarge | Registration Document | 2011

7SOCIAL AND ENVIRONMENTAL RESPONSIBILITY7.5 Environment
7.5.2 Managing our e missions
Reducing e missions
Regulators in many areas of the world
continue to be concerned over unhealthy
levels of smog in urban areas and have
tended to look to the industrial sector, where
it is easier to implement change compared
to transportation, as a source of reduction.
Whether through legislation, regulation,
permit renewals, or bi-lateral agreements
with companies, we see targeted levels for
NOx (and in some cases particulate) being
lowered. The regions where we see the most
activity in this regards are in the USA, Europe,
and China, with emerging concern also being
expressed in many other areas such as India
and Russia. For NOx, as we expand our
utilization of alternative fuel, especially wet
biomass, we have seen large reductions in
our emissions.
For dust, we had numerous new dust filters
or upgrades start which replaced older
non-performant equipment (Russia, Pakistan,
Ukraine, Nigeria). This continues our
program to address emissions that meet local
regulations, but not our internal standards.
At the end of 2010 we completed our program
to measure our emissions for mercury and
dioxins. In 2011 our focus was on ensuring
the quality of all measurements as the nature
of these materials and the very small specific
concentrations require rigorous testing which
has been a challenge in some emerging
countries. Our program with WWF has also
been addressing some kilns with higher than
average emissions and although the results of
these actions are not yet evident in our stack
emission reporting, we are confident we will
see improvement in our 2012 results.
And looking ahead
Our operations in the USA continue to
implement necessary upgrades to comply
with regulatory requirements and other
commitments to reduce air emissions and
storm-water. Results of these new equipments
should start to be seen in 2012 with further
reductions in our emissions in later years. In
emerging countries we are also continuing our
program of upgrading dust collectors that do
not meet our standards and a number of new
systems are scheduled for start-up in later part
of 2012 and in 2013.
NOX EMISSIONS*
2005 2006 2007 2008 2009 2010 2011 2012
Target
2,4392,332
2,254
2,108
1,947
1,800
1,625
1,951
3000
g/ton
clinker
2500
2000
1500
1000
500
0
*For all emissions, the Group has modified the calculation method for current and past data to reflect the latest CSI protocols (see Reporting
methodology).
There has been a reduction of 33% in NOx emissions since 2005, more than the targeted reduction of 20%. The total amount of NO
x emitted
in 2011 was 190 thousand tons.
Registration Document | 2011 | Lafarge126

SOCIAL AND ENVIRONMENTAL RESPONSIBILITY
7
7.5 Environment
SO2 EMISSIONS*
2005 2006 2007 2008 2009 2010 2011 2012
Target
888845
748
540
452426 432
710
900
g/tonclinker
800
700
600
500
400
300
200
100
0
*For all emissions, the Group has modified the calculation method for current and past data to reflect the latest CSI protocols (see Reporting
methodology).
There has been a reduction of 51% in SO2 emissions since 2005, more than the targeted reduction of 20%. The total amount of SO
2 emitted
in 2011 was 50 thousand tons.
STACK DUST EMISSIONS*
2005 2006 2007 2008 2009 2010 2011 2012
Target
236
206 205
175165
157144
165
250
g/ton
clinker
200
150
100
50
0
*For all emissions, the Group has modified the calculation method for current and past data to reflect the latest CSI protocols (see Reporting
methodology).
There has been a reduction of 39% in dust emissions since 2005, more than the targeted reduction of 30%. The total amount of stack dust
emitted in 2011 was 16 thousand tons.
127Lafarge | Registration Document | 2011

7SOCIAL AND ENVIRONMENTAL RESPONSIBILITY7.5 Environment
Persistent pollutants and VOC (1) Reporting
Mercury continues to be an important subject
in the cement industry. 2011 saw the United
Nations Environment Program approve a
Cement Mercury Partnership in the framework
of developing a «Globally Binding Instrument
on Mercury». In the United States new
regulations were adopted towards the end
of 2010 that require emission reductions by
2013. While these civil society processes have
recently increased , Lafarge has continued its
10-year work with WWF to understand and
reduce mercury and dioxin/furan emissions
from our kilns.
MERCURY
Quantity
(T/an)
Specific
(mg/Teq
Cim)
Specific
(mg/T
CK)
3.7 4.0
24.6 25.1
33.334.2
2011201040
30
20
10
0
For mercury, our results in 2011 are very
similar to those of 2010. Action plans have
been implemented to reduce emissions at
a number of kilns, but as these actions took
place throughout the year, the results are not
yet evident in our reporting.
For mercury, in 2011 we found one plant for
which we mis-reported very high emissions in
2010 and we have restated here the corrected
2010 emissions.
DIOXIN/FURANS EMISSIONS
Quantity
(gTeq/year)
Specific
(pg/Teq
Cem)
Specific
(pg/T
CK)
7.04.7
46.6
29.3
62.9
40.0
70
60
50
40
30
10
20
0
20112010
One of the biggest improvements in 2011 is the
quality of the data we are collecting, particularly
from emerging countries. Persistent pollutants
are emitted in trace quantities and they can
be very difficult to measure. Lafarge released a
new measurement protocol at the beginning of
2011 to address what we saw as the difficulty
encountered in some countries to measure
these constituents accurately. As we now have
a higher level of confidence in the tests being
performed, we have adopted the CSI’s new
protocol for reporting the last measurement
for mercury and dioxin/furan.
VOC
Quantity
(kT/year)
Specific
(g/Teq
Cem)
Specific
(g/T
CK)
4.2 4.6
27.9 28.6
37.739.040
30
20
10
0
20112010
PROPORTION OF KILNS ANALYZED FOR
MICRO-POLLUTANTS (%)
Percentage
for mercury
Percentage
for Dioxins/
Furans
Percentage
for VOC
8994
67
2011100%
75%
50%
25%
0%
In 2010 Lafarge completed a program to
have at least one measurement for mercury
and dioxin/furan for all kilns which have
been in Lafarge for a minimum of 3 years.
As 100% of kilns meeting this criterion
have been analyzed, this year we present
data concerning the percentage of all kilns
analyzed, even those new to the Group.
(1) Volatile Organic Compound
Registration Document | 2011 | Lafarge128

SOCIAL AND ENVIRONMENTAL RESPONSIBILITY
7
7.5 Environment
7.5.3 Biodiversity at our sites
2011 was the International Year of Forests, a UN global campaign which both celebrated and raised awareness of the importance of forests in our societies. 2011 was also the year when we mapped all of our quarries and used IBAT to confirm the identity of the high biodiversity locations. To continue to raise awareness of the importance of biodiversity we worked in partnership with WWF International to develop a guidance document for our operations and a leaflet for our visitors.
Progress with ambitions for rehabilitation and biodiversity
2011Achievement
Quarries with rehabilitation plans (target 85% by 2010) 86.4%
Quarries that have completed biodiversity screening (using WWF validated checklist) (target 100% by 2010) 97.2%
Quarries screened for international biodiversity sensitivity using IBAT 97.6%
Quarries which operate within or adjacent to a protected area* 18.3%
Quarries which operate within or adjacent to a protected area* with site biodiversity programs (target 100% by 2012) 49.2%
Quarries which have red-listed species** 19.0%
Quarries engaged in formalized partnerships with NGOs for nature conservation 28.6%
* Quarries within 0.5 km of IUCN I – VI, Ramsar, IBA, Natura 2000.
** A species categorized by the IUCN as threatened.
2011 United Nations Year of Forests
The United Nations designated 2011 as the
year of the forests where they celebrated
people’s actions for sustainable forest
management. To acknowledge this and to
further Lafarge’s commitment to biodiversity
we were involved in several projects related
to forestry.
A few examples of these included “Green
Chhattisgarh” around the Sonadih and
Arasmeta cement plants in India. A total of
70,000 tree saplings were planted as part of
this local program. The species were chosen
following advice from local authorities and
NGOs and included teak and tamarind and
fruit trees such as mango and jackfruit. The
planting was done in partnership with local
communities, particularly school children, in
order to raise their awareness of environmental
issues.
Other projects included a partnership between
Lafarge Aggregates Poland and Warsaw
University of Life Sciences working closely with
the National Forestry department to improve
techniques for forest restoration at the Sepolno
quarry. This included a joint seminar to
present the results in October 2011. In Spain
the cement operation produced a pictorial
book on Spanish forests to raise awareness
of the importance and beauty of these forests.
Raising a wareness on b iodiversity
To continue to raise awareness of biodiversity
within Lafarge we jointly developed with
WWF International and our International
Biodiversity Panel members a guidance
manual. The guidance not only explains what
biodiversity is and why it is of importance to
all of us, but also how we can better manage
it. It included examples of how biodiversity is
managed at different types of sites including
offices, cement plants, concrete plants and
quarries. Externally we continued to promote
the importance of biodiversity through the
production of a leaflet for visitors of our
sites. This leaflet includes examples of how
individuals can participate in trying to halt the
loss in biodiversity.
Lafarge also contributed to the development
of two guidelines by WBCSD for corporate
ecosystem evaluation and by WBCSD CSI on
quarry rehabilitation, both of which contain
new case studies describing Lafarge best
pratices.
Progress on Group a mbitions and a dditional s creening for b iodiversity
W e continued to make progress towards
our Group Ambitions for rehabilitation and
biodiversity.
Building on the screening program we
implemented using our checklists developed
with WWF, in 2011 Lafarge mapped the
location of all of its quarries and screened
them to confirm all of those that are located
in or within 500 meters of an internationally
protected area using IBAT (1) (Integrated
Biodiversity Assessment Tool).
(1) IBAT a world database of protected areas developed by IUCN, Birdlife, UNEP, Conservation International and WCMC.
129Lafarge | Registration Document | 2011

7SOCIAL AND ENVIRONMENTAL RESPONSIBILITY7.5 Environment
Summary of Lafarge w ater f ootprint
TOTAL WATER WITHDRAWAL BY SOURCE
(in million cubic meters)
2011 2010
CEMENT AGGREGATES CONCRETE TOTAL CEMENT AGGREGATES CONCRETE TOTAL
Surface water including from rivers, lakes,
wetlands and oceans 187.5 23.1 1.0 211.6 169.8 11.2 1.2 182.2
Ground water 24.3 14.7 3.3 42.3 23.3 69.3 3.5 96.1
Rainwater harvested 2.4 12.8 0.5 15.7 - 23.2 0.2 23.4
Municipal water supplies or other water utilities 6.9 1.2 4.9 13.0 9.1 0.8 4.6 14.5
Total withdrawal* 221.2 51.7 9.6 282.5 202.3 104.5 9.5 316.2
Water returned to same catchement area 161.7 0.0 0.0 161.7 142.3 0.0 0.0 142.3
Net Withdrawal 59.5 51.7 9.6 120.8 60.0 104.5 9.5 174.0
* According to GRI G3 EN 8
(in million cubic meters)
2011 2010
Cement Agregates Concrete Cement Agregates Concrete
Net withdrawal 59.5 51.7 9.6 60.0 104.5 9.5
Consumption 50.1 21.6 9.5 47.6 39.3 9.4
Discharge 9.3 30.1 0.1 12.4 65.2 0.1
Our work in 2011 has identified several
situations where water withdrawal had
previously been overestimated, especially by
including quarrying dewatering as withdrawal
water for future use, which is not the case
since this water is returned to the same
aquifer from which it is taken.
Of the 174 million cubic meters net water
withdrawal reported for 2010, only 118 million
cubic meters corresponded to a net levy for
use by our sites.
The net water withdrawal in 2011 was of
121 million cubic meters.
16 million cubic meters was withdrawn from
recycle water networks fed with rainwater,
corresponding to 13% of the net withdrawal.
SPECIFIC WATER CONSUMPTION
Cement Agregates Concrete
317.0 313.8
213.7
116.4103.4
113.2
350l/t
300
250
200
150
50
100
0
20112010
The performance of specific consumption of
water per ton of cement in 2011 (314 l/t) is
influenced by two new in house captive power
plants that consumed 2.5 million cubic meters
of water that were added to the consumption
of the cement sites.
7.5.4 Water footprint
Over the past two years the United Nations,
governments around the world and companies
have greatly increased their attention to
the world’s supply of fresh water and have
recognized access to safe drinking water and
sanitation as a human right.
The situation in regards to water varies
drastically by geography with water stress
increasing in many areas of the world and
other areas with abundant supplies.
In 2011 Lafarge progressed further in its
understanding of the water footprint on
our sites and has changed its approach to
prioritize its actions according to each site’s
“water risk.”
Registration Document | 2011 | Lafarge130

SOCIAL AND ENVIRONMENTAL RESPONSIBILITY
7
7.5 Environment
A quarter of our cement production takes
place in areas where there is high water stress
(categorized as stress and high stress).
This is an ongoing challenge that must be
addressed, especially since the Group has
a strong presence in these regions with the
expectation of further development.
Fresh water consumption (surface water and
groundwater) in these regions, represents
almost 10 million cubic meters or 20% of
the total water consumption for cement
(corresponding to 25% of production).
Although the specific consumption of fresh
water in theses water stressed regions of
239 l/t cement, is well below the Group
average of 299 l/t cement (freshwater),
progress is still possible and remains a priority
of our Water Program.
Water p rogram
The actions undertaken in 2010 in areas
with high water stress (<500 cubic meters
Renewable Water Supply (RWS)/year/person)
continue.
For cement, three sites in the Philippines
located in areas of water stress ([500-1,000]
cubic meters RWS/year/person) have joined
the pilot program to establish detailed water
balances, to describe water networks and to
identify action plans to reduce their water
footprint.
In 2011 the program was expanded for
deployment to aggregate quarries. 94 quarries
have been identified as areas of stress or high
stress, or 15% of aggregate quarries. Of these
94 quarries, in 2011 36 quarries worked
within our program for the development of a
water action plan. The program for all sites will
be completed in 2012-2013.
Rainwater
To support the deployment of this program,
a compendium of good water management
practices has been developed and shared
within the Group. The practices include
actions to reduce consumption by recycling
water, cutting waste, and the substitution
of recovered/recycled water for fresh water,
including rainwater.
In countries with high water stress, where
the availability of fresh water is critical, the
total or even partial recovery of rainwater is
a permanent solution to limit aquifer water
withdrawal.
Within the Group, several installations of
rainwater harvesting have been promoted as a
model to limit the use of fresh water. In Britain,
five cement plants use rain water as the sole
source of supply: 1,260,000 cubic meters of
fresh water are saved in this way every year.
We continue the implementation of these good
practices in priority in areas with high water
stress.
Water for communities
Our commitment to respect the communities
where we operate is also reflected in our water
program where we respond and develop
partnerships for joint management of the
water resource.
We have for the first time in 2011 created
a KPI to track and measure the amount of
water provided by our sites to communities
for ecological (agriculture, among others) or
domestic use.
At a Group level, a total of 2.7 million cubic
meters of fresh water was provided to
neighboring communities. There are examples
in Algeria, Jordan, Philippines and China.
W e expect short-and medium-term increases
of such initiatives especially in areas with high
water stress.
Fresh water consumption
FRESH WATER CONSUMPTION BY SCARCITY AREAS
ANNUAL RENEWABLE WATER SUPPLY PER PERSON (PROJECTIONS FOR 2025)(CUBIC METERS/PERSON/YEAR)
TOTAL FRESHWATER CONSUMPTION(MILLION CUBIC METERS/YEAR)
TEQ CEMENT(MILLION TONS)
FRESHWATER CONSUMPTION PER TON OF CEMENT(L/YEAR/T CEMENT) % OF PRODUCTION
% OF FRESHWATER CONSUMPTION
<500 9.3 34.9 266 21.8% 19.4%
500 – 1,000 0.3 5.3 61 3.3% 0.7%
1,000 – 1,700 3.9 23.6 165 14.8% 8.1%
1,700 – 4,000 19.4 56.8 342 35.6% 40.7%
>4,000 14.9 39.2 379 24.5% 31.1%
TOTAL 47.8 159.8 299 100% 100%
131Lafarge | Registration Document | 2011

7SOCIAL AND ENVIRONMENTAL RESPONSIBILITY7.5 Environment
Alternative f uels
Mature Co-processing
New developments
In 2011 we recorded an increase in the
substitution of fossil fuels, with 13% of our
energy needs for cement production met
by alternative sources, such as waste and
biomass (versus 12% in 2010). This increase
is due to a combination of factors:
• development of new waste streams;
• increased percent substitution in plants
already using recycled materials;
• expanding this practice to new countries.
Among the new channels is a pilot in Romania
started in 2010, for sorting of household
waste, which will serve as a model for other
locations, including in China.
With regards to the use of biomass, several
achievements were made in 2011, for
instance the use of wood in Nigeria, the
recovery of energy from animal waste (poultry)
in Pakistan and the recovery of energy from
agricultural waste in Ecuador.
The biomass substitution program is in
now full swing, and in the short term many
developments are planned, especially in
emerging countries.
7.5.5 Resource m anagement
The Group consumes hundreds of millions
of tons of rock and tens of millions of tons of
fuel as raw materials each year. For almost
100 years, the Group has had a tradition
of trying to minimize its impact on natural
resources through the use of alternative
resources such as by-products on waste to
replace virgin materials.
Performance programs have always included
a component of recycling and recovery of
materials and energy. The current program
“Excellence” sets ambitious targets to replace
fossil fuels with alternative sources such as
waste or biomass.
Registration Document | 2011 | Lafarge132

SOCIAL AND ENVIRONMENTAL RESPONSIBILITY
7
7.5 Environment
Alternative raw materials
MATERIAL SUBSTITUTION IN CEMENT
17.06
Clinker/cement
sbst.
Raw Mix
sbst.
6.05
19.44
5.95
0
5
10
15
20
25
30
M tons
20112010
Material recovery in cement manufacturing
can occur in two areas:
• substitution of the raw materials;
• substitutes for clinker in finished product
(cement).
In 2011 we have increased the total materials
substitution by 2.3 million tons, mainly due
to finished products substitutes, such as slag
and fly ash.
Beyond its economic value, material used for
clinker substitution has a direct impact on CO2
performance, where material substitution is a
major lever for reducing emissions.
BREAKDOWN OF ALTERNATIVE FUELS
2011
Solid Waste Liquid Waste Pure Biomass Tyres
33.07 22.09 25.13 19.71
32.56 24.04 23.07 20.332010
0% 10% 20% 30% 40% 50% 60% 70% 80% 90% 100%
If we take into account the biomass fraction in waste streams, we reach a total of 36% of biomass in 2011:
• Liquid alternative fuels, such as solvents, used oil and hydrocarbons decreased from 24% to 22%;
• The quantities of solid waste and tires has remained stable.
Management of waste generated by our activities
WASTE FROM OPERATIONS
(thousand of tons)
Non hazardous
waste recovered
Non hazardous
waste disposed
Hazardous waste
recovered
Hazardous waste
disposed
123.332
82.347 54.540
252.601
14.987
1.977
1.018
1.043
300
250
200
150
100
50
0
A&C
Cement
The practice of waste and energy recovery
from other industrial and domestic sectors
has paved the way for optimal management
of the waste we generate on our sites.
Dust is the primary waste stream in cement
manufacturing and it often can be recycled
into the finished product. 415,000 tons of dust
were collected from the kiln and recycled into
the cement in 2011.
Wastes leaving the cement plants and treated
outside the sites represent 153,000 tons of
which 90% are non-hazardous (137,000
tons). 60% of this non-hazardous waste
stream was recovered in 2011 (82,347 tons).
For Cement, 93% of hazardous wastes were
recovered and only 1,018 tons were disposed
of in 2011, all at dedicated installations.
For Aggregates and Concrete operations, the
waste footprint is similar to that of cement with
99.7% being non hazardous wastes (376,000
tons) and 3,000 tons of hazardous wastes
with two-thirds recycled and only 1,043 tons
disposed at dedicated installations.
133Lafarge | Registration Document | 2011

7SOCIAL AND ENVIRONMENTAL RESPONSIBILITY7.6 Sustainable construction
7.6 Sustainable c onstruction
7.6.2 Access to housing
With the world’s population quickly expanding, especially in urban areas of emerging markets, there is a greater need for decent and affordable
housing. This will strain economic and social systems and put unprecedented pressure on the allocation of scarce resources. Lafarge has
carried out in 2011 several national initiatives contributing to affordable and efficient housing in Indonesia, Philippines, Honduras and France.
Indonesia: Lafarge launches a pilot fund to generate 100 new projectsIn partnership with CARE, Lafarge Cement Indonesia has set up a pilot microcredit program for low-income families to enable them to renovate and expand their houses. The aim is for recipients to improve their living conditions and develop new economic activities. Five microfinance institutions were selected. In collaboration with the University of Aceh, Lafarge has provided technical assistance and conducted a training program for masons. 100 microloans have been granted which will improve the lives of 500 people. Based on this experience, Lafarge is launching several projects in Indonesia, Honduras and other countries.
“Sustainable construction” is the contribution
of all actors that are using or shaping the
built environment to achieving the ambitions
of sustainable development. Building
sustainability is complex and multi-faceted
but Lafarge is making a contribution in many
aspects.
When looking at the life-cycle energy balance
of most existing residential buildings over
say 50 years, about 85% of the total energy
use occurs during the operational phase of a
building’s life. The remaining 15% is due to the
manufacturing of building materials, erection,
maintenance, and its end of life (demolition
and recycling). These proportions may vary
by climates, building types and service life.
7.6.1 Designing b uildings for s ustainability
A. New constructions
In 2011, Lafarge acquired in-house design
capabilities that optimized and documented a
set of 30 «Efficient Building TM» systems. Their
technical assessment includes structural,
thermal, environmental footprint and cost
considerations. By having used an integrated
design approach, the result gives architects,
engineers and contractors clues on how these
systems can help them achieve higher overall
building sustainability levels at affordable cost.
Further, Lafarge developed early assessment
tools to help tailor the building systems to
single project requirements.
Lafarge focussed in 2011 on building systems
suitable for the Mediterranean climate. We will
pursue this effort in coming years with the
development of building systems for other
climates. These building systems and tools
have been peer reviewed by a challenging
panel of external engineers and architects.
To deliver this knowhow to the market, Lafarge
has recruited a new team with the capabilities
of showcasing the benefits of such systems
to property developers, architects, engineers
and contractors.
Already a number of projects have been
designed based on these new internal
resources. For instance, in France, Lafarge
partnered with the home building company
Cecile Robin to demonstrate how positive
energy buildings can be designed and built at
very low construction cost using our innovative
materials with traditional construction modes.
These houses are designed for extended
service life with limited maintenance due to
the durability of concrete.
B. Existing buildings
Energy used in buildings represents about
39% of worldwide total energy consumption.
To reduce this amount, a collective effort of
all building owners and users is required to
significantly reduce the amounts of energy
use and subsequent CO2 emissions caused
by office buildings. For this reason Lafarge
decided to lead by example and in 2011
started to implement WBCSD’s Energy
Efficiency in Buildings Manifesto. The Group
carried out in depth analysis of energy
consumption in 11 large office buildings used
by 3,200 employees, covering 70,000 square
meters. As a result, Lafarge has drafted a Low
Energy Office Policy that states:
• Lafarge offices aim to be best in class in
energy efficiency when compared to similar
offices in their geographic areas;
• Lafarge commits to gradually reduce office
energy use;
• Energy consumption will be compared to
reduction targets and annually published as
part of the Group’s Sustainability Ambitions.
Registration Document | 2011 | Lafarge134

SOCIAL AND ENVIRONMENTAL RESPONSIBILITY
7
7.6 Sustainable construction
7.6.3 Shaping Lafarge R&D
Following the course set in 2009, in 2011 the
Lafarge R&D program continued to deliver
new products to enable construction to be
more sustainable. In 2011, Hydromedia™
was launched: this new high permeable
concrete absorbs rainwater and facilitates
its natural runoff into the ground to replenish
groundwater, avoiding saturation of the storm-
water treatment network, reducing the risk of
flooding in urban areas and reducing water
accumulation on roads and paths.
7.6.4 Lafarge Invention Awards
In 2011 Lafarge conducted a European
competition to promote innovations for more
sustainable construction. One hundred
applications were received from eighteen
countries, and three projects from France,
Poland and Serbia were recognized by an
international panel for the quality of their
work. The awards were given for the design
of a concrete-based artificial reef that fosters
marine biodiversity and fisheries, while
providing scour protection for underwater
structures such as offshore wind power piles,
cables and pipelines. The other two prizes
went to innovations that improve building
thermal performance by integrating heating
and cooling equipment in walls and insulation
in precast concrete elements.
135Lafarge | Registration Document | 2011

7SOCIAL AND ENVIRONMENTAL RESPONSIBILITY7.7 Table of Key Performance Indicators
7.7 Table of Key Performance Indicators
CSI KEY PERFORMANCE INDICATORS - DATA AND COVERAGE
ISSUE KEY PERFORMANCE INDICATOR (KPI)
KPI
LEVEL2011 2010
Climate Protection Total CO2 emissions - gross (million tons) 97.9 93.3 CEMENT
Total CO2 emissions - net (million tons) 95.0 90.8 CEMENT
Specific CO2 emissions - gross (kg/ton cementitious material) 610.7 621.0 CEMENT
Specific CO2 emissions - net (kg/ton cementitious material) 592.9 604.5 CEMENT
Independent third party assurance of CO2 data (Frequency) Yearly Yearly GROUP
Fuels and Raw Materials Specific heat consumption of clinker production (MJ/ton clinker) 3,657 3,667 CEMENT
Alternative Fuel Rate (%) 13.0% 11.6% CEMENT
Biomass Fuel Rate (%) 4.71% 4.04% CEMENT
Alternative Raw Materials Rate (%) 11.20% 10.99% CEMENT
Clinker/Cement Ratio (%) 0.7306 0.7402 CEMENT
Materials used by weight and volume
(EN1 GRI)
Consumption of material (million tons) 415.9 413.2 GROUP
Quantity of quarried material (million tons) 377.2 362.4 GROUP
Consumption of Energy (EN3 GRI) Direct Energy consumption by primary energy source (million Teo) 11.2 10.4 GROUP
Employee Health and Safety Number of fatalities (employees ) 8 9 GROUP
Number of fatalities per 10,000 employees 1.11 1.18 GROUP
Number of fatalities (sub-contractors ) 17 24 GROUP
Number of fatalities (3rd party) 9 11 GROUP
Number of Lost Time Injuries (employees ) 93 120 GROUP
Lost Time Injuries per 1 million manhours (employees ) 0.63 0.76 GROUP
Number of Lost Time Injuries ( sub-contractors) 63 111 GROUP
Lost Time Injuries per 1 million manhours (sub-contractors ) 0.58 0.94 GROUP
Total Number of Lost Time Injuries 156 231 GROUP
Independent third party assurance of safety data (LTIFR and fatalities) Yearly Yearly GROUP
Emissions Reduction Total NOx emissions (tons/year) (1) 190,288 200,275 CEMENT
Specific NOx emissions (g/ton clinker) 1,625 1,800 CEMENT
Total SO2 emissions (tons/year) (1) 50,613 47,364 CEMENT
Specific SO2 emissions (g/ton clinker) 432 426 CEMENT
Total Dust emissions (tons/year) 16,862 17,434 CEMENT
Specific Dust emissions (g/ton clinker) (1) 144 157 CEMENT
Mercury emissions - t/year 4.0 3.7 CEMENT
Mercury emissions mg/t clinker 34.2 33.3 CEMENT
Dioxin/Furans emissions - g TEQ/year 4.7 7.0 CEMENT
Dioxin/Furans emissions pg/ton of clinker 40.0 62.9 CEMENT
VOC emissions - kt/year 4.6 4.2 CEMENT
VOC emissions g/t clinker 39.0 37.7 CEMENT
(1) Data for the year 2010 has been recalculated according to the new method.
Registration Document | 2011 | Lafarge136

SOCIAL AND ENVIRONMENTAL RESPONSIBILITY
7
7.7 Table of Key Performance Indicators
ISSUE KEY PERFORMANCE INDICATOR (KPI)
KPI
LEVEL2011 2010
% Clinker produced with monitoring of dust, SO2 and NO
x emissions 94% 90% CEMENT
% Clinker produced with continuous monitoring of dust, SO2 and NO
x
emissions
65.9% 62.0% CEMENT
Independent third party assurance of emissions data (Frequency) Yearly Yearly GROUP
Local Impacts % of sites with quarry rehabilitation plans in place 86.4% 84.5% GROUP
% of sites with community engagement plans in place 69% 64% CEMENT
Biodiversity KPI no. 1 Number of quarries within, containing, or adjacent to areas designated for
their high biodiversity value, as defined by GRI EN11 (number and coverage)
132
18.3%
GROUP
Biodiversity KPI no. 2 Percentage of quarries with high biodiversity value where biodiversity
management plans are actively implemented
49.2% GROUP
Strategies; current actions and future
plans for managing impacts on
biodiversity (EN14)
Percentage of active quarries that have been screened for biodiversity
according to WWF’s criteria
97.2% 90.7% GROUP
Environmental Expenditures and total
investments by type (EN30 GRI)
Environment capital expenditure (million euros) 79.2 81.8 GROUP
Environment operating expense (million euros) (2) 179.5 GROUP
Total weight of waste by type and
disposal method (EN22 GRI)
Dust Disposed on-site (kton) 559 687 CEMENT
Non hazardous waste recovered (kton) (3) 205.7 GROUP
Non hazardous waste disposed (kton) (3) 307.1 GROUP
Hazardous waste recovered (kton) (3) 17.0 18.6 GROUP
Hazardous waste disposed (kton) (3) 2.1 35.1 GROUP
Total water withdrawal by source (EN8 GRI) Total water withdrawal from ground water (Mm3) 42.3 96.1 GROUP
Total water withdrawal from open water (Mm3) 211.6 182.2 GROUP
Total water withdrawal from other sources (Mm3) 13.0 14.5 GROUP
Rainwater Harvested (Mm3) 15.7 33.4 GROUP
Net water withdrawal (Mm3) 120.9 174.0 GROUP
Quantity of water consumed (Mm3) 81.3 96.3 GROUP
Percentage and total volume of water
recycled and reused (EN10 GRI)
% of sites equipped with a water recycling system 68% 73% GROUP
Actions taken in response to incidents
of corruption (S04 GRI)
% of sites that have implemented the Competition Compliance Program 96% 96% GROUP
Total workforce by employment type,
employment contract, and region,
broken down by gender (LA1 GRI)
Total headcount 67,924 75,677 GROUP
Percentage of full-time employees 99.0% 99.1% GROUP
Percentage of part-time employees 1.0% 0.9% GROUP
Percentage of permanent employees 97.0% 96% GROUP
Percentage of fixed-term contract employees 3.0% 4.0% GROUP
Total number and rate of new employees
hires and employee turnover by age
group, gender, and region. (LA2 GRI)
Number of hirings 7,,400 5991 GROUP
Number of resignations 3,770 3,752 GROUP
Number of retirements 776 1057 GROUP
Number of redundancies 4,308 3,986 GROUP
Number of deaths 125 142 GROUP
Percentage of employees covered by
collective bargaining agreements.
(LA4 GRI)
Percentage of business units where employees are covered by collective
agreements
74% 71% GROUP
(2) Operating expense was reported for 52 % of operations. Further to reliability checks by the Group, the figure here is extrapolated to 100 % from a sample of operations (≈ 40 %).
(3) For A&C, data was reported for 47% of operations and extrapolated to 100%.
137Lafarge | Registration Document | 2011

7SOCIAL AND ENVIRONMENTAL RESPONSIBILITY7.8 Reporting methodology
ISSUE KEY PERFORMANCE INDICATOR (KPI)
KPI
LEVEL2011 2010
Percentage of total worforce represented
in formal joint management-worker
health and safety comittees that help
monitor and advise on occupational
health and safety programs (LA6 GRI)
Percentage of total workforce represented in Health & Safety Committees 59% 51% GROUP
Rates of injury, occupational diseases,
lost days, and absenteeism, and total
number of work-related fatalities, by
regions and by gender (LA7 GRI)
Injury Rate (TIFR - Employees)
Total number of male / female fatalities
2.8
33 M /
1F
3.1 GROUP
GROUP
Average hours of training per year per
employee, by gender, and by employee
category (LA 10 GRI)
Average number of hours of training for management staff 41 45 GROUP
Average of number of hours of training for non-management staff 29 31 GROUP
Percentage of employees receiving
regular performance and career
development reviews, by gender
(LA 12 GRI)
Percentage of management staff having an annual performance review 91.0% 94.0% GROUP
Percentage of non-management staff having an annual performance review 62.0% 64.0% GROUP
Composition of governance bodies and
breakdown of employees per employee
category according to gender, age group,
minority group membership, and other
indicators of diversity (LA13 GRI)
Percentage of employees under the age of 30 16.1% 16.7% GROUP
Percentage of employees between 30 and 50 63.0% 63.3% GROUP
Percentage of employees above 50 20.9% 20.0% GROUP
7.8 Reporting methodology
How we reportWe have aligned our definitions for reporting across all product lines of the Group and have updated our air emissions methodologies to conform to new guidelines issued by the WBCSD CSI.
7.8.1 Reporting standards
The rules for computing the KPIs are
consistent with the GRI (Global Reporting
Initiative) G3 reporting standard. Where
details definitions of KPIs are defined by
WBCSD - CSI (World Business Council
for Sustainable Development - Cement
Sustainability Initiative), the recommended
CSI methodology is used for the calculation
of the KPI. All elements for calculating KPIs
are documented in a glossary specific to the
Cement, Gypsum or Aggregates and Concrete
businesses. Compliance with GRI G3 and a
summary of reporting standards used is
documented online at http://www.lafarge.com.
Health and safety data is collected separately
taking into account our internal guidelines
and external best practice. The Group’s Social
Policies department conducts a separate
survey on social data.
The KPI related to the training on the
stakeholders relationships is also tracked
and verified. Local stakeholder relationship
management training is organized around
plant managers (in Cement and Gypsum)
and area/regional managers in Aggregates
and Concrete.
Our 2008, 2009 and 2010 reports were
awarded an A+ rating against the GRI G3
guidelines; this is the standard for which we
annually strive.
7.8.2 Scope of consolidation and reporting methodologies
The reporting covers all business units and
their industrial production sites under the
Group’s management control throughout the
world.
When a new site is acquired by Lafarge,
procedures and definitions for sustainability
data are not necessarily in line with Lafarge
standards. Accordingly we give the new site a
maximum of four years to meet our standards.
This period is necessary to implement the
appropriate management and data collection
systems, in order to yield good, reliable data
for reporting.
Registration Document | 2011 | Lafarge138
SOCIAL AND ENVIRONMENTAL RESPONSIBILITY
7
7.8 Reporting methodology
When a plant is sold, we cease to include its
performance data and we remove its data from
the baseline data used for our Sustainability
Ambitions, whether the reference year is 1990
or 2005. For plants divested during the year,
environmental and social data is excluded for
the entire year; for health and safety, data is
included up until the time of divestiture.
We use the CSI Protocol V3 to calculate CO2
emissions between the 1990 baseline and the
reporting year.
In 2011 we are changing our methodology for
calculating air emissions to be in accordance
with the 2012 CSI protocol for reporting.
Previously, gas factors based on the type
of kiln process were utilized whereas we
now use gas factors based on the energy
consumption of the specific kiln; 2010 data
and our baseline (2005) is restated using the
changed methodology for comparison.
For dust, SO2 and NO
x emissions, when
measurements are missing, we use standard
emission concentrations based on the site’s
kiln process. In 2011 the standard emission
concentration was applied to 0.9% of clinker
production for dust emissions, 1.9% for SO2
emissions and 4.4% for NOx emissions. For
persistent pollutants, for 2011 reporting we
have changed our reporting methodology to
be in line with 2012 CSI recommendation
to use the last annual year concentration
measurements available rather than a three
year average used in past reports; past data is
restated using this present definition and the
current perimeter for consolidation.
For water, dewatering of quarries and
non-contact cooling water taken from surface
water and returned to the same catchment is
not included in net withdrawal.
For the calculation of safety KPIs that include
contractors, contractor off-site hours are not
included in the divisor and therefore these
indicators may slightly overstate the frequency
rates.
Social data and health and safety data is
collected by business units and consolidated
at Group level. Social data for 2011 in
this report is derived from a social survey
covering 103 business units in 64 countries
representing 100 % of the total Group
workforce.
7.8.3 Control and assurance
Environmental data is collected by business
line and consolidated at Group level. For
cement, environmental experts in the regional
technical centers (Beijing, Cairo, Montreal and
Vienna) review and validate the performance
data for the plants within their regions.
Ernst & Young provides independent
verification for sustainability data. The
statements made in this Social and
Environmental Responsibility Chapter and
a selection of key quantitative indicators
(lost time injury frequency rate and fatality
rate; total headcount, workforce by type of
contracts and by Status, workforce hirings,
resignations, retirements, redundancies
and death; women in senior and executive
management; sites environmentally audited,
quarries with rehabilitation plans and quarries
screened for biodiversity; CO2, dust, NO
x,
SO2, Mercury, VOC and Dioxins/Furans
emissions, water withdrawals by sources, and
total, quarried and alternative raw materials
consumption) were reviewed to issue a limited
assurance report. You can find more details
on the verification works and conclusion in
Ernst & Young’s independent assurance report
provided in Section 7.9.
139Lafarge | Registration Document | 2011

7SOCIAL AND ENVIRONMENTAL RESPONSIBILITY7.9 Independent assurance report on environmental and social information by Ernst & Young
7.9 Independent assurance report on environmental and social information by Ernst & Young
Lafarge S.A.
Financial year ended on December 31, 2011
Independent assurance report on environmental and social information
This is a free translation into English of the original report issued in French and is solely provided for the convenience of English speaking readers.
To the shareholders,
Further to Lafarge’s request, we present you our report on the review of the environmental and social information presented in the Chapter 7
of this Document established for the financial year ended December 31, 2011.
The Board of Directors was responsible for preparing the Group Registration Document which includes environmental and social information
(the “Information”), defining the appropriate reporting criteria (the “Reporting Criteria”) to establish the numerical data (the “Indicators”) (1)
and to ensure their availability.
It is our responsibility to obtain limited assurance that:
1.the Information have been presented faithfully, in all material aspects, in accordance with the principles of completeness, neutrality and clarity
as defined by international standards (2) ;
2.the Indicators were prepared in all material aspects in accordance with the Reporting Criteria.
Our procedures were conducted in compliance with the professional standards applicable in France and the International Standard on Assurance
Engagement (ISAE 3000), published in December 2003. The Reporting Criteria applicable in 2011 consist in:
• Group specific instructions and procedures, a summary of which is provided in Section 7.8 under the heading "Reporting methodology", in
the comments related to the Indicators presentation in Section 7.7, and on the Group website (3) ;
• External standards and guidelines elaborated by the Cement Sustainable Initiative (CSI) of the World Business Council for Sustainable
Development (WBCSD) for environment and safety indicators and the international Hay job evaluation method for data on senior managers.
Those standards and guidelines are available on the WBCSD and Hay websites, respectively (4).
A higher level of assurance would have required a more extensive review.
Nature and scope of our review
We performed the following review to be able to express a conclusion:
On the Information:
• At the Group level and at the Cement and Aggregates and Concrete Division levels, we have conducted interviews with the people responsible
for environmental, safety, and social reporting. At this level, we checked the consistency of the Information with supporting documents or
explanations provided by the Group and available at the headquarters.
• We reviewed the presentation of the Information in Chapter 7 of this Document and the associated notes on methodology.
In addition, on the Indicators:
• We have assessed the Reporting Criteria with respect to their relevance, completeness, neutrality, understandability, and reliability.
• At the Group level and at the Cement and Aggregates and Concrete, Division levels, we have verified the correct application of the Reporting
Criteria. At this level, we have implemented analytical procedures and verified, on a test basis, the calculations and the consolidation of data.
• At the Cement Division level, we checked the consistency of CO2 emissions with figures declared to authorities and verified to date in the
framework of the 2007/589/CE European Directive on "allowances".
• At the Cement Division level, for the indicators related to CO2 emission reduction compared to 1990 emissions, our review was limited to
reviewing modifications brought since 2005 to the 1990 baseline.
• We have selected a sample of three cement sites, three regional technical centers, one shared services center, and eight business units (5)
on the basis of their activity, their contribution to the Group’s consolidated data, their location, and the results of the review performed during
prior financial years. At the level of the selected sites and entities, we have verified the understanding and application of the Reporting Criteria,
and verified, on a test basis, calculations and reconciliation with supporting documents.
The selected sample represented on average 45% of environmental indicators (6) , 5% of hours worked used in the calculation of the lost time
injury frequency rate, and 7% of total headcount for social indicators.
Taking into account the review performed during the past six financial years in different activities and countries, we assess that this review
provide a sufficient basis to issue a reasoned opinion on the faithfulness of the Information and express the conclusion below.
Registration Document | 2011 | Lafarge140

SOCIAL AND ENVIRONMENTAL RESPONSIBILITY
7
7.9 Independent assurance report on environmental and social information by Ernst & Young
Information about the Reporting Criteria
We draw your attention to the following comments on the Reporting Criteria and the Information preparation processes .
Relevance
• The Group publishes environmental and social information on the material issues of the sector and the performance indicators are comparable
to other cement manufacturers belonging to WBCSD-CSI.
Completeness
• The Indicators and Information reporting scope aims to cover the whole Group worldwide.
• Methods for estimating missing data, notably atmospheric emissions or 1990 baseline for CO2 emissions, as well as the perimeters covered
by the Indicators (expressed in percentage) have been indicated in the notes on methodology in Section 7.8, and on the Group website (3).
Neutrality
• The Group provides detailed information on methodologies used to establish the Indicators or the Information in the notes on methodology
in Section 7.8, in the comments next to the published data, and on its website (3).
Reliability
• The methods used to count hours of training are different from one entity to another leading to uncertainty on the information reported in
Sections 7.3.4 and 7.7. In addition, the internal controls on the consolidated data should be strengthened.
• For the information related to sales of new products reported in Section 7.1.2, the criteria used to define what products are considered as
new should be better clarified.
• For the safety indicators, although no major anomaly was detected, the internal controls on the consolidation of hours worked could be
strengthened.
Conclusion
Based on our review, nothing has come to our attention that causes us to believe that:
1.The Information have not been presented faithfully, in all material aspects, in accordance with the principles of completeness, neutrality and
clarity as defined by international standards; and
2.the Indicators were not established, in all material aspects, in accordance with the Reporting Criteria.
Paris-La Défense, March 20 th 2012
ERNST & YOUNG et Associés
Environment and Sustainable Development
Eric Duvaud
(1) Environmental indicators: Gross and net CO2 emissions (total and specific), air emissions (SO
2, NO
x, Dust, Mercury, Dioxins/Furans and VOC), energy consumption (total and specific),
energy mix in % (incl. Alternative fuels and biomass), materials consumption, quarried materials, percentage of alternative materials, water withdrawals by sources, percentage of
active sites audited environmentally within the last 4 years, percentage of quarries with rehabilitation plan, percentage of quarries screened for biodiversity according to WWF criteria.
Safety indicators: LTI frequency rate (Lafarge employees), Fatality rate (Lafarge employees).
Social indicators: Total headcount (incl. part time / full time and type of contract repartition), movements in the population (hiring, resignations, retirement, redundancies, death),
percentage of women in senior management.
(2) ISAE 3000 from IFAC and Global Reporting Initiative (GRI), Sustainability Reporting Guidelines, Version 3.1, Part I.
(3) http://www.lafarge.com in the section “Reporting Methodology”
(4) http://www.wbcsd.org/ Sector Project/ Cement and http://www.haygroup.com/ Our Services / Job evaluation
(5) Three cement plants : Bath (USA), DingXiao (China), and Malogoszcz (Poland) ; three regional technical centers for the Cement Division : Corporate Technical Services (CTS) based
in Montreal (Canada), Asia Technical Center (ATC) based in Beijing and Europe Technical Center (ETC) based in Vienna (Austria); the shared services center based in Reston (USA);
three business units of the Cement Division (Poland, Lakes and Seaways in the USA, and Guizhou in China), five business units of the Aggregates and Concrete Division : Poland,
Southern China (China), France Béton Sud et France Granulats Sud (France), and Greece.
(6) 41% of CO2 emissions, 57 % on average of SO
2, NO
x and dust emissions, 16% on average of sites and active quarries, 33% of total water withdrawals, and 52 % on average of
the raw material consumption.
141Lafarge | Registration Document | 2011

7SOCIAL AND ENVIRONMENTAL RESPONSIBILITY
Registration Document | 2011 | Lafarge142

ADDITIONAL INFORMATION
8
8.1 SHARE CAPITAL 1448.1.1 Changes in the share capital during the fi scal year
ended December 31, 2011 144
8.1.2 Potential share capital at December 31, 2011 144
8.1.3 Changes in our share capital over the past
two fi scal years 144
8.2 SHARES OWNED BY THE COMPANY 1458.2.1 Information on transactions completed
during the fi scal year ending December 31, 2011 145
8.2.2 Information on the share buyback program
approved on May 12, 2011 145
8.2.3 Information on the share buyback program
to be approved on May 15, 2012 146
8.3 SECURITIES NON REPRESENTATIVE OF SHARE CAPITAL – BONDS 146
8.4 AUTHORIZATIONS DELEGATED TO THE BOARD OF DIRECTORS 1478.4.1 Authorizations delegated to the Board of Directors
by the General Meeting 147
8.4.2 Authorizations to be delegated to the Board
of Directors by the General Meeting to be held
on May 15, 2012 148
8.5 ARTICLES OF ASSOCIATION (STATUTS) 1488.5.1 Corporate purpose 148
8.5.2 Board of Directors 148
8.5.3 Rights, preferences and restrictions
attached to shares 149
8.5.4 Changes to shareholders’ rights 150
8.5.5 Convocation and admission to Shareholders’
General Meetings 150
8.5.6 Disclosure of holdings exceeding certain thresholds 150
8.6 CHANGE OF CONTROL 151
8.7 MATERIAL CONTRACTS 151
8.8 DOCUMENTS ON DISPLAY 1528.8.1 Documents available at the registered offi ce
and the Lafarge website 152
8.8.2 Annual Information Document
(art. 222–7 of the general regulations
of the Autorité des marchés fi nanciers (AMF)) 152
143Lafarge | Registration Document | 2011

8ADDITIONAL INFORMATION8.1 Share Capital
144
8.1 Share Capital
As at December 31, 2011, the Company’s share
capital amounted to 1,148,990,072 euros
divided into 287,247,518 fully paid-up shares,
each with a nominal value of 4 euros.
Considering that double voting rights accrue
to 112,769,432 shares held in registered
form for at least 2 years, the total number
of voting rights attached to the shares
for the purpose of computing notification
thresholds amounted to 400,016,950 at
December 31, 2011.
8.1.1 Changes in the share capital during the fiscal year ended December 31, 2011
The Company ’s share cap i ta l a t
December 31, 2010 amounted to
1,145,815,116 euros div ided into
286,453,779 shares, each with a nominal
value of 4 euros.
Since December 31, 2010, the Company’s share capital has increased by a total of 793,739 shares as a result of a capital increase reserved
for Group employees:
NUMBER OF SHARES ISSUED
SUBSCRIPTION AMOUNT (EUROS)
CAPITAL SHARE PREMIUM TOTAL
Capital increase reserved for Group employees 793,739 3,174,956.00 24,351,386.12* 27,526,342.12
* Net of issuance costs
8.1.2 Potential share capital at December 31, 2011
The number of shares as at December 31,
2011 could be increased by a maximum of
8,511,063 shares in the hypothetical scenario
that stock-options granted to employees
existing on that date were exercised. 5,402,651
out of these existing 8,511,063 stock-options
could have been exercised at December 31,
2011. The remaining 3,108,412 stock-options
can only be exercised upon expiry of a period
of four years after their grant and subject to
the performance conditions attached to some
of these stock-options being fulfilled.
At December 31, 2011, the Company had not
issued any other type of security giving any
right, directly or indirectly, to the Company’s
share capital.
Our Board of Directors has received from
our General Meeting held on May 12, 2011,
the right to carry out share capital increases
through the issue of shares or other equity
securities with or without preferential
subscription rights for shareholders, the
capitalization of reserves, the issue of
employee stock subscription options or
performance shares, and through the issue
of shares reserved for our employees.
See Section 8.4 (Authorizations delegated to
the Board of Directors) for further information
on financial authorizations delegated to our
Board of Directors.
8.1.3 Changes in our share capital over the past two fiscal years
2011 2010
Share capital at the beginning of the fiscal year (number of shares) 286,453,779 286,453,316
Number of shares issued during the period from January 1 to December 31 as a result of 793,739 463
payment of the dividend in shares - -
exercise of stock subscription options - 463
exercise of stock subscription warrants - -
increase in share capital reserved for employees 793,739 -
issue of new shares - -
Number of shares cancelled during the period from January 1 to December 31 - -
Maximum number of shares to be issued in the future as a result of 8,511,063 9,099,072
exercise of stock subscription options 8,511,063 9,099,072
exercise of stock subscription warrants - -
conversion of bonds - -
Share capital at the end of the fiscal year
a- euros 1,148,990,072 1,145,815,116
b- number of shares 287,247,518 286,453,779
Registration Document | 2011 | Lafarge144

ADDITIONAL INFORMATION
8
8.2 Shares owned by the Company
8.2 Shares owned by the Company
8.2.1 Information on transactions completed during the fiscal year ending December 31, 2011
The Company held 233,448 shares
with a nominal value of 4 euros, as of
December 31, 2011, representing 0.08%
of its capital stock. The value based on
the purchase price of those shares is
16,546,794.24 euros.
All of the 233,448 shares held by the Company
at December 31, 2011 are assigned to cover
stock-options or performance share grants.
In 2011, 130,110 shares were used to cover
the delivery of performance shares. None of
the shares held by the Company have been
reassigned to cover different objectives.
The Company has not entered into any
liquidity agreement with an investment service
provider.
In 2011, the Company carried out the following transactions on its shares:
PURCHASES SALES
NUMBER OF SHARES
PURCHASEDAVERAGE PRICE
(IN EUROS)AMOUNTS
(IN EUROS)NUMBER OF
SHARES SOLDAVERAGE PRICE
(IN EUROS)AMOUNTS
(IN EUROS)
2011 fiscal year - - - 130,110* - -
* Delivered to employees as part of performance share plans.
8.2.2 Information on the share buyback program approved on May 12, 2011
The share buyback program approved by the Shareholders’ Meeting on May 12, 2011 has the following features:
Securities Shares
Maximum percentage of capital that may be authorized 5%
Maximum number of shares that may be acquired 14,322,688*
Maximum total amount of the program 500 million euros
Maximum unit purchase price 100 euros
* Which is 5% of the capital as of December 31, 2010, subject to adjustment to take into account treasury shares and/or shares cancelled on the date of the purchases.
Program objectives:
• the implementation of any Company
stock-option plan under the terms of
articles L. 225-177 et seq. of the French
Commercial Code or any similar plan; or
• the allotment or sale of shares to employees
under the French statutory profit-
sharing scheme or the implementation
of any employee savings plan under
applicable legal conditions, in particular
articles L. 3332-1 et seq. of the Labor
Code; or
• the allotment of consideration free
shares pursuant to the terms of
articles L. 225-197-1 et seq. of the French
Commercial Code; or
• generally, to fulfil obligations linked with
stock-option program s or other share
allotment schemes in favor of employees
or executive officers of the Company or
related entities; or
• the delivery of shares on the exercise of
rights attached to securities giving rights
to the capital by redemption, conversion,
exchange, presentation of a warrant or any
other means; or
• the cancellation of some or all of the shares
purchased, pursuant to the 15th resolution
approved by the Combined General Meeting
on May 12, 2011; or
• the delivery of shares (in exchange, as
payment, or otherwise) in connection with
acquisitions, mergers, demergers or asset-
for-share exchanges; or
• market-making in the secondary market
or maintenance of the liquidity of Lafarge
shares by an investment services provider
under a liquidity contract that complies with
the ethical code recognized by the Autorité
des marchés financiers.
Period 18 months, until November 12, 2012.
As indicated in the table in Section 8.2.1
above, the Company has not purchased any
of its own shares within the share buyback
program in 2011 or until publication of this
Registration Document.
145Lafarge | Registration Document | 2011

8ADDITIONAL INFORMATION8.3 Securities non representative of share capital – Bonds
8.2.3 Information on the share buyback program to be approved on May 15, 2012
The Shareholders’ Meeting convened on May 15, 2012 should be presented with the following share buyback program for approval:
Securities Shares
Maximum percentage of capital that may be authorized 5 %
Maximum number of shares that may be acquired 14,362,375
Maximum total amount of the program 500 million euros
Maximum unit purchase price 80 euros
* Which is 5% of the capital as of December 31, 2011, subject to adjustment to take into account treasury shares and/or shares cancelled on the date of the purchases.
Program objectives:
• the implementation of any Company
stock-option plan under the terms of
articles L. 225-177 et seq. of the French
Commercial Code or any similar plan; or
• the allotment or sale of shares to employees
under the French statutory profit-
sharing scheme or the implementation
of any employee savings plan under
applicable legal conditions, in particular
articles L. 3332-1 et seq. of the Labor
Code; or
• the allotment of consideration free
shares pursuant to the terms of
articles L. 225-197-1 et seq. of the French
Commercial Code; or
• generally, to fulfil obligations linked with
stock-option program s or other share
allotment schemes in favor of employees
or executive officers of the Company or
related entities; or
• the delivery of shares on the exercise of
rights attached to securities giving rights
to the capital by redemption, conversion,
exchange, presentation of a warrant or any
other means; or
• the cancellation of some or all of the shares
purchased, pursuant to the 15th resolution
approved by the Combined General Meeting
on May 12, 2011; or
• the delivery of shares (in exchange, as
payment, or otherwise) in connection with
acquisitions, mergers, demergers or asset-
for-share exchanges; or
• market-making in the secondary market
or maintenance of the liquidity of Lafarge
shares by an investment services provider
under a liquidity contract that complies with
the ethical code recognized by the Autorité
des marchés financiers.
Period : 18 months, until November 15, 2013.
As at February 29, 2012, the Company
held 233,448 shares with a nominal value
of 4 euros representing 0.08% of its capital
stock, all of which are assigned to cover stock-
options or performance share grants.
The Company has no open purchase or sale
positions in relation to its share buyback
program approved on May 12, 2011 on
the date of publication of this Registration
Document.
8.3 Securities non representative of share capital – Bonds
To meet the Group’s medium and long-term
financing needs and to optimize the maturity
profile of the Group’s debt, Lafarge issues
bonds and other related securities on a regular
basis, in particular under its Euro Medium
Term Notes program (“EMTN”).
The Company has not issued any bond or
other related security in 2011, either under
the EMTN program or otherwise.
The maximal nominal outstanding amount
under our EMTN program is currently 12,000
million euros. At December 31, 2011, the
Company’s total nominal outstanding amount
of bond issues under the EMTN program is
8,748 million euros. The available balance for
new bond issues was therefore 3,252 million
euros at December 31, 2011.
At December 31, 2011, the total nominal
outstanding amount of the Company
resulting from bonds issues, including bonds
issues made under the EMTN program, is
10,384 million euros.
See Section 4.4 (Liquidity and c apital
r esources – Net cash provided (used in)
financing activities) and Note 25 (Debt) to
our consolidated financial statements for more
information on bond issues.
Our General Meeting held on May 12, 2011
authorized our Board of Directors to issue up
to 8,000 million euros of bonds and other
related securities for a period of 26 months. At
December 31, 2011, an outstanding amount
of 8,000 million euros was available for new
bonds, as the Company had not issued
in 2011 any bond or other related security
since the authorization granted by the General
Meeting held on May 12, 2011.
Following a bond issue on March 15, 2012,
the outstanding amount available on the
date of the Registration Document has been
reduced to 7,950 million euros.
See Section 8.4 (Authorizations delegated to
the Board of Directors) for further information
on financial authorizations delegated to our
Board of Directors.
Registration Document | 2011 | Lafarge146

ADDITIONAL INFORMATION
8
8.4 Authorizations delegated to the Board of Directors
8.4 Authorizations delegated to the Board of Directors
8.4.1 Authorizations delegated to the Board of Directors by the General Meeting
At March 15, 2012, the Board of Directors benefited from the following authorizations upon delegation by the General Meeting held on
May 12, 2011:
TYPE OF AUTHORIZATION MAXIMUM AMOUNTS EXPIRATION DATE
MAXIMUM AUTHORIZED AMOUNT AVAILABLE AT
MARCH 15, 2012(EUROS)
Buy and sell its own shares (7th resolution) Up to 5% of the share capital
Up to 500 million euros
Unitary Purchase price up to
100 euros November 12, 2012
5% of
the share capital
500 million euros
Issue of bonds and other related securities (8th resolution) 8 billions euros (nominal value) July 12, 2013 7,950 million euros
Issue of shares or other equity securities
with preferential subscription rights (9th resolution)
560 million euros
(nominal value) (1) July 12, 2013 560 million euros
Issue of shares or other equity securities
without preferential subscription rights (10th resolution)
160 million euros
(nominal value) (2) July 12, 2013 160 million euros
Issue of shares in an offer as set forth in article L. 411-2 of the French
Monetary and Financial Code (11th resolution)
160 million euros
(nominal value) (2) (3) July 12, 2013 160 million euros
Issue of shares or other equity securities as payment for contributions in
kind (12th resolution)
112 million euros
(nominal value) (2) (3) July 12, 2013 112 million euros
Increase in the number of shares to be issued in case of a capital
increase with or without preferential subscription rights (13th resolution)
Up to the amount applicable
to the initial issue and to be
applied against the global cap
set forth in the 9th resolution July 12, 2013 -
Capital increase through incorporation of premiums, reserves, profits or
other items (14th resolution)
100 million euros
(nominal value) (2) (3) July 12, 2013 100 million euros
Reduction of share capital through cancellation of treasury shares
(15th resolution)
Up to 10% of the share capital
for a 24-month period July 12, 2013
10% of
the share capital
Grant of options to subscribe for and/or purchase shares (16th resolution) 3% of the share capital (on
grant date) July 12, 2013
2.55 % of the share
capital
Allotment of free existing or new shares (17th resolution) 1% of the share capital
(on grant date) (4) July 12, 2013
0.82 % of
the share capital
Issue of shares or other equity securities reserved for Group employees
(18th resolution)
50 million euros
(nominal value) July 12, 2013 46,825,044 euros
Capital increase reserved for a category of beneficiaries as part of a
transaction reserved for employees (19th resolution)
50 million euros
(nominal value) (5) November 12, 2012 46,825,044 euros
(1) Global cap for the 9th, 10th, 11th, 12th, 13th and 14th resolutions.
(2) To be applied against the global cap set forth in the 9th resolution.
(3) To be applied against the cap set forth in the 10th resolution.
(4) To be applied against the cap set forth in the 16thresolution.
(5) To be applied against the cap set forth in the 18h resolution.
147Lafarge | Registration Document | 2011

8ADDITIONAL INFORMATION8.5 Articles of Association (Statuts)
Use of authorizations in 2011
In 2011, the Board of Directors made use of
the authorization granted in the 17th resolution
by granting 20,000 performance shares
to Mr Bruno Lafont, Chairman and Chief
Executive Officer, on May 12, 2011.
Use of authorizations in 2012
The Board of Directors made use of the
authorization granted in the 17th resolution
during its meeting on March 15, 2012
by granting 789,920 stock options and
483,967 performance shares, of which
70,000 options and 20,000 performance
shares were granted to the Chairman and
Chief Executive Officer.
In addition, on March 15, 2012, we made use
of the authorization to issue bonds and other
related securities granted in the 8th resolution
for a 50 million euros private placement under
our EMTN Program.
8.4.2 Authorizations to be delegated to the Board of Directors by the General Meeting to be held on May 15, 2012
The General Meeting to be held on May 15, 2012 should vote upon the following delegations:
TYPE OF AUTHORIZATION TO BE VOTED UPON MAXIMUM AMOUNTS EXPIRATION DATE
Buy and sell its own shares
(17th resolution)
Up to 5% of the
share capital
Up to 500 million euros
Purchase price of up to 80 euros
November 15, 2013
8.5 Articles of Association (Statuts)
The main provisions of articles of association
of Lafarge S.A. are summarized below.
8.5.1 Corporate purpose
The Company’s purpose is:
1. The acquisition and management of all
industrial and fi nancial holdings, including,
without limitation:
• industries relating to cement and other
hydraulic binders, construction materials
and products or equipment used in homes;
• refractory product industries;
• industr ia l plant engineering and
construction;
• bio-industries and agri-business.
2. Research and provision of services in any
of the above-mentioned fi elds and in any
other fi eld where the skills of the Company
and its subsidiaries may be relevant.
3. All associations or undertakings, all
acquisitions of securities, and all industrial,
commercial, financial, agricultural, real
and movable property transactions relating
directly or indirectly to any of the above-
mentioned purposes or such as ensure the
development of Company assets.
8.5.2 Board of Directors
The Board of Directors must have a minimum
of three members and a maximum of
18 members. The Directors are appointed by
shareholders at a General Meeting, and their
term of office is for four years. Directors must
not be over 70 years of age and must each
hold at least 1,143 of the Company’s shares.
Each Director’s term of office expires at the
end of the ordinary Shareholders’ Meeting
called to approve the previous year’s financial
statements and held in the year during which
the Director’s term of office normally expires
or during which the Director reaches the age
limit of 70 years.
The Board of Directors elects a Chairman from
among its members. The Chairman of the
Board must not be over 65 years of age. The
Chairman automatically ceases to perform his
duties on December 31 of the year in which
he reaches the age of 65 unless the Board of
Directors decides as an exceptional measure
to extend the term of office of the Chairman
beyond the above-mentioned age limit for
successive one-year periods provided that his
term of office as Director continues for such
periods. In this case, the term of office of the
Chairman of the Board expires definitively on
December 31 of the year in which he reaches
the age of 67.
See Section 5.1 (Board of Directors-Corporate
Officers) for more information on our Board
of Directors.
Transactions between the Company and Directors
Agreements between the Company and any
member of the Board of Directors are subject
to prior approval of the Board unless these
agreements are entered into at arms’ length in
the ordinary course of business. The Director
who has an interest in the agreement to be
approved by the Board cannot take part in
the vote of the Board of Directors. The same
applies to agreements to be entered into
between the Company and the Chief Executive
Officer, a Chief Operating Officer, a shareholder
holding more than 10% of the voting rights in
the Company or, if such shareholder is a legal
entity, a company controlling that shareholder.
Directors’ compensation
The Shareholders’ Meeting can award a fixed
annual amount as compensation for the
members of the Board of Directors. The Board
can then distribute this amount between
its members as it sees fit.
See Section 5.4 (Compensation and benefits)
for more information on the amount of
compensation awarded to the Directors by
the Shareholders Meeting.
The Board of Directors can authorize the
reimbursement of travelling expenses
and expenses incurred by Directors in the
interests of Lafarge. The Board may also
award exceptional remuneration to Directors
Registration Document | 2011 | Lafarge148

ADDITIONAL INFORMATION
8
8.5 Articles of Association (Statuts)
who are members of Committees formed from
among its members or who are entrusted with
specific tasks or duties.
8.5.3 Rights, preferences and restrictions attached to shares
Allocation and appropriation of earnings
The net results of each financial year after
deduction of overheads and other Company
expenses, including any depreciation and
provisions, constitute the Company’s profit or
loss for that financial year.
The Company contributes 5% of this profit,
as reduced by any loss carried forward from
previous years, to a legal reserve fund; this
contribution is no longer required if the legal
reserve fund equals 10% of the Company’s
issued share capital and becomes compulsory
again if the legal reserve fund falls below this
percentage of the share capital.
A contribution is also made to other reserve
funds in accordance with French law.
The profits remaining after these contributions
constitute the profits available for distribution,
as increased by any profit carried forward from
the previous years, out of which an initial
dividend equal to 5% of the nominal value of
shares fully paid-up and not redeemed is paid
to the shareholders. Such dividends cannot
be carried forward from one year to another.
The profits available for distribution remaining
after payment of the initial dividend can be
allocated to optional reserve funds or carried
forward. Any profits remaining are distributed
to shareholders as a super dividend.
The Shareholders’ General Meeting may also
decide to distribute part of the Company’s
distributable reserves. In such cases,
the decision of the shareholders must specify
expressly from which reserves the distribution
is to be made. In any event, dividends are
to be paid first from the financial year’s
distributable profits.
If the Company has incurred losses, such
losses are record ed, after approval of the
accounts by the shareholders, in a special
balance sheet account and can be carried
forward against profits in subsequent years
until extinguished.
Payment of dividends
Our statuts provide that the General Meeting
may offer shareholders a choice, with respect
to all or part of any dividend to be distributed,
between payment in cash and payment in
new Company shares pursuant to applicable
law. Shareholders may be offered the same
choice with regard to the payment of interim
dividends.
Unclaimed dividends within five years from
the date of payment are forfeited and must
be paid to the French State, in accordance
with French law.
Loyalty dividend
Any shareholder who, at the end of the fiscal
year, has held registered shares for at least
2 years and still holds them at the payment
date of the dividend in respect of that year, is
entitled to receive in respect of such shares a
bonus equal to 10% of the dividend (initial and
loyalty dividend) paid to other shareholders,
including any dividend paid in shares. Where
applicable, the increased dividend is rounded
down to the nearest cent. Entitlement to the
increased dividend is lost upon conversion of
the registered shares into bearer form or upon
transfer of the registered shares.
Similarly, any shareholder who, at the end of
the fiscal year, has held registered shares for
at least 2 years and still holds them at the
date of an issue by way of capitalization of
reserves, retained earnings or issue premiums
of performance shares, is entitled to receive
additional shares equal to 10% of the number
distributed, rounded down to the nearest
whole number. The number of shares giving
entitlement to such increases held by any one
shareholder may not exceed 0.5% of the total
share capital at the relevant fiscal year-end.
In the event of a share dividend or bonus issue,
any additional share ranks pari passu with the
shares previously held by a shareholder for
the purpose of determining any increased
dividend or distribution of performance
shares. However, in the event of fractions:
• where a shareholder opts for payment of
dividends in shares, he can pay a balancing
amount in cash to receive an additional
share provided he meets the applicable
legal requirements;
• in the event of a bonus issue, the rights
to any fractions of a share arising from
the increase are not negotiable, but the
corresponding shares can be sold and the
proceeds will be distributed to the holder
of such rights no later than 30 days after
the registration in the share account of the
whole number of shares allocated to him.
Voting rights
Each holder of shares is entitled to one vote
per share at any Shareholders’ General
Meeting. Voting rights attached to shares
may be exercised by the holder of the usufruct
except where the holder of the usufruct and
the beneficial owner agree otherwise and
jointly notify the Company at least five days
before the date of the meeting.
DOUBLE VOTING RIGHTS
Double voting rights are attached to fully
paid-up shares registered for at least 2 years
in the name of the same shareholder. In
accordance with French law, entitlement to
double voting rights is lost upon conversion of
the registered shares into bearer form or upon
transfer of the registered shares (this does not
apply to transfers resulting from inheritance or
gifts). Double voting rights were introduced
in our statuts over 60 years ago and are
exercisable within the limitations set out below.
ADJUSTMENT OF VOTING RIGHTS
There are no restrictions on the number of
voting rights held by each of our shareholders
if those rights do not exceed 5% of the rights
attached to all the shares comprising the
Company’s share capital. Above this threshold,
the number of voting rights is adjusted on
the basis of the percentage of the capital
represented at the General Meeting rounded
off to the nearest whole unit. This prevents
over-representation of a shareholder when
participation at a General Meeting is low, while
ensuring that each of our shareholders obtains
a percentage of voting rights at least equal to
his stake in the Company’s share capital.
Where applicable, the voting rights held
directly or indirectly by a shareholder are
added to the voting rights belonging to any
third party, with whom such shareholder is
acting in concert, as defined by law.
This adjustment mechanism does not apply
when the quorum at the General Meeting is
greater than two-thirds of the total number of
voting rights.
149Lafarge | Registration Document | 2011

8ADDITIONAL INFORMATION8.5 Articles of Association (Statuts)
8.5.4 Changes to shareholders’ rights
Shareholders’ rights can only be modified if
a resolution to amend our statuts is passed
at an Extraordinary General Meeting of
the shareholders by a two-thirds majority.
Unanimity is, however, required to increase
shareholders’ obligations. In addition to a vote
at the Shareholders’ Extraordinary General
Meeting, elimination of double voting rights
requires ratification by a two-thirds majority
at a special meeting of the shareholders
benefiting from such rights.
8.5.5 Convocation and admission to Shareholders’ General Meetings
Convocation of General Meetings
Shareholders’ General Meetings can be called
by the Board of Directors or, failing which, by
the auditors and any other person legally
authorized for such purpose.
The form of notice calling such meeting,
which may be transmitted electronically, and
the time limits for sending out this notice are
regulated by law. The notice must specify the
place of the meeting, which may be held at
the registered office or any other place, and
the agenda of the meeting.
Attendance and Voting at General Meetings
Shareholders’ General Meetings may be
attended by all shareholders regardless of the
number of shares they hold, provided that all
calls of capital contributions due or past due
with respect to such shares have been paid
in full.
Access to the General Meeting is open to such
shareholders, as well as to their proxies and
registered intermediaries who have provided
evidence of their entitlement to attend no later
than midnight (Paris time) three business
days before the date of the General Meeting,
including certification that their shares are
registered in an account. It is not necessary
to block shares in order to attend General
Meetings. The Board of Directors may,
where appropriate, present shareholders
with personal admission cards and request
production of the cards.
At all General Meetings, shareholders
are deemed present for quorum and
majority purposes if participating in the
General Meeting by videoconference or
by any electronic communication means,
including internet, that permits them to be
identified. The Board of Directors organizes,
in accordance with applicable laws and
regulations, the participation and voting by
such shareholders at the meeting by creating
a dedicated site, and verifies the efficacy of
the methods adopted to permit shareholder
identification and to guarantee their effective
participation in the General Meeting.
Shareholders not domiciled in French territory
may be represented by an intermediary
registered in accordance with applicable laws.
Any shareholder may be represented by proxy,
even if the proxy holder is not a shareholder.
Shareholders may also vote by mail in
accordance with the conditions set out by law.
Shareholders may, pursuant to applicable
law and regulations, submit their proxy or
mail voting forms in respect of any General
Meeting, either in paper form or by a method
of electronic communications, provided
that such method is approved by the Board
of Directors and published in the notices
of meeting, no later than 3.00 p.m. (Paris
time) the day before the date of the General
Meeting. The Board of Directors is authorized
to reduce the time limit for the receipt of such
forms.
Any shareholder fulfilling the required
conditions set out above may attend the
General Meeting and take part in the vote,
and any previously submitted correspondence
vote or previously granted proxy is deemed
invalid.
Quorum
In Ordinary and Extraordinary General
Shareholders’ Meetings, the calculation of
the quorum is based on the total number of
shares with voting rights.
Ordinary General Meetings: the quorum for
Ordinary General Meetings called pursuant
to the first notice of the meeting is only met
if the shareholders present, deemed present
or represented, hold 20% of the shares with
voting rights. No quorum is required for a
meeting called pursuant to a second notice.
Extraordinary Meetings: a quorum for
Extraordinary Meetings is met only if the
shareholders present, deemed present or
represented at a meeting called pursuant to
the first notice, hold 25% of the shares with
voting rights, or hold 20% of the shares with
voting rights at a meeting called on second
notice. If the quorum is not met pursuant
to the second notice, the meeting is to be
postponed to a date no later than 2 months
after the date for which it had been called.
Majority Required
Resolutions at an Ordinary General Meeting of
shareholders are passed by a simple majority
of the votes cast by the shareholders present,
deemed present or represented.
Resolutions at an Extraordinary General
Shareholders’ Meeting are passed by a
two-thirds majority of the votes cast by the
shareholders present, deemed present or
represented.
In the event of a capital increase by
capitalization of reserves, profits or issue
premiums, resolutions are passed in
accordance with the voting requirements for
Ordinary General Shareholders’ Meetings.
8.5.6 Disclosure of holdings exceeding certain thresholds
In addition to the legal requirement to disclose
holdings exceeding certain thresholds,
our statuts provide that any person acting
alone or in concert who becomes, directly
or indirectly, the owner of 2% or more of
our share capital must notify the Company
therein. This notification requirement is
governed by the same provisions that apply
to the legal requirement. The Company must
be notified, within the time limits provided
by law, by registered mail with return receipt
requested or by fax or telex, of the number
of shares held, indicating whether these are
held directly or indirectly and whether the
shareholder is acting alone or in concert.
The same notification requirement applies
to each subsequent increase or decrease
in ownership of 1% or whole multiples of
1%. The notification must also specify the
date on which the threshold was crossed
(which corresponds to the date on which
the transaction resulting in the crossing of
the threshold took place) and the number of
shares held giving access to the share capital.
If a person does not comply with this
notification requirement, the provisions of the
law providing for loss of voting rights apply. If
this sanction is not applied automatically, one
or more shareholders holding 1% or more of
our share capital or voting rights may require
a Shareholders’ General Meeting to strip the
Registration Document | 2011 | Lafarge150

ADDITIONAL INFORMATION
8
8.6 Change of control
shares in excess of the relevant threshold
of voting rights at all General Meetings for
2 years following the date on which the owner
complies with the notification requirements.
This penalty is irrespective of any legal
sanction that may be issued by a court upon
the request of the Chairman, a shareholder or
the Autorité des marchés financiers (AMF).
The Company may at any time request,
under the terms and conditions set forth
by applicable law, the entity in charge of
settlement of securities transactions to identify
the holders of securities conferring immediate
or future entitlement to voting rights at General
Meetings and to state the number of securities
held by each holder and any restrictions on
such securities.
8.6 Change of control
Within the framework of the provisions
of Article L. 225-100-3 of the French
Commercial Code, the Company states that it
has no specific provisions which may have an
incidence in the event of a call for tenders. The
change of control provisions of the Company’s
principal financing agreements, including
those presented in Section 8.7 (Material
contracts), details the early reimbursement
of the loans in case of a change of control.
The EMTN program of the Company includes
in its terms and conditions the situation of a
change of control accompanied by a lowered
financial rating for the Company which could
bring about, at the choice of bonds holders
and subject to certain conditions, the early
reimbursement of bonds. In addition, for
informational purposes:
• the structure of the Company’s capital, the
information on the thresholds notifications
and declaration of intent are set forth in
Chapter 6 (Major shareholders) and certain
provisions of the Articles of Association,
including those regarding voting rights,
are set forth in Section 8.5 (Articles of
Association (Statuts);
• to the Company’s knowledge, there are no
agreements between shareholders which
may give rise to restrictions to the transfer
of shares and the exercise of the Company’s
voting rights, and the Company has not
been informed of agreement clauses
pursuant to Article L. 233-11 of the French
Commercial Code;
• the severance arrangements which may be
due to the Chairman and Chief Executive
Officer following a change of control is
set forth in Section 5.4.2 (Compensation
benefits paid to the Chairman and Chief
Executive Officer).
8.7 Material c ontracts
We are a party to a syndicated credit facility
entered into on October 29, 2004, and
amended successively on July 28, 2005,
July 27, 2010 and March 19, 2012.
This facility originally provided a revolving
credit line in the amount of 1,850 million
euros, with a maturity of five years. Through
the last amendment of March 19, 2012, we
have reduced the amount to 1,235 millions
euros and extended the maturity to July 28,
2015 for 1,200 million euros.
As a part of the acquisition of Orascom
Cement, we are party to a 7,200 million
euro credit facility dated December 9, 2007
arranged by BNP Paribas, Calyon and
Morgan Stanley Bank International Ltd. This
facility is structured in several tranches of
different amounts and with maturity dates
between one and five years (1,800 million
euros maturing in one year, 2,300 million
euros in 2 years and 3,100 million euros in
five years, with one-year extension options
for each of the tranches maturing in one
and 2 years). The first tranche was partially
refinanced up to 1,500 million euros in 2008.
We exercised the first extension option of one
year on November 17, 2008 for the remaining
300 million euros. During the 2009 fiscal year
we made several early repayments for a total
amount of 4,900 million euros. As a result a
balance of 768 million euros remains due
under this facility as at December 31, 2011,
maturing on December 9, 2012.
We also have a significant number of contracts
relating to outstanding bond issues.
See Section 4.4 (Liquidity and c apital
r esources) and Note 25 (Debt) to our
consolidated financial statements for further
information.
In addition, we have entered into several
agreements in relation to the significant sales
and acquisitions mentioned in Section 3.2.2
(Recent acquisitions, partnerships and
divestitures).
151Lafarge | Registration Document | 2011

8ADDITIONAL INFORMATION8.8 Documents on display
8.8 Documents on d isplay
8.8.1 Documents available at the registered office and the Lafarge website
The Articles of Association of the Company,
minutes of General Meetings as well as
reports from the Board of Directors to the
General Meeting, auditors’ reports, financial
statements of the Company for the last three
fiscal years, and any other document sent to or
available for our shareholders in accordance
with the law, are available for consultation
during the validity period of this Registration
Document at our registered office, 61, rue des
Belles Feuilles, 75116 Paris.
In addition, historical financial information and
regulated information relating to the Group as
well as information relating to the Company’s
General Meetings is available on-line at
www. lafarge.com.
8.8.2 Annual Information Document (art. 222–7 of the general regulations of the Autorité des marchés financiers (AMF))
The tables below list the information which has been disclosed by Lafarge since January 1, 2011 (in addition to the data mentioned in
Section 8.8.1 above).
Releases available on the Lafarge internet website: www.lafarge.com
DATE TITLE
03/20/2012 Lafarge extends syndicated credit facility to July 2015
03/16/2012 Lafarge: Ordinary General Meeting (May 15, 2012) – Availability of documentation
02/17/2012 2011 full year results
02/02/2012 Lafarge presents its proposed reorganization of the Group’s corporate functions
01/17/2012 Lafarge launches Studio+ on affordable housing
11/21/2011 Lafarge announces its new organization project
11/04/2011 Lafarge closes sale of Gypsum assets to Etex Group
11/04/2011 Cooptation of Ian Gallienne as a Director of Lafarge
11/04/2011 2011 third quarter results
09/28/2011 Inauguration of first sustainable construction development laboratory in Chongqing
09/28/2011 Lafarge – partnering architecture and UIA2011 TOKYO
08/17/2011 Divestment of Gypsum business in Asia
07/28/2011 2011 half year results
07/22/2011 Sale of Australian Gypsum operations
07/14/2011 Project to sell European and South American Gypsum operations
06/23/2011 Announcement of new CO2 targets
06/09/2011 Lafarge strengthens its partnership with Ecole des Ponts ParisTech
05/27/2011 Share capital increase reserved for the Group’s employees
05/17/2011 New “Clean Development Mechanism” in the Philippines
05/12/2011 Shareholders’ Meeting
05/12/2011 Sale of Cement and Concrete assets in the southeast United States
05/05/2011 2011 first quarter results
02/18/2011 Lafarge and Anglo American to create a joint venture in UK
02/18/2011 2010 full year results
01/30/2011 Temporary return of some Cairo-based expatriates
01/06/2011 Lafarge Invention Awards: innovating for sustainable construction
Registration Document | 2011 | Lafarge152

ADDITIONAL INFORMATION
8
8.8 Documents on display
Other permanent and occasional information available on the Lafarge website: www.lafarge.com
DATE TITLE
03/09/2012 Declaration in accordance with article 223-16 of the AMF general regulations
02/13/2012 Declaration in accordance with article 223-16 of the AMF general regulations
01/19/2012 Declaration in accordance with article 223-16 of the AMF general regulations
12/08/2011 Declaration in accordance with article 223-16 of the AMF general regulations
11/14/2011 Declaration in accordance with article 223-16 of the AMF general regulations
10/14/2011 Declaration in accordance with article 223-16 of the AMF general regulations
09/08/2011 Declaration in accordance with article 223-16 of the AMF general regulations
08/08/2011 Declaration in accordance with article 223-16 of the AMF general regulations
07/11/2011 Declaration in accordance with article 223-16 of the AMF general regulations
06/09/2011 Declaration in accordance with article 223-16 of the AMF general regulations
05/16/2011 Declaration in accordance with article 223-16 of the AMF general regulations
04/08/2011 Declaration in accordance with article 223-16 of the AMF general regulations
03/08/2011 Declaration in accordance with article 223-16 of the AMF general regulations
02/18/2011 Declaration in accordance with article 223-16 of the AMF general regulations
01/10/2011 Declaration in accordance with article 223-16 of the AMF general regulations
Information published in the Official Journal for Legal Compulsory Publications (Bulletin des Annonces Légales Obligatoires) available on the
website: www.journal-officiel.gouv.fr
DATE ISSUE NUMBER TITLE
03/19/2012 (n°34) Notice of meeting of shareholders
05/23/2011 (n°61) Annual financial statements
04/22/2011 (n°48) Notice of meeting of shareholders
03/18/2011 (n°33) Notice of meeting of shareholders
153Lafarge | Registration Document | 2011

8ADDITIONAL INFORMATION
Registration Document | 2011 | Lafarge154

9.1 REPORT OF THE CHAIRMAN OF THE BOARD OF DIRECTORS ON INTERNAL CONTROLPROCEDURES AND ON CORPORATE GOVERNANCE (ARTICLE L. 225-37 OF THE FRENCH COMMERCIAL CODE) 1569.1.1 General organization of internal control
and risk management 156
9.1.2 Procedures related to “internal control
over fi nancial reporting” 158
9.2 STATUTORY AUDITORS’ REPORT, PREPARED IN ACCORDANCE WITH ARTICLE L. 225-235 OF THE FRENCH COMMERCIAL CODE (CODE DE COMMERCE) ON THE REPORT PREPARED BY THE CHAIRMAN OF THE BOARD OF DIRECTORS OF LAFARGE 159
INTERNAL CONTROL PROCEDURES
9
155Lafarge | Registration Document | 2011

9INTERNAL CONTROL PROCEDURES9.1 Report of the Chairman of the Board of Directors on internal control procedures and on corporate governance
156
9.1 Report of the Chairman of the Board of Directors on internal control procedures and on corporate governance (article L. 225-37 of the French Commercial Code)
This report on internal control procedures and corporate governance was prepared under the responsibility of the Chairman of the Board
pursuant to the article L. 225-37 of the French Commercial Code.
It was drafted with the support of the Group Internal Control department and Group Audit department.
It was examined by the Audit Committee in its meeting of February 15, 2012 and approved by the Board of Directors in its meeting of February 16,
2012 and covers Group Holding, Lafarge S.A., as well as controlled companies included in the Group’s scope of consolidation.
The information of this report is organized as follows:
• general organization of internal control and of risk management;
• internal control procedures related to the preparation of accounting and financial information.
The introduction of Chapter 5 (Declaration in terms of corporate governance – Governance Code of reference) and Sections 2.2 (Risk
Management), 5.1 (Board of Directors-Corporate O fficers), 5.2 (Board and Committee rules and pract ices), 5.4 (Compensations and benefits),
5.7 (Implementation of the principle "Comply or Explain" of the AF EP-MEDEF Code), and 8.5.5 (Convocation and admission to Shareholders’
General Meetings) of the Registration Document are part of this report. Moreover the Registration Document includes the information pursuant
to article L. 225-100-3 of the French Commercial Code (see Section 8.6 (Change of control)).
Internal control related to the preparation of financial and accounting information is designated below as “internal control over financial reporting”.
9.1.1 General organization of internal control and risk management
Internal control framework chosen by the Group
In conformity with the definition of the COSO Report (1), which is the framework chosen by the Group, the internal control process consists
in implementing and permanently adapting appropriate management systems, aiming at giving the Directors and management reasonable
assurance concerning the reliability of financial reporting, compliance with laws and internal regulations, and the effectiveness and efficiency of
major Company processes. One of the objectives of internal control is to prevent and monitor the risks of errors and fraud. Like all control systems,
because of its inherent limitations, the internal control process cannot guarantee that all risks of errors or fraud are fully eliminated or controlled.
Group internal control environment
The Group’s internal control environment is based on key documents such as the Group Principles of Action, principles of organization and
Code of Business Conduct, which have to be strictly applied by Group employees:
• the Principles of Actions present Group commitments towards customers, employees, shareholders and other Group stakeholders, and
define what the “Lafarge Way” is, being its management philosophy;
• the principles of organization define responsibilities at all levels within the organization (business units, Divisions and Group), the various
components of the management cycle as well as the key principles driving performance improvement;
• the Code of Business Conduct defines rules of conduct and is structured as follows: compliance with the law and regulations, prevention of
conflicts of interest, respect for people and the environment, safeguarding of the Group’s assets, financial disclosure, importance of internal
control, implementation of behavioral rules and appropriate sanctions.
Those documents are complemented by rules and policies established by the Group defining priorities for each of the Group’s principal functions.
Among other things, these rules state that implementing a robust internal control process is one of the primary responsibilities of the Executive
Management of each legal or operational entity.
An annual assessment of the internal control environment is organized in the Group main operational units, on the basis of self-assessment
questionnaires.
(1) COSO: Committee of Sponsoring Organization of the Treadway Commission. Septembrer 1992.
Registration Document | 2011 | Lafarge156

INTERNAL CONTROL PROCEDURES
9
9.1 Report of the Chairman of the Board of Directors on internal control procedures and on corporate governance
Risk identification and analysis
The approach implemented by the Group, relating to the identification and analysis of risks, is described in Section 2.2.1. (Risk identification
and analysis) of the Registration Document.
Risk management systems
A presentation of the general framework of risk management and of major risk management systems is included in Section 2.2.2. (Risk
management systems) of the Registration Document.
Control activities
Control activities are implemented at every level in the Group, in conformity with rules and policies described above.
Internal control activities over major processes impacting the reliability of the Group’s financial reporting are defined in the Group “Internal
Control Standards”(1) and are documented and tested as described in Section 9.1.2 below.
Information and communication
The Group’s key documents are available on the Group’s intranet. Function leaders are responsible for disseminating the rules, policies and
procedures applicable Group-wide.
Controls and procedures over key processes affecting the Group’s financial reporting are subject to formal documentation and test procedures
described in Section 9.1.2 below.
Internal control monitoring across the Group
Internal control is monitored at all levels of the Group. The roles of major stakeholders are described below.
BOARD OF DIRECTORS AND BOARD COMMITTEES
The Board of Directors and its specialized committees, and in particular the Audit Committee, ensure the implementation of the Group’s internal
control policy.
See Sections 5.1 (Board of Directors-Corporate O fficers), 5.2 (Board and Committees r ules and p ractices) and 5.4 (Compensations and benefits).
GROUP EXECUTIVE COMMITTEE
The Executive Committee steers the effective implementation of the Group’s internal control policy, through:
• the monitoring and follow-up of internal control procedures performed throughout the Group, and in particular the follow-up of identified
action plans;
• the review of the annual summary of the Group’s internal audit reports.
GROUP FUNCTIONS AND DIVISIONS
With regard to processes affecting the preparation of financial reporting, Group function leaders, including in particular managers of the Group
Finance function, have been designated at Division and Group level as “business process owners”, with the responsability of:
• documenting their processes at Division and Group level and verifying that the “Internal Control Standards” for such processes are effectively
implemented;
• defining and updating the standards of internal control applicable to business units.
BUSINESS UNITS
In application of Group internal control policy, internal control is under the direct responsibility of the Executive Committee of business units.
In each of the Group’s major business units, “Internal Control Coordinators” are appointed. Their role consists mainly in supporting implementation
of the Group’s “Internal Control Standards” and ensuring procedures related to “internal control over financial reporting” in their unit are
implemented. Their activities are coordinated by the Group Internal Control department presented below.
GROUP INTERNAL AUDIT
The Group Internal Audit department (around 40 persons) is responsible for performing an independent assessment of the quality of internal
control at all levels in the organization, following the annual audit plan approved by the Chairman and Chief Executive Officer and Audit Committee.
(1) Group “Internal Control Standards” is the set of key controls covering main risks pertaining to processes participating in the preparation of financial reporting.
157Lafarge | Registration Document | 2011

9INTERNAL CONTROL PROCEDURES9.1 Report of the Chairman of the Board of Directors on internal control procedures and on corporate governance
Reports are issued to business units and to senior managers upon completion of the fieldwork. An annual summary of such reports is presented
to the Chairman and Chief Executive Officer and to the Audit Committee, who also receives comments from Group’s external auditors on internal
control.
Furthermore, follow-up assignments are organized to verify that internal audit recommendations have been put in place.
GROUP INTERNAL CONTROL DEPARTMENT
The Group Internal Control department (12 persons) is part of the Group Finance function. This department is in charge of overseeing internal
control and monitoring all procedures related to “internal control over financial reporting”.
This department oversees the definition of “Internal Control Standards” mentioned above and coordinates the network of Internal Control
Coordinators within its business units. It supports business units and the heads of Group functions in the implementation of such standards
as well as the documentation and tests of controls over financial reporting presented in Section 9.1.2 below.
The Internal Control Committee chaired by the Chief Financial Officer and encompassing the key finance managers at Group level, the Group
audit Director, the Group information systems Director, the Group purchasing Director, and the Group legal counsel oversees the work performed
on “internal control over financial reporting”.
9.1.2 Procedures related to “internal control over financial reporting”
Key processes with an impact on the reliability of Group financial reporting
Processes with a direct impact on the production of financial reporting, for which key controls were defined as part of the analysis presented
above, relate to the following areas: finance (closing process, consolidation process, legal and tax management, treasury management),
purchasing (from the bidding process to recording and payment of invoices), sales (from orders receipt to revenue recognition and collection),
IT (security management, among others), payroll and management of various employee benefits, management of tangible and intangible assets
and management of inventories (physical count, valuation, etc.).
Documentation and testing of “controls over financial reporting”
The Group is committed to maintain high standards of internal control and implements detailed work related to documentation and testing of
“internal control over financial reporting”.
This work is implemented by business units, Divisions and at Group level, on key controls contributing to the reliability of financial reporting
and encompasses:
• a description of key processes affecting the reliability of the Group’s financial reporting, as presented above;
• a detailed description of key controls defined in the “Internal Control Standards” presented above;
• tests of controls to check the operational effectiveness of such controls; the scope of such tests being defined based on the materiality and
risk level of each entity;
• an internal certification process to review the principal action plans in progress and to confirm management responsibility at business units,
Divisions and Group level on the quality of both internal control and financial reporting.
This work is part of the process of continuous improvement in internal control and includes the preparation of specific action plans, identified
through the activities described above, as well as through internal and external audits. The implementation of action plans is followed up by
relevant senior management. The outcome of such procedures are presented to the Audit Committee.
Preparation of published financial reporting
Specific procedures are put in place to ensure the reliability of published financial reporting, as follows:
• a consolidation and financial reporting system is used to prepare Group financial reporting;
• a formal reporting, analysis and control process for other published information included in the Group’s Registration Document (Document
de référence) is implemented.
This process is monitored by the Disclosure Committee, composed of the main heads of Group functions, who verify the content of financial
disclosures and reports before they are submitted to the Audit Committee and to the Board of Directors.
Paris, February 17, 2012
French original signed by
Bruno Lafont
Chairman of the Board of Directors
Registration Document | 2011 | Lafarge158

INTERNAL CONTROL PROCEDURES
9
9.2 Statutory auditors’ Report, prepared in accordance with Article L. 225-235 of the French Commercial Code
9.2 Statutory auditors’ Report, prepared in accordance with Article L. 225-235 of the French Commercial Code (Code de commerce) on the report prepared by the Chairman of the Board of Directors of Lafarge
Year ended December 31, 2011
This is a free translation into English of a report issued in the French language and is provided solely for the convenience of English-speaking
readers. This report should be read in conjunction with, and construed in accordance with, French Law and professional auditing standards
applicable in France.
To the Shareholders,
In our capacity as statutory auditors of Lafarge (“the Company”), and in accordance with article L. 225-235 of the French Commercial Code
(Code de commerce), we report to you on the report prepared by the Chairman of the Board of Directors of your Company in accordance with
article L. 225-37 of the French Commercial Code (Code de commerce) for the year ended December 31, 2011.
It is the Chairman’s responsibility to:
• prepare a report describing the internal control and risk management procedures implemented within the Company and providing the other
information required by article L. 225-37 of the French Commercial Code (Code de commerce) notably relating to the corporate governance
system;
• submit it for approval to the Board of Directors.
It is our responsibility to:
• report to you on the information set out in the Chairman’s report on the internal control and risk management procedures relating to the
preparation and processing of financial and accounting information;
• attest that the report contains the other information required by article L. 225-37 of the French Commercial Code (Code de commerce),
knowing that we are not responsible for verifying the fairness of this other information.
We performed our procedures in accordance with the relevant professional standards applicable in France.
Information concerning the internal control and risk management procedures relating to the preparation and processing of financial and
accounting information
The professional standards require us to perform procedures to assess the fairness of the information set out in the Chairman’s report on the
internal control and risk management procedures relating to the preparation and processing of financial and accounting information. These
procedures notably consisted in:
• obtaining an understanding of the internal control and risk management procedures relating to the preparation and processing of financial
and accounting information, on which the information presented in the Chairman’s report is based, and the existing documentation;
• obtaining an understanding of the work performed to prepare this information, and the existing documentation;
• ensuring that any material weaknesses in internal control procedures relating to the preparation and processing of financial and accounting
information that we would have detected in the course of our engagement have been properly disclosed in the Chairman’s report.
On the basis of these procedures, we have no matters to report in connection with the information given on the internal control and risk
management procedures relating to the preparation and processing of financial and accounting information, contained in the Chairman’s report,
prepared in accordance with article L. 225-37 of the French Commercial Code (Code de commerce).
Other information
We attest that the Chairman’s report contains the other information required by article L. 225-37 of the French Commercial Code
(Code de commerce).
Neuilly-sur-Seine and Paris–La Défense, February 27, 2012
The Statutory Auditors
DELOITTE & ASSOCIÉS ERNST & YOUNG Audit
French original signed by French original signed by
Arnaud de Planta Frédéric Gourd Christian Mouillon Nicolas Macé
159Lafarge | Registration Document | 2011

9INTERNAL CONTROL PROCEDURES
Registration Document | 2011 | Lafarge160

AUDITING MATTERS
10.1 AUDITORS 162Auditors 162
Proposal to renew the Auditors’ appointments -
2012 Shareholders Meeting 162
10.2 AUDITORS’ FEES AND SERVICES 163
10.3 AUDITORS’ REPORTS 164
10
161Lafarge | Registration Document | 2011

10AUDITING MATTERS10.1 Auditors
162
10.1 Auditors
Auditors
S tatutory A uditors
DELOITTE & ASSOCIÉS
185, avenue Charles-de-Gaulle, F 92200 Neuilly-sur-Seine, represented
by Arnaud de Planta and Frédéric Gourd.
Date of first appointment: 1994.
Expiry of current appointment: at the end of the Shareholders’ Meeting
called to approve the financial statements for fiscal year 2011.
The shareholders will be proposed at the next Shareholders Meeting
to take place on May 15, 2012 to renew the appointment of Deloitte &
Associés as S tatutory A uditor for six year, until the end of the
Shareholders’ Meeting called to approve the financial statements for
financial year 2017.
ERNST & YOUNG AUDIT
11, allée de l’Arche, F 92400 Courbevoie, represented by
Christian Mouillon and Nicolas Macé.
Date of first appointment: 2006.
Expiry of current appointment: at the end of the Shareholders’ Meeting
called to approve the financial statements for fiscal year 2011.
The shareholders will be proposed at the next Shareholders Meeting
to take place on May 15, 2012 to appoint Ernst & Young et Autres
as S tatutory A uditor for six years, until the end of the Shareholders’
Meeting called to approve the financial statements for financial year
2017.
This actually corresponds to the renewal of the appointment of the
S tatutory A uditor from the Ernst & Young network, although from a
legal stand point it is necessary to propose the appointment of Ernst &
Young et Autres, in replacement of Ernst & Young Audit. The Ernst &
Young et Autres partners are Mr. Nicolas Macé and Mr. Alain Perroux,
the later replacing Mr. Christian Mouillon.
Alternate A uditors
BEAS
7-9, villa Houssay, F 92200 Neuilly-sur-Seine.
Date of first appointment: 2000.
Expiry of current appointment: at the end of the Shareholders’ Meeting
called to approve the financial statements for fiscal year 2011.
The shareholders will be proposed at the next Shareholders Meeting
to take place on May 15, 2012 to renew the appointment of BEAS
as Alternate Auditor for six years, until the end of the Shareholders’
Meeting called to approve the financial statements for financial year
2017.
AUDITEX
11, allée de l’Arche, F 92400 Courbevoie.
Date of first appointment: 2008.
Expiry of current appointment: at the end of the Shareholders’ Meeting
called to approve the financial statements for fiscal year 2013.
The shareholders will be proposed at the next Shareholders Meeting
to take place on May 15, 2012 to renew the appointment of Auditex
as Alternate Auditor for six years, until the end of the Shareholders’
Meeting called to approve the financial statements for financial year
2017.
Proposal to renew the Auditors’ appointments - 2012 Shareholders Meeting
The S tatutory A uditors appointments, which were renewed after a competitive bidding process in 2006, are due to expire after the Shareholders
Meeting convened on May 15, 2012.
After noting the high quality of the services provided by the auditors and upon recommendation from the Audit Committee, the Board of Directors
resolved during its meeting on February 16, 2012 that it should be proposed at the Shareholders Meeting to renew the appointments of the
current S tatutory and Alternate Auditors.
Registration Document | 2011 | Lafarge162

AUDITING MATTERS
10
10.2 Auditors’ fees and services
10.2 Auditors’ f ees and s ervices
This table sets out the amount of fees billed for each of the last two fiscal years by each of our auditors, Deloitte & Associés and Ernst & Young
Audit, in relation to audit services, audit-related services, tax and other services provided to us.
(million euros)
DELOITTE & ASSOCIES ERNST & YOUNG AUDIT
AMOUNT (EXCL. TAX) % AMOUNT (EXCL. TAX) %
2011 2010 2011 2010 2011 2010 2011 2010
Audit fees
Audit, attestation and review of financial
statements 6.6 7.4 57% 84% 5.9 6.4 84% 88%
Lafarge S.A. 1.5 1.8 13% 20% 1.5 1.5 21% 21%
Subsidiaries 5.1 5.6 44% 64% 4.4 4.9 63% 67%
Audit-related Fees * 4.8 1.3 41% 15% 0.9 0.7 12% 9%
Lafarge S.A. 2.7 0.4 23% 5% 0.6 0.1 8% 1%
Subsidiaries 2.1 0.9 18% 10% 0.3 0.6 4% 8%
SUB-TOTAL 11.4 8.7 98% 99% 6.8 7.1 96% 97%
Other fees
Tax Fees ** 0.3 0.1 2% 1% 0.3 0.2 4% 3%
Legal and Employment Fees - - - - - - - -
Information Technology - - - - - - - -
Others - - - - - - - --
SUB TOTAL OTHER FEES 0.3 0.1 2% 1% 0.3 0.2 4% 3%
TOTAL FEES 11.7 8.8 100% 100% 7.1 7.3 100% 100%
* Audit-related fees are generally fees billed for services that are closely related to the performance of the audit or review of financial statements. These include due diligence services
related to acquisitions, consultations concerning financial accounting and reporting standards, attestation services not required by statute or regulation, information system reviews.
** Tax fees are fees for services related to international and domestic tax compliance, including the review of tax returns and tax services regarding statutory, regulatory or administrative
developments and expatriate tax assistance and compliance.
163Lafarge | Registration Document | 2011

10AUDITING MATTERS10.3 Auditors’ reports
10.3 Auditors’ r eports
The table below indicates where to find in this Registration Document the different reports issued by the auditors.
REPORT PAGE
Report on the consolidated financial statements F 3
Report on the statutory accounts F 73
Special report on related-party agreements and commitments F 94
Report on the report prepared by the Chairman of the Board of Directors on internal control and risk management 159
Report on sustainable development indicators (Ernst & Young only) 140
Registration Document | 2011 | Lafarge164

CERTIFICATION
CERTIFICATION
We hereby certify that, having taken all reasonable care to ensure that this is the case, the information set out in this Document de Référence
is, to the best of our knowledge, true and accurate and that no information has been omitted that would be likely to impair the meaning thereof.
We certify that, to the best of our knowledge, the financial statements have been prepared in accordance with applicable accounting standards
and give a true and fair view of the assets and liabilities, and of the financial position and results of the Company and of its consolidated
subsidiaries, and that the management report of the Annual Financial Report defined on page 265 provides a true and fair view of the evolution
of the business, results and financial condition of the Company and of its consolidated subsidiaries, and a description of the main risks and
uncertainties the Company and its consolidated subsidiaries are subject to.
We have obtained from our statutory auditors, Deloitte & Associés and Ernst & Young Audit, a letter asserting that they have reviewed the
information regarding the financial condition and the financial statements included in this Document de Référence and that they have read
the whole Document de Référence.
Our statutory auditors have established a report on the financial statements presented in this Document de Référence, set out on pages F3
and F73. The statutory auditors’ reports on the 2010 and 2009 consolidated financial statements presented respectively in the Document de
Référence 2010 (D.11-0163) on page F3 and Document de Référence 2009 (D.10-0104) on page F3 contain a technical observation.
Paris, April 6 , 2012
French original signed by French original signed by
Jean-Jacques Gauthier Bruno Lafont
Chief Financial Officer Chairman and Chief Executive Officer
165Lafarge | Document de Référence | 2011

166 Document de Référence | 2011 | Lafarge166

F
FINANCIAL STATEMENT S
Consolidated fi nancial statements F3
STATUTORY AUDITORS’ REPORT ON THE CONSOLIDATED FINANCIAL STATEMENTS F3
CONSOLIDATED STATEMENT OF INCOME F4
CONSOLIDATED STATEMENT OF COMPREHENSIVE INCOME F5
CONSOLIDATED STATEMENT OF FINANCIAL POSITION F6
CONSOLIDATED STATEMENT OF CASH FLOWS F7
CONSOLIDATED STATEMENT OF CHANGES IN EQUITY F9
Notes to the consolidated
fi nancial statements F10Note 1 Business description F10
Note 2 Summary of signifi cant accounting policies F10
Note 3 Signifi cant events F22
Note 4 Business segment and geographic area information F24
Note 5 Net gains (losses) on disposals F27
Note 6 Other operating income (expenses) F28
Note 7 Emission rights F29
Note 8 Finance income (costs) F29
Note 9 Earnings per share F30
Note 10 Goodwill F31
Note 11 Intangible assets F34
Note 12 Property, plant and equipment F35
Note 13 Investments in associates F36
Note 14 Joint ventures F37
Note 15 Other fi nancial assets F38
Note 16 Inventories F39
Note 17 Trade receivables F40
Note 18 Other receivables F41
Note 19 Cash and cash equivalents F41
Note 20 Equity F41
Note 21 Share based payments F43
Note 22 Income tax F47
Note 23 Pension plans, termination benefi ts and other post employment benefi ts F49
Note 24 Provisions F53
Note 25 Debt F54
Note 26 Financial instruments F57
Note 27 Other payables F64
Note 28 Commitments and contingencies F64
Note 29 Legal and arbitration proceedings F65
Note 30 Related parties F67
Note 31 Employee costs and Directors’ and Executive Offi cers’ compensation for services F67
Note 32 Supplemental cash fl ow disclosures F68
Note 33 Auditors’ fees and services F69
Note 34 Events after the reporting period F69
Note 35 List of signifi cant subsidiaries, joint ventures and investments in associates at December 31, 2011 F70
F1Lafarge | Registration Document | 2011
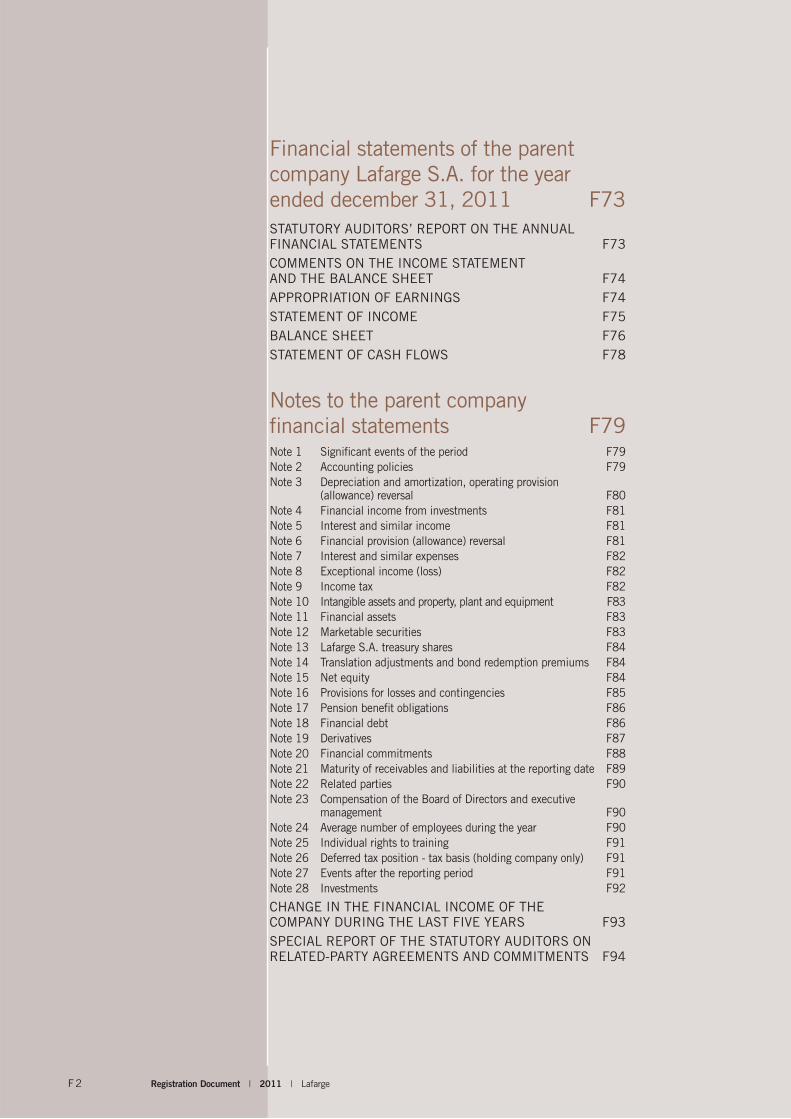
Financial statements of the parent
company Lafarge S.A. for the year
ended december 31, 2011 F73
STATUTORY AUDITORS’ REPORT ON THE ANNUAL FINANCIAL STATEMENTS F73
COMMENTS ON THE INCOME STATEMENT AND THE BALANCE SHEET F74
APPROPRIATION OF EARNINGS F74
STATEMENT OF INCOME F75
BALANCE SHEET F76
STATEMENT OF CASH FLOWS F78
Notes to the parent company
fi nancial statements F79Note 1 Signifi cant events of the period F79
Note 2 Accounting policies F79
Note 3 Depreciation and amortization, operating provision (allowance) reversal F80
Note 4 Financial income from investments F81
Note 5 Interest and similar income F81
Note 6 Financial provision (allowance) reversal F81
Note 7 Interest and similar expenses F82
Note 8 Exceptional income (loss) F82
Note 9 Income tax F82
Note 10 Intangible assets and property, plant and equipment F83
Note 11 Financial assets F83
Note 12 Marketable securities F83
Note 13 Lafarge S.A. treasury shares F84
Note 14 Translation adjustments and bond redemption premiums F84
Note 15 Net equity F84
Note 16 Provisions for losses and contingencies F85
Note 17 Pension benefi t obligations F86
Note 18 Financial debt F86
Note 19 Derivatives F87
Note 20 Financial commitments F88
Note 21 Maturity of receivables and liabilities at the reporting date F89
Note 22 Related parties F90
Note 23 Compensation of the Board of Directors and executive management F90
Note 24 Average number of employees during the year F90
Note 25 Individual rights to training F91
Note 26 Deferred tax position - tax basis (holding company only) F91
Note 27 Events after the reporting period F91
Note 28 Investments F92
CHANGE IN THE FINANCIAL INCOME OF THE COMPANY DURING THE LAST FIVE YEARS F93
SPECIAL REPORT OF THE STATUTORY AUDITORS ON RELATED-PARTY AGREEMENTS AND COMMITMENTS F94
Registration Document | 2011 | LafargeF2

CONSOLIDATED FINANCIAL STATEMENTSStatutory Auditors’ Report on the consolidated financial statements
Statutory Auditors’ Report on the consolidated financial statements
This is a free translation into English of the statutory auditors’ report on the consolidated financial statements issued in the French language
and is provided solely for the convenience of English-speaking users. The statutory auditors’ report includes information specifically required by
French law in such reports, whether modified or not. This information is presented below the opinion on the consolidated financial statements
and includes an explanatory paragraph discussing the auditors’ assessments of certain significant accounting and auditing matters. These
assessments were made for the purpose of issuing an audit opinion on the consolidated financial statements taken as a whole and not to
provide separate assurance on individual account captions or on information taken outside of the consolidated financial statements. This
report also includes information relating to the specific verification of information given in the Group’ s management report. This report should
be read in conjunction with, and construed in accordance with, French law and professional auditing standards applicable in France.
For the year ended December 31, 2011
To the Shareholders,
In compliance with the assignment entrusted to us by your Annual General Meeting, we hereby report to you for the year ended December
31, 2011 on:
• the audit of the accompanying consolidated financial statements of Lafarge;
• the justification of our assessments;
• the specific verification required by law.
These consolidated financial statements have been approved by the Board of Directors. Our role is to express an opinion on these consolidated
financial statements based on our audit.
I. OPINION ON THE CONSOLIDATED FINANCIAL STATEMENTS
We conducted our audit in accordance with professional standards applicable in France; those standards require that we plan and perform
the audit to obtain reasonable assurance about whether the consolidated financial statements are free of material misstatement. An audit
involves performing procedures, using sampling techniques or other methods of selection, to obtain audit evidence about the amounts and
disclosures in the consolidated financial statements. An audit also includes evaluating the appropriateness of accounting policies used and the
reasonableness of accounting estimates made, as well as the overall presentation of the consolidated financial statements. We believe that the
audit evidence we have obtained is sufficient and appropriate to provide a basis for our audit opinion.
In our opinion, the consolidated financial statements give a true and fair view of the assets and liabilities and of the financial position of the Group
as at December 31, 2011 and of the results of its operations for the year then ended in accordance with IFRS as adopted by the European Union.
II. JUSTIFICATION OF OUR ASSESSMENTS
In accordance with the requirements of article L. 823-9 of the French Commercial Code (Code de commerce) relating to the justification of our
assessments, we bring to your attention the following matters:
Goodwill, property plant and equipment, and intangible assets have been tested for impairment in accordance with the Group’ s accounting
policies described in note 2.12 “Impairment of long-lived assets” to the consolidated financial statements. The estimates are established based
on currently available information at the time of the preparation of the consolidated financial statements and are in keeping with the current
economic crisis or political instability affecting some of the Group’s markets, as described in note 2.3 “Use of estimates and judgments” to
the consolidated financial statements. Therefore, as set out in note 10 “Goodwill” to the consolidated financial statements, for countries with
a recent political instability, or European countries hit by the sovereign debt crisis, the operational and actuarial assumptions used in future
discounted cash flows have been determined based on the specific country environment, for these countries, without taken into consideration
any possible breach of the economical or geopolitical environment. In addition, the Group analyzed the sensitivity of the recoverable amount
(particularly with regard to a change in the discount rate and the perpetual growth rate) for the main goodwill items. Our procedures consisted
in reviewing available documents, assessing the reasonableness of retained valuations and the adequacy of the information disclosed in the
notes to the consolidated financial statements.
These assessments were made as part of our audit of the consolidated financial statements taken as a whole, and therefore contributed to the
opinion we formed which is expressed in the first part of this report.
III. SPECIFIC VERIFICATION
As required by law, we have also verified, in accordance with professional standards applicable in France, the information presented in the
Group’s management report.
We have no matters to report as to its fair presentation and its consistency with the consolidated financial statements.
Neuilly-sur-Seine and Paris-La Défense, February 27, 2012
The Statutory Auditors
French original signed by
DELOITTE & ASSOCIES ERNST & YOUNG Audit
Arnaud de Planta Frédéric Gourd Christian Mouillon Nicolas Macé
FF3Lafarge | Registration Document | 2011

FCONSOLIDATED FINANCIAL STATEMENTS Consolidated statement of income
Consolidated statement of income
YEARS ENDED DECEMBER 31,
(million euros, except per share data) NOTES 2011 2010*
REVENUE (4) 15,284 14,834
Cost of sales (11,627) (10,920)
Selling and administrative expenses (1,478) (1,521)
OPERATING INCOME BEFORE CAPITAL GAINS, IMPAIRMENT, RESTRUCTURING AND OTHER (4) 2,179 2,393
Net gains (losses) on disposals (5) 45 45
Other operating income (expenses) (6) (541) (304)
OPERATING INCOME 1,683 2,134
Finance costs (8) (1,142) (1,055)
Finance income (8) 143 343
Share of net income (loss) of associates (13) (8) (23)
INCOME BEFORE INCOME TAX 676 1,399
Income tax (22) (432) (305)
NET INCOME FROM CONTINUING OPERATIONS 244 1,094
Net income / (loss) from discontinued operations (3) 492 20
NET INCOME 736 1,114
Of which, attributable to:
Owners of the parent company 593 827
Non-controlling interests 143 287
EARNINGS PER SHARE (EUROS)
NET INCOME - ATTRIBUTABLE TO THE OWNERS OF THE PARENT COMPANY
Basic earnings per share (9) 2.07 2.89
Diluted earnings per share (9) 2.06 2.89
FROM CONTINUING OPERATIONS
Basic earnings per share (9) 0.36 2.83
Diluted earnings per share (9) 0.35 2.83
BASIC AVERAGE NUMBER OF SHARES OUTSTANDING (IN THOUSANDS) (9) 286,514 286,087
* Figures have been adjusted as mentioned in Note 3.1.1 «Disposal of Gypsum Division operations» following the disposal operations of Gypsum activities and are therefore not
comparable with those presented in the 2010 Registration Document .
The accompanying notes are an integral part of these consolidated financial statements.
Registration Document | 2011 | LafargeF4

F
CONSOLIDATED FINANCIAL STATEMENTSConsolidated statement of comprehensive income
Consolidated statement of comprehensive income
YEARS ENDED DECEMBER 31,
(million euros) 2011 2010
NET INCOME 736 1,114
Items that will not be reclassified subsequently to profit or loss
Actuarial gains / (losses) (345) (64)
Income tax on items that will not be reclassified to profit or loss 145 9
Total items that will not be reclassified to profit or loss (200) (55)
Items that may be reclassified subsequently to profit or loss
Available-for-sale financial assets - (138)
Cash-flow hedging instruments 1 12
Foreign currency translation adjustments (400) 1,175
Income tax on items that may be reclassified to profit or loss 2 (4)
Total items that may be reclassified to profit or loss (397) 1,045
OTHER COMPREHENSIVE INCOME , NET OF INCOME TAX (597) 990
TOTAL COMPREHENSIVE INCOME 139 2,104
Of which, attributable to:
Owners of the parent company (6) 1,712
Non-controlling interests 145 392
The accompanying notes are an integral part of these consolidated financial statements.
F5Lafarge | Registration Document | 2011

FCONSOLIDATED FINANCIAL STATEMENTS Consolidated statement of financial position
Consolidated statement of financial position
AT DECEMBER 31,
(million euros) NOTES 2011 2010
ASSETS
NON-CURRENT ASSETS 31,172 34,752
Goodwill (10) 12,701 14,327
Intangible assets (11) 652 661
Property, plant and equipment (12) 15,542 17,912
Investments in associates (13) 604 422
Other financial assets (15) 755 863
Derivative instruments (26) 80 78
Deferred tax assets (22) 804 489
Other receivables (18) 34 -
CURRENT ASSETS 9,547 7,742
Inventories (16) 1,531 1,647
Trade receivables (17) 1,765 1,774
Other receivables (18) 824 971
Derivative instruments (26) 61 56
Cash and cash equivalents (19) 3,171 3,294
Assets held for sale (3) 2,195 -
TOTAL ASSETS (4) 40,719 42,494
EQUITY & LIABILITIES
Common stock (20) 1,149 1,146
Additional paid-in capital (20) 9,684 9,640
Treasury shares (20) (17) (26)
Retained earnings 6,219 5,816
Other reserves (20) (751) (555)
Foreign currency translation adjustments (20) (280) 123
EQUITY ATTRIBUTABLE TO OWNERS OF THE PARENT COMPANY 16,004 16,144
Non-controlling interests (20) 2,197 2,080
EQUITY 18,201 18,224
NON-CURRENT LIABILITIES 15,260 16,765
Deferred tax liabilities (22) 933 871
Pension & other employee benefits (23) 1,295 1,108
Provisions (24) 637 633
Long-term debt (25) 12,266 14,096
Derivative instruments (26) 46 57
Other payables (27) 83 -
CURRENT LIABILITIES 7,258 7,505
Pension & other employee benefits (23) 167 139
Provisions (24) 125 146
Trade payables 1,964 1,996
Other payables (27) 1,499 1,642
Current tax payables 165 314
Short term debt and current portion of long-term debt (25) 2,940 3,184
Derivative instruments (26) 34 84
Liabilities associated with assets held for sale (3) 364 -
TOTAL EQUITY AND LIABILITIES (4) 40,719 42,494
The accompanying notes are an integral part of these consolidated financial statements.
Registration Document | 2011 | LafargeF6

F
CONSOLIDATED FINANCIAL STATEMENTSConsolidated statement of cash flows
Consolidated statement of cash flows
YEARS ENDED DECEMBER 31,
(million euros) NOTES 2011 2010*
NET CASH PROVIDED BY (USED IN) OPERATING ACTIVITIES
NET INCOME 736 1,114
NET INCOME FROM DISCONTINUED OPERATIONS 492 20
NET INCOME FROM CONTINUING OPERATIONS 244 1,094
Adjustments for income and expenses which are non cash or not related
to operating activities, finance income or costs, or income tax:
Depreciation and amortization of assets (4) 1,038 1,093
Impairment losses (6) 388 154
Share of net (income) loss of associates (13) 8 23
Net (gains) losses on disposals (5) (45) (45)
Finance (income) / costs (8) 999 712
Income tax (22) 432 305
Others, net (including dividends received from equity-accounted investments ) (59) (305)
Change in working capital items, excluding financial expenses and income tax
(see analysis below) 20 361
NET OPERATING CASH GENERATED BY CONTINUING OPERATIONS BEFORE IMPACTS
OF FINANCIAL EXPENSES AND INCOME TAX 3,025 3,392
Cash payments for financial expenses (944) (911)
Cash payments for income tax (484) (383)
NET OPERATING CASH GENERATED BY CONTINUING OPERATIONS 1,597 2,098
NET OPERATING CASH GENERATED BY DISCONTINUED OPERATIONS 22 74
NET CASH GENERATED BY OPERATING ACTIVITIES 1,619 2,172
NET CASH PROVIDED BY (USED IN) INVESTING ACTIVITIES
Capital expenditures (4) (1,071) (1,272)
Investment in subsidiaries and joint ventures (1) (47) (27)
Investment in associates (13) (4) (3)
Acquisitions of available-for-sale financial assets (3) (19)
Disposals (2) (3) / (32) 2,084 208
Net decrease in long-term receivables (68) (73)
NET CASH PROVIDED BY (USED IN) INVESTING ACTIVITIES FROM CONTINUING OPERATIONS 891 (1,186)
NET CASH PROVIDED BY (USED IN) INVESTING ACTIVITIES FROM DISCONTINUED OPERATIONS (48) (58)
NET CASH PROVIDED BY (USED IN) INVESTING ACTIVITIES 843 (1,244)
NET CASH PROVIDED BY (USED IN) FINANCING ACTIVITIES
Capital increase (decrease) - owners of the parent company (20) 18 26
Capital increase (decrease) - non controlling interests (3) - 15
Acquisitions of ownership interests with no gain of control (211) -
Disposals of ownership interests with no loss in control 87 139
Dividends paid (20) (288) (575)
Dividends paid by subsidiaries to non controlling interests (199) (273)
Proceeds from issuance of long-term debt 622 2,224
Repayment of long-term debt (2,442) (1,174)
Increase (decrease) in short-term debt (42) (323)
NET CASH PROVIDED BY (USED IN) FINANCING ACTIVITIES FROM CONTINUING OPERATIONS (2,455) 59
NET CASH PROVIDED BY (USED IN) FINANCING ACTIVITIES FROM DISCONTINUED OPERATIONS (74) (21)
NET CASH PROVIDED BY (USED IN) FINANCING ACTIVITIES (2,529) 38
* Figures have been adjusted as mentioned in Note 3.1.1 «Disposal of Gypsum Division operations» following the disposal operations of Gypsum activities and are therefore not
comparable with those presented in the 2010 Registration Document .
The accompanying notes are an integral part of these consolidated financial statements.
F7Lafarge | Registration Document | 2011

FCONSOLIDATED FINANCIAL STATEMENTS Consolidated statement of cash flows
YEARS ENDED DECEMBER 31,
(million euros) NOTES 2011 2010*
INCREASE/(DECREASE) IN CASH AND CASH EQUIVALENTS 33 971
Increase (decrease) in cash and cash equivalents from discontinued operations (100) (5)
Net effect of foreign currency translation on cash and cash equivalents and other non
monetary impacts (56) 108
Cash and cash equivalents at beginning of year 3,294 2,220
CASH AND CASH EQUIVALENTS AT END OF YEAR (19) 3,171 3,294
(1) Net of cash and cash equivalents of companies acquired 3 35
(2) Net of cash and cash equivalents of companies disposed of 117 23
Analysis of changes in working capital items 20 361
(Increase)/decrease in inventories (16) (89) 109
(Increase)/decrease in trade receivables (193) 71
(Increase)/decrease in other receivables – excluding financial and income taxes receivables (33) 31
Increase/(decrease) in trade payables 302 167
Increase/(decrease) in other payables – excluding financial and income tax payables 33 (17)
* Figures have been adjusted as mentioned in Note 3.1.1 «Disposal of Gypsum Division operations» following the disposal operations of Gypsum activities and are therefore not
comparable with those presented in the 2010 Registration Document .
The accompanying notes are an integral part of these consolidated financial statements.
Registration Document | 2011 | LafargeF8

F
CONSOLIDATED FINANCIAL STATEMENTSConsolidated statement of changes in equity
Consolidated statement of changes in equity
NOTES
OUTSTANDING SHARES
OF WHICH TREASURY
SHARESCOMMON
STOCK
ADDI-TIONAL PAID-IN
CAPITALTREASURY
SHARESRETAINED EARNINGS
OTHER RESERVES
FOREIGN CURRENCY
TRANSLATION ADJUST-MENTS
EQUITY ATTRIBU-
TABLE TO THE OWNERS OF THE PARENT
COMPANY
NON CONTROLLING
INTERESTS EQUITY
(number of shares) (million euros)
BALANCE
AT JANUARY 1, 2010 286,453,316 380,148 1,146 9,620 (27) 5,555 (370 ) (947) 14,977 1,823 16,800
Net income - - - - - 827 - - 827 287 1,114
Other comprehensive
income, net of income
tax - - - - - - (185) 1,070 885 105 990
TOTAL COMPREHENSIVE
INCOME FOR THE YEAR - - - - - 827 (185) 1,070 1,712 392 2,104
Dividends paid (20) - - - - - (575) - - (575) (277) (852)
Issuance of
common stock (21) 463 - - - - - - - - 15 15
Share based payments (21) - - - 20 - - - - 20 - 20
Treasury shares (20) - (16,590) - - 1 (8) - - (7) - (7)
Changes in ownership
with no gain / loss
of control (20) - - - - - 17 - - 17 118 135
Other movements -
Non-controlling interests (20) - - - - - - - - - 9 9
BALANCE
AT DECEMBER 31, 2010 286,453,779 363,558 1,146 9,640 (26) 5,816 (555 ) 123 16 ,144 2,080 18 ,224
BALANCE
AT JANUARY 1, 2011 286,453,779 363,558 1,146 9,640 (26) 5,816 (555 ) 123 16 ,144 2,080 18 ,224
Net income - - - - - 593 - - 593 143 736
Other comprehensive
income, net of
income tax - - - - - - (196) (403) (599) 2 (597)
TOTAL COMPREHENSIVE
INCOME FOR THE YEAR - - - - - 593 (196) (403) (6) 145 139
Dividends paid (20) - - - - - (288) - - (288) (199) (487)
Issuance of
common stock (21) 793,739 - 3 24 - - - - 27 26 53
Share based payments (21) - - - 20 - - - - 20 - 20
Treasury shares (20) - (130,110) - - 9 (9) - - - - -
Changes in ownership
with no gain / loss
of control (20) - - - - - 109 - - 109 145 254
Other movements (20) - - - - - (2) - - (2) - (2)
BALANCE
AT DECEMBER 31, 2011 287,247,518 233,448 1,149 9,684 (17) 6,219 (751 ) (280) 16 ,004 2,197 18 ,201
The accompanying notes are an integral part of these consolidated financial statements.
F9Lafarge | Registration Document | 2011

FCONSOLIDATED FINANCIAL STATEMENTSNote 1 Business description
NOTES TO THE CONSOLIDATED FINANCIAL STATEMENTS
Note 1 Business description
Lafarge S.A. is a French limited liability company (société anonyme)
governed by French law. Our commercial name is “Lafarge”. The
Company was incorporated in 1884 under the name “J et A Pavin de
Lafarge”. Currently, our Articles of Association state that the duration
of our company is until December 31, 2066, and may be amended
to extend our corporate life. Our registered office is located at 61 rue
des Belles Feuilles, 75116 Paris, France. The Company is registered
under the number “542105572 RCS Paris” with the registrar of the
Paris Commercial Court (Tribunal de Commerce de Paris).
The Group organizes its operations into two Divisions: Cement and
Aggregates & Concrete. The Gypsum Division was sold during the
year, which impacts the financial statements as presented in Note 3.1-
“Discontinued operations and Assets held for sale” .
The Group’s shares have been traded on the Paris stock exchange
since 1923 and have been a component of the French CAC-40 market
index since its creation, and have also been included in the SBF 250
index.
As used herein, the terms “Lafarge S.A.” or the “parent company” refer
to Lafarge a société anonyme organized under French law, without
its consolidated subsidiaries. The terms the “Group” or “Lafarge”
refer to Lafarge S.A. together with companies included in the scope
of consolidation.
These financial statements for the year ended December 31, 2011,
were established and authorized for issue by the Board of Directors
on February 16, 2012. They will be submitted for approbation to
the shareholders during the Annual General Meeting to be held on
May 15, 2012.
Note 2 Summary of significant accounting policies
2.1 Basis of preparation
The consolidated financial statements of the Group are prepared in
accordance with I nternational Financial Reporting Standards (“IFRS”)
as endorsed by the European Union as of December 31, 2011 and
available on the site http://ec.europa.eu/internal_market/accounting/
ias/index_fr.htm, which do not differ, for the Group, with the effective
IFRS as published by the International Accounting Standard Board
(“IASB”).
The consolidated financial statements have been prepared under the
historical cost basis , except for the following items, which are measured
at fair value:
• derivative financial instruments;
• financial instruments at fair value through the consolidated statement
of income ;
• available-for-sale financial assets;
• liabilities for cash-settled share based payment arrangements.
The consolidated financial statements are presented in euros rounded
to the nearest million, unless otherwise indicated.
As a first time adopter of IFRS at January 1, 2004, the Group has
followed the specific prescriptions of IFRS 1 which govern the first-time
adoption. The options selected for the purpose of the transition to IFRS
are described in the following notes.
Standards and Interpretations which are effective for the first time for
the financial year beginning on or after January 1, 2011 had no impact
on the Group consolidated financial statements:
• Amendments to IAS 32 – Financial instruments: presentation –
Classification of rights issues;
• Revised IFRS 1 – Limited exemption from comparative IFRS 7
disclosures for first-time adopters;
• Revised IAS 24 – Related parties disclosures;
• Improvements to IFRS, issued by the IASB in May 2010;
• Revised IFRIC 14 – Prepayments of a minimum funding requirement;
• IFRIC 19 – Extinguishing financial liabilities with equity instruments.
Standards and Interpretations to existing standards that are not yet
effective have not been early adopted by the Group (see Note 2.27).
2.2 Principles of consolidation
Subsidiaries
Investments in companies over which the Group exercises control
are fully consolidated. Control exists when the Group has the power
directly or indirectly, to govern the financial and operating policies of
a company so as to obtain benefits from its activities. In assessing
control, potential voting rights that are currently exercisable are taken
into account. The financial statements of subsidiaries are included
in the consolidated financial statements from the date that control
commences until the date that control ceases. Total comprehensive
income attributable to non-controlling interests is presented on the line
“Non-controlling interests” in the statement of financial position , even
if it can create negative non-controlling interests.
Special Purpose Entities (SPE) are consolidated if, based on an
evaluation of the substance of its relationship with the Group and the
SPE’s risks and rewards, the Group concludes that it controls the SPE.
Registration Document | 2011 | LafargeF10

F
CONSOLIDATED FINANCIAL STATEMENTSNote 2 Summary of significant accounting policies
Joint ventures
Investments in companies in which the Group and third party
investors have agreed to exercise joint control are consolidated by
the proportionate consolidation method with the Group’s share of the
joint ventures’ results of operations, assets and liabilities recorded in
the consolidated financial statements. Such entities are referred to as
“joint ventures” throughout these consolidated financial statements.
Associates
Investments in companies over which the Group exercises significant
influence on the financial and operating policies, but not control, are
accounted for under the equity method. Such investees are referred
to as “associates” throughout these consolidated financial statements.
Significant influence is presumed to exist when the Group holds at least
20% of the voting power of associates. Investments in associates are
initially recognized at cost except if the Group previously controlled the
investee. The consolidated financial statements include the Group’s
share of the net income or loss recorded by the associates, after
adjustments to align the accounting policies with those of the Group,
from the date significant influence commences until the date that
significant influence ceases. When the Group’s share of losses exceeds
its interest in an equity accounted investee, the carrying amount of that
interest (including any long term investments) is reduced to nil and
the recognition of further losses is discontinued except to the extent
that the Group has an obligation or has made payments on behalf of
the investee.
Intra-Group transactions eliminated on consolidation
All intra-Group receivables, payables, income and expenses have
been eliminated in consolidation for fully consolidated companies.
With respect to proportionately consolidated companies, intercompany
transactions are eliminated on the basis of the Group’s interest in the
entity involved.
G ains arising from transactions with equity accounted investees are
eliminated against the investment to the extent of the Group’s interest
in the investee. Losses are eliminated in the same way as gains , but
only to the extent that there is no evidence of impairment.
2.3 Use of estimates and judgments
a) Accounting estimates
The preparation of consolidated financial statements requires Group’s
management to make estimates and to use assumptions that affect the
reported amounts of assets and liabilities and of income and expenses.
The management of the Group revises its estimates and assumptions
on a regular basis to ensure that they are relevant regarding the past
experience and the current economic and political environment. Such
estimates are prepared on the assumption of going concern, are
established based on currently available information and are in keeping
with the current economic crisis or political instability affecting some of
the Group’s markets. These forecasts do not reflect any possible breach
of the economical or geopolitical environment and may be revised if the
circumstances on which they were based change or if new information
becomes available . Actual amounts could differ from the estimates.
The measurement of some assets and liabilities in the preparation of
these financial statements include assumptions made by management
particularly on the following items:
• impairment tests (see Note 2.12 and Note 10 d)): the determination
of recoverable amounts of the CGUs/groups of CGUs assessed in the
impairment test requires an estimate of their fair value less costs to
sell or of their value in use. The assessment of the recoverable value
requires assumptions to be made with respect to the operating cash
flows of the CGUs/groups of CGUs as well as the discount rates;
• deferred tax (see Note 2.23 and Note 22): the recognition of deferred
tax assets requires assessment of future taxable profit;
• provisions for employee benefits (see Note 2.20 and Note 23): the
actuarial techniques used to assess the value of the defined benefit
plans involve financial assumptions (discount rate, rate of return on
assets, medical costs trend rate) and demographic assumptions
(salary increase rate, employee turnover rate, etc. ). The Group uses
the assistance of an external independent actuary in the assessment
of these assumptions;
• provisions for environmental risks and site restoration (see Note 2.21
and Note 24): provisions for environmental risks and site restoration
require to set assumptions in terms of phasing and discount rate;
• provisions for litigation (see Note 24 and Note 29): the litigation and
claims to which the Group is exposed are assessed by the Legal
department. In certain situations, the Legal department may use
the assistance of external specialized lawyers.
b) Judgments
The accounting for certain provisions, certain financial instruments
and the disclosure of financial assets, contingent assets and liabilities
at the date of the consolidated financial statements is judgmental. The
items subject to judgment are detailed in the corresponding notes to
the consolidated financial statements.
2.4 Translation of financial statements denominated in foreign currencies
1) Foreign currency transactions
Transactions in foreign currencies are initially recorded in the functional
currency by applying the exchange rate between the functional
currency and the foreign currency at the date of the transaction.
At each reporting date , monetary assets and liabilities denominated
in foreign currencies recorded at historical cost are retranslated at the
functional currency exchange closing rate whereas monetary assets
and liabilities measured at fair value are translated using the exchange
rates at the dates at which the fair value was determined. Non monetary
assets and liabilities that are measured in terms of historical cost in a
foreign currency are translated using the exchange rates at the dates
of the initial transaction.
All differences are taken to profit and loss with the exception of
differences on foreign currency borrowings that provide a hedge against
a net investment in a foreign entity. These are taken directly to other
comprehensive income, until the disposal of the net investment.
F11Lafarge | Registration Document | 2011

FCONSOLIDATED FINANCIAL STATEMENTSNote 2 Summary of significant accounting policies
2) Foreign operations
As at the reporting date, the assets and liabilities, including goodwill
and any fair value adjustment arising on the acquisition of a foreign
operation whose functional currency is not the euro, are translated by
using the closing rate.
Income and expenses of a foreign entity whose functional currency
is not the currency of a hyperinflationary economy, are translated by
using the average exchange rate for the period except if exchange
rates fluctuate significantly.
The exchange differences arising on the translation are taken directly
to a separate component of other comprehensive income “Foreign
currency translation adjustments” . On the partial or total disposal of a
foreign entity with a loss of control, the related share in the cumulative
translation differences recognized in equity is recognized in the
consolidated statement of income .
The Group, as permitted by IFRS 1, elected to “reset to zero” previous
cumulative translation differences arising from the translation into euros
of foreign subsidiaries’ financial statements denominated in foreign
currencies. Translation adjustments which predate the transition to
IFRS will therefore not be included when calculating gains or losses
arising from the future disposal.
For companies that operate in countries which have been designated
as hyperinflationary, amounts in the consolidated statement of financial
position not yet expressed in terms of the measuring unit current at the
reporting date are restated by applying a general price index. Income
and expenses in local currency are also restated on a monthly basis.
Differences between original values and reassessed values are included
in income. In defining hyperinflation, the Group employs criteria which
include characteristics of the economic environment, such as inflation
and foreign currency exchange rate fluctuations.
Registration Document | 2011 | LafargeF12

F
CONSOLIDATED FINANCIAL STATEMENTSNote 2 Summary of significant accounting policies
The schedule below presents foreign exchange rates for the main currencies used within the Group:
2.5 Business combinations, acquisition of additional interests and disposal of interests
1) Business combinations
Business combinations are accounted for in accordance with the
acquisition method. The acquiree’s identifiable assets, liabilities and
contingent liabilities that meet the conditions for recognition under
IFRS are recognized at their fair value at the acquisition date, except
for non-current assets that are classified as held for sale in accordance
with IFRS 5, which are recognized and measured at fair value less
costs to sell.
When goodwill is determined provisionally by the end of the reporting
period in which the combination is effected, the Group recognizes any
adjustments to those provisional values within twelve months of the
acquisition date to reflect new information obtained about facts and
circumstances that existed as of the acquisition date. Comparative
information which was presented for the periods before the final
accounting of fair values is corrected as if the initial accounting had
been completed from the acquisition date, if the adjustments to
provisional values would have materially affected the presentation of
the consolidated financial statements.
At the acquisition date, the goodwill is measured as the difference
between:
• the fair value of the consideration transferred to take control over
the entity, including contingent consideration, plus the amount of
any non-controlling interests in the acquiree, and in a business
combination achieved in stages, the acquisition-date fair value
of the previously held equity interest in the acquiree, accordingly
re-valuated through the consolidated statement of income; and
• the fair value of the identifiable assets acquired and the liabilities
assumed on the acquisition date.
Any contingent consideration payable in a business combination
is accordingly measured at fair value at the acquisition date. After
acquisition date, the contingent consideration is re-valued at fair value
at each reporting date. Subsequent changes to the fair value of the
contingent consideration beyond one year from the acquisition date will
be recognized in the consolidated statement of income if the contingent
consideration is a financial liability.
A negative goodwill is recognized immediately in the consolidated
statement of income .
Acquisition costs (excluding costs to issue debt and equity securities)
are expensed as incurred and are presented in the consolidated
statement of income on the line “Other operating income (expenses)”.
When a business combination is entered into with an interest ownership
below 100%, IFRS 3 revised standard allows, on a transaction-by-
transaction basis, to account for goodwill either on a 100% basis or on
the acquired interest ownership percentage (without any subsequent
change in case of additional purchase of non-controlling interests). The
non-controlling interests are accordingly measured either at fair value
or at the non-controlling interests’ proportionate share in the acquiree’s
net identifiable assets.
RATES 2011 2010
(euros) AVERAGE RATE YEAR-END RATE AVERAGE RATE YEAR-END RATE
U.S. dollar (USD) 1.3918 1.2939 1.3267 1.3362
Canadian dollar (CAD) 1.3757 1.3215 1.3664 1.3322
British pound (GBP) 0.8678 0.8353 0.8582 0.8608
Brazilian real (BRL) 2.3258 2.4159 2.3345 2.2177
Chinese yuan (CNY) 8.9964 8.1588 8.9800 8.8220
Algerian dinar (DZD) 102.1940 106.5739 99.2034 103.4710
Egyptian pound (EGP) 8.2922 7.7802 7.4325 7.7111
Hungarian forint (HUF) 279.2934 314.5800 275.3593 277.9500
Indian rupee (INR) 64.8693 68.7130 60.6313 59.7580
Iraqi dinar (IQD) 1,667.3972 1,578.5580 1,565.1274 1,596.7590
Jordanian dinar (JOD) 0.9925 0.9190 0.9464 0.9423
Kenyan shilling (KES) 123.7636 110.2467 105.2271 107.7472
Korean won (KRW ) 1,541.0569 1,498.6900 1,532.4235 1,499.0600
Moroccan dirham (MAD) 11.2828 11.1390 11.1856 11.2040
Malaysian ringgit (MYR) 4.2554 4.1055 4.2729 4.0950
Nigerian naira (NGN) 212.1543 204.7400 197.7571 195.3000
Philippine peso (PHP) 60.2602 56.7540 59.7977 58.3000
Polish zloty (PLN) 4.1187 4.4580 3.9950 3.9750
Romanian leu (RON) 4.2386 4.3233 4.2106 4.2620
Russian rouble (RUB) 40.8797 41.7650 40.2765 40.8200
South african rand (ZAR) 10.0931 10.4830 9.7132 8.8625
F13Lafarge | Registration Document | 2011

FCONSOLIDATED FINANCIAL STATEMENTSNote 2 Summary of significant accounting policies
SPECIFIC TREATMENT RELATED TO FIRST-TIME ADOPTION OF IFRS (BUSINESS COMBINATIONS BEFORE JANUARY 1, 2004)
As permitted by IFRS 1, the Group has not restated goodwill related
to the business combinations which predate the transition date
(January 1, 2004).
In addition, under French GAAP, before January 1, 2004,
non-amortizable intangible assets acquired in a business combination,
such as market share, have been recognized through the purchase
price allocation. These assets are not considered as a separately
identifiable intangible asset under IAS 38, “Intangible Assets” (such
as market share), but as a component of goodwill. They have been
reclassified to goodwill as at January 1, 2004.
2) Acquisition of additional interests after control is obtained
Since there is no change on the control exercised over this entity, the
difference between the acquisition cost and the carrying amount of
the non-controlling interests acquired is recognized directly in equity
and attributed to the owners of the parent company with no change
in the consolidated carrying amount of the subsidiary’s net assets
and liabilities including goodwill. The cash consideration paid, net of
acquisition costs, is reflected as cash flows from financing activities in
the consolidated statements of cash flows.
3) Disposal of interests after control is obtained
DISPOSAL OF INTERESTS WITHOUT LOSS OF CONTROL
Since there is no change on the control exercised over this entity, the
difference between the fair value of the consideration received and
the carrying amount of the interests disposed of at transaction date
is recognized directly in equity and attributed to the owners of the
parent company with no change in the consolidated carrying amount
of the subsidiary’s net assets and liabilities including goodwill. The cash
consideration received, net of sale costs, is reflected as cash flows
from financing activities in the consolidated statements of cash flows.
DISPOSAL OF INTERESTS WITH LOSS OF CONTROL
The loss of control triggers the recognition of a gain (loss) on disposal
determined on both shares sold and retained at transaction date. Any
investment retained is accordingly measured at its fair value through
profit or loss upon the date the control is lost. Disposals of interests
which result in a loss of control are reflected, for the cash part of
the consideration received net of disposal costs and cash and cash
equivalents disposed of, as investing cash flows on the line “Disposals”
of the consolidated statements of cash flows.
2.6 Revenue recognition
Consolidated revenues represent the value, before sales tax, of goods,
products and services sold by consolidated companies as part of their
ordinary activities, after elimination of intra-Group sales.
Revenues from the sale of goods and products are recorded when the
Group has transferred the significant risks and rewards of ownership of
the goods to the buyer (generally at the date ownership is transferred)
and recovery of the consideration is probable.
Revenue is measured at the fair value of the consideration received or
receivable net of return, taking into account the amount of any trade
discounts and volume rebates allowed by the entity.
Amounts billed to a customer in a sales transaction related to shipping
and handling are included in “Revenue”, and costs incurred for
shipping and handling are classified as “Cost of sales”.
2.7 Operating income before capital gains, impairment, restructuring and other
The Group has included the subtotal “Operating income before
capital gains, impairment, restructuring and other” on the face of
the consolidated statement of income . This measure excludes those
elements of our operating results that are by nature unpredictable
in their amount and/or in their frequency, such as capital gains,
asset impairment and restructuring costs. While these amounts have
been incurred in recent years and may recur in the future, historical
amounts may not be indicative of the nature or amount of these items ,
if any, in the future. The Group believes that the subtotal “Operating
income before capital gains, impairment, restructuring and other”
is useful to users of the Group’s financial statements as it provides
them with a measure of our operating results which excludes these
elements, enhancing the predictive value of our financial statements
and provides information regarding the results of the Group’s ongoing
trading activities that allows investors to better identify trends in the
Group’s financial performance.
In addition, operating income before capital gains, impairment,
restructuring and other is a major component of the Group’s key
profitability measure, return on capital employed (which is calculated
by dividing the sum of operating income before capital gains,
impairment, restructuring and other, and share of net income (loss)
of associates by the average of capital employed). This measure is
used by the Group internally to: a) manage and assess the results of
its operations and those of its business segments, b) make decisions
with respect to investments and allocation of resources, and c) assess
the performance of management personnel. However, because this
measure has limitations as outlined below, the Group limits its use to
these purposes.
The Group’s subtotal within operating income may not be comparable
to similarly titled measures used by other entities. Further, this
measure should not be considered as an alternative for operating
income as the effects of capital gains, impairment, restructuring and
other amounts excluded from this measure do ultimately affect our
operating results and cash flows. Accordingly, the Group also presents
“Operating income” within the consolidated statement of income which
encompasses all amounts which affect the Group’s operating results
and cash flows.
2.8 Finance costs and income
Finance costs and income comprise:
• interest expense and income relating to debenture loans, the liability
component of compound instruments, other borrowings including
finance lease liabilities , and cash and cash equivalents;
• other expenses paid to financial institutions for financing operations;
• dividends received from non-consolidated investments;
• impact of discounting provisions (except employee benefits) and
long-term receivables;
• foreign currency exchange gains and losses;
Registration Document | 2011 | LafargeF14

F
CONSOLIDATED FINANCIAL STATEMENTSNote 2 Summary of significant accounting policies
• gains on the disposal of available-for-sale financial assets;
• impairment losses recognized on available-for-sale financial assets;
• gains and losses associated with certain derivative instruments
(except for the effective portion of derivative instruments qualified
as cash flow hedge or net investment hedge);
• change in value of derivative instruments held for trading.
2.9 Earnings per share
Basic earnings per share are computed by dividing net income
available to shareholders of the parent company by the weighted
average number of common shares outstanding during the year.
Diluted earnings per share are computed by dividing adjusted net
income available to shareholders of the parent company by the
weighted average number of common shares outstanding during the
year adjusted to include any dilutive potential common shares.
Potential dilutive common shares result from stock options and
convertible bonds issued by the Group on its own common shares.
2.10 Intangible assets
In accordance with criteria set in IAS 38 – Intangible assets, intangible
assets are recognized only if:
• identifiable;
• controlled by the entity because of past events;
• it is probable that the expected future economic benefits that are
attributable to the asset will flow to the Group and the cost of the
asset can be measured reliably.
Intangible assets primarily include amortizable items such as software,
mineral rights, and real estate development rights as well as certain
development costs that meet the IAS 38 criteria.
Intangible assets are amortized using the straight-line method over
their useful lives ranging from three to seven years, except for mineral
rights, which are amortized based upon tonnes extracted, and real
estate development rights, which are amortized over the estimated life
of the development program.
Amortization expense is recorded in “Cost of sales” and “Selling and
administrative expenses”, based on the function of the underlying
assets.
Research & Development costs
According to IAS 38, development expenditure is capitalized only if
the entity can demonstrate:
• the technical feasibility of completing the intangible asset so that it
will be available for use or sale;
• its intention to complete the intangible asset and use or sell it;
• its ability to use or sell the intangible asset;
• how the intangible asset will generate probable future economic
benefits;
• the availability of adequate technical, financial and other resources
to complete the development;
• its capacity to measure reliably the expenditure attributable to the
intangible assets during their development.
The Group is committed to improving its manufacturing process,
maintaining product quality and meeting existing and future customer
needs. These objectives are pursued through various Research and
Development programs. Within their framework, expenditure on
research activities, undertaken with the prospect of gaining new
scientific or technical knowledge and understanding, are recognized
as expenses when incurred. Development expenditures (which have
direct applications on the product offer) are capitalized only if the
above-mentioned criteria are met and are amortized on a straight-line
basis over five years. The expenditure capitalized includes the costs
that are directly attributable to preparing the asset for its intended use.
Other development costs are recognized as expenses as incurred.
Intangible assets considered to have finite useful life are carried at their
costs less accumulated amortization and accumulated impairment
losses.
2.11 Property, plant and equipment
Property, plant and equipment are measured at cost less accumulated
depreciation and accumulated impairment losses.
In accordance with IFRIC 4 – Determining whether an arrangement
contains a lease, arrangements including transactions that convey
a right to use the asset, or where fulfillment of the arrangement is
dependent on the use of a specific asset, are analyzed in order to
assess whether such arrangements contain a lease and whether the
prescriptions of IAS 17 – Lease Contracts have to be applied.
In accordance with IAS 17, the Group capitalizes assets financed
through finance leases where the lease arrangement transfers to the
Group substantially all of the rewards and risks of ownership. Lease
arrangements are evaluated based upon the following criteria:
• the lease term in relation to the assets’ useful lives;
• the total future payments in relation to the fair value of the financed
assets;
• existence of transfer of ownership;
• existence of a favorable purchase option; and
• specificity of the leased asset.
Upon initial recognition the leased asset is measured at an amount
equal to the lower of its fair value and the present value of the
minimum lease payments. Subsequent to initial recognition, the asset
is accounted for in accordance with the accounting policy applicable
to that asset.
Other leases are operating leases and they are not recognized on the
Group’s statement of financial position.
F15Lafarge | Registration Document | 2011

FCONSOLIDATED FINANCIAL STATEMENTSNote 2 Summary of significant accounting policies
Interest on borrowings related to the financing of significant construction
projects, which is incurred during development activities, is capitalized
in project costs. The interest rate used to determine the amount of
capitalized interest cost is the actual interest rate when there is a
specific borrowing or the Group’s debt average interest rate.
Investment subsidies are deducted from the cost of the property, plant
and equipment.
The residual values are reviewed, and adjusted if appropriate, at each
reporting date .
Depreciation on property, plant and equipment is calculated as follows:
• mineral reserves are depleted by reference to the ratio of tons
extracted during the year to the estimated total extraction capacity
of the reserve over its useful life;
• land is not depreciated;
• buildings are depreciated using the straight-line method over
estimated useful lives varying from 20 years to 50 years for office
properties;
• plant, machinery, equipment and installation costs are depreciated
using the straight-line method over their estimated useful lives,
ranging from 8 to 30 years.
The historical cost of assets is classified into specific cost categories
based upon their distinct characteristics. Each cost category represents
a component with a specific useful live. Useful lives are reviewed on a
regular basis and changes in estimates, when relevant, are accounted
for on a prospective basis.
The cost of replacing part of an item of property, plant and equipment
is recognized in the carrying amount of the item if it is probable that
the future economic benefits embodied within the part will flow to
the Group and its cost can be measured reliably. The costs of the
day-to-day servicing of property, plant and equipment are recognized
in the consolidated statement of income as incurred.
Depreciation expense is recorded in “Cost of sales” and “Selling and
administrative expenses”, based on the function of the underlying
assets.
2.12 Impairment of non-current assets
1) Goodwill
In accordance with IAS 36 – Impairment of Assets, goodwill is tested
for impairment, whose purpose is to take into consideration events or
changes that could have affected the recoverable amount of these
assets, at least annually and quarterly when there are some indications
that an impairment loss may have been identified. In case there are
some indications that an impairment loss may have occurred during
interim periods, a specific analysis is then performed. The annual
impairment test is performed during the last quarter of the year, in
relation with the budget process. The recoverable amount is defined
as the higher of the fair value less costs to sell and the value in use.
For the purposes of the goodwill impairment test, the Group’s net assets
are allocated to Cash Generating Units (“CGUs”) or groups of CGUs. A
CGU is the smallest identifiable group of assets generating cash inflows
independently and represents the level used by the Group to organize
and present its activities and results in its internal reporting. CGUs
generally represent one of our two Divisions in a particular country.
When it is not possible to allocate goodwill on a non-arbitrary basis to
individual CGUs, goodwill can be allocated to a group of CGUs at a
level not higher than the operating segment (denominated business
segment), as defined in Note 4.
Impairment tests are carried out in two steps:
• first step: the Group compares the recoverable amount of CGUS
or groups of CGUs with an EBITDA multiple (the industry-specific
multiple used is determined every year on the basis of a sample
of companies in our industry). EBITDA is defined as the operating
income before capital gains, impairment, restructuring and other,
before depreciation and amortization on intangible assets and
property, plant and equipment;
• second step: for CGUs or groups of CGUs presenting an impairment
risk according to this first step approach, the Group determines the
recoverable amount of the CGU or group of CGUs as its fair value
less costs to sell or its value in use.
Fair value is the best estimate of the amount obtainable from the sale
in an arm’s length transaction between knowledgeable, willing parties.
This estimate is based either on market information available, such as
market multiple, on discounted expected market cash flows, or any
other relevant valuation method.
Value in use is estimated based on discounted cash flows expected
over a 10-year period. This period reflects the characteristics of our
activities where operating assets have a high lifespan and where
technologies evolve very slowly.
If the recoverable amount of the CGU or group of CGUs is less than
its net carrying amount , the Group records an impairment loss, first
to reduce the carrying amount of any goodwill allocated to the CGU
or group of CGUs, then to to reduce the carrying amount of the other
assets of the CGU or group of CGUs. The impairment loss is recorded
in “Other operating expenses” (see Note 6).
According to IAS 36, impairment losses recognized for goodwill are
never reversed.
2) Property, plant & equipment and amortizable intangible assets
Whenever events or changes in circumstances indicate that the
carrying amount of intangible assets and property, plant and equipment
may not be recoverable, an impairment test is performed. The purpose
of this test is to compare the net carrying amount of the asset with its
recoverable value. Recoverable amount is determined for an individual
asset, unless the asset does not generate cash inflows that are largely
independent of those from other assets or groups of assets. In that
case, recoverable amount is determined for the cash-generating unit
to which the asset belongs.
An asset’s recoverable amount is the higher of an asset’s fair value
less costs to sell and its value in use which is the present value of the
future cash flows expected to be derived from the use of the asset or
its disposal. Where the net carrying amount of an asset exceeds its
Registration Document | 2011 | LafargeF16

F
CONSOLIDATED FINANCIAL STATEMENTSNote 2 Summary of significant accounting policies
recoverable amount, an impairment loss is recognized in the caption
“Other operating income (expenses) ”.
When an impairment loss is recognized for a cash-generating unit,
the loss is allocated first to reduce the carrying amount of the goodwill
allocated to the cash-generating unit; and, then, to the other assets
of the unit pro rata on the basis of the carrying amount of each asset
in the unit.
After the impairment loss, the newly assessed asset is depreciated
over its remaining life.
Assets other than goodwill that suffered impairment are reviewed for
possible reversal of the impairment at each reporting date . The increase
in the carrying value of the assets, revised due to the increase of the
recoverable value, cannot exceed the carrying amount that would have
been determined had no impairment loss been recognized for the
asset in prior periods. Such reversal is immediately recognized in the
consolidated statement of income.
2.13 Other financial assets
Other financial assets mainly consist of shares held in non-consolidated
companies, long-term loans and receivables, and cash balances that
are restricted from use.
The Group classifies financial assets in four categories: trading (assets
that are bought and held principally for the purpose of selling them
in the near term), held-to-maturity (assets with fixed or determinable
payments and fixed maturity that the Group has a positive intent
and ability to hold to maturity), long-term loans and receivables
(non-derivative assets with fixed or determinable payments that are not
quoted in an active market) and available-for-sale (all other assets). The
classification depends on the purpose for which the financial assets
were acquired. The classification is determined at initial recognition.
All financial assets are reviewed for impairment on an annual basis to
assess if there is any indication that the asset may be impaired.
Purchases and sales of all financial assets are accounted for at trade
date.
Financial assets held for trading
Trading investments are measured at fair value with gains and losses
recorded as finance income or costs . Assets in this category are
classified as current assets.
Financial assets held-to-maturity
Financial assets that are designated as held-to-maturity are initially
measured at fair value and then at amortized cost, in accordance with
the effective interest rate method.
Long-term loans and receivables
Long-term loans and receivables are initially measured at fair value and
then accounted for at amortized cost are measured in accordance with
the effective interest rate method.
Available-for-sale financial assets
Equity interests in non- consolidated companies are classified as
available-for-sale financial assets and are initially recognized and
subsequently measured at fair value.
For equity securities listed on an active market, fair value is quoted
price.
In absence of active market, fair value is generally determined according
to the most appropriate financial criteria in each case (comparable
transactions, multiples for comparable companies, discounted present
value of future cash flows, estimated selling price). If such fair value
cannot be reliably measured, equity securities are accounted for at
cost.
Gains and losses arising from changes in their fair value are recognized
directly in other comprehensive income (“ Available-for-sale financial
assets” ). When the security is disposed of, the cumulative gain or
loss previously recognized in equity is included in the consolidated
statement of income for the year (“ Finance income” and/or “ Finance
costs” ).
The Group assesses at the end of each reporting period whether
there is any objective evidence that the available-for-sale financial
assets are impaired which would lead, if this were to be the case, to
recognize in the consolidated statement of income the cumulative loss
previously recognized in equity. In accordance with IAS 39 – Financial
Instruments: Recognition and Measurement, such impairment cannot
subsequently be reversed.
Factors considered by the Group to assess the objective evidence of
impairment of its investments and accordingly enabling the Group to
determine if the cost of its equity securities can be or not recovered,
are notably:
• the occurrence of significant financial difficulties;
• the analysis of the national/local economic conditions in relation
with its assets;
• the analysis of significant adverse changes in the technological,
economic or legal environment;
• the existence of a significant or prolonged decline in fair value of the
investment below its acquisition cost.
2.14 Derecognition of financial assets
Under IAS 39 – Financial Instruments: Recognition and Measurement,
financial assets can only be derecognized when no further cash flow
is expected to flow to the Group from the asset and if substantially all
risks and rewards attached to the assets have been transferred.
For trade receivables, programs for selling receivables with recourse
against the seller in case of recovery failure (either in the form of a
subordinated retained interest or a direct recourse) do not qualify for
derecognition.
2.15 Inventories
Inventories are stated at the lower of cost and net realizable value.
Cost is determined using the weighted-average method and includes
F17Lafarge | Registration Document | 2011

FCONSOLIDATED FINANCIAL STATEMENTSNote 2 Summary of significant accounting policies
expenditure incurred in acquiring the inventories. In the case of
manufactured inventories and work in progress, cost includes an
appropriate share of production overhead based on normal operating
capacity.
Net realizable value is the estimated selling price in the ordinary
course of business, less the estimated costs of completion and selling
expenses.
2.16 Trade receivables
Trade receivables are initially measured at fair value, and subsequently
carried at amortized cost using the effective interest method less
provisions for impairment.
Trade receivables are considered impaired when there is objective
evidence that the Group will not be able to collect all amounts due
according to the original terms of the receivables.
The amount of the impairment loss is the difference between the asset’s
carrying amount and the present value of estimated future cash flows ,
discounted at the original effective interest rate. Impairment loss is
recognized in the consolidated statement of income .
2.17 Cash and cash equivalents
Cash and cash equivalents consist of current account bank balances ,
cash, highly liquid investments and cash equivalents which are not
subject to significant changes in value and with an original maturity
date of generally less than three months from the time of purchase.
Investments, classified as cash equivalents, with a maturity date greater
than three months have:
• exit options exercisable with no penalty at any time or maximum
every 3 months, planned at the initiation of the contract;
• no risk related to the minimum acquired.
Cash balances with use restrictions other than legal restrictions in
force in some countries (exchange controls, etc. ) are excluded from
cash and cash equivalents presented in the consolidated statement of
financial position and in the consolidated statement of cash flows and
are classified in non-current assets on the line “Other financial assets”.
2.18 Equity
1) Ordinary shares
Incremental costs directly attributable to the issue of ordinary shares
and share options are recognized as a deduction from equity, net of
any tax effects.
2) Treasury shares
Treasury shares (own equity instruments held by Lafarge S.A. or
subsidiaries) are accounted for as a reduction of shareholders’ equity
at acquisition cost and no further recognition is made for changes in
fair value. When shares are sold out of treasury shares, the resulting
gain or loss is recognized in equity, net of tax.
2.19 Financial liabilities and derivative instruments
1) Recognition and measurement of financial liabilities
Financial liabilities and long-term loans are measured at amortized cost
calculated based on the effective interest rate method.
Accrued interests on loans are presented within “Other payables” in
the consolidated statement of financial position.
Financial liabilities hedged by an interest rate swap that qualifies for
fair value hedge accounting are measured in the statement of financial
position at fair value for the part attributable to the hedged risk (risk
related to changes in interest rates). The changes in fair value are
recognized in the consolidated statement of income for the period of
change and are offset by the portion of the loss or gain recognized on
the hedging item that relates to the effective portion.
2) Compound instruments
Under IAS 32– Financial Instruments: Presentation, if a financial
instrument contains components with characteristics of both liability
and equity items, we classify the component parts separately
according to the definitions of the various items. This includes financial
instruments that create a debt and grant an option to the holder to
convert the debt into equity instruments (e.g. bonds convertible into
common shares).
The component classified as a financial liability is valued at issuance
at the present value (taking into account the credit risk at issuance
date) of the future cash flows (including interest and repayment of
the nominal value) of a bond with the same characteristics (maturity,
cash flows) but without any option to be converted into or repaid in
common shares.
The equity component is assigned the residual carrying amount after
deducting from the instrument as a whole the amount separately
determined for the liability component.
3) Recognition and measurement of derivative instruments
The Group enters into financial derivative contracts only in order to
reduce its exposure to changes in interest rates, foreign currency
exchange rates and commodities prices on firm or highly probable
commitments.
Forward exchange contracts and foreign currency swaps are used to
hedge foreign currency exchange rate exposures.
The Group enters into various interest rate swaps and options to
manage its interest rate exposure. These swaps aim at converting
financial instruments either from fixed rate to floating rate or from
floating rate to fixed rate.
The Group uses derivatives such as swaps and options in order to
manage its exposure to commodity risks.
Pursuant to the guidance in IAS 39 and IAS 32, the Group records in
the consolidated statement of financial position derivative instruments
Registration Document | 2011 | LafargeF18

F
CONSOLIDATED FINANCIAL STATEMENTSNote 2 Summary of significant accounting policies
at their fair value. The accounting for changes in fair value of a
derivative depends on the intended use of the derivative and the
resulting designation. The Group designates its derivatives based on
the criteria established by IAS 39.
In case of a fair value hedge relationship, changes in fair value on the
hedging item are recognized in the consolidated statement of income
of the period of change. The part corresponding to the efficient portion
of the hedge is offset by the unrealized loss or gain recognized on the
hedged item.
In case of a cash flow hedge relationship, changes in fair value on the
hedging item are recognized directly in other comprehensive income
for the effective portion and in the consolidated statement of income
under the “ Finance income” caption for the ineffective portion. The
gain or loss recognized in equity is subsequently reclassified to the
consolidated statement of income when the hedged exposure affects
earnings.
Embedded derivatives not closely related to host contracts are recorded
at fair value in the consolidated statement of financial position. For
embedded derivatives, the gain or loss is recognized in the consolidated
statement of income in the period of the change in fair value.
4) Put options on shares of subsidiaries granted to third-parties
Pursuant to IAS 32, put options granted to non controlling interests of
fully-consolidated subsidiaries are considered financial debt. The value
of the debt is estimated using the contract formulas or prices. When
utilizing formulas based upon multiples of earnings minus debt, we
use the actual earnings of the period and the debt of the subsidiary at
the closing date of the estimation.
PUT OPTIONS GRANTED TO NON CONTROLLING INTERESTS BEFORE JANUARY 1, 2010
The Group recorded the put options granted to non controlling interests
as a financial debt at present value of the put exercise price and as
a reduction in non controlling interests in equity. When such present
value of the put exercise price exceeded the carrying amount of the
non controlling interest, the Group recorded this difference as goodwill.
The change in the fair value of the debt related to puts options granted
to non controlling interests before January 1, 2010, is recorded against
non-controlling interests and against the goodwill initially recorded if
the debt exceeds the carrying amount of the non-controlling interests.
There is no impact on the consolidated statement of income nor on the
equity attributable to the owners of the parent company.
PUT OPTIONS GRANTED TO NON CONTROLLING INTERESTS AFTER JANUARY 1, 2010
The Group recorded the put options granted to non controlling interests
as a financial debt at present value of the put exercise price and as
a reduction in non controlling interests in equity. When such present
value of the put exercise price exceeded the carrying amount of the non
controlling interest, the Group recorded this difference as a reduction
in equity attributable to the owners of the parent company.
The change in the fair value of the debt is recorded against
non-controlling interests and against equity attributable to the owners
of the parent company if the debt exceeds the carrying amount of the
non-controlling interests.
2.20 Pensions, termination benefits and other post-retirement benefits
1) Defined contribution plans
The Group accounts for pension costs related to defined contribution
pension plans as they are incurred (in “cost of sales” or “selling and
administrative expenses” based on the beneficiaries of the plan).
2) Defined benefit plans
Estimates of the Group’s pension and termination benefit obligations
are calculated annually, in accordance with the provisions of IAS 19–
Employee Benefits, with the assistance of independent actuaries,
using the projected unit credit method. This method considers best
estimate actuarial assumptions including the probable future length of
the employees’ service, the employees’ final pay, the expected average
life expectancy and probable turnover of beneficiaries.
The Group’s obligations are discounted by country based upon
appropriate discount rates. The obligations are recognized based
upon the proportion of benefits earned by employees as services are
rendered.
Assets held by external entities to fund future benefit payments are
valued at fair value at the reporting date .
For most defined benefit plans of the Group, changes in actuarial
assumptions which affect the value of the obligations and the
differences between expected and actual long-term return on plan
assets are accounted for as actuarial gains and losses.
The current period pension expense is comprised of the increase in
the obligation, which results from the additional benefits earned by
employees in the period, and the interest expense, which results from
the outstanding pension obligation. The amounts described above are
reduced by the expected return on plan assets.
The current period pension expense is recorded in Operating income
before capital gains, impairment, restructuring and other (in “cost
of sales” or “selling and administrative expenses” based on the
beneficiaries of the plan).
Actuarial gains and losses arise from changes in actuarial assumptions
used in the valuation of obligations and plan assets and from market
conditions effectively noticed regarding these assumptions. These
gains or losses are charged or credited to other comprehensive income
in the period in which they arise, the Group applying the option offered
by the amendment to IAS 19 .
The effect of plans amendments on the Group companies’ obligations
are, in general, recognized in the consolidated statement of income :
• in the year of the amendment for the part related to vested benefits;
• over the remaining service lives of related employees for the portion
related to non-vested benefits.
In the event of overfunding of a plan’s liabilities by its dedicated assets,
the Group applies the limitations applicable under IAS 19 (asset
ceiling).
F19Lafarge | Registration Document | 2011

FCONSOLIDATED FINANCIAL STATEMENTSNote 2 Summary of significant accounting policies
3) Other post-retirement benefits
Certain of the Group’s subsidiaries grant their employees and
dependants post-retirement medical coverage or other types of post-
employment benefits. These costs are calculated based upon actuarial
determinations and are recorded through the consolidated statement
of income over the expected average remaining service lives of the
employees (in “cost of sales” or “selling and administrative expenses”
based on the beneficiaries of the plan).
SPECIFIC TREATMENT RELATED TO FIRST-TIME ADOPTION OF IFRS
The Group has elected to use the option available in IFRS 1 under
which any difference existing at January 1, 2004 between defined
benefit plan liabilities and the fair value of dedicated assets, not
recognized in an entity’s statement of financial position at that date, can
be recognized through an adjustment to equity, except the non-vested
portion of unrecognized past service costs. As a consequence, actuarial
gains or losses relating to pensions obligations were recognized as of
January 1, 2004.
2.21 Provisions
The Group recognizes provisions when it has a legal or constructive
obligation resulting from past events, the resolution of which would
result in an outflow of resources embodying economic benefits to the
Group .
1) Restructuring
A provision for restructuring costs is recognized when the restructuring
plans have been finalized and approved by the Group’s management,
and when the Group has raised a valid expectation in those affected
that it will carry out the plan either by starting to implement the plan
or announcing its main features to those affected by it. This provision
only include direct expenditures arising from the restructuring, notably
severance payments, early retirement costs, costs for notice periods not
worked and other costs directly linked with the closure of the facilities.
2) Site restoration
When the Group is legally, contractually or constructively required to
restore a quarry site, the estimated costs of site restoration are accrued
and recognized to cost of sales, on the basis of production levels and
depletion rates, over the operating life of the quarry. The estimated
future costs for known restoration requirements are determined on
a site by site basis and are calculated based on the present value of
estimated future costs.
3) Environmental costs
Costs incurred that result in future economic benefits, such as
extending useful lives, increased capacity or safety, and those costs
incurred to mitigate or prevent future environmental contamination,
are capitalized. When the Group determines that it is probable that a
liability for environmental costs exists and that its resolution will result
in an outflow of resources, an estimate of the future remediation is
recorded as a provision without the offset of contingent insurance
recoveries (only virtually certain insurance recoveries are recorded
as an asset in the consolidated statement financial position). When
the effect of the passage of time is not significant, the provision is
calculated based on undiscounted cash flows.
Environmental costs, which are not included above, are expensed as
incurred.
2.22 Trade payables
Trade payables are recognized initially at fair value and subsequently
measured at amortized cost using the effective interest method.
2.23 Income tax
Income tax expense or benefit comprises current and deferred tax.
Income tax expense is recognized in the consolidated statement of
income except to the extent that it relates to items recognized directly
in equity, in which case it is recognized in equity.
Current tax is the expected tax payable on the taxable income for the
year, using tax rates enacted or substantively enacted at the reporting
date, and any adjustment to tax payable in respect of previous years.
Deferred tax is recognized using the balance sheet method, providing
for temporary differences between the carrying amounts of assets
and liabilities for financial reporting purposes and the amounts used
for taxation purposes. Deferred tax is not recognized for the following
temporary differences: (i) the initial recognition of goodwill, (ii) the
initial recognition of assets or liabilities in a transaction that is not a
business combination and that affects neither accounting nor taxable
profit, and (iii) differences relating to investments in subsidiaries and
jointly controlled entities to the extent that it is probable that they will
not reverse in the foreseeable future.
Deferred tax is measured at the tax rates that are expected to be
applied to the temporary differences when they reverse, based on the
laws that have been enacted or substantively enacted by the reporting
date. Deferred tax assets and liabilities are offset if there is a legally
enforceable right to offset current tax liabilities and assets, and they
relate to income taxes levied by the same tax authority on the same
taxable entity, or on different tax entities, but they intend to settle
current tax liabilities and assets on a net basis or their tax assets and
liabilities will be realized simultaneously.
A deferred tax asset is recognized to the extent that it is probable that
future taxable profits will be available against which the temporary
difference can be utilized. Deferred tax assets are reviewed at each
reporting date and are reduced to the extent that it is no longer probable
that the related tax benefit will be realized.
A deferred tax liability is recognized for all taxable temporary differences
associated with investments in subsidiaries, joint ventures and
associates except to the extent that both of the following conditions
are satisfied:
• the Group is able to control the timing of the reversal of the temporary
difference (e.g. the payment of dividends); and
• it is probable that the temporary difference will not reverse in the
foreseeable future.
Accordingly, for fully consolidated companies, a deferred tax liability is
only recognized in the amount of taxes payable on planned dividend
distributions by these companies.
2.24 Share based payments
On a regular basis, the Group grants to its employees stock options,
which give entitlement to subscribe for new shares in the Company or
to purchase existing shares at a set price, and offers employee share
Registration Document | 2011 | LafargeF20

F
CONSOLIDATED FINANCIAL STATEMENTSNote 2 Summary of significant accounting policies
purchase plans. The Group granted a performance stock plan for the
first time in 2007.
In accordance with the prescriptions of IFRS 2 – Share Based
Payments, the Group records compensation expense for all share-
based compensation granted to its employees.
1) Share options granted to employees, performance stock plans and SAR (“Stock Appreciation Rights”)
Share options and performance stock fair value are calculated at grant
date using the Black & Scholes model. However, depending on whether
the equity instruments granted are equity-settled through the issuance
of Group shares or cash settled, the accounting treatment differs.
If the equity instrument is settled through the issuance of Group shares,
the fair value of the equity instruments granted is estimated and fixed
at the grant date and recorded over the vesting period based on the
characteristics of the equity instruments. In addition, the expense is
recorded against equity.
If the equity instrument is settled in cash (applicable for SAR), the fair
value of the equity instruments granted is estimated as of the grant
date and is re-estimated at each reporting date and the expense is
adjusted pro rata taking into account the vested rights at the relevant
reporting date. The expense is spread over the vesting period based
on the characteristics of the equity instruments and corresponding
entries are made in non-current provisions .
In accordance with IFRS 1 and IFRS 2, only options granted after
November 7, 2002 and not fully vested at January 1, 2004 are
measured and accounted for as employee expenses .
2) Employee share purchase plans
When the Group performs capital increases reserved for employees,
and when the conditions offered are significantly different from market
conditions, the Group records a compensation cost.
This cost is measured at the grant date, defined as the date at which
the Group and employees share a common understanding of the
characteristics of the offer.
The measurement of the cost takes into account the Group’ s
contributions to the plan , the potential discount granted on the share
price and the effect of post-vesting transfer restrictions (deducted from
the discount granted).
The compensation cost calculated is expensed in the period of the
transaction (considered as compensation for past services) if no vesting
condition is attached to the shares.
2.25 Emission rights
Where the Group is involved in a cap and trade scheme, and until the
IASB issues a position on the appropriate accounting treatment, the
Group will account for the effects of such scheme as follows:
• emission rights granted by governments are not recorded in the
consolidated statement of financial position, as they have a cost
equal to zero;
• proceeds from the sale of granted emission rights are recorded as
a reduction to cost of sales;
• purchases of emission rights on the market are recorded in “C ost
of sales ” when they cover actual emissions of the period. They are
recorded as intangible assets if they cover actual emissions to be
made in future periods;
• provisions are recorded (in “C ost of sales”) when estimated yearly
actual emissions exceed the number of emission rights granted for
the period or purchased to cover actual emissions.
No other impact is recorded in the consolidated statement of income
or in the consolidated statement of financial position.
2.26 Non-current assets held for sale and discontinued activities
A non-current asset or a group of assets and liabilities is classified as
held for sale when its carrying amount will be recovered principally
through a sale transaction rather than through continuing use. For this
to be the case, the asset (or group of assets and liabilities) must be
available for immediate sale and its sale must be highly probable. Such
assets or groups of assets and liabilities are presented separately in the
consolidated statement of financial position, in the line “Assets held
for sale” when they are material. These assets or groups of assets and
liabilities are measured at the lower of their carrying amount and fair
value less costs to sell. The liabilities directly linked to assets or groups
of assets held for sale are presented in the line “Liabilities directly
associated with assets held for sale” of the consolidated statement of
financial position.
A discontinued operation is a component of an entity that either has
been disposed of or is classified as held for sale, and:
• represents a separate major line of business or geographical area
of operations;
• is part of a single coordinated plan to dispose of a separate major
line of business or geographical area of operations; or
• is a significant subsidiary acquired exclusively with a view to resale.
Amounts included in the consolidated statement of income and the
statements of cash flows related to these discontinued operations
are presented separately for the current period and all prior periods
presented in the financial statements. Assets and liabilities related to
discontinued operations are shown on separate lines for the last period
presented with no restatement for prior years.
2.27 Accounting pronouncements at the reporting date not yet effective
Standards and interpretations adopted by the European Union at the reporting date
PRONOUNCEMENTS WITH LIMITED IMPACT EXPECTED ON CONSOLIDATED FINANCIAL STATEMENTS
• Amendments to IFRS 7 – Disclosures – Transfers of Financial assets,
issued by the IASB in October 2010 and applicable for annual
periods beginning on or after July 1 , 2011.
F21Lafarge | Registration Document | 2011

FCONSOLIDATED FINANCIAL STATEMENTSNote 3 Significant events
Standards and Interpretations issued but not yet adopted by the European Union at the reporting date
PRONOUNCEMENTS WITH A POTENTIAL IMPACT ON CONSOLIDATED FINANCIAL STATEMENTS
• IFRS 9 – Financial instruments and subsequent amendments,
issued by the IASB in November 2009 and in December 2011 and
applicable for annual periods beginning on or after January 1, 2015;
• IFRS 10 – Consolidated financial statements, issued by the IASB in
May 2011 and applicable for annual periods beginning on or after
January 1, 2013, based on a preliminary study, no material impact
has been identified. However, our final assessment of the potential
impacts is not yet complete;
• IFRS 11 – Joint arrangements, issued by the IASB in May 2011
and applicable for annual periods beginning on or after January
1, 2013, based on a preliminary study, this new standard could
have material impacts on performance indicators and presentation
of Group consolidated financial statements (see Note 14 related
to Joint ventures). However, our final assessment of the potential
impacts is not yet complete;
• IFRS 12 – Disclosures of interests in other entities, issued by the
IASB in May 2011 and applicable for annual periods beginning on
or after January 1, 2013;
• Amendments to IAS 19 – Employee benefits, issued by the IASB in
June 2011 and applicable for annual periods beginning on or after
January 1 , 2013. The impacts are currently under review.
PRONOUNCEMENTS WITH LIMITED IMPACT EXPECTED ON CONSOLIDATED FINANCIAL STATEMENTS
• IFRS 13 – Fair value measurement, issued by the IASB in May 2011
and applicable for annual periods beginning on or after January 1,
2013;
• IAS 27 revised – Separate financial statements, issued by the IASB
in May 2011 and applicable for annual periods beginning on or
after January 1, 2013;
• IAS 28 revised – Investments in associates and joint ventures,
issued by the IASB in May 2011 and applicable for annual periods
beginning on or after January 1, 2013;
• Amendments to IFRS 1 – Severe Hyperinflation and Removal of
Fixed Dates for First-Time Adopters, issued by the IASB in December
2010 and applicable for annual periods beginning on or after July 1 ,
2011;
• Amendments to IAS 1 – Presentation of financial Statements –
Presentation of items of other comprehensive income, issued by
the IASB in June 2011 and applicable for annual periods beginning
on or after July 1 , 2012;
• Amendments to IFRS 7 – Disclosures – Offsetting financial assets
and financial liabilities, issued by the IASB in December 2011 and
applicable for annual periods beginning on or after January 1 , 2013;
• Amendments to IAS 32 – Financial instruments: Presentation –
Offsetting financial assets and financial liabilities, issued by the IASB
in December 2011 and applicable for annual periods beginning on
or after January 1 , 2014;
• Amendments to IAS 12 – Deferred Tax – Recovery of Underlying
Assets, issued by the IASB in December 2010 and applicable for
annual periods beginning on or after January 1 , 2012;
• IFRIC 20 – Stripping costs in the production phase of a surface mine,
issued by the IASB in November 2011 and applicable for annual
periods beginning on or after January 1, 2013.
Note 3 Significant events
3.1 Discontinued operations and Assets held for sale
3.1.1 Disposal of Gypsum Division operations
The Group is committed, after approval in early July 2011 by the
Group’s Executive Directors and Board of Directors, in a disposal
project of the Gypsum Division for its operations in Western Europe,
Central and Eastern Europe, North America, Latin America and Asia,
which are a Group’s specific business segment. Accordingly, these
operations are presented as Discontinued operations according to IFRS
5 (see Note 2.26) in the financial statements as of December 31, 2011.
As of December 31, 2011, the following transactions have occurred:
• on December 9 , 2011, the Group sold to Boral its stake in their
common Asian Gypsum joint-venture LBGA (Lafarge Boral Gypsum
Asia) for net cash proceeds of 343 million euros;
• on November 4 , 2011, the Group sold to Etex Group its European
and South American Gypsum operations for net cash proceeds
of 824 million euros. The Group retains a 20% interest in the
partnerships, which combines the European and South American
Gypsum activities of both Groups and is accounted under the
equity method for 153 million euros as at December 31, 2011 (see
Note 13);
• on August 5 , 2011, the Group disposed of the integrality of its
Australian Gypsum operations to Knauf for 123 million euros (net
of cash disposed of).
As of December 31, 2011, these operations are presented in one single
line in the consolidated statement of income (net income (loss) from
discontinued operations) and in one separate line in the consolidated
statement of cash flows for each nature of flow. Figures in the
consolidated statement of income and in the consolidated statement
of cash flows were adjusted for the comparative period presented.
As of December 31, 2011, interests that continue to be consolidated
are presented in two separate lines in the consolidated statement of
financial position i.e. “Assets held for sale” and “Liabilities associated
with assets held for sale” with no restatement for previous years. The
“Assets held for sale” for an amount of 433 million euros mainly
comprise of goodwill and property, plant and equipment and the
“Liabilities associated with assets held for sale” for an amount of
27 million euros mainly comprise of trade payables.
Registration Document | 2011 | LafargeF22

F
CONSOLIDATED FINANCIAL STATEMENTSNote 3 Significant events
The following table provides the net income attributable to the discontinued operations:
The depreciation and amortization expense ceased on July 1, 2011
(29 million euros impact as of December 31, 2011).
3.1.2 Agreement between Lafarge and Anglo American
On February 18, 2011, the Group and Anglo American plc announced
their agreement to combine their cement, aggregates, ready-mixed
concrete, and asphalt & contracting businesses in the United Kingdom,
comprising Lafarge Cement UK, Lafarge Aggregates and Concrete
UK (“Lafarge UK”) and Tarmac Quarry Materials (“Tarmac UK”). The
completion of this transaction, which will form a 50:50 joint venture,
is conditional upon regulatory approvals.
In compliance with IFRS 5 – Non-current assets held for sale and
discontinued operations, Lafarge UK ‘s assets and liabilities that will
be contributed to this joint venture have been grouped since February
18, 2011 in the consolidated statement of financial position on the lines
“Assets held for sale” and “Liabilities directly associated with assets
held for sale”, respectively, with no restatement for previous years. The
depreciation charge ceased from that date (50 million euros impact
as of December 31, 2011).
As of December 31, 2011, the assets held for sale of Lafarge UK
amount to 1,762 million euros and essentially comprise goodwill and
property, plant and equipment. The liabilities directly associated with
assets held for sale of Lafarge UK amount to 337 million euros and
notably comprise trade payables.
Lafarge UK’s businesses that will contribute to the joint venture are
not discontinued operations according to IFRS 5 (see Note 2.26).
Accordingly, the amounts included in the consolidated statement of
income and the statements of cash flows related to these businesses
are not presented separately for the current and comparative periods
presented in the financial statements.
3.1.3 Disposal of the Aggregates & Concrete activities in Portugal
The Group has disposed of the integrality of its Aggregates & Concrete
business in Portugal (29 concrete plants and 4 aggregates quarries)
to the Portuguese construction group Secil. The approval by the
Portuguese competition authorities has been obtained in June 2011.
The net impact of this disposal is 62 million euros, net of cash disposed
of, in the consolidated statement of cash flows on the line “Disposals”
and 18 million euros for the net gain on disposal, in the consolidated
statement of income on the line “Net gains (losses) on disposals ”.
3.1.4 Disposal of Cement and Concrete assets in the South East of United States
On October 3, 2011, the Group disposed of its cement and concrete
assets in the South East of United States to the Colombia-based
conglomerate Cementos Argos. The cement assets sold include the
Harleyville cement plant in South Carolina and the Roberta cement
plant in Alabama, a cement grinding station in Atlanta (Georgia),
associated supporting cement terminals and its ready-mix concrete
units. The net impact of this disposal is 564 million euros, net of cash
disposed of, in the consolidated statement of cash flows on the line
“Disposals ” and 22 million euros for the net gain on disposal, in the
consolidated statement of income on the line “Net gains (losses) on
disposals ”.
3.2 Acquisitions of additional interests
These acquisitions have no impact on the evolution of the Group’s net
financial debt over the period since, non controlling shareholders held a
put option and in accordance with accounting principles related to put
options on shares of subsidiaries, the Group recorded as at December
31, 2010 a debt for these put exercise prices (see Note 2.19).
STATEMENT OF INCOME - DISCONTINUED OPERATIONS YEARS ENDED DECEMBER 31,
(in millions of euros, except per share data) 2011 2010
REVENUE 1,236 1,335
Cost of sales (1,028) (1,094)
Selling and administrative expenses (133) (193)
Operating income before capital gains, impairment, restructuring and other 75 48
Other operating income (expenses) (including gains (losses) on disposals) 466 (13)
OPERATING INCOME 541 35
Finance income (costs) (6) (11)
Share of net income (loss) of associates (15) 7
INCOME BEFORE INCOME TAX 520 31
Income tax* (28) (11)
NET INCOME / (LOSS) FROM DISCONTINUED OPERATIONS 492 20
O f which part attributable to:
Owners of the parent company 490 18
Non-controlling interests 2 2
EARNINGS PER SHARE FROM DISCONTINUED OPERATIONS (IN EUROS)
Basic earnings per share 1.71 0.06
Diluted earnings per share 1.71 0.06
* Of which (14) million euros related to gains / (losses) on disposals.
F23Lafarge | Registration Document | 2011

FCONSOLIDATED FINANCIAL STATEMENTSNote 4 Business segment and geographic area information
3.2.1 Lafarge India PVT Limited
Following the exercise by the non controlling shareholder of its put
option, the Group acquired 5.62% of additional interests in Lafarge
India PVT Limited for an amount of 51 million euros, reflected on the
statement of cash flows on the line “Acquisition of ownership interests
with no gain of control”.
3.2.2 Cement activities in Serbia
The Group now holds 100% of Cement activities in Serbia. This
acquisition made for an amount of 111 million euros, is reflected on the
statement of cash flows on the line “Acquisition of ownership interests
with no gain of control”.
3.3 Capital increase reserved for Group’s employees
The Group launched in May 2011 capital increase reserved for Group’s
employees. The settlement and delivery took place on July 29, 2011.
The employees have the option to pay upfront, or over a 12-month or
24-month period. The net impact in equity is 27 million euros.
Note 4 Business segment and geographic area information
The segment information presented hereafter by operating segment is
the same as that reported to the Chief Operating Decision Maker (the
Chief Executive Officer) for the purposes of making decisions about
allocating resources to the segment and assessing its performance.
The Group now operates in two operating segments (Cement and
Aggregates & Concrete), defined as continuing business segments,
each of which represents separately managed strategic operating
segments that have different capital requirements and marketing
strategies. Each segment develops, manufactures and sells distinct
products.
CONTINUING BUSINESS SEGMENTS
• The Cement segment produces and sells a wide range of cement
and hydraulic binders adapted to the needs of the construction
industry.
• The Aggregates & Concrete segment produces and sells aggregates,
ready mix concrete, other concrete products and, relating to paving
activities, other products and services.
DISCONTINUED BUSINESS SEGMENT (GYPSUM EXCLUDING ACTIVITIES IN MIDDLE EAST AND AFRICA)
• The Gypsum segment mainly produces and sells drywall for the
commercial and residential construction sectors.
Other and holding activities (namely the activities in North America,
Middle East and Africa of the Gypsum Division), not allocated to our
core operating segments, are summarized in the “other” segment.
Group management internally evaluates its performance based upon:
• operating income before capital gains, impairment, restructuring and
other, and share of net income (loss) of associates; and
• capital employed (defined as the total of goodwill, intangible assets
and property, plant and equipment , investments in associates and
working capital).
Group financing, notably treasury process (including finance income
and finance costs ), and income taxes are managed at Group level and
are not allocated to segments.
The Group accounts for intersegment sales and transfers at market
prices.
For the geographical information, the revenue is presented by region
or country of destination of the revenue.
Business segment and geographical information, presented below,
reflects the items mentioned in Note 3.1 “Discontinued operations and
Assets held for sale ”. 2010 f igures for the consolidated statement of
income and consolidated statement of cash flows have been adjusted
following the disposal of Gypsum activities and are therefore not
comparable with those presented in the 2010 Registration Document .
Registration Document | 2011 | LafargeF24

F
CONSOLIDATED FINANCIAL STATEMENTSNote 4 Business segment and geographic area information
a) Segment information
2011(million euros) CEMENT
AGGREGATES & CONCRETE OTHER TOTAL
STATEMENT OF INCOME
Gross revenue 10,622 5,238 82 15,942
Less: intersegment (647) (11) - (658)
REVENUE 9,975 5,227 82 15,284
Operating income before capital gains, impairment, restructuring
and other 1,968 237 (26) 2,179
Net gains (losses) on disposals 22 23 - 45
Other operating income (expenses) (470) (43) (28) (541)
Including impairment on assets and goodwill (367) (21) - (388)
OPERATING INCOME 1,520 217 (54) 1,683
Finance costs (1,142)
Finance income 143
Share of net income (loss) of associates (10) 3 (1) (8)
Income tax (432)
NET INCOME FROM CONTINUING OPERATIONS 244
NET INCOME FROM DISCONTINUED OPERATIONS 492 492
NET INCOME 736
OTHER INFORMATION
Depreciation and amortization (766) (226) (46) (1,038)
Other segment non cash items of operating income (expenses) (413) 34 78 (301)
Capital expenditures 828 169 74 1,071
Capital employed 24,706 4,700 536 29,942
STATEMENT OF FINANCIAL POSITION
Segment assets 29,237 5,885 2,457 37,579
Of which investments in associates 395 36 173 604
Assets held for sale - Lafarge UK 1,216 440 107 1,762
Assets held for sale - Gypsum Division operations 433 433
Unallocated assets* 945
TOTAL ASSETS 40,719
Segment liabilities 2,860 1,023 2,052 5,935
Liabilities associated with assets held for sale - Lafarge UK 135 157 45 337
Liabilities associated with assets held for sale - Gypsum Division
operations 27 27
Unallocated liabilities and equity** 34,420
TOTAL EQUITY AND LIABILITIES 40,719
*Deferred tax assets and derivative instruments.
**Deferred tax liabilities , financial debt, derivative instruments and equity.
F25Lafarge | Registration Document | 2011

FCONSOLIDATED FINANCIAL STATEMENTSNote 4 Business segment and geographic area information
2010(million euros) CEMENT
AGGREGATES & CONCRETE OTHER* TOTAL
STATEMENT OF INCOME
Gross revenue 10,280 5,093 90 15,463
Less: intersegment (624) (5) - (629)
REVENUE 9,656 5,088 90 14,834
Operating income before capital gains, impairment, restructuring
and other 2,230 216 (53) 2,393
Net gains (losses) on disposals 50 (5) - 45
Other operating income (expenses) (249) (28) (27) (304)
Including impairment on assets and goodwill (126) (11) (17) (154)
OPERATING INCOME 2,031 183 (80) 2,134
Finance costs (1,055)
Finance income 343
Share of net income (loss) of associates (26) 5 (2) (23)
Income tax (305)
NET INCOME FROM CONTINUING OPERATIONS 1,094
NET INCOME FROM DISCONTINUED OPERATIONS 20 20
NET INCOME 1,114
OTHER INFORMATION
Depreciation and amortization (775) (266) (52) (1,093)
Other segment non cash items of operating income (expenses) (100) 22 - (78)
Capital expenditures 1,060 168 44 1,272
Capital employed 26,780 5,200 1,782 33,762
STATEMENT OF FINANCIAL POSITION
Segment assets 31,330 6,384 4,157 41,871
Of which investments in associates 236 34 152 422
Unallocated assets ** 623
TOTAL ASSETS 42,494
Segment liabilities 2,797 1,107 2,075 5,979
Unallocated liabilities and equity *** 36,515
TOTAL EQUITY AND LIABILITIES 42,494
* Out of which 1,511 million euros of capital employed 1,900 million euros of segment assets (namely 134 million euros in investments in associates) and 313 million euros of segment
liabilities related to the Gypsum Division.
** Deferred tax assets and derivative instruments.
*** Deferred tax liabilities , financial debt, derivative instruments and equity.
Registration Document | 2011 | LafargeF26

F
CONSOLIDATED FINANCIAL STATEMENTSNote 5 Net gains (losses) on disposals
b) Geographic area information
c) Major customers
The Group has no reliance on any of its customers.
Note 5 Net gains (losses) on disposals
Components of net gains (losses) on disposals , net are as follows:
In presenting information on the basis of geographical segments,
segment revenue is based on the geographical location of customers.
Non-current assets are allocated to segments based on their
geographical locations.
Non-current assets include goodwill, intangible assets, property, plant
and equipment and investments in associates.
(million euros)
2011 2010
REVENUE NON CURRENT ASSETS* REVENUE NON CURRENT ASSETS
WESTERN EUROPE** 3,431 4,456 3,482 6,613
Of which:
France 1,885 2,271 1,800 2,345
United Kingdom 846 2 787 1,550
NORTH AMERICA 3,110 5,145 3,153 6,127
Of which:
United States 1,395 4,006 1,553 4,917
Canada 1,715 1,139 1,600 1,210
MIDDLE EAST AND AFRICA 3,897 12,016 3,883 12,621
Of which:
Egypt 482 2,729 714 2,804
Algeria 537 2,954 444 3,071
CENTRAL & EASTERN EUROPE** 1,302 2,465 1,066 2,257
LATIN AMERICA 1,035 1,421 838 1,527
Of which:
Brazil 659 993 504 1,072
ASIA 2,509 3,997 2,412 4,177
TOTAL 15,284 29,499 14,834 33,322
* The decrease in non- current assets relates to the reclassification as “ Assets held for sale” of the items mentioned in Note 3.1 “ Discontinued operations and Assets held for sale”.
** Austria has been reclassified from Western Europe to Central & Eastern Europe for both years presented.
YEARS ENDED DECEMBER 31,
(million euros) 2011 2010*
Net gains (losses) on disposals of consolidated subsidiaries, joint ventures and associates 44 33
Net gains (losses) on sale of other long-term assets 1 12
NET GAINS (LOSSES) ON DISPOSALS 45 45
* Figures have been adjusted as mentioned in Note 3.1.1 «Disposal of Gypsum Division operations» following the disposal operations of Gypsum activities and are therefore not
comparable with those presented in the 2010 Registration Document .
The effect on the income tax rate of the net gains (losses) on disposals is mentioned in the Note 22 (a).
F27Lafarge | Registration Document | 2011

FCONSOLIDATED FINANCIAL STATEMENTSNote 6 Other operating income (expenses)
2011
“Net gain on disposals of consolidated subsidiaries, joint ventures and
associates ” amounts to 44 million euros, and is notably composed of
a 22 million euros gain on the sale of Cement & Concrete assets in
the S outh E ast United States (see note 3.1.4) and 18 million euros
on the disposal of Aggregates & Concrete activities in Portugal (see
Note 3.1.3).
2010
“Net gain on disposals of consolidated subsidiaries, joint ventures and
associates ” amounts to 33 million euros, and is notably composed of a
14 million euros gain on the sale of an associate in Brazil.
Note 6 Other operating income (expenses)
Components of other operating income (expenses) are as follows:
2011
Other operating income (expenses) mainly comprised of impairment
losses on goodwill in Greece and United Arab Emirates (see Note 10 d ),
depreciation of some assets in Europe and restructuring costs for 61
million euros in various locations. Restructuring costs include notably
employee termination benefits, contract termination costs and other
restructuring costs. They are mainly due to our reduction cost plans
and concern notably Spain (Cement and Aggregat es & Concrete) and
North America. In 2011, litigations mainly include an accrual related to
a competition litigation in South Africa described in Note 29.
2010
In 2010, the Group recognized impairment on intangible assets and
property, plant and equipment for a total amount of 154 million euros,
notably relating to the assets of a closed paper plant in Sweden and to
some cement assets in the Western Europe and in South Korea regions
due to the impact of the economic environment. Restructuring costs
mainly concern Greece (Cement) and Spain (Cement and Aggregates
& Concrete).
YEARS ENDED DECEMBER 31,
(million euros) 2011 2010*
Impairment losses on goodwill (292) -
Impairment losses on intangible assets and property, plant and equipment (96) (154)
IMPAIRMENT LOSSES (388) (154)
Restructuring costs (61) (115)
Litigations (25) (21)
Other income - 29
Other expenses (67) (43)
OTHER OPERATING INCOME (EXPENSES) (541) (304)
* Figures have been adjusted as mentioned in Note 3.1.1 «Disposal of Gypsum Division operations» following the disposal operations of Gypsum activities and are therefore not
comparable with those presented in the 2010 Registration Document .
Registration Document | 2011 | LafargeF28

F
CONSOLIDATED FINANCIAL STATEMENTSNote 8 Finance income (costs)
Note 7 Emission rights
In 2003, the European Union adopted a Directive implementing the
Kyoto Protocol on climate change. This directive established a CO2
emissions trading scheme in the European Union: within the industrial
sectors subject to the scheme, each industrial facility is allocated a
certain amount of CO2 allowances. Industrial operators that keep their
CO2 emissions below the level of allowances granted to their plants
can sell their excess allowances to other operators that have emitted
more CO2 than the allowances they were initially granted. Another
provision allows European Union companies to use credits arising from
investments in emission reduction projects in developing countries to
comply with their obligations in the European Union.
The Emissions Trading Directive came into force on January 1, 2005
for an initial three-year period (2005-2007). For the second period
covering the years 2008 to 2012, each Member State issued at end
of 2007, after approval by the European Commission, a National
Allocation Plan (NAP) defining the amount of allowances given to
each industrial facility.
The Emissions Trading Directive and its provisions apply to all our
cement plants in the EU. We are operating cement plants in 10 out
of the 27 EU Member States. Allowances that were allocated to these
facilities represented some 28 million tonnes of CO2 per year over the
2008-2012 period. The Group policy is to monitor allowances not only
on a yearly basis but also over the whole 2008-2012 period. Actual
emissions are followed and consolidated on a monthly basis. Forecast
of yearly position is updated regularly during the year. Allowances would
be purchased on the market in case of actual emissions exceeding
rights granted for the period and, conversely, surplus may be sold on
the market.
In 2011, the low level of demand in our European markets combined
with our improved performance in kg of CO2 per ton of cement has led
to a surplus of allowances. During 2011, the Group sold excess rights
over actual emissions for an amount of 136 million euros and EUA/
CER swaps for an amount of 41 million euros, which leads to a total
amount of 177 million euros (158 million euros in 2010).
For the year 2012, based on our current production forecasts, which
may evolve in case of market trends different from those expected as
at today, the allowances granted by the NAP 2008-2012 should exceed
our needs on a consolidated basis.
Note 8 Finance income (costs)
Components of finance income (costs) are as follows:
2011
Net interest expense (interest expense less interest income), net of
capitalized interest costs, amounts to 841 million euros as at December
31, 2011 (766 million euros as at December 31, 2010), which
represents an increase of 10%. This variation is mainly explained by:
• the average interest rate on our gross debt of 5.7% in 2011, as
compared to 5.3% in 2010 (6.3% in 2011 and 5.8% in 2010 on
our net debt);
• capitalized interest costs for construction projects of 33 million
euros in 2011 compared to 68 million euros for the year ended
December 31, 2010;
• additional interests of 21 million euros in 2011 further to the
decisions of the credit rating agencies (Standard & Poor’s and
Moody’s) to downgrade our credit rating in 2011 triggering step-up
clauses on certain of our bonds.
YEARS ENDED DECEMBER 31,
(million euros) 2011 2010*
Interest expense (943) (853)
Foreign currency exchange losses (97) (78)
Other financial expenses (102) (124)
FINANCE COSTS (1,142) (1,055)
Interest income 102 87
Dividends received from investments 4 4
Foreign currency exchange gains 18 54
Other financial income 19 198
FINANCE INCOME 143 343
NET FINANCE INCOME (COSTS) (999) (712)
* Figures have been adjusted as mentioned in Note 3.1.1 «Disposal of Gypsum Division operations» following the disposal operations of Gypsum activities and are therefore not
comparable with those presented in the 2010 Registration Document .
F29Lafarge | Registration Document | 2011

FCONSOLIDATED FINANCIAL STATEMENTSNote 9 Earnings per share
The amount of foreign currency exchange gains and losses depends
on the exchange risk exposure of loans and debts denominated in
currencies different from the functional currencies of the company that
carries this loan and/or this debt. These exchange differences mainly
relate to loans and debts denominated in US dollars and Algerian dinars.
2010
Other financial income notably includes the gain on disposal of our
available-for-sale investment in Cimentos de Portugal (CIMPOR) for an
amount of 161 million euros.
Note 9 Earnings per share
The computation and reconciliation of basic and diluted earnings per share from continuing operations for the years ended December 31,
2011 and 2010 are as follows:
YEARS ENDED DECEMBER 31,
2011 2010
NUMERATOR (MILLION EUROS)
NET INCOME - ATTRIBUTABLE TO THE OWNERS OF THE PARENT COMPANY 593 827
Out of which net income from continuing operations 103 809
DENOMINATOR (IN THOUSANDS OF SHARES)
WEIGHTED AVERAGE NUMBER OF SHARES OUTSTANDING 286,514 286,087
Total potential dilutive shares 801 249
Weighted average number of shares outstanding — fully diluted 287,315 286,336
BASIC EARNINGS PER SHARE (EUROS) 2.07 2.89
DILUTED EARNINGS PER SHARE (EUROS) 2.06 2.89
BASIC EARNINGS PER SHARE FROM CONTINUING OPERATIONS (EUROS) 0.36 2.83
DILUTED EARNINGS PER SHARE FROM CONTINUING OPERATIONS (EUROS) 0.35 2.83
For purposes of computing diluted earnings per share, stock options which would have an anti-dilutive effect on the calculation of the diluted
earnings per share are excluded from the calculation.
In 2011, 7.81 million stock options were excluded from the diluted earnings per share calculation (8.40 million in 2010).
Registration Document | 2011 | LafargeF30

F
CONSOLIDATED FINANCIAL STATEMENTSNote 10 Goodwill
Note 10 Goodwill
a) Changes in goodwill
The following table displays the changes in the carrying amount of goodwill by business segment:
b) Acquisitions and disposals
2011
ACQUISITIONS
No significant acquisition occurred in 2011.
DISPOSALS
The 2011 disposals are related to:
• the goodwill allocated to CGUs of the Gypsum Division for its
operations in Western Europe, Central and Eastern Europe, Latin
America and Asia;
• the goodwill allocated to CGUs of Aggregates & Concrete business
in Portugal; and
• the share of goodwill allocated to CGUs of the Cement and Concrete
assets affected by the disposal of our operations in the South East
United States.
2010
ACQUISITIONS
In February 2010, the Group exchanged its 17.28% stake in Cimpor
to Votorantim against cement operations of Votorantim in Brazil and
the dividends paid by Cimpor related to its 2009 year-end. The cement
operations received from Votorantim have been valued at 755 million
euros. This evaluates our sold Cimpor stake at 6.5 euros per share.
The cement operations in Brazil have been transferred to the Group
by Votorantim on July 19, 2010, which notably comprise two grinding
stations, one cement plant, slag supply contracts and clinker supply
to grinding stations.
The goodwill arising from this transaction amounts to 490 million euros.
DISPOSALS
No significant disposal occurred in 2010.
(million euros) CEMENTAGGREGATES &
CONCRETE OTHER * TOTAL
CARRYING AMOUNT AT DECEMBER 31, 2009 11,038 1,966 245 13,249
Cost at January 1, 2010 11,308 1,973 266 13,547
Accumulated impairment (270) (7) (21) (298)
CARRYING AMOUNT AT JANUARY 1, 2010 11,038 1,966 245 13,249
Additions 490 22 1 513
Disposals (8) (26) - (34)
Impairment losses - - - -
Change in goodwill related to put options on shares of subsidiaries and other (12) (23) - (35)
Translation adjustments 496 121 17 634
CARRYING AMOUNT AT DECEMBER 31, 2010 12,004 2,060 263 14,327
Cost at January 1, 2011 12,289 2,061 285 14,635
Accumulated impairment (285) (1) (22) (308)
CARRYING AMOUNT AT JANUARY 1, 2011 12,004 2,060 263 14,327
Additions 55 50 - 105
Disposals (123) (76) (169) (368)
Impairment losses (285) (7) - (292)
Change in goodwill related to put options on shares of subsidiaries and other 39 - - 39
Translation adjustments (154) (6) (1) (161)
Other movements ** (151) - - (151)
Reclassification as a ssets held for sale (616) (93) (89) (798)
CARRYING AMOUNT AT DECEMBER 31, 2011 10,769 1,928 4 12,701
Cost at December 31, 2011 11,140 1,936 4 13,080
Accumulated impairment (371) (8) - (379)
CARRYING AMOUNT AT DECEMBER 31, 2011 10,769 1,928 4 12,701
* Gypsum Division disposed of (see Note 3.1.1).
** Corresponds to the goodwill of Saudi Arabia (change of consolidation method - See Note 13).
F31Lafarge | Registration Document | 2011

FCONSOLIDATED FINANCIAL STATEMENTSNote 10 Goodwill
c) Reclassification as assets held for sale
The “Reclassification as assets held for sale” line mainly reflects the
amounts related to Lafarge UK (see Note 3) and includes 230 million
euros of goodwill impairment.
d) Impairment test for goodwill
The Group’s methodology to test its goodwill for impairment is described
in Note 2.12.
Key assumptions
The evolution of the economic and financial, political and competitive
contexts in the different countries may have an impact on the
evaluation of recoverable amounts. Especially, the key assumptions
are the following:
• the market size, driven by the segments of residential construction,
commercial construction and infrastructures’ field of each country;
• our market share and the level of prices based especially on supply
- demand balance on the market;
• the costs evolution factors and mainly the evolution of energy costs;
• the country specific discount rate based on the weighted average
cost of capital;
• the country specific perpetual growth rate retained.
These parameters are based on:
• a 10-year period plan established during the last quarter of the
year in line with the budget exercice and approved by the heads
of operating and functional matters, which details operating
assumptions described above, based on the last trends known;
• a country specific discount rate, which includes a country risk
premium factoring political and economical risks of the country and
takes into account if needed specific situations such as in certain
countries in Europe and Middle East;
• a perpetual growth rate which has been maintained in 2011,
except for North America, because the worldwide economic
climate evolution does not change the expected evolution of long-
term market trends in the construction segment in which the Group
operates.
For countries such as Egypt and Syria with a recent political instability,
or European countries hit by the sovereign debt crisis such as Greece
and Spain, the operating assumptions and discount rates used have
been determined based on the specific country environment. These
forecasts do not reflect any possible breach of the economical or
geopolitical environment.
As described in Note 2.12, in performing the first step of the impairment
test, the Group uses a multiple of EBITDA from 7.9 to 13.4 (8.3 to 11.8
in 2010) according to the corresponding division.
When the Group determines the value in use of CGUs or groups of CGUs based on estimated discounted cash-flows (second step of the
impairment test as described in Note 2.12), the discount rates and perpetual growth rates are as follows for the main regions of the Group:
The discount rates are post-tax discount rates that are applied to
post-tax cash flows. The use of these rates results in recoverable values
that are identical to the ones that would be obtained by using pre-tax
rates and pre-tax cash flows.
The discount rates and perpetual growth rates are based on inflation
assumptions in Euro-Zone or American Dollar-zone (“hard currency”).
Therefore, the cash flows used for the calculation of the recoverable
amount are translated in “hard currency” taking into account the
differential of inflation between local currency and “hard currency”.
Main goodwill
Lafarge is composed of around seventy CGUs, generally corresponding
to the activity of a segment in a country, or groups of CGUs. The
key assumptions used for the valuation of the main CGUs or groups
of CGUs, covering more than 50% of total group goodwill, with the
carrying amount of corresponding goodwill are as follow:
DISCOUNT RATE PERPETUAL GROWTH RATE
2011 2010 2011 2010
Western Europe [7.0%-11%] [6.9%-10.2%] 2% 2%
North America 7.3% 7.1% 1.4% 1.8%
Middle East and Africa [8.4%-11.8%] [7.7%-11.7%] 3.0% 3.0%
Asia [8.1%-12.1%] [8.0%-10.6%] [2.0%-3.0%] [2.0%-3.0%]
Registration Document | 2011 | LafargeF32

F
CONSOLIDATED FINANCIAL STATEMENTSNote 10 Goodwill
MAIN CGUS
MAIN GROUP OF CGUS
The goodwill allocated to the Middle East and Africa region amounts
to 1, 130 million euros as at December 31, 2011 (1, 172 million euros
in 2010). The main assumptions used for the valuation of this group
of CGUs are discount rates between [8.4% and 11.8%] ([7.7% and
11.7%] in 2010) and a multiple of Ebitda of 7.9 (8.3 in 2010).
The goodwill that are allocated to other CGUs or groups of CGUs do not
account individually for more than 4% of total group goodwill.
Sensitivity of recoverable amounts
The Group analyzed the sensitiv ities of the recoverable amounts to a
reasonable possible change of a key assumption (notably to a change
of one point in the discount rate or the perpetual growth rate). These
analyses did not show a situation in which the carrying value of the
main CGUs would exceed their recoverable amount, with the exception
of the five CGUs referred to below.
For these five CGUs, the sensitivity of the recoverable amounts to an independent change of one point in either the discount rate or the perpetual
growth rate was as follows as at December 31, 2011:
For these five CGUs, the maximal range of sensitivity estimated by
the Group of the recoverable amount to key assumptions included in
10-year period plans is reflected by the sensitivity to the discount rate
presented above.
Impairment losses
2011
As at December 31, 2011, the Group has analysed the above
assumptions and sensitivities, and has specifically considered the
operating assumptions of the above five CGUs. In particular:
• for the CGU Cement Greece, a material drop in demand is noticed
in the context of the tougher economic environment and has for
consequence a reduced volume growth compared with previous
forecasts. On this basis, the Group recorded an impairment loss of
185 million euros for the goodwill of this CGU, based on the value
in use of this CGU determined with a discount rate of 11% (10.2%
in 2010);
• for the CGU Cement United Arab Emirates, a material drop in
demand and an unfavourable evolution of competitive environment
have for consequence a reduction of expected volumes and prices
growths compared with previous forecasts. On this basis, the Group
recorded an impairment loss of 100 million euros for the goodwill of
this CGU, based on the value in use of this CGU determined with a
discount rate of 8.7% (7.7% in 2010).
2010
No impairment loss occurred in 2010.
AT DECEMBER 31,
CASH GENERATING UNITS
2011 2010
CARRYING VALUE OF GOODWILL
(million euros) DISCOUNT RATE PERPETUAL
GROWTH RATE
CARRYING VALUE OF GOODWILL
(million euros) DISCOUNT RATE PERPETUAL
GROWTH RATE
Cement North America 1,527 7.3% 1.4% 1,590 7.1% 1.8%
Cement Algeria 1,354 8.4% 3.0% 1,395 8.2% 3.0%
Cement Egypt 1,364 9.4% 3.0% 1,376 8.2% 3.0%
Aggregates & Concrete North America 1,024 (a) n/a 1,054 7.1% 1.8%
Cement Iraq 679 9.3% 3.0% 672 9.9% 3.0%
(a) In 2011, the Aggregates & Concrete North America CGU was estimated based on a Ebitda multiple of 13.4.
CASH GENERATING UNIT(million euros)
EXCESS OF ESTIMATED RECOVERABLE AMOUNT OVER
CARRYING VALUE
IMPACT OF ONE POINT INCREASE / DECREASE IN THE
DISCOUNT RATE PERPETUAL GROWTH RATE
+1 PT -1 PT +1 PT -1 PT
Cement Greece* - (89) 133 69 (38)
Cement Spain 33 (118) 162 90 (66)
Cement Egypt 102 (316) 435 260 (190)
Cement United Arab Emirates** - (55) 79 51 (36)
Cement Syria 11 (68) 86 41 (33)
* After impairment loss of 185 million euros in 2011, which leads to a residual goodwill of 472 million euros.
** After impairment loss of 100 million euros in 2011, which leads to a goodwill fully depreciated.
F33Lafarge | Registration Document | 2011

FCONSOLIDATED FINANCIAL STATEMENTSNote 11 Intangible assets
Note 11 Intangible assets
(million euros) 2011 2010
CARRYING AMOUNT AT JANUARY 1, 661 632
Additions 70 77
Disposals - (13)
Amortization (82) (95)*
Impairment losses - (3)
Changes in scope and other changes 28 18
Translation adjustments 10 45
Reclassification as assets held for sale (35) -
CARRYING AMOUNT AT DECEMBER 31, 652 661
* Of which (88) million euros related to the continuing operations in 2010.
For the years presented, “Other intangible assets” include only assets
with finite useful lives.
In 2011, the overall Group’s spendings for product innovation and
industrial process improvement was 129 million euros, compared
to 153 million euros in 2010. The part of these spendings that are
expensed as incurred were 117 million euros in 2011 (140 million
euros in 2010).
For the years presented, no reversal of impairment losse s has been recorded.
The following table presents details of intangible assets:
AT DECEMBER 31,
(million euros)
2011 2010
COST
ACCUMULATED AMORTIZATION
AND IMPAIRMENT CARRYING VALUE COST
ACCUMULATED AMORTIZATION
AND IMPAIRMENT CARRYING VALUE
Software 478 348 130 494 348 146
Real estate development rights 87 59 28 85 58 27
Mineral rights 182 45 137 158 43 115
Other intangible assets 437 80 357 506 133 373
TOTAL INTANGIBLE ASSETS 1,184 532 652 1,243 582 661
Registration Document | 2011 | LafargeF34

F
CONSOLIDATED FINANCIAL STATEMENTSNote 12 Property, plant and equipment
Note 12 Property, plant and equipment
a) Changes in property, plant and equipment
2011
“Other changes in scope” notably includes:
• the disposal of Gypsum activities (see Note 3.1.1);
• the transaction with Strabag (see Note 20 (g)) ;
• the change in consolidation method of the company Al Safwa in
Saudi Arabia (see Note 13).
For the years presented, no significant reversal of impairment charges
has been recorded.
2010
In 2010, property, plant and equipment items with a carrying amount
below their recoverable value were impaired for a total amount of 151
million euros, notably relating to the assets of a closed paper plant in
Sweden and to some cement assets in the Western Europe and in
South Korea regions due to the impact of the economic environment
(see Note 6).
(million euros)
MINERAL RESERVES AND LAND BUILDINGS
MACHINERY, EQUIPMENT,
FIXTURES AND FITTINGS
CONSTRUCTION IN PROGRESS
TOTAL BEFORE INVESTMENT
SUBSIDIESINVESTMENT
SUBSIDIES TOTAL
Cost at January 1, 2010 2,127 3,628 18,505 2,328 26,588
Accumulated depreciation (471) (1,743) (7,593) (14) (9,821)
CARRYING AMOUNT
AT JANUARY 1, 2010 1,656 1,885 10,912 2,314 16,767 (68) 16,699
Additions 31 117 235 837 1,220 (11) 1,209
Disposals (10) (4) (21) 12 (23) - (23)
Main acquisitions through
business combinations 3 25 229 4 261 - 261
Other changes in scope (18) (6) (11) 3 (32) 1 (31)
Depreciation* (49) (114) (902) (19) (1,084) 6 (1,078)*
Impairment losses (2) - (149) - (151) - (151)
Other changes 22 445 1,016 (1,438) 45 - 45
Translation adjustments 99 99 618 165 981 - 981
CARRYING AMOUNT
AT DECEMBER 31, 2010 1,732 2,447 11,927 1,878 17,984 (72) 17,912
Cost at January 1, 2011 2,272 4,380 20,760 1,905 29,317
Accumulated depreciation (540) (1,933) (8,833) (27) (11,333)
CARRYING AMOUNT
AT JANUARY 1, 2011 1,732 2,447 11,927 1,878 17,984 (72) 17,912
Additions 29 18 116 816 979 - 979
Disposals (38) (15) (47) (2) (102) 5 (97)
Other changes in scope (127) (58) (731) 104 (812) 6 (806)
Depreciation (28) (152) (772) (4) (956) - (956)
Impairment losses (2) (12) (77) (5) (96) - (96)
Other changes 57 164 841 (1,076) (14) - (14)
Translation adjustments 3 (61) (161) (33) (252) - (252)
Reclassification as assets held
for sale** (200) (162) (660) (106) (1,128) - (1,128)
CARRYING AMOUNT
AT DECEMBER 31, 2011 1,426 2,169 10,436 1,572 15,603 (61) 15,542
Cost at December 31, 2011 1,835 3,877 18,197 1,582 25,490
Accumulated depreciation (409) (1,708) (7,761) (10) (9,887)
* Of which (1,005) million euros related to the continuing operations in 2010.
** Correspond to property, plant and equipment related to Lafarge UK and to the Gypsum activities for which the disposal is not effective as at December 31, 2011.
F35Lafarge | Registration Document | 2011

FCONSOLIDATED FINANCIAL STATEMENTSNote 13 Investments in associates
Note 13 Investments in associates
Investments in associates (see Note 35), presented below, are not listed and therefore do not have public quote. Their reporting date is in line
with Group’s one.
a) Changes in investment in associates
2011
ACQUISITIONS
Following the disposal to Etex Group of European and South
American Gypsum operations, the Group retains a 20% interest in
the partnerships, which combines the European and South American
Gypsum activities of both Groups and is accounted under the
equity method for 153 million euros as of December 31, 2011 (see
Note 3.1.1).
OTHER CHANGES
In Saudi Arabia, the Al Safwa company was jointly controlled by the
Group and a Saudi partner. On December 13, 2011, an agreement
has been signed and plans the entrance of two new Saudi financial
partners, by reserved increase in capital in this company. Following this
agreement, the Group exercises a significant influence on this entity,
which is accounted under the equity method as of December 31, 2011.
2010
The Group capitalized its long- term loan with an associate in Nigeria
(United Cement Company Of Nigeria Limited) for an amount of 132
million euros (see Note 15). In 2010, the Group sold its investment of
8% in an associate in Brazil (see Note 5).
Information relating to the statement of income
The following details the Group’s share of the operations of associates:
b) Finance Leases
The cost of property, plant and equipment includes 113 million euros and 121 million euros of assets under finance leases at December 31, 2011,
and 2010, respectively. The remaining obligations on such assets amount to 46 million euros and 52 million euros at December 31, 2011,
and 2010, respectively.
YEAR ENDED DECEMBER 31,
(million euros) 2011 2010*
Operating income before capital gains, impairment, restructuring and other 33 1
Net gains (losses) on disposals - 2
Other operating income (expenses), net (9) 2
Finance income (costs) (27) (22)
Income tax (5) (6)
SHARE OF NET INCOME (LOSS) FROM ASSOCIATES (8) (23)
* Figures have been adjusted as mentioned in Note 3.1.1 «Disposal of Gypsum Division operations» following the disposal operations of Gypsum activities and are therefore not
comparable with those presented in the 2010 Registration Document .
YEAR ENDED DECEMBER 31,
(million euros) 2011 2010
AT JANUARY 1, 422 335
Share of net income (loss) of associates * (8) (16)
Dividends received from associates (15) (11)
Acquisitions or share capital increases 155 148
Disposals and reduction in ownership percentage** (128) (14)
Other changes 178 (20)
AT DECEMBER 31, 604 422
* Of which (23) million euros related to the continuing operations in 2010.
** In 2011 mainly corresponds to the disposal of Gypsum activities .
Registration Document | 2011 | LafargeF36

F
CONSOLIDATED FINANCIAL STATEMENTSNote 14 Joint ventures
b) Summarized combined statement of financial position and statement of income information of associates
Combined statement of financial position information at 100%
Note 14 Joint ventures
The Group has several interests in joint ventures (see Note 35).
As of December 31, 2011, the joint ventures mainly relate to:
• Emirats Cement LLC, owned at 50% in United Arab Emirates;
• several joint ventures in Morocco for the Cement and Aggregates &
Concrete activities, owned at 35%;
• several joint ventures in China, notably: Lafarge Chongqing Cement
Co. Ltd. owned at 43.68%, Lafarge Dujiangyan Cement Company
Limited owned at 35.09% and Yunnan Shui On Building Materials
Investment Co. Ltd. owned at 44%;
• and other joint ventures in the Middle East for the Aggregates &
Concrete Division and in Bangladesh for the Cement Division.
As at December 31, 2010, the joint ventures included the investment in
Al Safwa company in Saudi Arabia which is accounted under the equity
method on December 31, 2011 (see Note 13) and also the investments
in Asia for the Gypsum Division disposed of in 2011 (see Note 3.1.1).
The following amounts are included in the Group’s financial statements
as a result of the proportionate consolidation of joint ventures:
Impact on the consolidated statement of income
AT DECEMBER,31
(million euros) 2011 2010
Non-current assets 2,652 1,413
Current assets 931 397
TOTAL ASSETS 3,583 1,810
Total equity 1,247 780
Non-current liabilities 1,304 640
Current liabilities 1,032 390
TOTAL EQUITY AND LIABILITIES 3,583 1,810
Combined statement of income information at 100%
YEARS ENDED DECEMBER 31,
(million euros) 2011 2010*
Revenue 732 554
Operating income before capital gains, impairment, restructuring and other 60 (7)
Operating income 65 6
Net income (loss) (23) (69)
* Figures have been adjusted as mentioned in Note 3.1.1 «Disposal of Gypsum Division operations» following the disposal operations of Gypsum activities and are therefore not
comparable with those presented in the 2010 Registration Document .
YEARS ENDED DECEMBER 31,
(million euros) 2011* 2010**
Revenue 1,093 1,024
Operating income before capital gains, impairment, restructuring and other 131 148
Operating income 127 135
Net income 50 93
* Including Al Safwa net income further to the change of consolidation method in December 2011 (see Note 13).
** Figures have been adjusted as mentioned in Note 3.1.1 «Disposal of Gypsum Division operations» following the disposal operations of Gypsum activities and are therefore not
comparable with those presented in the 2010 Registration Document .
F37Lafarge | Registration Document | 2011

FCONSOLIDATED FINANCIAL STATEMENTSNote 15 Other financial assets
Impact on the consolidated statement of financial position
AT DECEMBER 31,
(million euros) 2011 2010
Level 1 - -
Level 2 90 86
Level 3 219 233
AVAILABLE-FOR-SALE FINANCIAL ASSETS 309 319
Note 15 Other financial assets
Components of other financial assets are as follows:
AT DECEMBER 31,
(million euros) 2011 2010
Long-term loans and receivables 386 490
Available-for-sale financial assets 309 319
Prepaid pension assets 3 5
Restricted cash 57 49
TOTAL 755 863
a) Available-for-sale financial assets
Available-for-sale financial assets are equity interests in non-consolidated
companies.
The table below presents the split of the fair value between the three
levels of hierarchy:
• level 1: for equity securities listed on an active market, fair value is
quoted price;
• level 2: for equity securities not listed on an active market and for
which observable market data exist that the Group can use in order
to estimate the fair value;
• level 3: for equity securities not listed on an active market and for
which observable market data doesn’t exist in order to estimate the
fair value.
AT DECEMBER 31,
(million euros) 2011 2010
Non-current assets 2,076 2,599
Current assets 653 626
Non-current liabilities 313 389
Current liabilities 991 939
For the level 3 category, the reconciliation from the beginning balances to the ending balances presents as follows:
(million euros) 2011 2010
AT JANUARY 1, 233 196
Gains ( losses) in statement of income - -
Unrealized gains or losses in equity - -
Acquisitions 5 19
Other movements (including translation adjustments) (19) 18
Reclassification out of Level 3 - -
AT DECEMBER 31, 219 233
Registration Document | 2011 | LafargeF38
F
CONSOLIDATED FINANCIAL STATEMENTSNote 16 Inventories
b) Long-term loans and receivables
In 2010, the Group notably capitalized its long- term loan with an associate in Nigeria (United Cement Company Of Nigeria Limited) for an
amount of 132 million euros (see Note 13).
Note 16 Inventories
Components of inventories are as follows:
AT DECEMBER 31,
(million euros) 2011 2010
Raw materials 425 409
Work-in-progress 9 8
Finished and semi-finished goods 634 705
Maintenance and operating supplies 624 674
INVENTORIES CARRYING VALUE 1,692 1,796
Impairment losses (161) (149)
INVENTORIES 1,531 1,647
The depreciation primarily relates to maintenance and operating supplies for 110 million euros and 108 million euros at December 31, 2011,
and 2010, respectively.
The change in the inventories is as follows:
(million euros) 2011 2010
AT JANUARY 1, 1,647 1,702
Movement of the year 89 (97)
Scope effects and other changes (197) (65)
Translation adjustments (8) 107
AT DECEMBER 31, 1,531 1,647
Scope effects and other changes mainly include the disposal of Gypsum activities (see Note 3.1.1) and the reclassification as “Assets held for
sale” of Lafarge UK’s inventories.
F39Lafarge | Registration Document | 2011

FCONSOLIDATED FINANCIAL STATEMENTSNote 17 Trade receivables
Note 17 Trade receivables
The change in the valuation allowance for doubtful receivables is as follows:
(million euros) 2011 2010
AT JANUARY 1, (221) (193)
Current year addition (53) (69)
Current year release 12 24
Cancellation 16 25
Other changes 12 -
Translation adjustments - (8)
Reclassification as assets held for sale 1 -
AT DECEMBER 31, (233) (221)
Components of trade receivables are as follows:
AT DECEMBER 31,
(million euros) 2011 2010
Gross trade receivables and advances on trade payables 1,998 1,995
Valuation allowance (233) (221)
TRADE RECEIVABLES 1,765 1,774
Securitization programs
The Group entered into multi-year securitization agreements, with
respect to trade receivables:
• the first one implemented in France in January 2000 for Cement
activity, renewed twice, includes Aggregates and Concrete activities
since September 2009. This is a five-year program from June 2010;
• the second one implemented in September 2009 in North America
(United States and Canada) for a three-year period;
• the last one implemented in March 2010 both in Spain and
United Kingdom, also for a 5-year period, for some of the Cement,
Aggregates and Concrete activities of these two countries.
Under the programs, some of the French, North American, British
and Spanish subsidiaries agree to sell on a revolving basis, some
of their trade receivables. Under the terms of the arrangements,
the subsidiaries involved in these programs do not maintain control
over the assets sold and there is neither entitlement nor obligation to
repurchase the sold receivables. In these agreements, the purchaser
of the receivables, in order to secure his risk, only finances a part of
the acquired receivables as it is usually the case for similar commercial
transactions. As risks and benefits cannot be considered as being
all transferred, these programs do not qualify for derecognition of
receivables, and are therefore accounted for as secured financing.
Trade receivables therefore include sold receivables totaling
537 million euros and 680 million euros at December 31, 2011 and
2010, respectively.
The current portion of debt includes 404 million euros and
533 million euros at December 31, 2011 and 2010, respectively,
related to these programs.
The European securitization agreements are guaranteed by
subordinated deposits and units totaling 133 million euros and
147 million euros at December 31, 2011 and 2010, respectively.
Registration Document | 2011 | LafargeF40

F
CONSOLIDATED FINANCIAL STATEMENTSNote 20 Equity
Note 18 Other receivables
In 2011, “Other current receivables” mainly include:
• the receivables on disposals of assets and advances paid to
suppliers for an amount of 105 million euros (115 million euros at
December 31, 2010), including the short-term part of our receivable
on the 2009 disposal of our Cement activities in Venezuela for
17 million euros;
• the receivables from Group’s employees for 15 million euros
(15 million euros at December 31, 2010).
Note 19 Cash and cash equivalents
Cash and cash equivalents, amounting to 3,171 million euros at
December 31, 2011 (3,294 million euros at December 31, 2010),
include cash equivalents totaling up to 1,191 million euros at
December 31, 2011, mainly time deposits and short-term investments
(200 million euros at December 31, 2010) measured at their fair value.
Note 20 Equity
a) Common stock
At December 31, 2011, Lafarge common stock consisted of
287,247,518 shares with a nominal value of 4 euros per share.
At December 31, 2011, the total number of theoretical voting rights
attributable to the shares is 400,016,950 after inclusion of the double
voting rights attached to registered shares held for at least two years
in the name of the same shareholders.
b) Capital increase and decrease
In 2011, Lafarge launched a share capital increase reserved for Group’s
employees (see Note 3 and Note 21).
There was neither capital increase nor decrease in 2010.
c) Dividends
The following table indicates the dividend amount per share the
Group paid for the year 2010 as well as the dividend amount per
share for 2011 proposed by our Board of Directors for approval at the
Annual General Meeting of shareholders to be held on May 15, 2012.
Dividends on fully paid-up shares that have been held by the same
shareholders in registered form for at least two years are increased
by 10% over dividends paid on other shares. The number of shares
eligible for this increased dividend for a shareholder is limited to 0.5%
of all outstanding shares at the end of the fiscal year for which dividend
is paid.
Components of other receivables are as follows:
(euros, unless otherwise indicated) 2011 2010
Total dividend (MILLION) 145 *** 288
Base dividend per share 0.50* 1.00
Increased dividend per share** 0.55* 1.10
* Proposed dividend. As this dividend is subject to approval by shareholders at the Annual General Meeting, it has not been included as a liability in these financial statements as of
December 31, 2011.
** See Section 8.5 (Articles of Association (Statuts) - Rights, preferences and restrictions attached to shares) for an explanation of our “Loyalty dividend”.
*** Based on an estimation of the number of shares eligible for dividends of 287,014,070 shares.
AT DECEMBER 31,
(million euros) 2011 2010
Taxes 25 6 373
Prepaid expenses 108 131
Interest receivables 25 26
Other current receivables 46 9 441
OTHER RECEIVABLES 858 971
Current portion 824 971
Non-current portion 34 -
F41Lafarge | Registration Document | 2011

FCONSOLIDATED FINANCIAL STATEMENTSNote 20 Equity
d) Transactions on treasury shares
In 2011, the treasury shares decreased by 130,110 shares related to
the 2007 and 2009 performance stock plans which were vested and
delivered to the employees.
In 2010, the treasury shares decreased by 16,590 shares related to
the 2008 and 2009 performance stock plans which were vested and
delivered to the employees.
e) Other comprehensive income – part attributable to the owners of the parent company
The roll forward of other comprehensive income, for the part attributable
to the owners of the parent company, is as follows:
JANUARY 1, 2010
GAINS/(LOSSES) ARISING
DURING THE YEAR
RECYCLING TO STATEMENT
OF INCOMEDECEMBER 31,
2010
GAINS/(LOSSES) ARISING
DURING THE YEAR
RECYCLING TO STATEMENT
OF INCOME DECEMBER 31,
2011
Available-for-sale financial assets 160 10 (148) 22 (1) - 21
Gross value 169 10 (148) 31 - - 31
Deferred taxes (9) - - (9) (1) - (10)
Cash flow hedge instruments (42) - 8 (34) 3 2 (29)
Gross value (55) - 12 (43) (1) 3 (41)
Deferred taxes 13 - (4) 9 4 (1) 12
Actuarial gains/(losses) (488) (55) - (543) (200) - (743)
Gross value (661) (64) - (725) (345) - (1,070)
Deferred taxes 173 9 - 182 145 - 327
TOTAL OTHER RESERVES (370) (45) (140) (555) (198) 2 (751)
TOTAL FOREIGN CURRENCY TRANSLATION
ADJUSTMENTS (947) 1,078 (8) 123 (386) (17) (280)
TOTAL OTHER COMPREHENSIVE INCOME
(LOSS), NET OF INCOME TAX (1,317) 1,033 (148) (432) (584) (15) (1,031)
In 2010, the unrealized gain on the shares of Cimentos de Portugal (CIMPOR), which amounted to 148 million euros, was transferred to the
consolidated statement of income further to the sale of this asset .
f) Non controlling interests
At December 31, 2011, the non controlling interests amount to
2,197 million euros (2,080 million euros at December 31, 2010).
In 2010, the Group notably sold on the market a minority stake
representing 11.2% of interests in Lafarge Malayan Cement.
At December 31, 2011 and December 31, 2010, the Group’s significant
non controlling interests are Lafarge Cement Egypt (Egypt), Malayan
Cement Berhad (Malaysia), Jordan Cement Factories Company PSC
(Jordan), Lafarge Halla Cement Corporation (South Korea), West
African Portland Cement Company plc (Nigeria) and Bazian Cement
Company Ltd. (Iraq) .
g) Changes in ownership interests with no gain/loss of control
As at December 31, 2011, changes in ownership interest with no gain/
loss of control amount to 254 million euros, of which 350 million euros
related to the transaction with Strabag (Lafarge brought its cement
plants in Austria, in Czech Republic and in Slovenia in exchange of
Strabag’s contribution of its cement plant in Hungary).
As at December 31, 2010, changes in ownership interest with no gain/
loss of control amounted to 135 million euros, of which 141 million
euros related to the disposal of a non controlling stake in Malaysia as
stated above.
Registration Document | 2011 | LafargeF42

F
CONSOLIDATED FINANCIAL STATEMENTSNote 21 Share based payments
Note 21 Share based payments
a) Compensation expense for share based payments
The Group recorded a compensation expense for share based payments that is analyzed as follows:
C apital increase reserved for employees
The Group launched in 2011 a capital increase reserved for Group’s
employees, under the plan “Lafarge in Action”. Under the terms of the
plan, the employees and Corporate Officers eligible to the Employee
Lafarge Plan (“PEG”) were entitled to purchase a maximum of five
million shares at 4 euros each.
The purchase price was 36.98 euros, 20% less than the average of
Lafarge’s shares price over the last 20 days preceding the date the offer
was proposed. Additionally, depending on the country, bonuses are
paid on the first 15 purchased shares. The shares purchased cannot
be sold for a period of five years, except under specific circumstances.
The increase in capital resulting from this plan amounts to 3,174,956
euros by issuing 793,739 new shares.
A net expense of 8 million euros has been recognized on this plan in
full in 2011 as there are no vesting conditions attached to the shares:
• seven million euros related to the cash incentives;
• one million euros related to the compensation expense deducted
from the discount element.
Employee stock options plans and performance stock plans
The compensation cost recognized includes the fair value amortization
for all outstanding and non vested plans, including the plans granted
in 2011.
The expense related to share based payments is included in the
consolidated statement of income as follows:
YEARS ENDED DECEMBER 31,
(million euros) 2011 2010
Cost of sales 9 7
Selling and administrative expenses 16 13
COMPENSATION EXPENSE FOR SHARE BASED PAYMENTS 25 20
Total compensation cost related to non-vested and not yet recognized stock options plans, performance stock plans and SAR plans is 26 million
euros which will be recognized on a straight-line basis over the vesting period from 2012 to 2015.
b) Equity settled instruments
Stock option plans
Lafarge S.A. grants stock option plans and employee stock purchase
plans. Stock option plans offer options to purchase or subscribe shares
of the Group’s common stock to executives, senior management, and
other employees who have contributed significantly to the performance
of the Group. The option exercise price approximates market value on
the grant date. The options are vested four years and expire ten years
from the grant date.
YEARS ENDED DECEMBER 31,
(million euros) 2011 2010
Employee stock options 9 13
Employee share purchase plans 8 -
Performance stock plans 8 7
Stock appreciation rights (SAR) plans - -
COMPENSATION EXPENSE FOR SHARE BASED PAYMENTS 25 20
F43Lafarge | Registration Document | 2011

FCONSOLIDATED FINANCIAL STATEMENTSNote 21 Share based payments
Information relating to the Lafarge S.A. stock options granted is summarized as follows:
EXERCISE PRICE(euro) NUMBER OF OPTIONS OUTSTANDING
WEIGHTED AVERAGE REMAINING LIFE(months) NUMBER OF OPTIONS EXERCISABLE
87.98 428,406 5 428,406
64.38 318,577 11 318,577
57.00 1,108,341 23 1,108,341
61.19 746,956 35 746,956
62.78 1,345,793 47 1,345,793
84.42 885,918 53 885,918
110.77 568,660 65 568,660
96.18 774,270 75 -
30.74 704,930 88 -
51.30 861,307 99 -
44.50 767,905 111 -
8,511,063 5,402,651
FAIR VALUE OF OPTIONS GRANTED
The Group estimated the fair value of the options granted based on the following assumptions:
The expected dividend yield assumption is based on a prospective
approach, according to market expectations by 2012.
The expected volatility assumption has been determined based on
the observation of historical volatility over periods corresponding to the
expected average maturity of the options granted, partially smoothed
to eliminate extreme deviations and better reflect long-term trends.
2011 2010
OPTIONS
WEIGHTED AVERAGE EXERCISE PRICE
(euros) OPTIONS
WEIGHTED AVERAGE EXERCISE PRICE
(euros)
OPTIONS OUTSTANDING AT JANUARY 1, 9,113,828 69.47 8,358,955 72.01
Options granted 781,980 44.50 1,203,500 51.30
Options exercised - - (463) 57.00
Options cancelled and expired (1,384,745) 75.18 (448,164) 68.10
OPTIONS OUTSTANDING AT DECEMBER 31, 8,511,063 66.25 9,113,828 69.47
OPTIONS EXERCISABLE AT DECEMBER 31, 5,402,651 72.07 5,884,994 70.24
Weighted average share price for options
exercised during the year - 58.93
Weighted average share price at option grant
date (for options granted during the year) 45.25 53.93
Weighted average fair value of options granted
during the year 8.26 11.86
LAFARGE S.A. OPTIONS
Years ended December 31, 2011 2010
Expected dividend yield 3.5% 4.3%
Expected volatility of stock 30.4% 31.3%
Risk-free interest rate 3.2% 3.2%
Expected life of the options (years) 7.0 8.0
Information relating to the Lafarge S.A. stock options outstanding at December 31, 2011 is summarized as follows:
Registration Document | 2011 | LafargeF44

F
CONSOLIDATED FINANCIAL STATEMENTSNote 21 Share based payments
The Group assumes that the equivalent risk-free interest rate is the
closing market rate, on the last trading day of the year, for treasury bills
with maturity similar to the expected life of the options.
The Lafarge S.A. stock incentive plan was introduced on November 29,
1989. The Group assumes the estimated life of the outstanding option
agreements based upon the number of options historically exercised
and cancelled since the plan inception.
Performance stock plans
Lafarge set up a performance stock plan in 2011 and 2010. The shares
are granted to executives, senior management and other employees for
their contribution to the continuing success of the business. For French
resident employees, these shares will be issued following a three- year
vesting period after the grant date (two-year for the 2010 plan), but will
remain unavailable for an additional two- year period. For non-French
resident employees, the shares will be vested for four years.
Information relating to the Lafarge S.A. performance stock plans outstanding at each December 31, is summarized as follows:
The expected dividend yield assumption is based on a prospective
approach, according to market expectations by 2012.
A discount for post vesting transfer restriction has been applied on
shares granted to French resident employees for the three years
following the vesting date.
c) Cash-settled instruments
In 2007 and 2008, Lafarge granted certain U.S. employees equity
instruments settled in cash, called Stock Appreciation Rights plans
(SAR). SAR give the holder, for a period of 10 years after the grant
date, the right to receive a cash payment based on the increase in the
value of the Lafarge share from the time of the grant until the date of
exercise. The SAR strike price approximates market value on the grant
date. Right grants will vest at a rate of 25% each year starting on the
first anniversary of the grant.
(million euros) 2011 2010
SHARES OUTSTANDING AT JANUARY 1, 492,560 356,393
Shares granted 348,755 169,605
Shares cancelled (31,695) (16,848)
Shares definitely alloted (130,110) (16,590)
SHARES OUTSTANDING AT DECEMBER 31, 679,510 492,560
Weighted average share price at option grant date 45.25 53.93
The Group estimated the fair value of the performance stock plan granted in 2011 and 2010 based on the following assumptions:
YEARS ENDED DECEMBER 31,
2011 2010
Expected dividend yield 3.4% 4.1%
Post vesting transfer restriction discount 4.2% 3.8%
F45Lafarge | Registration Document | 2011

FCONSOLIDATED FINANCIAL STATEMENTSNote 21 Share based payments
Information relating to the Lafarge North America Inc. Stock Appreciation Rights plan outstanding at December 31 is summarized as follows:
The Group estimated at year-end the fair value of the Stock Appreciation Rights plan based on the following assumptions:
YEARS ENDED DECEMBER 31,
2011 2010
Expected dividend yield 4.0% 4.0%
Expected volatility of stock 24.7% 24.7%
Risk-free interest rate 4.0% 4.0%
Expected life of the SAR (years) 7.6 7.6
The expected dividend yield assumption is based on market
expectations.
The expected volatility assumption has been determined based on
the observation of historical volatility over periods corresponding to the
expected average maturity of the options granted, partially smoothed
to eliminate extreme deviations and to better reflect long-term trends.
The Group assumes that the equivalent risk-free interest rate is the
closing market rate, on the last trading day of the year, for treasury bills
with maturity similar to the expected life of the SAR.
2011 2010
SAR
WEIGHTED AVERAGE EXERCISE PRICE
(euros) SAR
WEIGHTED AVERAGE EXERCISE PRICE
(euros)
SAR OUTSTANDING AT JANUARY 1, 496,385 118.41 505,710 118.42
SAR revaluation 79,422 (16.06) - -
SAR granted - - - -
SAR exercised - - - -
SAR cancelled and expired (4,782) 91.29 (9,325) 119.03
SAR OUTSTANDING AT DECEMBER 31, 571,025 102.44 496,385 118.41
OPTIONS EXERCISABLE AT DECEMBER 31, 510,253 102.95 349,175 119.24
Weighted average share price for SAR
exercised during the year - -
Weighted average share price at SAR grant date - -
Weighted average fair value of SAR granted
during the year - -
Registration Document | 2011 | LafargeF46

F
CONSOLIDATED FINANCIAL STATEMENTSNote 22 Income tax
Note 22 Income tax a) Income Tax
The components of the income tax expense from continuing operations for the reporting periods are as follows:
YEARS ENDED DECEMBER 31,
(million euros) 2011 2010*
CURRENT INCOME TAX 453 528
Corporate income tax for the period 380 412
Adjustment recognized in the period for current tax of prior periods 2 (7)
Withholding tax on dividends 27 33
Other 44 90
DEFERRED INCOME TAX (21) (223)
Deferred taxes on origination or reversal of temporary differences and other movements (154) (130)
Reassessment of deferred tax assets 68 (81)
Adjustment recognized in the period for deferred tax of prior periods 19 (15)
Effect of changes in tax rates 46 3
INCOME TAX 432 305
* Figures have been adjusted as mentioned in Note 3.1.1 «Disposal of Gypsum Division operations» following the disposal operations of Gypsum activities and are therefore not
comparable with those presented in the 2010 Registration Document.
An analysis of the deferred tax expense (income) in respect of each temporary difference is presented in paragraph (b) “Change in deferred
tax assets and liabilities”.
Effective tax rate
The Group’s effective tax rate is based on income before tax from
continuing operations, excluding the share of net income (loss) of
associates, namely 684 million euros for 2011 and 1,422 million euros
for 2010.
For the years ended December 31, 2011 and 2010, the Group’s effective
tax rate is reconciled to the same tax rate of 34.43%. This rate elected
by the Group does not take into account the additional contribution of
5% as enacted in France on December 28, 2011 by the Loi de Finances
2011, based on the following grounds: i) the French tax group is not
tax payer in 2011; ii) this contribution is a temporary measure; iii) the
impact of the additional contribution on French deferred taxes positions
that will be reversed in 2012 is deemed to be not material at Group level.
The reconciliation is as follows:
YEARS ENDED DECEMBER 31,
(%) 2011 2010*
Statutory tax rate 34.4 34.4
Effect of foreign tax rate differentials (20.2) (14.3)
Withholding taxes and other costs on dividends and service and royalties fees 9.8 4.4
Changes in enacted tax rates 6.7 0.3
Capital gains taxed at a different rate 6.2 (4.4)
Impact of impairment loss on goodwill and other assets 16.2 1.4
Non recognition of deferred tax assets and provisions for tax exposure 14.3 7.8
Other (4.2) (8.2)
EFFECTIVE TAX RATE 63.2 21.4
* Figures have been adjusted as mentioned in Note 3.1.1 «Disposal of Gypsum Division operations» following the disposal operations of Gypsum activities and are therefore not
comparable with those presented in the 2010 Registration Document.
The effect of foreign tax rate differentials, withholding taxes and other
costs on dividends remains consistent in value as compared to last
year but has a relative impact more significant on the effective tax rate
in 2011 as a result of the decrease in taxable result.
The effective tax rate is negatively impacted for 14.7% by the
non-deductibility of goodwill impairment loss which amounted to 292
million euros in 2011.
The Group has accounted for an additional deferred tax charge of 46
million euros as a result of the re-measurement of the relevant deferred
tax balances following the change in the corporation tax rate in Egypt
from 20% to 25% as at January 1, 2011. The negative impact on
effective tax rate amounted to 6.7 % as shown on the caption " changes
in enacted tax rates" .
North American assets' disposals generated a taxable result higher than
the accounting result which has been allocated to the North American
tax group's activated losses and an associated tax charge amounting to
59 million euros in 2011: it negatively impacted the effective tax rate for
7.2% as shown on the caption " capital gains taxed at a different rate" .
Furthermore, the Group has recorded a valuation allowance on certain
deferred tax assets on tax loss carry forwards along with tax assets
relating to taxable temporary differences following the reassessment
of the recoverability of these assets and in order to cover the risks
associated with the contingent impacts of ongoing tax audits. This
negatively impacted the effective tax rate for 14.3%. This is presented
in paragraph c).
F47Lafarge | Registration Document | 2011

FCONSOLIDATED FINANCIAL STATEMENTSNote 22 Income tax
b) Change in deferred tax assets and liabilities
The movements in net deferred tax (from a net liability of 579 million euros as at December 31, 2009 to a net liability of 382 million euros
as at December 31, 2010 and to a net liability of 129 million euros as at December 31, 2011) as presented in the consolidated statement of
financial position are as follows:
NET DEFERRED TAXES POSITIONS
(million euros)
JANUARY 1, 2010
EXPENSE (INCOME)*
(CREDIT) CHARGE TO OTHER
COMPREHENSIVE INCOME
SCOPE EFFECTS
OTHER CHANGES
TRANSLATION ADJUSTMENTS
DECEMBER 31, 2010
Pensions and other post-retirement benefits (355 ) 31 (22 ) - (17) (23 ) (386 )
Property, plant and equipment 1,419 (11) - - (1) 73 1,480
Net operating loss and tax credit carry forwards (784) (336 ) (20) - (47) (25 ) (1,212 )
Net capital loss carry forwards (370 ) 63 - - 43 (9 ) (273 )
Valuation allowance 703 120 11 - 7 2 1 862
Provisions, current liabilities and others, net (34 ) (106) 26 - 28 (3) (89 )
TOTAL 579 (239 ) (5 ) - 13 34 382
*: Of wich (223) million euros related to continuing operations in 2010
In 2011, in addition to the income tax charged to the consolidated
statement of income, a net deferred tax income of 148 million euros
was recognized in other comprehensive income, mostly composed
of a 101 million euros deferred tax income relating to actuarial gains
and losses and of a 47 million euros income deriving from a reversal of
valuation allowance recognized in prior periods on deferred tax assets
through other comprehensive income.
Scope effects are mainly related to the disposal of the Group’s Gypsum
activities in Europe, South America and Asia.
c) Tax loss and capital loss carry forwards
At December 31, 2011, the Group has net operating loss (NOL) and tax credit carry forwards of approximately 4,342 million euros, and capital
loss carry forwards of 1,026 million euros, which will expire as follows:
(million euros)NOL AND TAX CREDITS
CARRY FORWARDSLONG-TERM CAPITAL LOSS
CARRY FORWARDS TOTAL
2012 24 1 25
2013 34 - 34
2014 58 - 58
2015 55 - 55
2016 and thereafter 4,171 1,025 5,196
TOTAL 4,342 1,026 5,368
NET DEFERRED TAXES POSITIONS
(million euros) JANUARY 1,
2011 EXPENSE (INCOME)
(CREDIT) CHARGE TO OTHER
COMPREHENSIVE INCOME
SCOPE EFFECTS
OTHER CHANGES
TRANSLATION ADJUSTMENTS
DECEMBER 31, 2011
Pensions and other post-retirement benefits (386) 34 (101 ) 4 2 (10) (457)
Property, plant and equipment 1,480 77 - (35) 62 (24) 1,560
Net operating loss and tax credit carry forwards (1,212) (215) - (15) 3 (9) (1,448)
Net capital loss carry forwards (273) 20 - 1 2 (7) (257)
Valuation allowance 862 11 (47 ) (1) (4) 11 832
Provisions, current liabilities and others, net (89) 52 - (11) (60) 7 (101 )
TOTAL 382 (21) (148 ) (57) 5 (32) 129
Registration Document | 2011 | LafargeF48

F
CONSOLIDATED FINANCIAL STATEMENTSNote 23 Pension plans, termination benefits and other post-employment benefits
Deferred tax assets have been recognized on all tax losses and a
valuation allowance has been recorded when it is not probable that
such deferred tax assets will be recoverable in a foreseeable future
or when tax losses are uncertain to be used due to risks of differing
interpretations with regard to the application of tax legislation.
The analyses performed, based on the most recent forecasts approved
by the management, consistent with the Group’s last strategic review
and the Group’s budget for next year concludes that it is probable
that such assets will be recoverable in a foreseeable future, notably in
France, North America and Spain where these net assets amount to
647 million euros as at December 31, 2011. Net deferred tax assets
as presented on the consolidated statement of financial position as at
December 31, 2011, based on the most reasonable estimate of taxable
results should be recoverable within approximately 8 to 12 years.
In 2010, the deferred tax assets on the French tax loss carry forwards,
along with tax assets relating to taxable temporary differences had
been depreciated to limit their amount to the amounts of deferred
tax liabilities of the French tax Group, since the recoverability of these
assets in a foreseeable future was not assured considering notably the
structure of the Group’s indebtedness. In 2011, in view of the action
plans implemented to reduce the level of indebtedness at Group level
and of the French tax group, the deferred tax assets on the French tax
loss carry forwards, along with tax assets relating to taxable temporary
differences, have been recognized for an amount corresponding to the
losses generated during the year.
d) Tax audits
The fiscal year ended December 31, 2011 and prior years are open to
tax audits by the respective tax authorities in the jurisdictions in which
the Group has or had operations. Various tax authorities have proposed
or levied adjustments for additional tax in respect of prior years.
In jurisdictions where notices of adjustments have been received,
the Group has challenged almost all of the proposed assessments
and is proceeding with discussions with relevant tax authorities under
applicable rules.
As at December 31, 2011, the Group has covered its most reasonable
estimate of the charge which may ultimately result from such tax audits
considering notably the technical merits of its positions and the possible
settlements in certain countries.
The Group regularly reviews the assessment of such risk taking into
account the evolution of audits and disputes.
Note 23 Pension plans, termination benefits and other post- employ ment benefits
The Group sponsors both defined benefit and defined contribution
plans, in accordance with local legal requirements and each specific
subsidiary benefit policies.
For defined contribution plans, the Group’s obligations are limited to
periodic payments to third party organizations, which are responsible
for the financial and administrative management of the funds. The
pension costs of these plans, corresponding to the contribution
paid, are charged in the consolidated statement of income . The total
contribution paid in 2011 and 2010 (excluding mandatory social
security plans organized at state level) for continuing operations is 33
million euros and 30 million euros, respectively.
Only defined benefit plans create future obligations for the Group.
Defined benefit pension plans and termination benefits constitute 93%
of the Group’s post-employ ment obligations. The remaining 7% relates
to other post-employment benefits, mainly post-employment medical
plans. For these plans, the Group’s obligations are estimated with the
assistance of independent actuaries using assumptions, which may
vary over time. The obligations related to these plans are often funded
through Group and employee contributions to third party legal entities,
which investments are subject to fluctuations in the financial markets.
These entities are usually administered by trustees representing both
employees and employer.
Based on specific studies conducted by external experts, each Board
of Trustees determines an appropriate investment strategy, typically
designed to maximize asset and liability matching and limit investment
risk by an appropriate diversification. The implementation of this
investment strategy is conditioned by market opportunities and is
usually conducted by external asset managers selected by trustees.
Assets are mostly invested in listed instruments (shares, bonds) with
limited use of derivatives or alternative asset classes. These entities do
not hold any instrument issued by the Group.
The following table shows the asset allocation of the most significant funded plans of the Group located in the United Kingdom and North America:
(%)
NORTH AMERICA UNITED KINGDOM
2011 2010 2011 2010
Equity 59 68 46 53
Bonds 40 32 45 40
Other 1 - 9 7
TOTAL 100 100 100 100
F49Lafarge | Registration Document | 2011

FCONSOLIDATED FINANCIAL STATEMENTSNote 23 Pension plans, termination benefits and other post-employment benefits
The following table shows the accounting treatment for defined benefit pension plans and termination benefits under the column “pension
benefits” and the accounting treatment for other post-employ ment benefits under the column “other benefits”.
AT DECEMBER 31,
(million euros)
PENSION BENEFITS OTHER BENEFITS TOTAL
2011 2010 2011 2010 2011 2010
COMPONENTS OF NET PERIODIC PENSION COST
Service cost 79 76 8 8 87 84
Interest cost 236 244 16 19 252 263
Expected return on plan assets (249) (236) - - (249) (236)
Amortization of past service cost 7 (16) (1) (6) 6 (22)
Special termination benefits 24 51 2 2 26 53
Curtailment (gain) (79) (5) 2 - (77) (5)
Settlement loss - 1 - - - 1
NET PERIODIC PENSION COST 18 115 27 23 45 138
CHANGE IN DEFINED BENEFIT OBLIGATION
DEFINED BENEFIT OBLIGATION AT JANUARY 1, 4,568 4,117 326 282 4,894 4,399
Service cost 79 76 8 8 87 84
Interest cost 236 244 16 19 252 263
Employee contributions 6 8 2 3 8 11
Plan amendments 11 (17) (4) (6) 7 (23)
Curtailments* (79) (5) 2 - (77) (5)
Settlements (9) - - - (9) -
Business combinations/Divestitures (28) (44) - - (28) (44)
Special termination benefits 24 51 2 2 26 53
Benefits paid (278) (314) (19) (20) (297) (334)
Actuarial (gain) loss related to change in assumptions 231 239 24 1 255 240
Actuarial (gain) loss related to experience effect 62 3 - 10 62 13
Foreign currency translations 124 210 8 27 132 237
DEFINED BENEFIT OBLIGATION AT DECEMBER 31, 4,947 4,568 365 326 5,312 4,894
* Including the effect of freezing the UK pension plan for 66 million euros (see Note 23 (a)).
Registration Document | 2011 | LafargeF50

F
CONSOLIDATED FINANCIAL STATEMENTSNote 23 Pension plans, termination benefits and other post-employment benefits
AT DECEMBER 31,
(million euros)
PENSION BENEFITS OTHER BENEFITS TOTAL
2011 2010 2011 2010 2011 2010
CHANGE IN PLAN ASSETS
FAIR VALUE OF PLAN ASSETS AT JANUARY 1, 3,654 3,236 - - 3,654 3,236
Expected return on plan assets 249 236 - - 249 236
Actuarial gains/(losses) related to experience effect (29) 185 - - (29) 185
Employer contributions* 113 85 - - 113 85
Employee contributions 6 8 - - 6 8
Benefits paid (223) (208) - - (223) (208)
Settlements (9) - - - (9) -
Business combinations/Divestitures (9) (53) - - (9) (53)
Foreign currency translations 103 165 - - 103 165
FAIR VALUE OF PLAN ASSETS AT DECEMBER 31, 3,855 3,654 - - 3,855 3,654
Actual return on plan assets 220 421 - - 220 421
RECONCILIATION OF PREPAID (ACCRUED) BENEFIT COST
Defined benefit obligation 4,947 4,568 365 326 5,312 4,894
Fair value of plan assets 3,855 3,654 - - 3,855 3,654
FUNDED STATUS OF THE PLAN (1,092) (914) (365) (326) (1,457) (1,240)
Unrecognized actuarial past service cost 8 6 (6) (3) 2 3
Unrecognized asset due to asset ceiling limitations (4) (5) - - (4) (5)
PREPAID (ACCRUED) PENSION COST AT DECEMBER 31, (1,088) (913) (371) (329) (1,459) (1,242)
Of which Other financial assets 3 5 - - 3 5
Of which Pension and other employee benefits (1,091) (918) (371) (329) (1,462) (1,247)
* Of which exceptional contributions to the UK pension plan of 12 million British pounds in 2010 and in 2011 (see Note 23(a)).
Amounts recognized in equity are presented in the table below (before tax, non-controlling interests and after translation adjustments):
The Group did not recognize any reimbursement right as an asset for the years presented.
The defined benefit obligation disclosed in the table above arises from:
(million euros)
PENSION BENEFITS OTHER BENEFITS TOTAL
2011 2010 2011 2010 2011 2010
STOCK OF ACTUARIAL GAINS/(LOSSES) RECOGNIZED
AT DECEMBER 31, (1,109) (757) (35) (4) (1,144) (760)
AMOUNTS RECOGNIZED IN THE PERIOD (321) (54) (24) (10) (345) (64)
Of which Actuarial gains/(losses) (322) (52) (24) (10) (346) (62)
Of which Asset ceiling impact 1 (2) - - 1 (2)
AT DECEMBER 31,
(million euros) 2011 2010 2009 2008 2007
Plans wholly unfunded 905 865 770 699 630
Plans wholly or partially funded 4,407 4,028 3,629 3,051 4,140
TOTAL DEFINED BENEFIT OBLIGATION 5,312 4,894 4,399 3,750 4,770
Actuarial (g ains)/l osses related to experience effect 63 13 ( 179) 83 112
Actuarial (g ains)/l osses in % of obligation at December 31, 1% 0% (4%) 2% 2%
TOTAL FAIR VALUE OF PLAN ASSETS 3,855 3,654 3,236 2,761 4,148
G ains /(l osses) related to experience effect (29) 185 233 (839) (26)
G ains/ (l osses) in % of fair value of asset at December 31, (1%) 5% 7% (30%) (1%)
F51Lafarge | Registration Document | 2011
FCONSOLIDATED FINANCIAL STATEMENTSNote 23 Pension plans, termination benefits and other post-employment benefits
The primary assumptions made to account for pensions and termination benefits are as follows:
The expected rates of investment return on pension assets and the
discount rates used to calculate the Group’s pension related obligations
are established in close consultation with independent advisors.
The expected long-term rate of investment return on pension plan
assets is based on historical performance, current and long-term
outlook and the asset mix in the pension trust funds. The impact of
decreasing the expected rate of return on assets by one percentage
point for 2011 for the most significant benefits plans located in the
United Kingdom and North America would have been to increase
the net periodic pension expense by approximately 35 million euros.
Discount rates reflect the rate of long-term high-grade corporate
bonds. They are selected based on external indexes (such as the
iboxx index in the UK for instance), usually considered as references for
discounting pension obligations. The Group was specifically attentive to
the relevance of those indexes. The impact of decreasing the discount
rate assumption by one percentage point at December 31, 2011 for
the valuation of the most significant benefit plans located in the United
Kingdom and North America would have been to increase the total
benefit obligation by approximately 735 million euros.
For the fiscal year 2012, the expected return rates on assets are as
follows:
United States 7.50
Canada 7.25
United Kingdom 7.00
Euro zone 4.30
a) Pension plans
The main defined benefit pension plans provided to employees by
the Group are mainly in the United Kingdom and North America (The
United States of America and Canada). The related pension obligations
represent 54% and 35%, respectively, of the Group’s total defined
benefit plan obligations.
In the United Kingdom, pension related obligations are principally
administered through a unique pension fund, governed by an
independent board. In October 2011, vested rights (based on salary and
years of service within the Group) have been frozen: active members
of the scheme will no more acquire rights in the defined benefit plan.
If needed, the plan will be funded by employer contributions based on
rates determined, within the framework of the UK pension regulation
every three years, based on plan valuation made by independent
actuaries. Funding of the obligation is based upon both local minimum
funding requirements as well as long term funding objectives to settle
the future statutory pension obligations. Based on the funding situation
of the plan every end of June, an additional contribution of 12 million
British pounds can be called in 2012, as it was in 2011. At the end
of 2011, approximately 46% of the pension fund assets are invested
in equity instruments, which is consistent with the long-term nature
of the pension obligations, approximately 45% are invested in bond
portfolios and 9% in cash instruments and real estate.
In the United States and Canada, defined pension benefits are granted
through various plans. Contributions are based upon required amounts
to fund the various plans as well as tax-deductible minimum and
maximum amounts. Group obligations granted through these funds
are currently managed to limit further accruals of rights by closing some
funds to new entrants and to optimize administrative and management
costs and processes by merging some of them. At the end of 2011,
59% of the pension fund assets were invested in equity instruments
40% in bond portfolios and 1% in cash instruments and real estate.
Required employer contributions in 2012 are expected to be 155
million U.S. dollars.
b) Termination benefits
Termination benefits are generally lump sum payments based upon an
individual’s years of credited service and annual salary at retirement
or termination of employment. The primary obligations for termination
benefits are in France, Greece and Korea. In France, the pension
reform in November 2010 did not impact significantly the obligation.
% UNITED STATES CANADA UNITED KINGDOM EURO ZONE
2011
Discount rate at December 31, 4.50 4.60 4.70 4.30
Salary increase at December 31, 4.00 3.50 n/a 2.50 to 4.00
Expected return on assets at January 1 7.75 7.5 6.9 4.75
2010
Discount rate at December 31, 5.30 5.10 5.40 4.75
Salary increase at December 31, 4.00 4.50 4.90 2.50 à 4.00
Expected return rate on assets at January 1, 8.00 7.75 7.00 4.75 à 5.25
Registration Document | 2011 | LafargeF52

F
CONSOLIDATED FINANCIAL STATEMENTSNote 24 Provisions
c) Other post-employ ment benefits
In North America, and to a lesser extent in France, in Jordan and in
Brazil, certain subsidiaries provide healthcare and insurance benefits
to retired employees. These obligations are unfunded, but the federal
subsidies expected in the coming years in the United States (Medicare
Act) have significantly reduced Group obligations. The health care
reform in the United States did not lead to significant impact on the
obligation of the U.S. plans.
In North America, the assumed healthcare cost trend rate used in
measuring the accumulated post-employ ment benefit obligation differs
between U.S. and Canadian plans. At the end of 2011, the rate used
was 8% in the U.S. plan, decreasing to 5% in 2019, and 7.6% in the
Canadian plan, decreasing to 5% in 2018.
At the end of 2010, the rate used was 8% in the U.S. plan, decreasing
to 5% in 2017, and 8% in the Canadian plan, decreasing to 5% in
2018.
Assumed healthcare costs trend rates have a significant effect on the amounts reported for the healthcare plans. A one-percentage-point
increase or decrease in assumed healthcare cost trend rates would have the following effects:
Note 24 Provisions
(million euros)RESTRUCTURING
PROVISIONS
SITE RESTORATION AND ENVIRONMENTAL
PROVISIONS OTHER PROVISIONS TOTAL
AT JANUARY 1, 2010 74 229 772 1,075
Current year addition* 40 33 142 215
Current year release* (60) (25) (396) (481)
Cancellation* (4) (4) (71) (79)
Other changes 1 5 8 14
Translation adjustments 4 13 18 35
AT DECEMBER 31, 2010 55 251 473 779
Current portion 146
Non-current portion 633
AT JANUARY 1, 2011 55 251 473 779
Current year addition 20 39 120 179
Current year release (18) (26) (64) (108)
Cancellation (1 ) (4 ) (36 ) (41 )
Other changes (16) (43) 15 (44)
Translation adjustments - 1 (4) (3)
AT DECEMBER 31, 2011 40 218 504 762
Current portion 125
Non-current portion 637
* Of which 202 million euros of addition, (475 ) million euros of release and (41) million euros of cancellation related to the continuing operations in 2010.
ONE-PERCENTAGE-POINT
(million euros) INCREASE DECREASE
Increase (decrease) in defined benefit obligation at December 31, 2011 37 (31)
Increase (decrease) in the total of service and interest cost components for 2011 3 (3)
The restructuring provisions mainly include the employee termination
benefits, the contract termination costs and other restructuring costs.
Other provisions include:
• the provisions for competition litigation, mainly comprised of the
competition litigations in South Africa (accrued in 2011) and in
Germany. S ee Note 29 Legal and arbitration proceedings. The
variation in 2010 essentially relates to the reversal of the provision
relating to the Gypsum competition litigation further to the fine
payment of 338 million euros in July 2010;
• insurance and re-insurance reserves for an amount of 111 million
euros at December 31, 2011 (107 million euros at December 31,
2010).
F53Lafarge | Registration Document | 2011

FCONSOLIDATED FINANCIAL STATEMENTSNote 25 Debt
Note 25 Debt
D ebt breakdown is as follows:
Debenture loans and other notes
The Group has a Euro Medium-Term Note (EMTN) program, which
allows for a maximum issuable amount of 12,000 million euros. At
December 31, 2011, 8,748 million euros had been issued under the
EMTN program, including 8,135 million euros of debenture loans
and 613 million euros of private placements included under “Other
notes”. The weighted average interest rate of EMTN issues is 6.7%
with maturities ranging from 2012 to 2020.
At December 31, 2011, debenture loans consist of bonds issued
mainly in euros, U.S. dollars and British pounds with a weighted
average interest rate of 6.7% (6.1% at December 31, 2010). Their
maturities range from 2012 to 2036, with an average maturity of 5
years and 5 months.
Other notes mainly consist of notes denominated in euros and in U.S.
dollars with a weighted average interest rate of 7.1% at December 31,
2011 (6.3% at December 31, 2010).
AT DECEMBER 31,
(million euros) 2011 2010
Debenture loans 10,384 11,323
Bank loans and credit lines 3,442 3,591
Commercial paper 57 724
Other notes 688 688
Other debt 487 687
TOTAL DEBT EXCLUDING PUT OPTIONS ON SHARES OF SUBSIDIARIES 15,058 17,013
AT DECEMBER 31,
(million euros) 2011 2010
Long-term debt excluding put options on shares of subsidiaries 12,216 14,033
Put options on shares of subsidiaries, long-term 50 63
LONG-TERM DEBT 12,266 14,096
Short-term debt and current portion of long-term debt excluding put options on shares
of subsidiaries 2,842 2,980
Put options on shares of subsidiaries, short-term 98 204
SHORT-TERM DEBT AND CURRENT PORTION OF LONG-TERM DEBT 2,940 3,184
Total debt excluding put options on shares of subsidiaries 15,058 17,013
Total put options on shares of subsidiaries 148 267
TOTAL DEBT 15,206 17,280
a) Analysis of debt excluding put options on shares of subsidiaries by type of financing
Registration Document | 2011 | LafargeF54

F
CONSOLIDATED FINANCIAL STATEMENTSNote 25 Debt
Bank loans
At December 31, 2011, bank loans total 2,661 million euros and
are primarily comprised of loans to Group subsidiaries in their local
currencies.
The weighted average interest rate on these bank loans is 5.9% at
December 31, 2011 (5.8% at December 31, 2010).
Committed long and medium-term credit lines
Drawdowns on long and medium-term committed credit lines amount
to 13 million euros (excluding the acquisition credit facility) out of
a maximum amount available of 4,023 million euros equivalent at
December 31, 2011 (including 3,973 million euros at Lafarge S.A. level
which are fully undrawn). The average interest rate of these drawdowns,
fully denominated in Egyptian pounds, is 11% at December 31, 2011.
The credit lines are used primarily as a back-up for the short-term
financings of the Group and contribute to the Group’s liquidity. The
average non-utilization fee of these credit lines stands at 63 basis
points at December 31, 2011 (46 basis points at December 31, 2010).
The outstanding amount of the three remaining tranches of the
Orascom Cement acquisition credit facility put in place on December
9, 2007 did not change during 2011 and therefore still stands at 768
million euros. The average interest rate on these drawdowns is 2.0%
at December 31, 2011 (1.5% at December 31, 2010).
Commercial paper
The Group’s euro denominated commercial paper program at
December 31, 2011 allows for a maximum issuable amount of 3,000
million euros. Commercial paper can be issued in euros, U.S. dollars,
Canadian dollars, Swiss francs or British pounds. At December 31,
2011, commercial paper issued under this program totaled 57 million
euros. This commercial paper bears an average interest rate close to
the European inter-bank offer rate (“Euribor”) for maturities generally
ranging from 1 to 6 months. As of December 31, 2011, the weighted
average interest rate of the euro denominated commercial paper is
2.0% (1.1% at December 31, 2010).
b) Analysis of debt excluding put options on shares of subsidiaries by maturity
At December 31, 2011, 57 million euros of short-term debt have been
classified as long-term based upon the Group’s ability to refinance these
obligations on a medium and long-term basis through its committed
credit facilities.
The short-term debt that the Group can refinance on a medium and
long-term basis through its committed credit facilities is classified in the
statement of financial position under the section “Long-term debt”. The
net variation of this short-term debt is shown in the cash flow statement
in “proceeds from issuance of long-term debt” when it is positive, and
in “repayment of long-term debt” when it is negative. At December 31,
2011, the net variation of this debt amounted to a decrease of
667 million euros (compared to a decrease of 212 million euros at
December 31, 2010).
AT DECEMBER 31,
(million euros) 2011
2012 H1 1,215
2012 H2 1,627
2013 1,802
2014 1,990
2015 1,368
2016 2,187
Beyond 5 years 4,869
TOTAL DEBT EXCLUDING PUT OPTIONS ON SHARE OF SUBSIDIARIES 15,058
This repayment schedule results from the schedules of group’s loan contracts, without any discount rate nor netting.
F55Lafarge | Registration Document | 2011

FCONSOLIDATED FINANCIAL STATEMENTSNote 25 Debt
c) Analysis of debt excluding put options on shares of subsidiaries by currency
The average spot interest rate of the debt after swaps, as at December
31, 2011, is 6.2% (5.5% as at December 31, 2010). The average
interest rate on net debt after swaps in 2011 is 6.3% (5.8% in 2010).
Most of the increase of the interest rate on gross debt comes from the
triggering of "step-up" clauses included in our bonds issued since 2009.
These clauses have been progressively triggered in 2011 following our
credit rating downgrade by Standard & Poor’s (March 17, 2011) and
Moody’s (August 5, 2011).
e) Particular clauses in financing contracts
Financial covenants
At December 31, 2011, Lafarge S.A. loan contracts do not required
any financial covenants.
Loan contracts requiring compliance with certain financial covenants
existed in some of our subsidiaries. These subsidiaries are located
in the following countries: Bangladesh, China, Ecuador, India,
Jordan, Nigeria, Qatar, Syria, United Arab Emirates, United Kingdom,
Vietnam and Pakistan. Debt with such financial covenants represents
approximately 6% of the total Group debt excluding put options on
shares of subsidiaries at December 31, 2011. For most of them, they
have a low probability of being triggered. Our agreements and those of
our subsidiaries also include cross-acceleration clauses. If we, or under
certain conditions, our material subsidiaries, fail to comply with our or
their covenants, then our lenders could declare default and accelerate
a significant part of our indebtedness.
Given the split of these contracts on various subsidiaries and the quality
of the Group liquidity protection through its access to committed credit
lines, the existence of such clauses cannot materially affect the Group’s
financial situation.
The other loan contracts do not require any compliance with certain
financial covenants.
Change of control clauses
Change of control clauses are included in the acquisition credit facility
dedicated to the acquisition of Orascom Cement and in several of
the Group’s committed credit facilities contracts, which amount to
4,740 million euros, i.e. 100% of the total outstanding credit facilities
contracted at parent company level. As a consequence, in the event
of a change in control, these facilities will be automatically cancelled if
undrawn or, if drawn upon, will require immediate repayment. Change
of control clauses are also included in some debenture loans and
private placements issued under the EMTN program, which amount
to 6,301 million euros. In case of a change in control, the holders of
these notes would be entitled, under certain conditions, to request
their repayment.
f) Put options on shares of subsidiaries
As part of the acquisition process of certain entities, the Group has
granted third party shareholders the option to require the Group to
purchase their shares at predetermined conditions. These shareholders
are either international institutions, such as the European Bank for
Reconstruction and Development, or private investors, which are
essentially financial or industrial investors or former shareholders of
AT DECEMBER 31, 2011 2010
(million euros) BEFORE SWAPS AFTER SWAPS BEFORE SWAPS AFTER SWAPS
Euro (EUR) 9,597 10,896 10,836 10,467
U.S. dollar (USD) 2,487 1,998 3,068 3,999
British pound (GBP) 1,589 710 1,543 830
Chinese yuan (CNY) 588 588 434 434
Indian rupee (INR) 22 151 52 189
Nigerian naira (NGN) 215 215 104 104
Other 560 500 976 990
TOTAL 15,058 15,058 17,013 17,013
d) Analysis of debt excluding put options on shares of subsidiaries by category and type of interest rate
AT DECEMBER 31, 2011 2010
(million euros) BEFORE SWAPS AFTER SWAPS BEFORE SWAPS AFTER SWAPS
Floating rate 3,561 4,971 4,455 5,723
Fixed rate below 6% 3,111 1,559 6,544 5,150
Fixed rate between 6% and 10% 7,652 7,794 5,831 5,957
Fixed rate 10% and over 734 734 183 183
TOTAL 15,058 15,058 17,013 17,013
Registration Document | 2011 | LafargeF56

F
CONSOLIDATED FINANCIAL STATEMENTSNote 26 Financial instruments
the acquired entities. Assuming that all of these options were exercised,
the purchase price to be paid by the Group, including debt and
cash acquired, would amount to 162 euros at December 31, 2011
(283 million euros at December 31, 2010).
Out of the outstanding put option at year-end 2011, 113 million euros
can be exercised in 2012. The remaining 49 million euros can be
exercised for part starting 2014 and for part starting 2015.
P ut options granted to non controlling interests of subsidiaries are
classified as debt of the Group. Out of the total options granted by the
Group, the options granted to non controlling interests amounted to
148 million euros and 267 million euros at December 31, 2011 and
December 31, 2010, respectively, the remaining options were granted
on shares of joint ventures.
The debt decrease related to put options granted to non controlling
interests of subsidiaries is mainly due to the acquisition of additional
interests mentioned in Note 3.2.
The goodwill resulting from put options granted to non controlling
interests amounts to 71 million euros and 128 million euros at
December 31, 2011, and December 31, 2010, respectively .
Put options on shares of joint ventures are presented in Note 28 (c)
as “C ommitments related to scope of consolidation”.
Note 26 Financial instruments
a) Designation of derivative instruments for hedge accounting
The Group uses derivative financial instruments to manage market
risk exposures. Such instruments are entered into by the Group
solely to hedge such exposures on anticipated transactions or firm
commitments. The Group does not enter into derivative contracts for
speculative purposes.
Certain derivative instruments are designated as hedging instruments
in a cash flow or fair value hedge relationship in accordance with IAS
39 criteria.
Other derivatives, which are not documented under IAS 39 as it would
translate into an unfavorable cost-benefit ratio, are not designated
as hedges for accounting purposes. Changes in fair value of these
derivatives are recorded directly in the consolidated statement of
income , as required by IAS 39.
F57Lafarge | Registration Document | 2011

FCONSOLIDATED FINANCIAL STATEMENTSNote 26 Financial instruments
b) Fair values
The following details the cost and fair values of financial instruments:
FINANCIAL INSTRUMENTS IN THE CONSOLIDATED STATEMENT OF FINANCIAL POSITION
AT DECEMBER 31,
IAS 39 CATEGORYFAIR VALUE CATEGORY
2011 2010
CARRYING AMOUNT
NET FAIR VALUE
CARRYING AMOUNT
NET FAIR VALUE(million euros)
ASSETS
Cash and cash equivalents
Financial assets at fair value through profit and
loss Lev 1, 2* 3,171 3,171 3,294 3,294
Trade receivables Loans and Receivables at amortized cost 1,765 1,765 1,774 1,774
Other receivables Loans and Receivables at amortized cost 858 858 971 971
Other financial assets 755 755 863 863
Held-to-maturity financial assets Held-to-maturity financial assets at amortized cost - - - -
Available-for-sale financial assets Available-for-sale financial assets at fair value
recognized in equity
See
Note 15 309 309 319 319
Long-term loans and receivables Loans and Receivables at amortized cost 386 386 490 490
Prepaid pension assets (excluding the IAS 39 scope) 3 3 5 5
Restricted cashFinancial assets at fair value through profit and
loss 57 57 49 49
Derivative instruments - assets Refer below 141 141 134 134
LIABILITIES
Short-term bank borrowings** Financial liabilities at amortized cost 1,034 1,034 1,036 1,036
Trade payables Financial liabilities at amortized cost 1,964 1,964 1,996 1,996
Other payables Financial liabilities at amortized cost 1,582 1,582 1,642 1,642
Debenture loans Financial liabilities at amortized cost Lev 2 10,384 10,045 11,323 11,722
Other long-term financial debt
(including current portion) Financial liabilities at amortized cost Lev 2 3,640 3,524 4,654 4,706
Put options on shares of subsidiaries - 148 148 267 267
Derivative instruments - liabilities Refer below 80 80 141 141
DERIVATIVE INSTRUMENTS
Interest rate derivative instruments 49 49 (5) (5)
Designated as hedging instruments in cash flow hedge relationship Lev 2 44 44 24 24
Designated as hedging instruments in fair value hedge relationship Lev 2 7 7 9 9
Not designated as hedges for accounting purposes Lev 2 (2) (2) (38) (38)
Foreign exchange derivative instruments 14 14 (3) (3)
Designated as hedging instruments in cash flow hedge relationship Lev 2 3 3 1 1
Designated as hedging instruments in fair value hedge relationship Lev 2 (5) (5) (8) (8)
Not designated as hedges for accounting purposes Lev 2 16 16 4 4
Commodities derivative instruments (2) (2) 1 1
Designated as hedging instruments in cash flow hedge relationship Lev 2 (2) (2) 1 1
Other derivative instruments - - - -
Equity swaps not designated as hedges for accounting purposes - - - -
Embedded derivatives not designated as hedges for accounting purposes - - - -
* See Note 2.17 and Note 19.
** Of which 282 million euros of bank overdraft as at December 31, 2011 (209 million euros of bank overdrafts as at December 31, 2010) and 404 million euros of securitization (533
million euros of bank overdrafts as at December 31, 2010).
Level 1: quoted on financial markets (Note 15).
Level 2: based on market observable data (Note 15).
Level 3: based on internal assumptions (Note 15).
Registration Document | 2011 | LafargeF58

F
CONSOLIDATED FINANCIAL STATEMENTSNote 26 Financial instruments
The fair value of financial instruments has been estimated on the
basis of available market quotations or the use of various valuation
techniques, such as present value of future cash flows. However,
the methods and assumptions followed to disclose fair value are
inherently judgmental. Thus, estimated fair value does not necessarily
reflect amounts that would be received or paid in case of immediate
settlement of these instruments.
The use of different estimations, methodologies and assumptions
could have a material effect on the estimated fair value amounts. The
methodologies used are as follows:
• cash and cash equivalents, trade receivables, trade payables,
short-term bank borrowings: due to the short-term nature of these
balances, the recorded amounts approximate fair value;
• other financial assets: Marketable securities quoted in an active
market are carried at market value with unrealized gains and loss
recorded in a separate component of equity. The fair value of
securities that are not quoted in an active market and for which
there is no observable market data on which the Group can rely
to measure their fair value (219 million euros as at December 31,
2011 and 233 million euros as at December 31, 2010) is determined
according to the most appropriate financial criteria in each case
(discounted present value of cash flows, estimated selling price). If
such fair value cannot be reliably measured, securities are carried
at acquisition cost;
• debenture loans: the fair values of the debenture loans were estimated
with internal models that rely on market observable data, at the
quoted value for borrowings listed on a sufficiently liquid market;
• other long-term financial debt: the fair values of long-term debt
were determined by estimating future cash flows on a borrowing-
by-borrowing basis, and discounting these future cash flows using
a rate which takes into account the Group’s spread for credit risk at
year end for similar types of debt arrangements;
• derivative instruments: the fair values of foreign exchange, interest
rate, commodities and equity derivatives were calculated using
market prices that the Group would pay or receive to settle the
related agreements.
c) Foreign currency risk
In the course of its operations, the Group’s policy is to hedge all material
“operational” foreign currency exposures arising from its transactions
using derivative instruments as soon as a firm or highly probable
commercial and/or financial commitment is entered into or known.
These derivative instruments are limited to forward contracts, foreign
currency swaps and options, with a term generally less than one year.
This policy is implemented in all of the Group’s subsidiaries, which are
required to ensure its monitoring. When allowed by local regulations
and when necessary, Group subsidiaries have to hedge their exposures
with the corporate Treasury department. A follow up of risks related
to foreign exchange financial instruments is regularly done through
internal reporting provided to the management.
The Group’s operating policies tend to reduce potential “financial”
foreign currency exposures by requiring all liabilities and assets of
controlled companies to be denominated as much as possible in the
same currency as the cash flows generated from operating activities,
the functional currency. The Group may amend this general rule under
special circumstances in order to take into account specific economic
conditions in a specific country such as, inflation rates, interest rates,
and currency related issues such as convertibility and liquidity. When
needed, currency swaps are used to convert debts most often raised
in euros, into foreign currencies.
See Section 2.1.2 (Financial and market risks) for more information
on our exposure to foreign currency risk.
Foreign currency hedging activity
At December 31, 2011, most forward contracts have a maturity date of less than one year. The nominal amount of foreign currency hedging
instruments outstanding at year-end is as follows:
AT DECEMBER 31,
(million euros) 2011 2010
FORWARD CONTRACT PURCHASES AND CURRENCY SWAPS
U.S. dollar (USD) 1,158 600
British pound (GBP) 1,040 888
Other currencies 217 307
TOTAL 2,415 1,795
FORWARD CONTRACT SALES AND CURRENCY SWAPS
U.S. dollar (USD) 668 1,526
British pound (GBP) 55 62
Other currencies 425 334
TOTAL 1,148 1,922
F59Lafarge | Registration Document | 2011

FCONSOLIDATED FINANCIAL STATEMENTSNote 26 Financial instruments
Details of the statement of financial position value of instruments hedging foreign currency risk
At December 31, 2011 and 2010, most of the Group’s foreign currency derivatives were not designated as hedges for accounting purposes
(see Note 26 a) (Designation of derivative instruments for hedge accounting) . Changes in fair value were recorded directly in the consolidated
statement of income .
d) Interest rate risk
The Group is primarily exposed to fluctuations in interest rates based
upon the following:
• price risk with respect to fixed-rate financial assets and liabilities.
Interest rate fluctuations impact the market value of fixed-rate assets
and liabilities;
• cash flow risk for floating rate assets and liabilities. Interest rate
fluctuations have a direct effect on the financial income or expense
of the Group.
In accordance with established policies, the Group seeks to mitigate
these risks using, to a certain extent, interest rate swaps and options.
A follow up of risks related to interest rate financial instruments is
regularly done through internal reporting provided to the management.
Interest rate risk derivatives held at December 31, 2011 were mainly
designated as hedging instruments in:
• cash flow hedge relationship for derivatives used to hedge cash
flow risk;
• fair value hedge relationship for derivatives used to hedge price risk.
See Section 2.1.2 (Financial and market risks) for more information
on our policy and procedure to interest rate risk.
Interest rate hedging activity
AT DECEMBER 31, 2011 LESS THAN ONE YEAR 1 TO 5 YEARS MORE THAN 5 YEARS TOTAL
(million euros) FIXED RATE FLOATING RATE FIXED RATE FLOATING RATE FIXED RATE FLOATING RATE FIXED RATE FLOATING RATE
Debt* 489 2,353 6,182 1,165 4,826 43 11,497 3,561
Cash and cash equivalents - (3,171) - - - - - (3,171)
NET POSITION BEFORE HEDGING 489 (818) 6,182 1,165 4,826 43 11,497 390
Hedging instruments (1,022) 1,022 (388) 388 - - (1,410) 1,410
NET POSITION AFTER HEDGING (533) 204 5,794 1,553 4,826 43 10,087 1,800
* Debt excluding put options on shares of subsidiaries.
AT DECEMBER 31, 2011 2010
DERIVATIVES’ FAIR VALUE
UNDERLYING REEVALUATION NET IMPACT
DERIVATIVES’ FAIR VALUE
UNDERLYING REEVALUATION NET IMPACT(million euros)
ASSETS
Non-current derivative instruments - - - - - -
Current derivatives instruments 43 - 43 42 - 42
Net reevaluation of financial loans and
borrowings denominated in foreign currencies - - - - - -
LIABILITIES
Non-current derivative instruments 3 - 3 6 - 6
Current derivative instruments 26 - 26 39 - 39
Net reevaluation of financial loans and
borrowings denominated in foreign currencies - 15 15 - 4 4
NET IMPACT ON EQUITY 14 (15) (1) (3) (4) (7)
Registration Document | 2011 | LafargeF60

F
CONSOLIDATED FINANCIAL STATEMENTSNote 26 Financial instruments
The notional value of interest rate derivative instruments at year-end is as follows:
Details of the statement of financial position value of instruments hedging interest rate risk
MATURITIES OF NOTIONAL CONTRACT VALUES AT DECEMBER 31, 2011*
(million euros) AVERAGE RATE 2012 2013 2014 2015 2016 > 5 YEARS TOTAL
Pay fixed
(designated as cash flow hedge)
Euro 4.5% 70 58 42 - - - 170
Other currencies 7.2% 34 67 104 - - - 205
Pay floating
(designated as fair value hedge)
Euro 1.7% 1,200 300 - - - - 1,500
Other currencies 1.8% - 77 240 - - - 317
Other interest rate derivatives
Euro - - - - - - - -
Other currencies 2.2% 19 332 - - - - 351
TOTAL 1,323 834 386 - - - 2,543
* The notional amounts of derivatives represent the face value of financial instruments negotiated with counterparties. Notional amounts in foreign currency are expressed in euros at the
year-end exchange rate.
MATURITIES OF NOTIONAL CONTRACT VALUES AT DECEMBER 31, 2010*
(million euros) AVERAGE RATE 2011 2012 2013 2014 2015 > 5 YEARS TOTAL
Pay fixed
(designated as cash flow hedge)
Euro 4.5% - 70 58 42 - - 170
Other currencies 5.4% 120 31 71 108 7 - 337
Pay floating
(designated as fair value hedge)
Euro 1.2% - 1,200 300 - - - 1,500
Other currencies 1.5% - - 75 232 - - 307
Other interest rate derivatives
Euro - - - - - - - -
Other currencies 2.0% 218 20 331 - - - 569
TOTAL 338 1,321 835 382 7 - 2,883
* The notional amounts of derivatives represent the face value of financial instruments negotiated with counterparties. Notional amounts in foreign currency are expressed in euros at the
year-end exchange rate.
AT DECEMBER 31, 2011 2010
IMPACT ON DERIVATIVES
IMPACT ON UNDERLYING NET IMPACT
IMPACT ON DERIVATIVES
IMPACT ON UNDERLYING NET IMPACT(million euros)
ASSETS
Non-current derivative instruments 80 - 80 78 - 78
Current derivative instruments 17 - 17 5 - 5
LIABILITIES
Long-term debt - 7 7 - 9 9
Non-current derivative instruments 43 - 43 51 - 51
Current derivative instruments 5 - 5 37 - 37
NET IMPACT ON EQUITY 49 (7) 42 (5) (9) (14)
F61Lafarge | Registration Document | 2011

FCONSOLIDATED FINANCIAL STATEMENTSNote 26 Financial instruments
e) Commodity risk
The Group is subject to commodity risk with respect to price changes
mainly in the electricity, natural gas, petcoke, coal, oil refined products
and sea freight markets.
The Group uses, from time to time, financial instruments to manage
its exposure to these risks. At December 31, 2011 and 2010, these
derivative instruments were mostly limited to swaps and options. A
follow up of risks related to commodity financial instruments is regularly
done through internal reporting provided to the management.
See Section 2.1.2 (Financial and market risks) for more information
on our commodity risk hedging policy and procedure.
Commodities hedging activity
The notional value of commodity derivative instruments at year-end is as follows:
Details of the statement of financial position value of instruments hedging commodities risk
Commodities derivative instruments held at December 31, 2011 and 2010 were all designated as hedging instruments in cash flow hedge
relationship.
Statement of financial position values of commodity derivative instruments are as follows:
f) Counterparty risk for financial operations
The Group is exposed to credit risk in the event of a counterparty’s
default. The Group implemented policies to limit its exposure to
counterparty risk by rigorously selecting the counterparties with which it
executes financial agreements. These policies take into account several
criteria (rating assigned by rating agencies, assets, equity base) as well
as transaction maturities.
The Group’s exposure to credit risk is limited and the Group believes
that its counterparty management risk is cautious and in line with
market practises but this may not prevent the Group’s financial
statements from being significantly impacted in case of systemic crisis.
MATURITIES OF NOTIONAL CONTRACT RESIDUAL VALUES AT DECEMBER 31, 2011*
(million euros) 2012 2013 2014 2015 2016 > 5 YEARS TOTAL
Natural Gas (NYMEX) 5 - - - - - 5
Heating Oil (NYMEX) 26 - - - - - 26
Sea freight (PANAMAX) - - - - - - -
Others 35 - - - - - 35
TOTAL 66 - - - - - 66
* The notional residual amounts of derivatives represent the residual value at December 31 of financial instruments negotiated with counterparties. Notional amounts in foreign currency
are expressed in euros at the year-end exchange rate.
MATURITIES OF NOTIONAL CONTRACT RESIDUAL VALUES AT DECEMBER 31, 2010*
(million euros) 2011 2012 2013 2014 2015 > 5 YEARS TOTAL
Natural Gas (NYMEX) 10 - - - - - 10
Heating Oil (NYMEX) 19 - - - - - 19
Sea freight (PANAMAX) 19 - - - - - 19
Others 29 - - - - - 29
TOTAL 77 - - - - - 77
* The notional residual amounts of derivatives represent the residual value at December 31 of financial instruments negotiated with counterparties. Notional amounts in foreign currency
are expressed in euros at the year-end exchange rate.
AT DECEMBER 31,
(million euros) 2011 2010
ASSETS
Non-current derivative instruments 0 0
Current derivative instruments 1 9
LIABILITIES
Non-current derivative instruments 0 0
Current derivative instruments 3 8
NET IMPACT ON EQUITY (2) 1
Registration Document | 2011 | LafargeF62

F
CONSOLIDATED FINANCIAL STATEMENTSNote 26 Financial instruments
g) Liquidity risk
The Group implemented policies to limit its exposure to liquidity risk.
As a consequence of this policy, a significant portion of our debt has a
long-term maturity. The Group also maintains committed credit lines
with various banks which are primarily used as a back-up for the debt
maturing within one year as well as for the short-term financings of the
Group and which contribute to the Group’s liquidity.
See Section 4.4 (Liquidity and capital resources) and Note 25 for more
information on our exposure to liquidity risk.
h) Capital risk management
The Group manages equity from a long-term perspective taking the
necessary precautions to ensure its sustainability, while maintaining
an optimum financial structure in terms of the cost of capital, the
Return On Equity for shareholders and security for all counterparties
with which it has ties.
Within this framework, the Group reserves the option, with the approval
of shareholders, to issue new shares or to reduce its capital. The Group
also has the power to adapt its dividend distribution policy. The Group
wishes to adjust its dividend distribution to its financial performances,
notably to earnings per share.
In accordance with common market practices, in managing its financial
structure, the Group strives to maintain the cash flow from operations
to net debt ratio within a predefined range.
Based on the 2011 financial statements, the cash flow from operations
to net debt ratio was 13.2%, compared to 12.4% at year-end 2010.
In Section 4.2 “Accounting policies and definitions ” of the present
Registration Document , the sub-heading “Reconciliation of our
non-GAAP financial measures” presents the Group’s definition of the
indicators net debt, equity and cash flow from operations.
In Section 4.4 “Liquidity and capital resources” of the present
Registration Document , the sub-heading “Net debt and net debt ratios”
presents the net-debt-to-equity ratio and the cash flow from operations
to net debt ratio for each of the periods presented.
i) Credit risk
Credit risk is defined as the risk to the counterparty to a contract failing
to perform or pay the amounts due.
The Group is exposed to credit risks in its operations.
The Group’s maximum exposure to credit risk as of December 31,
2011 on its short-term receivables is presented in the following table:
AT DECEMBER 31,
(million euros) 2011
Trade receivables (see Note 17) 1,765
Other receivables (see Note 18) 858
TOTAL 2,623
The Group considers that the credit risk on overdue and not depreciated
receivables is not material.
In fact, the Group sells its products to thousands of customers, and
customers usually order quantities to meet their short-term needs.
Outstanding amounts per customer are, on an individual basis, not
significant. The general terms of payment are different across countries
however, the Group average days of payment is around 45 to 60 days.
The Group has implemented procedures for managing and depreciating
receivables, which are set by each d ivision. A monthly review of the
operating working capital is performed at both d ivision and Group
level, aiming to verify that the monitoring of trade receivables, through
the days’ receivable ratio, is compliant with the Group’s commercial
policies.
In addition, the Group has loans and long term-receivables for a total
amount of 386 million euros and 490 million euros as at December
31, 2011 and 2010, respectively (see Note 15).
F63Lafarge | Registration Document | 2011

FCONSOLIDATED FINANCIAL STATEMENTSNote 27 Other payables
Note 27 Other payables
Note 28 Commitments and contingencies
The procedures implemented by the Group allow all the major commitments to be collated and prevent any significant omissions.
Components of other payables are as follows:
AT DECEMBER 31,
(million euros) 2011 2010
Accrued payroll expenses 444 402
Accrued interest 302 333
Other taxes 156 200
Payables to suppliers of fixed assets 221 258
Other accrued liabilities 459 449
OTHER PAYABLES 1,582 1,642
Current portion 1,499 1,642
Non-current portion 83 -
“Other accrued liabilities” include payables to suppliers for non-operating services and goods, and payables to associates.
(million euros)LESS THAN
1 YEAR 1 TO 5 YEARSMORE THAN
5 YEARSAT DECEMBER 31,
2011AT DECEMBER 31,
2010
COMMITMENTS GIVEN
Commitments related to operating activities
Capital expenditures and other purchase obligations 407 567 409 1,383 1,206
Operating leases 222 557 318 1,097 974
Other commitments 336 177 90 603 464
Commitments related to financing
Securities pledged - 17 84 101 263
Assets pledged 49 557 23 629 775
Other guarantees 13 83 - 96 147
Scheduled interest payments* 876 2,497 1,276 4,649 4,981
Net scheduled obligation on interest rate swaps** 17 2 - 19 16
Commitments related to scope of consolidation
Indemnification commitments 91 332 18 441 395
Put options to purchase shares in joint-ventures 15 - - 15 16
COMMITMENTS RECEIVED
Unused confirmed credit lines 147 3,863 - 4,010 3,839
Indemnification commitments - 2,240 129 2,369 2,511
* Scheduled interest payments associated with variable rate are computed on the basis of the rates in effect at December 31. Scheduled interest payments include interest payments on
foreign exchange derivative instruments .
** Scheduled interest payments of the variable leg of the swaps are computed based on the rates in effect at December 31.
Registration Document | 2011 | LafargeF64

F
CONSOLIDATED FINANCIAL STATEMENTSNote 29 Legal and arbitration proceedings
1) Commitments given
a) Commitments related to operating activities
In the ordinary course of business, the Group signed contract for long
term supply for raw materials and energy.
The Group is committed as lessee in operating leases for land,
quarries, building and equipment. The amount in off-balance sheet
commitments corresponds to future minimum lease payments. Total
rental expense under operating leases was 193 million euros and 191
million euros for the years ended December 31, 2011, and 2010,
respectively for continuing operations.
Future expected funding requirements or benefit payments related
to our pension and post retirement benefit plans are not included in
the above table because future long-term cash flows in this area are
uncertain. Refer to the amount reported under the “current portion”
of pension and other employee benefits liabilities in the statements of
financial position or in Note 23 for further information on these items.
b) Commitments related to scope of consolidation
As part of its divestment of assets transactions, the Group has granted
indemnification commitments, for which the exposure is considered
remote, for a total maximum amount still in force at December 31,
2011 of 441 million euros.
2) Commitments received
As part of its acquisition of assets transactions, the Group received
indemnification commitments for an initial maximum amount of:
• 2,240 million euros relating to the acquisition of Orascom Cement
in 2008;
• 129 million euros relating to the acquisition of cement operations
in Brazil from Votorantim in 2010. The Group in addition received
specific warranties to cover specific assets, properties and
agreements related to the transaction.
The Group received an indemnification commitment unlimited in
amount further to the acquisition in 2008 of 50% of Grupo GLA from
the former partners of Orascom Cement.
Note 29 Legal and arbitration proceedings
In the ordinary course of its business, Lafarge is involved in a certain
number of judicial and arbitral proceedings. Lafarge is also subject to
certain claims and lawsuits which fall outside the scope of the ordinary
course of its business, the most significant of which are summarized
below.
The amount of provisions made is based on Lafarge’s assessment of
the level of risk on a case-by-case basis and depends on its assessment
of the basis for the claims, the stage of the proceedings and the
arguments in its defense, it being specified that the occurrence of
events during proceedings may lead to a reappraisal of the risk at
any moment.
Competition
Germany – Cement: Following investigations on the German cement
market, the German competition authority, the Bundeskartellamt,
announced on April 14, 2003, that it was imposing fines on the
major German cement companies, including one in the amount of
86 million euros on Lafarge Zement, our German cement subsidiary
for anti-competitive practices in Germany. Considering that the amount
of the fine was disproportionate in light of the actual facts, Lafarge
Zement has brought the case before the Higher Regional Court, the
Oberlandesgericht, in Düsseldorf. Moreover, on August 15, 2007,
Lafarge Zement partially withdrew its appeal. Consequently Lafarge
Zement paid an amount of 16 million euros on November 2, 2007
and reduced the related provision of the same amount.
Finally, the Court’s decision related to the remaining part of the appeal
has been given on June 26, 2009, exempting Lafarge Zement partly
and reducing the remaining fine very significantly to 24 million euros.
Lafarge Zement has appealed to the Supreme Court on the basis of
legal grounds. The decision of the Supreme Court should be given
in 2012.
Assessment on the merits of a potential civil action brought by third
parties to obtain damages may depend on the outcome of the above
mentioned procedure. T here has been no significant development
on this potential civil action at this stage further to the decision of the
Düsseldorf Appeal Court.
The global provision in connection with this case amounts to 24 million
euros as of December 31, 2011.
South Africa – Cement: In South Africa, an inquiry by cement players
was opened by the competition authorities in 2009 regarding possible
infringements to competition rules. Lafarge cooperated with the South
African authority (“Authority”) during the course of the procedure.
In 2009 and in November 2011 some competitors agreed having
had anticompetitive behaviors during the previous years and signed
agreements with the Authority to cease the proceedings. Lafarge also
decided to enter into a settlement agreement with the Authority to
cease the proceedings. These negotiations are still ongoing and a
provision was recorded for this purpose.
Also on competition matters, there are three industry-wide inquiries
which do not constitute judicial proceedings and for which no provision
has been recorded:
Europe – Cement: In November 2008, the major European cement
players, including Lafarge, were investigated by the European
Commission for alleged anti-competitive practices. By a letter dated
December 6 , 2010, the Commission notified the parties of the
opening of an official investigation (which do not however constitute
a statement of objection), while reminding them that at that stage, it
did not have conclusive evidence of anti-competitive practices. The
alleged offences, which will be the subject of the detailed investigation,
involve any possible restrictions of commercial trade in or upon entry
to the EEA, market sharing, and coordination of prices on the cement
and related markets (concrete, aggregates). In the case of Lafarge,
F65Lafarge | Registration Document | 2011

FCONSOLIDATED FINANCIAL STATEMENTSNote 29 Legal and arbitration proceedings
seven (7) countries are quoted: France, the United Kingdom, Germany,
Spain, the Czech Republic, Greece and Austria. The Commission’s
investigation is ongoing and Lafarge is answering to its various requests
for information. I n November 2011, further to the answer by Lafarge
of the last questionnaire received, the Commission notified Lafarge an
injunction to waive any reserve to the answer and provide any further
information deemed necessary to complete its investigation, under the
threat of a penalty. Lafarge promptly complied with this new request
for information and lodged a lawsuit before the EU General Court with
a view to obtaining the annulment of such injunction decision. The
completion date of this investigation is unknown and no conclusion
can be drawn at this stage.
United Kingdom (UK) – Cement: On January, 18, 2012, the UK Office
of Fair Trading (OFT) announced that it had referred the aggregates,
cement and ready-mixed concrete markets (the “Industry”) in the UK
to the Competition Commission for an in-depth sector investigation. The
OFT believes that it has reasonable grounds to suspect that competition
problems may exist due to the existing market structure in the UK, and
considers that the Industry displays a number of features which may
potentially adversely affect the way competition operates in the UK.
As a result, the UK Competition Commission will conduct an in-depth
sector investigation into competition in relation to the supply of those
products, and decide whether or not any structural and/or behavioural
remedies will be required. Our UK subsidiaries will continue to fully
cooperate with the UK Competition Commission, which is expected
to conclude its investigation in the coming years (late 2013 or early
2014). At this stage, we cannot assess the potential consequences of
this investigation.
India – Cement: An investigation started in 2011 against the major
players of the cement Indian market, including our subsidiary Lafarge
India PVT Ltd. This investigation which was initiated by the Director
General of the Competition Commission of India (“CCI”) concludes
to the existence of anticompetitive behaviours in India. Lafarge India
PVT Ltd., which is the less significant player in terms of market share
among the implicated companies, vigorously defends itself against
these allegations essentially based on economic speculations. Hearings
took place before the CCI in February 2012, and a decision is expected
in 2012. No conclusion on the outcome of this procedure can be
drawn at this stage.
Other proceedings
United States of America – Hurricane Katrina: In late 2005, several class
action and individual lawsuits were filed in the United States District
Court for the Eastern District of Louisiana. In their Complaints, plaintiffs
allege that our subsidiary, Lafarge North America Inc., and/or several
other defendants including the federal government, are liable for death,
bodily and personal injury and property and environmental damage
to people and property in and around New Orleans, Louisiana. Some
of the referenced complaints claim that these damages resulted from
a barge under contract to Lafarge North America Inc. that allegedly
breached the Inner Harbor Navigational Canal levee in New Orleans
during or after Hurricane Katrina. On May 21, 2009, the Court denied
plaintiffs’ Motion for Class Certification. The Judge trial involving the first
few plaintiffs commenced in late June, 2010 and briefing to the Court
closed in October. In a ruling dated January 20, 2011, the Judge ruled
in favor of our subsidiary, Lafarge North America Inc. These plaintiffs
filed a Notice of Appeal, but then withdrew it. A new case was filed
against Lafarge North America Inc on September 16, 2011 in Louisiana
State Court. Our subsidiary has moved to remove the case to Federal
Court before the same Judge and has filed a Motion for Summary
Judgment against all the remaining plaintiffs. A Hearing was held by
the Court in October 2011 and a decision is expected during the first
quarter of 2012.
Lafarge North America Inc. vigorously defends itself in these actions.
Lafarge North America Inc. believes that the claims against it are
without merit and that these matters will not have a materially adverse
effect on its financial condition.
India / Bangladesh: The Group holds, jointly with Cementos Molins,
59% of Lafarge Surma Cement which is operating a cement plant in
Bangladesh. This cement plant is supplied by its Indian affiliate with
limestone extracted from a quarry in the Meghalaya region of India. At
a hearing on February 5 , 2010, the Supreme Court of India decided
to suspend the mining activities of the quarry, due to the fact that its
location is today regarded as a forest area, making it necessary to
obtain a new mining permit.
By a favourable decision dated July 6 , 2011, the Supreme Court has
declared to see no reason to interfere with the past decisions of the
Ministry of Environment and Forest granting the clearances to our
subsidiary during the course of the project (including site clearance
dated June 1999, Environmental Impact Assessment clearance
dated August 2001 and revised in April 2010 and the Stage 1 Forest
Clearance dated April 2010). Accordingly the Court decides to stand
vacated its interim order dated February 5 , 2010 suspending the
mining activities of our subsidiary and to allow the application filed
by our subsidiary to obtain a new clearance from the Ministry of
Environment and Forest. Further to this decision, and pending to the
granting of a Stage 2 Forest Clearance for which the procedures are
continuing before the Ministry of Environment and Forest, by a letter
dated August 5 , 2011 the State Government of Meghalaya allowed
our Indian subsidiary to immediately restart its mining activities in
the already broken-up area of the quarry. Therefore, Lafarge Surma
Cement has restarted in a normal way the operations of its cement
plant, thanks to the supply of limestone extracted from this area of its
Indian affiliate’s quarry.
In connection with disposals made in the past years, Lafarge and
its subsidiaries provided customary warranties notably related to
accounting, tax, employees, product quality, litigation, competition, and
environmental matters. Lafarge and its subsidiaries received or may
receive in the future notice of claims arising from said warranties. In
view of the current analysis, it is globally concluded that no significant
provision has to be recognized in relation to such claims and disposals.
Finally, certain Group subsidiaries have litigation and claims pending
in the normal course of business. The resolution of these matters
should not have any significant effect on the Company’s and/or the
Group’s financial position, results of operations and cash flows. To
the Company’s knowledge, there are no other governmental, legal or
arbitration proceedings which may have or have had in the recent
past significant effects on the Company and/or the Group’s financial
position or profitability.
Registration Document | 2011 | LafargeF66

F
CONSOLIDATED FINANCIAL STATEMENTSNote 31 Employee costs and Directors’ and Executive Officers’ compensation for services
Note 30 Related parties
Lafarge has not entered into any transaction with any related parties as
defined under paragraph 9 of IAS 24, except for information described
hereafter and in paragraph b) disclosed in Note 31.
Transactions with associates and with joint ventures were not material
for the years presented except for a loan granted to our associate in
Nigeria (Unicem) amounting to 84 million euros as at December 31,
2011 (74 million euros as at December 31, 2010).
See Note 35 (List of significant subsidiaries, joint ventures and
investments in associates at December 31, 2011).
Transactions with other parties or companies related to the Group are
as follows:
Mr. Baudouin Prot is Director of Lafarge S.A. and Chairman of BNP
Paribas, and Mrs. Ploix is Director of both Lafarge S.A. and BNP
Paribas. Lafarge S.A. has and will continue to have an arm’s length
business relationship with BNP Paribas, including for the conclusion of
mandates in the context of acquisitions and/or divestments, financings,
credit facilities and agreements relating to securities offerings. In
compliance with French law on regulated transactions (“conventions
réglementées”), and when applicable, these agreements are approved
by the Board of Directors of Lafarge S.A. and communicated to the
auditors and shareholders.
Within the scope of the purchase of Orascom Building Materials
Holding SAE (OBMH) in 2008, the holding company of the cement
activities of Orascom construction industrie SAE (OCI), Lafarge S.A.
has received indemnification guarantee (see Note 28) and entered
into a cooperation agreement with OCI. Mr. Nassef Sawiris is Chief
Executive Officer of OCI and Director of both OCI and Lafarge S.A.,
and Mr. Jérôme Guiraud is Director of both OCI and Lafarge S.A. The
cooperation agreement dated December 9, 2007 aims to allow OCI to
participate in tenders in respect of the construction of new and cement
plants in countries where OCI has the capability to meet certain of
Lafarge’s construction needs.
At this stage, the construction agreements entered into with the
OCI Group are considered to be arms length business transactions,
intervening within the framework of consortia, OCI being one of the
members. There is no conflict of interest between Mr. Sawiris and
Lafarge on this subject. Under these agreements, the outstanding
balances with OCI Group are not significant as at December 31, 2011.
From time to time, Directors of the Group, or their related entities, may
purchase or sell goods from/to the Group. These purchases or sales
are on the same terms and conditions as those entered into by other
Group employees or customers.
Certain b usiness relationships between the Group, its Directors and
related parties are described in chapter 5.1.3. of this document (see
also the description of related party agreements and commitments
detailed in the special report of the statutory auditors on page F94) .
Note 31 Employee costs and Directors’ and Executive Officers’ compensation for services
a) Employees and employee expenses
AT DECEMBER 31,
2011 2010**
Management staff 11,989 12,859
Non-management staff 48,936 54,177
TOTAL NUMBER OF EMPLOYEES* 60,925 67,036
Of which:
companies accounted for using the proportionate method 7,788 9,123
* The headcounts at 100% of our fully consolidated and proportionately consolidated subsidiaries amounted to 67,924 as of December 31, 2011 and 75,677 as of December 31, 2010.
** Of which 4,935 related to the employees of Gypsum discontinued activities.
YEARS ENDED DECEMBER 31
(million euros) 2011 2010*
TOTAL EMPLOYEE EXPENSES 2,452 2,337
Of which:
companies accounted for using the proportionate method 117 100
* Figures have been adjusted as mentioned in Note 3.1.1 «Disposal of Gypsum Division operations» following the disposal operations of Gypsum activities and are therefore not
comparable with those presented in the 2010 Registration Document.
F67Lafarge | Registration Document | 2011

FCONSOLIDATED FINANCIAL STATEMENTSNote 32 Supplemental cash flow disclosures
b) Directors’ and executive officers’ compensation for services
The table below presents the compensation by Lafarge S.A. and its subsidiaries to executives who are, at the reporting date or have been during
the period, members of the Board of Directors or of the Group Executive Committee. The Group Executive Committee is composed as defined
in Section 5.3 - Executive Officers – of the Registration Document :
Note 32 Supplemental cash flow disclosures
a) Cash flow information related to investing activities
The cash flows from investments in subsidiaries and joint venture
include the purchase price consideration paid for the acquisitions less
the cash acquired. No significant acquisition settled in cash occurred
in 2011 and 2010.
The cash flows from disposal of assets include the selling price, net
of disposal costs and less the cash disposed of. The impact of the
disposals in the consolidated statement of income is detailed in Note 5.
The main disposals in 2011 are more fully described in Note 3.
YEARS ENDED DECEMBER 31
2011 2010*
CASH FLOWS FROM DISPOSALS OF ASSETS 2,084 208
of which:
Disposal of our Gypsum activities in Europe, South America, Asia and Australia 1,290 -
Disposal of our Cement and Concrete activities in South East US 564 -
Disposal of our activities in Portugal 62 -
Disposal of our investment in Venezuela 22 22
Disposal of our Aggregates & Concrete activities in Alsace (France) and Switzerland 13 37
Disposal of our Cimpor investment in Portugal - 21
Others 133 128
* Figures have been adjusted as mentioned in Note 3.1.1 «Disposal of Gypsum Division operations» following the disposal operations of Gypsum activities and are therefore not
comparable with those presented in the 2010 Registration Document.
b) Cash flow information related to financing activities
YEARS ENDED DECEMBER 31
(million euros) 2011 2010
Board of Directors (1) 0.7 0.7
Senior Executives 18.4 24.4
Short-term benefits 8.5 11.0
Post-employment benefits (2) 5.7 8.8
Other long-term benefits - -
Share-based payments (3) 4.2 4.6
TOTAL 19.1 25.1
(1) Directors’ fees.
(2) Change for the year in discounted post-employment benefit obligation.
(3) Expense of the year estimated in accordance with principles described in Note 2.24.
The lines “Acquisitions/disposals of ownership interests with no gain/
loss in control” reflect the cash impact of acquisition and disposal
of non-controlling interests (see Note 2), net of related acquisition/
disposal costs.
In 2011, “Acquisitions of ownership interests with no gain of control”
amounts to 211 million euros and essentially includes put exercised
on non controlling interests in Serbia (111 million euros) and in India
(51 million euros). The impact of partial acquisitions of interests is
described in Note 3.
In 2011, “Disposals of ownership interests with no loss in control”
amounts to 87 million euros and essentially includes the cash proceeds
arising from the disposal of the non controlling interests in Austria (see
Note 20 (g)).
In 2010, “Disposals of ownership interests with no loss in control”
amounted to 139 million euros and essentially included the cash
proceeds arising from the disposal of non controlling interests in
Malaysia for an amount of 141 million euros.
Registration Document | 2011 | LafargeF68

F
CONSOLIDATED FINANCIAL STATEMENTSNote 34 Events after the reporting period
Note 33 Auditors’ fees and servicesThis table sets out the amount of fees billed for each of the last two fiscal years by each of our auditors, Deloitte & Associés and Ernst & Young
Audit, in relation to audit services, audit-related services, tax and other services provided to us.
Note 34 Events after the reporting period
As part of its new country-based organization project, Lafarge announced on February 2 , 2012, a proposed reorganization of its Corporate
functions.
DELOITTE & ASSOCIES ERNST & YOUNG AUDIT
(million euros)
AMOUNT (EXCL. TAX) % AMOUNT (EXCL. TAX) %
2011 2010 2011 2010 2011 2010 2011 2010
AUDIT FEES
Audit, attestation and review of financial
statements 6.6 7.4 57% 84% 5.9 6.4 84% 88%
Lafarge S.A. 1.5 1.8 13% 20% 1.5 1.5 21% 21%
Subsidiaries 5.1 5.6 44% 64% 4.4 4.9 63% 67%
Audit-related Fees* 4.8 1.3 41% 15% 0.9 0.7 12% 9 %
Lafarge S.A. 2.7 0.4 23% 5% 0.6 0.1 8% 1%
Subsidiaries 2.1 0.9 18% 10% 0.3 0.6 4% 8%
SUB-TOTAL 11.4 8.7 98% 99% 6.8 7.1 96% 97%
OTHER FEES
Tax Fees** 0.3 0.1 2% 1% 0.3 0.2 4% 3%
Legal and Employment Fees - - - - - - - -
Information Technology - - - - - - - -
Others - - - - - - - --
SUB TOTAL OTHER FEES 0.3 0.1 2% 1% 0.3 0.2 4% 3 %
TOTAL FEES 11.7 8.8 100% 100% 7.1 7.3 100% 100%
* Audit-related fees are generally fees billed for services that are closely related to the performance of the audit or review of financial statements. These include due diligence services
related to acquisitions, consultations concerning financial accounting and reporting standards, attestation services not required by statute or regulation, information system reviews.
** Tax fees are fees for services related to international and domestic tax compliance, including the review of tax returns and tax services regarding statutory, regulatory or administrative
developments and expatriate tax assistance and compliance.
F69Lafarge | Registration Document | 2011
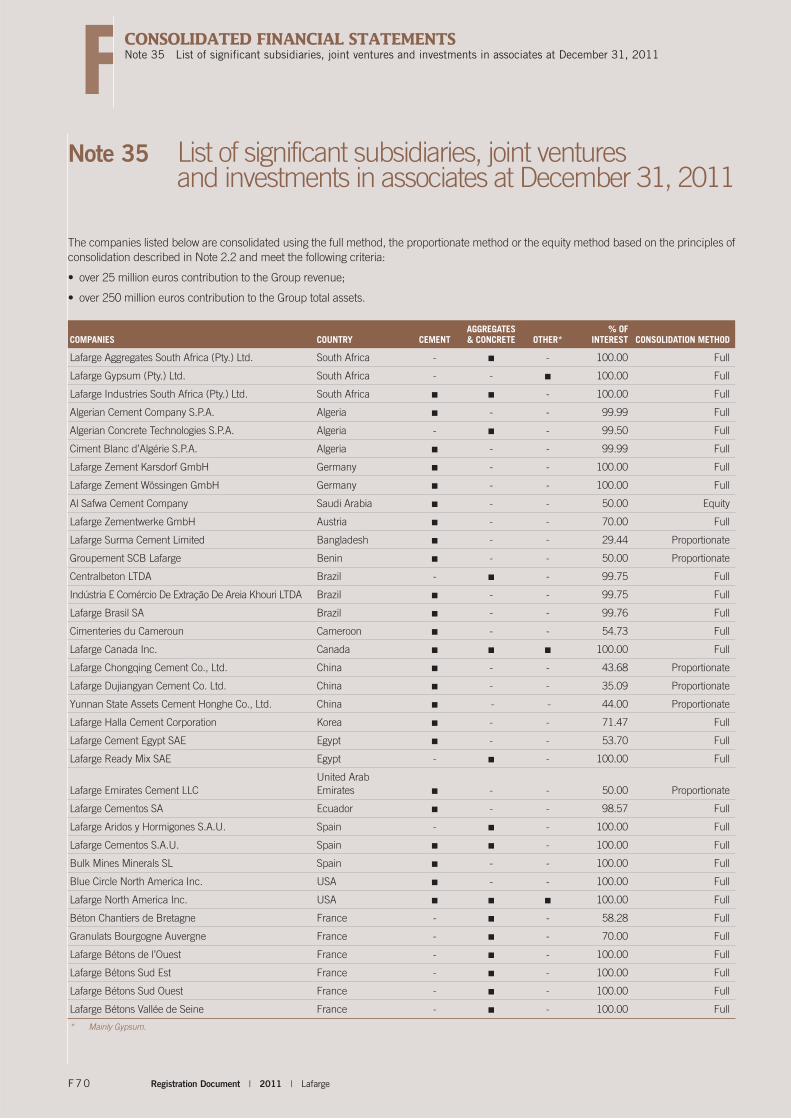
FCONSOLIDATED FINANCIAL STATEMENTSNote 35 List of significant subsidiaries, joint ventures and investments in associates at December 31, 2011
Note 35 List of significant subsidiaries, joint ventures and investments in associates at December 31, 2011
The companies listed below are consolidated using the full method, the proportionate method or the equity method based on the principles of
consolidation described in Note 2.2 and meet the following criteria:
• over 25 million euros contribution to the Group revenue;
• over 250 million euros contribution to the Group total assets.
COMPANIES COUNTRY CEMENTAGGREGATES & CONCRETE OTHER*
% OF INTEREST CONSOLIDATION METHOD
Lafarge Aggregates South Africa (Pty.) Ltd. South Africa - ■ - 100.00 Full
Lafarge Gypsum (Pty.) Ltd. South Africa - - ■ 100.00 Full
Lafarge Industries South Africa (Pty.) Ltd. South Africa ■ ■ - 100.00 Full
Algerian Cement Company S.P.A. Algeria ■ - - 99.99 Full
Algerian Concrete Technologies S.P.A. Algeria - ■ - 99.50 Full
Ciment Blanc d’Algérie S.P.A. Algeria ■ - - 99.99 Full
Lafarge Zement Karsdorf GmbH Germany ■ - - 100.00 Full
Lafarge Zement Wössingen GmbH Germany ■ - - 100.00 Full
Al Safwa Cement Company Saudi Arabia ■ - - 50.00 Equity
Lafarge Zementwerke GmbH Austria ■ - - 70.00 Full
Lafarge Surma Cement Limited Bangladesh ■ - - 29.44 Proportionate
Groupement SCB Lafarge Benin ■ - - 50.00 Proportionate
Centralbeton LTDA Brazil - ■ - 99.75 Full
I ndústria E Comércio De Extração De Areia Khouri LTDA Brazil ■ - - 99.75 Full
Lafarge Brasil SA Brazil ■ - - 99.76 Full
Cimenteries du Cameroun Cameroon ■ - - 54.73 Full
Lafarge Canada Inc. Canada ■ ■ ■ 100.00 Full
Lafarge Chongqing Cement Co., Ltd. China ■ - - 43.68 Proportionate
Lafarge Dujiangyan Cement Co. Ltd. China ■ - - 35.09 Proportionate
Yunnan State Assets Cement Honghe Co., Ltd. China ■ - - 44.00 Proportionate
Lafarge Halla Cement Corporation Korea ■ - - 71.47 Full
Lafarge Cement Egypt SAE Egypt ■ - - 53.70 Full
Lafarge Ready Mix SAE Egypt - ■ - 100.00 Full
Lafarge Emirates Cement LLC
United Arab
Emir ates ■ - - 50.00 Proportionate
Lafarge Cementos SA Ecuador ■ - - 98.57 Full
Lafarge Aridos y Hormigones S.A.U. Spain - ■ - 100.00 Full
Lafarge Cementos S.A.U. Spain ■ ■ - 100.00 Full
Bulk Mines Minerals SL Spain ■ - - 100.00 Full
Blue Circle North America Inc. USA ■ - - 100.00 Full
Lafarge North America Inc. USA ■ ■ ■ 100.00 Full
Béton Chantiers de Bretagne France - ■ - 58.28 Full
Granulats Bourgogne Auvergne France - ■ - 70.00 Full
Lafarge Bétons de l’Ouest France - ■ - 100.00 Full
Lafarge Bétons Sud Est France - ■ - 100.00 Full
Lafarge Bétons Sud Ouest France - ■ - 100.00 Full
Lafarge Bétons Vallée de Seine France - ■ - 100.00 Full
* Mainly Gypsum.
Registration Document | 2011 | LafargeF70

F
CONSOLIDATED FINANCIAL STATEMENTSNote 35 List of significant subsidiaries, joint ventures and investments in associates at December 31, 2011
COMPANIES COUNTRY CEMENTAGGREGATES & CONCRETE OTHER*
% OF INTEREST CONSOLIDATION METHOD
Carrières de Saint Laurent France - ■ - 50.59 Full
Lafarge Ciments France ■ - - 100.00 Full
Lafarge Ciments Distibution France ■ - - 100.00 Full
Lafarge Ciments Réunion France ■ - - 82.92 Full
Lafarge Granulats Bétons Réunion France - ■ - 93.34 Full
Lafarge Granulats Ouest France - ■ - 100.00 Full
Lafarge Granulats Seine Nord France - ■ - 100.00 Full
Lafarge Granulats Sud France - ■ - 100.00 Full
Société des Ciments Antillais France ■ - - 69.73 Full
Etex Dryco S.A.S France - - ■ 20.00 Equity
Heracles General Cement Company S.A. Greece ■ - - 88.99 Full
Lafarge Beton Industrial Commercial SA Greece - ■ - 88.99 Full
Lafarge Cementos SA de C.V. Honduras ■ - - 53.11 Full
Lafarge Cement Hungary Ltd. Hungary ■ - - 70.00 Full
Lafarge India PVT Limited India ■ - - 100.00 Full
Lafarge Aggregates & Concrete India Private Limited India - ■ - 100.00 Full
Pt Lafarge Cement Indonesia Indonesia ■ - - 100.00 Full
Bazian Cement Company Ltd. Iraq ■ - - 70.00 Full
United Cement Company Limited Iraq ■ - - 60.00 Full
Arabian Concrete Supply Company Jordan - ■ - 25.64 Full
Jordan Cement Factories Company PSC Jordan ■ - - 50.28 Full
Bamburi Cement Ltd. Kenya ■ - - 58.60 Full
CMCM Perniagaan SND BHD Malaysia ■ - - 51.00 Full
Lafarge Malayan Cement Berhad Malaysia ■ - - 51.00 Full
Lafarge Cement sdn bhd Malaysia ■ - - 51.00 Full
Lafarge Concrete (Malaysia) sdn bhd Malaysia - ■ - 31.49 Full
Lafarge Cement Malawi Ltd. Malawi ■ - - 100.00 Full
Lafarge Betons Morocco - ■ - 34.64 Proportionate
Lafarge Ciments Morocco ■ - - 34.93 Proportionate
Lafarge Cementos S.A. de C.V. Mexico ■ - - 100.00 Full
Lafarge Ciment (Moldova) SA Moldavia ■ - - 95.31 Full
Atlas Cement Company Ltd. Nigeria ■ - - 100.00 Full
United Cement Company of Nigeria Ltd. Nigeria ■ - - 35.92 Equity
Ashakacem plc Nigeria ■ - - 58.60 Full
Lafarge cement WAPCO Nigeria plc Nigeria ■ - - 60.00 Full
Hima Cement Ltd. Uganda ■ - - 71.01 Full
Lafarge Pakistan Limited Pakistan ■ - - 73.22 Full
Lafarge Holdings (Philippines) Inc. Philippines ■ - - 100.00 Full
Lafarge Cement S.A. Poland ■ - - 100.00 Full
Lafarge Kruszywa i Beton Poland - ■ - 100.00 Full
Readymix Qatar W.L.L. Qatar - ■ - 49.00 Proportionate
Lafarge Cement AS Czech Republic ■ - - 67.98 Full
Lafarge Ciment (Romania) S.A. Romania ■ - - 98.56 Full
Lafarge Aggregates Limited United Kingdom - ■ - 100.00 Full
Lafarge Cement UK Limited United Kingdom ■ - - 100.00 Full
* Mainly Gypsum.
F71Lafarge | Registration Document | 2011

FCONSOLIDATED FINANCIAL STATEMENTSNote 35 List of significant subsidiaries, joint ventures and investments in associates at December 31, 2011
COMPANIES COUNTRY CEMENTAGGREGATES & CONCRETE OTHER*
% OF INTEREST CONSOLIDATION METHOD
Redland Readymix Holdings Limited United Kingdom - ■ - 100.00 Full
OAO Lafarge Cement Russia ■ - - 75.00 Full
Lafarge Beocinska Fabrika Cementa Serbia ■ - - 100.00 Full
Lafarge Mahaweli Cement (Private) Limited Sri Lanka ■ - - 85.08 Full
Cementia Trading AG Switzerland ■ - - 100.00 Full
Marine Cement AG/Ltd. Switzerland ■ - - 100.00 Full
Lafarge Cement Syria Syria ■ - - 98.67 Full
Mbeya Cement Company Limited Tanzania ■ - - 62.76 Full
PJSC Mykolaivcement Ukraine ■ - - 79.41 Full
Lafarge Cement Zambia PLC Zambia ■ - - 84.00 Full
Lafarge Cement Zimbabwe Limited Zimbabwe ■ - - 76.46 Full
* Mainly Gypsum.
Registration Document | 2011 | LafargeF72

F
FINANCIAL STATEMENTS OF THE PARENT COMPANY LAFARGE S.A. Statutory Auditors’ Report on the annual financial statements
F INANCIAL STATEMENTS OF THE PARENT COMPANY L AFARGE S .A . FOR THE YEAR ENDED DECEMBER 31, 2011 Statutory Auditors’ Report on the annual financial statements
This is a free translation into English of the statutory auditors’ report issued in the French language and is provided solely for the convenience of English-speaking
users. The statutory auditors’ report includes information specifically required by French law in such reports, whether modified or not. This information is
presented below the opinion on the annual financial statements and includes an explanatory paragraph discussing the auditors’ assessments of certain significant
accounting and auditing matters. These assessments were considered for the purpose of issuing an audit opinion on the annual financial statements taken as
a whole and not to provide separate assurance on individual account captions or on information taken outside of the annual financial statements. This report
also includes information relating to the specific verification of information given in the management report. This report should be read in conjunction with, and
construed in accordance with, French law and professional auditing standards applicable in France.
Year ended December 31, 2011To the Shareholders,
In compliance with the assignment entrusted to us by your Annual General Meeting, we hereby report to you for the year ended December 31, 2011 on:
• the audit of the accompanying annual financial statements of Lafarge;
• the justification of our assessments;
• the specific verifications and information required by law.
These annual financial statements have been approved by the Board of Directors. Our role is to express an opinion on these financial statements based on our audit.
I. OPINION ON THE ANNUAL FINANCIAL STATEMENTSWe conducted our audit in accordance with professional standards applicable in France; those standards require that we plan and perform the audit to obtain reasonable assurance about whether the annual financial statements are free of material misstatement. An audit involves performing procedures, using sampling techniques or other methods of selection, to obtain audit evidence about the amounts and disclosures in the annual financial statements. An audit also includes evaluating the appropriateness of accounting policies used and the reasonableness of accounting estimates made, as well as the overall presentation of the annual financial statements. We believe that the audit evidence we have obtained is sufficient and appropriate to provide a basis for our opinion.
In our opinion, the annual financial statements give a true and fair view of the assets and liabilities and of the financial position of the Company as of December 31, 2011 and of the results of its operations for the year then ended, in accordance with French accounting principles.
II. JUSTIFICATION OF OUR ASSESSMENTSIn accordance with the requirements of Article L. 823-9 of the French Commercial Code (Code de commerce) relating to the justification of our assessments, we bring to your attention the following matters:
Note " 2.3 Financial assets" to the annual financial statements details the accounting principles and methods applied to investments and mentions that the earnings outlooks are established based on currently available information and are in keeping with the current economic crisis or political instability affecting some of the Group’s markets. They do not take into consideration any possible breach of the economical or geopolitical environment. Our procedures consisted in reviewing available documents and assessing the reasonableness of retained valuations.
The assessments were made as part of our audit of the annual financial statements taken as a whole, and therefore contributed to the opinion we formed, which is expressed in the first part of this report.
III. SPECIFIC VERIFICATIONS AND INFORMATIONWe have also performed, in accordance with professional standards applicable in France, the specific verifications required by French law.
We have no matters to report as to the fair presentation and the consistency with the annual financial statements of the information given in the management report of the Board of Directors and in the documents addressed to shareholders with respect to the financial position and the annual financial statements.
Concerning the information given in accordance with the requirements of article L. 225-102-1 of the French Commercial Code (Code de commerce) relating to remunerations and benefits received by the directors and any other commitments made in their favour, we have verified its consistency with the annual financial statements, or with the underlying information used to prepare these annual financial statements and, where applicable, with the information obtained by your Company from companies controlling your Company or controlled by it. Based on this work, we attest the accuracy and fair presentation of this information.
In accordance with French law, we have verified that the required information concerning the identity of the shareholders and holders of the voting rights has been properly disclosed in the management report.
Neuilly-sur-Seine and Paris-La Défense, February 27, 2012
The Statutory Auditors
French original signed by
DELOITTE & ASSOCIES ERNST & YOUNG Audit
Arnaud de Planta Frédéric Gourd Christian Mouillon Nicolas Macé
F73Lafarge | Registration Document | 2011

FFINANCIAL STATEMENTS OF THE PARENT COMPANY LAFARGE S.A. Comments on the income statement and the balance sheet
Comments on the income statement and the balance sheet
The financial statements for the year ended December 31, 2011 show
net income of 206 million euros compared to 49 million euros the
previous year.
• These results reflect the following events:
– the increase in operating income of 29 million euros due mainly
to the new license contracts with our main subsidiaries;
– the increase in dividends collected (+122 million euros) partly
compensated by the increase in net fi nancial expenses (-66 million
euros) explains the increase in fi nancial income (+56 million euros);
– exceptional income of 72 million euros in 2011 mainly
corresponds to the reversal of 1976 revaluation reserve of its
investments in Lafarge Ciments and Lafarge Ciments Distribution
following the transfer of these investments to its subsidiary Sofi mo
(+85 million euros);
– fi nally, income tax includes 103 million euros already received
or receivable from subsidiaries included in the Group tax regime.
• The main trends in the balance sheet reflect the following:
– the change in the gross value of investments (+613 million euros)
which may be explained by, in particular:
– the Lafarge North America capital increase (+1,144 million
euros),
– the Lafarge Centre de Recherche capital increase (+20 million
euros),
– the Sabelfi capital decrease (-551 million euros);
– the increase in provisions of 21 million euros which corresponds
to the increase of the provision for the potential consequences
of the tax audit in progress;
– the net decrease of 2,347 million euros in short and long-term loans,
borrowings and current accounts granted to Group companies;
– the decrease in equity of 297 million euros before profi t or loss,
resulting from the appropriation of the previous year’s net income
(+49 million euros), a dividend payment (-288 million euros),
the share capital increase reserved for Group’s employees
(+27 million euros) and the decrease of the reevaluation reserve
1976 (-85 million euros);
– the decrease in net debt of 1,466 million euros which stood at
11,518 million euros at year-end 2011.
As of December 31, 2011, gross debt was composed of bonds for
10,201 million euros, negotiable debt instruments of 703 million euros,
borrowings from Group companies for 352 million euros and other
bank borrowings for 1,575 million euros.
Appropriation of earnings
It will be proposed to the Shareholders’ Annual General Meeting an appropriation of the earnings for fiscal year 2011 that allows a normal
dividend of 0.50 euro per share and a loyalty dividend of 0.55 euro per share, as follows:
ORIGINS:
Earnings 205,507,226.30
Retained earnings* 1,700,991,186.71
TOTAL 1,906,498,413.01
APPROPRIATION
Legal reserve 10,275,361.32
Dividend
- First dividend (5% of the par value of the share) 57,402,814.00
- Additional dividend (total dividend - first dividend) 86,104,221.00
- Maximum amount of the 10% increase 1,052,013.85
- Total d ividend 144,559,048.85
Retained e arnings 1,751,664,002.84
TOTAL 1,906,498,413.01
* After inclusion of:
- the dividends received on treasury shares, which total 130,110.00 euros;
- the 10% increase not collected on the registered shares transferred in to a bearer account between January 1 and June 30, 2011, i.e. 166,487.10 euros.
We remind the Shareholders’ Meeting that the dividends distributed in previous years were as follows:
YEAR 2010 2009 2008
Number of shares 286,453,779 286,453,316 195,236,534
Normal dividend per share 1.00 2.00 2.00
Loyalty dividend per share 1.10 2.20 2.20
Registration Document | 2011 | LafargeF74

F
FINANCIAL STATEMENTS OF THE PARENT COMPANY LAFARGE S.A. Statement of income
Statement of income
YEARS ENDED DECEMBER 31,
(million euros) NOTES 2011 2010
Production sold (services) 488 422
Provision reversals 3 19 23
Operating Revenue 507 445
Other purchases and external expenses (413) (386)
Duties and taxes (4) (2)
Employee expenses (142) (141)
Depreciation and amortization 3 (23) (21)
Provision allowance 3 (22) (21)
Operating expenses (604) (571)
OPERATING INCOME (97) (126)
Income from investments 4 911 791
Interest and similar income 5 70 51
Foreign currency exchange gains 17 19
Provision reversals 6 1 89
Financial Income 999 950
Interest and similar expenses 7 (806) (815)
Foreign currency exchange losses (17) (9)
Provision allowance 6 (13) (19)
Financial Expenses (836) (843)
NET FINANCIAL INCOME (EXPENSES) 163 107
CURRENT OPERATING INCOME (LOSS) BEFORE TAX 66 (19)
EXCEPTIONAL INCOME (LOSS) 8 72 (8)
Income tax credit/(expense) 9 68 76
NET INCOME 206 49
F75Lafarge | Registration Document | 2011

FFINANCIAL STATEMENTS OF THE PARENT COMPANY LAFARGE S.A. Balance sheet
Balance sheet
ASSETS AT DECEMBER 31,
(million euros) NOTES
2011 2010
GROSS AMOUNT
DEPRECIATION, AMORTIZATION,
IMPAIRMENT NET AMOUNT NET AMOUNT
NON-CURRENT ASSETS
Intangible assets and property, plant and equipment 10 199 105 94 104
Financial assets* 11 26,658 9 26,649 26,470
Investments 28 25,467 5 25,462 24,849
Long-term receivables from investments 21 1,178 4 1,174 1,607
Other financial assets 13 - 13 14
26,857 114 26,743 26,574
CURRENT ASSETS
Other receivables 21 2,313 - 2,313 3,508
Marketable securities 12 17 - 17 26
Cash and cash equivalents 1,296 - 1,296 1,303
3,626 - 3,626 4,837
Bond redemption premiums 14 45 - 45 58
Cumulative translation adjustments 14 450 - 450 421
TOTAL ASSETS 30,978 114 30,864 31,890
* Of which less than one year 689 488
Registration Document | 2011 | LafargeF76
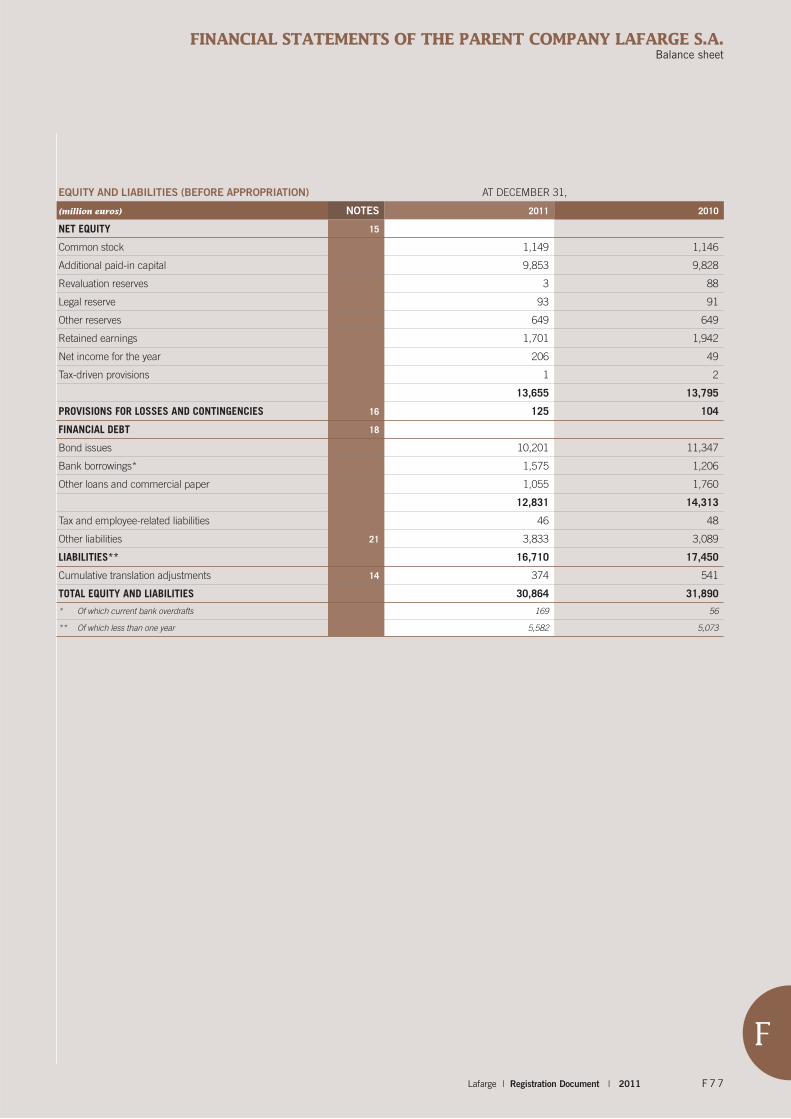
F
FINANCIAL STATEMENTS OF THE PARENT COMPANY LAFARGE S.A. Balance sheet
EQUITY AND LIABILITIES (BEFORE APPROPRIATION) AT DECEMBER 31,
(million euros) NOTES 2011 2010
NET EQUITY 15
Common stock 1,149 1,146
Additional paid-in capital 9,853 9,828
Revaluation reserves 3 88
Legal reserve 93 91
Other reserves 649 649
Retained earnings 1,701 1,942
Net income for the year 206 49
Tax-driven provisions 1 2
13,655 13,795
PROVISIONS FOR LOSSES AND CONTINGENCIES 16 125 104
FINANCIAL DEBT 18
Bond issues 10,201 11,347
Bank borrowings* 1,575 1,206
Other loans and commercial paper 1,055 1,760
12,831 14,313
Tax and employee-related liabilities 46 48
Other liabilities 21 3,833 3,089
LIABILITIES** 16,710 17,450
Cumulative translation adjustments 14 374 541
TOTAL EQUITY AND LIABILITIES 30,864 31,890
* Of which current bank overdrafts 169 56
** Of which less than one year 5,582 5,073
F77Lafarge | Registration Document | 2011

FFINANCIAL STATEMENTS OF THE PARENT COMPANY LAFARGE S.A. Statement of cash flows
Statement of cash flows
YEARS ENDED DECEMBER 31,
(million euros) 2011 2010
CASH FLOW FROM OPERATIONS* 187 (235)
Change in working capital 1,741 (132)
NET CASH PROVIDED BY (USED IN) OPERATING ACTIVITIES (I) 1,928 (367)
Capital expenditure (44) (28)
Investments (1,164) (1,255)
Repayment of investments 552 1,300
Net decrease in loans and miscellaneous 433 185
Disposals of assets 21 9
NET CASH PROVIDED BY (USED IN) INVESTING ACTIVITIES (II) (202) 211
Proceeds from issuance of common stock 28 -
Dividends paid (288) (575)
NET CASH PROVIDED BY (USED IN) CAPITAL TRANSACTIONS (III) (260) (575)
INCREASE (DECREASE) IN NET DEBT (I+II+III) 1,466 (731)
NET DEBT AT END OF YEAR 11,518 12,984
Debt 12,831 14,313
Marketable securities (17) (26)
Cash and cash equivalents (1,296) (1,303)
* Cash flow from operations mainly comprises net income (+206 million euros) before depreciation and amortization (+35 million euros), provisions (-63 million euros) and a gain on
investment disposal (+9 million euros).
Registration Document | 2011 | LafargeF78

F
NOTES TO THE PARENT COMPANY FINANCIAL STATEMENTS Note 2 Accounting policies
NOTES TO THE PARENT COMPANY FINANCIAL STATEMENTS
Note 1 Significant events of the period
Lafarge S.A. entered into three new services agreements with effect
started January 1, 2011, supposed to retribute LAFARGE’s brand,
the transfert of expertise and intellectual property and some support
functions for which Lafarge S.A. is in charge of. They currently replace
the former Industrial Francheese agreements and their implementation
will continue in 2012.
Lafarge S.A. brought to its wholly owned subsidiary Sofimo its
investments in Lafarge Ciments and Lafarge Ciments Distribution at
the net booked value.
Note 2 Accounting policies
The financial statements have been prepared in accordance with the
provisions set forth in the French General Chart of Accounts (“Plan
comptable général” – CRC regulation 99-03).
The accounting policies applied by the Company are described below:
2.1 Intangible assets
Intangible assets are recorded at acquisition cost and mainly include
purchased software and related development costs.
These assets are amortized on a straight-line basis over five to seven
years from the date of commissioning.
2.2 Property, plant and equipment
Property plant and equipment are recorded at historical cost, except
for those items purchased before December 31, 1976 that have been
recorded based on their revalued amounts (legal revaluation).
Depreciation is recorded using the straight-line method (except for
computer hardware, which is depreciated using the declining balance
method) over the estimated useful life of items of property, plant and
equipment as follows:
• buildings: 25 years;
• equipment: 3 to 10 years;
• vehicles: 4 years.
Accelerated depreciation classified in the balance sheet under tax
driven provisions is recorded when the fiscally authorized period is
less than the estimated useful life or when the depreciation method
is different.
2.3 Financial assets
Investments
The gross value of investments is equal to the purchase price excluding
acquisition costs, after the 1976 revaluation adjustment for investments
purchased before this date.
Acquisition costs are expensed in the fiscal year.
When the current value is less than the gross value, a provision for
impairment is recognized in the amount of the difference. The current
value is determined taking into account the share of net equity held,
the earnings outlook or the quoted market price, if relevant.
The earnings outlook is determined using either an estimate cash flows
approach or a market multiple approach (multiple of gross operating
income). It is established based on currently available information and
is in keeping with the current economic crisis or political instability
affecting some of the Group’s markets. The forecast does not reflect
any possible breach of the economical or geopolitical environnement.
When the Company’s share in the net equity of the investment is
negative, a provision for contingencies is recorded, if justified.
Long-term receivables from investments
These are long-term loans granted to companies held directly or
indirectly by Lafarge S.A. Long-term receivables from investments are
recorded at their nominal value.
Long-term receivables from investments are distinguished from
current accounts received or granted to subsidiaries, used for daily
cash management.
An impairment loss is recognized in the event of risk of non-recovery.
Treasury shares
Lafarge S.A. treasury shares are classified as “Financial assets” in the
balance sheet except when they are earmarked to cover purchase
option plans and performance share plans.
2.4 Marketable securities
Shares are valued in accordance with CRC regulation 2008-15.
Lafarge S.A. treasury shares are classified as “Marketable securities” in
the balance sheet when they are earmarked to cover purchase option
plans and performance share plans.
When plans are likely to be exercised and a cash outflow is probable,
a provision for contingencies is recorded for the corresponding shares,
equal to the difference between the value of shares allocated to the
plans and the exercise price of each of the plans. For Lafarge S.A.
employees, this provision is spread out over the vesting period.
When plans are not likely to be exercised, an impairment loss is
recognized for the corresponding shares if the market price of the
shares is lower than the gross value.
F79Lafarge | Registration Document | 2011

FNOTES TO THE PARENT COMPANY FINANCIAL STATEMENTS Note 3 Depreciation and amortization, operating provision (allowance) reversal
2.5 Foreign currency – denominated transactions
Payables and receivables denominated in foreign currencies are
translated into euros using the period end closing exchange rate. The
resulting unrealized foreign currency exchange gains or losses are
recorded in the translation adjustment accounts in the balance sheets.
Unrealized foreign currency exchange losses are provided in full,
except when offset by unrealized foreign exchange gains on payables
and receivables or on off-balance sheet commitments expressed in
the same currency and with similar maturities.
2.6 Interest rate derivatives
Gains and losses on these contracts are calculated and recognized to
match the recognition of income and expenses on the hedged debt.
2.7 Bond issue and redemption premiums
Bond issues to be redeemed with a premium are recognized in liabilities
on the balance sheet for their total amount, including redemption
premiums. An offsetting entry is then made for redemption premiums
which are recognized in assets and amortized on a straight-line basis
over the term of the bond issue. Other expenses and commission
relating to these bonds are expensed in the fiscal year incurred.
2.8 Net equity
Expenses relating to capital increases are deducted from additional
paid-in capital.
2.9 Provisions for losses and contingencies
A provision is recognized when an obligation which is probable or
certain will result in an outflow of resources with no offsetting entry.
2.10 Income tax
Lafarge S.A., together with its French subsidiaries held directly or
indirectly more than 95%, has elected to report income tax under the
tax Group regime as defined in article 223A and following of the French
General Tax Code (CGI).
The tax savings resulting from the difference between the income
tax recorded separately for each of the consolidated entities and the
income tax calculated based on the taxable results of the consolidated
group is recorded at Lafarge S.A.
Lafarge S.A. is liable to the French Treasury for the full tax charge
calculated based on the profits and losses of all tax Group companies.
2.11 Pension Benefit Obligation
Provisions are recognized to cover termination benefits and other post-
retirement benefits. These provisions are based on periodic actuarial
valuations performed using the projected unit credit method.
This method takes into account seniority, life expectancy and Company
employee turnover, as well as salary increase and discounting
assumptions.
Actuarial gains and losses resulting from a change in actuarial
assumptions or experience adjustments are recognized when they
exceed a corridor corresponding to 10% of the value of obligations.
They are amortized over the average expected remaining service lives
of the plans’ beneficiaries.
Note 3 Depreciation and amortization, operating provision (allowance) reversal
3.1 Depreciation and amortization(million euros) 2011 2010
DEPRECIATION AND AMORTIZATION
Intangible assets (20) (17)
Property, plant and equipment (3) (4)
(23) (21)
3.2 Operating provision (allowance) reversal
(million euros)
2011 2010
ALLOWANCE REVERSAL ALLOWANCE REVERSAL
Pensions obligations and termination benefits* (22) 19 (21) 19
Other operating provisions - - - 4
(22) 19 (21) 23
* See Note 17 “Retirement benefit obligations” for more information.
Registration Document | 2011 | LafargeF80
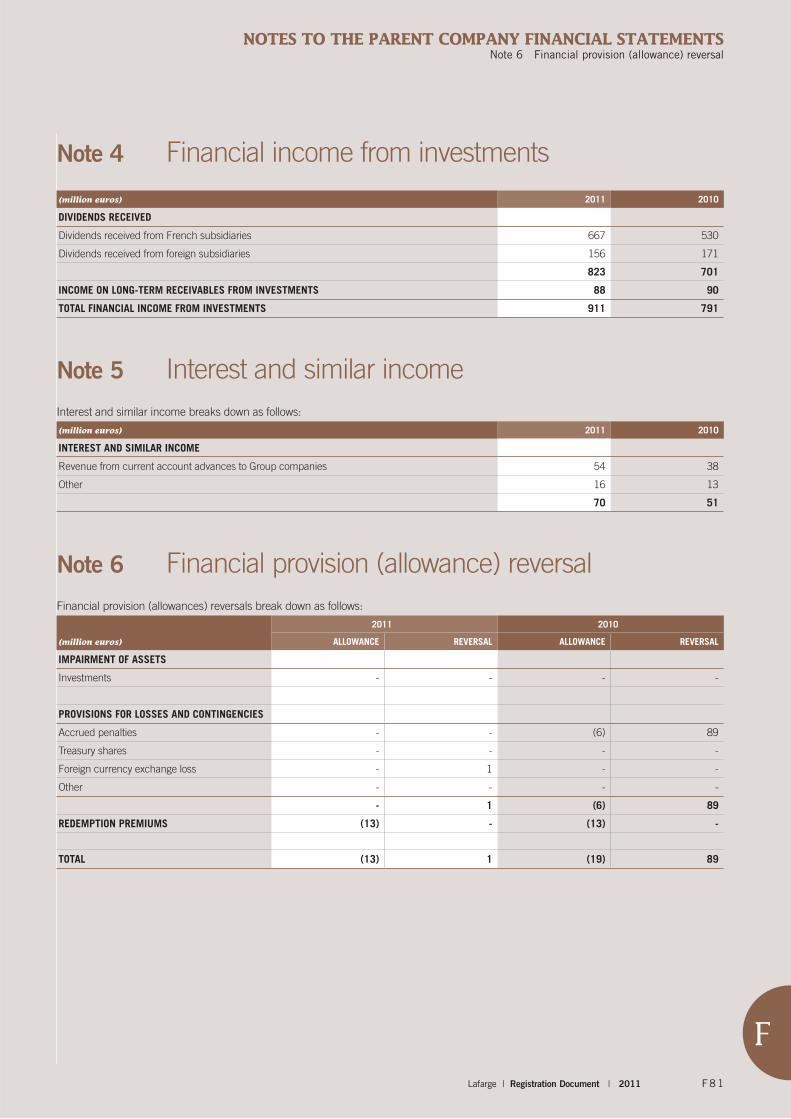
F
NOTES TO THE PARENT COMPANY FINANCIAL STATEMENTS Note 6 Financial provision (allowance) reversal
Note 4 Financial income from investments
(million euros) 2011 2010
DIVIDENDS RECEIVED
Dividends received from French subsidiaries 667 530
Dividends received from foreign subsidiaries 156 171
823 701
INCOME ON LONG-TERM RECEIVABLES FROM INVESTMENTS 88 90
TOTAL FINANCIAL INCOME FROM INVESTMENTS 911 791
Note 5 Interest and similar income
Interest and similar income breaks down as follows:
(million euros) 2011 2010
INTEREST AND SIMILAR INCOME
Revenue from current account advances to Group companies 54 38
Other 16 13
70 51
Note 6 Financial provision (allowance) reversal
Financial provision (allowances) reversals break down as follows:
(million euros)
2011 2010
ALLOWANCE REVERSAL ALLOWANCE REVERSAL
IMPAIRMENT OF ASSETS
Investments - - - -
PROVISIONS FOR LOSSES AND CONTINGENCIES
Accrued penalties - - (6) 89
Treasury shares - - - -
Foreign currency exchange loss - 1 - -
Other - - - -
- 1 (6) 89
REDEMPTION PREMIUMS (13) - (13) -
TOTAL (13) 1 (19) 89
F81Lafarge | Registration Document | 2011

FNOTES TO THE PARENT COMPANY FINANCIAL STATEMENTS Note 7 Interest and similar expenses
Note 7 Interest and similar expenses
Interest and similar expenses break down as follows:
(million euros) 2011 2010
INTEREST AND OTHER EXPENSES ON INVESTMENTS
Expenses on payables related to investments (21) (20)
Expenses on current account advances from Group companies (41) (26)
(62) (46)
OTHER INTEREST AND SIMILAR EXPENSES
Interest on bond issues (651) (602)
Interest on bank borrowings (42) (21)
Interest on negotiable debt instruments (45) (53)
Other interest and financial expenses (6) (93)
(744) (769)
TOTAL INTEREST AND SIMILAR EXPENSES (806) (815)
In 2010, other interest and similar expenses included the payment of accrued interest (89 million euros) on the competition fine.
Note 8 Exceptional income (loss)
(million euros) 2011 2010
Net gains (losses) on disposals 5 -
Write-off of intangible asset (13) -
Risk related to performance share allotment plan (4) (7 )
Reversal revaluation reserve 1976 85 -
Risk related to the competition litigation - 250
Other net exceptional items (1) (251)
EXCEPTIONAL INCOME (LOSS) 72 (8)
In 2010, this item mainly included the payment of the competition fine
for 249.6 million euros and the reversal of the corresponding provision.
In 2011, the exceptional income corresponds mainly to the reversal
revaluation reserve (1976 revaluation) of its investments Lafarge
Ciments and Lafarge Ciments Distribution, following the transfer of
this investment to its subsidiary Sofimo.
Moreover, the 13 million euros correspond to software developments
which are not needed anymore due to the disposal of the Gypsum
activity by the Group .
Note 9 Income tax
(million euros) 2011 2010
INCOME TAX
Gain or (loss) from tax Group regime 103 107
Income tax, withholding tax, other (35) (31)
68 76
At December 31, 2011, tax loss carry forwards attributable to the Group totaled 1,932 million euros.
Registration Document | 2011 | LafargeF82

F
NOTES TO THE PARENT COMPANY FINANCIAL STATEMENTS Note 12 Marketable securities
Note 10 Intangible assets and property, plant and equipment
The change in intangible assets and property, plant and equipment in the period breaks down as follows:
(million euros) DECEMBER 31, 2010 INCREASE DECREASE DECEMBER 31, 2011
INTANGIBLE ASSETS
Gross amount 144 38 22 160
Accumulated amortization (69) (20) (10) (79)
Net amount 75 18 12 81
PROPERTY, PLANT & EQUIPMENT
Gross amount 63 5 29 39
Accumulated depreciation (34) (3) (11) (26)
Net amount 29 2 18 13
TOTAL 104 20 30 94
No impairment is recorded for intangible assets and property, plant and equipment.
Note 11 Financial assets
(million euros) DECEMBER 31, 2010 INCREASE DECREASE DECEMBER 31, 2011
Investments(1) 24,849 1,371 758 25,462
Long-term receivables from investments 1,607 63 496 1,174
Other financial assets
Other investment securities 10 - - 10
Security deposit 4 - 1 3
14 - 1 13
FINANCIAL ASSETS 26,470 1,434 1,255 26,649
(1) The list of subsidiaries and investments is presented in Note 28 –“Investments”.
The increase in investments concerns our subsidiaries Lafarge North
America Inc., Sofimo and Lafarge Centre de Recherche for respectively
1,144 million euros, 207 million euros and 20 million euros. The
decrease in investments is explained by the capital decrease of Sabelfi
snc for 551 million euros and the sale of Lafarge Ciments and Lafarge
Ciments Distribution for 207 million euros.
Long-term receivables are composed of long-term loans granted
to directly- or indirectly-held affiliated companies. In 2011, Lafarge
Bulding Material Inc. (US) repaid its loan which had reached maturity
for 459 million euros.
Note 12 Marketable securities
(million euros) DECEMBER 31, 2010 INCREASE DECREASE DECEMBER 31, 2011
Lafarge S.A. treasury shares(1) 26 - 9 17
MARKETABLE SECURITIES 26 - 9 17
(1) See Note 13 “Lafarge S.A. treasury shares” for more information.
F83Lafarge | Registration Document | 2011
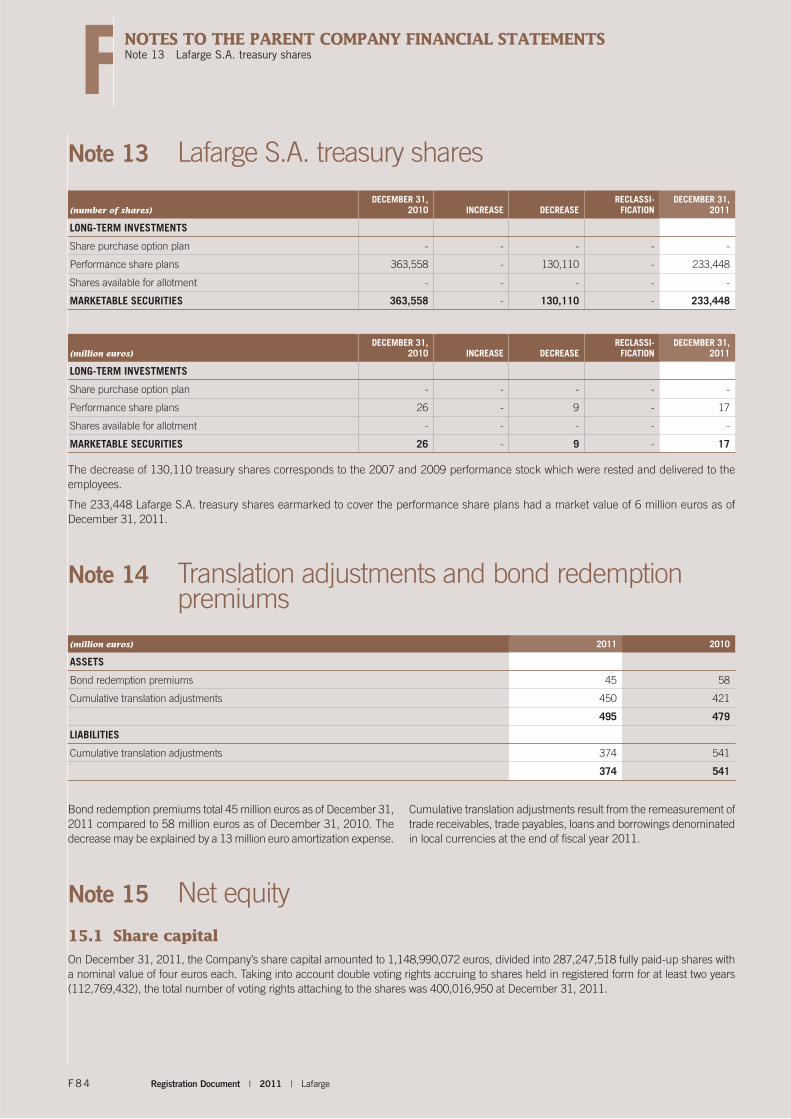
FNOTES TO THE PARENT COMPANY FINANCIAL STATEMENTS Note 13 Lafarge S.A. treasury shares
Note 13 Lafarge S.A. t reasury shares
(number of shares)DECEMBER 31,
2010 INCREASE DECREASERECLASSI-
FICATIONDECEMBER 31,
2011
LONG-TERM INVESTMENTS
Share purchase option plan - - - - -
Performance share plans 363,558 - 130,110 - 233,448
Shares available for allotment - - - - -
MARKETABLE SECURITIES 363,558 - 130,110 - 233,448
Note 14 Translation adjustments and bond redemption premiums
(million euros) 2011 2010
ASSETS
Bond redemption premiums 45 58
Cumulative translation adjustments 450 421
495 479
LIABILITIES
Cumulative translation adjustments 374 541
374 541
Bond redemption premiums total 45 million euros as of December 31,
2011 compared to 58 million euros as of December 31, 2010. The
decrease may be explained by a 13 million euro amortization expense.
Cumulative translation adjustments result from the remeasurement of
trade receivables, trade payables, loans and borrowings denominated
in local currencies at the end of fiscal year 2011.
Note 15 Net equity
15.1 Share capital
On December 31, 2011, the Company’s share capital amounted to 1,148,990,072 euros, divided into 287,247,518 fully paid-up shares with
a nominal value of four euros each. Taking into account double voting rights accruing to shares held in registered form for at least two years
(112,769,432), the total number of voting rights attaching to the shares was 400,016,950 at December 31, 2011.
(million euros)DECEMBER 31,
2010 INCREASE DECREASERECLASSI-
FICATIONDECEMBER 31,
2011
LONG-TERM INVESTMENTS
Share purchase option plan - - - - -
Performance share plans 26 - 9 - 17
Shares available for allotment - - - - -
MARKETABLE SECURITIES 26 - 9 - 17
The decrease of 130,110 treasury shares corresponds to the 2007 and 2009 performance stock which were rested and delivered to the
employees.
The 233,448 Lafarge S.A. treasury shares earmarked to cover the performance share plans had a market value of 6 million euros as of
December 31, 2011.
Registration Document | 2011 | LafargeF84

F
NOTES TO THE PARENT COMPANY FINANCIAL STATEMENTS Note 16 Provisions for losses and contingencies
Changes in the share capital during the fiscal year ended December 31, 2011
The Company’s share capital at December 31, 2010 amounted to 1,145,815,116 euros, divided into 286,453,779 shares with a nominal value of
four euros each. Since December 31, 2011, the Company’s share capital has increased by a total of 793,739 shares as a result of the following:
AMOUNT OF SUBSCRIPTIONS OR DEDUCTIONS (EUROS)
NUMBER OF SHARES ISSUED CAPITAL SHARE PREMIUM TOTAL
Share capital increase reserved for Group’s
employees (July 29, 2011) 793,739 3,174,956 24,351,386 27,526,342
TOTAL AT DECEMBER 31, 2011 793,739 3,174,956 24,351,386 27,526,342
Potential Share capital at December 31, 2011
The number of shares as at December 31, 2011 could be increased by a maximum of 8,511,063 shares in the hypothetical scenario that stock
options granted to employees existing on that date were exercised. 5,402,651 out of these existing stock options could have been exercised at
December 31, 2011. The remaining 3,108,412 stock options can only be exercised upon expiry of a period of four years after their grant and
subject to the performance conditions attached to some of these stock options being fulfilled.
15.2 Change in net equity
(million euros) COMMON STOCKADDITIONAL
PAID-IN CAPITAL OTHER RESERVESRETAINED EARNINGS NET INCOME TOTAL
NET EQUITY AT DECEMBER 31, 2010
(Before appropriation of 2010 income) 1,146 9,828 830 1,942 49 13,795
Appropriation of 2010 income - - 2 (241) (49) (288)
Share capital increase 3 25 - - - 28
Reversal revaluation reserve 1976 - - (85) - - (85)
Net income for 2011 - - - - 206 206
NET EQUITY AT DECEMBER 31, 2011
(Before appropriation of 2011 income) 1,149 9,853 746 1,701 206 13,655
Note 16 Provisions for losses and contingencies
Change in provisions for losses and contingencies break down as follows:
(million euros) DECEMBER 31, 2010 ADDITION UTILIZATION REVERSAL DECEMBER 31, 2011
Provisions for retirement benefit obligations* 52 22 19 - 55
Provision for share-based payment 31 5 9 - 27
Provision for tax 14 21 - - 35
Other provisions for losses and contingencies 7 2 1 - 8
PROVISIONS FOR LOSSES AND CONTINGENCIES 104 50 29 - 125
Of which employee expenses 1 1 -
Of which operating 22 19 -
Of which financial - 1 -
Of which exceptional 6 8 -
Of which tax 21 - -
50 29 -
* See Note 17 “Pension benefit obligations” for more information.
At December 31, 2011, Lafarge S.A. has covered its most reasonable estimate of the risk which may result from the tax audit in progress
considering notably the technical merits of its positions.
In November 2008, the major European cement players, including
Lafarge, were investigated by the European Commission for alleged
anti-competitive practices. By a letter dated December 6, 2010,
the Commission notified the parties of the opening of an official
investigation (which do not however constitute a statement of
objection), while reminding them that at that stage, it did not have
conclusive evidence of anti-competitive practices. The alleged
offences, which will be the subject of the detailed investigation, involve
any possible restrictions of commercial trade in or upon entry to the
EEA, market sharing, and coordination of prices on the cement and
F85Lafarge | Registration Document | 2011

FNOTES TO THE PARENT COMPANY FINANCIAL STATEMENTS Note 17 Pension benefit obligations
related markets (concrete, aggregates). In the case of Lafarge, seven
(7) countries are quoted: France, the United Kingdom, Germany,
Spain, the Czech Republic, Greece and Austria. The Commission’s
investigation is ongoing and Lafarge is answering to its various requests
for information. I n November 2011, further to the answer by Lafarge
of the last questionnaire received, the Commission notified Lafarge an
injunction to waive any reserve to the answer and provide any further
information deemed necessary to complete its investigation, under the
threat of a penalty. Lafarge promptly complied with this new request
for information and lodged a lawsuit before the EU General Court with
a view to obtaining the annulment of such injunction decision. The
completion date of this investigation is unknown and no conclusion
can be drawn at this stage.
Note 17 Pension benefit obligations
Lafarge S.A.’s pension benefit obligation comprises supplementary
pension plans and termination benefits.
In 2007, the Company transferred its obligation relating to the
supplementary defined benefit pension schemes of current retirees
through an insurance contract with Cardif Assurance Vie. The premium
paid amounted to 15 million euros in 2011, as in 2010. In accordance
with French Regulations, the insurer guarantees pension indexation
up to the amount of technical gains allocated to the contract, with
any residual cost of pension indexation remaining with the Company.
Obligations for supplementary pension plans and termination benefits
were valued using the projected unit credit method.
The main assumptions underlying these valuations are outlined below:
(million euros, unless otherwise indicated) 2011 2010
Discount rate 4.30% 4.00 - 4.75%
Salary increase rate 2 à 5.5% 2 à 5.5%
Long-term return expected on pension fund assets - -
Discounted value of the obligation 139 153
Fair value of pension fund assets - -
Actuarial gains (losses) and impact of plan modifications not recognized (84) (101)
PROVISION FOR PENSION BENEFIT OBLIGATIONS 55 52
Note 18 Financial debt
18.1 Financial debt by nature
(million euros)AMOUNT OUTSTANDING AT DECEMBER 31, 2010 INCREASE DECREASE
OTHER MOVEMENTS*
AMOUNT OUTSTANDING AT DECEMBER 31, 2011
BOND ISSUES
Bond issues (excluding accrued interest) 11,066 - 1,199 79 9,946
Accrued interest on bond issues 281 255 281 - 255
11,347 255 1,480 79 10,201
BANK BORROWINGS 1,206 370 1 - 1,575
OTHER FINANCIAL DEBT
Other loans and commercial paper 1,361 - 658 - 703
Long-term payables from investments 399 - 47 - 352
1,760 - 705 - 1,055
TOTAL FINANCIAL DEBT 14,313 625 2,186 79 12,831
* Of which translation adjustments
Registration Document | 2011 | LafargeF86

F
NOTES TO THE PARENT COMPANY FINANCIAL STATEMENTS Note 19 Derivatives
18.2 Bond issues
(million euros) CURRENCY INITIAL AMOUNT RATE MATURITYAMOUNT OUTSTANDING AT DECEMBER 31, 2011
AMOUNT OUTSTANDING AT DECEMBER 31, 2010
2001 bond GBP 538 6.875% 11 years 419 407
2002 bond GBP 307 6.625% 15 years 239 232
2003 bond EUR 500 5.448% 10 years 500 500
2004 bond EUR 612 5.000% 10 years 612 612
2005 bond EUR 500 4.250% 11 years 500 500
2005 bond EUR 500 4.750% 15 years 500 500
2006 bond USD 444 6.150% 5 years - 449
2006 bond USD 444 7.125% 30 years 464 449
2006 bond USD 592 6.500% 10 years 618 599
2007 bond EUR 500 5.375% 10 years 500 500
2008 bond EUR 750 5.750% 3 years - 750
2008 bond EUR 750 6.125% 7 years 750 750
2009 bond EUR 1000 8.875%* 5 years 1,000 1,000
2009 bond GBP 411 10.000%* 8 years 419 406
2009 bond EUR 750 6.750%* 10 years 750 750
2009 bond EUR 750 8.875%* 7 years 750 750
2010 bond USD 412 6.200%* 5 years 425 412
2010 bond EUR 500 6.250%* 8 years 500 500
2010 bond EUR 1000 6.625%* 8 years 1,000 1,000
9,946 11,066
Accrued interest on bond issues 255 281
BOND ISSUES 10,201 11,347
* In 2011, interest rate mentioned takes into account step up clauses related to these bonds further to the degradation of our long term credit rating by the rating agencies . Additional
interests of 21 million euros have been recorded due to this degradation.
18.3 Bank borrowings
As of December 31, 2011, bank borrowings amount to 1,575 million euros and include draw-downs of 768 million euros, maturing in 2012,
on the credit facility set-up to finance the OBMHE acquisition, amount unchanged since 2010.
The decrease of bond issues corresponds to the repayment of two bond
issues with a 2011 maturity date for respectively 449 million euros and
750 million euros (see Note 18.2). The loans secured by Lafarge S.A.
do not contain any clause requiring continuous compliance with certain
financial ratios. However, the loans secured by some subsidiaries of the
Group contain that type of clause. If we, or under certain conditions,
our material subsidiaries, fail to comply with our or their covenants,
then our lenders could declare default and accelerate a significant
part of our indebtedness.
3,973 million euros of credit lines are fully undrawn at December 31,
2011.
Note 19 Derivatives
19.1 Currency risk
Lafarge S.A. uses forward purchases and sales of currencies and
currency swaps to:
• refinance loans and borrowings granted to subsidiaries in a currency
other than the euro;
• hedge the currency risk incurred by the Group’s subsidiaries (firm
commitments and highly probable transactions), bearing in mind
that contracts negotiated with subsidiaries are hedged in exactly
the same manner in the interbank market and do not give rise to a
currency position for Lafarge S.A.
At December 31, 2011, most forward exchange contracts had a
maturity date of less than one year.
F87Lafarge | Registration Document | 2011

FNOTES TO THE PARENT COMPANY FINANCIAL STATEMENTS Note 20 Financial commitments
The nominal and fair values of derivatives at the reporting date date were as follows:
(million euros)
AT DECEMBER 31, 2011 AT DECEMBER 31, 2010
NOTIONAL FAIR VALUE* NOTIONAL FAIR VALUE*
FORWARD PURCHASES AND CURRENCY
SWAPS
US dollar (USD) 1,039 17 205 1
Pound sterling (GBP) 1,040 17 887 (16)
Other currencies 194 - 79 1
2,273 34 1,171 (14)
FORWARD SALES AND CURRENCY SWAPS
US dollar (USD) 355 (10) 699 6
Pound sterling (GBP) 55 - 44 1
Other currencies 138 2 131 (1)
548 (8) 874 6
* The fair value of currency derivatives was calculated using market prices that Lafarge S.A. would pay or receive to unwind these positions.
19.2 Interest-rate risk
Lafarge S.A.’s exposure to interest rate fluctuations comprises two
types of risk:
• a fair value risk arising from fixed-rate financial assets and liabilities:
interest-rate fluctuations have an influence on their market value;
• a cash flow risk arising from floating-rate financial assets and
liabilities: fluctuations in interest rates have a direct impact on the
Company’s future earnings.
As part of its general policy, Lafarge S.A. manages these two risk
categories using, if necessary, interest-rate swaps.
The notional and fair values of interest rate derivatives at the reporting date date were as follows:
Note 20 Financial commitments
Commitments given for 1,618 million euros include financial guarantees given for 1,429 million euros and vendor warranties given in connection
with asset sales for 189 million euros. As of December 31, 2011, there are no securities or assets pledged.
AT DECEMBER 31, 2011 NOTIONAL VALUE OF DERIVATIVES BY EXPIRY DATE*
(million euros, unless otherwise indicated)
AVERAGE INTEREST
RATE 2012 2013 2014 2015 2016 > 5 YEARS TOTALFAIR
VALUE**
INTEREST RATE SWAP
Fixed-rate payer 4.5% 70 58 42 - - - 170 (8)
Fixed-rate receiver 1.7% 1,200 300 - - - - 1,500 3
Other interest-rate derivatives - - - - - - - - -
AT DECEMBER 31, 2010
NOTIONAL VALUE OF DERIVATIVES BY EXPIRY DATE*
(million euros, unless otherwise indicated)
AVERAGE INTEREST
RATE 2011 2012 2013 2014 2015 > 5 YEARS TOTALFAIR
VALUE **
INTEREST RATE SWAP
Fixed-rate payer 4.5% - 70 58 42 - - 170 (11)
Fixed-rate receiver 1.2% - 1,200 300 - - - 1,500 2
Other interest-rate derivatives - - - - - - - - -
* The notional value of derivatives represents the nominal value of financial instruments traded with counterparties.
** The fair value of interest-rate swaps was calculated using market prices that Lafarge S.A. would have to pay or receive to unwind the positions.
Registration Document | 2011 | LafargeF88

F
NOTES TO THE PARENT COMPANY FINANCIAL STATEMENTS Note 21 Maturity of receivables and liabilities at the reporting date
Note 21 Maturity of receivables and liabilities at the reporting date
NET AMOUNT AT
DECEMBER 31, 2011
FALLING DUE IN
LESS THAN ONE YEAR BETWEEN 1 AND 5 YEARS OVER 5 YEARS
RECEIVABLES
Non-current receivables
Long-term receivables from investments 1,174 689 23 462
Other financial assets 13 - - 13
1,187 689 23 475
Current receivables
Loans and current accounts granted to
subsidiaries 2,275 2,275 - -
Other 38 38 - -
2,313 2,313 - -
3,500 3,002 23 475
LIABILITIES
Financial Debt
Bond issues 10,201 674 5,155 4,372
Bank borrowings 1,575 1,015 560 -
Negotiable debt instruments 703 14 289 400
Long-term payables owed to investments 352 - 352 -
12,831 1,703 6,356 4,772
TAX AND EMPLOYEE-RELATED LIABILITIES 46 46 - -
OTHER LIABILITIES
Borrowings and current accounts received from
Group companies 3,736 3,736 - -
Other* 97 97 - -
3,833 3,833 - -
16,710 5,582 6,356 4,772
* Settlement periods: Law no. 2008-776 of August 4, 2008 on the modernization of the economy, known as the LME, and Decree no. 2008-1492 of December 30, 2008 rendered for the
application of article L. 144-6-1 of the French Commercial Code.
The 97 million euros of other liabilities include trade payables for an amount of 45 million euros as of December 31, 2011 (French and foreign
suppliers).
The following schedule presents trade payables from the invoice date:
(million euros)DEBT DUE AT YEAR
END30 DAYS FROM INVOICE DATE
BETWEEN 31 AND 60 DAYS FROM INVOICE DATE
> 61 DAYS FROM INVOICE DATE
TOTAL AT DECEMBER 31,
2011
Trade payables (including debt to suppliers of fixed assets) 1.3 4.5 24.1 15.1 45.0
(million euros)DEBT DUE AT YEAR
END30 DAYS FROM INVOICE DATE
BETWEEN 31 AND 60 DAYS FROM INVOICE DATE
> 61 DAYS FROM INVOICE DATE
TOTAL AT DECEMBER 31,
2010
Trade payables (including debt to suppliers of fixed assets) - 4.0 18.5 3.6 26.1
F89Lafarge | Registration Document | 2011

FNOTES TO THE PARENT COMPANY FINANCIAL STATEMENTS Note 22 Related parties
Note 22 Related parties
(million euros) NET AMOUNT OF WHICH RELATED PARTIES OF WHICH OTHER INVESTMENTS
FINANCIAL ASSETS
Investments 25,462 25,462 -
Long-term receivables from investments 1,174 1,174 -
FINANCIAL DEBT
Other loans and commercial paper 1,055 352 -
OTHER RECEIVABLES
Loans and current accounts 2,275 2,271 4
Other receivables 38 26 -
OTHER LIABILITIES
Borrowings and current accounts 3,736 3,733 3
Other 97 21 -
NET INCOME FROM INVESTMENTS 911 911 -
INTEREST AND SIMILAR INCOME 70 54 -
INTEREST AND SIMILAR EXPENSES (806) (62 ) -
Pursuant to the regulations of the ANC, the French standard-setting body, and article R. 123-198 11 of the French Commercial Code, on related
parties, Lafarge S.A. hereby reports that it did not enter into any significant transaction considered not to be arms length business during 2011.
Note 23 Compensation of the Board of Directors and executive management
(million euros) 2011 2010
Board of Directors 0.61 0.61
Executive management* 8.95 10.01
* Executive Management comprises 10 members, including the Chief Executive Officer, as of December 31, 2011.
Note 24 Average number of employees during the year
2011 2010
Management 382 356
Supervisors and technicians 126 124
Other employees 21 22
TOTAL EMPLOYEES 529 502
Registration Document | 2011 | LafargeF90

F
NOTES TO THE PARENT COMPANY FINANCIAL STATEMENTS Note 27 Events after the reporting period
Note 25 Individual rights to training
In compliance with recommendation 2004F issued by the Urgent Issues Task Force of the French National Accounting Council (CNC) concerning
accounting for individual rights to training, Lafarge did not record any provisions for training rights in the financial statements for the year ended
December 31, 2011. Rights acquired at year-end 2011 are estimated at 36,704 hours.
Note 26 Deferred tax position - tax basis (holding company only)
(million euros) 2011 2010
DEFERRED TAX LIABILITIES
Tax-driven provisions 1 2
Capital gains rolled over - Long term 1,849 1,764
DEFERRED TAX ASSETS
Provision for pensions 55 52
Other provisions 7 4
Temporarily non-deductible expenses 12 26
TAX LOSSES CARRIED FORWARD
Tax Group losses 1,932 1,425
Revaluation account (1976) - tax free 3 88
The tax audit in progress could induce a reduction of the tax losses carried forward of the French tax group.
Note 27 Events after the reporting period
As part of its new country-based organization project, Lafarge announced on February 2 , 2012, a proposed reorganization of its Corporate
functions.
F91Lafarge | Registration Document | 2011

FNOTES TO THE PARENT COMPANY FINANCIAL STATEMENTS Note 28 Investments
Note 28 InvestmentsSubsidiaries and investments at December 31, 2011
(million of currency unit) CURRENCY
COMMON STOCK(A)
RESERVES AND RETAINED
EARNINGS(A)
SHARE OF CAPITAL HELD
% (A) (B)
BOOK VALUE OF SHARES HELD(C)
LOANS AND ADVANCES
GRANTED AND NOT REPAID(C)
GUARANTEES & ENDOR-SEMENTS
GIVEN BY THE COMPANY(C)
NET REVENUES EXCLUDING
TAX AT CLOSING(A)
NET INCOME (PROFIT OR
LOSS) AT CLOSING(A)
DIVIDENDS RECEIVED
BY THE COMPANY OVER THE
YEAR(C)GROSS NET
A. DETAILED INFORMATION ON SUBSIDIARIES (1) AND INVESTMENTS (2) ET (3) BELOW
1. SUBSIDIARIES (OVER 50% OF CAPITAL HELD BY THE COMPANY):
Sofimo EUR 1,055 16,576 100.00 16,676 16,676 376 - - 1,604 521
Lafarge Gypsum
International EUR 798 76 99. 99 934 934 - - - 495 -
Lafarge Centre
de Recherche EUR 23 1 100.00 23 23 - - - 2 2
Sabelfi EUR 2,721 1 99. 99 2,728 2,728 - - - 132 132
Cimento
Portland Lacim BRL 1,232 40 56.43 341 341 - - 1,098 95 21
Lafarge North
America Inc. USD 6,557 87.53 4,709 4,709 245 - 4,581 (27) -
2. INVESTMENTS (10 TO 50% OF CAPITAL HELD BY THE COMPANY)
Ciments du
Cameroun CFA 5,600 24,600 43.65 15 15 - - 92,981 4,073 3
Lafarge Zement
gmbh EUR 26 52 10.00 29 25 - - - 9 -
3. INVESTMENTS (LESS THAN 10% OF CAPITAL HELD BY THE COMPANY)
B. GENERAL INFORMATION CONCERNING OTHER SUBSIDIARIES AND INVESTMENTS
1. SUDSIDIARIES NOT INCLUDED UNDER A.1)
French (total) 5 5 - 4
Foreign (total) 6 6 - -
2. INVESTMENTS NOT INCLUDED UNDER A.2) AND A.3)
French (total) - - - -
Foreign (total) 1 - - -
TOTAL 25,467 25,462 621 683
(A) In local currency for foreign subsidiaries.
(B) Before appropriation of net income and interim dividend.
(C) In million euros.
Registration Document | 2011 | LafargeF92

F
FINANCIAL STATEMENTS OF THE PARENT COMPANY LAFARGE S.A. Change in the financial income of the Company during the last five years
2011 2010 2009 2008 2007
1. CAPITAL STOCK
Capital stock (euros) 1,148,990,072 1,145,815,116 1,145,813,264 780,946,136 690,258,300
Number of existing shares of common stock 287,247,518 286,453,779 286,453,316 195,236,534 172,564,575
Maximum number of future shares to be created 8,511,063 9,099,072 8,060,756 7,033,553 6,502,420
through conversion of bonds
through exercise of stock options 8,511,063 9,099,072 8,060,756 7,033,553 6,502,420
2. TRANSACTIONS FOR THE YEAR (thousand euros)
a) Gross sales revenues(1) 1,536,243 1,322,722 1,625,520 1,878,341 1,634,956
b) Income before taxes, profit-sharing and amortization and
provisions 88,20 8 (320,834) 213,495 709,856 492,565
c) Income taxes 68,352 76,060 118,439 151,900 159,648
d) Employee profit-sharing owed for the year
e) Income after taxes, profit sharing and amortization and
provisions 205,507 49,032 254,309 780,352 668,817
f) Income distributed 144,559 287,903 575,207 392,654 784,026
including 10% increase(2) 1,052 1,683 3,028 2,942 5,524
Earnings per share (euros)
a) Income after taxes, employee profit-sharing but before
amortization and provisions 0.84 (0.85) 1.16 4.41 3.78
b) Income after taxes, employee profit-sharing and amortization
and provisions 0.72 0.17 0.89 4.00 3.88
c) Net dividend 0.500 1.000 2.000 2.000 4.000
Net loyalty dividend 0.550 1.100 2.200 2.200 4.400
3. PERSONNEL
Number of employees at December 31 528 510 485 448 435
Payroll (thousand euros)(3) 94,773 92,799 78,315 87,421 91,934
Social benefits (thousand euros)(4) 47,36 9 48,098 35,088 33,261 37,383
Bonuses and profit-sharing paid (thousand euros) 1,732 2,142 1,592 3,382 2,806
(1) Gross sales revenues represent the revenues from ordinary activities, which include the sold production (services) and financial income . For 2008, only income and expenses on
interest rate financial instruments are net. On the same basis, gross sales revenues for the previous years would have been as follows 1,856,807 in 2007.
(2) Increase in the dividend for registered shares held for more than two years.
(3) Including retirement indemnities, provision for performance shares grants.
(4) Social organizations, charitable projects and other employee expenses for impatriates, etc.
Change in the financial income of the Company during the last five years (articles R. 225-81, R. 225-83, R. 225-102 of the French Commercial Code)
F93Lafarge | Registration Document | 2011

FFINANCIAL STATEMENTS OF THE PARENT COMPANY LAFARGE S.A. Special Report of the statutory auditors on Related-Party Agreements and Commitments
Special Report of the statutory auditors on Related-Party Agreements and CommitmentsThis is a free translation into English of a report issued in the French language and is provided solely for the convenience of English-speaking
users. This report should be read in conjunction with, and construed in accordance with, French law and professional auditing standards
applicable in France.
Year ended December 31, 2011
To the Shareholders,
In our capacity as statutory auditors of your company, we hereby report on certain related-party agreements and commitments.
We are required to inform you, on the basis of the information provided to us, of the terms and conditions of those agreements and commitments
indicated to us, or that we may have identified in the performance of our engagement. We are not required to comment as to whether they
are beneficial or appropriate or to ascertain the existence of any such agreements and commitments. It is your responsibility, in accordance
with Article R. 225-31 of the French Commercial Code (Code de Commerce), to evaluate the benefits resulting from these agreements and
commitments prior to their approval.
In addition, we are required, where applicable, to inform you in accordance with Article R. 225-31 of the French Commercial Code (Code de
Commerce) concerning the implementation of the agreements and commitments already approved by the General Meeting of Shareholders.
We performed those procedures which we considered necessary to comply with professional guidance issued by the French national auditing
body (Compagnie Nationale des Commissaires aux Comptes) relating to this type of engagement. These procedures consisted in verifying that
the information provided to us is consistent with the documentation from which it has been extracted.
Agreements and commitments submitted for approval by the General Meeting of Shareholders
Agreements and commitments authorized during the year
In accordance with Article L. 225-40 of the French Commercial Code (Code de Commerce), we have been advised of certain related-party
agreements and commitments which received prior authorization from your Board of Directors.
With Mr Bruno Lafont, Chairman and Chief Executive Officer of your company
Change and preservation of Mr. Bruno Lafont’s employment contract, Chairman and Chief Executive Officer
At its meeting on July 27, 2011, the Board of Directors, upon the recommendation of the Committee of the corporate governance, decided to
maintain Mr. Bruno Lafont’s employment contract and to modify it in the effect to delete the clause of commitment of presence by which Mr.
Bruno Lafont was committed not to leave the Company before June 30, 2011, in return of which the notice of termination could run until the
same date.
As a consequence, the Board of Directors decided to adopt in all its capacities the new complete and amended version of this contract and
confirmed its suspension, from January 1, 2006, when Mr. Bruno Lafont was named as Chief Executive Officer.
The Board of Directors considers that the 29 years seniority of Mr. Bruno Lafont within Lafarge Group together with the impact of this seniority
on the internal promotion policy, which enables to promote experienced senior executives as corporate officers, justifies its decision to maintain
the employment contract of Mr. Bruno Lafont.
These decisions do not modify Mr. Bruno Lafont situation relating especially to the potential benefits of its pension plan or severance indemnity.
Agreements and commitments authorized after closing
We have been advised of certain related party agreements and commitments which received prior authorization from your Board of Directors
after closing.
With NNS Holding Sàrl, Orascom Construction Industries SAE, M. Nassef Sawiris and other parties
Board members concerned
Mr. Nassef Sawiris, a Director of your company, is also the Chairman and CEO of Orascom Construction Industries SAE and a Director of NNS
Holding Sàrl.
Mr. Jérôme Guiraud, a Director of your company, is also a Director of Orascom Construction Industries SAE.
Amendment to the Shareholders’ Agreement dated December 9, 2007
The Shareholders’ Agreement contains various commitments concerning in particular the 22.5 million shares issued for the benefit of NNS
Holding Sàrl through a reserved capital increase in 2008, among which some obligations of preservation of the shares and limitation of acquisition
of shares which expire on March 27th, 2012.
Registration Document | 2011 | LafargeF94
F
FINANCIAL STATEMENTS OF THE PARENT COMPANY LAFARGE S.A. Special Report of the statutory auditors on Related-Party Agreements and Commitments
The amendment authorized by the Board of Directors of March 15th, 2012 aims at:
• maintain until March 27th, 2015 and only on the 22.5 million shares initially subscribed by NNS Holding Sàrl, the preliminary disclosure
obligation by NNS Holding Sàrl to Lafarge SA in case of potential disposal of its shares,
• pre-approve a list of main financial institutions as intermediaries accepted in order to, where necessary, implement such disposals,
• maintain until the term of the Shareholders’ Agreement and only on the 22.5 million shares initially subscribed by NNS Holding Sàrl, the ban
for NNS Holding Sàrl to dispose its shares to Lafarge competitors,
• align disclosure obligations after transactions on shares on the existing legal and statutory obligations.
The Board of Directors considers that this amendment is not going against the social interest of your company as it aims to update the
Shareholders’ Agreement, without any financial impact, and does not offer any additional specific right to NNS Holding Sàrl compared to other
shareholders of your company.
Agreements and commitments already approved by the General Meeting of Shareholders
Agreements and commitments approved in prior years whose implementation continued during the year
In accordance with Article R. 225-30 of the French Commercial Code (Code de Commerce), we have been advised that the following agreements
and commitments, already approved in prior years by the Shareholders’ Meeting, remained effective during this financial year.
With BNP Paribas
Board members concerned
Ms. Hélène Ploix, Director of your company, is a Director of BNP Paribas, and Mr. Baudouin Prot, Director of your company, is Chairman of
the Board of Directors of BNP Paribas.
a. Domiciliation agent agreement
At its meeting on May 24, 2006, the Board of Directors authorized the domiciliation agent agreement between your company and BNP Paribas
concerning the commercial paper program.
The amounts paid by your company in 2011 in respect of this agreement totaled 3,615 euros.
b. Loan of 2.4 billion euros guaranteed by BNP Paribas for the acquisition of Orascom Building Materials Holding
At its meeting on December 9, 2007, the Board of Directors authorized a loan agreement totaling 7.2 billion euros between your company
and BNP Paribas and two other financial institutions to finance the acquisition of the share capital of the Egyptian company Orascom Building
Materials Holding.
BNP Paribas had originally guaranteed to finance an amount of 2.4 billion euros. Under this agreement, the costs relating to the set-up of this
line of credit correspond to the 13.8 million euros in commissions paid by your company to BNP Paribas in 2007.
As a result of this commitment, a 78 million euros debt payable to BNP Paribas was recorded in your company’s balance sheet as at
December 31, 2011 (unchanged compared to 2010).
c. Transfer of retirement plans for French executives, senior executives and members of the Executive Committee to Cardif Assurance Vie, a subsidiary of BNP Paribas
The Board of Directors authorized the conclusion of insurance contracts between your company and Cardif Assurance Vie, a subsidiary of BNP
Paribas, the purpose of which was to transfer defined-benefit retirement plans. These agreements were authorized by the Board of Directors
at its Meetings of August 1, 2007 and November 6, 2008 and approved by the Shareholders’ Meetings of May 7, 2008 and of May 6, 2009.
As these agreements remained in effect in 2011, the total amount of contributions (allocated to retirement capital, expenses and other taxes)
paid by your company in respect of the two current contracts with Cardif Assurance Vie amounted to 14.8 million euros for the financial year
ended December 31, 2011.
d. Agreement covering the management of its investments department with BNP Paribas Securities Services, a subsidiary of BNP Paribas
At its meeting on September 8, 2004, the Board of Directors authorized an agreement covering the management of its investments department,
shareholders’ meetings, employee shareholding plans and stock option plans with BNP Paribas Securities Services, a wholly owned subsidiary
of BNP Paribas.
The amounts paid by your company in 2011 in respect of this agreement totaled 4.2 million euros.
Agreements and commitments approved in prior years which were not implemented during the year
In addition, we have been advised that the following agreements and commitments which were approved by the General Meeting of Shareholders
in prior years were not implemented during the year.
F95Lafarge | Registration Document | 2011

FFINANCIAL STATEMENTS OF THE PARENT COMPANY LAFARGE S.A. Special Report of the statutory auditors on Related-Party Agreements and Commitments
1. With Mr. Bruno Lafont, Chairman and Chief Executive Officer of your company
Supplementary pension plan of Mr. Bruno Lafont
At its meeting on December 16, 2005, the Board of Directors authorized an amendment to Mr. Bruno Lafont’s employment contract, whereby
he would benefit from a supplementary pension plan guaranteeing a pension based on his salary as a Director. The employment contract was
suspended as from January 1, 2006, the date of Mr. Bruno Lafont’s appointment as Chief Executive Officer. However, as a Director, he will
continue to benefit from the supplementary retirement benefit.
Moreover, at its meeting on November 6, 2008, the Board of Directors authorized the amendment of two supplementary benefit plans. One of
these amendments consists in including the c ompany’s Directors as potential beneficiaries of these benefit plans, which would provide, under
certain conditions, a retirement payment based on the last salaries received, irrespective of any other legal retirement benefits received by the
retired individual. The Shareholders’ Meeting of May 6, 2009 approved this agreement.
Mr. Bruno Lafont’s suspended employment contract and severance indemnity
At its meeting on February 19, 2009, the Board of Directors authorized the amendment to Mr. Bruno Lafont’s employment contract, for the
purpose of adapting the severance indemnity to the Afep Medef recommendations regarding the compensation of Executive Directors.
Mr. Bruno Lafont’s employment contract thus specifies (i) the conditions under which he would benefit from a contractual severance indemnity
(change of control or a change in strategy on the part of your company and performance conditions based on three criteria), in the event he
were to benefit from his employment contract at the end of his term as Chairman and Chief Executive Officer, and upon a dismissal and (ii)
the calculation methodology and the maximum amount of this potential severance indemnity (limited to a maximum of two years of the total
gross remuneration received).
2. With Orascom Construction Industries SAE
Board members concerned
Mr. Nassef Sawiris, a Director of your company, is also the Chairman and CEO of Orascom Construction Industries SAE.
Mr. Jérôme Guiraud, a Director of your company, is also a Director of Orascom Construction Industries SAE.
Amendment to the Agreement for the sale and purchase of the share capital of Orascom Building Materials Holding SAE reached between Lafarge and Orascom Construction Industries SAE on December 9, 2007
At its meeting on February 18, 2010, the Board of Directors authorized the signature of this amendment dated February 22, 2010.
Under the agreement dated December 9, 2007, your company acquired 50% of a joint venture in Saudi Arabia (Alsafwa Cement Company).
The agreement also stipulated that Orascom Construction Industries SAE would transfer various licenses and authorizations, as well as shares
and rights on land and tangible assets, as required for the company’s activity, to the company. Your company also benefited from a guarantee,
pursuant to which a claim has been filed.
The purpose of the amendment, dated February 22, 2010, is (i) to set the general framework for the steps that your company has to implement
to further develop the company and (ii) stipulates that these steps will be implemented without prejudice to the rights and claims of each party
to the Agreement, which are preserved and maintained.
Neuilly-sur-Seine and Paris-La Défense, March 16, 2012
The Statutory Auditors
French original signed by
DELOITTE & ASSOCIES ERNST & YOUNG Audit
Arnaud de Planta Frédéric Gourd Christian Mouillon Nicolas Macé
Registration Document | 2011 | LafargeF96

263Lafarge | Registration Document | 2011
Cross-reference tables
Cross-reference tablesEC Regulation 809/2004 Cross-reference table
In order to facilitate the reading of the present document as the form of the Registration Document, the cross-reference table below is used to
identify the corresponding Sections.
Items of Annex I to EC Regulation 809/2004 Location in this Report Page
1 PERSONS RESPONSIBLE Certification 165
2 STATUTORY AUDITORS
2.1 Name and address 10.1 Auditors 162
2.2 Resignation or removal of statutory auditors Not applicable -
3 SELECTED FINANCIAL INFORMATION
3.1 Selected historical financial information 1 Selected financial data 7
3.2 Selected financial information for interim periods Not applicable -
4 RISK FACTORS 2 Risk factors 11
5 INFORMATION ABOUT LAFARGE
5.1 History and development of the Company 3.1 The Group - General presentation 26
3.1.1 History and development of the Group 26
5.2 Investments 3.2.2 Recent acquisitions, partnerships and divestitures 28
3.4.5 Summary of our capital expenditures in 2011
and 2010 44
3.4.6 Capital expenditures planned for 2012 44
6 BUSINESS OVERVIEW
6.1 Principal activities 3.4 Our businesses 32
6.2 Principal markets 3.4 Our businesses 32
6.3 Exceptional factors 3.2.2 Recent acquisitions, partnerships and divestitures 28
6.4 Dependency of the issuer Not applicable -
6.5 Competitive position 3.4 Our businesses 32
7 ORGANIZATIONAL STRUCTURE
7.1 Description of the Group 3.5 Intra-group R elationships 44
7.2 List of the issuer’s significant subsidiaries Note 35 (List of significant subsidiaries, joint ventures and
investments in associates at December 31, 2011) F70
8 PROPERTY, PLANTS AND EQUIPMENT
8.1 Existing or planned material tangible fixed asset 3.4.4 Mineral reserves and quarries 42
3.4.5 Summary of our capital expenditures in 2011
and 2010
3.4.6 Capital expenditures planned for 2012
44
44
8.2 Environment 7.5 Environment 124
9 OPERATING AND FINANCIAL REVIEW
9.1 Financial condition 4.1 Overview 48
9.2 Operating results 4.3 Results of operations for the fiscal years ended
December 31, 2011 and 2010 52
10 CAPITAL RESOURCES
10.1 Equity capital 4.4 Liquidity and capital resources
Note 20 (Equity)
63
F41
10.2 Cash flows 4.4 Liquidity and capital resources 63
10.3 Financing and liquidity 4.4 Liquidity and capital resources 63
10.4 Information regarding any restrictions on the use of capital
resources that have materially affected, or could materially
affect, the issuer’s operations
4.4 Liquidity and capital resources
2.1.2 Financial and market risks
63
16
10.5 Information regarding the anticipated sources of funds
needed to fulfil certain commitments 4.4 Liquidity and capital resources 63

Registration Document | 2011 | Lafarge264
Cross-reference tables
Items of Annex I to EC Regulation 809/2004 Location in this Report Page
11 RESEARCH & DEVELOPMENT, PATENTS AND LICENCES 3.3 Innovation 29
12 TREND INFORMATION 4.1.2 Trend information and 2012 perspectives 48
13 PROFIT FORECASTS OR ESTIMATES Not applicable -
14 ADMINISTRATIVE, MANAGEMENT, AND SUPERVISORY BODIES
AND SENIOR MANAGEMENT
14.1 Information on the members of administrative
and management bodies
5.1.2 Information on Directors
5.3 Executive Officers
70
94
14.2 Conflicts of interests 5.1.3 Independent Directors – Parity within the Board
5.3 Executive Officers
83
94
15 REMUNERATION AND BENEFITS
15.1 Remuneration and benefits granted 5.4 Compensation and benefits
Note 31 (Employees’ costs and Directors’ and Executive
Officers’ compensation for services)
95
F67
15.2 Retirement plans 5.4 Compensation and benefits
Note 31 (Employees’ costs and Directors’ and Executive
Officers’ compensation for services)
95
F67
16 BOARD PRACTICES
16.1 Term of office of the Directors 5.1.2 Information on Directors 70
16.2 Service contracts providing for the grant of future benefits 5.1.3 Independent Directors – Parity within the Board 83
16.3 The Committees 5.2.2 Board of Directors’ Committees 87
16.4 Declaration in terms of corporate governance Declaration in terms of corporate governance - Governance
Code of reference 68
5.7 Implementation of the Principle
« Comply or explain » of the Afep-Medef Code 106
17 EMPLOYEES
17.1 Number of employees 7.3.1 Headcount 119
17.2 Shareholdings and stock-options 5.5.2 Stock-option plans
5.5.3 Performance share plans
5.6.1 Directors, Chairman and Chief Executive Officer
and Executive Officers share ownership
101
104
106
17.3 Employees’ share ownership in the issuer’s capital
5.5 Long-term incentives
(stock-options and performance shares plans)
6.4 Employee share ownership
99
111
18 MAJOR SHAREHOLDERS
18.1 Share capital distribution 6.1 Major shareholders and share capital distribution
6.3 Threshold notifications imposed by law
and declarations of intent
108
110
18.2 Voting rights 6.1 Major shareholders and share capital distribution
8.5.3 Rights, preferences and restrictions attached to shares
108
149
18.3 Information on the control of share capital
6.2 Shareholders’ agreement with the Sawiris family
and NNS Holding Sàrl
6.3 Threshold notifications imposed by law
and declarations of intent
109
110
18.4 Change of control 8.6 Change of control 151

265Lafarge | Registration Document | 2011
Cross-reference tables
Items of Annex I to EC Regulation 809/2004 Location in this Report Page
19 RELATED PARTY TRANSACTIONS Note 30 (Related parties) F67
20 FINANCIAL INFORMATION
20.1 Historical financial information Consolidated financial statements F4
20.2 Pro forma financial information Not applicable -
20.3 Financial statements Consolidated financial statements F4
20.4 Auditing of historical annual financial information Consolidated financial statements - statutory auditors’ report F3
20.5 Age of latest financial information Consolidated financial statements F4
20.6 Interim and other financial information Not applicable -
20.7 Dividend policy Note 20 (Equity) F41
20.8 Legal and arbitration proceedings Note 29 (Legal and arbitration proceedings) F65
20.9 Significant change in the issuer’s financial or trading position Note 34 (E vents after the reporting Period) F69
21 ADDITIONAL INFORMATION
21.1 Share capital
■ Share capital 8.1 Share capital 144
■ Securities not representing capital 8.3 Securities non representative of share capital - Bonds 146
■ Shares owned by the Company 8.2 Shares owned by the Company 145
■ History of the capital 8.1 Share capital 144
21.2 Memorandum and articles of association 8.5 Articles of Association (statuts) 148
■ Corporate purpose 8.5.1 Corporate purpose 148
■ Statutory provisions or other with respect to the
members of administrative and management bodies
8.5.2 Board of Directors 148
■ Rights, preferences and restrictions attached
to the shares
8.5.3 Rights, preferences and restrictions attached
to the shares 149
■ Changes to shareholder rights 8.5.4 Changes to Shareholder’ rights 150
■ Convocation and admission to the Shareholders’
General Meetings
8.5.5 Convocation and admission to the Shareholders’
General Meetings 150
■ Change of control 8.6 Change of control 151
■ The crossing of thresholds 8.5.6 Disclosure of holdings exceeding certain thresholds 150
22 MATERIAL CONTRACTS 8.7 Material contracts 151
23 THIRD-PARTY INFORMATION, AND STATEMENT BY EXPERTS
AND DECLARATIONS OF ANY INTEREST
Not applicable -
24 DOCUMENTS ON DISPLAY 8.8 Documents on display 152
25 INFORMATION ON HOLDINGS 3.5 Intra-group R elationships 44
Annual financial report cross-reference table
The table below identifies the sections of the Annual financial report (Article 451-1-2 of the Monetary and Financial Code and article 222-3 of
the General Regulations of the AMF) incorporated in the present Registration Document.
Item Section of this report or Page
Lafarge S.A. statutory accounts F74 - F92
Consolidated financial statements F4 - F72
Management report (see cross-reference table below) N/A
Certification 165
Statutory auditors’ report on Lafarge S.A. financial statements F73
Statutory auditors’ report on the consolidated financial statements F3
Auditors’ fees and services 10.2
Report of the Chairman of the Board on internal control procedures and on corporate governance
(article L.225-37 of the French Commercial Code)
Preamble to Chapter 5
2.2, 5.1, 5.2, 5.4, 5.7,
8.5.5, 9.1
Statutory auditors’ report on the Chairman’s report (article L.225-235 of the French Commercial Code) 9.2
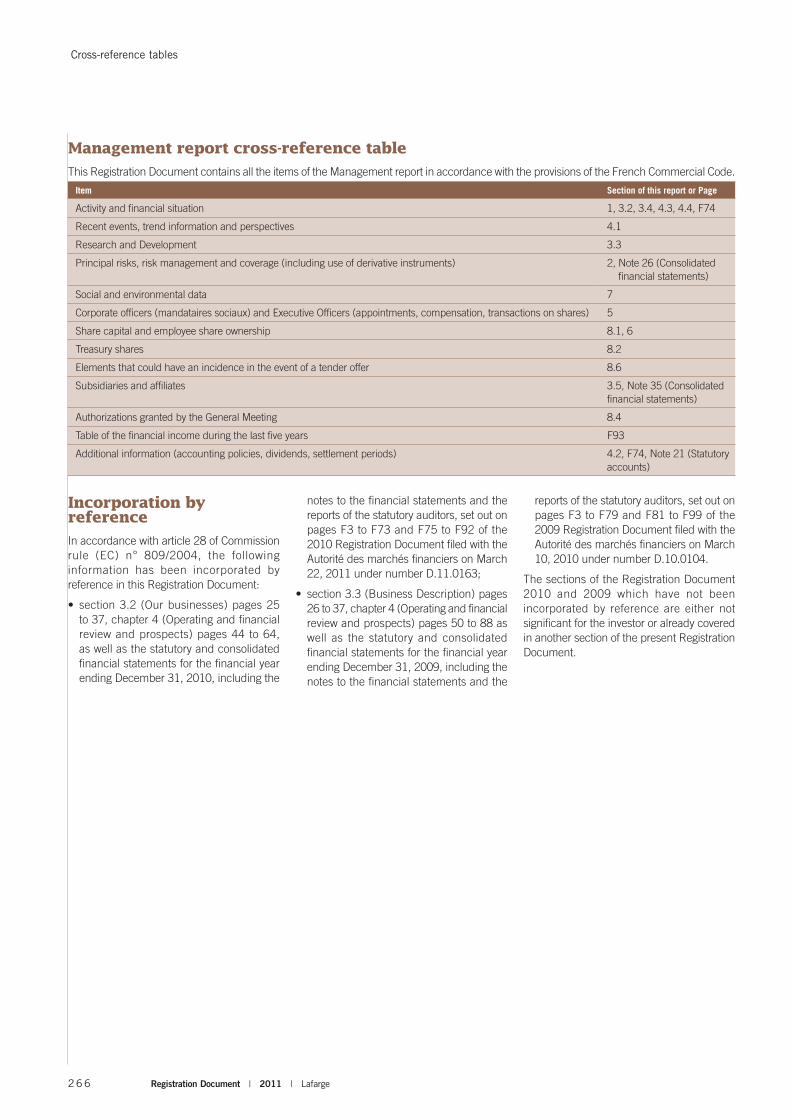
Registration Document | 2011 | Lafarge266
Cross-reference tables
Management report cross-reference table
This Registration Document contains all the items of the Management report in accordance with the provisions of the French Commercial Code.
Item Section of this report or Page
Activity and financial situation 1, 3.2, 3.4, 4.3, 4.4, F74
Recent events, trend information and perspectives 4.1
Research and Development 3.3
Principal risks, risk management and coverage (including use of derivative instruments) 2, Note 26 (Consolidated
financial statements)
Social and environmental data 7
Corporate officers (mandataires sociaux) and Executive Officers (appointments, compensation, transactions on shares) 5
Share capital and employee share ownership 8.1, 6
Treasury shares 8.2
Elements that could have an incidence in the event of a tender offer 8.6
Subsidiaries and affiliates 3.5, Note 35 (Consolidated
financial statements)
Authorizations granted by the General Meeting 8.4
Table of the financial income during the last five years F93
Additional information (accounting policies, dividends, settlement periods) 4.2, F74, Note 21 (Statutory
accounts)
Incorporation by reference
In accordance with article 28 of Commission
rule (EC) n° 809/2004, the following
information has been incorporated by
reference in this Registration Document:
• section 3.2 (Our businesses) pages 25
to 37, chapter 4 (Operating and financial
review and prospects) pages 44 to 64,
as well as the statutory and consolidated
financial statements for the financial year
ending December 31, 2010, including the
notes to the financial statements and the
reports of the statutory auditors, set out on
pages F3 to F73 and F75 to F92 of the
2010 Registration Document filed with the
Autorité des marchés financiers on March
22, 2011 under number D.11.0163;
• section 3.3 (Business Description) pages
26 to 37, chapter 4 (Operating and financial
review and prospects) pages 50 to 88 as
well as the statutory and consolidated
financial statements for the financial year
ending December 31, 2009, including the
notes to the financial statements and the
reports of the statutory auditors, set out on
pages F3 to F79 and F81 to F99 of the
2009 Registration Document filed with the
Autorité des marchés financiers on March
10, 2010 under number D.10.0104.
The sections of the Registration Document
2010 and 2009 which have not been
incorporated by reference are either not
significant for the investor or already covered
in another section of the present Registration
Document.

267Lafarge | Registration Document | 2011
Glossary
Glossary
In this document, the following terms have the meanings indicated below:
“DIVISIONS”: the organizations by activity that are being replaced in 2012 by a country-based organization.
“REGISTRATION DOCUMENT” or “ANNUAL REPORT”: the present document which is a free translation of the Document de Référence filed with
the Autorité des marchés financiers of France.
“GROUP” or “LAFARGE”: Lafarge S.A. and its consolidated subsidiaries.
“COMPANY” or “LAFARGE S.A.”: our parent company Lafarge S.A., a société anonyme organized under French law.
“BUSINESS UNIT”: a management organization in one designated geographic area, generally one country.
“EMERGING MARKETS or COUNTRIES”: all markets or countries outside Western Europe and North America, except Japan, Australia and New
Zealand.
“EXCELLENCE” program: detailed strategic plan of the Group, which includes in particular a cost reduction program.
“PRINCIPLES OF ACTION”: means the Group’s Principles of Action, which set out the Group’s commitments to customers, employees, local
community institutions and shareholders, and explain the “Lafarge Way”, i.e. the Group’s management philosophy.
“Tonne” or “TONS”: always refer all to metric tons
“Dollars” or “US dollars”: unless otherwise specified, dollars of the United States of America.
“Pure Aggregates”: core aggregates activities such as crushed stone, gravel and sand.
GRI: Global Reporting Initiative.
WBCSD - CSI: World Business Council for Sustainable Development - Cement Sustainability Initiative.
KPI: Key Performance Indicators.
“Corporate Officer”: under French law, the Chairman and Chief Executive Officer and the Board of Directors members are the “Corporate
Officers” of Lafarge S.A.
NB. Due to rounding of amounts and percentages, the addition of data in text or charts may not be totally consistent. Indeed, totals include
decimals.

Registration Document | 2011 | Lafarge268

www.lafarge.com
The Imprim’vert label is awarded for printers implementing industrial strategies to protect the environment.
This document was printed in France by an Imprim’Vert certified printer on recyclable, chlorine-free and FSC certified paper produced from sustainably managed forests.
© Lafarge – March 2012
Production: Group Finance Department LAFARGE
Design: Group Communication Department –

LAFARGE
61, rue des Belles-Feuilles – BP 40
75782 Paris Cedex 16 – France
Tel.: + 33 1 44 34 11 11
Fax: + 33 1 44 34 12 00
www.lafarge.com