02296 corrosion product films on carbon steel in semi-sour co2 h2s environments
TRANSCRIPT

CORROSION PRODUCT FILMS ON CARBON STEEL IN SEMI-SOUR CO2/H2S
ENVIRONMENTS
J. Kvarekval, R. Nyborg and M. Seiersten
Institute for Energy Technology (IFE)
PO Box 40
N-2007 Kjeller
NORWAY
ABSTRACT
Flow loop corrosion experiments with carbon steel have been carried out in CO2
environments with H2S levels below the NACE sour limit of 3 mbar H2S (“semi-sour” environments).
The presence of 0.5 – 1.5 mbar H2S in loop experiments with up to 2 bar CO2 and temperatures up to
80°C resulted in slightly higher corrosion rates than in corresponding experiments without H2S. The
corrosion rates were in the range of 0.1-2 mm/y. In an experiment with 0.5 mbar H2S at a CO2/H2S
partial pressure ratio of 4500 both iron sulfides (FeS) and iron carbonates (FeCO3) were detected on the
steel surface. The mixed sulfide/carbonate films were 30-80 µm thick. Thermodynamic solubility data
are clearly in favour of iron sulfide formation under these conditions, thus it is likely that the co-
existence of FeS and FeCO3 is caused by local depletion of sulfide ions within the corrosion product
films. Experiments with CO2/H2S ratios of 1200-1500 resulted in formation of thin iron sulfide films (1-
10 µm) on the corroding surfaces. No iron carbonates were found in corrosion product films formed at
CO2/H2S ratios below 1500.
Keywords: CO2 corrosion, H2S corrosion, corrosion product films, iron sulfide, iron carbonate
1
Jesus Arze - Invoice INV-218306-PNGBUN, downloaded on 5/24/2009 4:05:02 PM - Single-user license only, copying and networking prohibited.

INTRODUCTION
Corrosion product films formed on carbon steel in CO2 environments consist mostly of
iron carbonate (FeCO3). The formation rate and morphology of these films depend on environmental
conditions such as temperature and pH. When conditions are right dense and adhesive iron carbonate
films protect the underlying steel surface against further corrosion. Experimental work has shown that
protective iron carbonate films can be more than 100 µm thick 1-3. These beneficial corrosion product
films form the basis of the pH-stabilisation technique, a corrosion control method used in several CO2-
containing wet gas pipelines around the world.
Corrosion control in fields producing both CO2 and H2S is often more complex than with
CO2 only, as H2S introduces a variety of corrosion mechanisms related to hydrogen embrittlement and
cracking of carbon steel and CRAs. Iron sulfide (FeS) scale formed on carbon steel in CO2/H2S
environments can be very protective for long periods of time, but severe localised corrosion attacks may
occur when the scale is weakened by e.g. high chloride levels, solid particles or accumulation of
stagnant water. Iron sulfides are less soluble than iron carbonate and is the prevailing corrosion product
above the NACE limit for sour service, which is 3 mbar H2S 4. With less than 3 mbar H2S the
composition of the corrosion films depends on several factors, such as:
• The ratio between the partial pressures of CO2 and H2S (CO2/H2S ratio)
• Corrosion rates (dissolved iron precipitates as FeS and consumes H2S close to the steel surface)
• Temperature (FeCO3 solubility decreases and FeS solubility increases with increasing temperature)
Calculations based on solubility data from literature and in-house experiments show that
the theoretical CO2/H2S ratios for transition between FeS and FeCO3 formation are in the range of 105 -
107, as shown in Figure 1. Observed CO2/H2S ratios of 1000-5000 for FeS/FeCO3 transition have been
reported in literature 5-7.
EXPERIMENTAL PROCEDURE
Three flow loop experiments were performed with H2S levels between 0 and 2 mbar H2S
and other conditions as described below. Detailed conditions for each experiment are given in Table 2.
• Experiment 1: 80°C, 2.2 bar CO2, pH 5.8, ~1.5 mbar H2S. CO2/H2S ratio 1500.
• Experiment 2: 80°C, 2.2 bar CO2, pH 5.8, 0.5 mbar H2S. CO2/H2S ratio 4500.
• Experiment 3: 60-70oC, 0.7 bar CO2, pH 4-6, 0-0.6 mbar H2S, CO2/H2S ratio > 1200.
2
Jesus Arze - Invoice INV-218306-PNGBUN, downloaded on 5/24/2009 4:05:02 PM - Single-user license only, copying and networking prohibited.

Test specimens were machined from various low carbon steels. Element analysis,
microstructure and API designation are given in Table 1. Four steel types were used in Experiments 1
and 2: St52B, Cr0.53, TMPC and Cr2.2. St52B is a common ferritic-pearlitic construction steel. Cr0.53
is a typical quenched and tempered pipeline steel with 0.53 % chromium. The steel designated TMCP is
a typical modern pipeline steel with low carbon and a very fine-grained microstructure due to thermo-
mechanical treatment and microalloying additions. The steel named Cr2.2 is a 2¼Cr-1Mo pressure
vessel steel included to test a steel with chromium content between the 0.5 % Cr pipeline steels and 13
% Cr stainless steels. In Experiment 3 all test specimens were made of API 5L-X65 steel (designated
X65), which is a modern pipeline steel with ferritic-pearlitic microstructure. Flat test coupons with
dimensions 25 mm x 25 mm x 3mm and were used in all three experiments. In addition some cylinder-
shaped test specimens were used in Experiment 3.
Test solutions were prepared from analytical grade chemicals and reverse osmosis water.
Sodium chloride (NaCl) was added to a concentration of 0.1-3 %. The test solutions were saturated with
CO2 grade 4.0 at a partial pressure of 1-2.2 bar. This gas contains less than 10 ppm of O2, corresponding
to less than 0.5 ppb in the solutions. pH adjustments were carried out with sodium bicarbonate
(NaHCO3).
Experiments 1 and 2 were conducted in a loop specially designed for inhibitor testing,
high temperature testing, experiments with H2S, experiments under scaling conditions and experiments
with oil/water wetting. All the components in contact with water are made of Hastelloy C. The ID of the
main circuit is 25 mm. A centrifugal pump with canned motor is used to circulate the water. Maximum
pressure and temperature are 50 bar and 150°C respectively. The loop is equipped with three horizontal
test sections that can be bypassed and operated independently. The test sections can accommodate both
flat and flush mounted tubular specimens. Tubular specimens (15 mm ID) were used in the present
experiments. Illustrations of the loop and test sections with electrode arrangements are shown in Figure
2.
Experiment 3 was carried out in a small flow loop with a horizontal test section
connected to a 3-litre glass cell. Both flat and cylindrical test specimens can be exposed in this
apparatus. The test section can hold up to 3 test coupons, which are flush-mounted in a 22.5 mm wide
and 7 mm deep duct. Pt wire counter electrodes are installed on the vertical walls on both sides of the
test specimens. An Ag/AgCl reference electrode was connected to the test section by a salt bridge. The
glass cell act as a test solution reservoir for the flat coupon test section as well as a test compartment for
cylindrical test specimens, which can be immersed through the glass cell lid. For electrochemical
measurements the glass cell was equipped with a titanium sheet counter electrode and an Ag/AgCl
reference electrode connected through a Luggin capillary. Furthermore, the glass cell was fitted with a
pH electrode, temperature sensor, pressure gauge and gas inlet and outlet. A gas mixing battery
3
Jesus Arze - Invoice INV-218306-PNGBUN, downloaded on 5/24/2009 4:05:02 PM - Single-user license only, copying and networking prohibited.

consisting of three mass flow controllers in parallel enabled continuous purging of the glass cell with
H2S/N2 or H2S/CO2 at various mixing ratios. The exhaust gas was led through a H2S scavenger solution
(10 % NaOH).
Corrosion rates were measured electrochemically with the linear polarisation (LPR)
technique in three-electrode configuration. Electrochemical impedance spectroscopy (EIS)
measurements were performed to assess the uncompensated electrolyte resistance (IR drop) used for
correction during subsequent corrosion rate calculations. The parameters used for electrochemical
measurements and corrosion rate calculations are summarised in Table 3. All the electrochemical
measurements were performed with multiplexed Gamry PC3/750 potentiostats. The electrochemically
measured corrosion rates were calibrated by weight loss measurements. The concentration of Fe2+ ions
in the test solutions was monitored by spectrophotometric analysis.
The H2S partial pressure was monitored indirectly by measuring the total sulfide (H2S+
HS-+S2-) in the water phase. A commercial kit based on the "methylene blue" colorimetric analysis was
used in Experiments 1 and 2, while titration of samples with silver/sulfide electrodes was used in
experiment 3. The dissolved H2S concentration was then calculated from the total sulfide and pH of the
test solution. The H2S partial pressure (pH2S) was calculated from the measured H2S concentration.
When FeS is formed during corrosion, H2S is depleted from the test solution and has to be replenished.
In Experiment 3 the H2S partial pressure was maintained through continuous gas bubbling. Experiments
1 and 2 were carried out in a pressurised system. In these experiments the H2S concentration was
controlled by continuously adding small amounts of dissolved Na2S directly to the water phase from a
large autoclave connected to the loop.
RESULTS
Experiments 1 and 2. Figure 3 shows corrosion rates plotted against time for Experiment
1. All specimens in Experiment 1 with 1.5 mbar H2S had uniform attack and thin black corrosion films.
The corrosion rates did not change much during the experiment and stabilized between 0.5 and
0.8 mm/y for all steels except the Cr2.2 steel, which had two to three times higher corrosion rates than
the other steels. SEM examination of the corrosion films on these specimens showed that the St52B and
Cr0.53 steels had very little corrosion film, only a few areas with 1 - 2 µm thick porous corrosion film
could be seen on these specimens, as seen in Figure 4. The TMCP and Cr2.2 steels had a thicker and
more uniform corrosion film with thickness 7 - 10 µm. The films on the Cr2.2 steel appeared to be more
porous than on the TMCP steel. The corrosion products were loosely adherent and easily removed.
Element analysis in the SEM showed that the corrosion films on these specimens contain iron and sulfur
with an atomic ratio close to 1:1, i.e. FeS. They also contained very little oxygen, indicating that the
corrosion film consisted mostly of iron sulfide.
4
Jesus Arze - Invoice INV-218306-PNGBUN, downloaded on 5/24/2009 4:05:02 PM - Single-user license only, copying and networking prohibited.

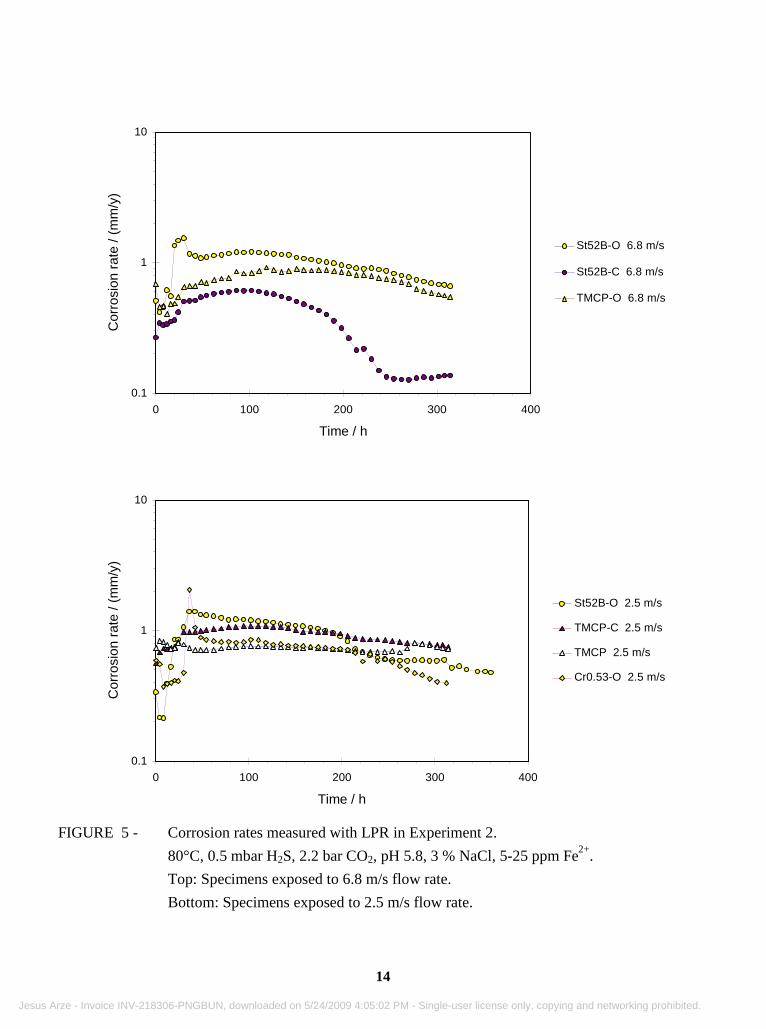
Experiment 2 was performed under the same conditions as Experiment 1 but with only 0.5 mbar H2S,
and with both ground and oxide or carbonate covered surfaces. All specimens in Experiment 2 had only
uniform attack and grey to black corrosion films. The final corrosion rates were between 0.1 and
0.8 mm/y, and as seen from Figure 5 the corrosion rate did not vary much during the experiment. No
localised corrosion attacks or mesa attacks were observed.
The specimens in Experiment 2 had relatively thick and dense corrosion films with
thickness typically between 30 and 80 µm. SEM examination of the films revealed a varying mixture of
iron sulfide and iron carbonate. For the St52B and TMCP steels the film adhered well to the steel, while
the film flaked easily off as a black powder for many of the Cr0.53 steel specimens. Figure 6 shows
some of the corrosion films from this experiment. Element analysis in the SEM showed that most of the
light grey and slightly porous areas in the figures are almost pure iron sulfide, while the darker grey
massive areas are iron carbonate. Some of the original carbonate film from precorrosion can be seen as a
massive dark grey layer in the outer part of the film in the lower picture in Figure 6. Most of the film
beneath this layer is iron sulfide, while the part of the film closest to the metal is mostly iron carbonate.
A thin layer of iron sulfide has precipitated out on top of the original carbonate layer.
Experiment 3. Experiment 3 was carried out to study changes in corrosion behaviour and
corrosion films (FeCO3) as H2S enters a FeCO3-saturated CO2/H2O system at slowly increasing levels.
Flat coupons were exposed in the test section with a flow velocity of 1 m/s, while cylinder specimens
were immersed in the glass cell reservoir. The total duration was 68 days, of which the first 49 days
were run with no H2S present. In this period a FeCO3 films were formed with no measures being taken
to control the Fe2+ level and pH. Below the FeCO3 saturation level the increase in Fe2+ and
bicarbonate/pH with time was proportional to the corrosion rate. During the period of pure CO2
corrosion the pH increased from 4 to 6.2 and the Fe2+ ion concentration increased from zero to 130 ppm.
Initially the temperature was set to 60oC, but was increased to 70oC after 14 days exposure in order to
improve corrosion film protectiveness. After 49 days of exposure with CO2 only the H2S level was
stepwise increased to a maximum pH2S of 0.6 mbar. Although the H2S concentration in the gas phase
was maintained, the high Fe2+ level in the test solution formation of colloidal FeS caused depletion of
aqueous H2S:
++ +→+ HFeSFeSH 22
2
As a result of this reaction both the Fe2+ concentration and pH were observed to decrease at the end of
the experiment.
5
Jesus Arze - Invoice INV-218306-PNGBUN, downloaded on 5/24/2009 4:05:02 PM - Single-user license only, copying and networking prohibited.

Corrosion rates and potentials vs. time plots are given in Figure 7. For all specimens the
corrosion rates were initially about 1 mm/y, but dropped to 0.3-0.5 mm/y in a few hours. The corrosion
rates then decreased slowly as the pH and Fe2+ level increased. After 14 days the temperature was
increased to 70oC (via a short period at 65oC), which seemed to make the corrosion rates decrease a little
bit faster. Immediately prior to H2S addition the corrosion rates were 0.1-0.2 mm/y. At this point the
cylinder specimen exposed from the start (Cyl1) was removed from the cell and replaced by a fresh one
(Cyl2). Cyl2 was replaced with Cyl3 when the H2S level was increased to 0.56 mbar. The first H2S
caused very small increases in the corrosion rate of the flat coupons (Flat1-3), and the corrosion
potential dropped about 20 mV. The H2S level was stepwise increased to 0.56 mbar, but the corrosion
rates of specimens Flat1-3 was nearly constant for the remainder of the experiment. The slow decrease
in corrosion rates observed without H2S could no longer be observed. The corrosion rates of specimens
Cyl2 and Cyl3 were 0.3-0.4 mm/y and did not seem to decrease with time. The corrosion potentials of
these specimens were more than 50 mV lower than on Cyl1, and appeared to decrease with increasing
H2S level.
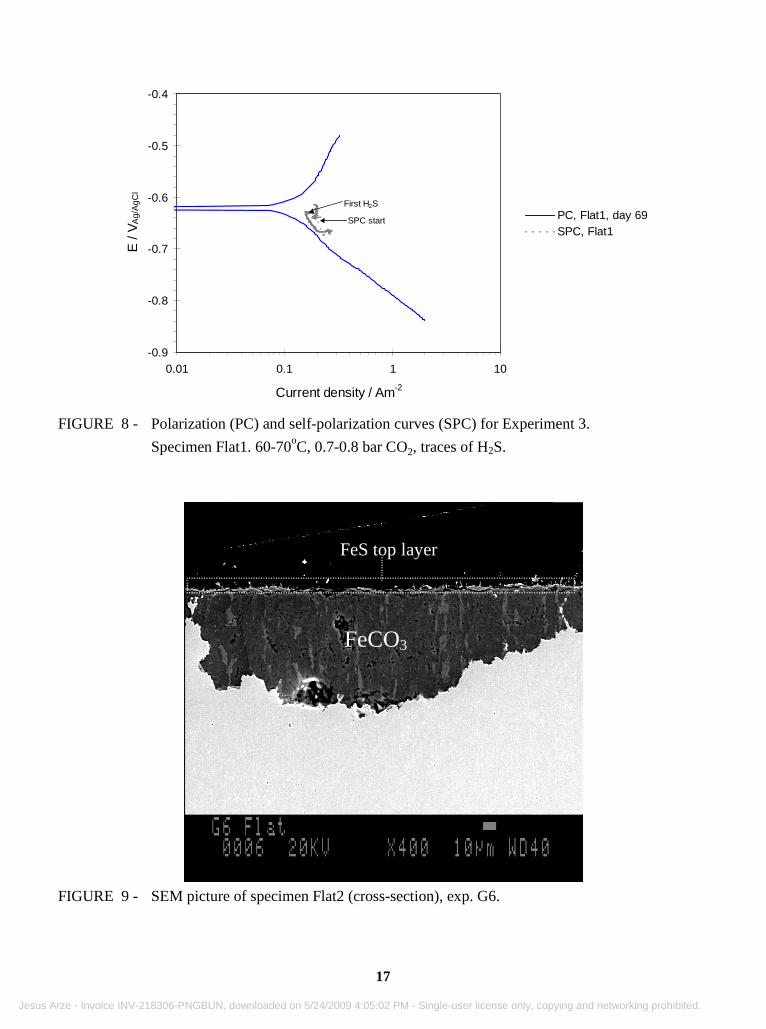
Polarisation and self-polarisation curves for specimen Flat1 are shown in Figure 8. The
cathodic reaction rate is mostly activation-controlled with a Tafel slope 150 mV/dec., although a
fraction of a limiting current slope, which may origin from H+ or H2S reduction, can be observed in the
cathodic region close to the corrosion point (-0.63 to -0.68 VAg/AgCl). On the other hand, the anodic
dissolution is heavily suppressed with a Tafel slope of 380 mV/dec. From the self-polarisation curve for
Flat1 it seen that the reduction in anodic reaction rate took place during the corrosion film build-up
without H2S present. The specimens immersed with H2S present (Cyl2 and Cyl3) stabilised at higher
corrosion rates and lower corrosion potentials than Cyl1 and the flat coupons, which is caused by more
active anodic iron dissolution.
Figures 9-10 show SEM pictures of specimens Flat2, Cyl1 and Cyl3 with corrosion film.
The specimens ”precorroded” in pure CO2 solution had quite uneven corrosion attacks and were
completely covered with FeCO3. EDX element mapping (Figure 11) showed that a thin layer of iron
sulfide had precipitated on top of the FeCO3 film on specimen Flat2, probably as a result of the H2S
addition. On specimen Cyl1, which was removed from the cell before H2S was added, only FeCO3 could
be identified. The corrosion film on Cyl3, which was exposed for 10 days at a H2S level of 0.6 mbar,
was about 5 µm thick and consisted of iron sulfide only.
DISCUSSION
Studies of the corrosion product films formed in Experiments 1 and 2, carried out with
1.5 mbar and 0.5 mbar H2S respectively, show clear differences in composition and structure of the
films. FeS was the only compound precipitating formed in Experiment 1 (CO2/H2S ratio 1500), forming
6
Jesus Arze - Invoice INV-218306-PNGBUN, downloaded on 5/24/2009 4:05:02 PM - Single-user license only, copying and networking prohibited.

a thin film on the steel surface. Similar films formed on the test specimens exposed with 0.6 mbar H2S
(CO2/H2S ratio 1200) in Experiment 3. In Experiment 2 (CO2/H2S ratio 4500) apparently precipitation
of both FeS and FeCO3 took place. The co-existence of these compounds may be a result of
concentration gradients caused by local depletion of sulfide within the corrosion film. FeCO3 was the
main corrosion product close to the steel surface, while FeS prevailed in the outer parts of the films
formed in Experiment 2. It is possible that transport rate of sulfide-related ions from the test solution
through the film was less than the corrosion-inflicted Fe2+ production rate, giving conditions close to the
steel surface favouring formation of FeCO3 instead of FeS. Thermodynamic calculations indicate that
pH2S must be lower than 0.01 mbar for FeCO3 to precipitate in this environment. Bulk Fe2+
concentrations were up to 25 ppm in Experiment 2, which corresponds to thermodynamic
supersaturation of a factor 20 for FeCO3 and 2000 for FeS. The supersaturation required for
precipitation may explain the difference between the observed and estimated CO2/H2S ratios for
FeS/FeCO3 transition.
Experiment 3 was run for 48 days without H2S (only CO2), and up to 100 µm thick iron
carbonate films were formed in this period. The carbonate films remained intact during the exposure
with H2S, but iron sulfide was detected on top of them. Considering the high Fe2+ concentration of the
test solution, it is more likely that the iron sulfide was formed by precipitation from the solution rather
than by transformation of the FeCO3 layers.
The corrosion rates with CO2/H2S ratios 1200-4500 in Experiments 1 and 2 were
somewhat higher than in corresponding experiments without H2S. In Experiment 3 the corrosion rates
decreased with time during the exposure period with CO2 only, but H2S additions slightly increased and
stabilised the corrosion rates. Previous work have shown that small amounts of H2S may accelerate
corrosion of iron and steel in CO2 solutions, especially at low pH values (pH~4) 5. However, the effect
becomes less pronounced as pH increases. No localised corrosion attacks were found in these
experiments, while mesa attack often occur at high flow rates flow rate in CO2 solutions without H2S 8-9.
CONCLUSIONS
Flow loop corrosion experiments with various types of carbon steel have been carried out
in CO2 environments with H2S levels below the NACE sour limit of 3 mbar H2S (“semi-sour”
environments). The presence of 0.5 – 1.5 mbar H2S in loop experiments with up to 2 bar CO2 and
temperatures up to 80°C resulted in slightly higher corrosion rates than in corresponding experiments
without H2S. The corrosion rates were in the range of 0.1-2 mm/y, and did not vary significantly
between the carbon steel types. The corrosion attacks were general with uneven surface profiles, and
neither mesa attacks nor pitting were found in these experiments.
7
Jesus Arze - Invoice INV-218306-PNGBUN, downloaded on 5/24/2009 4:05:02 PM - Single-user license only, copying and networking prohibited.

In an experiment with 0.5 mbar H2S at a CO2/H2S partial pressure ratio of 4500 both iron
sulfides (FeS) and iron carbonates (FeCO3) were detected on the steel surface. The mixed
sulfide/carbonate films were 30-80 µm thick, and the outer parts of the films had much higher sulfide
concentrations than the inner parts close to the corroding metal. Thermodynamic solubility data are
clearly in favour of iron sulfide formation under these conditions, thus it is likely that the co-existence of
FeS and FeCO3 is caused by local depletion of sulfide ions in parts of the corrosion films close to the
steel surface.
Experiments with CO2/H2S ratios of 1200-1500 resulted in formation of thin iron sulfide
films (1-10 µm) on the corroding surfaces. No iron carbonates were found in corrosion product films
formed at CO2/H2S ratios below 1500.
REFERENCES
1. A.Dugstad, ”Mechanism of Protective Film Formation During CO2 Corrosion of Carbon Steel”, CORROSION/98, Paper No. 31, NACE International, 1998.
2. E.W.J van Hunnik, B.F.M. Pots, E.L.J.A. Hendriksen, "The formation of protective FeCO3 corrosion product layers in CO2 corrosion", CORROSION/96, Paper No. 6. NACE International, 1996.
3. A. Dugstad, L. Lunde, K. Videm, "Parametric Study of CO2 Corrosion of Carbon Steel", CORROSION/94, Paper No. 14. NACE International, 1994.
4. NACE Standard MR 0175-95: «Sulphide Stress Cracking Resistant Metallic Materials for Oilfield Equipment».
5. J. Kvarekvål, "The Influence of Small Amounts of H2S on CO2 Corrosion of Iron and Carbon Steel", EUROCORR ’97, Trondheim, Norway, 1997.
6. R. H. Hausler, D.W. Stegman, D. Tjandroso, "Laboratory Studies on Flow Induced Localized Corrosion in CO2/H2S Environments, II. Parametric Study on the Effect of H2S, Condensate, Metallurgy, and Flowrate", CORROSION/90, Paper No. 6, NACE, 1990.
7. K. Videm, J. Kvarekvål, "Corrosion of Carbon Steel in CO2 Saturated Aqueous Solutions Containing Small Amounts of H2S", Corrosion, 1995.
8. R. Nyborg, "Initiation and Growth of Mesa Corrosion Attack During CO2 Corrosion of Carbon Steel ", CORROSION/98, Paper No. 48. NACE International, 1998.
9. R. Nyborg, A. Dugstad, "Mesa Corrosion Attack in Carbon Steel and 0.5 % Chromium Steel", CORROSION/98, Paper No. 29. NACE International, 1998.
8
Jesus Arze - Invoice INV-218306-PNGBUN, downloaded on 5/24/2009 4:05:02 PM - Single-user license only, copying and networking prohibited.

TABLE 1. ELEMENT ANALYSIS (WT-%) FOR THE CARBON STEELS USED IN THE EXPERIMENTS.
Designation Material C Si Mn S P Cr Ni V Mo Cu Al Sn Nb
St52B St 52 .15 .18 1.57 .011 .014 .03 .04 .009 .007 .02 .025 - .014
Cr0.53 API 5LX-X60 .06 .24 1.12 .003 .008 .53 .02 .004 .002 .01 .027 - .002
TMCP API 5LX-X60 .09 .22 1.32 .004 .010 .03 .22 .01 <.01 .20 .04 - .01
Cr2.2 2¼Cr-1Mo .11 .22 .54 .004 .021 2.24 - - .97 - - - -
X65 API 5L-X65 .08 .25 1.54 .001 .019 .04 .05 .095 .01 .02 .038 .001 .043
TABLE 2 EXPERIMENTAL PARAMETERS
Parameter Experiment 1 Experiment 2 Experiment 3
Temperature / °C 80 80 70
Flow velocity / m/s 2.5 and 6.8 2.5 and 6.8 1.0
pH 5.8 5.8 4-6
pCO2 / bar 2.2 2.2 0.7
pH2S / mbar 1.5 0.5 0-0.6
pCO2/pH2S 1500 4500 > 1200
Dissolved iron / ppm 5-20 2-25 0-130
Steels St52B, Cr0.5, Cr2.2,
TMPC
St52B, Cr0.5, Cr2.2,
TMPC
X-65
Spec. surface finish Fresh abraded Fresh abraded Fresh abraded
Duration / days 20 15 68
9
Jesus Arze - Invoice INV-218306-PNGBUN, downloaded on 5/24/2009 4:05:02 PM - Single-user license only, copying and networking prohibited.
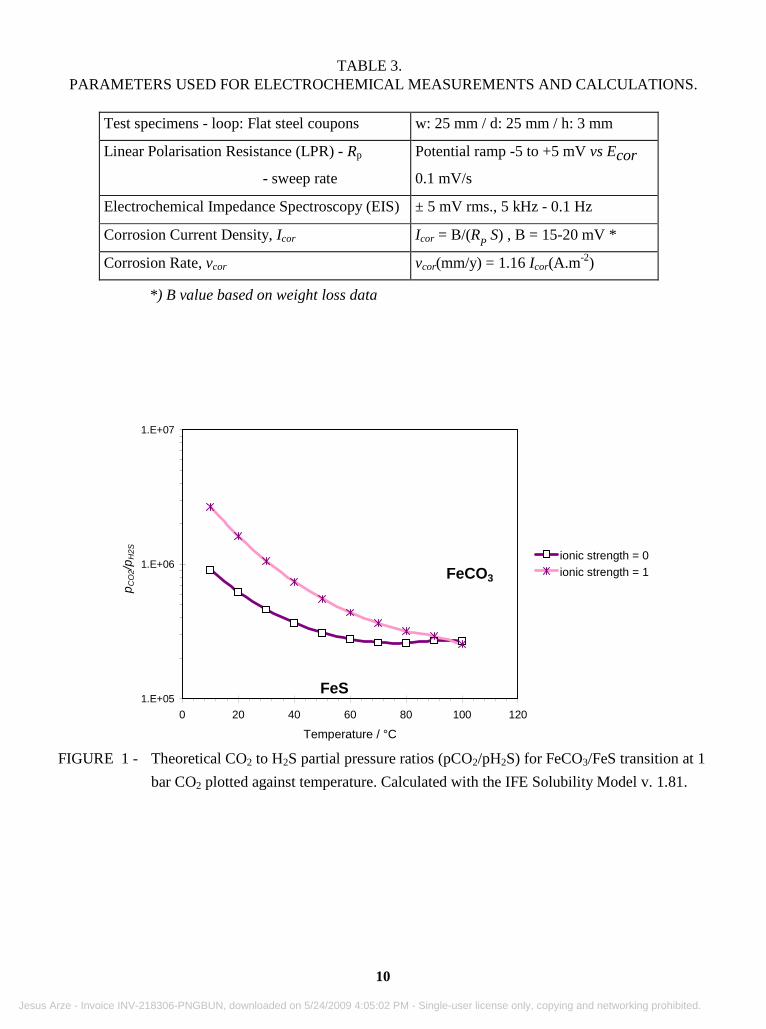
TABLE 3.
PARAMETERS USED FOR ELECTROCHEMICAL MEASUREMENTS AND CALCULATIONS.
Test specimens - loop: Flat steel coupons w: 25 mm / d: 25 mm / h: 3 mm
Linear Polarisation Resistance (LPR) - Rp
- sweep rate
Potential ramp -5 to +5 mV vs Ecor
0.1 mV/s
Electrochemical Impedance Spectroscopy (EIS) ± 5 mV rms., 5 kHz - 0.1 Hz
Corrosion Current Density, Icor Icor = B/(RP S) , B = 15-20 mV *
Corrosion Rate, vcor vcor(mm/y) = 1.16 Icor(A.m-2)
*) B value based on weight loss data
1.E+05
1.E+06
1.E+07
0 20 40 60 80 100 120
Temperature / °C
p CO
2/p H
2S ionic strength = 0ionic strength = 1
FeS
FeCO3
FIGURE 1 - Theoretical CO2 to H2S partial pressure ratios (pCO2/pH2S) for FeCO3/FeS transition at 1
bar CO2 plotted against temperature. Calculated with the IFE Solubility Model v. 1.81.
10
Jesus Arze - Invoice INV-218306-PNGBUN, downloaded on 5/24/2009 4:05:02 PM - Single-user license only, copying and networking prohibited.

Vacuum CO2 CO2
Flowmeter
CO2
Test section Test section Test section
CO2
WA
TE
R WA
TE
R
Vacuum
Vacuum
Safety valve
Heating Cooling
Cooling
WA
TE
RO
ILOIL
Hea
ting
Oil
Water
Pre
ssur
eris
er
Fe
prec
ipita
tion
Iron
gen
erat
or
Ion
gene
rato
r
WA
TE
R
Safety valve
Safety valve
WA
TE
R
WA
TE
R WA
TE
R
Safety valve
Safety valve
Safety valve
Connecting lead
Test section pipe(glass fiber reinforced PTFE
Counter electrode(Hastelloy-C)
Spacer (PTFE)
Corrosion test coupon
Corrosion test coupon
FIGURE 2 - Upper: Schematic drawing of the loop used for temperature-flow limit tests. Lower: The PTFE lining with specimen mounting in the tubular test rack.
11
Jesus Arze - Invoice INV-218306-PNGBUN, downloaded on 5/24/2009 4:05:02 PM - Single-user license only, copying and networking prohibited.

KV-3
0.1
1
10
0 100 200 300 400 500
Time / h
Cor
rosi
on r
ate
/ (m
m/y
)
St52B 6.8 m/s
TMCP 6.8 m/s
Cr0.53 6.8 m/s
Cr2.2 6.8 m/s
KV-3
0.1
1
10
0 100 200 300 400 500
Time / h
Cor
rosi
on r
ate
/ (m
m/y
)
St52B 2.5 m/s
TMCP 2.5 m/s
Cr0.53 2.5 m/s
Cr2.2 2.5 m/s
FIGURE 3 - Corrosion rates measured with LPR in Experiment 1.
80°C, 1.8 bar CO2, 1.5 mbar H2S, pH 5.8, 3 % NaCl, 5-20 ppm Fe2+.
Top: Specimens exposed to 6.8 m/s flow rate.
Bottom: Specimens exposed to 2.5 m/s flow rate.
12
Jesus Arze - Invoice INV-218306-PNGBUN, downloaded on 5/24/2009 4:05:02 PM - Single-user license only, copying and networking prohibited.

FIGURE 4 - SEM pictures of cross-sectioned specimens exposed in Experiment 1.
13
Jesus Arze - Invoice INV-218306-PNGBUN, downloaded on 5/24/2009 4:05:02 PM - Single-user license only, copying and networking prohibited.
KV-8
0.1
1
10
0 100 200 300 400
Time / h
Cor
rosi
on r
ate
/ (m
m/y
)
St52B-O 6.8 m/s
St52B-C 6.8 m/s
TMCP-O 6.8 m/s
0.1
1
10
0 100 200 300 400
Time / h
Cor
rosi
on r
ate
/ (m
m/y
)
St52B-O 2.5 m/s
TMCP-C 2.5 m/s
TMCP 2.5 m/s
Cr0.53-O 2.5 m/s
FIGURE 5 - Corrosion rates measured with LPR in Experiment 2.
80°C, 0.5 mbar H2S, 2.2 bar CO2, pH 5.8, 3 % NaCl, 5-25 ppm Fe2+.
Top: Specimens exposed to 6.8 m/s flow rate.
Bottom: Specimens exposed to 2.5 m/s flow rate.
14
Jesus Arze - Invoice INV-218306-PNGBUN, downloaded on 5/24/2009 4:05:02 PM - Single-user license only, copying and networking prohibited.

FIGURE 6 - SEM pictures of cross-sectioned specimens exposed in Experiment 2.
15
Jesus Arze - Invoice INV-218306-PNGBUN, downloaded on 5/24/2009 4:05:02 PM - Single-user license only, copying and networking prohibited.

0.01
0.1
1
10
0 10 20 30 40 50 60 70
Time / d
Cor
rosi
on r
ate
/ (m
m/y
)
-0.9
-0.85
-0.8
-0.75
-0.7
-0.65
-0.6
Eco
rr /
VA
g/A
gCl
Flat1 CR
Flat2 CR
Flat3 CR
Cyl. specs.CRFlat1 Ecorr
Cyl. specs.Ecorr
Cyl1
Cyl2 Cyl3
0
50
100
150
200
0 10 20 30 40 50 60 70
Time / d
[Fe2+
] / p
pm
0.00
1.00
2.00
3.00
4.00
5.00
6.00
7.00
pH, H
2S in
gas
/ (x
10-1
mba
r)
Fe(II) ionconc.
pH
H2S in gasphase
(Temp.)
(pCO2)60oC
0.82 bar65oC
0.77 bar70oC
0.71 bar
FIGURE 7 - Corrosion measurements and exp. parameters vs. time, Experiment 3.
Flow velocity 1 m/s. fresh abraded specimens.
Upper fig.: Corrosion rates and potentials vs. time
Lower fig.: Experimental conditions and parameters vs. time
16
Jesus Arze - Invoice INV-218306-PNGBUN, downloaded on 5/24/2009 4:05:02 PM - Single-user license only, copying and networking prohibited.
-0.9
-0.8
-0.7
-0.6
-0.5
-0.4
0.01 0.1 1 10
Current density / Am-2
E /
VA
g/A
gCl
PC, Flat1, day 69SPC, Flat1
SPC start
First H2S
FIGURE 8 - Polarization (PC) and self-polarization curves (SPC) for Experiment 3.
Specimen Flat1. 60-70oC, 0.7-0.8 bar CO2, traces of H2S.
FIGURE 9 - SEM picture of specimen Flat2 (cross-section), exp. G6.
FeCO3
FeS top layer
17
Jesus Arze - Invoice INV-218306-PNGBUN, downloaded on 5/24/2009 4:05:02 PM - Single-user license only, copying and networking prohibited.
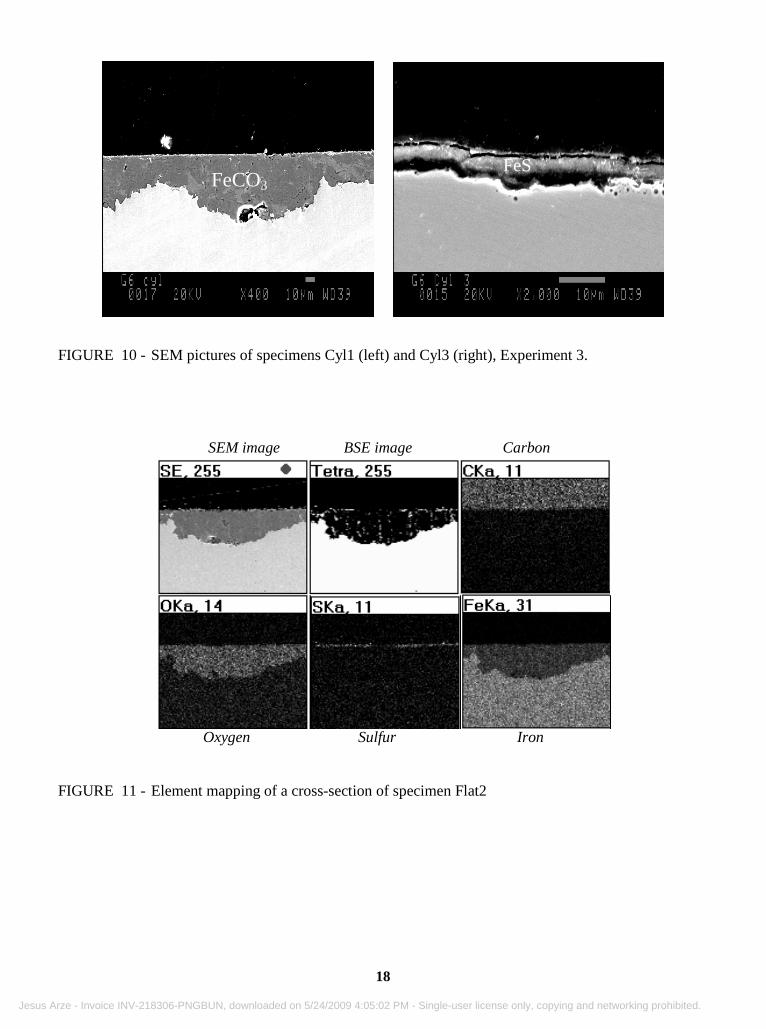
FIGURE 10 - SEM pictures of specimens Cyl1 (left) and Cyl3 (right), Experiment 3.
FIGURE 11 - Element mapping of a cross-section of specimen Flat2
FeCO3 FeS
SEM image BSE image Carbon
Oxygen Sulfur Iron
18
Jesus Arze - Invoice INV-218306-PNGBUN, downloaded on 5/24/2009 4:05:02 PM - Single-user license only, copying and networking prohibited.