012,2%234, #$ · health care deal news ... includes anthemÕs proposed acquisition of cigna for ......
TRANSCRIPT

Health Care Mergers & Acquisitions
21stCENTURY
in the
2 0 0 0 - 2 0 1 6 | S E C O N D E D I T I O N

2 0 0 0 - 2 0 1 6 | S E C O N D E D I T I O N
Health Carein the 21st CenturyMergers & Acquisitions
HealthCare MandA.comInside the Health Care Mergers & Acquisitions Market

Subscriptions & Memberships The SeniorCare Investor HealthCareMandA.com Health Care M&A News Dealmakers Forum Health Care Deal News Deal Search OnlineWebcasts & Training Interactive Webinar Series CEU Program
Irving Levin Associates Publications and ServicesAnnual and Data Reports The Senior Care Acquisition Report The Health Care Services Acquisition Report The Home Health & Hospice Acquisition Report The Hospital Acquisition Report The Not-for-Profit Acquisition Report
© 2016 Irving Levin Associates, Inc. All rights reserved. Reproduction or quotation in whole
or part without permission is forbidden. First Class Postage is paid at Norwalk, CT.
This publication is not a complete analysis of every material fact regarding any company, industry or security. Opinions expressed
are subject to change without notice. Statements of fact have been obtained from sources considered reliable but no representation is
made as to their completeness or accuracy. POSTMASTER: Send address changes to
Irving Levin Associates, Inc. 268 ½ Main Avenue, Norwalk, CT 06851
Published by: Irving Levin Associates, Inc.
268 ½ Main AvenueNorwalk, CT 06851
Phone (203) 846-6800 | Fax (203) [email protected]
HEALTH CARE MERGERS & ACQUISITIONS IN THE 21ST CENTURY
Eleanor B. MeredithStephen M. MonroeLisa E. PhillipsBenjamin SwettRachel ScintoJeanne AloiDrew Rider
Publisher: Senior Editor:
Editor:Associate Editor:
Research Analyst:Advertising:
Design:

Introduction ........................................................................................4
SERVICES
Behavioral Health Care .......................................................................6
Home Health & Hospice .....................................................................9
Hospitals...................................................... ................................ .....12
Laboratories, MRI & Dialysis ........................................................... 16
Long-Term Care ................................................................................ 18
Managed Care .................................................................................. 22
Physician Medical Groups .............................................................. 24
Rehabilitation ................................................................................... 28
Other Services................. ..................................................................31
TECHNOLOGY
Biotechnology ................................................................................... 34
eHealth ............................................................................................. 36
Medical Devices ................................................................................39
Pharmaceuticals .............................................................................. 41
CONTENTS
2 0 0 0 - 2 0 1 6 | S E C O N D E D I T I O N
Health Carein the 21st CenturyMergers & Acquisitions

Health Care M&A in the 21st Century | Second Edition | 2016
4 www.healthcaremanda.com
or relocation to another country to lower the effective tax rate, something the federal government took strong exception to, the transaction was ultimately terminated in early 2016. Had it remained, it certainly would have skewed the total numbers for the year as well as for the pharmaceutical sector.
Even after removing the Pfizer/Allergan transaction, 2015 was a record year for total number of mergers and acquisitions (1,504) as well as total dollar amount committed to those acquisitions ($403.6 billion). And two of the largest transactions in 2015 made it into the top 10 list so far in the 21st century. This includes Anthem’s proposed acquisition of Cigna for $54.2 billion and Teva Pharmaceutical’s acquisition of Allergan’s generic business for $40.5 billion. Just missing the cut was the second largest managed care transaction: Aetna’s proposed acquisition of Humana for $37.0 billion. Both managed care transactions are coming under heavy regulatory scrutiny, but both transactions are still expected to close, perhaps in late 2016.
Introduction
Glaxo Wellcome buys SmithKline Beecham for $74 billion, still the biggest pharma deal ever
Johnson & Johnson acquires Alza Corporation for $12.3 billion
2000 2001Pfizer acquires Pharmacia Corp. for $56 billion in an all-stock transaction
2002WellPoint Health Networks is acquired by Anthem Group for $16.5 billion
2003
This is the second issue of Health Care Mergers & Acquisitions in the 21st Century, an annual report that will update current trends and transactions in the merger and acquisition market across all sectors of health care. We start our coverage with the year 2000, and in the 15 years since then there has been enough political, social and economic upheaval to bring most any market crashing down. But not health care. The healthcare economy continues to grow as a percentage of GNP, and even though certain major legislative events such as the Affordable Care Act were supposed to slow that growth, the impact has been negligible. With sustained growth comes investment opportunity, but the negative side of that is increased scrutiny, pressure on payment rates, and a healthcare system that no one seems happy with.
Perhaps the most notable event in 2015 was the announced acquisition of Allergan plc by Pfizer, Inc. for $160 billion in the fourth quarter. As can be seen below, it would have been the largest transaction in the 21st century by almost twofold. But because part of the rationale was the benefits from an “inversion,”
Target Acquirer Year Price AcquirerSector TargetSectorSmithKlineBeechamPLC GlaxoWellcomePLC 2000 $74,000,000,000 Pharmaceuticals PharmaceuticalsWyeth,Inc. Pfizer,Inc. 2009 $68,000,000,000 Pharmaceuticals PharmaceuticalsAllergan,Inc. Actavisplc 2014 $66,000,000,000 Pharmaceuticals PharmaceuticalsAventis,SA Sanofi-Synthelabo,SA 2004 $65,500,000,000 Pharmaceuticals PharmaceuticalsPharmaciaCorporation Pfizer,Inc. 2002 $56,000,000,000 Pharmaceuticals PharmaceuticalsCignaCorp. Anthem,Inc. 2015 $54,200,000,000 ManagedCare ManagedCareGenentech(remaininginterest) RocheHoldingAG 2008 $46,800,000,000 Pharmaceuticals BiotechnologyCovidienplc Medtronic,Inc. 2014 $42,900,000,000 MedicalDevices MedicalDevicesSchering-PloughCorporation Merck&Co.,Inc. 2009 $41,100,000,000 Pharmaceuticals PharmaceuticalsAllerganGenerics TevaPharmaIndustriesLtd. 2015 $40,500,000,000 Pharmaceuticals Pharmaceuticals
TENLARGESTHEALTHCARETRANSACTIONS,2000-2015
4 www.healthcaremanda.com

HealthCareMandA 5
21stCENTURY
Health Care M&Ain the
Moving forward, while it is certainly possible that 2015’s records will be broken at some point, with the political environment and the anti-consolidation mood in Washington, D.C., it may be difficult to top the total dollars committed in 2015. In addition, as far as number of transactions, the long-term care sector has by far been the most active in recent years, setting its own M&A records along the way. In 2015, while representing less than 5% of the dollars committed, the number of individual transactions made up more than 23% of the entire healthcare M&A market. This sector has been in a bull run for six years, helped by low interest rates and plentiful capital, and at least in terms of number of transactions, 2016 may come close to the record in 2015.
Sanofi-Synthelabo acquires Aventis for $65.5 billion
2004Boston Scientific Corp. buys Guidant Corp. for $27.2 billion
2005Hospital giant HCA is privatized for $33 billion by Bain, KKR and Merrill Lynch
2006Schering-Plough buys Organon BioSciences from Akzo Nobel for $33 billion
2007
The publicly traded companies dominate the M&A market in terms of the dollars committed to acquisitions, usually representing over 90% of the total dollars, but they generally account for less than 50% of the number of transactions each year. Private companies account for about 45% of the acquisitions but less than 10% of the dollars, while not-for-profit organizations represent the remainder of the transaction volume, usually between 5% and 10%, but less than 1% of the dollars committed, mostly because they either don’t disclose prices or there are no funds transferred when there is a merger between not-for-profits. These numbers have been relatively consistent over the years. Financial buyers, which include private equity firms, real estate investment trusts and venture capital firms, are very active in the healthcare M&A market, usually accounting for 10% to 20% of the number of acquisitions, but less than 10% of the dollars invested.
$-
$50
$100
$150
$200
$250
$300
$350
$400
$450
0
200
400
600
800
1000
1200
1400
1600
2000 2001 2002 2003 2004 2005 2006 2007 2008 2009 2010 2011 2012 2013 2014 2015Do
llarVo
lume(inbillions)
Transactions
HealthcareTransactionsandDollarVolume,2000-2015
NumberofTransactions TotalDollarAmount

Health Care M&A in the 21st Century | Second Edition | 2016
and Addiction Equity Act of 2008, followed by passage of the ACA. The Center for Medicare and Medicaid Services (CMS) has continually granted positive payment updates and regulatory expansions in the past decade. For example, in 2015, the agency extended provisions of the Mental Health Parity Act to managed Medicaid organizations, Medicaid alternative benefit plans, and Children’s Health Insurance Programs.
Demand is strong for inpatient psychiatric hospitals, substance abuse programs, and facilities to serve the intellectually and developmentally disabled (I/DD), to name a few areas. In 2015, $210 billion was spent on mental health and substance abuse disorders alone, out of the $3 trillion in overall spending on health care.
Mergers and acquisitions in the behavioral health care sector have been on an upswing since 2010, when the Affordable Care Act was passed. That year, the sector was suffering its worst year for merger and acquisition activity since the 21st century began, with just eight deals announced. The next year, however, mergers and acquisitions began a steady climb. By 2015, M&A was booming, as deal volume surged to 40 transactions, up 63% compared with 2014. That streak may continue: through the first week of June 2016, 22 deals have already been announced.
A lot is happening in this sector to drive deal making even higher in the coming years. Uncompensated care is no longer an issue, thanks to the Mental Health Parity
Roche Holding AG buys out its remaining interest in Genentech for $46.8 billion
Pfizer pays $68 billion for Wyeth and eventually spins off the animal health division as Zoetis
2008 2009Genzyme Corp. is acquired by Sanofi-Aventis SA for $20.1 billion
2010Pharmacy benefits big-wig Express Scripts pays $29.1 billion for Medco Health Solutions
2011
6 www.healthcaremanda.com
Buyer interest in behavioral health care surged in 2015, as issues of mental health and opioid addiction garnered national attention. Private equity firms continue to build platforms of behavioral health facilities and treatment programs, while publicly traded companies branched into new areas of the sector.
Behavioral Health Care
$-
$500
$1,000
$1,500
$2,000
$2,500
$3,000
$3,500
$4,000
0
5
10
15
20
25
30
35
40
45
2000 2001 2002 2003 2004 2005 2006 2007 2008 2009 2010 2011 2012 2013 2014 2015
DollarVo
lume(inm
illions)
Transactions
BehavioralHealthCareTransactionsandDollarVolume,2000-2015
NumberofTransactions TotalDollarAmount
The PPACA individual mandate is upheld by the Supreme Court and Aetna buys Coventry Health Care for $7.3 B
2012

HealthCareMandA 7
21stCENTURY
Health Care M&Ain the
Allergan accepts Actavis plc's white-knight offer of $66 billion, and Actavis changes its name
2014Thermo Fisher Scientific acquires Life Technologies Corporation for $15.1 billion
Anthem and Cigna announce a $54.2 billion merger, but regulators are still studying the deal
2013 2015
It’s estimated that, of the 23 million alcohol or drug addicts in the United States, only 11% per year seek treatment.
Supply is still tight for inpatient psychiatric beds, even as providers build more hospitals. The result has been a proliferation of outpatient programs throughout communities, and even telehealth psychiatric services. This sector is dominated by Acadia Healthcare Company and Universal Health Services, but a number of private equity firms are busy building platforms of inpatient and outpatient mental health services.
The substance abuse disorder segment, which now includes eating disorders, is still highly fragmented. Consolidation is happening, as new market entrances by American Addiction Centers and private equity-backed companies such as Community Intervention Services and Odyssey Behavioral Healthcare are picking up addiction treatment programs around the country. In May, the Comprehensive Addiction and Recovery Act of 2016 was passed by Congress, which awards grants to the states to “address the national epidemics of prescription opioid abuse and heroin use,” and to establish a task force to review best practices for pain management and prescribing pain
thebraffgroup.com 888.922.5169
The Difference in Health Care M&AThe Braff Group is the leading mergers and acquisitions advisory firm specializing exclusively in health care services including home health care, hospice, behavioral health care, pharmacy services (home infusion, specialty Rx, institutional Rx), urgent care, health care information technology, and home medical equipment.
Unlike many brokers and investment sectors that work many sides of the negotiating table which can create conflicts of interest, we provide sell-side only transaction advisory services including representation, divestiture strategy, debt and equity recapitalizations, and valuation. Since the firm’s inception in 1998, we have closed more than 275 transactions, more than any other mergers and acquisitions advisory firm covering these sectors.
Shire plc acquires Baxalta for $32 billion, the biggest deal in the first half of 2016
2016

Health Care M&A in the 21st Century | Second Edition | 2016
8 www.healthcaremanda.com
medication. The I/DD market has been around for decades, but has come back into the spotlight with the growing number of autism diagnoses. The states are trying to move people out of state-run homes and into private home- and community-based settings that are managed by private operators. Spending on behavioral health care deals has varied widely, from a low of $58.5 million in 2007 to $3.5 billion in 2010—the year that Universal Health Services acquired Psychiatric Solutions for $3.1 billion. Billion-dollar deals are becoming more common in this sector since 2014, when Acadia Healthcare paid nearly $1.2 billion for CRC Health Group. That deal marked a departure for Acadia, which had concentrated in psychiatric inpatient hospitals. CRC Health Group provides specialized behavioral health programs treating addiction and mental health disorders, which often occur together. In January 2016, Acadia announced its $2.2 billion purchase of the Priory Group, based in the United Kingdom.
Although spending reached $1.2 billion in 2015, that total is the result of 15 deals with disclosed prices, with $350 million as the highest. That was Universal Health Services’ acquisition of Foundations Recovery Network, LLC, with four residential facilities with 322 beds, and eight outpatient facilities in California, Georgia and Tennessee. An additional 140 expansion beds were planned at the time of the announcement in September 2015. This deal signaled a change for Universal Health,
which had focused on acute-care and mental health hospitals in the United States and United Kingdom.
Levine Leichtman Capital Partners made the second largest deal in 2015, paying $280 million for Monte Nido, a portfolio company of Centre Partners Management. Monte Nido treats eating disorders and exercise addiction in adults and adolescents.
In 2015, American Addiction Centers, a subsidiary of publicly traded AAC Holdings, announced the most acquisitions, at six deals. The company spent a total of $82.9 million for five inpatient and outpatient addiction treatment programs from Nevada to Rhode Island, and one 84-bed hospital facility in California.
Acadia Healthcare announced five transactions that included 10 behavioral health companies. Only two of the deals disclosed a price, for a total of $198 million. Three of the companies are based in the United Kingdom and the rest in the United States. Five of the targets treat addiction disorders, while the other five are inpatient behavioral health care centers.
Private equity firms made eight acquisitions in 2015, including Kohlberg & Company, LLC, which paid an undisclosed amount for substance abuse center Sunspire Health. Kohlberg has followed up with another behavioral health acquisition in 2016, paying $180 million for Meadows Behavioral Health, a portfolio company of American Capital.
Target Acquirer Year Price AcquirerSectorPsychiatricSolutions UniversalHealthServices 2010 $3,100,000,000 HospitalCRCHealthGroup AcadiaHealthcareCo. 2014 $1,175,000,000 BehavioralHealthCareCRCHealthCorp. BainCapitalPartners 2006 $723,000,000 PrivateEquityPartnershipsinCare AcadiaHealthcareCo. 2014 $662,000,000 BehavioralHealthCareBehavioralhealthdivision PsychiatricSolutions 2005 $565,300,000 BehavioralHealthCareAscendHealthCorp. UniversalHealthServices 2012 $517,000,000 HospitalHorizonHealthCorp. PsychiatricSolutions 2006 $426,000,000 BehavioralHealthCareResCare OnexCorp. 2010 $390,000,000 ConglomerateFoundationsRecoveryNetwork UniversalHealthServices 2015 $350,000,000 BehavioralHealthCareCygnetHealthCareLtd. UniversalHealthServices 2014 $335,000,000 BehavioralHealthCare
TENLARGESTBEHAVIORALHEALTHCARETRANSACTIONS,2000-2015

HealthCareMandA 9
21stCENTURY
Health Care M&Ain the
CPA/CVA/RN/PT Integration Specialistsfor Home Care and Hospice
Financial & Clinical Due DiligenceWork Flow and Process Due Diligence
Business Valuation Market AssessmentStrategic Planning
Financial Benchmarking
Simione.com | 844.293.1530
Serving the Home Care andHospice Industry for 50 Years
These are higher than in 2014 and higher than in previous years not dominated by some large transactions. Other buyers of note in 2015 were Almost Family and New Century Hospice with three acquisitions each, Addus Home Care, Epic Health Services, Civitas Solutions, LHC Group and Compassus with two acquisitions each. In addition, two private equity firms announced one acquisition each. But none of these transactions were close to making the top 10 list.
When looking at who is buying the home health and hospice agencies, it is no surprise that the majority of buyers are other home health and hospice companies seeking to expand their market share or geographic penetration. In 2015, these buyers accounted for 62% of the transactions. A distant second was long-term
There was a steady rise in home health care and hospice acquisitions from 2011 through 2014, increasing by nearly 80% in that time period. But that came to an end in 2015, with a 33% decline in transaction volume to just 47 acquisitions, which was closer to the activity in years 2010 (44 acquisitions) and 2011 (39 acquisitions). In addition, in 2014 there were three transactions valued in excess of $400 million, including one at $1.8 billion, whereas in 2015, the highest priced transaction with a disclosed price was just $170 million. Of the U.S.-based home health and hospice agencies sold with disclosed prices, the total value was only $438.05 million in 2015, an 88% plunge in value from 2014. Obviously, these were two very different markets separated by just 12 months. But the decline in transaction volume in 2015 was somewhat surprising because most of the trends in providing care are pointing to expanding home and community-based care or for providers to be part of a post-acute network. Both of these would seem to warrant a high level of interest to expand in the home health care and hospice market. So far in 2016, acquisition volume has exceeded that of 2015.
Based on publicly disclosed transactions, The Ensign Group was the most prolific buyer of home health and hospice agencies, announcing five separate acquisitions, all without disclosed prices but assumed to be relatively small. For the second year in a row it was the most active acquirer among the senior care providers. Other senior care providers buying home health or hospice companies included Extendicare, PruittHealth, Greystone Healthcare Management, Good Samaritan Society HCBS-Heritage and Sagepoint Senior Living. Even though the senior care providers did not disclose financial terms for their acquisitions, there were several other buyers who did. From this data we were able to glean an average price-to-revenue multiple of 1.24x and a median of 1.26x.
After three years of rising M&A activity, the home health and hospice sector took a breather in 2015. The pause was surprising, given the desire to increase home and community based supports and services that elderly advocacy groups have been pushing for, as well as government agencies. But that doesn't mean the demand is not there.
Home Health & Hospice

Health Care M&A in the 21st Century | Second Edition | 2016
10 www.healthcaremanda.com
$-
$1
$2
$3
$4
$5
$6
$7
0
10
20
30
40
50
60
70
80
2000 2001 2002 2003 2004 2005 2006 2007 2008 2009 2010 2011 2012 2013 2014 2015
DollarVo
lume(inbillions)
Transactions
HomeHealth&HospiceTransactionsandDollarVolume,2000-2015
NumberofTransactions TotalDollarAmount
care providers with 22% of the announced transactions, who view the home health business as not just a part of their post-acute continuum of care, but also as a means to better position themselves as part of integrated networks or Accountable Care Organizations. Some long-term care providers prefer to start their own agencies in the markets where they operate as opposed to buying other providers that may not have as good of a geographic fit. All the other acquirer categories each represented less than 5% of the transactions.
Spending on home health care has been rising steadily since the beginning of the 21st century. While most of the spending increase has been through the Medicaid and Medicare programs, from 2001 to 2007, the amount paid by private health insurance or out-of-pocket by consumers declined a little before starting a slow increase to the highest levels ever (but still far lower than either Medicaid or Medicare). According to the Centers for Medicare and Medicaid Services (CMS), between 2010 and 2014, spending on home health care increased 17% from $71.1 billion to $83.2 billion, and was expected to reach $86.5 billion in 2015. The market is expected to increase by at least 6% annually through 2026, the year that the first baby boomers reach 80 years old. The aging population, the prevalence of chronic health conditions of that population and quicker hospital discharges are all contributing to this increase in home health care expenditures. In addition,
although there is widespread discussion about the low cost of home health care relative to other settings, the comparison is less meaningful when the cost of living in your home is added to the equation.
Despite the growth in home health expenditures, the number of Medicare-certified home health agencies started to level off in 2013 and actually declined slightly by 2014. This occurred after a 38% increase between 2007 and 2013, or a compounded annual growth rate of 5.5%. Although fewer in number, hospice agencies have continued to grow, increasing by a compounded annual growth rate of 4.4% from 2007 through 2014. Unfortunately, with an increase in stories of hospice patients living well beyond the standard protocol of six-months, there has been pressure on hospice regulations and providers to make changes to who qualifies for hospice care and how care will be reimbursed.
Until the mid-2000’s, the Medicare-certified hospice market was dominated by not-for-profit providers. Even though there were not many Medicare-certified hospice providers 25 years ago, the not-for-profits outnumbered the for-profits by about three to one. The total number of certified agencies really began to grow in the mid-1990s, and after 1997 the number of not-for-profit agencies peaked and then started a slow decline. On the other hand, after 2000 the number of for-profit agencies started to expand significantly. It was not until

HealthCareMandA 11
21stCENTURY
Health Care M&Ain the
Target Acquirer Year Price AcquirerSectorLincareHoldings TheLindeGroup 2012 $4,600,000,000 OtherServicesCoram CVSCaremark 2013 $2,100,000,000 OtherServicesGentivaHealthServices KindredHealthcare 2014 $1,800,000,000 HomeHealth&HospiceApriaHealthcareGroup TheBlackstoneGroup 2008 $1,596,000,000 PrivateEquityOdysseyHealthCare,Inc. GentivaHealthServices 2010 $984,000,000 HomeHealth&HospiceEuropeanhomecareassets TheLindeGroup 2012 $750,000,000 IndustrialGasesEncompassHomeHealthandHospice HealthSouthCorp. 2014 $750,000,000 RehabilitationTheHealthfieldGroup GentivaHealthServices 2006 $454,000,000 HomeHealth&HospiceHardenHealthcareHoldings GentivaHealthServices 2013 $408,800,000 HomeHealth&HospiceVitasHealthcareCorp. Roto-Rooter 2013 $406,000,000 OtherServices
10LARGESTHOMEHEALTH&HOSPICETRANSACTIONS,2000-2015
the middle of the last decade that for-profit agencies started to outnumber the not-for-profits, and by 2014 they outnumbered them by almost three-to-one, completely reversing the relationship of 25 years ago. Today, about 68% of the Medicare-certified hospice agencies are for-profit.
According to our statistics, the vast majority of buyers of home health and hospice agencies (and companies) are for-profit (87% in 2015), which only fuels the expansion of the for-profit sector. In contrast, 8.5% of the sellers in 2015 were not-for-profits. So while the not-for-profits are not growing in number, neither are they selling in large numbers. The for-profits may be more attractive acquisition targets since, according to a MedPAC study, for-profits have a much higher profit margin (15.4%) than not-for-profits (3.7%).
The hospice market has come under some recent criticism, partly because it has grown so rapidly resulting in higher Medicare expenditures, and partly because there are some analysts in Washington, D.C. who believe that some providers have been gaming the system to a degree. As an example, some for-profit hospice providers have been accused of selectively admitting healthier patients who require less costly care and who endure longer profitable “stays” in hospice care. Research by MedPAC has determined that the average length of stay is longer in for-profit hospice programs than not-for-profits, and the disenrollment rate is higher in for-profits, meaning that the patients
do not die during their stay. The Medicare flat-rate reimbursement system may have also created an economic incentive for these providers to provide less care or have healthier patients, because the lower the treatment costs are, the more profitable the flat-rate payments become. Because of this, there have been changes to reimbursement as part of the Affordable Care Act, including a service intensity add-on which reimburses hospice agencies for up to four hours of direct patient care from a registered nurse or social worker who treats the patient during their last seven days of life, refocusing incentives to quality of care. While these changes may increase the quality of care provided in hospices, they will also reduce the profitability of hospice care as the need for increased hospice service will only increase with the demographic bubble that will start to grow in the mid-2020s.
There is no question that the overall need for home health and hospice care will only increase over the next 30 years, but the question remains: Who will pay for it and what will they pay for? If the reimbursement screws continue to tighten, the incentive for for-profit providers to expand in the business will decline. On the other hand, as bundled payments proliferate in the post-acute marketplace, as well as site-neutrality reimbursement, all providers will want to have access to high quality but efficient home health and hospice services in their networks of care, driving future acquisition demand for the better home health and hospice agencies.

Health Care M&A in the 21st Century | Second Edition | 2016
12 www.healthcaremanda.com
Hospital merger and acquisition activity remained strong in 2015, as the effects of the Affordable Care Act continued to ripple through the healthcare industry. Small hospitals and healthcare systems felt greater financial pressure to merge, partner or affiliate with larger hospitals and systems as the shift to value-based and capitated reimbursements gained ground. Hospitals in states that expanded Medicaid generally were in better financial shape than those in states that did not expand the healthcare safety net.
As a consequence, several deals resulted from the publicly traded hospital companies “rationalizing” their portfolios, which included divesting hospitals in non-expansion states. Some examples include Tenet Healthcare Corp.’s sale of five hospitals in the Atlanta metropolitan area to WellStar Health System for $661 million in December 2015, and the company’s sale of two North Carolina hospitals to Duke LifePoint Healthcare for an undisclosed price in November. In March, Community Health Systems sold two South Carolina hospitals to a REIT, Medical Properties Trust, Inc.
Acute care hospitals have been the center of health care delivery in the United States, but that is changing. Inpatient volumes have declined for several years, and aren't expected to increase. Meanwhile, payers are looking for the lowest-
cost setting with the best outcomes, leading hospitals to build or buy ambulatory surgery centers and partner with skilled nursing facilities, while adding home health and hospice services. Thanks to the rapidly changing role of technology in health care, the hospital of the future that some systems are building may be obsolete on opening day.
Hospitals
Evidence emerged in third quarter of 2015 that the gains hospitals expected from the ACA could be fading. Inpatient volumes continued to fall, and investors began to look to the leverage hospital operators were carrying. Stock prices plummeted, and haven’t completely recovered by Q1:16. To be fair, equity markets around the globe were roiled in Q3:15 by the fact that China’s economic growth was slowing, and by the first hike in interest rates that the Federal Reserve signaled would come in September. That quarter-point increase did not occur until December, but the anticipation dampened investment performance.
Against that backdrop, Community Health Systems announced its spinoff of 38 small-market hospitals into a new company called Quorum Health Corp., as it shifted its focus to larger markets with more opportunities for growth. The plan originally targeted the initial public offering to launch by the end of the first quarter, but in January 2016, the company postponed the spinoff to the second quarter, citing the uncertain state of the markets once again.
$-
$5
$10
$15
$20
$25
$30
$35
$40
0
20
40
60
80
100
120
2000 2001 2002 2003 2004 2005 2006 2007 2008 2009 2010 2011 2012 2013 2014 2015
DollarVo
lume(inbillions)
Transactions
HospitalTransactionsandDollarVolume,2000-2015
NumberofTransactions TotalDollarAmount

HealthCareMandA 13
21stCENTURY
Health Care M&Ain the
Financial Advisor toAllegiance Health
STRATEGIC AFFILIATIONS • MERGERS & ACQUISITIONS CAPITAL PLACEMENTS • RESTRUCTURINGS
Three dialysis centers have been acquired by
Sell Side Advisor
in its Change of Control Transaction with
f/k/a
Financial Advisor toSenior Secured Creditors
has affiliated with
SOLICCAPITAL.COM
CREATIVE SOLUTIONS TOHEALTHCARE CONSOLIDATION
SOLICC A P I T A L A D V I S O R S , L L C
©2016 SOLIC Capital Advisors, LLC. All rights reserved. Investment banking, private placement, merger, acquisition and divestiture services offered through SOLIC Capital, LLC. Member FINRA/SIPC. SOLIC Capital Management, LLC is an SEC Registered Investment Adviser.
SOLIC is not a certified public accounting firm and does not provide audit, attest, or public accounting services.
Target Acquirer Year Price AcquirerSectorHCA PEConsortium 2006 $33,000,000,000 PrivateEquityHealthManagementAssociates CommunityHealthSystems 2013 $7,600,000,000 HospitalTriadHospitals CommunityHealthSystems 2007 $6,800,000,000 HospitalVanguardHealthSystems TenetHealthcareCorp. 2013 $4,300,000,000 Hospital43Germanhospitals FreseniusHelios 2013 $4,175,200,000 HospitalParkwayHoldingsLtd. KhazanahNasionalBerhad 2010 $3,300,000,000 SovereignFundQuorumHealthGroup TriadHospitals 2000 $2,400,000,000 HospitalSelectMedicalCorp. Welsh,Carson,Anderson&Stowe 2004 $2,300,000,000 PrivateEquityAlNoorHospitalsGroupplc MediclinicInternationalLtd. 2015 $2,300,000,000 HospitalProvinceHealthcareCompany LifePointHospitals 2004 $1,799,000,000 Hospital
10LARGESTHOSPITALTRANSACTIONS,2000-2015
Hospital M&A increased 3.0% in 2015, to 102 transactions, compared with 99 transactions in 2014. The level of activity is more typical than that seen in 2013, when the publicly traded hospital chains consolidated from five to three. That is when Community Health Systems acquired Health Management Associates, and Tenet Healthcare acquired Vanguard Health. At the time, Health Management owned 71 hospitals with approximately 11,000 licensed beds. Tenet's target, Vanguard, operated 28 acute-care and specialty hospitals with 7,081 licensed beds.
Those two deals took a lot of facilities out of play for a while, as the acquirers integrated and evaluated their new properties, and sapped some energy from the market. The corresponding dip in the number of transactions for 2013 is deceiving, as the number of hospitals that traded hands that year (293 hospitals) was far higher than the year before, 2012 (242), and the year after, 2014 (175). In 2015, 265 hospitals were involved in the 102 transactions, averaging 2.6 hospitals per transaction.
Of the 102 transactions announced in 2015, seven involved critical access hospitals with a combined total of 160 beds; one deal involved the acquisition of a single long-term acute care hospital, or LTAC, with 34 beds; and three deals involved three surgical hospitals with a total of 74 beds. The remaining 91 deals involved the acquisition of 246 general acute care hospitals with 26,799 beds. Seven transactions involved the sale of
seven bankrupt facilities (2014, seven) with 654 beds (2014, 1,182).
The largest deal in 2015 was a transaction between two foreign hospital operators. Al Noor Hospitals Group plc, based in Dubai, United Arab Emirates, accepted a $2.3 billion offer from South Africa-based Mediclinic International Ltd. Al Noor Hospitals Group provides
Health Care M&A in the 21st Century | Second Edition | 2016
14 www.healthcaremanda.com
primary, secondary and tertiary care services through its portfolio of hospitals and medical centers in the United Arab Emirates. Mediclinic International operates private hospitals in South Africa, Namibia, Switzerland and the UAE.
The second largest was the $1.75 billion deal for Ardent Health Services, a 10-hospital chain, by the REIT Ventas, Inc. in April 2015. In July, Ventas sold off 90.1% of its stake in the operations to Equity Group Investments, for $475 million. EGI and current Ardent Health Services management share the remaining ownership stake.
Those two hospital deals announced in 2015 surpassed the $1 billion mark—quite a change from 2014, when no deal carried a price higher than $1 billion. The combined total of 2015’s top 10 deals, nearly $7.7 billion, is a far cry from the previous year’s $2.5 billion spent on the 10 largest transactions.
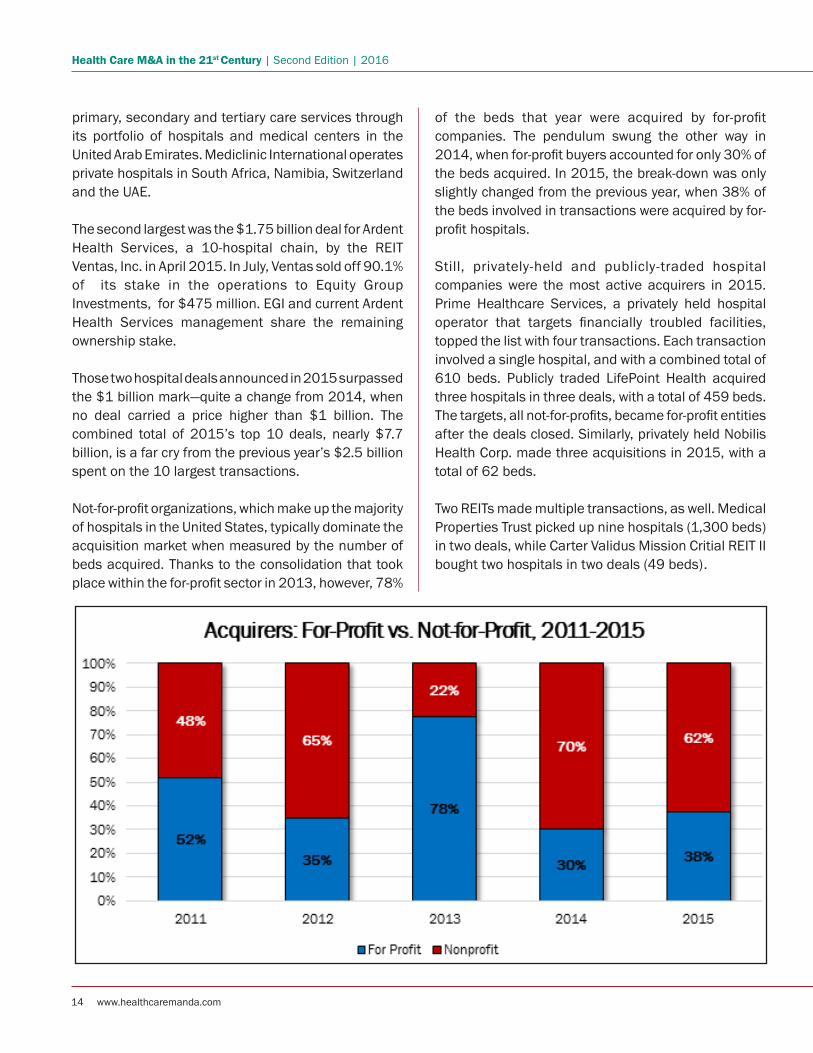
Not-for-profit organizations, which make up the majority of hospitals in the United States, typically dominate the acquisition market when measured by the number of beds acquired. Thanks to the consolidation that took place within the for-profit sector in 2013, however, 78%
of the beds that year were acquired by for-profit companies. The pendulum swung the other way in 2014, when for-profit buyers accounted for only 30% of the beds acquired. In 2015, the break-down was only slightly changed from the previous year, when 38% of the beds involved in transactions were acquired by for-profit hospitals.
Still, privately-held and publicly-traded hospital companies were the most active acquirers in 2015. Prime Healthcare Services, a privately held hospital operator that targets financially troubled facilities, topped the list with four transactions. Each transaction involved a single hospital, and with a combined total of 610 beds. Publicly traded LifePoint Health acquired three hospitals in three deals, with a total of 459 beds. The targets, all not-for-profits, became for-profit entities after the deals closed. Similarly, privately held Nobilis Health Corp. made three acquisitions in 2015, with a total of 62 beds.
Two REITs made multiple transactions, as well. Medical Properties Trust picked up nine hospitals (1,300 beds) in two deals, while Carter Validus Mission Critial REIT II bought two hospitals in two deals (49 beds).

HealthCareMandA 15
21stCENTURY
Health Care M&Ain the
Which is why it pays to think big. Our big ideas led to more than $10.4 billion in seniors housing financing and capital markets transactions in 2015.
With Key you get a powerful, national platform and the keen market insights that come from being a leader in seniors housing finance. In 2015 we:
• Raised $3.0 billion in Equity• Placed $1.9 billion in Debt• Sold $2.7 billion in Syndications• Originated $1.1 billion on Balance Sheet• Closed $1.7 billion in Mortgage Banking
Ideas are the new currency.
To learn more, contact:Healthcare Finance Kevin Murray at 770-510-2168 or [email protected]
Healthcare Mortgage Banking Carolyn Nazdin at 202-452-4912 or [email protected]
Visit key.com/healthrec
Banking products and services are offered by KeyBank National Association. All credit, loan and leasing products subject to credit approval. Key.com is a federally registered service mark of KeyCorp. ©2016 KeyCorp. KeyBank is Member FDIC. 160210-40288

Health Care M&A in the 21st Century | Second Edition | 2016
16 www.healthcaremanda.com
The merger and acquisition market for laboratories, imaging services and dialysis companies is as diverse as each of these segments are, and their fortunes are controlled by market factors unique to each. However, one factor links each of these sub-sectors to the rest of the healthcare environment, and that is the need for scale, and thus, consolidation.
The laboratory segment has undergone some deep shifts as other sectors consolidate. Diagnostics companies have had to adapt as hospitals and health systems have merged or closed in recent years. In many cases, hospitals outsourced their lab operations as a way to cut costs, which created opportunities for companies like Quest Diagnostics. Quest has become a large "partner" to many health systems, such as Barnabas Health, the second largest not-for-profit health system in New Jersey.
Some lab companies have evolved to offer coordinated diagnostics, such as on-the-spot diagnoses, while also handling bills and lab data from several sources and providers as an aid to accountable care organizations.
The catch-all sector that we call Laboratories, MRI and Dialysis covers varied parts of the health care market, combining diagnostic laboratories with medical imaging and dialysis companies. The number of transactions in all three areas has been lackluster in recent years, but deals for diagnostic labs, radiology and medical imaging spiked in 2015.
Laboratories, MRI & Dialysis
$-
$2
$4
$6
$8
$10
$12
0
10
20
30
40
50
60
70
2000 2001 2002 2003 2004 2005 2006 2007 2008 2009 2010 2011 2012 2013 2014 2015
DollarVo
lume(inbillions)
Transactions
Laboratories,MRI&DialysisTransactionsandDollarVolume,2000-2015
NumberofTransactions TotalDollarAmount
One headwind that's gathering strength stems from a June 2016 final ruling by CMS that is intended to cut billions of dollars in lab fees. Beginning in January 2018, CMS will change its reimbursement rates to match those of private insurance companies for clinical diagnostic laboratory tests. Although the cost benefits are more modest than an earlier proposal, the rule is expected to save $390 million in its first year of implementation and $3.9 billion over 10 years. The current fee schedule for Medicare reimbursement has remained largely unchanged since 1984. The program paid approximately $7 billion for clinical diagnostic lab tests in 2014.
Technology is another major factor behind M&A in this sector. Labs, imaging and dialysis centers each generate a lot of data, which payers want to analyze, hoping to find ways to cut costs and improve both health and efficiencies. Some data may provide early warning signs to payers, to help them detect and identify clients who haven't made a claim, but whose data show they may be headed for an emergency room visit and/or a hospital stay in the near future.

HealthCareMandA 17
21stCENTURY
Health Care M&Ain the
Even so, managed care companies are not lining up to acquire these data-rich companies. Only one managed care company announced a purchase in 2015. One Call Care Management, a privately held firm based in Jacksonville, Florida, paid $30 million for MedFocus Radiology Network, which manages the delivery and scheduling of diagnostic imaging services through its network of contracted radiological imaging providers.
The largest deal in this sector in 2015 shows how the game is changing. In June 2015, biopharmaceutical maker OPKO Health paid $1.47 billion for publicly traded Bio-Reference Laboratories, one of the largest full-service diagnostic laboratories in more than 50 countries. OPKO planned to leverage the national marketing, sales and distribution resources of Bio-Reference to enhance sales of its 4Kscore test, a blood test that evaluates a patient's risk for aggressive prostate cancer. At the same time, it gained a strong diagnostic franchise in women's health, oncology and genetics. The multiples are in line with those seen in other sectors: 1.7x revenue and 12.7x EBITDA.
In the dialysis market, DaVita HealthCare Partners expanded its geographic footprint with the $415 million acquisition of Renal Ventures Management, LLC, operator of 36 dialysis clinics in six states. Renal Ventures also operates infusion and vascular centers in three states through its Multispecialty Physician Partners and Physician Venture Partners divisions.
The largest acquisition by price in the MRI/diagnostic
Target Acquirer Year Price AcquirerSectorCovance LaboratoryCorp.ofAmericaHoldings 2014 $5,600,000,000 Laboratories,MRI&DialysisOrtho-ClinicalDiagnostics TheCarlyleGroup 2014 $4,150,000,000 PrivateEquityRenalCareGroup FreseniusNationalMedicalCareNA 2005 $4,000,000,000 Laboratories,MRI&DialysisGambroHealthcareUS DaVita 2004 $3,050,000,000 Laboratories,MRI&DialysisLibertyDialysisHoldings FreseniusMedicalCare 2011 $2,100,000,000 Laboratories,MRI&DialysisAmeriPath QuestDiagnostics 2007 $2,000,000,000 Laboratories,MRI&DialysisBio-ReferenceLaboratories OPKOHealth,Inc. 2015 $1,470,000,000 PharmaceuticalsCMLHealthCareInc. LifeLabsMedicalLaboratoryServices 2013 $1,220,000,000 Laboratories,MRIandDialysisDiagnosticsbusiness BorealisInfrastructureManagement,Inc. 2006 $1,176,575,000 FundmanagerUnilabCorporation QuestDiagnostics,Inc. 2002 $1,100,000,000 Laboratories,MRIandDialysis
10LARGESTLABORATORIES,MRI&DIALYSISTRANSACTIONS,2000-2015
imaging space was made by a Chinese private investment firm, Fujian Thai Hot Investment Co., Ltd. In September 2015, the firm paid $102.5 million for a majority interest in Alliance HealthCare Services, Inc., a publicly traded diagnostic and imaging network based in Newport Beach, California. Alliance operates 518 diagnostic imaging and radiation therapy centers, including 118 fixed-site imaging centers across the country, and 32 radiation therapy centers and stereotactic radiosurgery facilities.
In 2015, six acquirers, including Fujian, were private equity firms. KKR & Co. led this cohort with its $989 million acquisition of the U.K.-based LGC Group, a portfolio company of Bridgepoint, which provides services such as DNA sequencing, paternity and drug/alcohol testing in 22 countries. Private equity firms generally steer clear of healthcare companies that can be affected adversely by "a stroke of the pen" or overly active government oversight, so it's a telling sign that LGC is based outside the United States.
On the other hand, London-based GHO Capital Partners LLP paid approximately $118.2 million for DDC, in Fairfield, Ohio, one of the largest DNA testing companies in the world. So foreign firms are not afraid to invest in the U.S., at least in the biological diagnostic area. More PE firms see this climate as a good time to exit the space. For example, Primus Capital and Brentwood Capital Partners are said to be looking for a buyer for PathGroup Inc., a clinical lab and anatomical pathology testing provider.
Health Care M&A in the 21st Century | Second Edition | 2016
18 www.healthcaremanda.com
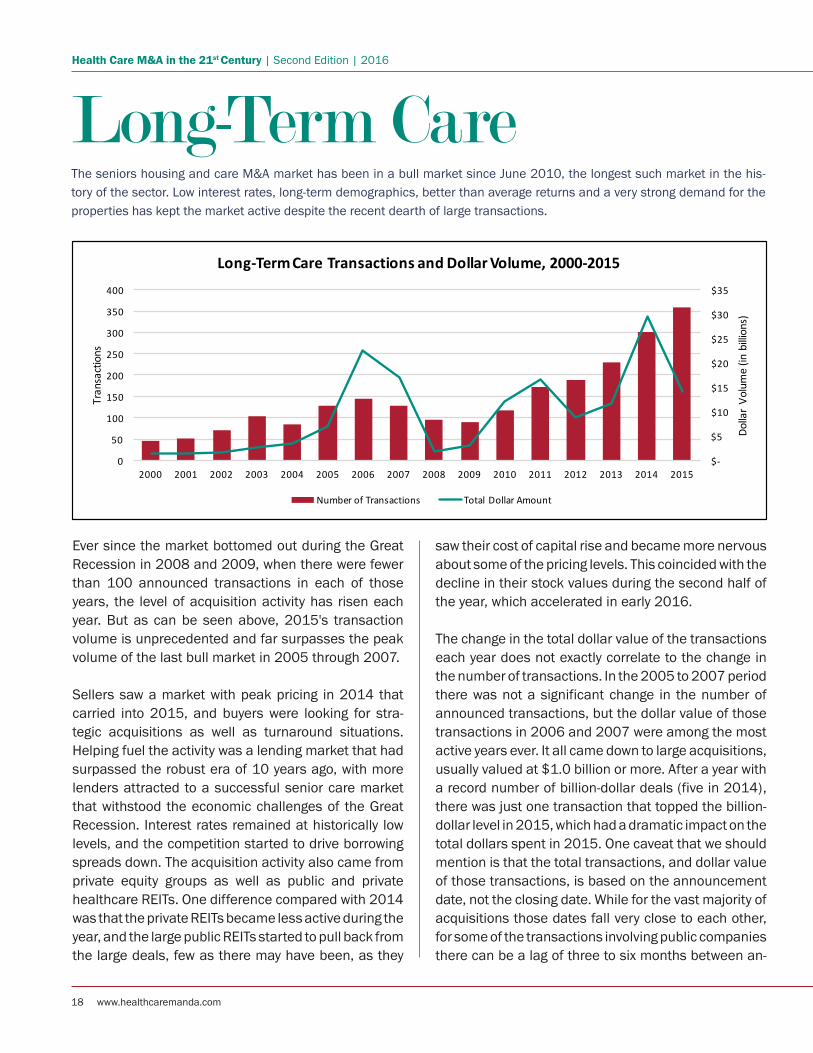
Ever since the market bottomed out during the Great Recession in 2008 and 2009, when there were fewer than 100 announced transactions in each of those years, the level of acquisition activity has risen each year. But as can be seen above, 2015's transaction volume is unprecedented and far surpasses the peak volume of the last bull market in 2005 through 2007.
Sellers saw a market with peak pricing in 2014 that carried into 2015, and buyers were looking for stra-tegic acquisitions as well as turnaround situations. Helping fuel the activity was a lending market that had surpassed the robust era of 10 years ago, with more lenders attracted to a successful senior care market that withstood the economic challenges of the Great Recession. Interest rates remained at historically low levels, and the competition started to drive borrowing spreads down. The acquisition activity also came from private equity groups as well as public and private healthcare REITs. One difference compared with 2014 was that the private REITs became less active during the year, and the large public REITs started to pull back from the large deals, few as there may have been, as they
saw their cost of capital rise and became more nervous about some of the pricing levels. This coincided with the decline in their stock values during the second half of the year, which accelerated in early 2016.
The change in the total dollar value of the transactions each year does not exactly correlate to the change in the number of transactions. In the 2005 to 2007 period there was not a significant change in the number of announced transactions, but the dollar value of those transactions in 2006 and 2007 were among the most active years ever. It all came down to large acquisitions, usually valued at $1.0 billion or more. After a year with a record number of billion-dollar deals (five in 2014), there was just one transaction that topped the billion-dollar level in 2015, which had a dramatic impact on the total dollars spent in 2015. One caveat that we should mention is that the total transactions, and dollar value of those transactions, is based on the announcement date, not the closing date. While for the vast majority of acquisitions those dates fall very close to each other, for some of the transactions involving public companies there can be a lag of three to six months between an-
The seniors housing and care M&A market has been in a bull market since June 2010, the longest such market in the his-tory of the sector. Low interest rates, long-term demographics, better than average returns and a very strong demand for the properties has kept the market active despite the recent dearth of large transactions.
Long-Term Care
$-
$5
$10
$15
$20
$25
$30
$35
0
50
100
150
200
250
300
350
400
2000 2001 2002 2003 2004 2005 2006 2007 2008 2009 2010 2011 2012 2013 2014 2015
DollarVo
lume(inbillions)
Transactions
Long-TermCareTransactionsandDollarVolume,2000-2015
NumberofTransactions TotalDollarAmount

HealthCareMandA 19
21stCENTURY
Health Care M&Ain the
nouncement and closing, which is why the numbers in this report may differ from other reported numbers. In addition, we deduct out from the transaction dollars the value of non-senior care assets purchased, such as hospitals or MOBs that may be in the portfolio of a purchased REIT. This provides a clearer picture of what happened during the year.
After the record dollar amount of M&A in the senior care market in 2014, there was a 44.5% plunge in the total dollars invested or committed in 2015, but the mar-ket’s breadth was unparalleled. REITs were still active, just not at the mega-deal level like in previous years. However, even though it looks as if there was a sudden investment shift, over the past 16 years 2015 had the fifth highest dollar amount of M&A activity with the high-est number of individual transactions. Many people had been expecting more REIT-to-REIT acquisitions in 2015, and that may happen in 2016 when some weakness in the market may spur some mergers.
The average price per unit of seniors housing commu-nities (independent and assisted living combined) not only set a new record in 2014, but shattered the previ-ous record (in 2007) with an increase of 26.5%, driven by an unusual number of high-quality properties and portfolios. IL properties, in particular, had an outsized effect on the high average price, despite being outnum-bered four-to-one by AL properties sold. The high prices mostly continued into 2015, with 48 transactions val-ued above $200,000 per unit, of which 15 were over $300,000 per unit. While these numbers were similar
to 2014, the volume of transactions expanded year over year, and the lower-priced sales brought the full year average down. Despite a drop of nearly 9% in the average price per unit for seniors housing, the 2015 average price of $189,900 per unit still ranks as the second highest ever. When breaking down the seniors housing market into its two primary components, in-dependent living and assisted living (which includes memory care), the change from 2014 becomes very ap-
Our client acquires SNF portfolios& chains throughout the U.S.
One Billion Dollars earmarked forinvestment this year
CONTACT US WITH OPPORTUNITIESABSOLUTE DISCRETION NECESSARY
NO FEESBROKERS WELCOME
1.424.281.4244 | [email protected]
Target Acquirer Year Price AcquirerNationwideHealthProperties Ventas 2011 $7,400,000,000 REITHolidayRetirement FortressInvestmentGroup 2006 $6,600,000,000 InvestmentManorCare TheCarlyleGroup 2007 $6,300,000,000 PrivateEquityHCRManorCarerealestateassets HCP 2010 $6,100,000,000 REITCNLRetirementProperties HealthCarePropertyInvestors 2006 $5,300,000,000 REITGriffin-AmericanHealthcareREITII NorthStarRealtyFinanceCorp. 2014 $4,000,000,000 REITAtriaSeniorLivingrealestateassets Ventas 2010 $3,100,000,000 REITAvivREIT OmegaHealthcareInvestors 2014 $3,000,000,000 REITEmeritusCorp. BrookdaleSeniorLiving 2014 $2,800,000,000 Long-TermCareAmericanRealtyCapitalHealthcare Ventas 2014 $2,600,000,000 REIT
10LARGESTLONG-TERMCARETRANSACTION,2000-2015
Health Care M&A in the 21st Century | Second Edition | 2016
20 www.healthcaremanda.com
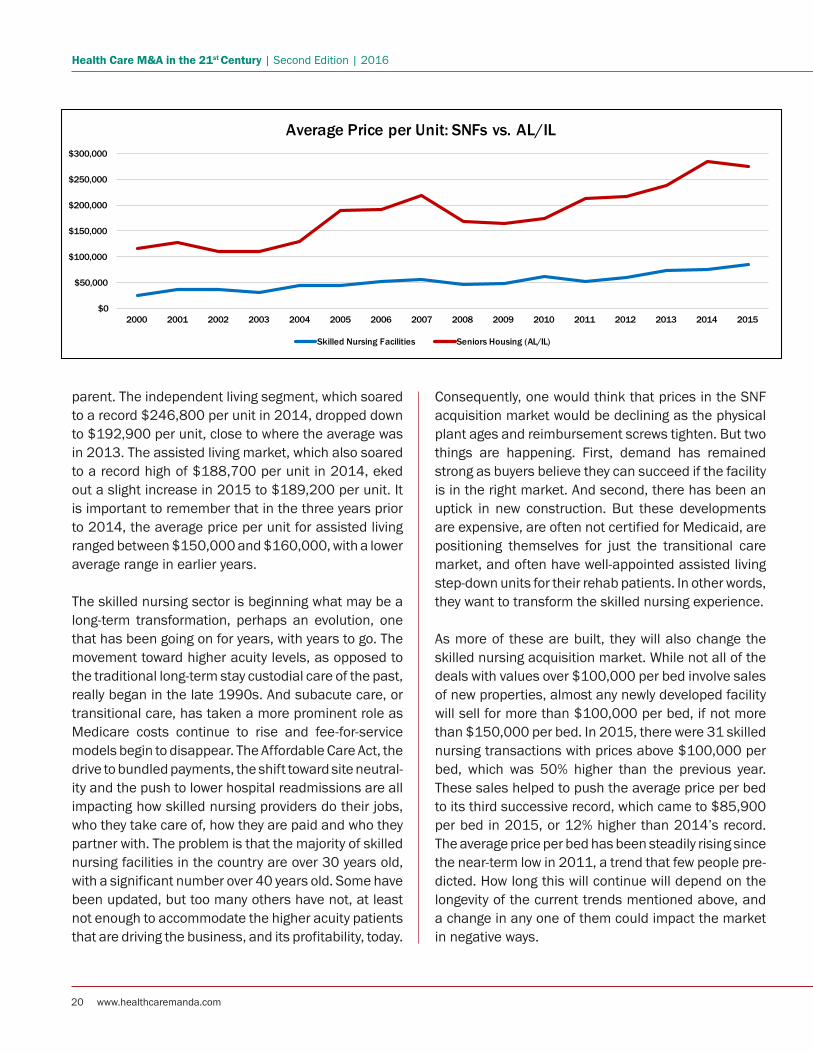
parent. The independent living segment, which soared to a record $246,800 per unit in 2014, dropped down to $192,900 per unit, close to where the average was in 2013. The assisted living market, which also soared to a record high of $188,700 per unit in 2014, eked out a slight increase in 2015 to $189,200 per unit. It is important to remember that in the three years prior to 2014, the average price per unit for assisted living ranged between $150,000 and $160,000, with a lower average range in earlier years.
The skilled nursing sector is beginning what may be a long-term transformation, perhaps an evolution, one that has been going on for years, with years to go. The movement toward higher acuity levels, as opposed to the traditional long-term stay custodial care of the past, really began in the late 1990s. And subacute care, or transitional care, has taken a more prominent role as Medicare costs continue to rise and fee-for-service models begin to disappear. The Affordable Care Act, the drive to bundled payments, the shift toward site neutral-ity and the push to lower hospital readmissions are all impacting how skilled nursing providers do their jobs, who they take care of, how they are paid and who they partner with. The problem is that the majority of skilled nursing facilities in the country are over 30 years old, with a significant number over 40 years old. Some have been updated, but too many others have not, at least not enough to accommodate the higher acuity patients that are driving the business, and its profitability, today.
Consequently, one would think that prices in the SNF acquisition market would be declining as the physical plant ages and reimbursement screws tighten. But two things are happening. First, demand has remained strong as buyers believe they can succeed if the facility is in the right market. And second, there has been an uptick in new construction. But these developments are expensive, are often not certified for Medicaid, are positioning themselves for just the transitional care market, and often have well-appointed assisted living step-down units for their rehab patients. In other words, they want to transform the skilled nursing experience.
As more of these are built, they will also change the skilled nursing acquisition market. While not all of the deals with values over $100,000 per bed involve sales of new properties, almost any newly developed facility will sell for more than $100,000 per bed, if not more than $150,000 per bed. In 2015, there were 31 skilled nursing transactions with prices above $100,000 per bed, which was 50% higher than the previous year. These sales helped to push the average price per bed to its third successive record, which came to $85,900 per bed in 2015, or 12% higher than 2014’s record. The average price per bed has been steadily rising since the near-term low in 2011, a trend that few people pre-dicted. How long this will continue will depend on the longevity of the current trends mentioned above, and a change in any one of them could impact the market in negative ways.
$0
$50,000
$100,000
$150,000
$200,000
$250,000
$300,000
2000 2001 2002 2003 2004 2005 2006 2007 2008 2009 2010 2011 2012 2013 2014 2015
Average Price per Unit: SNFs vs. AL/IL
Skilled Nursing Facilities Seniors Housing (AL/IL)

HealthCareMandA 21
21stCENTURY
Health Care M&Ain the

Health Care M&A in the 21st Century | Second Edition | 2016
22 www.healthcaremanda.com
Mergers and acquisitions in the managed care sector surged back to life in 2015. For the year, deal volume grew 104%, to 45 transactions, almost tying the cen-tury's high point of 46 transactions in 2000. However, the new millennium has never come close to the 1990s in deal volume for managed care companies. In 1999, there were 66 deals announced in this sector, a record that hasn't been broken yet.
The Great Recession took a toll on M&A in this space, and the passage of the ACA in 2010 did little to get things moving once again. The industry as a whole was watching and waiting to see what challenges would come along. After the U.S. Supreme Court ruled favorably on the ACA's tax implications in June 2012, deal activity increased slightly. It fell again in 2013 as investors waited to see the outcome of the launch of Healthcare.gov, the federal healthcare exchange, which went "live" only in a figurative sense, on October 1, 2013. The disastrous launch of the federal exchange was fixed over the following months, and the stream of new enrollees encouraged investors to come back.
Another challenge to the ACA came in 2014, which tamped down M&A activity. It wasn't until late June 2015 that SCOTUS handed down its decision in King v. Burwell, which upheld the use of subsidies to people who enrolled in healthcare coverage through the federal exchange. The virtual M&A floodgates opened.
Almost immediately, Centene Corp. announced its in-tention to buy Health Net for $6.8 billion. That deal was soon dwarfed by Aetna’s proposed buyout of Humana Inc. for $37 billion, and by Anthem’s $54.2 billion deal for Cigna. All three acquirers anticipated closing their transactions in 2016.
The largest deal, of course, was Anthem’s $54.2 billion acquisition of Cigna Corp., which provides insurance and related products through several segments, includ-ing Commercial, Government, Group Disability and Life, Global Supplemental Benefits and Run-off Reinsur-ance. The combined company is expected to cover 53 million lives, making it the largest health insurer in the United States. Anthem expects to achieve adjusted EPS
The managed care acquisition market has had a very mixed level of activity in recent years, with uncertainty around the Affordable Care Act and then with the first test of the Act with the Supreme Court. After a disastrous roll-out of the health-insurance exchanges, the market began to pick up. The desire for ever greater scale made 2015 a bang-up year for M&A.
Managed Care
$-
$20
$40
$60
$80
$100
$120
05
101520253035404550
2000 2001 2002 2003 2004 2005 2006 2007 2008 2009 2010 2011 2012 2013 2014 2015
DollarVo
lume(inbillions)
Transactions
ManagedCareTransactionsandDollarVolume,2000-2015
NumberofTransactions TotalDollarAmount

HealthCareMandA 23
21stCENTURY
Health Care M&Ain the
accretion approaching 10% in Year One, and double that in Year Two. The price/revenue multiple is 1.5x, and price/EBITDA is 13.9x.
Some friction surfaced in May 2016, when a regulatory filing by Cigna said the acquisition may not be approved in 2016. The companies were aiming to close the deal in the second half of the year. In June, California's in-surance commissioner urged the U.S. Department of Justice to block this transaction, saying the deal would likely result in higher costs for consumers and busi-nesses. The recommendation can't derail the deal, but could influence the federal agency's decision.
Humana’s focus on Medicare and Medicaid plans was the big attraction for Aetna and its commercial plans. With Aetna's 8.7 million commercial insured members and Humana's 4.4 million Medicare Advantage mem-bers, 56% of revenue will come from government busi-ness. The transaction establishes a leading Medicare Advantage and commercial player, and is projected to realize $1.25 billion in annual synergies. The price of $37 billion produces multiples of 0.7x revenue and 13.7x EBITDA.
This deal also ran into a rocky patch during the regula-tory review process in May 2016, when Missouri was the first state to take issue with this transaction. State insurance officials issued a preliminary order to the parties, saying they had 30 days to submit a plan to
remedy the anticompetitive impact of the acquisition. The states seemed to be pushing the insurers to divest Medicare Advantage plans in areas where competition would have been severely diminished. That issue has yet to be resolved, at press time.
Centene Corp.’s acquisition of Health Net, Inc. actu-ally closed in March 2016. The transaction created an MCO with more than 10 million members across the country. At the time of the announcement in 2015, Health Net covered approximately 6 million individuals through group, individual, Medicare, Medicaid, dual eligible, U.S. Department of Defense and U.S. Depart-ment of Veterans Affairs programs. The $6.8 billion price includes approximately $500 million of debt, and produces multiples of 0.5x revenue and 19.5x EBITDA.
Other insurers were making multiple deals in 2015. Molina Healthcare was by far the busiest acquirer, an-nouncing eight transactions. Every target was a Man-aged Medicaid division of a larger state-based insurer, with two in Florida, three in Illinois, two in Michigan and one in Washington state.
Centene Corp. announced two additional deals (be-sides HealthNet). In January 2015 it acquired Live-Healthier, a health management solutions provider working with large employers, unions and government organizations, and Agate Resources, which offers a range of healthcare products and services in Oregon.
Target Acquirer Year Price AcquirerSectorCignaCorp. Anthem,Inc. 2015 $54,200,000,000 ManagedCareHumanaInc. Aetna 2015 $37,000,000,000 ManagedCareWellPointHealthNetworks,Inc. AnthemGroup 2003 $16,500,000,000 ManagedCarePacifiCareHealthSystems,Inc. UnitedHealthGroup,Inc. 2005 $9,200,000,000 ManagedCareCoventryHealthCare,Inc. AetnaInc. 2012 $7,300,000,000 ManagedCareHealthNet,Inc. CenteneCorp. 2015 $6,800,000,000 ManagedCareWellChoice,Inc. WellPoint,Inc. 2005 $6,500,000,000 ManagedCareOxfordHealthPlans,Inc. UnitedHealthGroup,Inc. 2004 $4,900,000,000 ManagedCareAmerigroupCorporation WellPoint,Inc. 2012 $4,900,000,000 ManagedCareAmilParticipaçõesS.A. UnitedHealthGroup 2012 $4,300,000,000 ManagedCare
10LARGESTMANAGEDCARETRANSACTIONS,2000-2015

Health Care M&A in the 21st Century | Second Edition | 2016
24 www.healthcaremanda.com
After three years of declines, mergers and acquisitions among physician medical groups picked up in 2015, in a big way. Just as hospitals, health insurers and others are seeking greater scale to boost efficiency and outcomes, physicians are joining larger management groups or health systems for the same reasons. In 2015, consoli-dation among the biggest players got under way, and the momentum has continued into 2016.
The usual factors are driving some of this M&A activity. Younger doctors with young families want more regular schedules, older doctors are retiring and selling their practices, or whole group practices are looking to third-party managers to cover the expenses of installing electronic health records, revenue cycle management and even population health management technology that will make them compliant with the latest Center for Medicare and Medicaid Services (CMS) regulations.
Another factor is making this a sector to watch in 2016 and beyond. The most influential will likely be the Medicare Access and CHIP Replacement Act of 2015 (MACRA), passed by a bipartisan vote in Congress in
April 2015. Just as the Affordable Care Act aimed to change the health insurance industry, MACRA targets healthcare providers. The law did away with the hated Sustainable Growth Rate, known as the Doc-Fix Rule, that caused annual arguments in Congress over setting new rates for physicians who see Medicare patients.
CMS took a year to issue regulations regarding this legislation, and when the 962-page proposal landed in late April 2016, word began to spread among the investment community that another shoe had dropped. The comment period extended only until the end of June, and CMS’ goal is to finalize the proposals by the end of 2016. Adjustments to reimbursements would take effect in 2019, a proposal that has many physi-cian practice managers worried that CMS is moving too quickly to affect big changes.
The rule replaces the previous Meaningful Use program, but ups the ante on electronic health records, and in-teroperability across multiple providers’ systems. It also continues the shift from a fee-for-service model (called Merit-based Incentive Payment System, or MIPS) to a
The 1990s still holds the record for mergers and acquisitions among physician medical groups, thanks to the myriad IPOs and the race to meet earnings targets. M&A activity in this sector picked up sharply in 2015, and could go higher in the coming years. The impact of the Medicare Access and CHIP Replacement Act of 2015 (MACRA) is just beginning to be felt, and that could push more physicians to seek employment with the big practice management companies, or health systems.
Physician Medical Groups
$-$500$1,000$1,500$2,000$2,500$3,000$3,500$4,000$4,500$5,000
0
20
40
60
80
100
120
140
2000 2001 2002 2003 2004 2005 2006 2007 2008 2009 2010 2011 2012 2013 2014 2015
DollarVo
lume(inm
illions)
Transactions
PhysicianMedicalGroupTransactionsandDollarVolume,2000-2015
NumberofTransactions TotalDollarAmount

HealthCareMandA 25
21stCENTURY
Health Care M&Ain the
value-based, coordinated care model (called Advanced Alternative Payment Model, or APM). Physicians can choose one or the other, and even move from one to the other, but the reward is greater for assuming more risk in APM than in MIPS. While CMS announced a program to help smaller practices adapt to the changes, some industry observers predict that solo practitioners will be forced to join a larger practice, seek employment with a local hospital, or simply retire.
Judging from the jump in acquisitions in 2015, it looks as though many physicians came to the conclusion that they were better off joining a large physician man-agement company. These circumstances seem to give acquirers—from hospitals and physician management companies to payers and private equity groups—strong bargaining positions, as more physician groups decide they need greater scale to survive.
In 2015, consolidation began among the biggest play-ers, and more is on the way. A total of 46 acquirers announced 88 deals in 2015. Nine publicly traded corporations had a combined total of 50 deals. IPC Healthcare, which became a target itself in the sum-mer of 2015, made 16 acquisitions and MEDNAX announced 10. Sheridan Healthcare and Team Health Holdings each made seven announcements.
Twenty-one privately held companies announced 24 deals, and 14 not-for-profits announced 14 acquisi-tions. Every target was privately owned, and none were not-for-profits.
Chicago Medical Office Portfolio
Chicago, IL (9 Locations)
401,428 sf
$131,000,000
21st Century Oncology Portfolio
FL, CA, NV, WV, KY
224,150 sf
$117,216,153
Memorial Hermann Katy Medical Complex
Katy, TX
108,066 sf
$40,400,000
Bronson LakeView Outpatient Center
Paw Paw (Kalamazoo), MI
100,321 sf
$30,430,000
Dermatology Associates of Wisconsin Portfolio
Manitowoc, WI
93,142 sf
$28,339,280
Orthopaedic Associates & Deaconess Health System
Henderson, KY
12,823 sf
$4,010,000
Providing Specialized Care in the Healthcare Real Estate Marketplace™
Below is a Sampling of Our Recent Closings
HEALTHCARE REAL ESTATE GROUP
To access the investment market, contact the market leaders.
Scott NiedergangVice President Investments
(312) [email protected]
Gino LollioVice President Investments
(312) [email protected]
MARCUS & MILLICHAP | DOWNTOWN CHICAGO | 333 West Wacker Drive | Suite 200 Chicago, IL 60606
For more information please visit us at: www.healthcarerealestate.com
Target Acquirer Year Price AcquirerSectorHealthCarePartners,LLC DaVita 2012 $4,220,000,000 Laboratories,MRI&DialysisSheridanHealthcare AmSurgCorp. 2014 $2,350,000,000 OtherServicesUSOncology Welsh,Carson,Anderson&Stowe 2004 $1,700,000,000 PrivateEquityIPCHealthcareInc. TeamHealthHoldings,Inc. 2015 $1,600,000,000 PhysicianMedicalGroupsTeamHealth,Inc. TheBlackstoneGroup 2005 $1,000,623,000 PrivateequitySoundPhysicians,Inc. FreseniusMedicalCareAG&Co.KGaA 2014 $600,000,000 Laboratories,MRIandDialysisVirtualRadiologicCorporation MEDNAX,Inc. 2015 $500,000,000 PhysicianMedicalGroupsContinucare,Inc. MetropolitanHealthNetworks,Inc. 2011 $416,000,000 PhysicianMedicalGroupsNorthwesternMedicalFacultyFoundationNorthwesternMemorialHealthCare 2013 $388,880,000 HospitalTheEverettClinic DaVitaHealthcarePartnersInc. 2015 $385,000,000 PhysicianMedicalGroups
10LARGESTPHYSICIANMEDICALGROUPTRANSACTIONS,2000-2015
The publicly traded companies continued to dominate the buy side, with 48 transactions. Hospitals made 19 acquisitions, and one long-term care company, Kindred Healthcare, bought a primary care practice that makes house calls. Specialty physician practices were the dominant targets, particularly in anesthesiology, radiol-ogy and dermatology.
Team Health’s $1.6 billion takeover of IPC Healthcare came as a surprise in August, but was immediately

Health Care M&A in the 21st Century | Second Edition | 2016
26 www.healthcaremanda.com
hailed as a highly strategic combination of outsourced emergency room and hospitalist services that positions Team Health to capitalize on the migration to value-based payments. At the time of the announcement, IPC had approximately 2,000 providers serving approxi-mately 2,370 facilities in 28 states.
The point-of-care mix is 74% acute care and 26% post-acute. The price-per-physician worked out to $788,177. while the price-to-revenue was 2.3x, and the price-to-EBITDA was approximately 22.4x.
MEDNAX, Inc. scored big with its $500 million ac-quisition of Virtual Radiologic Corporation (vRad), a leading radiology physician services and telemedicine company. VRAD has a network of more than 350 U.S. board-certified and eligible radiologists, of whom more than 75% are sub-specialty trained. With only 350 radiologists, the price-per-head was a whopping $1.4 million, while the price-to-revenue was 2.7x and price-to-EBITDA was 20.0x.
The deal marks MEDNAX’s first acquisition in the radiol-ogy and telemedicine area. The company was founded as a practice management company in the areas of pediatric and maternal-fetal medicine in 1979. In the early 21st century its management carefully branched out into anesthesiology practices, which became a full line of business soon after.
MEDNAX also added MedData in August 2014 for an undisclosed price. The company provides revenue cycle management services, including professional and facility coding, billing and collections, as well as an early outpatient pay solution to emergency depart-ment, hospitalist and other physician specialty groups. In May 2016, MedData made its own acquisition of Duet Health, which creates multi-platform software solutions that help doctors educate, monitor and influ-ence patient behavior while enabling patients to take a more active role in their care. This bolt-on deal extends MEDNAX's services into hospitals' and providers' back offices, bolstering its presence with eligibility and enroll-ment, third-party liability, and patient reimbursement solutions.
Other publicly traded practice management companies made aggressive deals in 2015. One of the most strik-ing in the industry was DaVita Healthcare Partners, which began operating dialysis and kidney care clinics and centers, and then acquired HealthCare Partners, LLC in May 2012 for $4.2 billion. At the time, Health-Care Partners operated medical groups (700 physi-cians) and physician networks (1,800 physicians).
As close as that deal was to the end of the Great Reces-sion, the price-per-physician averaged $1.68 million. Price-to-revenue was 1.8x; price-to-EBITDA was 8.4x.
DaVita's 2015 acquisition on the PMG side was much more modest on scale. In September 2015, the com-pany agreed to pay $385 million in cash for The Everett Clinic in Everett, Washington. The 500-physician group operated 20 care sites north of Seattle, who cared for more than 300,000 patients in 2014. As a privately held company, financial details weren’t disclosed, but the primary and specialty care physicians cost DaVita approximately $770,000 per head. A better deal finan-cially, perhaps.
In August 2015, as Team Health was beginning its merger with IPC Healthcare, AmSurg Corporation, par-ent company to Sheridan Healthcare, made a surprise bid for Team Health. The offers, which ended at $5 billion in October 2015 were each rebuffed by Team Health, to the chagrin of many Team Health sharehold-ers. AmSurg withdrew its offer on November 2, and began looking for another partner.
In June 2016, the company announced its merger with Envision Health Holdings, valued at approximately $6.7 billion. AmSurg's origins were in ambulatory sur-gery centers and the anesthesiologists that worked there. Envision Health Holdings provides physician-led outsourced medical services to consumers, hospitals, healthcare systems, health plans and government en-tities. The merger brings together two complementary companies to form one of the nation's largest provider organizations and will be named Envision Healthcare Corporation. Don't be surprised if Envision's medical transport company finds a new owner.

HealthCareMandA 27
21stCENTURY
Health Care M&Ain the
Monte Nido Holdings, LLC sale of equity to Levine
Leichtman Capital Partners
Molina Healthcare acquisition of segment of Providence Service
Corporation
Medfocus Radiology Network sale to One Call Care
Management
Marina Del Rey Hospital sale to Cedars-Sinai
Health System
Blue Wolf Capital Partners
acquisition of National Home Health Care Corp.
HealthLoop, Inc. preferred equity financing
AMN Healthcare acquisition of The First String Healthcare, Inc.
Signet Healthcare Partners
follow-on offering of Pfenex Inc.
Fosun Pharmaceutical Development Co., Ltd. investment in Sovereign Medical Services, Inc.
Excel Anesthesia sale to
US Anesthesia Partners
Scottsdale Emergency Associates, Ltd.
acquisition by EmCare/Envision Healthcare
South Denver Anesthesiologists, P.C.
partnership with U.S. Anesthesia Partners
Fosun Industrial Co., Ltd.
investment in Amerigen Pharmaceuticals Ltd.
ProHealth Physicians reverse triangular merger
with Collaborative Care Holdings
(subsidiary of Optum)
“Not all healthcare lawyers are the same”Many people believe that healthcare lawyers are pretty much the same. We don’t. We believe that what separates us from the pack is that we do tomorrow’s deals today. Clients who want to innovate contact us – for population health management, global risk, vertical integration, strategic alliances and game-changing transactions.
Forward-looking not one size fits all, problem solvers not just legal practitioners. Our clients clearly understand and value this difference. How can we help you?
www.sheppardmullin.com | www.sheppardhealthlaw.com
Contact Eric Klein, Healthcare Practice Group Leader, at 310-228-3728 or [email protected]
Recent Representative Healthcare Transactions
Greater Colorado Anesthesia
partnership with US Anesthesia Partners
Omnicare Medical Group, Inc.
sale to AltaMed Independent Physician
Network, Inc.
March Holdings Inc. and March Vision Care
acquisition by UnitedHealth Group
Molina Healthcare acquisition of certain
assets of MyCare Chicago
Emergency Physicians Medical Groupacquisition by
EmCare/Envision Healthcare
Advanced Medical Reviews Inc.
sale to ExamWorks

Health Care M&A in the 21st Century | Second Edition | 2016
28 www.healthcaremanda.com
The rehabilitation market is the smallest of all the healthcare sectors. It usually has the fewest number of transactions in most years (which remains true in 2015, despite a 58% increase in deals from 19 in 2014 to a record 31) as well as the lowest dollar amount spent on those deals. It is very similar in size to the behavioral health M&A market. But while the behavioral health market will grow because of changing attitudes regard-ing care and various illnesses, not to mention looser reimbursement policies, the rehabilitation market will grow with the aging population that will need more repairs to and replacements of hips, knees and other body parts that did not occur 50 years ago, let alone 25 years ago, at the volume that we are seeing today.
The rehabilitation market, as we define it, includes inpa-tient rehab hospitals, outpatient rehab clinics, physical therapy practices and orthopedic companies, among others. The market for providing such care, however, is changing and will continue to evolve as payment meth-odologies change and as payers continue to look for the lowest-cost producer, as long as quality of care is not compromised. As an example, licensed skilled nursing facilities have been encroaching on the care provided
at inpatient rehab hospitals, something the latter group has not been happy with for obvious reasons. In some cases they are competing very strongly and with a much lower price point. This is getting the attention of man-aged care companies as well as Medicare and Medi-care Advantage providers who are constantly looking for ways to control costs. As long as the outcomes are no different (or better), they will direct patients to the qualified skilled nursing facilities until there is pricing equilibrium with the inpatient rehab hospitals. But for our purposes, these specialized skilled nursing facilities are still classified in the long-term care sector because of their license and who the buyers typically are.
As an example of these changes in the market, one has to look no further than to Kindred Healthcare. Un-til recently, it was considered to be a hybrid company of skilled nursing facilities and long-term acute care hospitals (LTACs). In fact, it was one of the largest operators of skilled nursing facilities in the country. No longer. Today, it is one of the few true “post-acute care” companies in the country of any scale. Not only is it one of the largest operators of LTACs (having just added in 2016 a portfolio of five LTACs from Select Medical),
The rehabilitation market consists of inpatient rehab hospitals, outpatient clinics, physical therapy practices, orthopedic companies and occupational care providers, among others. There is just as wide a variety of buyers for this diverse group of businesses. The market, however, is somewhat limited with prices often not revealed.
Rehabilitation
$-
$200
$400
$600
$800
$1,000
$1,200
$1,400
$1,600
0
5
10
15
20
25
30
35
2000 2001 2002 2003 2004 2005 2006 2007 2008 2009 2010 2011 2012 2013 2014 2015
DollarVo
lume(inm
illions)
Transactions
RehabilitationTransactionsandDollarVolume,2000-2015
NumberofTransactions TotalDollarAmount

HealthCareMandA 29
21stCENTURY
Health Care M&Ain the
Granite Investment Group aggressively pursues acquisition opportunities. We seek skilled nursing, assisted living and multi-care facilities located in primary and secondary markets within states that have favorable regulatory and strong reimbursement environments.
Contact us with an opportunity today.
Let it be YOURS!
Granite is searching for its next acquisition …
For more information, visit GraniteInvestment.com, or call 949.477.5800.
syndicator of senior housing real estate

Health Care M&A in the 21st Century | Second Edition | 2016
30 www.healthcaremanda.com
but is also one of the largest inpatient rehab hospital operators, helped by the 2014 acquisition of Centerre Healthcare for $195 million (ranked in the top 10 of rehab acquisitions in the past 15 years). Kindred also purchased RehabCare Group in 2011 for $1.3 billion, which was the largest transaction in the past 16 years and one that included physical therapy clinics and in-patient hospitals. And Kindred is also now one of the largest providers of home health and hospice care in the country, having added 11 more agencies (in three deals) to its portfolio in 2016 alone.
Two of the century's top 10 rehab deals involved a REIT purchasing the real estate assets of various providers. One was the largest private sector chain of rehab clinics in Germany for $880 million, while the other was eight inpatient rehab hospitals (plus eight LTACs) for $400 million, or $660,000 per bed. With their low cost of capi-tal and aggressive buying, we can expect to see more REITs purchasing rehab assets in the coming years.
After peaking in 2008 with 27 announced rehab deals, but with very few prices disclosed, market activ-ity dropped by more than 50% the following year and has gained momentum ever since, at least in terms of transaction volume. The dollar volume is skewed by the few large deals over the years, just four valued at $400 million or more in 16 years. Highlighting that, the highest recorded dollar volume in a year (with $1.34 billion spent in 2011) was 97% comprised of one deal, Kindred’s $1.3 billion acquisition of RehabCare Group. The strongest year, when combining dollar volume and
number of transactions, was 2014, which reported 19 transactions and nearly $1.25 billion in dollars spent. That year was more diversified in its spending too, with the two largest deals making up just 86% of the year’s dollar volume. Then, 30 deals were announced in 2015, eclipsing the previous record set in 2008 with 27 deals. Not only that, but nearly $800 million was allocated to rehab deals in 2015, the third-highest spend since 2000. It appears we have entered a new period in rehab M&A activity. The shift toward bundled payments, led by the CMS, had a strong effect on this fragmented market, with private equity firms building platforms, and at least one REIT picking up a few facilities.
The largest deal by far recorded in 2015 (which hap-pens to be the third-largest since 2000) involved rehab giant HealthSouth Corporation acquiring Reliant Hospi-tal Partners, LLC for $730 million. A portfolio company of Nautic Partners, Reliant operates 11 inpatient rehab hospitals in Texas, Massachusetts and Ohio, plus three inpatient satellite locations in Massachusetts, for a to-tal of 902 beds. The deal featured a price of $809,300 per bed, as well as revenue and EBITDA multiples of 2.93x and 8.90x, respectively.
The rehab M&A market may continue to strengthen as buyers with cheap capital costs look for acquisitions that will be part of the solution for controlling health care costs. Providers will look to provide the full con-tinuum of post-acute care and become a preferred provider for Accountable Care Organizations, if they stand the test of time and future challenges.
Target Acquirer Year Price AcquirerSectorRehabCareGroup,Inc. KindredHealthcareServices,Inc. 2011 $1,300,000,000 Long-TermCareMedianKlinikenGmbH&Co. MedicalPropertiesTrustandWaterlandPE 2014 $880,000,000 REITReliantHospitalPartners,LLC HealthSouthCorporation 2015 $730,000,000 RehabilitationErnestHealth,Inc. MedicalPropertiesTrust,Inc. 2012 $400,000,000 REITPhysiotherapyAssociates CourtSquarePartners 2012 $330,000,000 PEGOutpatientrehabilitationdivision SelectMedicalCorporation 2007 $245,000,000 HospitalKesslerRehabilitationCorp. SelectMedicalCorporation 2003 $230,000,000 HospitalCenterreHealthcare KindredHealthcare,Inc. 2014 $195,000,000 Long-TermCareAcceleratedCarePlus HangerOrthopedicGroup 2010 $155,000,000 RehabilitationSixspecialtyhospitals HighmarkHealthcare,LLC 2004 $150,000,000 Rehabilitation
10LARGESTREHABILITATIONTRANSACTIONS,2000-2015

HealthCareMandA 31
21stCENTURY
Health Care M&Ain the
Over the years, we have combined into "other services" all those acquisitions that do not fit into the other services categories. Some of the more active sub-sectors include contract research organizations (the most active in 2014), institutional pharmacy companies and pharmacy benefits managers, urgent care clinics and dental practices. Among these sub-sectors are some of the largest transactions in all the health care services.
Other Services
020406080
100120140160180200
2000 2001 2002 2003 2004 2005 2006 2007 2008 2009 2010 2011 2012 2013 2014 2015$-
$5
$10
$15
$20
$25
$30
$35
$40
$45
DollarVo
lume(inbillions)
"OtherServices"TransactionsandDollarVolume,2000-2015
NumberofTransactions TotalDollarAmount
For those businesses in the health care services indus-try that do not fit into the traditional sectors, such as hospitals, long-term care or physician medical groups, we have placed into their own all-encompassing cat-egory, called “Other Services.” These include contract research organizations (CROs), pharmacy benefit man-agers (PBMs), institutional pharmacy companies, urgent care centers, dental and dermatology practices, ambu-latory surgery centers, and air ambulance businesses, among others. At times, one of the sub-sectors will post a higher number of transactions than some of the other main sectors that we cover, as happened in 2013 with CROs. But that deal volume is not very consistent, so we don’t separate them out.
Consistently over the past 16 years, we have tracked more than 100 transactions every year in the Other Services sector, except for the three years following the Great Recession. Also, in eight of the previous 16 years, acquirers spent more than $10.0 billion in announced transactions in the Other Services sector, with 2006 and 2011 reaching $30.9 billion and $40.7 billion, re-
spectively. And those two years were dominated by two of the three largest ever recorded health care services deals since 2000, both involving PBMs.
The first transaction, by date, was CVS’ acquisition of Caremark Rx for $26.5 billion. Announced in late 2006, the deal was billed as a “merger of equals,” and the stock-for-stock merger came with no stock premium. The basic pitch was that CVS could use Caremark’s skills to lower the cost of prescription drugs, while Caremark gained a national chain to provide PBM products and services. The deal multiples ended up at 0.76x revenues and 15.6x EBITDA. The initial transaction value was $21.0 billion, but another major competitor, Express Scripts, launched a hostile counter-offer worth about $25.0 billion, which drove up the final price.
Five years later, it was Express Scripts that announced the largest-ever transaction in the Other Services sec-tor, with the acquisition of its competitor, Medco Health Solutions, in July 2011 for $29.1 billion in cash and stock. Medco provided pharmacy benefit management,

Health Care M&A in the 21st Century | Second Edition | 2016
32 www.healthcaremanda.com
Target Acquirer Year Price AcquirerSectorMedcoHealthSolutions,Inc. ExpressScripts,Inc. 2011 $29,100,000,000 PBMCaremarkRx,Inc. CVSCorporation 2006 $26,500,000,000 DrugStoreCatamaranCorporation OptumRx 2015 $12,800,000,000 ManagedCareOmnicareInc. CVSHealthCorporation 2015 $12,700,000,000 OtherCelesioAG McKessonCorporation 2013 $8,420,000,000 OtherAdvancePCS CaremarkRx,Inc. 2003 $6,000,000,000 OtherNextRx ExpressScripts,Inc. 2009 $4,675,000,000 PBMCatalystHealthSolutions,Inc. SXCHealthSolutionsCorp. 2012 $4,400,000,000 OtherLifeTimeFitness,Inc. Privateequityinvestors 2015 $4,000,000,000 PrivateEquityPharmaceuticalProductDevelop. TheCarlyleGroup 2011 $3,900,000,000 PrivateEquity
10LARGEST"OTHERSERVICES"TRANSACTIONS,2000-2015
specialty pharmacy and allied services to 65 million members. The transaction came with a value of 0.44x revenues and 9.7x EBITDA. The acquisition also created one of the two largest PBMs in the country.
Then came 2015, which was a breakthrough year in the sector in which we saw the highest number of transac-tions, dollars spent on deals and three of the highest value acquisitions. There were 178 publicly announced transactions in 2015, up 23% from the previous record set in 2002 of 145 transactions, and 31% higher than 2014’s total of 136 transactions. Dollar volume also edged the previous record set in 2011, with $42.8 billion spent compared with $40.7 billion. Plus, 2015 featured three of the top-10 transactions (by dollars spent) since 2000, taking spots three, four and nine.
In the third-largest deal of the century, so far, OptumRx acquired Catamaran Corporation, the nation’s fourth-largest provider of pharmacy benefit management ser-vices and healthcare information technology solutions, for $12.8 billion, or $61.50 per share. The deal left No. 1 pharmacy benefits provider Express Scripts Holdings as the last holdout in the field. Then, 2015 also saw the fourth-largest deal, with CVS Health Corporation acquiring Omnicare Inc. for $12.7 billion, including $2.3 billion in debt. Omnicare’s big draw is its specialty pharmaceutical business (which has been growing con-siderably as a sub-sector following the Great Recession) focused on assisted living and long-term care facilities. The size of these transactions shows how dynamic the
behind-the-scenes portion of the healthcare industry can be. But, in addition to these mega deals, we have also seen a steady increase in deal volume since the Great Recession, reaching and then surpassing pre-Recession levels of activity. In recent years, activity in a few sub-sectors has been particularly prolific. Specialty physician practices, including dental and dermatology practices, have seen a spike in deal volume in recent years, with 15 transactions announced in each category from 2015 to the first half of 2016 alone.
Reflective of the growth in the dental subsector, in 1995, we recorded just two dental practice acquisi-tions, but this increased to 19 in 1996 and 75 in 1997. Nearly 15 dental practice management companies went public in the late 1990s, but the market soon became saturated and then began to deteriorate with the col-lapse of the larger physician practice management market. Today, one attractive quality of this subsector (and dermatology) is its lack of reliance on the federal government for revenue. CMS programs have accounted for about 36% of all U.S. health expenditures since 2010, but only about 10% of dental expenditures. The remainder of those expenditures are funded through out-of-pocket payments or private insurance. In addition to reliable revenue sources, PE firms tend to gravitate towards healthcare sectors that have steady or growing demand, as well as little health risk, like revenue cycle management firms, imaging centers and physical/oc-cupational therapy.

HealthCareMandA 33
21stCENTURY
Health Care M&Ain the
Speaking of private equity, those firms have not been shy about making significant bets across most areas of health care, and some of their largest targets have been in this ancillary services sector. One example is The Car-lyle Group, which made a $6.3 billion acquisition in the long-term care sector in late 2010, while simultaneously buying NBTY, Inc. for $3.8 billion. NBTY manufactures, markets and distributes nutritional supplements, food products and personal care products. The deal came at a 47% premium to the previous day’s share price and an 8.26x EBITDA multiple. A little over a year later, Carlyle bought a very different type of company in Pharmaceu-tical Product Development (PPD) for $3.9 billion. PPD was a CRO providing drug discovery, development and lifecycle management services.
CROs, after heating up in 2013 and 2014 with 12 and 19 deals, respectively, took a bit of a breather in 2015 with just five announced deals. But the sector has come roaring back with six deals announced in the first half of 2016, driven by global pharmaceutical companies building their drug discovery platforms.
By far, acquisitions involving outpatient care centers outnumbered all other categories in 2015, totaling 41 deals, or 23% of all transactions in the sector. To put it in perspective, the next most active subsectors were CMO/CRO and Specialty pharmacy, each reporting an active 14 transactions in 2014. Buyers have been interested in opportunities that can take advantage of the trend to cost management as well as high quality of care to help them align with ACOs.
Specialty and institutional pharmacy acquisition have been relatively consistent, although not as active as the late 1990s. This market peaked in 1997 with 61 trans-actions, which following the second most active year with 47 deals (1996). The late 1990s was a transition period for health care services, fueled by an active Wall Street community that found many willing buyers for the shares of fast-growing companies that chose to go pub-lic. Most of them merged with other competitors or went out of business, but a few large ones, like Omnicare, are still active. Today, the institutional pharmacy market averages about 10 to 12 announced transactions a year.

Health Care M&A in the 21st Century | Second Edition | 2016
34 www.healthcaremanda.com
The biotechnology merger and acquisition market has rolled with the economic cycles, as can be seen in the chart above. After the Great Recession, transaction volume, both in terms of number of acquisitions as well as the dollar volume of those acquisitions, dropped significantly and bottomed out in the 2011 to 2013 period. There has been, however, a dramatic increase in the dollars invested since then, with 2015’s num-ber ($48.5 billion) coming in at its highest level since 2010. The sharp increase in 2015 was propelled by six transactions priced over $1.0 billion each, one of which was $21.0 billion.
In addition to the capital committed to acquisitions, the number of actual transactions has been soaring as well. With 159 announced acquisitions in 2015, the activity was the highest since 2009 and the second highest in the past 16 years. That represents a huge increase from the 75 to 110 deals in each of the years from 2011 to 2013, and a smaller increase of 17% from the 136 transactions in 2014. By far the largest acquisition of the year was Abbvie’s purchase of Pharmacyclics for
$21.0 billion, representing 43% of the dollars spent in the biotechnology market in 2015. Pharmacyclics’ only product on the market is Imbruvica (ibrutinib), a highly effective treatment for Hematologic malignancies. It is also in more than 50 ongoing studies to evaluate the drug as a treatment for a wide range of additional appli-cations. The acquisition broadens AbbVie’s pipeline and establishes it in the hematological oncology market, but several analysts at the time believed that AbbVie overpaid for the company.
Pharmaceutical companies tend to be the purchasers of large biotech companies, but for the smaller deals they represent a smaller percentage of the buyers. In 2015, 37% of the acquirers in biotech acquisitions were pharmaceutical companies, while other biotech firms were the buyers in 58% of the transactions. There was a mix of buyers for the remaining 5%, including two medical device companies.
And while there were six billion-dollar-plus transactions in 2015, there were also 12 deals that came with values
BiotechnologyThe biotechnology M&A market continued its rise from a low point in 2013 when both number of transactions as well as dollars spent were close to their a near-term lows The bounce back was led by six transactions topping the billion dollar mark.
$-$10$20$30$40$50$60$70$80$90$100
0
50
100
150
200
250
2000 2001 2002 2003 2004 2005 2006 2007 2008 2009 2010 2011 2012 2013 2014 2015
DollarVo
lume(inbillions)
Transactions
BiotechnologyTransactionsandDollarVolume,2000-2015
NumberofTransactions TotalDollarAmount

HealthCareMandA 35
21stCENTURY
Health Care M&Ain the
between $300 million and $1.0 billion. These 18 acqui-sitions combined represented just over 78% of the dol-lars invested in the biotechnology acquisition market.
Pharmaceutical companies have been criticized for claiming to invest billions of dollars in drug development pipelines while buying smaller competitors or drug de-velopment companies, such as biotech companies. The reality is that they do both, but as everyone knows, drug development is extremely expensive and time consum-ing. So it makes sense for the large pharmaceutical companies to diversify with acquisitions of companies or pipelines that are already in the development stage.
Another notable acquisition of a biotechnology com-pany by a large pharmaceutical company was Shire plc’s purchase of Dyax Corp. for $5.9 billion, which was an-nounced in late 2015.Dyax develops plasma kallikrein inhibitors for the treatment of hereditary angioedema (HEA), a rare genetic disease. Its lead product is a Phase-3 ready asset offering potential transformative prophylactic therapy for HEA. It has received Fast Track, Breakthrough Therapy and Orphan Drug designations by the FDA, and has achieved Orphan Drug status in the European Union.
Earlier in 2015, Shire acquired NPS Pharmaceuticals, a global biopharmaceutical company focused on rare diseases, for $5.2 billion. NPS specializes in drugs for
Target Acquirer Year Price AcquirerSectorGenentech(remainingint.) RocheHoldingAG 2008 $46,800,000,000 PharmaceuticalsPharmacylicsInc. AbbVieInc. 2015 $21,000,000,000 PharmaceuticalsGenzymeCorp. Sanofi-AventisSA 2010 $20,100,000,000 PharmaceuticalsMedImmune AstraZenecaplc 2007 $15,200,000,000 PharmaceuticalsLifeTechnologiesCorp. ThermoFisherScientific 2013 $15,100,000,000 BiotechnologySeronoSA Merck&Co. 2006 $13,310,000,000 PharmaceuticalsImmunex Amgen 2001 $11,100,000,000 BiotechnologyPharmasset GileadSciences 2011 $11,000,000,000 PharmaceuticalsMillenniumPharmaceuticals TakedaPharmaceuticalCo. 2008 $8,800,000,000 PharmaceuticalsElanCorporationplc PerrigoCompanyplc 2013 $8,600,000,000 Pharmaceuticals
10LARGESTBIOTECHNOLOGYTRANSACTIONS,2000-2015
gastrointestinal disorders and has just one product on the market in the United State and Europe, and reported $57 million in revenue during its most recent quarter before the deal was announced. Its second product is under review in the United States and Europe. Both drugs are intended not to cure patients, but to improve the quality of their lives.
This strategic fit strengthens Shire’s focus on rare dis-eases while leveraging its GI commercial capabilities and global footprint. This acquisition as well as the deal for Dyax Corp. help make up for Shire’s misstep when it agreed to be acquired by Abbvie in 2014 in a $54 billion transaction that Abbvie subsequently terminated after new rules on corporate inversions were released by the U.S. Treasury Department. At least Shire walked away with a $1.6 billion check from Abbvie, which has been put to good use in subsequent acquisitions.
Other notable transactions in 2015 included Teva Phar-maceuticals’ purchase of Auspex Pharmaceuticals for $3.2 billion and Mallinckrodt’s acquisition of Therakos for $1.325 billion. Auspex specializes in applying deu-terium chemistry to known molecules to create novel therapies to treat disorders of the central nervous sys-tem, and it has 60 molecules in its portfolio. Therakos was a portfolio company of The Gores Group and is an immunotherapy company.

Health Care M&A in the 21st Century | Second Edition | 2016
36 www.healthcaremanda.com
The eHealth sector is very different from the other sec-tors of health care that we cover. There is no “care” provided (at least for now) and there is little to no federal reimbursement for the services provided. This sector is filled with startups attempting to tackle new challenges such as value-based and bundled payments, as well as private equity firms hoping to build the next big plat-form. Revenue cycle management, electronic health records and data analytics, which used to be separate segments, are now being packaged as single solutions for healthcare providers of all sizes.
The original eHealth companies got their start in the late 1990s with the dot-com bubble. There were more than 30 eHealth companies that went public, most with no revenues to speak of, and few with any chance of making the returns that investors were looking for. Names like drkoop.com, drugstore.com, MotherNature.com and PlanetRx.com shared more than the dot-com suffix. They all made no money and all either went out of business or merged with another company and changed their business plan.
They all got caught up in the dot-com bubble, which
burst shortly after 2000, but the bigger problem was that they were 10 to 15 years ahead of their time in two ways. First, the technology really wasn’t good enough at the time to do what people thought it could do, or at least at a price point that would work for the consumer. Second, the consumer was not ready for a lot of the in-novations that were being thrown at the market. There were many visionaries at the time, but acceptability in the market was not prevalent. It was all a question of timing.
Acquisitions in the eHealth market are typically small and do not disclose prices. Since 2014, however, more strategics are moving in, picking off companies with siz-able healthcare databases. Two transactions in 2014 topped $1 billion, and another two were made public in 2015. In the first half of 2016, two billion-dollar-plus deals have already been announced, signaling that consolidation has begun.
The first big deal in 2014 was Cognizant Technology Solutions’ purchase of TriZetto Corporation, which was one of the early pioneers and survived the burst of the dot-com bubble early in the century. Apax Partners LP
The peak of the eHealth market occurred around the turn of the century, when there were more than 30 ehealth IPOs until the dot-com bubble burst. The market went quiet for most of the first decade, but has roared back to life in the past two years. Thanks to growing demand for revenue cycle management and other cost-monitoring software,
this sector isn't showing signs of slowing in the first half of 2016.
eHealth
$-
$2
$4
$6
$8
$10
$12
$14
0
20
40
60
80
100
120
140
2000 2001 2002 2003 2004 2005 2006 2007 2008 2009 2010 2011 2012 2013 2014 2015
DollarVo
lume(inbillions)
Transactions
eHealthTransactionsandDollarVolume,2000-2015
NumberofTransactions TotalDollarAmount

HealthCareMandA 37
21stCENTURY
Health Care M&Ain the
Popular Community Bank has a dedicated national team of relationship managers who specialize in working with healthcare organizations. With years of experience in the healthcare industry, we have extensive expertise in the following areas:1
• Leasehold Improvement • Permanent Financing Financing • Acquisition Financing• Bridge Financing • Lines of Credit
To learn more, please contact our Director of Healthcare Financing, Kenneth Mitchell, at 212-417-6840 or [email protected].
Popular Healthcare Division For those who know the value of seeing a specialist.
1. All fi nancing is subject to credit approval. ©2016 Banco Popular North America. Member FDIC. All rights reserved.
$30,750,000
Mortgage Loan Skilled Nursing Facilities
Texas/Oklahoma
$15,000,000
Mortgage LoanSkilled Nursing Facility
New York
acquired TriZetto in 2008 for $1.4 billion, and sold it to Cognizant six years later for $2.7 billion. Cognizant's primary business is consulting, IT and business pro-cessing. TriZetto joined Cognizant's existing healthcare business unit, which represented about 26% of Cogni-zant's revenue. At the time of the acquisition, Cognizant expected to realize about $1.5 billion of revenue syner-gies through 2019.
Another 2014 mega-deal in this sector was made by the EHR giant, Cerner Corporation. The company paid $1.3 billion to acquire Siemens AG's healthcare IT business unit, Siemens Health Services. The sale was part of a plan by Siemens to divest all non-core businesses. In November 2014, Siemens sold its audiology division to the Swedish private investment firm, EQT VI, for ap-proximately $2.7 billion.
Strategic buyers aren't the only ones making these billion-dollar acquisitions, however. Pamplona Capital Management took the publicly traded MedAssets Inc. private in November 2015, with an announced price of
$2.7 billion. MedAssets provides technology-enabled products and services for hospitals, health systems, non-acute healthcare providers, payers and other ser-vice providers. At the time of the acquisition, it served four out of every five hospitals in the United States.
Pamplona immediately divested MedAssets' Spend and Clinical Resource Management segment to Vi-zient, Inc. (formerly known as VHA-UHC Alliance) for an undisclosed price. That acquisition makes Vizient one of the top global leaders in health care supply chain procurement, market intelligence, strategic analytics and comprehensive consulting services. Pamplona retained MedAssets' revenue cycle management seg-ment and combined it with another one of its portfolio companies, Precyse, which provides health information management services. The combined enterprise will offer end-to-end RCM and HIM solutions.
The second billion-dollar deal in 2015 involved IBM and its new Watson Health Cloud unit. The IT company publicly announced the division's launch in April of that

Health Care M&A in the 21st Century | Second Edition | 2016
38 www.healthcaremanda.com
In the first half of 2016, spending in this eHealth sec-tor has surged past the $5.9 billion spent in 2015, to $18.6 billion. The majority of that total went to a single transaction, as the global contract research organiza-tion Quintiles paid $12.8 billion to acquire IMS Health Incorporated.
That deal will certainly top next year's "10 Largest" list, and may be followed by a few other 2016 deals. Ironically, it will displace an earlier transaction involving then-publicly traded IMS Health, as the sector's largest deal in the 21st century. That deal offered IMS share-holders a premium of nearly 50% to the closing price on October 16, 2009, the day before public speculation that it was considering its strategic alternatives, and resulted in 2.4x revenue for the company.
Not surprisingly, the second largest deal in the first six months of 2016 was announced by IBM, which paid $2.6 billion to acquire Truven Health Analytics, a port-folio company of Veritas Capital.
Truven provides cloud-based healthcare data, analyt-ics and insights to more than 8,500 clients, including federal and state government agencies, employers, health plans, hospitals and life sciences companies. IBM plans to integrate Truven's extensive cloud-based data set with its Watson Health Cloud, creating one of the world's largest and most diverse collections of health-related data, aggregating approximately 300 million patient lives.
Target Acquirer Year Price AcquirerSectorIMSHealthIncorporated TPGCapital 2009 $5,200,000,000 PrivateequityPerotSystemsCorporation Dell,Inc. 2009 $3,900,000,000 ITEmdeon,Inc. TheBlackstoneGroup 2011 $3,000,000,000 PrivateequityTriZettoCorporation CognizantTechnologySolutionsCorp. 2014 $2,700,000,000 ITMedAssets,Inc. PamplonaCapitalManagement 2015 $2,700,000,000 InvestmentGroupPer-SeTechnologies,Inc. McKessonCorp. 2006 $1,800,000,000 OtherExecutiveHealthResources,Inc. UnitedHealthGroup,Inc. 2010 $1,500,000,000 ManagedCareSunquestInformationSystems RoperIndustries 2012 $1,415,000,000 e-HealthTriZettoGroup,Inc. ApaxPartners,L.P. 2008 $1,400,000,000 PrivateequityEclipsysCorp. Allscripts-MisysHealthcareSolutions,Inc. 2010 $1,300,000,000 e-Health
10LARGESTeHEALTHTRANSACTIONS,2000-2015
year, together with two acquisitions that did not disclose prices. One was Heritage Group's portfolio company, Explorys, a healthcare intelligence cloud company with one of the largest clinical data sets in the world, repre-senting more than 50 million lives. It was spun off from the Cleveland Clinic in 2009. The second was Phytel, which develops and sells cloud-based services that bring together healthcare providers and care teams to help them work through new reimbursement models.
IBM's largest acquisition in 2015, with an announced price of $1 billion, was for publicly traded Merge Health-care, a leading provider of medical image handling and processing, interoperability and clinical systems designed to advance healthcare quality and efficiency. Its technology platforms are used at more than 7,500 U.S. healthcare sites.
Throughout the year, IBM was making and announcing several partnership agreements with other healthcare companies, including one with generics giant Teva Pharmaceutical Industries to be its first Foundational Life Sciences Partner for the Watson Health Cloud. In September 2015, Teva teamed up with IBM Watson Health Cloud to build solutions designed to work on complex and chronic conditions such as asthma, pain, migraine and neurodegenerative diseases. In addition, a joint Teva-IBM Research team will deploy Big Data and machine learning technology to create disease models and advanced therapeutic solutions.

HealthCareMandA 39
21stCENTURY
Health Care M&Ain the
Since 2001, the medical device M&A market has re-corded at least 100 transactions each year, peaking in 2007 with 194 deals. The market hit new heights in 2014, with more than $85.6 billion spent on just 111 acquisitions, buoyed largely by three deals, including one valued at $42.9 billion, the largest medical device deal of the century.
Still, this space has had a lot of ups and downs in recent years, beginning with the passage of the Affordable Care Act, that included a 2.3% excise tax on medical devices that took effect on January 1, 2013. Although the tax was suspended for two years beginning in De-cember 2015, it has had a strong effect on the market. Deal volume slowed considerably since 2013.
One invisible effect of the excise tax was to hamper growth or to kill off many startups, which had little to no revenue, and few investors. The consequences may become more visible in a few years, when larger com-panies are looking to fill their product pipelines with innovative products or bolt-on smaller companies, and
the pickings are much slimmer than would otherwise be the case. If that comes to pass, expect higher prices and a few bidding wars.
On a grander scale, the industry began to react to the more far-reaching impacts of the ACA, as payers put pressure on healthcare providers, challenging the cost of some medical devices and implants in an effort to lower costs. In the same vein, hospitals and health systems took away physicians' power to choose freely which brand of device to use in surgical procedures, and thus curtailing some long-standing relationships between manufacturer and surgeon.
A wave of consolidation followed in the wake of those developments. In 2014, Zimmer Holdings made a $13.35 billion offer for its cross-town rival, Biomet, owned by Goldman Sachs and a group of giant private equity firms. Both manufacturers are focused on or-thopedic devices, and regulatory approval has been slow in coming, as the Justice Department investigated accusations of foreign bribery on Biomet's part. The
Medical DevicesWhen the medical device tax was slipped into the Affordable Care Act, some people thought that would be the end of the medical device M&A market. While it did result in a slowdown for a few years, the market bounced back, with the dollar amount of acquisitions hitting a new record in 2014 because of one large transaction. But the actual number of transactions has remained relatively low for three straight years. The excise tax was repealed temporarily in December 2015, but the two-year respite doesn't seem to have sparked outside investors' interest.
$-
$10
$20
$30
$40
$50
$60
$70
$80
$90
0
50
100
150
200
250
2000 2001 2002 2003 2004 2005 2006 2007 2008 2009 2010 2011 2012 2013 2014 2015
DollarVo
lume(inbillions)
Transactions
MedicalDeviceTransactionsandDollarVolume,2000-2015
NumberofTransactions TotalDollarAmount

Health Care M&A in the 21st Century | Second Edition | 2016
40 www.healthcaremanda.com
transaction closed on June 23, 2015, and featured multiples of 4.21x revenue and 15.42x EBITDA.
The single largest acquisition ever in this space was also driven by the need to consolidate, as Medtronic announced its purchase of Covidien plc for $42.9 bil-lion in June 2014. Another factor was Medtronic's plan to re-domicile the company in Ireland, where Covidien was based, to reap the benefits of the lower corporate tax rate. Before the transaction could close, however, the U.S. Treasury Department changed the rules on the so-called tax inversions. The move slowed but didn't stymie the deal, which closed in January 2015, with Medtronic making the move to Dublin after refinancing some parts of the deal. The multiples came in at 4.15x revenue and 15.38x EBITDA.
M&A activity slumped in 2015, with just $29.3 billion al-located to 114 transactions. However, the sector seems to have come back in vogue in 2016. In the first half of the year, 54 transactions have been announced and nearly $49 billion spent. This is largely due to the tem-porary lifting of the medical device excise tax. Leading the way in the renewed growth of the sector was Abbott, which acquired eHealth company Alere Inc. for $5.8 billion in February 2016, then dropped $30.7 billion in April to purchase St. Jude Medical, Inc.
The medical device acquisitions in the first half of 2016 also signal further consolidation among the bigger play-ers in this market. In 2015, 38% of the acquirers were
privately held companies, averaging $671 million per transaction. Also, the average purchase price by public acquirers was a whopping $2.02 billion so far in 2016 (and a still-hefty $775 million if you take out Abbott’s $30.7 billion acquisition of St. Jude Medical), compared to $450 million per deal in 2015. Perhaps the medical device excise tax meant some of the big companies had a lot of fuel in the tank for those previously postponed acquisitions.
In order to compete with the new behemoths, smaller device manufacturers should consider making their own consolidations, to acquire emerging technologies to further differentiate their business lines from the large companies. This will also include some mergers among peers to strengthen their balance sheets and allow for some product diversification. But as this hap-pens, they will become likely acquisition targets for the largest companies, which need something big just to move the needle on growth a little and satisfy share-holders who want to see profitable growth.
As the population ages, need for orthopedic devices and newer surgical instruments will increase. While the real beneficiary will be the care providers, such as skilled nursing facilities, inpatient rehab hospitals, outpatient surgery centers and acute care hospitals, companies that create new surgical products for proce-dures such as knee or hip replacements that shorten a patient's recovery time would have strong appeal in the market, but only if costs can be contained.
Target Acquirer Year Price AcquirerSectorCovidienplc Medtronic 2014 $42,900,000,000 MedicalDevicesMajorityInt.inAlcon NovartisAG 2008 $39,000,000,000 PharmaceuticalsGuidantCorp. BostonScientificCorp. 2005 $27,200,000,000 MedicalDevicesSynthesGmbH Johnson&Johnson 2011 $21,300,000,000 PharmaceuticalsBiomet ZimmerHoldings 2014 $13,350,000,000 MedicalDevicesMinorityInt.inAlcon NovartisAG 2010 $12,900,000,000 PharmaceuticalsFisherScientificInternational ThermoElectronCorp. 2006 $12,800,000,000 MedicalDevicesCareFusionCorp. BectonDickinson&Co. 2014 $12,200,000,000 MedicalDevicesBiomet PEConsortium 2006 $11,400,000,000 PrivateEquityMilliporeCorp. MerckKGaA 2010 $7,200,000,000 Pharmaceuticals
10LARGESTMEDICALDEVICETRANSACTIONS,2000-2015

HealthCareMandA 41
21stCENTURY
Health Care M&Ain the
PharmaceuticalsThe pharmaceutical acquisition market is the behemouth in healthcare M&A, usually accounting for the largest dollar amount spent in any given year and often one of the most active in terms of number of announced transactions. The pharmaceutical targets usually top the largest deals of the year charts, and Big Pharma is also a major acquirer of biotechnology companies. Its top deals are among the largest across all of health care.
$-
$50
$100
$150
$200
$250
020406080
100120140160180200
2000 2001 2002 2003 2004 2005 2006 2007 2008 2009 2010 2011 2012 2013 2014 2015
DollarVo
lume(inbillions)
Transactions
PharmaceuticalTransactionsandDollarVolume,2000-2015
NumberofTransactions TotalDollarAmount
The pharmaceutical merger and acquisition market is by far the largest of all the healthcare sectors. Ever since 2001, there have been at least 100 announced transactions each year, with six years posting 150 ac-quisitions or more. In 2014, there were a record number of deals in this sector, at 188 and a record dollar value of those deals, at $213.3 billion.
The M&A action slacked off in 2015, down 10% to 169 transactions, with spending down 36%, to $137.4 billion. What seems like lackluster performance, at least for pharmaceutical M&A, actually would have set an all-time record of approximately $297.4 billion, if a single deal had closed.
Pfizer Inc. has been on the prowl for a mega-merger partner for a few years. Beginning late in 2013, the com-pany made a hostile bid for AstraZeneca plc, which was rejected as too low. By May 2014, Pfizer's bid reached $118 billion, and still AstraZeneca held out, but did not let Pfizer take a look at its books to determine where the extra value lay.
Pfizer walked away in May, prompting a six-month "cooling off" period under British takeover regulations. Rumors swirled the company would be back with a fresh perspective (and perhaps a higher bid) when that period ended in November 2014. But in the ensuing months, the U.S. Treasury Department issued tighter rules re-garding corporate tax inversions, in which a U.S.-based company takes over a foreign-domiciled competitor and moves its headquarters overseas, where the corporate tax rate is lower.
Although the rule change dampened Pfizer's desire for AstraZeneca, a few other U.S. companies such as Mylan Inc. followed through. In July 2014, Mylan announced it would acquire Abbott's specialty and generic drug business outside the United States for more than $5.5 billion. It closed the deal in October 2014 and moved its headquarters to the United Kingdom.
In November 2015, Pfizer was back in the spotlight with an even higher offer, this time for Dublin-based Allergan plc. Allergan, formerly known as Actavis plc before its

Health Care M&A in the 21st Century | Second Edition | 2016
42 www.healthcaremanda.com
Target Acquirer Year Price AcquirerSectorSmithKlineBeechamplc GlaxoWellcomeplc 2000 $74,000,000,000 PharmaceuticalsWyeth Pfizer 2009 $68,000,000,000 PharmaceuticalsAllergan Actavisplc 2014 $66,000,000,000 PharmaceuticalsAventisSA Sanofi-SynthelaboSA 2004 $65,500,000,000 PharmaceuticalsPharmaciaCorp. Pfizer 2002 $56,000,000,000 PharmaceuticalsSchering-PloughCorp. Merck&Co. 2009 $41,100,000,000 PharmaceuticalsAllerganGenerics TevaPharmaceuticalIndustriesLimited2015 $40,500,000,000 PharmaceuticalsForestLaboratories,Inc. Actavisplc 2014 $25,000,000,000 PharmaceuticalsScheringAG BayerAG 2006 $21,510,000,000 PharmaceuticalsSigma-AldrichCorporation Merck 2014 $17,000,000,000 Pharmaceuticals
10LARGESTPHARMACEUTICALTRANSACTIONS,2000-2015
white-knight acquisition of Allergan Inc. in November 2014, was struggling with a debt load of $60 billion fol-lowing that deal. Pfizer offered $160 billion, which the Dublin-based Allergan readily accepted. Once again the Treasury Department issued even tighter regulations, and the deal unraveled in April 2016.
That leaves the $74 billion acquisition of SmithKline Beecham plc by Glaxo Wellcome plc as the largest healthcare transaction on the books. It was announced on September 11, 2000.
The deal-making momentum from the fourth quarter of 2014 kept rolling into the first quarter of 2015, as Valeant Pharmaceuticals International announced its acquisition of Salix Pharmaceuticals Ltd. At a price of $15.8 billion, it was the third-largest transaction announced that year. Salix was recognized as a gas-trointestinal market leader with a portfolio of 22 total products. However, the company reported inventory issues in November 2014, which resulted in manage-ment turnover and a "for sale" sign in January 2015. In March, Endo International offered $145 per share in cash and 1.4607 shares of ENDP common stock for each Salix share. Valeant countered on with an offer of $173 per share in cash. The rest, as they say, is history.
The largest pharmaceutical deal in 2015—that was actually consummated—was Teva Pharmaceutical
Industries Limited’s acquisition of Allergan’s generic drug business in July 2015. Allergan received $33.75 billion in cash and shares of Teva, for a total purchase price of $40.5 billion. As noted above, Allergan was in need of cash to help pay down debt accrued when Actavis acquired Allergan in November 2014. At the time of this transaction, Allergan had committed to de-leveraging to below 3.5x debt-to-EBITDA by the end of the first quarter of 2016. This acquisition also ef-fectively ended Teva's pursuit of Mylan N.V., for which it made an unsolicited offer of $40 billion in April 2015.
Pfizer didn't make the largest pharmaceutical deal in 2015, but it did make the sector's second-largest. After walking away from AstraZeneca in May 2014, Pfizer went on the hunt for another target, and came up with U.S.-based Hospira, Inc. In February 2015 Pfizer offered $17 billion, which was accepted readily enough.
The deal gave Pfizer the scale it was looking for in a takeover partner. Hospira is a global provider of inject-able drugs and infusion technologies, and a global leader in biosimilars. In 2020, the global marketplace value for generic sterile injectables is estimated to be $70 billion, and about $20 billion for biosimilars. The acquisition made Pfizer and Hospira a unified team providing patients with access to one of the broadest and most diverse portfolios of difficult-to-manufacture, life-saving sterile injectable products in the industry.

HealthCareMandA 43
21stCENTURY
Health Care M&Ain the
Health Care Mergers & Acquisitions
21stCENTURY
in the
3RDEDITION
REACH THE TOP DECISION MAKERSIN SENIORS HOUSING AND HEALTHCARE!
The 3rd edition of Health Care Mergers & Acquisitions in the 21st Centurywill be distributed at more than 35 health care and seniors housing
investment conferences.
- DISTRIBUTION DATES: JULY 1, 2017 - JUNE 30, 2018 -
Bookings Must Be Made By April 29, 2017*
Call or email today to reserve your space!Contact Jeanne Aloi at [email protected] or call 203-846-6800
* Spaces are limited and available on a first come, first served basis
RESERVE YOURAD SPACE TODAY!

Health Care M&A in the 21st Century | Second Edition | 2016
44 www.healthcaremanda.com
- Investment Opportunities to Grow Your Business -SENIORS HOUSING AND HEALTH CARE M&A SINCE 1948
The SeniorCare Investor
HealthCareMandA.com
INTERACTIVEWEBINAR SERIES
The SeniorCare Investor$697/year
Get hard-to-find M&A news and exclusive analysis in this award winning 50-year-old newsletter.
Senior Care Acquisition Report 21st Edition$595/copy
Investors and executives alike rely on this 250+ page M&A report with insightful statistics and analyses.
Health Care M&A News$2,497/year
This comprehensive membership alerts you week in and week out to deals and developments in the health care M&A market (includes monthly newsletter & quarterly M&A report).
Health Care Services Acquisition Report, 22nd Ed.$595/copy
Find exclusive trend analysis on M&A in over ten health care sectors included in this 250+ page report.
HEALTH CARE M&A SECTOR REPORTS
Annual WebinarSuper Pass$747/year
Interactive content direct from the leading experts in Health Care and Senior Care M&A
HospitalAcquisition Report6th Edition - $497/copy
Home Health Care & Hospice Acquisition Report7th Edition - $497/copy
Not-For-ProfitAcquisition Report5th Edition - $497/copy
Physician Medical GroupAcquisition Report6th Edition - $497/copy
Access vital details and crucial transaction information in each specific sector. Essentials such as key market statistics, charts and graphs on acquirers, sellers, deals and more are included.
Go to www.levinassociates.com/products or call 203-846-6800 to order.To order by mail, select the products above, fill outthe billing information, and send this form to:Levin Associates268 1/2 Main AvenueNorwalk, CT 06851
Billing Information:
Charge My Card Bill Me LaterCard #:Exp: / Security Code:Name:Company:Address:City, State, Zip:[email protected] • www.levinassociates.com • 203-846-6800

DEALSEARCHONLINE.COM
GET THE INFORMATION YOU NEEDWHEN YOU NEED IT!
visit dealsearchonline.com to activate your account today
Irving Levin Associates, Inc. • 203-846-6800 • 268 ½ Main Avenue, Norwalk, CT 06851
TRY OUR POWERFUL SEARCH CAPABILITIESZero in on the transactions you need quickly and easily. Search specifics such as
price, revenue, target, acquirer, date, and much more.
PAY NOTHING TO SEARCHUnlimited free searches and only pay for what you want. Don’t forget that
paid members of HealthCareMandA.com and The SeniorCare Investor getstandard user access to the database.
24/7 DATABASE ACCESSDealSearchOnline.com is THE source for reliable healthcare and seniors housing
M&A data when you need it. No appointment needed.
OVER 2,000 NEW DEALS ADDED IN 2015!
Behavioral Health CareBiopharmaceuticals
Biotechnologye-Health
Health Care Services
Home Health CareHospitals
Laboratories, MRI & DialysisLong Term CareManaged Care
Medical DevicesPharmaceuticals
Physician Medical GroupsRehabilitation... and more!
The most up-to-date health care and seniors housing M&A databasewith over 22,000 deals in these key sectors:

268½ Main Avenue, Norwalk, CT 06851Phone: 203-846-6800
Fax: 203-846-8300 Email: [email protected]
www.levinassociates.com
HealthCareMandA.com is a comprehensive data source that is devoted to health care mergers and acquisitions for the serious analyst and investor. Every day, this service alerts
you to developments in every key segment ofthe health care service and technology markets, including:
Behavioral Health CareBiotechnology
eHealthHome Health & Hospice
HospitalsLaboratories
Long-Term CareManaged Care
Medical DevicesPharmaceuticals
Physician Medical GroupsRehabilitation
and More!You won’t find more comprehensive information
anywhere else.