01 chandigarh final.qxd:layout 1cdn.cseindia.org/attachments/...chandigarh_report.pdf · chandigarh...
TRANSCRIPT
Centre for Science and Environment41, Tughlakabad Institutional Area, New Delhi 110 062 Ph: 91-11-2995 6110 / 5124 / 6394 / 6399 Fax: 91-11-29955879 E-mail: [email protected] Website: www.cseindia.org
CAPTURING RAINWATERA way to augment Chandigarh’s water resources
Centre for Science and Environment
01 Chandigarh COVER Final.qxd:Layout 1 6/22/10 2:25 PM Page 2

Centre for Science and Environment
CAPTURING RAINWATERA way to augment Chandigarh’s water resources
01 Chandigarh Final.qxd:Layout 1 6/22/10 2:10 PM Page 1

Prepared byWater Management TeamCentre of Excellence, Sustainable Water Management
June 2010, Centre for Science and Environment
Centre for Science and Environment41, Tughlakabad Institutional Area, New Delhi-110062Phones: 91-11-29955124, 2995125Fax: 91-11-29955879Email: [email protected]: www.cseindia.org
01 Chandigarh Final.qxd:Layout 1 6/22/10 2:10 PM Page 2

Contents
0. Executive summary 5
1. Chandigarh: the city 91.1 Background and history 9
2. Chandigarh: Water profile 112.1 Water supply 11
2.1.1 Canal water supply 112.1.2 Groundwater supply 12
2.2 Water consumption 122.2.1 Per capita supply 122.2.2 Total water demand and supply – 2009 132.2.3 Measures to address the demand-supply gap 142.2.4 Measures that have been already initiated by the Chandigarh administration 14
2.3 Water tariff 152.4 Cost of production 152.5 JNNURM projects 15
3. Rainwater harvesting: proposal to augment water resources 163.1 Why rainwater harvesting? 16
3.1.1 Water scarcity 163.1.2 Future demand 163.1.3 Decline of groundwater 173.1.4 Limited augmentation options 173.1.5 Problems of flooding 20
3.2 Rainwater harvesting for Chandigarh: Planning 203.2.1 Methodology 203.2.2 Parameters: Rainfall 203.2.3 Parameters: Geology, hydrogeology and soil 213.2.4 Parameters: Land use pattern 23
3.3 Proposal for rainwater harvesting in Chandigarh 233.3.1 Rainwater harvesting potential 233.3.2 Catchment areas for rainwater harvesting 233.3.3 Storage and recharge options 27
01 Chandigarh Final.qxd:Layout 1 6/22/10 2:10 PM Page 3

4. Planning for rainwater harvesting using storm water drains 284.1 Storm water drain network of Chandigarh 284.2 Why rainwater harvesting through storm water drain network? 294.3 Methodology of rainwater harvesting in the storm water drain network 294.4 Structure of a typical recharge system 29
4.3.1 Desilting chamber 294.3.2 Recharge well with desilting chamber 294.3.3 Recharge trench with desilting chamber 30
4.4 Location of structures 314.4.1 No. of recharge wells around a typical sector 31
5. Costing of structures 325.1 Cost of a typical recharge well with desilting chamber 335.2 Cost of typical recharge trench with desilting tank 335.3 Costs for recharge structues for a typical sector 33
5.3.1 Impact of rainwater harvesting 34
6. Water for all today and tomorrow 356.1 Towards a water-smart city: Institutional measures 35
6.1.1 Rainwater harvesting 356.1.2 Recycle and reuse of sewage 366.1.3 Water efficient fixtures 36
7. Annexures 38Annex 1: Soil profiles of a few representative sectors 38Annex 2: Construction of brick masonry storage tank 40Annex 3: Decline in groundwater levels between 1998-2006 41
8. References 43
CENTRE FOR SCIENCE AND ENVIRONMENT
01 Chandigarh Final.qxd:Layout 1 6/22/10 2:10 PM Page 4

Executive summary
1. WHY SHOULD CHANDIGARH HARVEST RAINWATER?
Chandigarh is a rapidly growing city and in the last decade (1991-2001), its population growth rate was 40%. Its populationdensity of 7900/sq km is one of the highest in the country and its demand for water is estimated to grow steeply. It is estimatedthat by 2025, the water demand will be 800 MLD, an increase of 58% over the 2011 demand of 494.25 MLD.
All urban centres are waterguzzlers, and Chandigarh will needeven more water as the city haslarge water needs for horticulturalpurposes. Almost one-third of thetotal area is under green spaces.
It has no surface water source. Ithas been getting water from theBhakra Main Canal and alreadythere is a dispute concerning waterfor the next two phases of supply.Therefore, options for augmentingsurface water supply are limited.
Chandigarh taps the deep, confinedaquifers for water supply. Aconfined aquifer can only berecharged naturally in places whereit is exposed to the surface. InChandigarh, natural recharge ofconfined aquifers is not takingplace and yet, water is beingpumped out from these aquifers.The deep, confined aquifers ofChandigarh are therefore, indecline.
To ensure long-term sustainabilityof water sources for the city,rainwater harvesting is a simpleand effective solution. It can bedone using roads, roundabouts, parks, rooftops, paved areas – almost the entire city.
2. HOW MUCH WATER CAN CHANDIGARH GET FROM RAINWATER HARVESTING?
The rainwater harvesting potential of Chandigarh, with an area of 114 sq km, assuming a co-efficient of 50%, and the averageannual rainfall of 1059.3 mm is 60380.1 million litres or 13241.25 million gallons or 36.28 MGD. This is more than the waterpumped out of aquifers and therefore, harvesting and recharging rainwater will go a long way in contributing towardssustainability of water supply.
5
24.58
185.64331.07
0
200
400
600
800
1000
2011 2016 2025
Grand Total demand (including losses)
Estimated supply (after Phase V & VI)
Gap
469.68
800.75
655.32
494.25 469.68469.68
MLD
Source: Statistical Abstract, Chandigarh Administration website
GRAPH: DEMAND-SUPPLY SCENARIO
Year Projected population
(lakh)
2011 14.38
2016 17.8
2025 24.88
Sector 12 Sector 37 Sector 39 Sector 10 C
0
5
10
15
20
25
30
6m
4m 4.3m4m
20002002
2006
200020032006
200020032006
200020012004
mb
gl
FIGURE: GROUNDWATER DECLINE IN DEEP AQUIFERS
Source: National Data Centre, CGWB, Faridabad
01 Chandigarh Final.qxd:Layout 1 6/22/10 2:10 PM Page 5

6
CENTRE FOR SCIENCE AND ENVIRONMENT
3. HOW AND WHERE CAN WE UNDERTAKE RAINWATER HARVESTING IN THE CITY?
1. By recharging the deep, confined aquifers2. By storing water in tanks or ponds and water bodies.
Recharging deep, confined aquifers: If you look at the tubewell map of the city, you can see that tubewells have beendrilled all across the city and also just outside the city limits in the vicinity of the Sukhna Choe and the Patiali ki Rao choe.Recharge structures can therefore be built across the city and near the choes.
� The simplest way to do recharge would be to tap the storm water drain network. Structures can be built next to thestorm water drain by tapping the water from it and using the rainwater to recharge the aquifer after proper filtration.
� There is a concentration of tubewells in the areas around and near the Sukhna choe in the south and the Patiali ki Raochoe in the north. As these areas have good sandy layers with appreciable thickness, these areas have high potential forrainwater harvesting.
Storage: In addition to recharge, storage structures can be built for rainwater harvesting. These can be either in the formof tanks in commercial and institutional areas or ponds in green areas. For instance, the Municipal Corporation has built suchponds in the Botanical Garden.
4. WHAT ARE THE BENEFITS OF USING THE STORM WATER DRAIN NETWORK FOR RECHARGING?
� The Administration is tapping water from confined aquifers almost in all sectors; Chandigarh’s storm water drainnetwork covers the entire city. A simple way to recharge the aquifers is to construct recharge structures along the stormwater drain network and tap the rainwater flowing through it (see Map: Location of deep tube wells and storm water drainnetwork).
� The drain network is a covered facility and thus the chances of polluted water entering the drain network are limited.
� Currently all the rainwater goes out of the city as the storm water drain tail ends are in the Sukhna choe or in the N-choe which take the water away from the city. By making recharge structures along the storm water drains the water canbe used to recharge Chandigarh’s aquifers.
� The storm water network collects water from the roads (15.89 sq. km), from rooftops of residential areas, (30.19 sq.km)from shopping areas (3.97 sq. km), public and institutional buildings (7.94 sq. km). This amounts to more than 70% ofthe total land area. The total quantum of water that would be available for recharge annually would be58 sq km (area) x 1059.3 (rainfall) x 0.5 (rainfall coefficient) = 30720 million litres.
Even if we assume the rainfall to be 1000 mm and use 40% collection efficiency, the total water that can be recharged annuallywould be 23200 million litres or 13.94 million gallons daily. This is equivalent to 70% of the total groundwater supply andis available only from tapping the storm water drain network. .
5. HOW MANY RECHARGE STRUCTURES CAN BE MADE ON THE ROADS AND WHAT WILL IT COST?
The planning has been done for a typical sector measuring 1200m by 800m. In some of the sectors there are storm waterdrains on all four sides and in some, only on three sides. Assuming that recharge structures are made at an interval of 50 m,there can be a minimum of 55 recharge wells and 50 recharge trenches and a maximum of 70 recharge wells and 64 rechargetrenches for a sector.
The cost of a typical recharge well with desilting chamber is Rs. 40,500 and a recharge trench is Rs. 53,135 (see Table:Costs for recharge structures for a typical sector).
If we take an average of Rs. 25 lakh for a sector, the total cost for 56 sectors would be Rs. 1400 lakh (14 crore).
The annual maintenance cost arises only from cleaning of the desilting chamber, cleaning of filter materials and decloggingthe bore.
01 Chandigarh Final.qxd:Layout 1 6/22/10 2:10 PM Page 6

Source: PH Department, MCC
MAP: LOCATION OF DEEP TUBE WELLS AND STORM WATER DRAIN NETWORK
No of Cost of No of recharge Cost of recharge recharge wells recharge wells (Rs) trenches trenches (Rs)
Typical sector with drainpipes on 3 sides 55 55 x 40500 = 22,27,500 50 50 x 53135 = 25,56,750
Typical sector with drainpipes on 4 sides 70 70 x 40500 = 28,35,000 64 64 x 53135 = 34,00640
TABLE: COSTS FOR RECHARGE STRUCTURES FOR A TYPICAL SECTOR
7
CAPTURING RAINWATER: A WAY TO AUGMENT CHANDIGARH’S WATER RESOURCES
01 Chandigarh Final.qxd:Layout 1 6/22/10 2:10 PM Page 7

6. WATER FOR ALL: TODAY AND TOMORROW
Against the background of the envisaged economic growth and the resulting population growth, the water needs ofChandigarh will grow at an explosive rate. But water availability will not grow in parallel leading to water stress and resultantconflicts. There is a need to put in place a number of measures to create awareness among the people about the importanceof water and incentivise them to use water carefully and wisely. These will include policy measures (legal, financial), research,capacity building and education measures. Water conservation measures include: (a) Rainwater harvesting; (b) Recycle andreuse of water; and, (c) Reducing water use.
The first step is to create a central authority to coordinate all water conservation and augmentation measures (RainwaterHarvesting or Water Conservation Cell). The next step is define clear and definite short-term and long-term measures andtargets, identify funding sources and secure adequate funding. Bulk users and institutional buildings must be targeted first.
Short-term measures: This will include legal, administrative and financial measures on the one hand, and awareness creationand capacity building on the other. They go hand in hand and must be initiated together. To catalyse citizens and publicinstitutions to become water-wise, legal and administrative measures can be put in place. These include amendment ofbylaws to make water conservation measures mandatory, financial and administrative incentives such as rebates on water bills,property taxes, award programmes etc. Pricing of water is a key instrument to ensure that consumers use water carefully.
Long-term measures: A focussed programme to encourage research on such issues as hydrogeological and rainfall mapping,filters, technological tools must be instituted. Detailed maps of each zone can be created for recharge zones, flood-proneareas, water quality and water bodies that can be revived etc. Detailed studies can be initiated using GIS, satellite imageries.
Before exhorting the public to use water wisely, the Administration must lead by example by instituting measures for wiseuse of water in its own buildings. Rainwater harvesting must be implemented in all government buildings and public spacessuch as parks, stadia etc. As Chandigarh’s soil is suitable for constructing water bodies, the MCC must plan for water bodiesin green areas and particularly in the southwestern sectors, where there is water logging. Public and commercial buildingsmust be made to implement water conservation measures in a targeted manner.
Rainwater harvesting: The first step to encourage rainwater harvesting in the city is to create a Rain Centre that will serveas a central repository of information on all aspects related to rainwater harvesting. The Rain Centre will have posters, models,and training facilities. It will be staffed with technical experts to provide technical help to common people. The Rain Centrewill also serve as a centre for providing training and capacity building to a cross-section of people from masons and plumbersto consultants and architects.
A key system that must be set up will be an Inspection and Maintenance programme to ensure that all rainwater harvestingsystems are kept in good order. A systematic programme to regularly clean and maintain the systems must be put in place.
Recycle and reuse of sewage: Although Chandigarh is the first city to have a system in place for treating and reusing sewage,this centralised system can be supplemented by decentralised sewage recycling systems. As the N-choe is greatly pollutedwith untreated sewage, decentralised sewage treatment systems can be easily set up in that area and the sewage can be gainfullyused in horticulture. This will serve to reduce the cost of supplying centrally treated water.
Water efficient fixtures: There is an increasing trend the world over to reduce the use of water by designing water efficientfixtures. In countries like Australia, Canada and the US, laws have been brought in to make it mandatory to replace oldfixtures that use more water with water-efficient fixtures. Therefore, the Chandigarh administration should also look atpolicy initiatives to facilitate the change over to the use of water- efficient fixtures. These can include labelling of water-efficient fixtures, rebates on the fixtures, rebates on water bills. In addition, the Administration can go in for a focussedreplacement programme of all older, water guzzling fixtures.
The most common water efficient fixture is the flush toilet and in India, low-flush or dual flush toilets are already being usedwidely. Water taps, washing machines are other fixtures where efficiency can be brought in. Currently the Ministry of Urbandevelopment is undertaking a study to initiate a programme of labelling of water efficient fixtures similar to the star ratingsystem for electrical appliances. This will greatly help in motivating consumers to switch over to the use of water efficientfixtures.
CENTRE FOR SCIENCE AND ENVIRONMENT
8
01 Chandigarh Final.qxd:Layout 1 6/22/10 2:10 PM Page 8

9
1. Chandigarh: the city
1.1 BACKGROUND AND HISTORY
Chandigarh is famously known as the first planned city of independent India, and was planned as a symbol of the aspirationsof the new republic. It was primarily created to meet the need for a new capital for the state of Punjab after independence.The task of planning the city was first assigned to the American planner, Albert Mayer and his partner, Matthew Nowicki.Mayer pulled out of the project after the death of his associate and Le Corbusier was brought into the project in 1951.
A gently sloping plain measuring 114 sq km, at the base of the Siwalik Range of the Himalaya and located at 30.74º Northand 76.79º East, was chosen as the site for the new capital city. It was named Chandigarh after a temple dedicated to thegoddess, Chandi, and a fort (garh) which were situated in one of the villages acquired for the city. The site was bounded bytwo seasonal rivulets, Patiali-ki-Rao and Sukhna Choe, marking its northwest and southeast boundaries. The elevation of333m above sea level moderates its severe summers.
Le Corbusier’s most significant contribution was the conception of the city as a human form – the Capitol complex formingthe “head”; the City Centre forming the “heart”; the industrial and the University areas serving as the “limbs”. The basic unitof urban planning was the “Sector” and the entire city was designed within an ordered framework of “sectors” that look likea chess board. Corbusier also implemented his idea of urban circulation through the hierarchy of roads, called the seven Vsthat gives Chandigarh its distinctive character. Beginning with the V1 roads that connect the city with the outside world, theV2 roads are the major roads that cut acrooss the city (the Jan Marg, Dakshin Marg, Madhya Marg). V3 roads surround eachsector and are meant for fast traffic, while V4 roads connect adjoining sectors and are the main shopping streets. The verticalgreen belts, with the pedestrian V7, contained sites for schools and sports activities. A typical sector measures 1200 m x 800m in area, and shopping and green areas cut across all sectors.
Chandigarh was the capital of Punjab until 1966, when the state was bifurcated into Punjab and Haryana, and it was thenmade the joint capital of both states. At the same time, it was also designated as a Union Territory to be directly administeredby the central government. Of the total area of 114 sq km, 79.34 sq km is designated as urban area and the remaining 34.66sq km as rural area comprising 18 villages. The MCC came into being in 1994 through an extension of the Punjab MunicipalCorporation Act, 1976.
The city was originally planned for 1.5 lakh people and the first 30 sectors were planned for this population. Later 17additional sectors (Sectors 31-47) were planned as the population increased to 5 lakh. As per the 2001 census, Chandigarh
1.22.57
4.52
6.429.01
14.38
22.26
0
5
10
15
20
25
1961 1971 1981 1991 2001 2011(projected)
2021(projected)
0
20
40
60
80
100
120
140
Total population (lakh) Decadal growth
Source: Statistical Abstract, Chandigarh Administration website
GRAPH: POPULATION GROWTH
Decade % of decennial growth
1961 ---
1971 114.17
1981 75.88
1991 42.04
2001 40.34
2011 (projected) 59.60
2021 (projected) 54.80
TABLE: DECADAL GROWTH OFPOPULATION
01 Chandigarh Final.qxd:Layout 1 6/22/10 2:10 PM Page 9

10
CENTRE FOR SCIENCE AND ENVIRONMENT
had a population of 9,00,635, 89.8% of which was urban population and the slum population was 1 lakh (12%). The decadalgrowth in population between 1991 and 2001 was 40%. In 2009, the city had a population of 12.97 lakh1. The city is also oneof the most densely populated cities in the country with a population density of 7900 per sq km.
Today, Chandigarh is emerging as a regional hub in areas such as education, health, information technology, food processingand service industries. Several new initiatives are being planned such as the Medi City, IT Park etc for the coming years. TheAdministrations’ e-sampark project has won the Golden Icon award. Chandigarh was adjudged the best city in terms ofquality sanitation under the National Rating and Award Scheme for Sanitation in May 2010 by the Ministry of UrbanDevelopment.
Source: Y. Singh, Siltation problems in Sukhna Lake in Chandigarh, NW India and comments on geohydrological changes in the Yamuna-Satlej region.
01 Chandigarh Final.qxd:Layout 1 6/22/10 2:10 PM Page 10

11
2. Chandigarh: Water profile
2.1 WATER SUPPLY
The responsibility of water supply and sewerage rests with the Public Health Department of the municipal corporation. TheSuperintending Engineer (Public Health) has the overall responsibility for water supply, sewerage and storm water drainage.Under him there are four divisions, each under an Executive Engineer. Each of these divisions has several sub-divisions thatcover the entire municipal area of the city.
The city was being supplied with water from groundwater wells till 1983. The exploding population of the city forced theadministration to look for a surface water source to supplement the ground water supply. Today, Chandigarh city gets 67MGD of water from the Bhakra Main Canal and 20 MGD of groundwater from 200 tubewells in the city, making the totalavailable water at 87 MGD or 396.72 MLD.
2.1.1 Canal water supplyIn 1983, the administration commissioned the first phase of Kajauli Water Works from the Bhakra Main Line at a distanceof 27.5 km from Chandigarh to provide 20 MGD of water to Chandigarh city and its satellite towns of Mohali and Panchkula.Another 20 MGD was commissioned under Phase –II in 1988, and the third and the fourth phases were commissioned in1994 and 2006 to bring in additional water supply of 40 MGD.
The agreed share of water from the Kajauli Water Works is as follows:
However, Panchkula has not been availing itself of its share of water and this is used by Chandigarh. Chandigarh also getsan additional 3 MGD of water from Punjab. Thus, as of today, Chandigarh gets 67 MGD from Kajauli. This water is pumpedto Chandigarh, Sector 39, which is at a higher elevation of 177 feet. There is a loss of 1% water due to leakage.
At Sector 39, there is a filtration plant of 70 MGD capacity and a storage capacity of 42 MGD for raw water. Treated wateris sent to underground reservoirs at Sectors 26, 32, 37, 12, 52 and 39 with a total capacity of 50 MGD.
Projected augmentation of canal supply: The Chandigarh Administration has planned for further augmentation ofthe surface water supply scheme at Kajauli Water Works to provide an additional 32 MGD (14.5 MGD of Chandigarh shareand 1.5 MGD of Panchkula share per phase). These two phases are expected to be commissioned by 2011. Thus the total canalwater supply available will be 103 MGD or 469.68 MLD.
Cities Phase I Phase II Phase III Phase IV Total MGD Remarks MGD MGD MGD MGD
Chandigarh 14.5 14.5 14.5 14.5 58 For Chandigarh
Mohali 2.5 2.5 2.5 2.5 10 For Punjab
Panchkula 1.5 1.5 1.5 1.5 6 For Chandigarh
Chandi mandir 1.5 1.5 1.5 1.5 6 For Chandi Mandir
Extra from Punjab 3
Total for Chandigarh 67
TABLE: CANAL WATER SUPPLY
Source: Executive Engineer, PH-I, Municipal Corporation Chandigarh (MCC)
01 Chandigarh Final.qxd:Layout 1 6/22/10 2:10 PM Page 11

12
CENTRE FOR SCIENCE AND ENVIRONMENT
2.1.2 Groundwater supplyIn Chandigarh, the use of private tubewells has been banned. Groundwater for drinking water supply and for irrigation isbeing provided solely by the municipal corporation. Water is pumped from the deep aquifers below 100 m. There are a totalof about 219 tubewells for both urban and rural areas, of which water from 200 tubewells is used for urban water supply. Asgroundwater has been used for water supply since the creation of the city, water table in the deeper aquifers have declinedconsiderably.
2.2 WATER CONSUMPTION
2.2.1 Per capita supplyGiven the total water available for supply at 87 MGD or 396.72 MLD and a total population of 12.97 lakh, the total per capitasupply after allowing for 22 % leakage losses is 269.17 lpcd. The total domestic per capita supply after deducting 22% leakageloss is 140.53 lpcd.
Source: PH Department, MCC
MAP: LOCATION OF DEEP TUBE WELLS
01 Chandigarh Final.qxd:Layout 1 6/22/10 2:10 PM Page 12

13
CAPTURING RAINWATER: A WAY TO AUGMENT CHANDIGARH’S WATER RESOURCES
Total per capita supplyTotal water available for supply = 396.72 MLDLess: leakage losses = 349.11 MLDTotal population = 12.97 lakhTotal per capita supply = 269.17 lpcd
Domestic per capita supplyTotal water available for supply = 396.72 MLDLess: leakage losses = 349.11 MLDLess water for: Industrial & commercial = 34.91 MLDInstitutional = 43.95 MLDHorticulture (3573 acres) = 87.98 MLDWater available for domestic water supply = 182.27 MLDDomestic per capita water supply = 140.53 lpcd
2.2.2 Total water demand and supply - 2009As per the population figures compiled by the Office of the Registrar General and Census Commissioner of India, New Delhi,Chandigarh’s population was 12.97 lakh in 2009. Assuming domestic supply at 150 lpcd , and water for floating populationat 5% of domestic demand, the total domestic water demand is 204 MLD.
Details of water demand for industrial, commercial, institutional and horticulture are as follows:
Total available for supply = 87 MGD or 396.72 MLDTotal demand = 99.29 MGD or 452.77 MLD Demand/supply gap for 2009 = 12.29 MGD or 56.05 MLD
As can be seen from the table above, the total water demand in 2009 exceeds the water supply.
Description No of acres Water demand Total water demand gallons/acre/day MLD
Commercial & industrial actuals 34.91
Institutional actuals 43.95
Horticulture 3573.0 5400 87.98
Total 166.84
Add: Total domestic demand 204.28
Total demand in city 371.12
To add provision for distribution losses at 22% 81.65
Grand total demand 452.77
Demand in MGD at 4.56 MLD = 1 MGD 99.29
TABLE: OTHER DEMANDS
Source: PH Department, MCC
Population in lakh (2009)* 12.97
Domestic demand @150 lpcd (MLD) 194.55
Floating population @ 5% of domestic demand (MLD) 9.73
Total domestic demand (MLD) 204.28
TABLE: DOMESTIC DEMAND
Note: *Registrar General and Census Commissioner of India
01 Chandigarh Final.qxd:Layout 1 6/22/10 2:10 PM Page 13

Sector numbers Area in acres
1-12, 26 1290
15-25 (Green areas + Houses with area of 1 kanal or above) 2283
Total 3573
TABLE: GREEN AREAS
Source: PH Department, MCC
14
CENTRE FOR SCIENCE AND ENVIRONMENT
2.2.3 Measures to address the demand-supply gapAs there is no further scope of increasing canal supply water, there remain very few options for the Administration to addressthe existing and future demand-supply gap. There is a need to put in place systems for the following:
� Rainwater harvesting: Storage and recharge
� Recyle and reuse water, both at the centralised and at decentralised levels.
� Demand side management measures: Reduce demand through the use of water efficient fixtures, water conservationmeasures.
2.2.4 Measures that have been already initiated by the Chandigarh administrationRainwater harvesting: The Administration has undertaken artificial recharge in a number of sites within the city. Thesestructures have been designed by the Central Groundwater Board (CGWB).
� Central Scientific Instrument Organisation (CSIO) Complex, Chandigarh (1998-99): One of the earliest structures tobe constructed, the site has been monitored for impact of artificial recharge on the groundwater level. The roof area ofthe building is 3550 sq m rainwater is recharged through injection wells. In 2000, as per water quality level monitoredby CGWB, the site recorded an increase of 2m.
� Panjab University, Chandigarh (2001): The rooftop of the Basic Medical Sciences Block of 2100 sq m was used to harvestand recharge rainwater through a trench-cum-recharge well.
� Bhujal Bhawan Chandigarh (2001-02): The rooftop of the building was used to harvest and recharge rainwater througha trench-cum-recharge well.
� Other structures have been constructed at Leisure valley; Chandigarh Housing Board, Sector 9; DAV School, Sector-8;UT Guest House, Sector-6: Government College for Women, Sector-11; Public Health Office Building, Sector-11;Government College, Sector-46; and, Government College for Boys, Sector-11.
Recycle and reuse of water: Under the JNNURM, the MCC has already set in motion a process to treat and reuse sewagewater for horticultural purposes. Chandigarh is unique because it has a huge demand for water for horticultural purposes.The total water demand for horticultural purposes is 87.98 MLD, which is 19.43% of total water demand and 43% of the totaldomestic demand. To reduce its pressure for fresh water, a tertiary treatment (TT) plant was set up in Diggian in 1991 of 10MGD capacity. Here, sewage is treated to the tertiary level so that it can be used for horticultural purposes and pipelines havebeen laid to distribute this treated water for the green areas in Sectors 1-12 and Sector 26. At present 7 MGD of TT water isbeing distributed through piplelines to green areas in Sectors 1-12. Work is ongoing for laying of more pipes to distributethe remaining TT water of 3 MGD to more green areas.
Under JNNURM, a proposal has been approved to construct treatment plants to treat a further 10 MGD of sewage so thatall the demand for horticulture can be met through the use of TT water. The break-up of the acreage of green areas is asfollows:
Tertiary treated water required for 3573 acres (@ 5400 gallons/acre/day) = 19294200 Gallons; = 19.29 Million Gallons perday = 20 MGD
01 Chandigarh Final.qxd:Layout 1 6/22/10 2:10 PM Page 14

15
CAPTURING RAINWATER: A WAY TO AUGMENT CHANDIGARH’S WATER RESOURCES
2.3 WATER TARIFF
The tariff structure is as follows:
Consumers are billed every two months. The cost of a new domestic connection is Rs 530 for a half-inch connection payableprior to connection. About 79% of service connections are metered. Those not metered pay a monthly flat rate. The bulk waterusers are the Punjab University in sector 14, Postgraduate Institute of Medical Education & Research in sector 12 and CSIOin sector 30 C. The government colonies also receive bulk supply.
2.4 COST OF PRODUCTION
The total annual cost of production is approximately Rs. 75 crore. The annual production of water is approximately144,80,2800 kl. The average cost of production of 1 kl of water is Rs. 5.18.
2.5 JNNURM PROJECTS
Chandigarh has three approved projects under JNNURM, relating to water supply. � Conservation of drinking water by harvesting of the tertiary treated sewage for irrigation of green spaces in Chandigarh.
(36.73 crore): This project is in process and at present 7 MGD of treated water is being supplied for horticulturalpurposes.
� Upgradation of water supply infrastructures for proper monitoring and automation with remote computerizedsurveillance system to 24x7 water supply. (Rs. 20.26 crore).
� Augmentation of water supply: The engineering wing of the MC has prepared the Detailed Project Report (DPR) ofphase V and VI of the Kajauli water project. The total cost of the project is estimated at Rs 198 crore and is expected tobe funded under the JNNURM programme.
Domestic Non-domestic
Consumption (m3) Rate (Rs/ m3) Category Rate (Rs/ m3)
1-15 1.75 Lawn/irrigation 2.50
15 – 30 3.50 Institutional 9.00
30 – 60 5.00 Semi-commercial 12.00
Above 60 6.00 Commercial 11.00
TABLE: OTHER DEMANDS
Source: PH Department, MCC
01 Chandigarh Final.qxd:Layout 1 6/22/10 2:10 PM Page 15

16
3. Rainwater harvesting: proposal toaugment water resources
3.1 WHY RAINWATER HARVESTING?
Rainwater harvesting must be undertaken on priority as Chandigarh does not have any surface water source and are declining. Water is being tapped from deep aquifers across the city. Tubewells are present in almost every sector of the city. As water istapped from the confined deep aquifers, recharge will not happen naturally. As the city has very few options for sourcing water,recharging the confined aquifers from where water is being tapped becomes a necessity.
3.1.1 Water scarcityEvery summer, newspaper reports quoteresidents residing on the second and thirdfloors in the southern sectors of the citycomplaining about the shortage of drinkingwater. Residents have also held a series ofprotests in several parts of the city. In 2009,Chandigarh was getting supply of 87 MGDper day against the requirement of 99.29MGD.
3.1.2 Future demandThe water shortage is likely to get worse in thecoming years as the population is alreadymore than double the planned capacity for thecity. In addition, there is a large floatingpopulation and a slum population that isbeing rehabilitated. There are plans for anumber of new initiatives such as the Medi City, the IT park and other such projects that will swell the population ofChandigarh. The demand of water for other purposes such as industrial and commercial will also increase concurrently withthe demand for domestic water demand.
HIGH AND DRYWater scarcity leaves residents high and dry
CHANDIGARH: Water scarcity in the tricity at the beginning of summer
season has left residents high and dry. In Chandigarh, the problem is more
marked in the southern sectors where numerous housing societies are
located. In many areas, residents have already started complaining of low
water pressure.
Rakesh Sharma, who resides in a housing society in the southern part of the
city, alleged those living on the top floors are not getting water at all. Raj
Malhotra of Sector-37 said low water pressure is being witnessed on the first
and second floors. Chandigarh MC officials said people living in housing
societies should use additional connections to overcome these problems.
TNN, Apr 13, 2010
Year 2011 2016 2025
Population in lakh * 14.38 17.8 24.88
Domestic demand @150 lpcd (MLD) 215.70 267.00 373.20
Floating population @ 5% of domestic demand (MLD) 10.79 13.35 18.66
Total domestic demand 226.49 280.35 391.86
TABLE: PROJECTED DOMESTIC DEMAND UP TO 2025
Source: *Statistical Abstract, Chandigarh Administration website
01 Chandigarh Final.qxd:Layout 1 6/22/10 2:10 PM Page 16

17
CAPTURING RAINWATER: A WAY TO AUGMENT CHANDIGARH’S WATER RESOURCES
3.1.3 Decline of groundwaterChandigarh is already sourcing 22% of its water supply from groundwater and there is a considerable decline in thegroundwater levels of the deep aquifers. According to CGWB pre monsoon data for the period 1991 to 2006 (15 years),Sector 10 in the north shows a maximum decline of 16m and in Sector 31, the fall has been of the order of 10m. The remainingparts of the city show on average a decline of 5 to 8 m. To cope up with the decline the municipality is drilling deeper. Everyyear about 10% of such tubewells become defunct (see Map: Premonsoon groundwater level – deep and shallow).
3.1.4 Limited augmentation optionsThe options for augmentation of sources of water supply for Chandigarh are very limited. Chandigarh is already sourcingits water from a distance of 27.5 kms from the Bhakra Main Line at Kajauli. As Kajauli is situated at a lower altitude thanChandigarh, water has to be pumped to Chandigarh, expending a great deal of financial resources. Chandigarh spends 60%of its total O & M cost on power.
Moreover, plans for further augmentation of water from Kajauli have run intoproblems as the Punjab government is reluctant to release any more water.
Uncertainty prevails over the MC’s project to enhance Chandigarh’s water supplyas the Punjab government has refused to release water for Kajauli Phase V and VI.
The MC had mooted Augmentation of Water Supply Scheme (Kajauli) Phase Vand VI to augment the city’s water supply by 40 million gallons per day (MGD).After giving Punjab and Haryana their share, the city will get 29 MGD water fromthe project. Recently, the Central government had approved around Rs. 130 crorefor the scheme under the Jawaharlal Nehru National Urban Renewal Mission(JNNURM). But till the Punjab government releases the additional 40 MGD,progress on the scheme is not possible. According to MC officials, the Punjabgovernment’s argument against releasing the additional water is that “the city isalready getting its fair share”.
MC plan to augment supply incity blocked, Punjab says no toextra water
In order to settle the dispute among
Punjab, Haryana and Chandigarh over
the issue of Augmentation of Water
Supply Scheme Phase V and VI, the
Punjab and Haryana High Court has
directed the Haryana government, the
Executive Engineer of Chandi Mandir
and the UT Adviser to hold a meeting.
Indian express, Dec 17 2009,
Year 2011 2016 2025
Commercial & industrial (No. of acres ) 1921.63 1998.50 2161.60
Demand (@4000 gallons/acre/day) (MLD) 35.05 36.45 39.43
Institutional (No. of acres) 3048.50 3170.44 3429.15
Demand (@4000 gallons/acre/day) (MLD) 55.60 57.83 62.55
Horticulture (No. of acres) 3573.00 6600.00 6600.00
Demand (@5400 gallons/acre/day) (MLD) 87.98 162.52 162.52
Total demand (MLD) 178.64 256.80 264.49
TABLE: PROJECTED DEMAND FOR OTHER PURPOSES UPTO 2025
Source: CDP, Chandigarh
Year 2011 2016 2025
Total domestic demand 226.49 280.35 391.86
Total demand for other purposes (MLD) 178.64 256.80 264.49
Provision for distribution losses @22% (MLD) 89.13 118.17 144.40
Grand Total demand (including losses) MLD 494.25 655.32 800.75
Supply (MLD) 469.68 469.68 469.68
Gap -24.57 -185.64 -331.07
TABLE: TOTAL PROJECTED DEMAND AND SUPPLY (DOMESTIC + OTHER PURPOSES) (MLD) UPTO 2025
Source: CDP and PH division, MCC
01 Chandigarh Final.qxd:Layout 1 6/22/10 2:10 PM Page 17

18
CENTRE FOR SCIENCE AND ENVIRONMENT
Source: CGWB, Chandigarh
MAP: PREMONSOON GROUNDWATER LEVEL – DEEP AQUIFER
01 Chandigarh Final.qxd:Layout 1 6/22/10 2:10 PM Page 18

19
CAPTURING RAINWATER: A WAY TO AUGMENT CHANDIGARH’S WATER RESOURCES
Source: CGWB, Chandigarh
MAP: PREMONSOON GROUNDWATER LEVEL – SHALLOW AQUIFER
01 Chandigarh Final.qxd:Layout 1 6/22/10 2:10 PM Page 19
20
CENTRE FOR SCIENCE AND ENVIRONMENT
3.1.5 Problems of floodingRainwater harvesting will also address the problem of flooding due to overloading of the storm water drains. The stormwater drainage system has been designed keeping in view the slope of the city i.e. from northeast to southwest. It was initiallydesigned for a rain intensity of half inch per hour. However, because of the increased green areas/ open spaces coming underconstruction, the run off co-efficient has increased tremendously. This has resulted in the over loading of storm water drainagesystem and hence flooding of low-lying pockets in the city. Although the Administration has augmented the capacity of thestorm water drains by laying additional pipes, constructing rainwater harvesting structures along the storm water drains inthe city will help to make use of the city’s rain water endowment and at the same time address the problem of floodingduring the monsoons.
3.2 RAINWATER HARVESTING FOR CHANDIGARH: PLANNING
3.2.1 Methodology To identify the soil profile, integration of thematic layers have been done. These layers are derived from conventional methodsthrough geographic information system (GIS) application. The thematic layers considered here are land use, geomorphology,geology, hydrogeology, storm water and sewage network.
The work on mapping is divided into three parts: (a) Collection of data; (b) Geo referencing of the maps and (c) Digitization
Collection of data: The basic land use map was supplied by the Chandigarh Administration. Other maps are collected fromthe existing research papers. Google-based satellite map has also been used for precise location of important locations likepark/garden, important buildings like schools etc. Borehole logs have been collected to get an understanding of the soilprofile below the surface.
Geo referencing of all maps: For the projection of map geographic latitude and longitudes are used with DatumModified Everest. Software used for Georeferencing is Erdas Imagine 9.0.
Digitization: Reference maps once preparedin Erdas Imagine are transferred to IllustratorCS2 for final map work. Maps are prepared indifferent layers according to preferences ofvisibility. Boundary, street and scale weremaintained in each map.
After the thematic layers are prepared,decisions about the solutions are taken to solvewater crisis and the flooding problemsaccording to the sites.
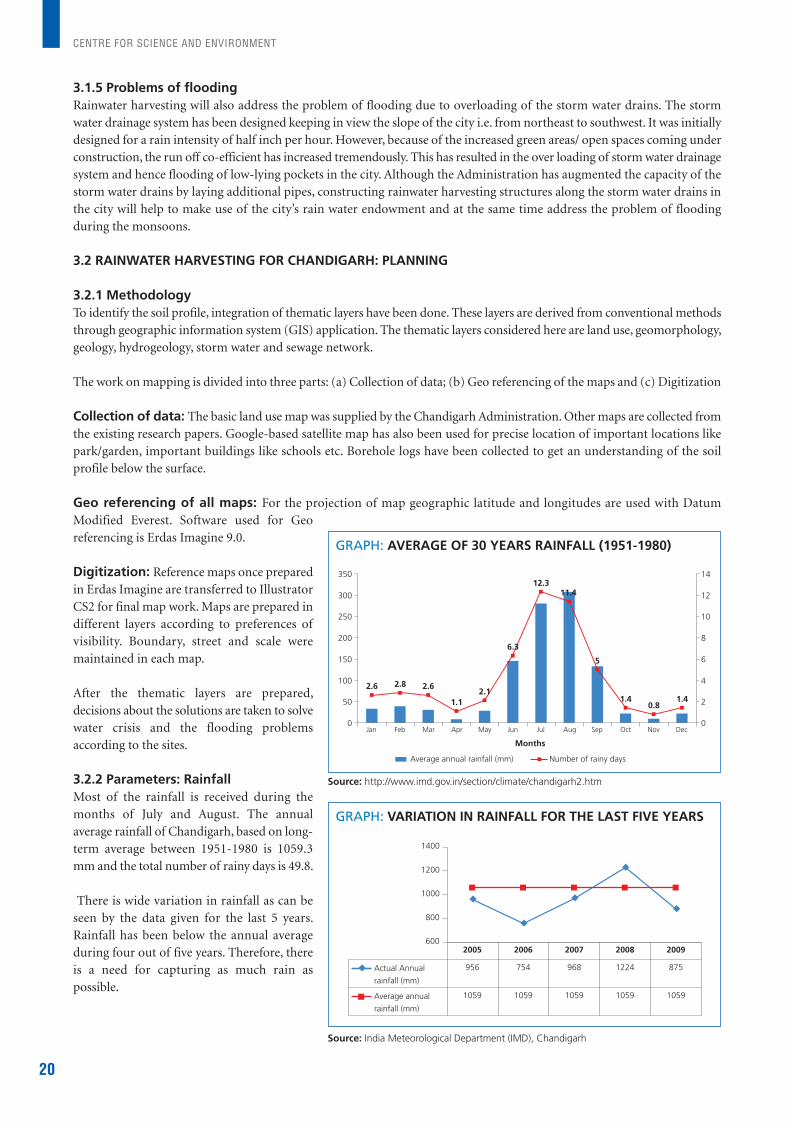
3.2.2 Parameters: Rainfall Most of the rainfall is received during themonths of July and August. The annualaverage rainfall of Chandigarh, based on long-term average between 1951-1980 is 1059.3mm and the total number of rainy days is 49.8.
There is wide variation in rainfall as can beseen by the data given for the last 5 years.Rainfall has been below the annual averageduring four out of five years. Therefore, thereis a need for capturing as much rain aspossible.
2.6 2.8 2.6
1.12.1
6.3
12.311.4
5
1.40.8
1.4
0
50
100
150
200
250
300
350
Jan Feb Mar Apr May Jun Jul Aug Sep Oct Nov Dec
Months
0
2
4
6
8
10
12
14
Average annual rainfall (mm) Number of rainy days
Source: http://www.imd.gov.in/section/climate/chandigarh2.htm
GRAPH: AVERAGE OF 30 YEARS RAINFALL (1951-1980)
600
800
1000
1200
1400
Actual Annual
rainfall (mm)
956 754 968 1224 875
Average annual
rainfall (mm)
1059 1059 1059 1059 1059
2005 2006 2007 2008 2009
Source: India Meteorological Department (IMD), Chandigarh
GRAPH: VARIATION IN RAINFALL FOR THE LAST FIVE YEARS
01 Chandigarh Final.qxd:Layout 1 6/22/10 2:10 PM Page 20

21
CAPTURING RAINWATER: A WAY TO AUGMENT CHANDIGARH’S WATER RESOURCES
3.2.3 Parameters: Geology, hydrogeology and soil
Geology: Quarternary sediments belonging to the Indo-Gangetic alluvium mainly cover the Union Territory of Chandigarh.The Older alluvium covers major part of the area and comprises layered sequence of clay, silty clay, and sand with lenses ofpebbly sand and gravel. The younger Alluvium mainly consisting of light grey micaceous sand and pebbles with interbeds
Source: Kandpal, G.C., et al, 2009. Geotechnical Studies in Relation to Seismic Microzonation of Union Territory of Chandigarh.J. Ind. Geophys.Union. Vol.13, No.2, pp.75-83.
MAP: GEOLOGICAL MAP
01 Chandigarh Final.qxd:Layout 1 6/22/10 2:10 PM Page 21
22
CENTRE FOR SCIENCE AND ENVIRONMENT
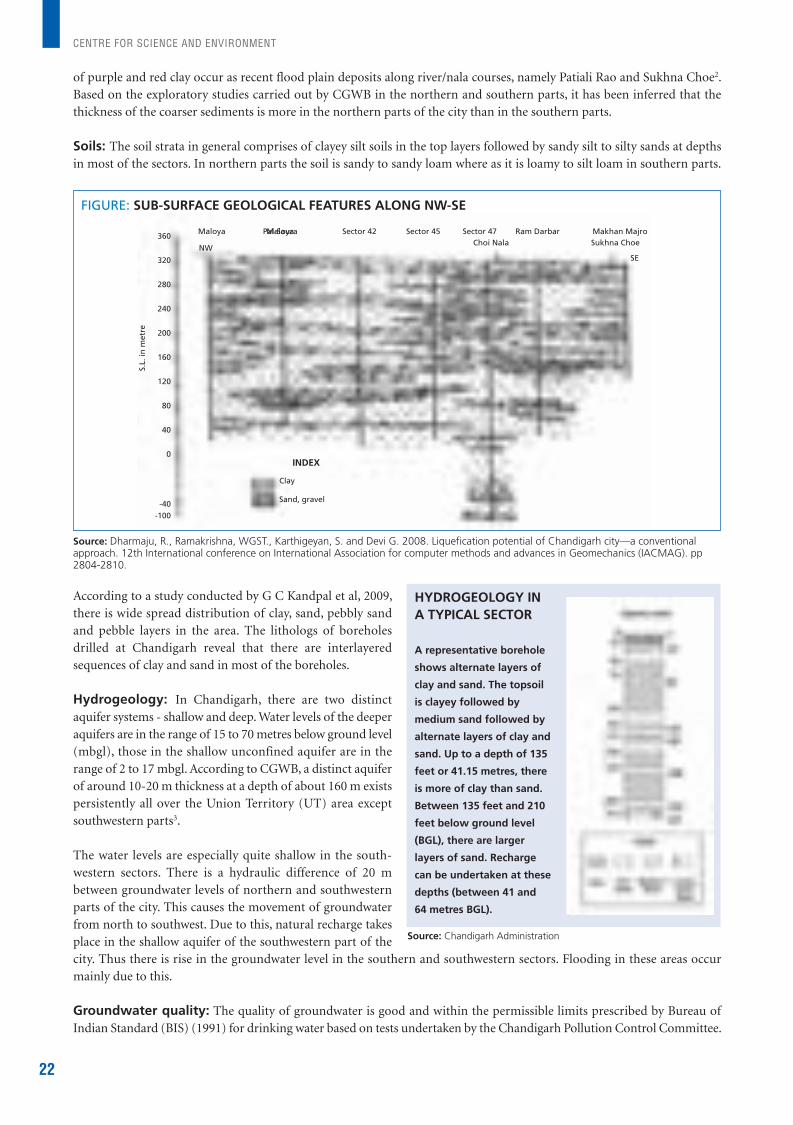
of purple and red clay occur as recent flood plain deposits along river/nala courses, namely Patiali Rao and Sukhna Choe2.Based on the exploratory studies carried out by CGWB in the northern and southern parts, it has been inferred that thethickness of the coarser sediments is more in the northern parts of the city than in the southern parts.
Soils: The soil strata in general comprises of clayey silt soils in the top layers followed by sandy silt to silty sands at depthsin most of the sectors. In northern parts the soil is sandy to sandy loam where as it is loamy to silt loam in southern parts.
According to a study conducted by G C Kandpal et al, 2009,there is wide spread distribution of clay, sand, pebbly sandand pebble layers in the area. The lithologs of boreholesdrilled at Chandigarh reveal that there are interlayeredsequences of clay and sand in most of the boreholes.
Hydrogeology: In Chandigarh, there are two distinctaquifer systems - shallow and deep. Water levels of the deeperaquifers are in the range of 15 to 70 metres below ground level(mbgl), those in the shallow unconfined aquifer are in therange of 2 to 17 mbgl. According to CGWB, a distinct aquiferof around 10-20 m thickness at a depth of about 160 m existspersistently all over the Union Territory (UT) area exceptsouthwestern parts3.
The water levels are especially quite shallow in the south-western sectors. There is a hydraulic difference of 20 mbetween groundwater levels of northern and southwesternparts of the city. This causes the movement of groundwaterfrom north to southwest. Due to this, natural recharge takesplace in the shallow aquifer of the southwestern part of thecity. Thus there is rise in the groundwater level in the southern and southwestern sectors. Flooding in these areas occurmainly due to this.
Groundwater quality: The quality of groundwater is good and within the permissible limits prescribed by Bureau ofIndian Standard (BIS) (1991) for drinking water based on tests undertaken by the Chandigarh Pollution Control Committee.
HYDROGEOLOGY INA TYPICAL SECTOR
A representative borehole
shows alternate layers of
clay and sand. The topsoil
is clayey followed by
medium sand followed by
alternate layers of clay and
sand. Up to a depth of 135
feet or 41.15 metres, there
is more of clay than sand.
Between 135 feet and 210
feet below ground level
(BGL), there are larger
layers of sand. Recharge
can be undertaken at these
depths (between 41 and
64 metres BGL).
Source: Chandigarh Administration
Source: Dharmaju, R., Ramakrishna, WGST., Karthigeyan, S. and Devi G. 2008. Liquefication potential of Chandigarh city—a conventionalapproach. 12th International conference on International Association for computer methods and advances in Geomechanics (IACMAG). pp2804-2810.
FIGURE: SUB-SURFACE GEOLOGICAL FEATURES ALONG NW-SE
360
320
280
240
200
160
120
80
40
0
-10
-40-100
Maloya MaloyaPal-Saura Sector 42 Sector 45 Sector 47Choi Nala
NW
Clay
Sand, gravel
INDEX
S.L.
in m
etre
Ram Darbar Makhan MajroSukhna Choe
SE
01 Chandigarh Final.qxd:Layout 1 6/22/10 2:10 PM Page 22

23
CAPTURING RAINWATER: A WAY TO AUGMENT CHANDIGARH’S WATER RESOURCES
This study shows that levels of nitrate and iron is high in some of the locations where water samples were drawn from handpumps that are about 15 m deep4.
Water from shallow aquifer is not allowed for drinking purposes to avoid risk of bacteriological contamination. This is dueto open defecation in the rural settlements and slum colonies in the northern-most parts of the city. As there is a hydraulicdifference between the northern and the southern parts of the city, there is a risk that the contaminated water of the shallowaquifer will move downwards and contaminate the shallow aquifer of the city.
A study undertaken on the bacteriological contamination of hand pumps and tap water in peri-urban and slum areas in thenorthern part of Chandigarh showed contamination in over a third of the total samples due to open defecation. This studywas undertaken over a period of two years (between 2002-2004, samples were taken from 133 handpumps and 107 taps)5.
3.2.4 Parameters: Land use patternThe total area of Chandigarh Union Territory is 114 sq km. Out of this about 79.44 sq km (70 % of the U.T.) belong to theurban area. The urban area has been categorized into seven categories. The residential area covers the maximum area whichis about 30.19 sq km. The major roads also cover a substation area which is about 15.89 sq km. Green cover is well spreadover the area of the city. Major institutions are planned in such a way that they occupy mostly the northern parts of the city.
The city has been divided into 56 sectors. Typically, each sector measures about 800 metres by 1200 metres, covering 250 acresof area. About 5000 to 25000 people stay or work in each sector. Every sector has a green strip oriented longitudinally. Thestrip is located centrally and used for sports and walk only. Heavy vehicles are not at all allowed in these green strips (see Map:Land use pattern).
In the master plan, ample area has been allotted for parks. The total area under horticulture is 3573 acres. The major parksare Leisure Valley, Rajendra park, Bougainvillea Park, Zakir Rose Garden, Shanti Kunj, Hibiscus Garden, Garden of Fragrance,Botanical Garden, Smriti Upavan, Topiary garden and Terraced Garden. The major institutions are located in sectors 10, 11,12, 14 which are at the north of the city and sector 26 which is to the south of the city and 12.19 sq km has been allocatedfor institutional areas.
3.3 PLANNING FOR RAINWATER HARVESTING IN CHANDIGARH
3.3.1 Rainwater harvesting potentialThe rainwater harvesting potential of Chandigarh, with an area of 114 sq km, assuming a co-efficient of 50%, and the averageannual rainfall of 1059.3 mm is 60380.1 million litres or 13241.25 MG or 36.28 MGD. This is more than the water pumpedout of aquifers and therefore, harvesting and recharging rainwater will go a long way in contributing towards sustainabilityof water supply.
3.3.2 Catchment areas for rainwater harvestingThe Administration is tapping the deep aquifers for groundwater from all sectors in the city. Therefore, rainwater harvesting
Residential38%
Commercial5%
Industrial7%
Public & Semi Public10% Recreational
7%Major roads
20%
Miscellaneous13%
Source: State of Environment, Chandigarh, 2008
GRAPH: LAND USE PATTERN OF URBAN AREA
01 Chandigarh Final.qxd:Layout 1 6/22/10 2:10 PM Page 23

24
CENTRE FOR SCIENCE AND ENVIRONMENT
can be undertaken to recharge the deep aquifers in the city. In order to do this, the sandy layers in the deep aquifers must beidentified and recharge undertaken.
The areas suitable for rainwater harvesting are as follows:1. Roads and roundabouts: Recharge along storm water drains to both recharge rainwater as well as prevent flooding.2. All green areas: Recharge where suitable and store where hydrogeology is not suitable. Stored water can be used for
horticulture. Ponds can be constructed to harvest and use rainwater as in Botanical Garden.3. Institutional areas such as Punjab University, Capitol complex: Recharge where suitable and store where hydrogeology
is not suitable. Stored water can be used for horticulture.
Source: Chandigarh Administration
MAP: LAND USE PATTERN
01 Chandigarh Final.qxd:Layout 1 6/22/10 2:10 PM Page 24
25
CAPTURING RAINWATER: A WAY TO AUGMENT CHANDIGARH’S WATER RESOURCES
4. Commercial areas: Store in underground tanks for non-potable use.5. Schools, colleges and religious places: Storage and recharge. Stored water can be used for horticulture and other non-
potable uses.6. Industrial areas and airport: Water from rooftop catchments to be stored that can be used for industrial purposes.
Overflow of rooftop water can be recharged. Water from rooftops and hangars to be harvested in storage tanks to be usedfor non-potable purposes
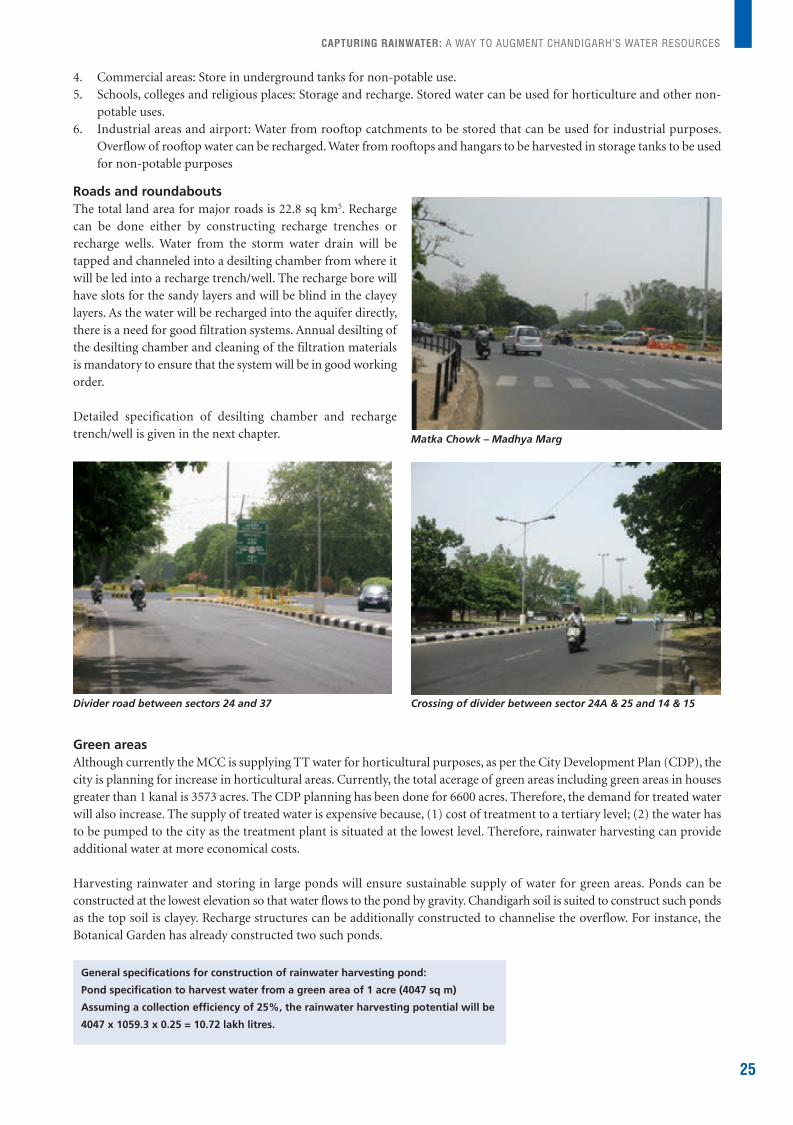
Roads and roundaboutsThe total land area for major roads is 22.8 sq km5. Rechargecan be done either by constructing recharge trenches orrecharge wells. Water from the storm water drain will betapped and channeled into a desilting chamber from where itwill be led into a recharge trench/well. The recharge bore willhave slots for the sandy layers and will be blind in the clayeylayers. As the water will be recharged into the aquifer directly,there is a need for good filtration systems. Annual desilting ofthe desilting chamber and cleaning of the filtration materialsis mandatory to ensure that the system will be in good workingorder.
Detailed specification of desilting chamber and rechargetrench/well is given in the next chapter.
Green areasAlthough currently the MCC is supplying TT water for horticultural purposes, as per the City Development Plan (CDP), thecity is planning for increase in horticultural areas. Currently, the total acerage of green areas including green areas in housesgreater than 1 kanal is 3573 acres. The CDP planning has been done for 6600 acres. Therefore, the demand for treated waterwill also increase. The supply of treated water is expensive because, (1) cost of treatment to a tertiary level; (2) the water hasto be pumped to the city as the treatment plant is situated at the lowest level. Therefore, rainwater harvesting can provideadditional water at more economical costs.
Harvesting rainwater and storing in large ponds will ensure sustainable supply of water for green areas. Ponds can beconstructed at the lowest elevation so that water flows to the pond by gravity. Chandigarh soil is suited to construct such pondsas the top soil is clayey. Recharge structures can be additionally constructed to channelise the overflow. For instance, theBotanical Garden has already constructed two such ponds.
Divider road between sectors 24 and 37 Crossing of divider between sector 24A & 25 and 14 & 15
Matka Chowk – Madhya Marg
General specifications for construction of rainwater harvesting pond:
Pond specification to harvest water from a green area of 1 acre (4047 sq m)
Assuming a collection efficiency of 25%, the rainwater harvesting potential will be
4047 x 1059.3 x 0.25 = 10.72 lakh litres.
01 Chandigarh Final.qxd:Layout 1 6/22/10 2:10 PM Page 25

26
CENTRE FOR SCIENCE AND ENVIRONMENT
To hold this water, a pond measuring 25 m x 11 m and a depth of 4 m canbe built, that will have a capacity of 11 lakh litres. The sides of the wallscan be strengthened by planting indigenous varieties of plants such asVetiver, Apluda etc that will serve to hold the soil as well as help inarresting silt. Native species can also be planted in the channels leadingto the pond to arrest silt.
Institutional areasIn the institutional areas, both storage and recharge can be undertakenbecause of the availability of large rooftop areas as well as paved andunpaved areas. Over or underground tanks can be constructed whererooftop water can be directed, filtered and stored. These can be used fornon-potable purposes. Overflow of the water can be channelised intorecharge structures. Recharge structures will be undertaken based on thenature of the aquifer geometry as per borehole logs.
Substantial water can be collected from large institutional buildings. Forinstance, the roof area of the Assembly building has an approximate roofarea of 350 sq m. From this about 3 lakh litres can be harvested annually.Similarly, the High Court building in Sector 1 has an approximate roofarea of 3600 sq m and approximately 30 lakh litres can be harvestedannually. As there are large open spaces available around such publicbuildings, it would be feasible to construct underground tanks of a minimum capacity of 1 lakh litres to use for non-potableuse.
Details of specification for construction of storage tank is given in Annexure II.
Commercial areasCommercial areas in the city are planned in such a way that there are large spaces in front of the buildings that are used forparking. The rooftops of the commercial areas can be used to harvest a good amount of water. Large tanks of a minimumof 1 lakh litre capacity can be constructed in front of the commercial spaces under the parking areas as described above.This water can be used for non-potable purposes. The total commercial space as per land use records is 3.97 sq km.
A MASSIVE PARK, FED ENTIRELY BYRAINWATER
Five years ago, the Maharashtra Nature Park,
near Dharavi, used to run up an annual
municipal water bill of about Rs 3.5 lakh. Today,
the park never pays more than Rs 4,000 a year. It
has stopped using civic water entirely, except for
1,000 litres a day used for drinking. The total
area of the park is 37 acres and the park needs
about 1 crore litres of water every year.
Rainwater is harvested also from the roof and
paved area of the office building. The storage
capacity of the pond is 2.25 crore litres, with an
allowance of seepage of 15 lakh litres, 20-25 lakh
litres for evaporation and dead stock of 30-40
lakh litres. The overflow from the pond is
diverted to the Mithi river.
Hindustan Times, Mumbai, June 05, 2010
FIGURE: COMMERCIAL CENTRE, SECTOR 24
Example: Sector 24
Total commercial area = 30000 sq m5% of total area as rooftop area = 1500 sq mRWH potential = 12.71 lakh litres
DesiltingChamber
Storagetank
Source: CSE
01 Chandigarh Final.qxd:Layout 1 6/22/10 2:10 PM Page 26

27
CAPTURING RAINWATER: A WAY TO AUGMENT CHANDIGARH’S WATER RESOURCES
Schools, colleges and religious placesSchools and colleges have large rooftop areas from where it is easy to harvest rainwater and store it for non-potable use.Large tanks of a minimum of 1 lakh litre capacity can be constructed for non-potable use. The overflow can be used torecharge groundwater. Water from paved and unpaved areas can also be used for recharging.
Industrial areas and airportHere, rooftop areas can be used for harvesting water that can be either stored or recharged.
3.3.3 Storage and recharge options Rainwater harvesting can be done either by storing the harvested rainwater or by recharging the aquifer. In Chandigarh,rainwater harvesting is constrained by the following factors:
• Hydrogeological profile consists of layers of clay and sand in different thicknesses. This layered sequence compels findingthe intervening sand lenses for recharge. The MCC is using only water from deep, confined aquifers, which do not getrecharged naturally.
• The MCC is not using the shallow unconfined aquifer. As there is a steep incline from northern to southern sectors, theshallow unconfined aquifer in the southern sectors get recharged naturally and there is water logging in the monsoon seasonin these areas. Therefore, rainwater harvesting by recharge to the shallow aquifer cannot be undertaken. Rainwater harvestingby recharge can only be undertaken to the deep, confined aquifers.
• In terms of storage, as the number of rainy days are only 49 days, it is not possible to collect rainwater in storage systemsthat can be used for a longer period.
Where can you do storage and where recharge ?
Recharge: Recharge to deep aquifers can be undertaken in a number of areas across the city – from roads to green areas toairports. The storm water drain network is the most suitable for this purpose, as rainwater from the entire city is tapped forrecharge.
Storage: Storage in underground or over the ground tanks can be undertaken in the commercial areas, institutional areaslike schools, colleges and other institutions, which have large roof areas. Storage can also be undertaken in green areas ofChandigarh by constructing ponds and larger water bodies. The soil is also suitable to create such water bodies. There arealready such rainwater harvesting ponds in some of the green areas and more such bodies can be created and the water canbe used for horticulture.
01 Chandigarh Final.qxd:Layout 1 6/22/10 2:10 PM Page 27

28
4. Planning for rainwater harvesting using storm water drains
4.1 STORM WATER DRAIN NETWORK OF CHANDIGARH
The storm water drains in the city are connected to the Sukhna choe and the N-choe. The tail ends of the drains have beenconstructed along the choe. The total length of the storm water sewer and its branch water sewer has been estimated to be720 km.
MAP: STORM WATER DRAINAGE SYSTEM
Source: Chandigarh Administration
01 Chandigarh Final.qxd:Layout 1 6/22/10 2:10 PM Page 28

29
CAPTURING RAINWATER: A WAY TO AUGMENT CHANDIGARH’S WATER RESOURCES
4.2 WHY RAINWATER HARVESTING THROUGH STORM WATER DRAIN NETWORK?
Chandigarh has a well laid out system of storm water drain network that is covered. Therefore, unlike other cities, there isvery little pollution of storm water drains. In recent years, this network has been strengthened and augmented. More than70% of the rain that falls on Chandigarh goes into the storm water drains.
Residential areas – 38%Roads – 20%Public and institutional buildings – 10%Commercial area – 5%
Therefore, storm water drains can be tapped to capture a major portion of the rain that falls on the city. Recharge of waterfrom the storm water drains will not only tackle the groundwater decline but also solve the flooding problems in the area.
4.3 METHODOLOGY OF RAINWATER HARVESTING IN THE STORM WATER DRAIN NETWORK
Recharge structures can be constructed along the roads and roundabouts to tap the water flowing in the storm water drains.The structures must be constructed in a way that they reach the sandy layers of deep aquifers.
4.4 STRUCTURE OF A TYPICAL RECHARGE SYSTEM
A typical recharge system will consist of a desilting chamber and a recharge well/trench.
4.3.1 Desilting chamberThe desilting chamber will be 1 m long, 1 m wide and 1 m deep in size. This is provided to arrest silt as the drain also carriessurface runoff from the surrounding areas. A baffle wall can be constructed in the storm drain to check the flow of the water
and then diverted into desilting chamber. It is divided into twohalves by constructing a baffle wall in the middle across thelength. The first half of the desilting chamber will reduce thevelocity of water and ensure the settling down of the silt andsuspended materials in first chamber. After being filtered throughthis layer, water will pass into the recharge well or trench where itwill undergo further filtration.
The second half of the desilting chamber has filtering materialsfilled up to half the depth of the tank, which is 1 m. There will bethree layers of filtration materials – sand, pebble and gravel, eachlayer measuring 15 cm. The top layer of sand will be covered witha thin layer (5cm) of pebble to prevent scouring of sand. At thebottom of this portion of the chamber (0.4 m from the base)there will a slotted pipe (6 inches diameter) that will collect thefiltered water and take it into recharge well.
The desilting chamber will also be provided with an arrangement for draining off the water standing in settlement tank afterrains. For this purpose, a pipe fitted with tap or valve should be provided at the bottom of the chamber.
4.3.2 Recharge well with desilting chamberThe recharge well is 1.5 m x 1 m x 2 m in size. The well is constructed with brickwork and has a recharge bore of 150 mmdiameter and a minimum depth of 60 m. However, the actual depth of the bore will depend on the soil profile of that area.The recharge bore will be drilled with mechanical bore set (down the hole (DTH) rig) and PVC pipe will be used as casing onlyin the upper portion where loose soil and other collapsible strata is found. A length of 0.6 m casing pipe in the recharge wellwill be slotted which will facilitate the movement of filtered water into the recharge well and later to the subsoil strata. The slotswill be of 15-20 mm diameter and will be closely wrapped with jute coir of diameter 20 mm. This will prevent the direct entryof fine silt into the recharge bore. The pipe passes through both permeable and impermeable layers of the deeper aquifers. The recharge bore is slotted in the sandy layers and blind where there are clayey layers. The exact depth where the slots willbe made will be based on the data from the borehole log that will show where the sandy layers occur.
FIGURE: CROSS SECTION OF A TYPICALDESILTING CHAMBER
Source: CSE
01 Chandigarh Final.qxd:Layout 1 6/22/10 2:10 PM Page 29

30
CENTRE FOR SCIENCE AND ENVIRONMENT
4.3.3 Recharge trench with desilting chamber
The collected rainwater from the drain is first diverted into a desilting chamber first as described above. The recharge trenchis 5 m x 1 m x 2 m in size. The trench is constructed with brickwork and has a recharge bore of 150 mm diameter. Each trenchwill contain recharge bores.
The recharge bores will be made as per specifications described above.
FIGURE: CROSS SECTION OF RECHARGE WELL WITH DESILTING CHAMBER
FIGURE: CROSS SECTION OF RECHARGE TRENCH WITH DESILTING CHAMBER
Source: CSE
Source: CSE
01 Chandigarh Final.qxd:Layout 1 6/22/10 2:10 PM Page 30

31
CAPTURING RAINWATER: A WAY TO AUGMENT CHANDIGARH’S WATER RESOURCES
4.4 LOCATION OF STRUCTURES
The periphery of a typical sector measures 1200 m x 800 m. Storm water drains run on either three or all four sides of thesector. Recharge structures can be built at intervals of 50 m.
4.4.1 No of recharge wells around atypical sector
Length of the sector = 1200 m Length of desilting chamber = 1 mLength of recharge well = 1.5 mIntervening space = 0.5 mTotal length of structure = 3 mDistance between two structures = 50 m
No of possible structures along the length ofa sector = 22 rounded to 20
Width of the sector = 800 mLength of desilting chamber = 1 mLength of recharge well = 1.5 mIntervening space = 0.5 mTotal length of structure = 3 mDistance between two structures = 50 mNo of possible structures along the width of a sector = 15
Possible number of recharge wells on atypical sector with storm water drain pipeson 3 sides = 55 Possible number of recharge wells on atypical sector with storm water drain pipes on 4 sides = 70
No of recharge trenches around a typical sectorThe length of a trench is 5 m and the length of a desilting chamber is 1 m. Allowance for distance between desilting chamberand recharge trench is 1m. Total of 7 m
No of possible structures along the length of a sector = 20 rounded to 18No of possible structures along the width of a sector = 14
Possible number of recharge trench on a typical sector with storm water drain pipes on 3 sides = 50 Possible number of recharge wells on a typical sector with storm water drain pipes on 4 sides = 64
FIGURE: SITING OF RECHARGE STRUCTURES IN SECTOR 20
Recharge trench with desilting chamber
Recharge well with desilting chamber
15 r
ech
arg
e w
ells
or
14 r
ech
arg
e tr
ench
es
20 recharge wells or 18 recharge trenches
Distance between 2 structures = 50 m
Source: CSE
01 Chandigarh Final.qxd:Layout 1 6/22/10 2:10 PM Page 31

32
5. Costing of structures
5.1 COST OF A TYPICAL RECHARGE WELL WITH DESILTING CHAMBER
Costing has based on Delhi schedule rates.
Desilting chamber (Dimensions: 1 m x 1 m x 1 m)
Recharge well: (Dimensions: 1.5 m x 1 m x 2 m)
Total cost of 1 recharge well with desilting chamber = Rs. 40437 or 40500/=
Item of work Quantity Unit Rate (Rs) Amount (Rs)
Excavation 4.99 Cu m 90 449
PCC 0.10 Cu m 2700 279
Brick lining including baffle wall 1.3455 Cu m 1650 2220
RCC slab/metal grill 0.21 L.S. 4700 1002
Pebbles L.S. 500
Total cost 4451
TABLE: COST OF A DESILTING CHAMBER
Item of work Quantity Unit Rate (Rs) Amount (Rs)
Excavation 11.09 Cu.m 90 998
PCC 0.12 Cu m 2700 311
Brick work 2.65 Cu.m 1650 4364
100 mm thick RCC slab (1:2:4) 0.29 Cu m 4700 1345
Drilling (6 inch bore using hand bore set) 60 M 250 15000
6 inch PVC casing pipe 60 M 230 13800
Brickbats pebbles, sand and coir packing L.S. 2500
Total cost 38318
TABLE: COST OF A RECHARGE WELL
01 Chandigarh Final.qxd:Layout 1 6/22/10 2:10 PM Page 32

33
CAPTURING RAINWATER: A WAY TO AUGMENT CHANDIGARH’S WATER RESOURCES
5.2 COST OF TYPICAL RECHARGE TRENCH WITH DESILTING TANK
Desilting chamber (Dimensions: 1 m x 1 m x 1 m)
Recharge trench: (Dimensions: 5 m x 1 m x 2 m)
Total cost of a recharge trench with desilting chamber = Rs. 53135
5.3 COSTS FOR RECHARGE STRUCTURES FOR A TYPICAL SECTOR
If we take an average of Rs. 25 lakh for a sector, the total cost for 56 sectors would be Rs. 1400 lakh (14 crore). The annualmaintenance cost arises only from cleaning of the desilting and cleaning of filter materials.
Item of work Quantity Unit Rate (Rs) Amount (Rs)
Excavation 26.87 Cu.m 90 2418
PCC 0.28 Cu m 2700 745
Brick work 6.35 Cu.m 1650 10474
100 mm thick RCC slab (1:2:4) 0.80 Cu m 4700 3747
Drilling 6 inch bore using hand bore set for 3 recharge bores 60 M 250 15000
6 inch PVC casing pipe 60 M 230 13800
Brickbats pebbles, sand and coir packing L.S. 2500
Total cost 48684
TABLE: COST OF A RECHARGE TRENCH
Item of work Quantity Unit Rate (Rs) Amount (Rs)
Excavation 4.99 Cu m 90 449
PCC 0.10 Cu m 2700 279
Brick lining including baffle wall 1.3455 Cu m 1650 2220
RCC slab/metal grill 0.21 L.S. 4700 1002
Pebbles L.S. 500
Total cost 4451
TABLE: COST OF A DESILTING CHAMBER
No of Cost of No of recharge Cost of recharge recharge wells recharge wells (Rs) trenches trenches (Rs)
Typical sector with drainpipes on 3 sides 55 55 x 40500 = 22,27,500 50 50 x 53135 = 25,56,750
Typical sector with drainpipes on 4 sides 70 70 x 40500 = 28,35,000 64 64 x 53135 = 34,00640
TABLE: COSTS FOR RECHARGE STRUCTURES FOR A TYPICAL SECTOR
01 Chandigarh Final.qxd:Layout 1 6/22/10 2:10 PM Page 33

34
CENTRE FOR SCIENCE AND ENVIRONMENT
5.3.1 Impact of rainwater harvesting
The stormwater network collects water from the roads (15.89 sq. km), from rooftops of residential areas, (30.19 sq.km)from shopping areas (3.97 sq. km), public and institutional buildings (7.94 sq. km). This amounts to more than 70% ofthe total land area. The total quantum of water that would be available for recharge annually would be
58 sq km (area) x 1059.3 (rainfall) x 0.5 (rainfall coefficient) = 30720 million litres.(18.46MGD)
This is equivalent to almost 90% of the total groundwater supply and this is available only from tapping the stormwaterdrain network. By careful planning of recharge in the parks and green areas of the city, it would be possible to recharge theentire groundwater the city takes out.
01 Chandigarh Final.qxd:Layout 1 6/22/10 2:10 PM Page 34

35
6. Water for all: today and tomorrow
Against the background of the envisaged economic growth and the resulting population growth, the water needs ofChandigarh will grow at an explosive rate. But water availability will not grow in parallel leading to water stress and resultantconflicts. There is a need to put in place a number of measures to create awareness among the people about the importanceof water and incentivise them to use water carefully and wisely. These will include policy measures (legal, financial), research,capacity building and education measures. Water conservation measures include: (a) Rainwater harvesting; (b) Recycle andreuse of water; and, (c) Reducing water use.
6.1 TOWARDS A WATER-SMART CITY: INSTITUTIONAL MEASURES
Step 1: Create a central authority to coordinate all water conservation and augmentation measures (Rainwater Harvestingor Water Conservation Cell).
Step 2: Define clear and definite short-term and long-term measures and targets, identify funding sources and secure adequatefunding. Bulk users and institutional buildings must be targeted first.
Short-term measures: These include legal, administrative and financial measures on the one hand, and awareness creationand capacity building on the other. They go hand in hand and must be initiated together.
Long-term measures: A focussed programme to encourage research on such issues as hydrogeological and rainfall mapping,filters, technological tools must be instituted. Detailed maps of each zone can be created for recharge zones, flood-proneareas, water quality and water bodies that can be revived etc. Detailed studies can be initiated using GIS, satellite imageries.
6.1.1 Rainwater harvestingRain Centre: The first step to encourage rainwater harvesting in the city is to create a Rain Centre that will serve as a centralrepository of information on all aspects related to rainwater harvesting. The Rain Centre will have posters, models, andtraining facilities. It will be staffed with technical experts to provide technical help to common people. The Rain Centre willalso serve as a centre for providing training and capacity building to a cross-section of people from masons and plumbersto consultants and architects.
The Rain Centre will be responsible for regularly conducting awareness creation activities on the need for water conservationand ways of doing it. This can be in the form of posters, exhibitions, events on special days such as World Water Day etc,competitions, quiz programmes, media campaigns, etc. The target groups will be residents Welfare Associations, schoolchildren, industries, institutions etc.
The Rain Centre will also prepare and make available a database of implementers (plumbers, masons, contractors, architects,consultants), a database of best practices, information on techniques and costs etc.
Legal, administrative and fiscal measures: the Administration has taken the first step of making rainwater harvestingmandatory for houses of more than 1 kanal area. The notification only mentions “recharge” and this should be expanded toinclude storage options. Other mandatory measures must include the use of water efficient fixtures such as low flush toilets,water efficient fixtures etc. Pricing of water is a key instrument to ensure that consumers use water carefully. Measures toincentivise and motivate people include awards, reduction in water bills, rebate on property tax, quick passing of buildingplans etc.
A key system that must be set up will be an Inspection and Maintenance programme to ensure that all rainwater harvestingsystems are kept in good order. A systematic programme to regularly clean and maintain the systems must be put in place.
01 Chandigarh Final.qxd:Layout 1 6/22/10 2:10 PM Page 35
Before exhorting the public to use water wisely, the Administration must lead by example by instituting measures for wiseuse of water in its own buildings. Rainwater harvesting must be implemented in all government buildings and public spacessuch as parks, stadia etc. As Chandigarh’s soil is suitable for constructing water bodies, the MCC must plan for water bodiesin green areas and particularly in the southwestern sectors, where there is water logging. Public and commercial buildingsmust be made to implement water conservation measures in a targeted manner.
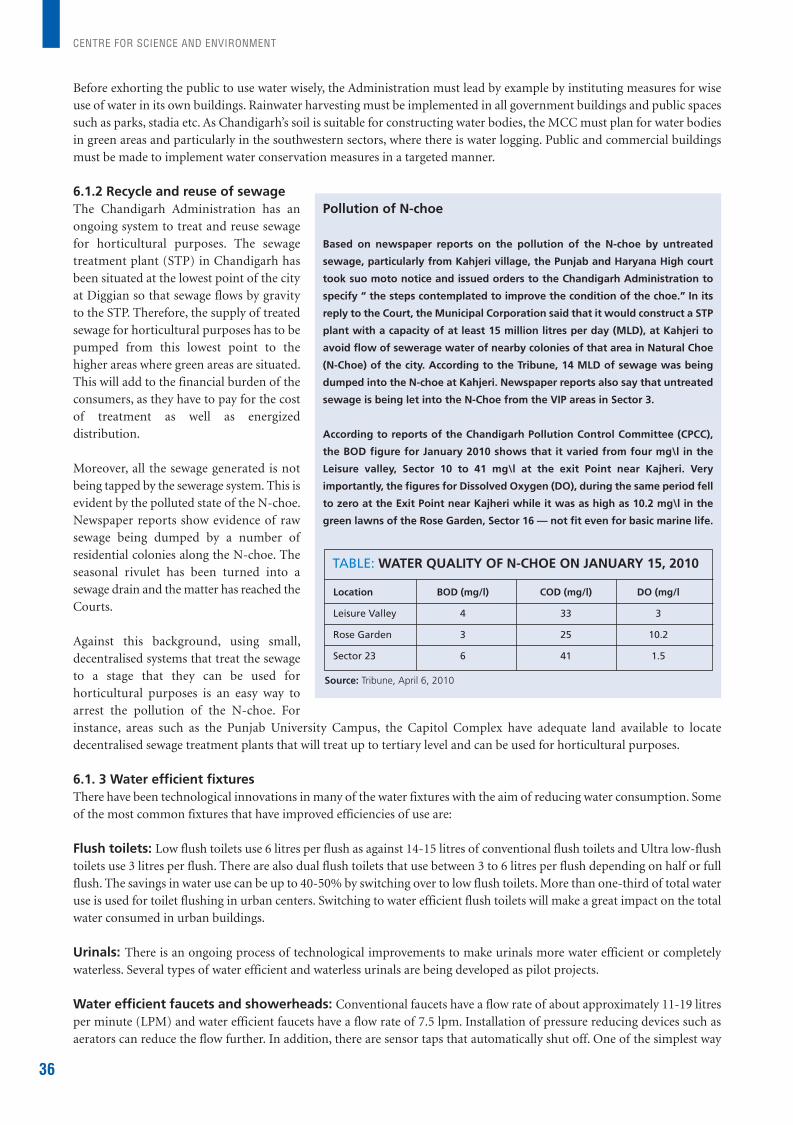
6.1.2 Recycle and reuse of sewageThe Chandigarh Administration has anongoing system to treat and reuse sewagefor horticultural purposes. The sewagetreatment plant (STP) in Chandigarh hasbeen situated at the lowest point of the cityat Diggian so that sewage flows by gravityto the STP. Therefore, the supply of treatedsewage for horticultural purposes has to bepumped from this lowest point to thehigher areas where green areas are situated.This will add to the financial burden of theconsumers, as they have to pay for the costof treatment as well as energizeddistribution.
Moreover, all the sewage generated is notbeing tapped by the sewerage system. This isevident by the polluted state of the N-choe.Newspaper reports show evidence of rawsewage being dumped by a number ofresidential colonies along the N-choe. Theseasonal rivulet has been turned into asewage drain and the matter has reached theCourts.
Against this background, using small,decentralised systems that treat the sewageto a stage that they can be used forhorticultural purposes is an easy way toarrest the pollution of the N-choe. Forinstance, areas such as the Punjab University Campus, the Capitol Complex have adequate land available to locatedecentralised sewage treatment plants that will treat up to tertiary level and can be used for horticultural purposes.
6.1. 3 Water efficient fixturesThere have been technological innovations in many of the water fixtures with the aim of reducing water consumption. Someof the most common fixtures that have improved efficiencies of use are:
Flush toilets: Low flush toilets use 6 litres per flush as against 14-15 litres of conventional flush toilets and Ultra low-flushtoilets use 3 litres per flush. There are also dual flush toilets that use between 3 to 6 litres per flush depending on half or fullflush. The savings in water use can be up to 40-50% by switching over to low flush toilets. More than one-third of total wateruse is used for toilet flushing in urban centers. Switching to water efficient flush toilets will make a great impact on the totalwater consumed in urban buildings.
Urinals: There is an ongoing process of technological improvements to make urinals more water efficient or completelywaterless. Several types of water efficient and waterless urinals are being developed as pilot projects.
Water efficient faucets and showerheads: Conventional faucets have a flow rate of about approximately 11-19 litresper minute (LPM) and water efficient faucets have a flow rate of 7.5 lpm. Installation of pressure reducing devices such asaerators can reduce the flow further. In addition, there are sensor taps that automatically shut off. One of the simplest way
CENTRE FOR SCIENCE AND ENVIRONMENT
36
Pollution of N-choe
Based on newspaper reports on the pollution of the N-choe by untreated
sewage, particularly from Kahjeri village, the Punjab and Haryana High court
took suo moto notice and issued orders to the Chandigarh Administration to
specify “ the steps contemplated to improve the condition of the choe.” In its
reply to the Court, the Municipal Corporation said that it would construct a STP
plant with a capacity of at least 15 million litres per day (MLD), at Kahjeri to
avoid flow of sewerage water of nearby colonies of that area in Natural Choe
(N-Choe) of the city. According to the Tribune, 14 MLD of sewage was being
dumped into the N-choe at Kahjeri. Newspaper reports also say that untreated
sewage is being let into the N-Choe from the VIP areas in Sector 3.
According to reports of the Chandigarh Pollution Control Committee (CPCC),
the BOD figure for January 2010 shows that it varied from four mg\l in the
Leisure valley, Sector 10 to 41 mg\l at the exit Point near Kajheri. Very
importantly, the figures for Dissolved Oxygen (DO), during the same period fell
to zero at the Exit Point near Kajheri while it was as high as 10.2 mg\l in the
green lawns of the Rose Garden, Sector 16 — not fit even for basic marine life.
Location BOD (mg/l) COD (mg/l) DO (mg/l
Leisure Valley 4 33 3
Rose Garden 3 25 10.2
Sector 23 6 41 1.5
TABLE: WATER QUALITY OF N-CHOE ON JANUARY 15, 2010
Source: Tribune, April 6, 2010
01 Chandigarh Final.qxd:Layout 1 6/22/10 2:10 PM Page 36

to improve efficiency is to switch from compression types faucets which require you to turn the faucet to open or close thetaps to cartridge type faucets that require you to turn the handle in an up and down or lateral movement. There are also self-closing faucets which will automatically close after a set time to reduce the potential for taps to be left running too long ornot turned off. Today there are a variety of products available that can be attached to existing taps to reduce water flow.
Washing Machines: In general, front loading washing machines are much more water efficient than top-loading machines.
Incentives and disincentives: The Administration must have a phased programnme to replace old flush toilets andfaucets with new low-flush toilets and water efficient taps. This must be phased in through rebates in prices and water billsand at then made mandatory. To begin with public institutional buildings and large commercial buildings such as mallsmust be targeted.
Currently the Ministry of Urban development is undertaking a study to initiate a programme of labelling of water efficientfixtures similar to the star rating system for electrical appliances. This will greatly help in motivating consumers to switchover to the use of water efficient fixtures.
CAPTURING RAINWATER: A WAY TO AUGMENT CHANDIGARH’S WATER RESOURCES
37
01 Chandigarh Final.qxd:Layout 1 6/22/10 2:10 PM Page 37

38
7. Annexures
ANNEX 1: Soil profiles of few representative sectors
Source: Chandigarh Administration
01 Chandigarh Final.qxd:Layout 1 6/22/10 2:10 PM Page 38
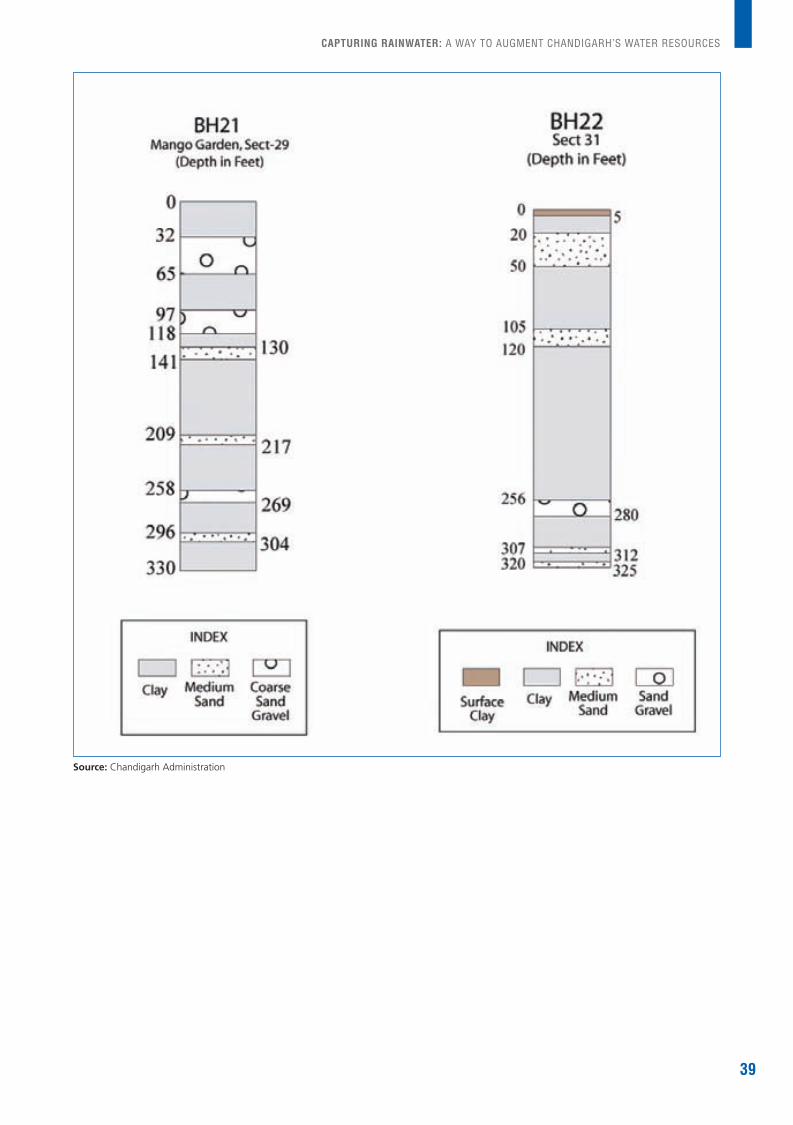
39
CAPTURING RAINWATER: A WAY TO AUGMENT CHANDIGARH’S WATER RESOURCES
Source: Chandigarh Administration
01 Chandigarh Final.qxd:Layout 1 6/22/10 2:10 PM Page 39

40
CENTRE FOR SCIENCE AND ENVIRONMENT
ANNEX 2: Construction of brick masonry storage tank
The rainwater from the rainwater pipes is collected in series of collection chambers and using the polyvinyl chloride (PVC)pipes diverted into a filtering tank. The filtering tank will be of 1 m x 1 m x 1m in size, with unpaved bottom. This will behalf filled with filtering material like pebbles. This will ensure the settling down of the silt and other suspended materials.The filtered water will be diverted into the tank. A diversion valve of suitable size should be fitted on the down take pipe forflushing the impurities coming down with initial spell of rainfall.
The tank is constructed as any other normal underground tank. The tank will be covered with a reinforced concrete cement(RCC) slab of 150 mm. Two pillars of 60 cm x 60 cm (with plinth foundation) can be provided across the length of tank forproper support of the roof. The slab will also have 2 manholes for cleaning and maintenance purpose. The tank will beprovided cement & sand plaster with neat cement punning on all inner walls. All inlet pipes and over flow pipes will becovered with fine mosquito nets to avoid entry of insects inside the tank. The tank will also be provided with 2 air vents,covered with fine mosquito nets. The tank will be provided with a pump to lift the water into overhead tank. The tank willbe of 1 lakh litres capacity. The water stored in this tank could be used for flushing the toilets and other purposes.
FIGURE: FILTERING TANK
Source: CSE
01 Chandigarh Final.qxd:Layout 1 6/22/10 2:10 PM Page 40

41
CAPTURING RAINWATER: A WAY TO AUGMENT CHANDIGARH’S WATER RESOURCES
ANNEX 3: Groundwater levels
MAY NOVEMBER
15
16
17
18
19
20
21
22
23
1998 2000 2002 2004
YEAR
Gro
un
dw
ate
r le
ve
l (m
bg
l)
15
17
19
21
23
25
27
29
31
1998 2000 2002 2004 2006
YEAR
MAY NOVEMBERG
rou
nd
wa
ter
lev
el
(mb
gl)
8
10
12
14
16
18
20
1998 2000 2002 2004 2006
YEAR
Gro
un
dw
ate
r le
ve
l (m
bg
l)
MAY NOVEMBER
12
12.5
13
13.5
14
14.5
1999 2000 2001 2002
YEAR
Gro
un
dw
ate
r le
ve
l (m
bg
l)
MAY NOVEMBER
10
12
14
16
18
20
22
2000 2002 2004 2006
YEAR
Gro
un
dw
ate
r le
ve
l (m
bg
l)
MAY NOVEMBER
SEC 39 DApproximately 4 m fall in the groundwater level of deep aquifer
SEC 37 DApproximately 8 m fall in the groundwater level of deep aquifer
SEC 31 DApproximately 2 m fall in the pre monsoon (May) groundwater
level of deep aquifer
SEC 10 DApproximately 5 m fall groundwater level of deep confined aquifer
SEC 12 DApproximately 6 m fall in the groundwater level of deep aquifer
GRAPH: GROUNDWATER LEVELS IN DEEP AQUIFERS
Source: National Data Centre, CGWB, Faridabad
01 Chandigarh Final.qxd:Layout 1 6/22/10 2:10 PM Page 41

42
CENTRE FOR SCIENCE AND ENVIRONMENT
MAY NOVEMBER
YEAR
Gro
un
dw
ate
r le
ve
l (m
bg
l)
SEC 10 CApproximately 2 m fall in the groundwater level of shallow aquifer
12
12.5
13
13.5
14
14.5
15
15.5
16
16.5
2000 2001 2002 2003 2004 2005
Gro
un
dw
ate
r le
ve
l (m
bg
l)
MAY NOVEMBER
SEC 37 DApproximately 1 m fall in the groundwater level of shallow aquifer.
3
3.2
3.4
3.6
3.8
4
4.2
4.4
4.6
1998 2000 2002 2004 2006
GRAPH: GROUNDWATER LEVELS IN SHALLOW AQUIFERS
YEAR
MAY NOVEMBER
Gro
un
dw
ate
r le
ve
l (m
bg
l)
SEC 39 DApproximately 0.1 m rise in the pre monsoon (May) groundwater
level of shallow aquifer
2.5
2.7
2.9
3.1
3.3
3.5
3.7
3.9
2002 2003 2004 2005 2006
RISE IN GROUNDWATER LEVEL IN SHALLOW AQUIFER
Source: National Data Centre, CGWB, Faridabad
01 Chandigarh Final.qxd:Layout 1 6/22/10 2:10 PM Page 42

43
8. References
1. Statistical abstract, Website of Chandigarh Administration.
2. Kandpal, G.C., John, B. and Joshi, K.C. 2009. Geotechnical Studies in Relation to Seismic Microzonation of UnionTerritory of Chandigarh.J. Ind. Geophys. Union. Vol.13, No.2, pp.75-83.
3. Ground water information booklet, Chandigarh (U.T.), 2007.
4. State of Environment, Chandigarh, 2008.
5. Goel, N.K., Bhatnagar, T., Sharma, M.K., Verma, A., Agarwal, N., Chander, J., Gupta, V. and Swami, H.M. 2007.Surveillance of Quality of Drinking Water. Bahrain Medical Bulletin, Vol. 29, No. 2.
Other references:
� Dharmaju, R., Ramakrishna, WGST., Karthigeyan, S. and Devi G. 2008. Liquefication potential of Chandigarh city—aconventional approach. 12th International conference on International Association for computer methods and advancesin Geomechanics (IACMAG). pp 2804-2810.
� State of Environment, Chandigarh, 2004.
� Singh, Y. Siltation problems in sukhna lake in Chandigarh, nw india and comments on geohydrogical changes in theYamuna-Satluj region.
� Gupta, S. Groundwater management in alluvial areas.
� Malik, J. and Nakata, T. 2003. Preliminary observations from a trench near Chandigarh, NW Himalaya and their bearingon active faulting. Curr. Sc. v. 85, pp. 1793-1798.
01 Chandigarh Final.qxd:Layout 1 6/22/10 2:10 PM Page 43
Centre for Science and Environment41, Tughlakabad Institutional Area, New Delhi 110 062 Ph: 91-11-2995 6110 / 5124 / 6394 / 6399 Fax: 91-11-29955879 E-mail: [email protected] Website: www.cseindia.org
CAPTURING RAINWATERA way to augment Chandigarh’s water resources
Centre for Science and Environment
01 Chandigarh COVER Final.qxd:Layout 1 6/22/10 2:25 PM Page 2