00717 01 1 36 - zignago vetro · elimination of intercompany sales (2.696) (714) not given total...
TRANSCRIPT
ZignagoVetroSpA
Consolidated Annual Report and AccountsFinancial Year 2006


Consolidated Annual Report and AccountsFinancial Year 2006
ZIGNAGO VETRO SpA
Registered office: Via Ita Marzotto, 8 – Fossalta di Portogruaro (VE) – Italy
Share capital: €8,000,000 fully paid in
Sole shareholder: Zignago Holding SpA
Tax Code and Venice Company Register no. 00717800247
1

Table of Contents
Corporate Bodies and Officers page 3
Group Structure page 5
Directors’ Report on Operations:
– The Group page 8
– The Company page 20
– Subsidiaries page 26
Proposed Resolutions for the Shareholders’ Meeting page 36
Balance Sheet page 38
Income Statement page 39
Statement of Cash Flows page 40
Statement of Changes in Shareholders’ Equity page 41
Notes to the Consolidated Financial Statements page 44
– Comments on the main balance sheet accounts page 60
– Comments on the main income statement accounts page 86
– Other information page 93
Report of the Independent Auditor on the ConsolidatedFinancial Statements page 100
2

Board of Directors Statutory Auditors’ Committeein office for period: 2005- 2007 in office for period: 2003 - 2005
Chairman and Chief Executive Officer Chairman
Franco Grisan Paolo Nicolai
Deputy Chairman Statutory Auditor
Nicolò Marzotto Andrea Dalla VecchiaCarlo Pesce
Directors
Giuseppe BreviariMarco Donà dalle RoseOvidio DriMaurizio GuseoMaurizio Pizzolotto
General Management
General Manager
Franco Grisan
Deputy General Manager and Technical Director
Ovidio Dri
Sales & marketing Director
Maurizio Guseo
Development Director
Roberto Moretto
Independent Auditorfor the financial year 2006
Reconta Ernst & Young SpA
3
CORPORATE BODIES AND OFFICERS


BUSINESSES AND EQUITY INVESTMENTS
ZIGNAGO VETRO SpA
PRODUCTION OF HOLLOW GLASS CONTAINERS
VERRERIES BROSSESAS
PRODUCTION OF GLASSBOTTLES FOR LUXURY
FRAGRANCES
BROSSE USA Inc.
DISTRIBUTION OF GLASSBOTTLES FOR LUXURY
FRAGRANCES
VETRI SPECIALI SpA
PRODUCTION OF SPECIALTY GLASS CONTAINERS
VETRI SPECIALI Inc.
DISTRIBUTION OFSPECIALTY GLASS
CONTAINERS
VETRI SPECIALIIBERICA SL
DISTRIBUTION OFSPECIALTY GLASS
CONTAINERS
100%
100% 100% 100%
43.50%
5
STRUCTURE OF ZIGNAGO VETRO GROUPAS AT 13 FEBRUARY 2007


Directors’ Report on Operationsand Consolidated Accounts
Financial Year 2006
7

To Our Shareholders,
Effective 31 December 2006, Zignago Vetro SpA waived the option envisaged in Article27 (3, 4, 5) of Italian legislative decree 127/91, deciding to submit the ConsolidatedFinancial Statements as at 31 December 2006 and 31 December 2005 and the Directors’Report on Operations.
The Consolidated Financial Statements as at 31 December 2006 and 31 December 2005were prepared in accordance with the IFRSs as issued by the International AccountingStandards Board and endorsed by the European Commission. The IFRSs were appliedto the assets and liabilities that satisfied the requirements for recognition at the 1 January2004 transition date, with the exception of IASs 32 and 39, which were appliedbeginning 1 January 2005.The Notes to the Consolidated Financial Statements include the information that isnormally required by applicable law and accounting principles, which is illustrated asappropriate in reference to the financial statement formats used. The ConsolidatedFinancial Statements as at 31 December 2006 and 31 December 2005 were alsoprepared for inclusion in the prospectus required as part of listing of the ordinary sharesof Zignago Vetro SpA on the Italian screen-based equity market Mercato TelematicoAzionario, STAR Segment, which is organized and managed by Borsa Italiana SpA.
For comparison of the financial figures as at 31 December 2006 and 31 December 2005,the scope of consolidation of the Zignago Vetro Group as at 31 December 2006 and 31December 2005 is as follows:
– Zignago Vetro S.p.A. (parent company)
– consolidated on a 100% line-by-line basis, on the financial statements as at 31December 2006 and 31 December 2005:
– Verreries Brosse SAS and its subsidiary:
– Brosse USA Inc.
– consolidated on a proportional line-by-line basis, for the 43.5% shareholding, onthe financial statements as at 31 December 2006:
– Vetri Speciali SpA and its subsidiaries:
– Vetri Speciali Inc.
– Vetri Speciali Iberica S.L.
In October 2004, the scope of consolidation changed when the parent company,Industrie Zignago Santa Margherita SpA (IZSM), completed a process of corporatereorganization by acquiring 43.5% of the capital of Vetri Speciali SpA, the parent
8
Directors’ Report on Operations and Consolidated Accounts
THE GROUP

company of three production companies (which were merged at the beginning of 2005)and two sales companies.
When it completed the aforementioned reorganization, IZSM sold the 43.5%shareholding in Vetri Speciali SpA to its subsidiary Zignago Vetro SpA on 30 June 2006,in addition to a call option on an additional share of the Company’s share capital andcertain related agreements. Since the transaction for sale of the shareholding in VetriSpeciali SpA by IZSM to Zignago Vetro SpA took place on the basis of continuity offinancial reporting, the income statement of Vetri Speciali SpA was consolidatedbeginning 1 January 2006, even though the shareholding was acquired on 30 June 2006.
The business areas in which Zignago Vetro SpA operates are organized into individualcompanies. Disclosure on operating performance by business segment and geographicalarea (segment reporting) is included in the illustration of the financial statement data foreach company and is an integral part of this report on operations.
The consolidation and measurement principles are illustrated on pages 44-59, togetherwith the shares of equity interest owned by Zignago Vetro Spa.
The figures illustrated in this Report on Operations and on the accompanying accountingstatements are expressed in thousands of euros (indicated hereinafter as € thousand).
Independent Auditor
The financial statements of Zignago Vetro SpA for the three-year period 2004-2005-2006 have been audited by the independent auditor RECONTA ERNST & YOUNGSpA. This firm was also retained to audit the consolidated financial statements as at 31December 2006 and 31 December 2005.
9
Directors’ Report on Operations and Consolidated Accounts

To Our Shareholders,
Net consolidated revenues achieved during the year that ended 31 December 2006totaled €209,427 thousand, including the change in the scope of consolidation resultingfrom acquisition of the new investment in Vetri Speciali SpA, as previously mentioned.Revenues totaled €155,303 thousand in the previous year.
The consumption of goods and services was significantly impacted by the increase inenergy costs. This item totaled €112,405 thousand at 31 December 2006, comparedwith €87,265 thousand the previous year, reflecting the change in the scope ofconsolidation. However, its ratio to the value of production contracted from 54.7%to 53.2%.
Consolidated value added as at 31 December 2006 was €98,883 thousand, comparedwith €72,126 thousand in the previous year. The change is not comparable due to thepreviously mentioned change in scope of consolidation. Its ratio to the value ofproduction rose from 45.3% to 46.8%.
Payroll & employee benefits during the financial year totaled €45,058 thousand,compared with €35,460 thousand in 2005. The increase is mainly attributable to thechange in the scope of consolidation following inclusion of Vetri Speciali SpA. A total of185 new employees are included in the scope of consolidation. To a lesser extent, thisgreater expense corresponds to the higher average unit cost of labor and the higher numberof hours worked. Its ratio to the value of production decreased from 22.3% to 21.3%.
Consolidated earnings before interest, taxes, depreciation, and amortization(EBITDA) as at 31 December 2006 totaled €53,825 thousand, compared with €36,666thousand in 2005 (which is not a comparable figure), representing 25.5% of the value ofproduction (23% as at 31 December 2005).
Consolidated earnings before interest and taxes (EBIT) for the year totaled €31,280thousand, representing 14.8% of the value of production, compared with €17,719thousand and 11.1% in the previous year (which is not a comparable figure).
Consolidated income before taxes totaled €27,689 thousand including costs connectedwith the process of listing Zignago Vetro SpA (€1,487 thousand), compared with€19,659 thousand in 2005, which had benefited from incidental income resulting fromthe release of a risk reserve by Zignago Vetro SpA for €1,549 thousand. It represents13.1% of the value of production, compared with 12.3% in the previous year (withcomparable figures that are standardized by the extraordinary effects of the release ofreserves in 2005 and the costs incurred in 2006 for the listing process of 13.8%,compared with 11.3% in 2005).
10
Directors’ Report on Operations and Consolidated Accounts

Group net consolidated income totals €15,415 thousand, compared with €11,853thousand for 2005.
Cash flow (net income + amortization and depreciation) totals €37,526 thousand,compared with €30,470 thousand in the previous year.
11
Directors’ Report on Operations and Consolidated Accounts
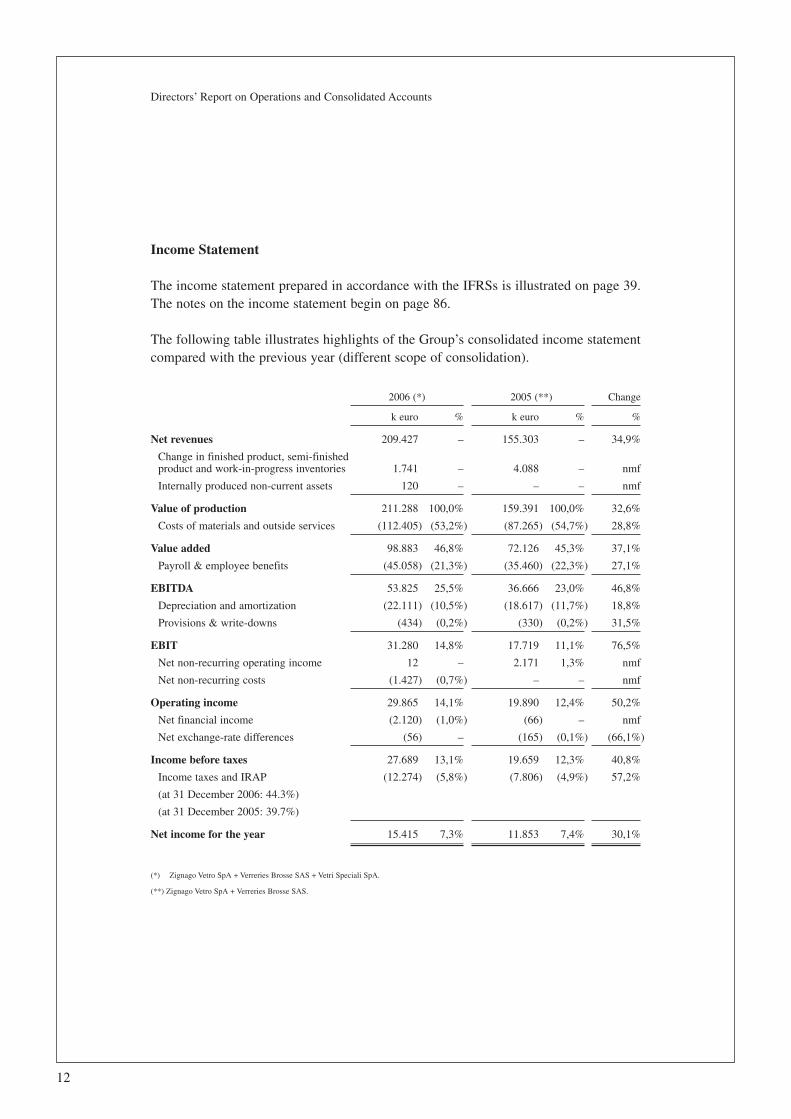
Income Statement
The income statement prepared in accordance with the IFRSs is illustrated on page 39.The notes on the income statement begin on page 86.
The following table illustrates highlights of the Group’s consolidated income statementcompared with the previous year (different scope of consolidation).
2006 (*) 2005 (**) Change
k euro % k euro % %
Net revenues 209.427 – 155.303 – 34,9%
Change in finished product, semi-finishedproduct and work-in-progress inventories 1.741 – 4.088 – nmf
Internally produced non-current assets 120 – – – nmf
Value of production 211.288 100,0% 159.391 100,0% 32,6%
Costs of materials and outside services (112.405) (53,2%) (87.265) (54,7%) 28,8%
Value added 98.883 46,8% 72.126 45,3% 37,1%
Payroll & employee benefits (45.058) (21,3%) (35.460) (22,3%) 27,1%
EBITDA 53.825 25,5% 36.666 23,0% 46,8%
Depreciation and amortization (22.111) (10,5%) (18.617) (11,7%) 18,8%
Provisions & write-downs (434) (0,2%) (330) (0,2%) 31,5%
EBIT 31.280 14,8% 17.719 11,1% 76,5%
Net non-recurring operating income 12 – 2.171 1,3% nmf
Net non-recurring costs (1.427) (0,7%) – – nmf
Operating income 29.865 14,1% 19.890 12,4% 50,2%
Net financial income (2.120) (1,0%) (66) – nmf
Net exchange-rate differences (56) – (165) (0,1%) (66,1%)
Income before taxes 27.689 13,1% 19.659 12,3% 40,8%
Income taxes and IRAP (12.274) (5,8%) (7.806) (4,9%) 57,2%
(at 31 December 2006: 44.3%)
(at 31 December 2005: 39.7%)
Net income for the year 15.415 7,3% 11.853 7,4% 30,1%
(*) Zignago Vetro SpA + Verreries Brosse SAS + Vetri Speciali SpA.
(**) Zignago Vetro SpA + Verreries Brosse SAS.
12
Directors’ Report on Operations and Consolidated Accounts

The figures for consolidated revenues as at 31 December 2006 and 31 December 2005are not objectively comparable (different scope of consolidation).
Breakdown (in € ’000):
2006 2005 %
Zignago Vetro SpA 135.935 125.086 8,7%
Verreries Brosse SAS and its subsidiary 36.325 30.931 17,4%
Vetri Speciali SpA and its subsidiaries 39.863 – nmf
Total aggregate 212.123 156.017 36,0%
Elimination of intercompany sales (2.696) (714) not given
Total consolidated revenues 209.427 155.303 34,9%
Group revenues outside Italy totaled €63,763 thousand. This figure is not objectivelycomparable to the one for 31 December 2005 (€48,421 thousand) and represents30.4% of total revenues (31.2% as at 31 December 2005). They are broken down asfollows (in € ’000):
2006 2005 %
Zignago Vetro SpA 19.083 18.326 4,1%
Verreries Brosse SAS and its subsidiary 35.562 30.095 18,2%
Vetri Speciali SpA and its subsidiaries 9.118 – nmf
Consolidated total 63.763 48.421 31,7%
The Group was active on the following foreign markets (in € ’000):
2006 2005 %
European Union 40.706 35.485 14,7%
North America 10.473 9.599 9,1%
Other countries 12.584 3.337 nmf
Total 63.763 48.421 31,7%
13
Directors’ Report on Operations and Consolidated Accounts

Net income as at 31 December 2006 and 31 December 2005 is broken down asfollows (in €’000):
2006 2005 %
Zignago Vetro SpA 9.913 10.708 (7,4%)
Verreries Brosse SAS and its subsidiary 1.102 931 18,4%
Vetri Speciali SpA and its subsidiaries 4.319 – nmf
Total aggregate 15.334 11.639 10,9%
Consolidation adjustments 81 214 nmf
Group’s interest in net income 15.415 11.853 30,1%
Capital and financial structure
The balance sheet prepared in accordance with the IFRSs is illustrated on page 38 andrelevant comments begin on page 60 of the Notes to the consolidated financialstatements.
Consolidated shareholders’ equity pertaining to the parent company as at 31December 2006, inclusive of the year’s net income, totaled €61,336 thousand (€89,660thousand as at 31 December 2005). The decrease of €28,324 thousand over 31December 2005 stems from the payment of dividends (– €41,401 thousand), net incomefor the year (+€15,415 thousand), the impact of consolidation of Vetri Speciali SpA(– €2,273 thousand), and other net negative changes (– €65 thousand).
The detailed breakdown of changes is illustrated on page 42.
14
Directors’ Report on Operations and Consolidated Accounts

Highlights of the Group’s capital and financial structure as at 31 December 2006, asrestated for operating purposes, are illustrated below and compared with thecorresponding figures as at 31 December 2005 (different scope of consolidation):
31.12.2006 31.12.2005 Change
k euro % k euro % k euro
Trade receivables 50.281 41.344 8.937
Sundry receivables 3.715 2.255 1.460
Inventories 41.781 34.779 7.002
Current non-financial payables (52.836) (38.631) (14.205)
A) Working capital 42.941 35,2% 39.747 50,4% 3.194
Net property, plant and equipment andintangible assets 66.282 60.543 5.739
Goodwill 34.772 – 34.772
Investments not consolidated online-by-line basis 205 199 6
Other non-current financial assets 83 63 20
Provisions and non-currentnon-financial liabilities (22.420) (21.693) (727)
B) Net fixed capital 78.922 64,8% 39.112 49,6% 39.810
A+B = Net invested capital 121.863 100,0% 78.859 100,0% 43.004
Financed by:
Current financial liabilities 31.920 14.987 16.933
Cash and cash equivalents (7.276) (32.288) 25.012
Short-term net debt/(cash) position 24.644 20,2% (17.301) (21,9%) 41.945
Medium and long-term financial debt 35.883 29,5% 6.500 8,2% 29.383
C) Net debt (cash and cash equivalents) 60.527 49,7% (10.801) (13,7%) 71.328
Initial shareholders’ equity 89.660 87.962
Dividends paid out during the year (41.401) (10.000)
Effect of consolidation of Vetri Speciali SpA (2.273) –
Other changes in shareholders’ equity (65) (155)
Net income for the year 15.415 11.853
D) Shareholders’ equity at year-end 61.336 50,3% 89.660 113,7% (28.324)
C+D = Total financial liabilities(cash and cashquivalents) andshareholders’ equity 121.863 100,0% 78.859 100,0% 43.004
In working capital, the increase of receivables stemmed mainly from the changed scopeof consolidation. In particular, using comparable data, the percentage increase of tradereceivables is significantly lower than the increase in revenues, due to a reduction in theaverage number of days for collection.
15
Directors’ Report on Operations and Consolidated Accounts

Net fixed capital increased, rising from €39,112 thousand to €78,922 thousand in2006. This was mainly due to the change in the scope of consolidation, followinginclusion of the subsidiary Vetri Speciali SpA. On a comparable scope of consolidation,there was a significant decrease due to higher amortization and depreciation over capitalexpenditures made.
The investments in property, plant and equipment made by Group companies in 2006totaled €16,694 thousand (€11,966 thousand in 2005).In particular:
– Zignago Vetro SpA made investments of €10,901 thousand (€8,807 thousand in2005), consisting principally of new plant, machinery, and equipment for €2,677thousand, and the purchase of moulds and pallets for €7,883 thousand.
– Verreries Brosse SAS made new investments in property, plant and equipmenttotaling €4,608 thousand (€3,159 thousand in 2005), mainly for refurbishment of afurnace for automatic processing and a furnace for semi-automatic processing, inaddition to improvement of the safety and quality of products and plants in general.New moulds were purchased for €1,062 thousand.
– The proportional part of investments made by Vetri Speciali SpA and itssubsidiaries, totaling €1,185 thousand (€1,299 thousand in 2005) was mainly forimprovement of plants and structures and new industrial equipment, includingmoulds and pallets.
As at 31 December 2006, the Group had 1,289 employees. As at 31 December 2005,they totaled 1,271 persons. All of the employees of Vetri Speciali were transferred to theGroup. The breakdown of Group employees in 2006 is illustrated on page 88.
Net financial position as at 31 December 2006 showed debt in the amount of €60,527thousand, compared with a net cash position of €10,801 thousand as at 31 December2005. There was a negative change at Zignago Vetro SpA, which moved from a netfinancial position of €27,138 thousand to net debt of €16,473 thousand, after paymentof €40,000 thousand in dividends during the year and acquisition of the shareholding inVetri Speciali SpA for €21,471 thousand. The net debt of Verreries Brosse SASdecreased slightly (from €16,337 thousand to €15,963 thousand), mainly as aconsequence of the growth in working capital. It should be pointed out that the changein the scope of consolidation, through the addition of Vetri Speciali SpA, resulted in€34,628 thousand in higher net debt as at 1 January 2006.
16
Directors’ Report on Operations and Consolidated Accounts

The cash flows that affected the consolidated capital structure as at 31 December 2006from 31 December 2005, are as follows (in € ’000):
Net financial assets at 31 December 2005 10,801
Internal financing:
– Income for the year 15,415
– Amortization and depreciation 22,111
– Net use of accrued provisions (4,436)
– Impairment losses on receivables 195
– Net gains realized on property, plant and equipment 83
33,368
Decrease in working capital 3,228
Net investments in property, plant and equipment (15,299)
Net investments in intangible assets (229)
Acquisition of Vetri Speciali (21,471)
Carrying value of property, plant and equipment sold 4,569
(29,202)
Free cash flow 4,166
Payment of dividends (41,401)
(41,401)
Increase in net financial debt (37,235)
Cash acquired upon acquisition of Vetri Speciali 535
Net financial debt acquired upon acquisition of Vetri Speciali (34,628)
Net financial debt at 31 December 2006 (60,527)
The statement of cash flows is illustrated on pages 40 and 41.
Research, Development, and Advertising
Research and development, which is dedicated to process and product innovation, led tothe creation of lighter containers for the sector of normal glass for food and beveragesand containers with innovative forms for the specialty glass and cosmetics andperfumery sectors.
17
Directors’ Report on Operations and Consolidated Accounts

Fees paid to the members of the Board of Directors and Statutory Auditors’Committee and to the General Managers
Board of Directors (in € ’000)
Name and surname Position Term Expiration Emoluments Non- Bonuses Otherof office of term for position cash and compen-
in company benefits other sationthat prepares incentives
financialstatements
Franco Grisan Chairman of the 2005-2007 Approval 37,190 11,469 66,794 219,270Board of Directors, of 2007Chief Executive financialOfficer, and statementsGeneral Manager
Nicolò Marzotto Deputy Chairman 2005-2007 Approval 10,330of the Board of 2007of Directors financial
statements
Marco Donà Director 2005-2007 Approval 6,200Dalle Rose of 2007
financialstatements
Maurizio Guseo Director 2005-2007 Approval 6,200 8,163 47,869 98,354of 2007financialstatements
Ovidio Dri Director 2005-2007 Approval 6,200 8,367 55,661 132,950of 2007financialstatements
Maurizio Pizzolotto Director 2005-2007 Approval 6,200of 2007financialstatements
Giuseppe Breviari Director 2005-2007 Approval 6,200of 2007financialstatements
Statutory Auditors’ Committee (in € ’000)
Name and surname Position held Fees paid
Paolo Nicolai Chairman 8,226
Carlo Pesce Statutory Auditor 4,598
Andrea Dalla Vecchia Statutory Auditor 2,870
Alessandro Bentsik Substitute Statutory Auditor –
Carmen Pezzuto Substitute Statutory Auditor –
18
Directors’ Report on Operations and Consolidated Accounts

Reconciliation of consolidated income for the year and shareholders’ equity, withanalogous values of the parent company
The following table is a summary reconciliation of the values of net income for theparent company and the relative consolidated values (in € ’000):
Net income Shareholders’at 31.12.2006 equity
at 31.12:2006
Parent company’s individual financial statements 9.913 56.656
Adjustments for compliance with accounting standards:
- reclassification of assets from inventories to property,plant and equipment, net of associated tax effect 81 (169)
- consolidation adjustments for Verreries Brosse SAS 16 (37)
- write-off “Fond de Commerce” in Verreries Brosse SAS – (100)
- advance of taxes on pension fund in Verreries Brosse SAS – 256
- other changes in Shareholders’ Equity – 44
97 (6)
Carrying value of equity investments:
Verreries Brosse SAS – (4.000)
Brosse USA Inc. – (200)
Vetri Speciali SpA – (21.471)
– (25.671)
Net income and shareholders’ equity of subsidiaries:
Verreries Brosse SAS 1.356 7.735
Brosse USA Inc. (270) 272
Vetri Speciali SpA 4.319 22.350
5.405 30.357
Consolidated Financial Statements 15.415 61.336
* * *
The results of the parent company and individual subsidiaries are examined anddiscussed on the following pages.
We remind the reader that, for the sake of greater clarity, figures on the financialperformance and position of the parent company and its subsidiaries are shownaccording to the contribution each one makes to preparation of the ConsolidatedFinancial Statements. They are shown in accordance with the customary criteria.
The accounting policies applied here are illustrated in the Notes, pages 44-59.
19
Directors’ Report on Operations and Consolidated Accounts

Zignago Vetro SpA
Registered office: Fossalta di Portogruaro (VE)Business segment: hollow glass containersShare capital: €8,000,000Share owned by Zignago Holding SpA as at 31 December 2006: 100.00%; by IndustrieZignago Santa Margherita SpA as at 31 December 2005: 100.00%
In 2006, sales on the European market of hollow glass for “Food and Beverage”continued to register a positive trend.
In France, the demand for containers was stimulated by rising exports of wine andliquors. In Germany, the demand for glass containers rose both due to higher domesticconsumption and increased exports. Demand rose in Great Britain as well, particularlyin the cider, distillate, and wine markets. Conversely, FABs continued declining.
The global market of “Perfumery” continued the expansion reported in the first half ofthe year. Launches of new products increased, as well as revisions of existing bottles, bychanging the outer packaging and decoration.
Demand also rose in the “Cosmetic” sector. The supply of products made by Asianmanufacturers remained high in America, while it appeared to be lower in Europe dueto lack in quality and inadequate services.
In Italy, the consumption of wine bottles continued growing, stimulated by exports. Thedemand for olive oil containers rose from 2005, while the demand for food containersremained buoyant.
20
Directors’ Report on Operations and Consolidated Accounts
THE COMPANY
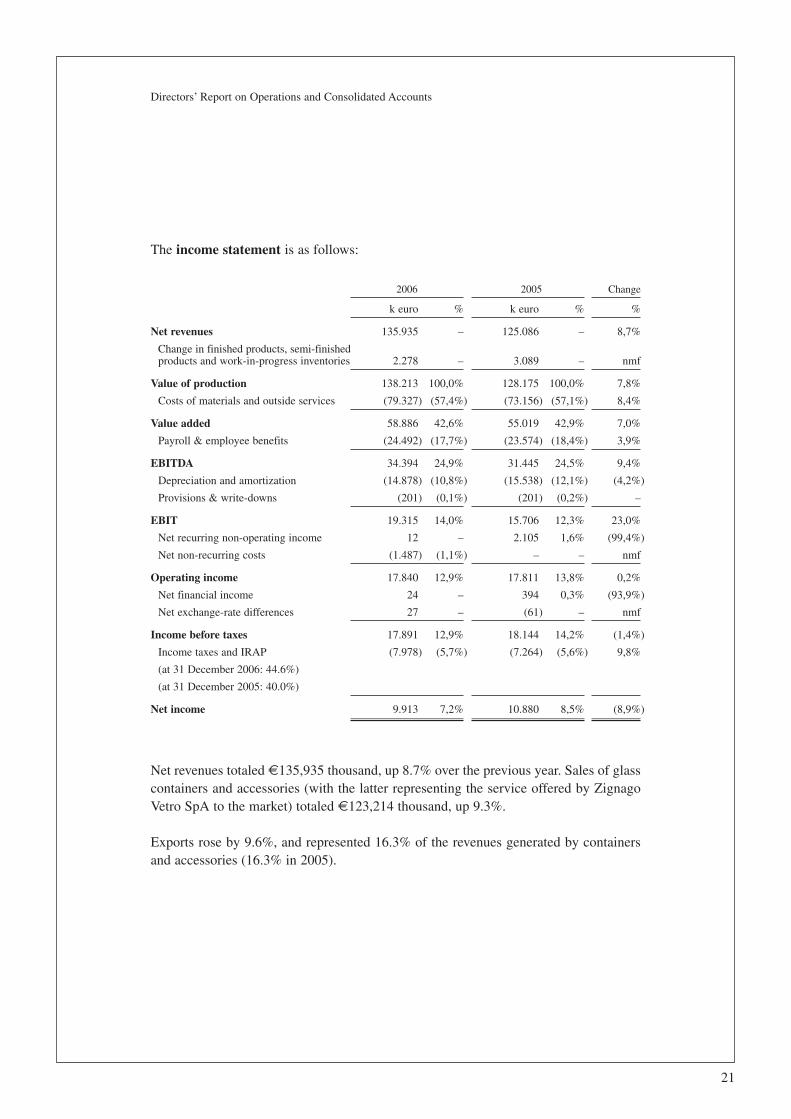
The income statement is as follows:
2006 2005 Change
k euro % k euro % %
Net revenues 135.935 – 125.086 – 8,7%
Change in finished products, semi-finishedproducts and work-in-progress inventories 2.278 – 3.089 – nmf
Value of production 138.213 100,0% 128.175 100,0% 7,8%
Costs of materials and outside services (79.327) (57,4%) (73.156) (57,1%) 8,4%
Value added 58.886 42,6% 55.019 42,9% 7,0%
Payroll & employee benefits (24.492) (17,7%) (23.574) (18,4%) 3,9%
EBITDA 34.394 24,9% 31.445 24,5% 9,4%
Depreciation and amortization (14.878) (10,8%) (15.538) (12,1%) (4,2%)
Provisions & write-downs (201) (0,1%) (201) (0,2%) –
EBIT 19.315 14,0% 15.706 12,3% 23,0%
Net recurring non-operating income 12 – 2.105 1,6% (99,4%)
Net non-recurring costs (1.487) (1,1%) – – nmf
Operating income 17.840 12,9% 17.811 13,8% 0,2%
Net financial income 24 – 394 0,3% (93,9%)
Net exchange-rate differences 27 – (61) – nmf
Income before taxes 17.891 12,9% 18.144 14,2% (1,4%)
Income taxes and IRAP (7.978) (5,7%) (7.264) (5,6%) 9,8%
(at 31 December 2006: 44.6%)
(at 31 December 2005: 40.0%)
Net income 9.913 7,2% 10.880 8,5% (8,9%)
Net revenues totaled €135,935 thousand, up 8.7% over the previous year. Sales of glasscontainers and accessories (with the latter representing the service offered by ZignagoVetro SpA to the market) totaled €123,214 thousand, up 9.3%.
Exports rose by 9.6%, and represented 16.3% of the revenues generated by containersand accessories (16.3% in 2005).
21
Directors’ Report on Operations and Consolidated Accounts

In particular:
Revenues by business segment
2006 2005 %
Glass containers and accessories 123,214 112,727 9,3%
Sundry materials 8,868 8,658 2,4%
Services 3,853 3,701 4,1%
Total 135,935 125,086 8,7%
Revenues by geographical area, excluding other materials and services
2006 2005 %
Italy 103.130 94.401 9,2%
European Union (excluding Italy) 13.336 11.654 14,4%
Europe - other countries 1.298 948 36,9%
North America 2.417 3.036 (20,4%)
Other countries 3.032 2.689 12,8%
Total 123.213 112.728 9,3%
of which exports 20.083 18.327 9,6%
% 16,3% 16,3%
The value of production, €138,213 thousand (€128,175 thousand in 2005), is greaterthan net revenues due to the effect of changes in inventories.
The ratio of costs of materials and outside services to the value of production decreasedfrom 57.4% to 57.1%, mainly due to the increase in energy costs.
Payroll & employee benefits increased by a total of 3.9%, due to an increase in theaverage hourly cost of labor and higher number of hours worked.
EBITDA totaled €34,394 thousand in 2006, compared with €31,445 thousand in 2005.This translates into a 9.4% increase and 24.9% of the value of production (24.5% in2005).
Depreciation and amortization during the year contracted by 4.2%, with the ratio tovalue of production contracting from 12.1% to 10.8%.
22
Directors’ Report on Operations and Consolidated Accounts

EBIT during the year was 23% higher than in the previous year and translates into 14%of the value of production (12.3% in 2005).
Non-operating recurring income largely reflects incidental income based on auditscarried out during preparation of the financial statements. The previous year mainlyreflected incidental income for the release of risk reserves in the amount of €1,623thousand, due to the elimination of liabilities that had caused those reserves to beaccrued.
Non-recurring costs for the year (€1,487 thousand) reflect professional servicesprovided for the previously illustrated listing of the Company.
Net financial income totaled €24 thousand (€394 thousand as at 31 December 2005),with up to €296 thousand of the decrease being accounted for by marking a commodityswap to market, while the reduction is generally associated with the lower level of cashavailable on average for the year.
Income before taxes, €17,891 thousand, was down by 1.4% compared with the €18,144thousand reported for the previous year (up by 17.3% on the basis of comparable figures,considering the non-operating income recognized in 2005 and non-recurring costsrecognized in 2006, as previously illustrated).
The year ended with net income of €9,913 thousand (€10,880 thousand in 2005) afteraccruing €7,978 thousand in provisions for taxes, against €7,264 thousand in 2005(respectively 44.6% and 40% on pre-tax income). The different impact of taxes on pre-tax income stems principally from the tax-exempt nature of the aforementionedincidental income for 2005 resulting from the release of the reserve, against which nodeferred tax liabilities had been recognized.
Cash flow (amortization & depreciation + comparable income for the year) in 2006 was€24,791 thousand (€26,418 thousand in 2005).
23
Directors’ Report on Operations and Consolidated Accounts

The balance sheet as at 31 December 2006 and 31 December 2005 is as follows:
31.12.2006 31.12.2005 Change
k euro % k euro % k euro
Trade receivables 31.993 31.968 25
Sundry receivables 1.624 1.651 (27)
Inventories 28.271 26.268 2.003
Current non-financial payables (37.335) (31.595) (5.740)
A) Working capital 24.553 33,6% 28.292 38,8% (3.739)
Net property, plant and equipment andintangible assets 39.352 47.932 (8.580)
Investments 25.670 4.199 21.471
Provisions and non-currentnon-financial liabilities (16.568) (20.818) 4.250
B) Net fixed capital 48.454 66,4% 31.313 52,5% 17.141
A+B = Net invested capital 73.007 100,0% 59.605 100,0% 13.402
Financed by:
Current financial liabilities 9.834 4.460 5.374
Cash and cash equivalents (5.423) (31.598) 26.175
Short-term net debt/(cash) position 4.411 6,0% (27.138) (45,5%) 31.549
Medium and long-term financial debt 11.940 21,1% – 0,0% 11.940
C) Net debt (cash and cash equivalents) 16.351 22,4% (27.138) (45,5%) 43.489
Initial shareholders’ equity 86.743 85.863 880
Dividends paid out during the year (40.000) (10.000) (30.000)
Net income for the year 9.913 10.880 (967)
D) Shareholders’ equity at year-end 56.656 77,6% 86.743 145,5% (30.087)
C+D = Total financial liabilities(cash and cash equivalents) andshareholders’ equity 73.007 100,0% 59.605 100,0% 13.402
Working capital decreased by €3,739 thousand (– 13.2%) over 2005. Trade and sundryreceivables were stable overall, against revenues that were up by 8.7%. Inventoriesincreased, reflecting higher sales volumes. Current non-financial payables alsoincreased, mainly for provisions of services to be paid in 2007.
Inventories of finished products increased in 2006 from the previous year by 10.1% interms of value and 10.3% in terms of quantity. In terms of volume, the product inventoryfor the year equaled 2.8 months of sales (2.7 as at 31 December 2005).
24
Directors’ Report on Operations and Consolidated Accounts

Net fixed capital increased by €17,141 compared with the previous year thousand dueto the combined effect of amortization and depreciation accrued in 2006 exceeding thevalue of net investments in property, plant and equipment and intangible assets, theincrease in investments following purchase of 43.50% of Vetri Speciali SpA, aspreviously illustrated, and accruals to provisions for deferred tax liabilities and risks andliabilities that were lower than utilization.
Net invested capital consequently increased during the year by €13,402 thousand.
The €30,087 thousand reduction in shareholders’ equity stemmed from payment of€40,000 thousand in dividends, net of the €9,913 thousand in income for the year.
Net debt totaled €16,351 thousand as at 31 December 2006 due to these events (the netfinancial position as at 31 December 2005 was a positive €27,138 thousand).
Investments in property, plant and equipment totaled €10,858 thousand (€8,785thousand in 2005), including new plant, machinery, and equipment for €2,677 thousand,moulds and pallets for €7,883 thousand, remodeling of buildings and other assets for€229 thousand, and assets under construction for €68 thousand.
As at 31 December 2006, the Company had 574 employees, including: 9 seniormanagers, 129 white-collar employees, and 436 blue-collar employees. Eleven workerswere temporary employees.As at 31 December 2005, the Company had 572 employees, including: 7 seniormanagers, 126 white-collar employees, and 439 blue-collar employees. There were 13temporary employees.
Both the domestic and the European market continued to grow in the first month of2007, permitting partial recovery of increased energy costs through higher prices.
* * *
In fulfillment of the requirements resulting from the application for public listing asapproved on 22 December 2006, as previously mentioned, Zignago Vetro SpA submittedits application on 12 January 2007 for listing of its ordinary shares on the MercatoTelematico Azionario, STAR segment, which is organized and managed by BorsaItaliana SpA.
25
Directors’ Report on Operations and Consolidated Accounts

Verreries Brosse SAS
Registered office: Vieux-Rouen-sur-Bresle, FranceBusiness segment: glass bottles for high-end Perfumery
Chairman and General Manager: Giuseppe Breviari
Board of Directors: Luciano AlbaneseMarc CooperAlberto FaggionFranco Grisan
Verreries Brosse SAS sells its products directly in the United States of America, relyingon the commercial support of its wholly owned subsidiary Brosse USA Inc.
In 2006, the ”high-end Perfumery” market in Europe continued to grow, confirming thetrend reported at the end of 2005. Consumption in East European countries rosesignificantly, particularly in Russia.
Interest in the launch of new products was renewed, particular by large customersoperating on multinational markets.
The American market continued expanding at a brisk pace, with a high number of newproduct launches and restocking. Demand on this market is characterized by the need toreact quickly and flexibly along with an expanding supply of products.
In this context, Verreries Brosse SAS improved its market position with the support ofits sales subsidiary.
26
Directors’ Report on Operations and Consolidated Accounts
SUBSIDIARIES

Highlights of the Consolidated Income Statement are illustrated in the following table,with comparable data for 2005:
2006 2005 Change
k euro % k euro % %
Net revenues 36.325 – 30.931 – 17,4%
Change in finished products, semi-finishedproducts and work-in-progress inventories 208 – 999 – nmf
Enhancement of asset value as a resultof in-house work 120 – – – nmf
Value of production 36.653 100,0% 31.930 100,0% 14,8%
Costs of materials and outside services (17.990) (49,1%) (14.823) (46,4%) 21,4%
Value added 18.663 50,9% 17.107 53,6% 9,1%
Payroll & employee benefits (12.497) (34,1%) (11.886) (37,2%) 5,1%
EBITDA 6.166 16,8% 5.221 16,4% 18,1%
Depreciation and amortization (3.510) (9,6%) (3.079) (9,6%) 14,0%
Provisions & write-downs (151) (0,4%) (129) (0,4%) 17,1%
EBIT 2.505 6,9% 2.013 6,3% 24,4%
Net recurring non-operating income(expenses) (6) – 66 nmf nmf
Operating income 2.499 6,8% 2.079 6,4% 20,2%
Net financial income (629) (1,7%) (460) (1,4%) 36,7%
Net exchange-rate differences (65) (0,2%) (104) (0,3%) (37,5%)
Income before taxes 1.805 4,9% 1.515 4,7% 19,1%
Income taxes and IRAP (703) (1,9%) (542) (1,7%) 29,7%(at 31 December 2006: 38,.9%)(at 31 December 2005: 35.8%)
Net income for the year 1.102 3,0% 973 3,0% 13,3%
Net revenues totaled €36,325 thousand (€30,931 thousand in 2005; + 17.4%). Sales ofglass containers totaled €34,769 thousand (€30,068 thousand in 2005; + 15.6%).Exports totaled 55.6% (50.0% in 2005) of net revenues.
27
Directors’ Report on Operations and Consolidated Accounts

Revenues by geographical area
2006 2005
Europe 30.191 23.719
North America 5.865 6.563
Other countries 269 649
Total 36.325 30.931
The value of production, €36,653 thousand (€31,930 thousand in 2005; + 14.8 %), ishigher than the sales and service revenues due to the increase of €208 thousand infinished product inventories (+ €999 thousand in 2005).
The ratio of costs of materials and outside services and payroll & employee benefits tothe value of production decreased (aggregate total 83.2% in 2006 and 83.7% in 2005),notwithstanding the increase in energy costs, outsourced processing, and higher costsconnected with changes in the cost of labor.
Amortization and depreciation increased by 14.0%, corresponding to the new non-current assets that became operational.
Net financial expenses for 2006 increased by 36.7% over the previous year, mainly dueto the increased cost of money recorded during 2006, notwithstanding lower averagedebt. They represent 1.7% of the value of production (1.4% in 2005).
The financial year ended with net income of €1,102 thousand (€973 thousand in 2005;+ 13.3%), after charging €703 thousand for income taxes (€542 thousand in 2005;+ 29.7%).
Cash flow (amortization & depreciation + income for the year) totaled €4,612 thousand(€4,052 thousand in 2005; + 13.8%).
28
Directors’ Report on Operations and Consolidated Accounts

The consolidated capital and financial structure as at 31 December 2006 and 31December 2005 is as follows:
31.12.2006 31.12.2005 Change
k euro % k euro % k euro
Trade receivables 10.401 9.435 966
Sundry receivables 1.024 667 357
Inventories 8.968 8.511 457
Current non-financial payables (8.441) (6.304) (2.137)
Payables to suppliers of capital goods (620) (791) 171
A) Working capital 11.332 47,3% 11.518 49,9% (186)
Net property, plant and equipment andintangible assets 13.425 12.611 814
Provisions and non-currentnon-financial payables (824) (875) 51
B) Net fixed capital 12.601 52,7% 11.736 50,5% 865
A+B = Net invested capital 23.933 100,0% 23.254 100,0% 679
Financed by:
Current financial liabilities 13.579 10.527 3.052
Cash and cash equivalents (1.516) (690) (826)
Short-term net debt position 12.063 50,4% 9.837 42,3% 2.226
Medium and long-term financial debt 3.900 16,3% 6.500 28,0% (2.600)
C) Net debt 15.963 66,7% 16.337 70,3% (374)
Initial shareholders’ equity 6.917 5.864
Other changes in shareholders’ equity (49) 80
Net income for the year 1.102 973
D) Shareholders’ equity at year-end 7.970 33,3% 6.917 29,7% 1.053
C+D = Total financial liabilities andshareholders’ equity 23.933 100,0% 23.254 100,0% 679
Trade receivables (+ 10.2% as at 31 December 2006 above 2005) represent 28.6 % ofnet revenues, as opposed to 30.6% as at 31 December 2005. This value was impacted bycollections from certain customers in 2007 of amounts due at 31 December 2006.
The amount of inventories increased by €457 thousand, due particularly to the higheraverage unit value of bottles on stock as at 31 December 2006 as compared with thesituation as at 31 December 2005.
In terms of volumes, finished product inventories equaled 3.5 months of sales (4.2 in2005).
29
Directors’ Report on Operations and Consolidated Accounts

The €2,137 thousand increase in current non-financial payables reflected the increasedlevel of activity in 2006 compared with 2005, particularly at the end of the year.
Group net debt decreased from €16,337 thousand as at 31 December 2005 to €15,963thousand as at 31 December 2006 (– €374 thousand), with a reduction of €186thousand in working capital and an increase of €865 thousand in fixed capital.
In particular, medium and long-term financial debt is represented by a bank loan, net ofthe current installment, granted to cover investments and with a final due date of 30 June2009.
Investments in property, plant and equipment and intangible assets are broken down asfollows:
2006 2005
Period investments
Land and buildings 56 36
Plant and machinery 4.154 2.105
Equipment 203 711
Intangible assets 140 32
Total 4.553 2.884
Investments in plant and machinery are largely represented by the refurbishment of thefurnace for automatic production and a furnace for semi-automatic production, as wellas qualitative improvement of products and plant safety in general. The new mouldstotaled €1,062 thousand (€1,139 thousand in 2005).
In implementation of the “Emission Trading Directive,” the quotas assigned for carbondioxide emission rights were recognized at their market value on 31 December 2006,€128 thousand.
The Group had 290 employees as at 31 December 2006, including 10 temporaryemployees and six part-time employees (288 employees as at 31 December 2005).
The demand for eau de toilette bottles increased during the first month of 2007.Sales of large containers produced on a semi-automatic basis rose, due in part to theexpansion of our production capacity in 2006.Average sales prices are expected to rise compared with 2006. Nevertheless, productioncosts will be indirectly influenced by changes in energy costs.We believe that the operating results for 2007 will mark an improvement over 2006.
30
Directors’ Report on Operations and Consolidated Accounts

Vetri Speciali SpA
Registered office: Via Manci, 5 – Trento, ItalyBusiness segment: specialty glass containers
Chairman: Stefano Marzotto
Vice Chairman: Vitaliano TornoChief Executive Officer: Giorgio MazzerDirectors: Luca Marzotto
Andrea Mazzoni
Statutory Auditors: Giuseppe RoveroGiuseppe BaratellaFranco Corgnati
Vetri Speciali SpA controls two commercial companies:
- Vetri Speciali Inc.,registered office in Benicia, California, USA (100% of share capital)
- Vetri Speciali Iberica S.L.,registered office in Barcelona, Spain (100% of share capital)
Demand for specialty glass containers on the domestic and international markets wherethe Company operates remained healthy increasing in 2006 compared with 2005.
However, the operating result was impacted by the significant increase in energy costs.
Following the company merger carried out in 2005, integration of production activitieswas nearly completed. Full use of the production capacity of all plants and relatedstructures permit extremely significant synergies.
As they satisfied accounting and regulatory requirements, the consolidated financialstatements as at 31 December 2006 and 31 December 2005 of Vetri Speciali SpA and itssubsidiaries have been prepared in accordance with the IFRSs, as issued by theInternational Accounting Standard Board and endorsed by the European Commission.
31
Directors’ Report on Operations and Consolidated Accounts

The Consolidated Income Statement of Vetri Speciali for the years that ended on 31December 2006 and 31 December 2005 were as follows for the share owned by ZignagoVetro S.p.A. (43.5%):
2006 2005(43.5%) (43.5%) Change
k euro % k euro % %
Net revenues 39.863 – 38.156 – 4,5%
Change in semi-finished products, finishedproducts and work-in-progress inventories (745) – (1.192) – nmf
Value of production 39.118 100,0% 36.964 100,0% 5,8%
Cost of materials and outside services (17.869) (45,7%) (15.855) (42,9%) 12,7%
Added value 21.249 54,3% 21.109 57,1% 0,7%
Payroll & emplyee benefits (8.069) (20,6%) (7.535) (20,4%) 7,1%
EBITDA 13.180 33,7% 13.574 36,7% (2,9%)
Depreciation and amortization (3.723) (9,5%) (3.785) (10,2%) (1,6%)
Provisions & writedowns (85) (0,2%) (96) (0,3%) (11,5%)
EBIT 9.372 24,0% 9.693 26,2% (3,3%)
Net recurring non-operating income(expenses) 69 0,3% 275 0,7% (74,9%)
Operating income 9.441 24,1% 9.968 27,0% (5,3%)
Net financial expenses (1.515) (3,9%) (1.217) (3,3%) 24,5%
Net exchange-rate differences (18) – 5 – nmf
Income before corporate income taxand IRAP 7.908 20,2% 8.756 23,7% (9,7%)
Income tax and IRAP (3.589) (9,2%) (3.504) (9,5%) nmf(at 31 December 2006: 45.4%)(at 31 December 2005: 40.0%)
Net income for the year 4.319 11,0% 5.252 14,2% (17,8%)
Net consolidated income for 2006 totaled €39,863 thousand, up 4.5% compared withthe €38,156 thousand in the previous year.
Considering the indirect share realized through distributors, exports representedapproximately 29% of revenues. Direct exports instead totaled 21.8% of total revenues(22.5% in 2005).
32
Directors’ Report on Operations and Consolidated Accounts

The Group operated on the following foreign markets (in € ‘000, for the Group’s share):
2006 2005 %
European Union countries 5.503 5.112 7,6%
Other European countries 417 540 (22,8%)
North America 2.191 2.286 (4,2%)
Other countries 1.012 665 52,2%
Total 9.123 8.603 6,0%
The Group’s share in the cost of materials and outside services totaled €17,869thousand, 12.7% more than in 2005 (€15,855 thousand), mainly due to higher energycosts (+ 20%). They represent 45.7% of the value of production, compared with 42.9%in 2005.
The Group’s share in payroll and employee benefits for the year increased by 7.1% vs.2005 due to the higher number of hours worked (+ 3.6%) and the increased averagehourly cost of labor.
Amortization and depreciation accrued for 2006 totaled €3,723 thousand, 1.6% lessthan in the previous year.
The Group’s share in financial expenses for the year increased by 24.5%, mainly as aresult of the effective interest rate method applied on existing loans, as envisaged byinternational accounting standards.
The Group’s share in income tax for the year, €3,589 thousand, equaled 45.4% of pre-tax income (40% in 2005).
The Group’s share in consolidated net income for the year was €4,319 thousand,compared with €5,252 thousand in the previous year.
33
Directors’ Report on Operations and Consolidated Accounts

The consolidated capital and financial structure as at 31 December 2006 and 31December 2005 was as follows for the share of Zignago Vetro SpA (43.50%):
31.12.2006 31.12.2005(43.50%) (43.50%) Change
k euro % k euro % k euro
Trade receivables 8.334 8.566 (232)
Sundry receivables 1.051 750 301
Inventories 4.810 5.708 (898)
Current non-financial payables (7.109) (6.807) (302)
A) Working capital 7.086 14,0% 8.217 15,4% (1.131)
Net property, plant and equipment
and intangible assets 13.633 16.060 (2.427)
Goodwill 34.772 34.772 –
Investments 6 6 0
Provisions and non-current
non-financial liabilities (5.056) (5.579) 523
B) Net fixed capital 43.355 86,0% 45.259 84,6% (1.904)
A+B = Net invested capital 50.441 100,0% 53.476 100,0% (3.035)
Financed by:
Current financial liabilities 8.507 8.435 72
Cash and cash equivalents (459) (535) 76
Short-term net debt 8.048 16,0% 7.900 14,8% 148
Medium and long-term financialdebt 20.043 39,7% 26.193 49,0% (6.150)
C) Net borrowings 28.091 55,7% 34.093 63,8% (6.002)
Initial shareholders’ equity 19.383 14.407
Dividends paid out during the period (1.401) –
Other changes in shareholders’ equity 49 (276)
Net income for the year 4.319 5.252
D) Shareholders’ equity at endof year 22.350 44,3% 19.383 36,2% 2.967
C+D= Total financial liabiltiesand shareholders’ equity 50.441 100,0% 53.476 100,0% (3.035)
The Group’s share in trade receivables as at 31 December 2006 showed a 2.7% decreaseagainst a 4.5% increase in revenues.
The Group’s share in inventories as at 31 December 2006 decreased by 15.7%, inconnection with higher sale volumes, particularly during the last part of the year.
34
Directors’ Report on Operations and Consolidated Accounts

The Group’s share in net non-current assets decreased due to the effects of amortizationand depreciation accrued during the year, which exceeded the investments made inproperty, plant and equipment (€1,250 thousand).
The Group’s share in net invested capital as at 31 December 2006 totaled €50,441thousand, down by 5.7% from the €53,476 thousand reported as at 31 December 2005.
After payment of €1,401 thousand in dividends, the Group’s share in net debt as at 31December 2006 totaled €28.091 thousand, down by €6,002 thousand (– 17.6%) vs. 31December 2005. This figure includes payables to leasing companies for a total of€3,836 thousand (€4,367 thousand as at 31 December 2005). The Group’s share inmedium-term loans decreased during the year to €20,043 thousand (– €6,150 thousand;– 23.5%).
As at 31 December 2006, the Group had a total of 185 employees (3 senior managers,42 administrative, technical and commercial employees, and 140 blue-collaremployees), representing an increase of six persons over 31 December 2005.
The year started with growth in shipments from the same period of the previous year.Signed agreements and received orders offer the prospect of results consistent with theprevious fiscal year.
35
Directors’ Report on Operations and Consolidated Accounts

Proposals for shareholder resolutions approved by Board of Directors meeting ofZignago Vetro SpA. in its meeting of 13 February 2007 are as follows.
“To Our Shareholders,
We trust that you will agree with the principles that we followed in preparing thefinancial statements for the financial year as at 31 December 2006 and we request thatyou approve them.
We propose allocating earnings for the year of €9,739,684 as follows:
– to the legal reserve €486,985in the amount of 5%
– to dividends, a total of €8,800,000at the rate of €0.11 per share for the 80,000,000eligible ordinary shares
– to retained earnings, the remainder of €452,699after which this reserve will total €5,344,163
€9,739,684
”
Fossalta di Portogruaro, 13 February 2007
THE BOARD OF DIRECTORS
36
Directors’ Report on Operations and Consolidated Accounts
PROPOSED RESOLUTIONS FOR THE SHAREHOLDERS’ MEETING OFZIGNAGO VETRO SpA

2006Consolidated Annual Report
Financial Statements
37

(in € ’000) Note 31.12.2006 31.12.2005
ASSETSNon-current assets
Property, plant and equipment 1 66,068 60,305Goodwill 2 34,772 0Intangible assets 3 214 238Investments in associates 4 205 199Other non-current assets 5 83 63Deferred tax assets 6 1,284 1,196
Total non-current assets 102,626 62,001
Current assetsInventories 7 41,781 34,779Trade receivables 8 50,281 41,344Other current assets 9 760 300Receivables for current taxes 10 1,671 759Securities 11 49 2,500Cash and cash equivalents 12 7,227 29,788
Total current assets 101,769 109,470
Total assets 204,395 171,471
LIABILITIES AND SHAREHOLDERS’ EQUITYShareholders’ equity
Share capital 8,000 4,132Reserves 34,200 38,833Retained earnings 3,721 34,842Net income 15,415 11,853
Total shareholders’ equity 13 61,336 89,660
LIABILITIESNon-current liabilities
Provisions for risks and liabilities 14 1,562 1,949Post-employment benefits 15 9,894 6,752Medium to long-term borrowings 16 35,883 6,500Other non-current liabilities 17 153 0Deferred tax liabilities 18 10,811 12,992
Total non-current liabilities 58,303 28,193
Current liabilitiesBank borrowings and current share of mediumto long-term borrowings 19 31,920 14,987Trade payables 20 36,796 28,268Other current liabilities 21 9,969 6,944Payables for current taxes 22 6,071 3,419
Total current liabilities 84,756 53,618
Total liabilities 143,059 81,811
Total liabilities and shareholders’ equity 204,395 171,471
38
Consolidated Balance Sheet
Zignago Vetro GroupConsolidated Balance Sheet

(in € ’000) Note 2006 2005
Revenues 23 209,427 155,303
Costs for raw & ancillary materials, consumables,and merchandise 24 (52,552) (38,891)
Costs for services 25 (58,631) (43,358)
Payroll & employee benefits 26 (45,058) (35,461)
Amortization, depreciation and impairment losses 27 (22,111) (18,617)
Other operating costs 28 (2,346) (1,717)
Other operating income 29 1,136 2,631
Operating income 29,865 19,890
Financial income 30 667 510
Financial expenses 31 (2,787) (576)
Net exchange losses (56) (165)
Income before taxes 27,689 19,659
Income taxes 32 (12,274) (7,806)
Group net income 15,415 11,853
Per share:
Base (and diluted) earnings per share 0.19 0.15
39
Consolidated Income Statement
Zignago Vetro GroupConsolidated Income Statement

(in € ’000) 2006 2005
CASH FLOW FROM OPERATING ACTIVITIES:Group Net income 15,415 11,853Adjustments to reconcile net income with cash flowsgenerated by operations:Amortization, depreciation, and impairment losses 22,111 18,617
Net gains from disposal of property, plant and equipment 83 (431)
Write-down of receivables 195 144
Accruals (uses) of provision for deferred tax liabilities/assets (4,554) (567)
Net post-employment benefits accrued during year 581 660
Net change in other reserves (463) (1,814)
Changes in operating assets and liabilities:Trade receivables (507) (2,888)
Other current assets (141) 115
Receivables for current taxes (723) 725
Inventories (1,607) (4,588)
Trade payables 3,072 2,799
Other current liabilities 1,239 676
Payables for current taxes 2,156 (1,675)
Other non-current assets and liabilities (261) 80
Total adjustments and changes 21,181 11,853
Net cash flow from operating activities 36,596 23,706
CASH FLOW FROM INVESTING ACTIVITIES:Investments in intangible assets (229) (63)
Investments in property, plant and equipment, including repaymentinstallments of finance lease contracts (15,299) (19,179)
Investments in non-current financial assets 0 15
Acquisition of shareholding in Vetri Speciali (21,471) 0
Investments in securities (49) 0
Disposal price of securities 2,500 0
Disposal price of property, plant and equipment 4,569 4,162
Net cash flow absorbed by investing activity (29,979) (15,065)
CASH FLOW FROM FINANCING ACTIVITIES:Net change in short-term bank borrowings 5,498 8,352
New medium and long-term borrowings 14,940 0
Reimbursement of medium and long-term borrowings (8,750) (2,600)
Payment of dividends (41,401) (10,000)
Net cash flow absorbed by financing activities (29,713) (4,248)
Increase/(decrease) in cash and cash equivalents (23,096) 4,393
Initial cash and cash equivalents (1) 30,323 25,395
Cash and cash equivalents at year-end 7,227 29,788
(1) Including E535 thousand from acquisition of Vetri Speciali.
40
Consolidated Statement of Cash Flows
Zignago Vetro GroupConsolidated Statement of Cash Flows

Supplementary information:
(in € ’000) 31.12.2006 31.12.2005
Interest paid 2,069 576
Income taxes paid 15,423 9,001
Net financial position
(in € ’000) 31.12.2006 31.12.2005
Cash and cash equivalents (7,227) (29,788)
Securities (49) (2.500)
Bank and other borrowings 31,920 14,987
Medium to long-term borrowings 35,883 6,500
Total 60,527 (10,801)
41
Consolidated Statement of Cash Flows

Statement of Changes in Consolidated Shareholders’ Equity
(in € ’000) Share Legal Revalua- Other Transla- Retained Net Total capital reserve tion reserves tion earnings income Conso-
reserve reserve (loss) lidatedShareh-olders’Equity
Balance as at1 January 2006 4,132 826 31,202 6,960 (155) 34,842 11,853 89,660
Consolidation effect ofVetri Speciali (10) (2,263) (2,273)
Allocation of income (9,548) (11,853) (21,401)
Distribution of reserves (690) (19,310) (20,000)
Capital increase throughtransfer of reserves 3,868 (3,868) 0
Translation difference (65) (65)
Net income (loss)for the year 15,415 15,415
Balance as at31 December 2006 8,000 826 27,334 6,270 (230) 3,721 15,415 61,336
42
Statement of Changes in Consolidated Shareholders’ Equity

2006Consolidated Annual Report
Notes to the Consolidated Financial Statements
43

Introduction
As previously mentioned on page 8, the Consolidated Financial Statements as at 31December 2006 and 31 December 2005 were prepared in accordance with the IFRSs,pursuant to the option envisaged in Italian legislative decree 38/2005. The notes includethe information normally required by applicable laws and regulations and accountingstandards, which are detailed as necessary in reference to the financial statement formatsused herein.
The Consolidated Financial Statements as at 31 December 2006 and 31 December 2005were also prepared for inclusion in the prospectus required for listing of the ordinarystock of Zignago Vetro SpA on the Mercato Telematico Azionario, STAR Segment,organized and managed by Borsa Italiana SpA.
The Consolidated Financial Statements as at 31 December 2005 were the first Groupfinancial statements prepared in accordance with the IFRSs.
For comparison of the financial figures as at 31 December 2006 and 31 December 2005,the scope of consolidation of the Zignago Vetro Group as at 31 December 2006 and 31December 2005 was as follows:
– Zignago Vetro S.p.A. (parent company)
– consolidated on a 100% line-by-line basis, on the financial statements as at 31December 2006 and 31 December 2005:
– Verreries Brosse SAS ad its subsidiary:
– Brosse USA Inc.
– consolidated on a proportional line-by-line basis, for the 43.5% shareholding, onthe financial statements as at 31 December 2006:
– Vetri Speciali SpA and its subsidiaries:
– Vetri Speciali Inc.
– Vetri Speciali Iberica S.L.
In October 2004, the scope of consolidation changed, when the parent company,Industrie Zignago Santa Margherita SpA (IZSM), completed a process of corporatereorganization by acquiring 43.5% of the capital of Vetri Speciali SpA, the parentcompany of three production companies (which were merged at the beginning of 2005)and two sales companies.
44
Notes to the Consolidated Financial Statements
INTERNATIONAL FINANCIAL REPORTING STANDARDS (IFRSS) USEDTO PREPARE THE CONSOLIDATED FINANCIAL STATEMENTS AS AT31 DECEMBER 2006

Report preparation criteria
The Consolidated Financial Statements of the Zignago Group as at 31 December 2006have been prepared in accordance with the historical cost principle, except forinvestments in financial assets and derivative instruments, which have been recognizedat their fair value.
Statement of compliance with the IFRSs
The consolidated financial information as at 31 December 2006 and 31 December 2005and for the periods closed on those dates has been prepared in compliance with theIFRSs.
Accounting standards
The accounting standards applied for all periods considered by these financialstatements are uniform, including recognition of the financial instruments whoseaccounting treatment is governed by IAS 32 and 39. The Group has exercised the optionenvisaged by IFRS 1 and selected 1 January 2005 as the transition date for initialapplication of IASs 32 and 39.
In order to facilitate reading, the Consolidated Financial Statements and Directors’Report on Operations are presented with the values of the balance sheet, incomestatement, and relevant comments expressed in thousands of euros.
Methods used to prepare the Consolidated Financial Statements
Acquisition by Zignago Vetro of the shareholding owned by the parent company IZSMin Vetri Speciali on 30 June 2006, as described in the Directors’ Report on Operations,represents a transaction under common control pursuant to IFRS 3, i.e. a businesscombination where all the combining entities or businesses are ultimately controlled bythe same party or parties both before and after the business combination, and that controlis not transitory in nature.
The accounting treatment of such transactions is not currently governed by the IFRS.Therefore, in compliance with the IFRSs, reference was made to a body of “similar”accounting standards. In this specific case, reference was also made to U.S. GAAP andthe criteria envisaged by those principles, which state that such operations be recognizedon the financial statements of the company resulting from the combination by using the
45
Notes to the Consolidated Financial Statements

historical values prior to the combination. The reason is that in a transaction betweenentities under common control, it is impossible to define objective current values. Thehigher amount paid for the acquisition with respect to historical values is handled as apayment of dividends.
Therefore, in this specific case, the consolidated figures reflect the amounts reported onthe financial statements of IZSM in reference to the aforementioned companies ZignagoVetro and Vetri Speciali.
Consolidation area and policies
The principles applied during the consolidation process include:
– elimination of the investment account following acquisition of the assets andliabilities of the subsidiaries and associated companies, according to the 100% orproportional line-by-line consolidation methods;
– separate recognition of any minority interest in shareholders’ equity;
– elimination of all intercompany transactions, and thus payables, receivables, sales,purchases, and gains and losses not realized with third parties;
– the financial statements of the subsidiaries used for preparation of the consolidatedfinancial statements are those approved by the respective boards of directors, whichwill be submitted to the respective shareholders’ meeting for approval. The closingdate of the financial statements of the consolidated companies is the same as that ofthe parent company. The financial statements of the consolidated companies areadjusted, if necessary, to make them consistent with the accounting standards usedby the parent company, which comply with the IFRSs endorsed by the EuropeanUnion.
If the acquisition value of investments exceeds the pro-rate value of the subsidiaries’equity, the positive difference is recognized under assets whenever possible (e.g. it canbe used to increase the value of the non-current assets themselves, but within the limitsof their market value, and amortized according to their residual useful life), and theresidual amount is recognized in an asset account named “goodwill.” The value ofgoodwill is not amortized but at least annually audited to determine any impairment andadjustment when events or changed situations indicate that the carrying value cannot berealized. Goodwill is recognized at cost net of impairment losses.
If the carrying value of the investments is lower than the pro-rate value of thesubsidiaries’ equity, the negative difference is recognized on the income statement.
46
Notes to the Consolidated Financial Statements

The companies included in the Consolidated Financial Statements as at 31 December2006 and 31 December 2005 are listed in the following table:
Consolidated Companies Registered office Share capital Group’s interest(in local currency) in equity
Zignago Vetro SpA (parent company) Fossalta di Portogruaro (VE) 8,000,000 –
Consolidated Financial Statementsat 31 December 2006
Companies consolidated on a 100%line-by-line basis
Verreries Brosse SAS Vieux-Rouen-sur-Bresle, France 4,000,000 100.00%
Brosse USA Inc. New Jersey, U.S.A. USD 10,000 100.00%
Companies consolidated on aproportional line-by-line basis
Vetri Speciali S.p.A. Trento (TN) 10,062,400 43.50%
Vetri Speciali Inc. Benicia, California, U.S.A. USD 100,000 43.50%
Vetri Speciali Iberica S.L. Barcelona, Spain 3,006 43.50%
Consolidated Financial Statementsat 31 December 2005
Companies consolidated on a 100%line-by-line basis
Verreries Brosse SAS Vieux-Rouen-sur-Bresle, France 4,000,000 100.00%
Brosse USA Inc. New Jersey, U.S.A. USD 10,000 100.00%
The main changes in the scope of consolidation during the fiscal year that ended 31December 2006 are illustrated as follows:
– acquisition from the parent company Industrie Zignago Santa Margherita S.p.A. ofthe equity investment owned by that company in the share capital of Vetri SpecialiS.p.A. (43.5%) on 30 June 2006, with settlement of the payment in cash on 27September 2006.
The main changes in the scope of consolidation during the financial year that ended 31December 2006 compared to the previous financial year are related to acquisition fromthe parent company IZSM of the investment in Vetri Speciali S.p.A. (43.5%) on 30 June2006.
The companies Verreries Brosse and its subsidiary Brosse USA are consolidated on a100% line-by-line basis.
The company Vetri Speciali and its subsidiaries, Vetri Speciali Inc. and Vetri SpecialiIberica, are consolidated on a proportional line-by-line basis, at the rate of 43.5%, sincethat company is subject to joint control by Zignago Vetro.
47
Notes to the Consolidated Financial Statements

Translation of financial statements expressed in currencies other than thefunctional currency
The following rules apply to translating the financial statements of companies expressedin currencies other than the Euro:
– assets and liabilities are translated by using the exchange rates in effect on thebalance sheet reference date;
– costs, revenues, expenses, and income are translated at the average exchange rate forthe period;
– the translation reserve accrues both the exchange differences generated by translationof economic figures at a different rate from the closing one and those generated bytranslation of opening shareholders’ equity at an exchange rate different from theclosing one for the statement period.
Property, plant and equipment
Property, plant and equipment are recognized at their historical cost, including directlyallocable associated costs necessary for placing the asset into service for the use forwhich it was acquired. Land, both undeveloped and that adjoining civil and industrialbuildings, is generally accounted for separately and is not depreciated since it has anunlimited useful life. Maintenance and repair costs that cannot increase the value and/orprolong the residual life of the assets are expensed in the year that they were incurred.Otherwise, they are capitalized.Property, plant and equipment are recognized net of the applicable accumulateddepreciation and any impairment losses determined according to the methods describedhereunder. Depreciation is calculated on a straight-line basis according to the estimateduseful life of the asset for the enterprise. The useful life is re-examined annually, and anychanges necessary are made on a prospective basis.
The principal depreciation rates used are as follows:
Category Depreciation rates
Industrial buildings 5.5%
Generic plant and machinery 4% - 10%
Specific plant and machinery 8% - 33.33%
Equipment (moulds) 40% - 100%
Furnaces and decoration tunnel kilns 11% - 25%
Office furniture and furnishings 12%
Electronic office machines 20%
Commercial equipment and furnishings 15%
Special internal communication systems 25%
Motor vehicles 25%
48
Notes to the Consolidated Financial Statements

The carrying value of property, plant and equipment is verified to determine anyimpairment losses if events or changed situations indicate that the carrying value cannotbe recovered. If there are such indications, when the carrying value exceeds the presumedrealizable value, the assets are written down to the point where they reflect their realizablevalue. The realizable value of property, plant and equipment is represented by the greaterof the net sales price (fair value) and the value in use.Impairment losses are recognized on the income statement. Impairment losses are reversedif the reasons for recognizing those losses cease to exist. At the time of sale or when futureeconomic benefits from use of the asset are expected, it is eliminated from the financialstatement and the loss or profit (calculated as the difference between the sale value and thecarrying value) is recognized on the income statement in the year of the elimination.
Leased assets
Assets acquired under finance lease agreements, which substantially transfer to the Groupall the risks and rewards of ownership of the leased asset, are capitalized under property,plant, and equipment from the starting date of the lease at the fair value of the leased assetor, if lower, at the current value of the lease installments. A payable for the same amountis recognized under liabilities, and this is steadily reduced according to the installmentpayment plan for the principal included in the contractually envisaged installments.The lease installments are divided into the portion for principal and the portion ofinterest in order to obtain application of a constant interest rate on the remainingbalance of the payable (principal). The financial expenses are charged to the incomestatement.The depreciation of these assets is calculated according to their useful life analogouslyto what is done for other property, plant and equipment.Lease agreements in which the lessor substantially retains all the risks and rewardstypical of ownership are classified as operating leases.The initial costs of negotiation incurred for operating lease agreements are added to thecost of the leased asset and recognized over the term of the lease agreement in order toset off the revenues generated by the lease itself.Operating lease installments are allocated to the income statement in even installmentsover the term of the agreement.
Goodwill
The goodwill stemming from acquisition of subsidiaries is initially recognized at cost.It represents the excess cost of purchase with respect to the buyer’s share in the net fairvalue referred to the identifiable values of the current and potential acquired values ofthe assets and liabilities. After the initial recognition, goodwill is not amortized but isreduced in the event of an impairment loss.
49
Notes to the Consolidated Financial Statements

This impairment loss is not restored if the reasons that caused it cease to exist.Goodwill is subjected to an impairment test on an annual or more frequent basis if eventsor changes in circumstances might cause impairment losses.Upon first-time application of the IFRSs, the Group chose not to apply IFRS 3 – BusinessCombinations on a retroactive basis to acquisitions of businesses that took place prior to1 January 2004. Consequently, any goodwill generated on acquisitions prior to the dateof transition to the IFRSs was maintained at the prior value determined in accordancewith Italian GAAPs, upon verification and recognition of any impairment losses.
Intangible assets
The intangible assets acquired through business combinations are recognized at the fairvalue defined at the acquisition date if this value can be determined in a reliable manner.Intangible assets that are acquired separately are recognized under assets at theirpurchase cost, inclusive of directly allocable transaction costs.Following their initial recognition, intangible assets with a definite useful life arerecognized net of any accumulated amortization and impairment losses, which aredetermined in the same way as described for property, plant and equipment.The useful life is re-examined annually and any changes are made as necessary on aprospective basis.The average rates for amortization of intangible assets with a definite useful life are asfollows:
Category Amortization rate
Concessions, licenses, and trademarks 33.33%
Intangible assets with a definite useful life are subjected to impairment tests todetermine any such losses when events or changed situations indicate that the carryingvalue cannot be realized.The Group does not own intangible assets with an indefinite useful life.The profits or losses deriving from disposal of an intangible asset are determined as thedifference between the disposal value and the carrying value of the asset and arerecognized in the income statement at the time of disposal.
Research and development costs
Research and development costs are recognized on the income statement when they areincurred. The development costs incurred for a specific project are capitalized only whenthe Group can prove the technical possibility of completing the intangible asset so thatit can be made available for use or sale, as well as its own intention to complete this assetfor use or sale, the ways in which it will generate probable future economic benefits, theavailability of technical, financial, or other resources for completing development, its
50
Notes to the Consolidated Financial Statements

capacity to reliably assess the cost attributable to the asset during its development, andthe existence of a market for the products and services deriving from the activity or itsutility for internal purposes.
Impairment
At every annual and interim report closing date, the Group determines whether anyindicators of impairment losses of intangible assets with a definite useful life, property,plant and equipment, and assets held under finance leases exist. If any such indicatorsare revealed, an impairment test is performed.Goodwill and any other intangible assets with an indefinite useful life are subjected toannual impairment tests, regardless of whether there is any indication of impairment.In both cases, i.e. annual verification of the carrying value of goodwill and intangibleassets with an indefinite useful life, or of the property, plant and equipment andintangible assets with a definite useful life if there are indications of impairment losses,the Group estimates the recoverable value. The recoverable value is the greater of thefair value of an asset or cash generating unit net of sale costs and value in use, and isdetermined according to each individual asset, with the exception of the case where thisasset generates cash flows that are not broadly independent from those generated byother assets or groups of assets, in which case the Group estimates the recoverable valueof the cash generating unit to which the asset belongs. In particular, since goodwill doesnot generate cash flows independently from other assets or groups of assets, theimpairment test concerns the unit or group of units to which the goodwill was allocated.When it determines the value in use, the Group discounts estimated future cash flows attheir current value, by using a pre-tax discount rate that reflects market valuations of thetime value of money and the specific risks of the activity.In order to estimate the value in use, future cash flows are deducted from the businessplans approved by Company management. These represent the best possible estimate bythe Group of the economic conditions envisaged during the plan period. The planprojections normally cover a period of three years. The long-term growth rate that isused to estimate the final value of the asset or the unit is normally less than the averagerate of long-term growth in the reference sector, country, or market and, if appropriate,can be equal to zero or even be negative. Future cash flows are estimated by referring tocurrent conditions. Therefore, the estimates do not consider either the benefits derivingfrom future restructurings for which the Company has not yet committed itself or futureinvestments for improving or streamlining the asset or unit.If the carrying value of an asset or cash-generating unit is greater than its recoverablevalue, this asset has sustained an impairment loss and is consequently written down toits recoverable value.The impairment losses sustained by functioning assets are recognized on the incomestatement in the cost categories consistent with the function of the asset that showed animpairment loss. Furthermore, at every financial statement closing date, the Group
51
Notes to the Consolidated Financial Statements

assesses any indicators of a decrease in previously recognized impairment losses. Ifthese indicators exist, it makes a new estimate of the recoverable value. With theexception of goodwill, the value of a previously written down asset may be restored onlyif there have been changes in the estimates used to determine the recoverable value ofthe asset after the last measurement of an impairment loss. In this case, the carryingvalue of the asset is restored to the recoverable value. However, the value increased inthis way cannot exceed the carrying value that would have been determined, net ofamortization or depreciation, if no impairment loss had been recognized in previousyears. All restorations of value are recognized as income on the income statement. Aftera recovery in value is recognized, the amortization or depreciation allowance for theasset is adjusted in future periods in order to divide the modified carrying value, net ofany residual values, into equal portions over its remaining useful life.The value of goodwill that has been previously written down may not be restored in anycase to its original value.
Investments in associates
Equity investments in unconsolidated companies that represent long-term investmentsare recognized under non-current assets and valued according to the cost method if theyrepresent less than 20% of the companies’ equity or according to the equity method ifthey represent between 20% and 50% of the companies’ equity.The carrying value of the investment is determined according to the purchase orsubscription price or the value attributed to the contributed assets, including anytransaction costs. The cost is reduced for impairment losses. The original value isrestored in subsequent years if the reasons for the writedown cease to exist.
Inventories
Inventories are recognized at the lesser of purchase and/or production cost, asdetermined by the weighted average cost method, and the presumed net realization orreplacement value. The net realization value is determined according to the estimatedsales price under normal market conditions, net of direct applicable sales costs.Obsolete and/or slow-moving inventories are written down according to their assumedpossibility of use or future realization. The writedown is eliminated in subsequent yearsif its reasons cease to exist.
Trade receivables
Trade receivables whose due date falls within normal commercial terms are recognizedat cost (i.e. their face value) net of any impairment losses. They are adjusted to their
52
Notes to the Consolidated Financial Statements

assumed realizable value through recognition of a specific adjustment reserve, which isaccrued when there is objective evidence that the Group will be unable to collect thereceivable for the original value.Trade receivables whose due date exceeds normal commercial terms are carried atpresent value in order to consider the implicit financial component separately.
Securities
Securities are acquired and held for the purpose of managing cash and cash equivalentsin view of maximizing return while assuring their flexibility, ease of disposal, and lowrisk. They are carried at fair value with recognition of their effects on the incomestatement. The fair value of these instruments is determined by referring to the bid priceat the closing date of the measurement period. In the case of unlisted securities, the fairvalue is determined by means of commonly used financial valuation techniques.
Cash and cash equivalents
These consist of cash on hand, in other words, cash and cash equivalents available onsight or very short notice, successful collection, and absence of fees for collection.
Provisions for risks and liabilities
Provisions for risks and liabilities refer to costs and charges of a specific nature whoseexistence is certain or probable but whose amount or date of occurrence is undeterminedat the closing date of the reference period. Accruals to these provisions are recognizedwhen there is a current legal or implicit obligation deriving from a past event, if anoutlay of resources in order to satisfy the obligation is likely and a reliable estimate ofthe amount of the obligation can be made.The accruals are recognized at the value most representative of the amount that theCompany would pay to extinguish the obligation or to transfer it to third parties at theperiod closing date. If the effect of expressing these items at their present value issignificant, the provisions are determined by calculating the present value of theexpected future cash flows at a pre-tax discount rate reflecting the current market valueof the cost of money at the time. When this calculation is done, the increased accrual dueto the passage of time is recognized as a financial expense.
Employee benefits
The benefits guaranteed to employees and paid upon or after termination of theemployment relationship through defined-benefit plans (post-employment benefits) or
53
Notes to the Consolidated Financial Statements

other long-term benefit plans (retirement indemnities) are recognized during the periodof accrual of the right.The liability generated by defined-benefit plans, net of any assets servicing the plan, isdetermined on the basis of actuarial assumptions and is recognized on an accruals basisconsistently with the service that must be provided to obtain the benefits. The liabilityis valued by independent actuaries using the projected unit credit method. The actuarialgains and losses are recognized on the income statement as a cost or revenue regardlessof their value, and thus without using the corridor approach.The amount reflects not only the liabilities accrued at the balance sheet date but alsofuture wage and salary increases and related statistical changes.
Medium to long-term borrowing
Medium to long-term loans are initially recognized at their fair value, net of anytransaction costs. Following initial recognition, the financial liabilities are recognizedaccording to the amortized cost principle, using the effective original interest ratemethod represented by the rate that equalizes the current value of cash flows and theinitial recognition value (amortized cost method) at the time of initial recognition.
Trade payables
Trade payables that fall due within the limits of normal commercial terms, are not shownat present value and are recognized at cost (as identified by their face value).
Other current liabilities
Other current liabilities are recognized at their face value.
Derivative financial instruments
The Group holds derivative instruments in order to hedge its exposure to changes ininterest rates affecting specific liabilities carried on the balance sheet. Consistently withits chosen strategy, the Group does not execute derivative transactions for speculativepurposes. However, if these transactions cannot be accounted for as hedging operations,they are recognized as speculative transactions.Derivatives are classified as hedging instruments when the relationship between thederivative and the object of the hedge is formally documented and the periodicallyverified effectiveness of the hedge is high. When hedging derivatives cover the risk ofchange in the fair value of hedge instruments (fair value hedge; e.g. hedging the
54
Notes to the Consolidated Financial Statements

variability of the fair value of assets/liabilities at a fixed rate), they are recognized attheir fair value through profit or loss. Consistently with this procedure, the hedgedinstruments are adjusted to reflect changes in the fair value associated with the hedgedrisk. When the derivatives hedge the risk of changes in cash flows generated by theinstruments covered by the hedge (cash flow hedge; e.g. hedging the variability of cashflows of assets/liabilities at a variable rate due to variations in interest rates), the changesin fair value are initially recognized in equity and then recognized on the incomestatement consistently with the economic effects produced by the hedged transaction.The changes in fair value derivatives that do not qualify as hedges are recognized on theincome statement.As stated elsewhere in this section, the Group has exercised its right to apply IASs 32and 39 on a postponed basis, starting from 1 January 2005.
Revenues and costs
Revenues and costs are recognized according to the matching concept. Revenues andincome are recognized at their fair value net of returns, discounts, rebates, andpremiums. Product sale revenues are recognized at the time when ownership changeshands, which generally coincides with shipment of the assets, and entails transfer of allthe risks and benefits connected with the sold products.
Financial income and expenses
Financial income and expenses are recognized according to the matching concept on thebasis of the interest accrued on the net value of the associated financial assets andliabilities, using the effective interest rate.
Income taxes
Accruals for income taxes during the year are calculated according to the costs expectedfrom application of current tax laws. The accrual of current income taxes to income isrecognized on the balance sheet net of tax prepayments and withholding charged.Deferred tax liabilities or assets are also determined according to the temporarydifferences between the assets and liabilities recognized on the balance sheet and thecorresponding values recognized for tax purposes, with the exception of the goodwillderiving from business combinations. In particular, deferred tax assets are recognized ifit is probable that they can be recovered, in other words, when it is envisaged thatsufficient taxable profits will be available in future for their recovery. Deferred taxliabilities are not recognized only if it is improbable that the associated liability willarise. Deferred tax assets and liabilities are determined according to the tax rates that are
55
Notes to the Consolidated Financial Statements

expected to be applicable pursuant to the laws of the various countries in which theGroup operates and in the years when the temporary differences will be realized orextinguished. In accordance with IAS 12, the Group recognizes deferred tax liabilitieson suspended-tax reserves in equity only if these reserves are not recognized bymanagement as being permanently acquired by the Group or when it is improbable thatthey can be used in ways that would generate a tax liability.
Translation of accounts expressed in foreign currency
The euro is the functional currency used by the Zignago Vetro Group for preparation ofits financial statements. Transactions in currencies other than the euro are initiallyrecognized at the exchange rate existing at the transaction date. Monetary assets andliabilities denominated in currencies other than the euro are reconverted into thefunctional currency at the exchange rate in effect at the balance sheet date.Non-monetary accounts recognized at their historical cost in foreign currency aretranslated by using the exchange rate in effect at the date when the transaction wasinitially recognized. Non-monetary accounts recognized at fair value are translated byusing the exchange rate at the date on which this value is determined.
Earnings per share
The base earnings per share is calculated by dividing the net income for the periodallocable to shareholders of the Company by the weighted average number of ordinaryshares outstanding during the reference period.In order to calculate the diluted earnings per share, the weighted average number ofshares outstanding is modified by assuming conversion of all potential shares having adilution effect. The Group’s net income is also adjusted to reflect the effects oftranslation, net of applicable taxes.
Use of estimates
Preparation of the financial statements and notes in accordance with the IFRSs requiresthat management make estimates and assumptions that impact the value of the assets andliabilities carried on the balance sheet and disclosures of potential assets and liabilitiesat the balance sheet date. The actual results might differ from these estimates. Theestimates are used to recognize provisions for doubtful accounts, inventoryobsolescence, amortization, depreciation, impairment losses on assets, employeebenefits, income taxes, and other provisions and reserves. The assumptions and reservesare periodically revised and the effects of all changes are immediately recognized on theincome statement.
56
Notes to the Consolidated Financial Statements

Exchange rate risk hedging policies
Certain Group companies execute transactions in currencies other than the functionalcurrency of the Group. If these transactions are significant, the Group assesses thepossibility of hedging exchange rate risks to mitigate changes in exchange rates.
Interest rate risk hedging policies
Group companies are exposed to the risk of changes in interest rates mainly inconnection with its medium and long-term debts. If these risks are consideredsignificant, Group companies enter into interest rate swaps (IRS) in order to convert thevariable rate of medium to long-term loans into a fixed rate that allows them to reducethe impact stemming from changes in interest rates.
Natural gas price risk hedging policies
Group companies are exposed to the risk of changes in the purchase cost of natural gas.If the Group finds that this risk is significant, the companies enter into swaps in order toconvert the variable cost of methane into a fixed cost that enables them to reduce theimpact stemming from changes in energy costs.
APPLICATION OF IFRSs
The Group applied the following International Accounting Standards (IASs). They didnot change compared with 2005, and they may have been revised by recalculating thecomparative values as necessary.
– IAS 1 Presentation of Financial Statements;
– IAS 2 Inventories;
– IAS 10 Events After the Balance Sheet Date;
– IAS 14 Segment Reporting;
– IAS 17 Leasing;
– IAS 19 Employee Benefits;
– IAS 24 Related Party Disclosures;
– IAS 27 Consolidated and Separate Financial Statements;
– IAS 31 Interests in Joint Ventures;
– IAS 32 Financial Instruments: Disclosure and Presentation (applied starting from1 January 2005);
– IAS 33 Earnings per Share;
– IAS 39 Financial Instruments: Recognition and Measurement (applied starting from1 January 2005).
57
Notes to the Consolidated Financial Statements

Acquisition of equity investment in Vetri Speciali
On 30 June 2006, Zignago Vetro acquired from its then parent company IZSM a 43.5%equity investment in Vetri Speciali, in addition to an option for the purchase of anadditional share of that company’s share capital and certain related agreements.Following reorganization and acquisition, the share capital of Vetri Speciali is owned byZignago Vetro SpA and Owens – Illinois Manufacturing Italy SpA (each holding a43.5% share), with minority shareholders owning the rest (Calfe for 8.0%, NuovaHolding for 4.0%; Falea for 1.0%).This transaction was executed by entities under common control. Transactions betweenentities under common control are specifically excluded from application of IFRS 3 andare generally not regulated by the IFRSs. Therefore, in order to recognize theacquisition, reference was made to other bodies of generally accepted accountingprinciples that envisage application of accounting methods similar to the pooling ofinterest method. These methods envisage that: (i) business combinations betweenentities under common control must be accounted for on the basis of the historicalvalues of the acquired assets and liabilities, as appear in the accounting records of theacquired entity; (ii) the higher value paid for purchase of the equity investment withrespect to the shareholders’ equity at the date of the first consolidated balance sheet mustbe considered as a distribution of reserves by Zignago Vetro SpA in favor of the parentcompany IZSM and accordingly reduce the consolidated shareholders’ equity ofZignago Vetro SpA; (iii) the transaction may be recognized as if it had been executed atthe beginning of the presented period, regardless of the date on which the combinationwas actually realized.Zignago Vetro completed the acquisition of the investment on 30 June 2006, but, for thereasons given above, it is reflected on the income statement as if it had taken place on 1January 2006. Consequently, the consolidated financial statements of the Group for theyear as at 31 December 2006 consist of the consolidated balance sheet as at 31December 2006, which also reflects the proportional consolidation of 43.5% of VetriSpeciali, and of the consolidated income statement for the year ended 31 December2006, which includes the proportional consolidation of the financial figures of VetriSpeciali from 1 January 2006.The sales price was €21,471 thousand, including transaction costs and the previouslymentioned call option, and was €2,273 thousand higher than the carrying values as at31 December 2005 of the 43.5% share of the net assets acquired by the Vetri SpecialiGroup, equal to €19,198 thousand.
58
Notes to the Consolidated Financial Statements

These carrying values and the comparison with the price paid are summarized in thefollowing table:
(in € ’000) IFRS carrying value as at 31 December 2005
Property, plant and equipment 15,953Goodwill 34,772Other non-current assets 471Inventories 5,395Trade receivables 8,566Other current assets 520Cash and cash equivalents 535
Total assets 66,212
Provisions for risks and liabilities 104Provision for post-employment benefits 2,561Medium to long-term borrowings 26,193Other non-current liabilities 277Deferred tax liabilities 2,637Bank borrowings and current portion of medium to long-term borrowings 8,435Trade payables 4,446Other current liabilities 1,716Payables for current taxes 645
Total liabilities 47,014
Net assets purchased 19,198Price paid 21,471Difference 2,273
The price paid was based on the following elements:
(in € ’000)
IFRS-compliant shareholders’ equity of Vetri Speciali as at 30 June 2006 20,879Value of call option acquired 563Transaction costs 29
Total price paid 21,471
The call option for purchase of an additional quota of the share capital of Vetri Speciali,which was acquired together with the equity investment, was recognized on the ZignagoVetro balance sheet pursuant to IFRSs according to the amortized cost method. In thisspecific case, that cost was zero at the balance sheet date.The price was paid on 27 September 2006.As previously described, the difference between the cost paid for purchase of the equityinvestment and the corresponding quota of shareholders’ equity acquired, €2,273thousand, was deducted from the consolidated equity of Zignago Vetro.The Vetri Speciali Group contributed to the consolidated net income of the Group as at31 December 2006 in the amount of €4,319 thousand.
59
Notes to the Consolidated Financial Statements

31.12.2006 31.12.2005
NON-CURRENT ASSETS 102,626 62,001
31.12.2006 31.12.2005
1 – Property, plant and equipment 66,068 60,305
The following table illustrates the changes in the historical cost, accumulateddepreciation, and net value of property, plant and equipment in the periods considered:
(in € ’000) 31.12.2006 31.12.2005
Historical Accum. Net Historical Accum. NetCost deprec. value Cost deprec. value
Land and buildings 33,711 19,906 13,805 22,558 15,055 7,503
Plant and machinery 183,017 138,745 44,272 156,333 110,805 45,528
Industrial and commercial equipment 59,807 52,400 7,407 44,829 38,347 6,482
Other assets 3,629 3,136 493 2,957 2,583 374
Assets under construction 91 0 91 418 0 418
Total property, plant andequipment 280,255 214,187 66,068 227,095 166,790 60,305
The following table illustrates the changes in property, plant and equipment as at 31December 2006:
(in € ’000) Balance Acquisition Purchases Decreases Deprec. Balance01.01.2006 Vetri and 31.12.2006
Speciali capitaliz.
Land and buildings 7,503 7,597 87 0 (1,382) 13,805
Plant and machinery 45,528 7,439 5,480 (43) (14,132) 44,272
Industrial and commercial equipment 6,482 845 10,704 (4,431) (6,193) 7,407
Other assets 374 64 338 (29) (254) 493
Assets under construction and advances paid 418 8 85 (420) 0 91
Total property, plant andequipment 60,305 15,953 16,694 (4,923) (21,961) 66,068
60
Notes to the Consolidated Financial Statements
COMMENTS ON THE MAIN BALANCE SHEET ACCOUNTS

The following table illustrates the changes in property, plant and equipment as at 31December 2005:
(in € ’000) Balance Acquisitions Decreases Depreciation Balance01.01.2005 and 31.12.2005
capitaliz.
Land and buildings 8,299 156 0 (952) 7,503
Plant and machinery 55,633 1,982 (169) (11,918) 45,528
Industrial and commercial equipment 6,706 9,239 (4,042) (5,421) 6,482
Other assets 449 170 (29) (216) 374
Assets under construction andadvances paid 147 419 (148) 0 418
Total 71,234 11,966 (4,388) (18,507) 60,305
The following table illustrates the value of leased buildings accounted for according tothe finance-lease method (with indication of the value of the property and any leaseholdimprovements), and the value of owned buildings for fiscal 2006:
(in € ’000) Balance Acquisition Reclassi- Decreases Depreciation Balance01.01.2006 Vetri fications 31.12.2006
Speciali
Value of lease agreement 0 5,367 (1,042) 0 (271) 4,054
Leasehold improvements 0 226 16 (30) 212
Total leased buildings 0 5,593 (1,042) 16 (301) 4,266
Total owned buildings 7,503 2,004 1,042 71 (1,081) 9,539
Total land and buildings 7,503 7,597 0 87 (1,382) 13,805
Property, plant and equipment totaled €66,068 thousand as at 31 December 2006, aftercharging €21,961 thousand for depreciation for the period, investments for €16,694thousand, and contribution of €15,593 thousand from the investment in VetriSpeciali.
Land and buildings
In addition to owned property, this account includes leased buildings, which areaccounted for according to the finance-lease method.The balance as at 31 December 2005 was €7,503 thousand, and as at 31 December 2006it was €13,805 thousand. The increase is largely attributable to the acquisition of VetriSpeciali.
61
Notes to the Consolidated Financial Statements

In December 2001, the company Vetrerie Venete, which was taken over by and mergedwith Vetri Speciali in 2005, had entered into a contract for sale and lease back withMedio Credito Trentino Alto Adige, with the object of the contract being that company’sindustrial plant. In 1998, the company Nord Vetri, which was taken over by and mergedwith Vetri Speciali in 2005, had entered into a finance lease agreement whose object wasits own industrial plant.The increases for 2005 mainly refer to remodeling carried out by the parent company,which continued in 2006.Depreciation totaled €952 thousand in 2005 and €1,382 thousand in 2006. The increasewas attributable to acquisition of the subsidiary Vetri Speciali in 2006.
Plant and machinery
The balance as at 31 December 2005 was €45,528 thousand and €44,272 thousand asat 31 December 2006.
The increases for 2006, totaling €5,480 thousand, include €3,271 thousand for thesubsidiary Verreries Brosse, particularly for the refurbishment of the furnace forautomatic production and a furnace for semi-automatic production, as well asimprovement of product quality and plant safety in general. The increases at the parentcompany, for €1,847 thousand and those for Vetri Speciali, for €541 thousand, refer topurchases of new plant and machinery.
The increases for 2005, totaling €1,982 thousand, include €934 thousand for thesubsidiary Verreries Brosse, particularly for the automatic palleting plant, constructionof new spaces for plant personnel, and improvement of product quality and plant safetyin general, and €1,048 thousand for purchases of new plant and machinery by the parentcompany.
Depreciation totaled €11,918 thousand in 2005 and €14,132 thousand in 2006. Theincrease is attributable to acquisition of the subsidiary Vetri Speciali in 2006.
Industrial and commercial equipment
The balance as at 31 December 2005 was €6,482 thousand and €7,407 thousand as at31 December 2006.The increases for 2006, totaling €10,704 thousand, include €8,757 thousand referringto the parent company for purchase of new equipment, especially moulds and pallets.
62
Notes to the Consolidated Financial Statements

The increases at the subsidiary Verreries Brosse totaled €2,379 thousand, including€1,062 thousand for moulds. The increases at Vetri Speciali totaled €718 thousand andrefer almost entirely to the purchase of moulds.The decreases for 2006, totaling €4,431 thousand, include €4,413 thousand upondisposal by the parent company of moulds and pallets that could no longer be used.
The increases for 2005, totaling €9,239 thousand, include €7,404 thousand which referto the parent company and concern the purchase of new moulds and pallets for €6,532thousand and the purchase of new equipment for €872 thousand. The increases atVerreries Brosse totaled €1,835 thousand, of which €1,139 thousand refer to newmoulds.The decreases for 2005, totaling €4,042 thousand, mainly refer to disposal by the parentcompany of moulds and pallets that could no longer be used.
Other assets
The balance as at 31 December 2005 was €374 thousand and €493 thousand as at 31December 2006.
Assets under construction and advances paid
The balance as at 31 December 2005 was €418 thousand and €91 thousand as at 31December 2006.Assets under construction decreased due to completion of the new work underway at theend of 2005, especially by the company Verrerie Brosse.
31.12.2006 31.12.2005
2 – Goodwill 34,772 0
The value of €34,772 thousand entered as goodwill at 31 December 2006 refers to thegains paid for acquisition by Vetri Speciali for industrial enterprises operating in thespecialty glass containers sector: Nord Vetri, Attività Industriali Friuli, and VetrerieVenete, as part of the corporate reorganization that took place in 2004. These companiesoperated in a specific sector characterized by high investments that do not envisagetechnological changes.The value of goodwill was subjected to an impairment test. The impairment test,calculated according to the expected cash flows attributable to the sole cash generatingunit “Vetri Speciali,” did not reveal the need for making any impairment losses.
63
Notes to the Consolidated Financial Statements

31.12.2006 31.12.2005
3 – Intangible assets 214 238
The following table shows the changes in historical cost and accumulated amortizationof intangible assets during the periods considered:
(in € ’000) Balance at 31.12.2006 Balance at 31.12.2005
Historical Accum. Net Historical Accum. NetCost Amortiz. Value Cost Amortiz. Value
Concessions, licences, trademarks,sim. rights 771 (557) 214 484 (246) 238
The following tables shows the changes in intangible assets during the fiscal yearsconsidered:
(in € ’000) Balance Purchases Decreases Amortiz. Balance01.01.2006 31.12.2006
Concessions, licenses, trademarks,and similar rights 238 126 (135) (150) 214
Total intangible assets 238 126 (135) (150) 214
(in € ’000) Balance Purchases Amortiz. Balance01.01.2005 31.12.2005
Concessions, licenses,trademarks,and similar rights 286 62 (110) 238
Total intangible assets 286 62 (110) 238
This account refers mainly to the costs incurred for purchase of software applicationswith a long-term useful life, utilized for operations and research activities.Investments totaled €126 thousand in fiscal 2006 and consisted of application softwarepurchased by Zignago Vetro for €45 thousand, by Vetri Speciali for €69 thousand, andby Verreries Brosse for €12 thousand.Investments totaled €62 thousand in fiscal 2005 and consisted of application softwarepurchased by Verreries Brosse and new international registrations of ornamental modelsby Vetri Speciali.
64
Notes to the Consolidated Financial Statements
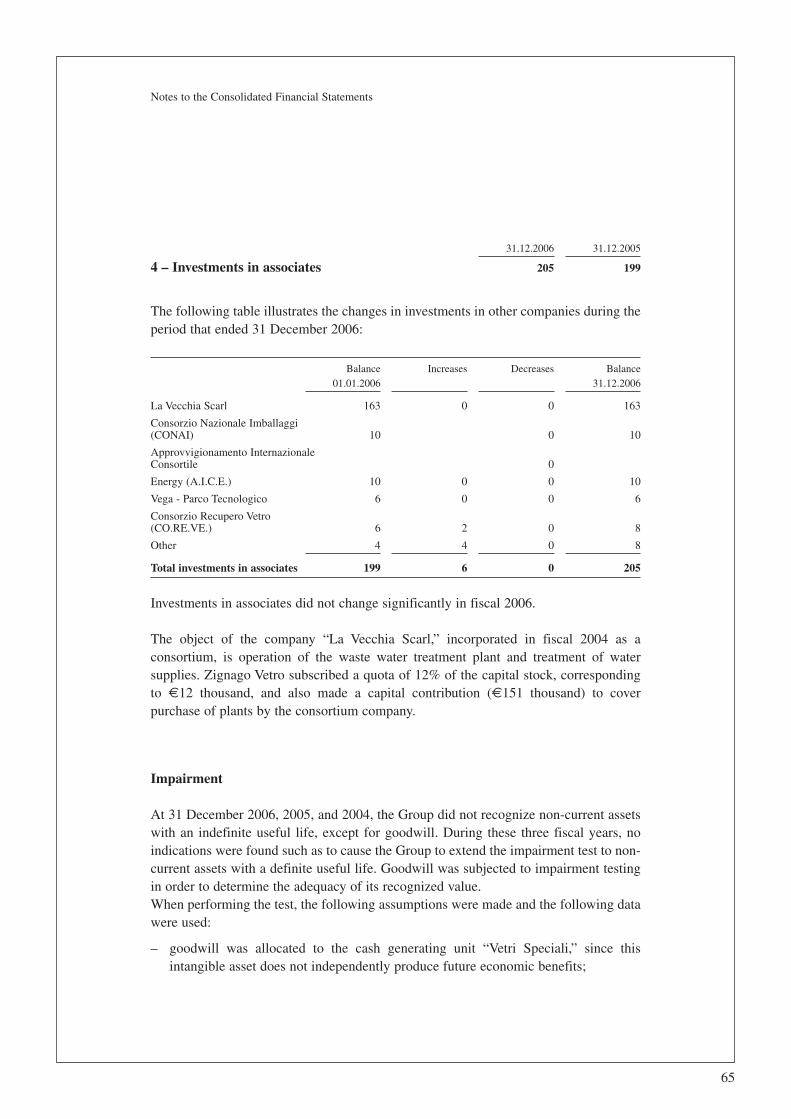
31.12.2006 31.12.2005
4 – Investments in associates 205 199
The following table illustrates the changes in investments in other companies during theperiod that ended 31 December 2006:
Balance Increases Decreases Balance01.01.2006 31.12.2006
La Vecchia Scarl 163 0 0 163
Consorzio Nazionale Imballaggi(CONAI) 10 0 10
Approvvigionamento InternazionaleConsortile 0
Energy (A.I.C.E.) 10 0 0 10
Vega - Parco Tecnologico 6 0 0 6
Consorzio Recupero Vetro(CO.RE.VE.) 6 2 0 8
Other 4 4 0 8
Total investments in associates 199 6 0 205
Investments in associates did not change significantly in fiscal 2006.
The object of the company “La Vecchia Scarl,” incorporated in fiscal 2004 as aconsortium, is operation of the waste water treatment plant and treatment of watersupplies. Zignago Vetro subscribed a quota of 12% of the capital stock, correspondingto €12 thousand, and also made a capital contribution (€151 thousand) to coverpurchase of plants by the consortium company.
Impairment
At 31 December 2006, 2005, and 2004, the Group did not recognize non-current assetswith an indefinite useful life, except for goodwill. During these three fiscal years, noindications were found such as to cause the Group to extend the impairment test to non-current assets with a definite useful life. Goodwill was subjected to impairment testingin order to determine the adequacy of its recognized value.When performing the test, the following assumptions were made and the following datawere used:
– goodwill was allocated to the cash generating unit “Vetri Speciali,” since thisintangible asset does not independently produce future economic benefits;
65
Notes to the Consolidated Financial Statements

– the financial figures are obtained from the 2007-2009 business plan prepared by theCompany;
– in order to determine cash flows, the value of investments and the change in netcurrent assets was stripped from EBITDA. In particular, the cash flow for 2009, usedas a constant value for obtaining the terminal value, was obtained by assuming thatthe value of investments was equal to the value of amortization;
– the cash flows were discounted at the WACC, determined on the basis of thefollowing assumptions:
– risk free rate: 3.84%;
– beta: 1.1;
– risk premium (country risk): 5%;
– debt-to-equity ratio: deduced from the exact figures of the company at 31December 2006.
– The terminal value was determined by considering the same cash flow in 2009 asbeing constant for nine years and by taking the present value of these amounts. Therate of growth, g, was prudently estimated to be zero.
– In order to determine the recoverable value, reference was made to the value in use.
31.12.2006 31.12.2005
5 – Other non-current assets 83 63
The account in question, which was €63 thousand as at 31 December 2005 and €83thousand as at 31 December 2006, consists of receivables for security deposits atsuppliers of servomechanisms and property companies whose duration is correlated tothe duration of the reference agreement, which normally has a term of between one andfive years.
66
Notes to the Consolidated Financial Statements

31.12.2006 31.12.2005
6 – Deferred tax assets 1,284 1,196
The following table illustrates the composition of deferred tax assets in the periodsconsidered:
(in € ’000) 31.12.2006 31.12.2005
Amount of Tax effect Amount of Tax effecttemporary temporary
differences differences
Taxed provision for doubtfulaccounts 1,049 346 954 314
Agent indemnity provision 330 123 319 119
Industrial risks provision 368 138 728 271
Contractual risks provision 28 10 27 10
Pension indemnity provision 767 256 730 247
Intercompany profit on inventories 97 36 0 0
Adjustment of provision forpost-employment benefits 51 19
Amortization and depreciationdeductible in subsequent years 373 139 580 216
Fair value measurement ofderivative financial instruments 296 97 0 0
Harmonization of accountingstandards 269 100 0 0
Others 39 0
Total deferred tax assets 1,284 1,196
Group companies fully recognized deferred tax assets resulting from temporarydifferences that arose between the value of the assets and liabilities identified forstatutory purposes and the corresponding tax value, since they believe that the futuretaxable amounts will absorb all the temporary differences (including consolidationadjustments) that generated them. In determining deferred tax assets, reference wasmade to the corporate income tax (IRES) rate (33%) and, when applicable, to the Italianregional business tax (IRAP) rate (4.25%).Deferred tax assets refer principally to accrual of tax provisions for technical riskprovisions, the provision for complaint risks, the provision for doubtful accounts, andthe provision for pension indemnities.
The change of €88 thousand as at 31 December 2006 from the previous year isprincipally attributable to use by Zignago Vetro of the industrial risk provision followingreimbursement of damages to a customer, in addition to the increases resulting fromchange in the scope of consolidation.
67
Notes to the Consolidated Financial Statements

The tax prepayments as at 31 December 2006 for recognition at fair value of financialinstruments refer exclusively to the commodity swap entered into by Zignago Vetro on3 November 2006. The interest rate swap to which Vetri Speciali was party at 31December 2006 does not generate deferred tax assets, since the value of that swap issubject to taxation following application of IFRSs by Vetri Speciali.
The changes in deferred tax assets during the fiscal years considered are as follows:
(in € ’000)
Balance at 31 December 2004 1,006
Utilization (75)
Increases 265
Balance at 31 December 2005 1,196
Acquisition of Vetri Speciali 223
Utilization (454)
Increases 319
Balance at 31 December 2006 1,284
31.12.2006 31.12.2005
CURRENT ACTIVITIES 101,769 109,470
31.12.2006 31.12.2005
7 – Inventories 41,781 34,779
The following table illustrates the breakdown of inventories:
Balance at Balance at31.12.2006 31.12.2005
Raw and ancillary materials and consumables 5,175 4,767
Work in progress and semi-finished products 3,197 2,632
Finished products 34,089 28,257
Inventory impairment provision (680) (877)
Total 41,781 34,779
Inventories totaled €41,781 thousand as at 31 December 2006, compared with €34,779thousand as at 31 December 2005.The increase is largely accounted for by Zignago Vetro, whose inventories are returningto normal levels for business operations after the decreases occurred in the last years dueto the refurbishment of one of the furnaces.
68
Notes to the Consolidated Financial Statements

Inventories as at 31 December 2005 increased by €4,588 thousand compared with theprevious year. This change is explained by the increase in production volumes and thetemporary stop of one of the furnaces at Zignago Vetro in 2004, which caused aslowdown in production and consequent lowering of the normal level of inventories.The obsolescence provision refers to the subsidiary Verreries Brosse. The €197thousand decrease in this reserve during 2006 and €233 thousand during 2005 reflectedthe high level of scrapping of obsolete products that were no longer marketable.
31.12.2006 31.12.2005
8 – Trade receivables 50,281 41,344
The following table illustrates the breakdown of trade receivables from customers andassociated adjustment reserves:
Balance at Balance at31.12.2006 31.12.2005
Receivables from domestic customers 28,752 25,292
Receivables from international customers 14,556 11,300
Receivables from parent companies 3 0
Receivables credited subject to collection 8,907 6,120
Provision for doubtful accounts (1,937) (1,368)
Total trade receivables 50,281 41,344
The increase in trade receivables is connected to contingent invoicing factors, in additionto the contribution made by the new scope of consolidation, €8,334 thousand.Most of the receivables of Zignago Vetro, which represent 63.6% of Group receivables,are secured by insurance policies.The company did not have significant concentrations of credit risk at the reference date.
The following changes occurred in the provision for doubtful accounts:
Balance at Balance at31.12.2006 31.12.2005
Reserve at the beginning of the period (1,368) (1,269)
Consolidation of Vetri Speciali (485) 0
Accruals (195) (144)
Utilization 111 45
Total (1,937) (1,368)
69
Notes to the Consolidated Financial Statements

Considering the existing insurance policies, the provision for doubtful accountsincreased by €195 thousand to cover risk positions that arose during the year orreceivables that became uncollectible during the year.
The following table illustrates the breakdown of trade receivables by region at the endof every period considered:
Balance at Balance at31.12.2006 31.12.2005
Italy 33,733 28,592
European Union 12,144 10,033
Other countries 4,404 2,719
North America 2,560 872
Total trade receivables 50,281 41,344
31.12.2006 31.12.2005
9 – Other current assets 760 300
The following table illustrates the composition of other current assets:
Balance at Balance at31.12.2006 31.12.2005
Advances to social security institutions and other receivablesfrom employees and agents 77 16
Advances to suppliers 49 26
Other receivables 351 16
Total sundry receivables 477 58
Accrued income for interest income 0 72
Accrued income for services 25
Prepaid expenses for:
– insurance premiums 200 139
– leases and rentals 58 31
Total accrued income and prepaid expenses 283 242
Total other current assets 760 300
Advances to social security institutions refer to payment of the INAIL prepayment.The advances to suppliers refer to payments advanced against services that will berendered in future.
70
Notes to the Consolidated Financial Statements
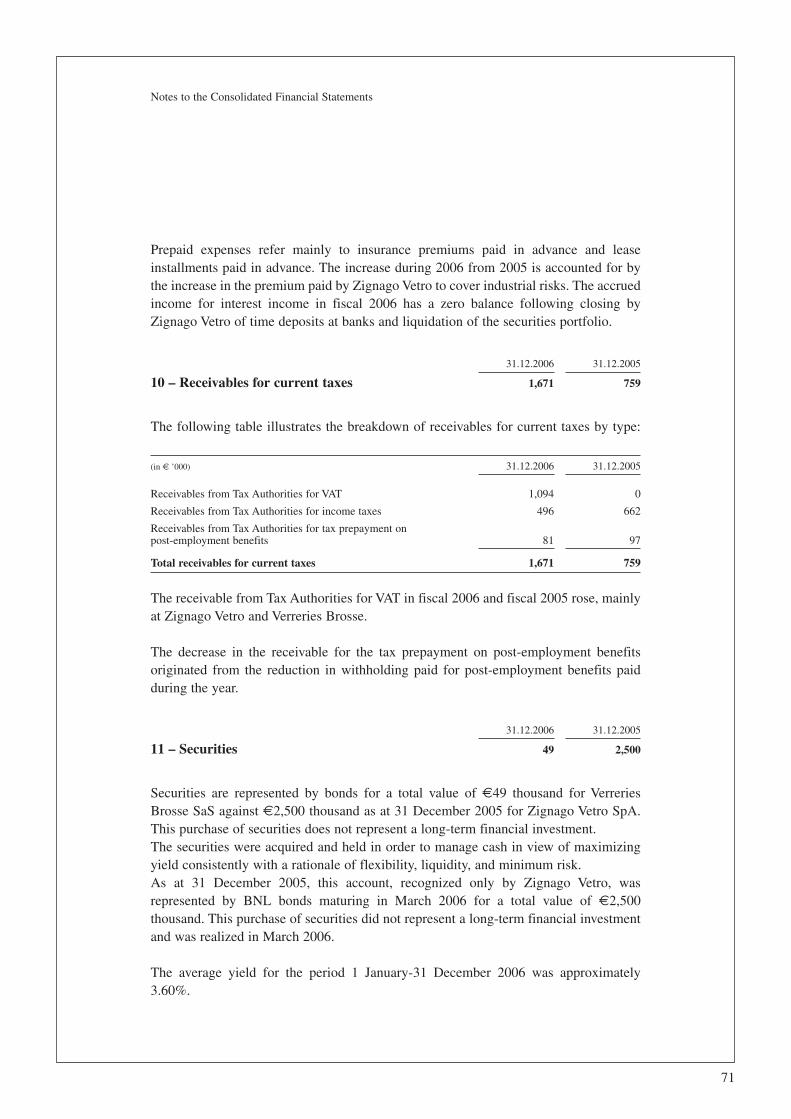
Prepaid expenses refer mainly to insurance premiums paid in advance and leaseinstallments paid in advance. The increase during 2006 from 2005 is accounted for bythe increase in the premium paid by Zignago Vetro to cover industrial risks. The accruedincome for interest income in fiscal 2006 has a zero balance following closing byZignago Vetro of time deposits at banks and liquidation of the securities portfolio.
31.12.2006 31.12.2005
10 – Receivables for current taxes 1,671 759
The following table illustrates the breakdown of receivables for current taxes by type:
(in € ’000) 31.12.2006 31.12.2005
Receivables from Tax Authorities for VAT 1,094 0
Receivables from Tax Authorities for income taxes 496 662
Receivables from Tax Authorities for tax prepayment onpost-employment benefits 81 97
Total receivables for current taxes 1,671 759
The receivable from Tax Authorities for VAT in fiscal 2006 and fiscal 2005 rose, mainlyat Zignago Vetro and Verreries Brosse.
The decrease in the receivable for the tax prepayment on post-employment benefitsoriginated from the reduction in withholding paid for post-employment benefits paidduring the year.
31.12.2006 31.12.2005
11 – Securities 49 2,500
Securities are represented by bonds for a total value of €49 thousand for VerreriesBrosse SaS against €2,500 thousand as at 31 December 2005 for Zignago Vetro SpA.This purchase of securities does not represent a long-term financial investment.The securities were acquired and held in order to manage cash in view of maximizingyield consistently with a rationale of flexibility, liquidity, and minimum risk.As at 31 December 2005, this account, recognized only by Zignago Vetro, wasrepresented by BNL bonds maturing in March 2006 for a total value of €2,500thousand. This purchase of securities did not represent a long-term financial investmentand was realized in March 2006.
The average yield for the period 1 January-31 December 2006 was approximately3.60%.
71
Notes to the Consolidated Financial Statements

31.12.2006 31.12.2005
12 – Cash and cash equivalents 7,227 29,788
The following table illustrates the composition of cash and cash equivalents:
(in € ’000) 31.12.2006 31.12.2005
Time deposits at banks 0 19,500
Current bank and postal accounts 7,214 10,286
Cash on hand 13 2
Total 7,227 29,788
As at 31 December 2006 cash and cash equivalents totaled €7,227 thousand, against€29,788 thousand as at 31 December 2005, for a decrease of €22,561 thousand. Thiswas explained by the payment of dividends for €40,000 thousand and payment of theequity investment in Vetri Speciali for €21,471 thousand on 27 September 2006.The cash and cash equivalents as at 31 December 2005 were invested in time depositsat banks for a maximum term of 3 months at an interest rate of 2.65%.
31.12.2006 31.12.2005
SHAREHOLDERS’ EQUITY 61,336 89,660
31.12.2006 31.12.2005
13 – Shareholders’ equity 61,336 89,660
Share capital
The share capital of Zignago Vetro SpA as at 31 December 2006, fully subscribed andpaid in, was increased to 80,000,000 ordinary shares with a par value of €0.10 each,with withdrawal of €3,868 thousand from the revaluation reserve. As at 31 December2005, it consisted of 80,000 ordinary shares with a par value of €51.65 each.
The share capital of Zignago Vetro as at 31 December 2005, fully subscribed and paidin, consisted of 80,000 ordinary shares with a par value of €51.65 each.
72
Notes to the Consolidated Financial Statements

Revaluation reserves
The revaluation reserves consist of the positive balances of monetary revaluationresulting from application of the following laws:
(in € ’000) 31.12.2006 31.12.2005
Law 342/2000 reserve 24,823 28,691
Law 72/1983 reserve 932 932
Law 413/1991 reserve, released 1,539 1,579
Total 27,294 31,202
The Law 342/2000 reserve is net of the substitute tax.
The account “other reserves” consists exclusively of the reserves envisaged in Article 55of Italian Presidential Decrees 597/1973 and 917/1986 for €6,960 thousand.
The translation reserve reflects the differences from translation into Euro of the financialstatements of Brosse USA Inc. and Vetri Speciali Inc., which are expressed in a foreigncurrency.
The breakdown of reserves qualifying for deferred taxation during the period consideredis illustrated as follows:
The translation reserve covers differences of translation into Euro of the financialstatements expressed in foreign currency by Brosse USA Inc. and Vetri Speciali Inc.
The decrease of €28,324 thousand in shareholders’ equity during 2006 compared with31 December 2005 is the result of the income of €15,415 thousand for the year, thepayment of €41,401 in dividends by Zignago Vetro SpA (€40,000 thousand) and VetriSpeciali SpA (€1,401 thousand), the effect due to purchase by IZSM and subsequentconsolidation of the now jointly controlled subsidiary Vetri Speciali SpA for €2,273thousand (not consolidated until after 31 December 2005), and the change in thetranslation reserve by a negative €65 thousand.
73
Notes to the Consolidated Financial Statements

31.12.2006 31.12.2005
NON-CURRENT LIABILITIES 58,303 28,193
31.12.2006 31.12.2005
14 – Provisions for risks and liabilities 1,562 1,949
The following table illustrates the breakdown of various liabilities and risk reserves:
(in € ’000) 31.12.2006 31.12.2005
Supplemental agent indemnity provision 342 318
Provision for contractual risks 28 26
Provision for industrial risks 368 730
Provision for retirement indemnities 767 730
Provision for tax risks 57 145
Total Provisions for risks and liabilities 1,562 1,949
Supplemental agent indemnity provision
The supplemental agent indemnity provision is accrued in accordance with law andcollective bargaining agreements to cover interruptions of agency relationships withagents.
The following table illustrates changes in the provision during the considered years:
(in € ’000) 2006 2005
Provision as at 1 January 318 338
Accruals 24 4
Utilization 0 (24)
Provision as at 31 December 342 318
Provision for technical, commercial and other typical business risks
The provision of technical risks, which as at 31 December 2006 and 31 December 2005was zero, was fully released in fiscal 2005 following issuance of the appeal judgment bythe Council of State, which barred the decision previously issued by the AntitrustAuthority.
74
Notes to the Consolidated Financial Statements

Provision for contractual risks
The provision for contractual risks is accrued against claims pending trial, principally inregard to employee lawsuits. The following table illustrates the change in the provisionduring the years considered:
(in € ’000) 2006 2005
Provision as at 1 January 26 205
Combination of Vetri Speciali 9 0
Accruals 0 0
Utilization (7) (179)
Provision as at 31 December 28 26
As at 31 December 2006 the reserve for contractual risks totaled €28 thousand,decreasing by €7 thousand upon conclusion of a lawsuit against Zignago Vetro.In the year that ended 31 December 2005, the provision was used or released to theincome statement for a total of €211 thousand against payments made or followingformal settlement of pending controversies.
Provision for industrial risks
The following table illustrates changes in the provision during the years considered:
(in € ’000) 2006 2005
Provision as at 1 January 730 764
Combination of Vetri Speciali 95 0
Accruals 178 58
Utilization (635) (92)
Provision as at 31 December 368 730
The industrial risks provision was accrued to cover complaints by customers due toproduction defects to be settled and potential losses on packaging materials for which abuy-back commitment had been reached.In fiscal 2006, the provision was used for €635 thousand, with €518 thousand beingallocable to settlement by Zignago Vetro of a dispute with a customer.In 2005, €154 thousand were accrued to cover new controversies undertaken in 2005,and a utilization of €118 thousand, principally to cover settlement of a dispute with acustomer.
75
Notes to the Consolidated Financial Statements

Provision for retirement indemnities
The provision for retirement indemnities accrued by Verreries Brosse refers to theestimated liability towards employees who terminate their employment relationship withthe company solely in order to retire, net of what has already been paid into a specificinsurance fund.
(in € ’000) 2006 2005
Provision as at 1 January 730 668
Accruals 37 62
Utilization 0 0
Provision as at 31 December 767 730
Provision for tax risks
The following table illustrates the changes in the provision during the periodsconsidered:
(in € ’000) 2006 2005
Provision as at 1 January 145 239
Accruals 0 0
Utilization (88) (94)
Provision as at 31 December 57 145
The provision for tax risks recognized by Verreries Brosse S.a.S. refers to the estimatedliability for assessments following tax audits covering fiscal 2002 and 2003, against withappeals were filed before the Rouen Tax Commission. The reduction from the accrualfor 2004 is related to the favorable opinion expressed by the aforementionedCommission on certain counter-arguments submitted by the Company.
The reduction of €88 thousand recognized as at 31 December 2006 compared with 31December 2005 is related to partial abandonment of the previous assessments made byFrench Tax Authorities.The reduction recorded as at 31 December 2005 compared with 2004 accruals is relatedto the favorable opinion expressed by the aforementioned Commission on certaincounter-arguments submitted by the Company.
76
Notes to the Consolidated Financial Statements

31.12.2006 31.12.2005
15 – Provision for post-employment benefits 9,894 6,752
The following table illustrates the changes in the provision for post-employment benefitsduring the periods considered:
(in € ’000) 2006 2005
Provision as at 1 January 6,752 6,099
Acquisition / Combination of Vetri Speciali 2,561 0
Accruals 1,651 1,218
Utilization (1,070) (565)
Provision as at 31 December 9,894 6,752
The value of the provision for post-employment benefits was determined by anindependent actuary using the projected unit credit method of the receivable and thefollowing basic assumptions:
– actual mortality rate: these figures were derived by the actuaries by reducing themortality quotients obtained from the ISTAT Simf/f 1998 demographic table by 20%;
– actual disability rate: in order to estimate the real trend of disability rates, a tableconstructed on the basis of assumed mortality differentiated according to age wasused;
– rate of early separation from employment (terminations and resignations): a constantannual rate of 0.5% for senior management, 6% for white-collar employees, and 10%for blue-collar employees was assumed;
– rate of requests for advances on post-employment benefits: a constant average annualrate was assumed, resulting from the product of the rate of employees who requestan advance every year and the percentage of accrued post-employment benefitrequested, equal to 0% for senior management and 3% for white-collar and blue-collar employees;
– interest rate for determination of current value of obligation: this was assumed to be4.1%, on the basis of the estimated trend of the rate curve over the considered timehorizon;
– real rate of wage and salary increases: this rate was assumed to be 4.5% for seniormanagement and 4% for white-collar and blue-collar employees, on the basis of theestimates made by management for compensation increases to be granted toemployees;
– annual future inflation rate: this was estimated to be 2.1% over the considered timehorizon;
77
Notes to the Consolidated Financial Statements

– retirement dates: these were estimated in accordance with applicable law;
– inflation indexing rate for accrued post-employment benefits: this was estimated inaccordance with applicable laws: 1.5% plus 75% of the annual inflation rate.
31.12.2006 31.12.2005
16 – Medium to long-term borrowings 35,883 6,500
The following table illustrates the composition of medium to long-term borrowings:
Note (in € ’000) 31.12.2006 31.12.2005
A. Mediocredito Trentino Alto Adige loan reimbursableby 2013, at a variable rate (3.05% at 31 December 2005,4.7% at 31 December 2006) 17,677 0
B. Non-revolving letter of credit, subscribed with Banco Popolaredi Verona e Novara, Banca Popolare di Vicenza, andCredito Bergamasco, at the Euribor 3/6 months rate + 0.40%,due 21 December 2011 14,940 0
C. Banca Nazionale del Lavoro loan due by 2009, fixed rate of 6% 6,500 9,100
D. Mediocredito Trentino Alto Adige finance lease due by 2013,at variable rate (3.06% at 31 December 2004, 3.04% at31 December 2005, 4.056% at 31 December 2006) 3,836 0
E. Mediocredito Friuli Venezia Giulia loan due by 2008, atfixed rate of 4% 616 0
F. Mediocredito Trentino Alto Adige loan due by 2007, atvariable rate (4.45% at 31 December 2004, 4.20% at31 December 2005, 5.3% at 31 December 2006) 137 0
Total medium to long-term borrowings 43,706 9,100
Minus current installments (7,823) (2,600)
Medium to long-term portion 35,883 6,500
The medium to long-term borrowings outstanding as at 31 December 2006 totaled€35,883 thousand, compared with €6,500 thousand as at 31 December 2005. Theincrease in medium to long-term borrowings is mainly due to consolidation of VetriSpeciali SpA and assumption of a loan by the parent company Zignago Vetro SpA.
78
Notes to the Consolidated Financial Statements

As at 31 December 2006 and 31 December 2005, the annual due dates for medium tolong-term borrowings are as follows:
(in € ’000) 31.12.2006 31.12.2005
Fiscal 2006 2,600
Fiscal 2007 7,823 2,600
Fiscal 2008 9,005 2,600
Fiscal 2009 7,554 1,300
Fiscal 2010 6,325 0
After fiscal 2010 12,999 0
Total medium to long-term borrowings 43,706 9,100
The medium to long-term borrowings outstanding as at 31 December 2005 and 31December 2006 are represented by:
A) Senior note issued in 2005 replacing bridge loan received by Vetri Speciali fromMediocredito Trentino Alto Adige, for a total of €26,252 thousand (Group’s interestin loan), at an ordinary rate for 18 months. This loan, whose initial due date was 11April 2006, was extinguished in fiscal 2005. A senior note was simultaneously issuedwith the same bank, with a reimbursement plan envisaging 12 semiannual deferredinstallments starting 10 November 2007. This loan, which was obtained for thepurchase of equity investments in October 2004, is secured by mortgages and lienson the plants owned by Vetri Speciali. The reduction of the loan in 2006 from 2005is attributable to early reimbursement during the year;
B) Non-revolving letter of credit entered into by Zignago Vetro with Banco PopolareVerona e Novara S.c.r.l., Banca Popolare Vicenza S.c.p.A., and Credito BergamascoSpA on 21 December 2006, for a notional amount of €25,000 thousand, of which€14,940 thousand had been disbursed as at 31 December 2006, due on 21 December2011;
C) Loan obtained by Verreries Brosse from Banca Nazionale del Lavoro to finance thescheduled investment plan. In 2006 and 2005, €2,600 thousand was repaid againstthis loan. The amortization schedule envisages semiannual reimbursements of€1,300 thousand starting 1 June 2004;
D) The residual €3,836 thousand as at 31 December 2006, with a short-term installmentof €349 thousand, corresponding to the Group’s 43.5% interest, stemming fromrecognition of the finance lease entered into by Vetrerie Venete on 14 December 2001according to the finance method. In order to hedge the risk of changes in the interestrate paid for the lease originally entered into by Vetrerie Venete, it entered into anamortized interest rate swap (IRS) agreement on 12 March 2002. See the note onother non-current liabilities for further details on the hedging transaction;
79
Notes to the Consolidated Financial Statements

E) The residual €616 thousand as at 31 December 2006, with a short-term installmentof €406 thousand, corresponding to the Group’s 43.5% interest, for a seven-yearloan granted to Attività Industriali Friuli by Mediocredito del Friuli Venezia Giuliaat the fixed rate of 4%, due 1 January 2008. This loan is secured by a mortgage onreal estate in addition to a standby letter of credit;
F) Loan granted to Nord Vetri by Mediocredito Trentino Alto Adige at a variable rateand due 31 December 2007. This loan is secured by a mortgage on the company’sland and buildings and a lien on its plants. The residual portion of €137 thousand isincluded entirely in the current installment.
In order to hedge the risk of changes in the interest rate paid for the lease originallyentered into by Vetrerie Venete SpA (a company acquired by Vetri Speciali SpA in2004), it entered into an amortized interest rate swap agreement on 12 March 2002, withan original notional value of €5,210 thousand (for the Group’s 43.5% share), due 1January 2010.
Covenants on financing
Against the letter of credit described above at point B, for a notional value of €25,000thousand, of which €14,940 thousand had been disbursed as at 31 December 2006, theparent company is bound by compliance with certain financial indices whosecharacteristics and costs are not inconsistent with general market practice. In particular,Zignago Vetro must comply with the following parameters, to be calculated at theconsolidated level on a periodic basis: (i) the ratio between net indebtedness andEBITDA must be less than 4 for fiscal 2007 and 3 for the subsequent fiscal years untilthe financing due date; and (ii) the ratio between EBITDA and net indebtedness must begreater than 7 for the entire duration of the financing. These parameters were compliedwith as at 31 December 2006.
31.12.2006 31.12.2005
17 – Other non-current liabilities 153 0
The following table illustrates the breakdown of other non-current liabilities:
(in € ’000) 31.12.2006 31.12.2005
Adjustment of the amortized IRS to fair value 153 0
Total other non-current liabilities 153 0
As indicated in the note on long-term borrowings, in order to hedge the risk of changes inthe interest rate paid for a lease agreement originally made by Vetrerie Venete, it entered into
80
Notes to the Consolidated Financial Statements

an amortized interest rate swap agreement on 12 March 2002 with the Banca Popolare diVicenza, whose original notional value was €5,210 thousand (for the Group’s 43.5% share)due on 1 January 2010. It envisages semiannual payment of a differential for interest basedon the 6-month Euribor rate with respect to an agreed fixed interest rate of 5.33%. Thenotional portion of the Group’s residual share of the financing as at 31 December 2006 was€3,841 thousand. Considering the fact that this transaction does not satisfy all theconditions imposed by IAS 39 in order to be qualified as a hedging transaction, it isrecognized as a speculative operation, and the changes in its fair value are recognized in theincome statement. Adjustment of this Amortized IRS to its fair value as at 31 December2006 resulted in recognition of a liability of €153 thousand (for the Group’s 43.5% share).
31.12.2006 31.12.2005
18 – Deferred tax liabilities 10,811 12,992
The following table illustrates the composition of deferred tax liabilities during theperiods considered:
(in € ’000) 31.12.2006 31.12.2005
Amount of Tax effect Amount of Tax effecttemporary temporary
differences differences
Excess and acceleratedamortization and depreciation 18,304 6,818 27,552 10,263
Accelerated amortization anddepreciation for which IRES(corporate income tax) hasbeen paid 4,342 185 5,033 214
Allocation of higher value of assets 2,430 905 0 0
Recognition of finance leasespursuant to IAS 17 664 247 0 0
Adjustment of inventories toaverage cost 863 320 652 243
Adjustment of reserves qualifying for deferred taxation 6,044 2,251 6,044 2,251
Others 85 21
10,811 12,992
The deferred tax liabilities are comprised principally of deferred tax liabilities accruedagainst temporary differences for the amortization and depreciation calculated by theCompany in accordance with Italian tax law (accelerated and excess amortization anddepreciation).It is also comprised of the tax liabilities on the temporary differences originatingbetween the value of inventories calculated according to the LIFO method used for taxpurposes and the value of inventories calculated according to the weighted average cost
81
Notes to the Consolidated Financial Statements

method pursuant to IFRSs, as well as the tax effect on reserves qualifying for deferredtaxation for those referred to reserves for capital contributions and recognition ofmedium and long-term borrowings on the basis of the amortized cost.Following consolidation of Vetri Speciali, the reserve for deferred tax reserves is alsocomprised of the negative tax effect for the residual value of the higher allocated values,principally to plants, upon acquisition of the three glass works by Vetri Speciali. Thedeferred tax liability was calculated because the amortization and depreciation for theseallocations are not tax deductible.
Shareholders’ equity as at 31 December 2006 and 31 December 2005 includes certainreserves qualifying for deferred taxation, which are illustrated as follows:
(in € ’000) 31.12.2006 31.12.2005
Revaluation reservesLaw 342/2000 reserve 24,823 28,691Law 72/1983 reserve 932 932
Other reservesReserve pursuant to Article 55, Presidential Decrees 597/1973and 917/1986 6,167 6,960
Total 31,922 36,583
Deferred tax liabilities were accrued for €2,251 thousand to cover the reservesqualifying for deferred taxation totaling €6,044 thousand and regarding the reserves forcontributions to the capital account (Reserve pursuant to Article 55, Presidential Decrees597/1973 and 917/1986), as indicated in the schedule for deferred tax liabilitiesillustrated above. In accordance with IAS 12, no deferred tax liabilities were accrued forthe revaluation reserves since it is not expected that they will be distributed.The following table illustrates the changes in the provision for deferred tax liabilitiesduring the periods considered:
(in € ’000)
Balance as at 31 December 2004 13,369Utilization (2,596)Increases 2,219
Balance as at 31 December 2005 12,992Acquisition of Vetri Speciali 2,637Utilization (7,221)Increases 2,403
Balance as at 31 December 2006 10,811
Deferred tax liabilities totaled €12,992 thousand as at 31 December 2005 and €10,811thousand as at 31 December 2006. The reduction is principally attributable to the earlyrecovery of accelerated amortization and depreciation at Zignago Vetro following the
82
Notes to the Consolidated Financial Statements
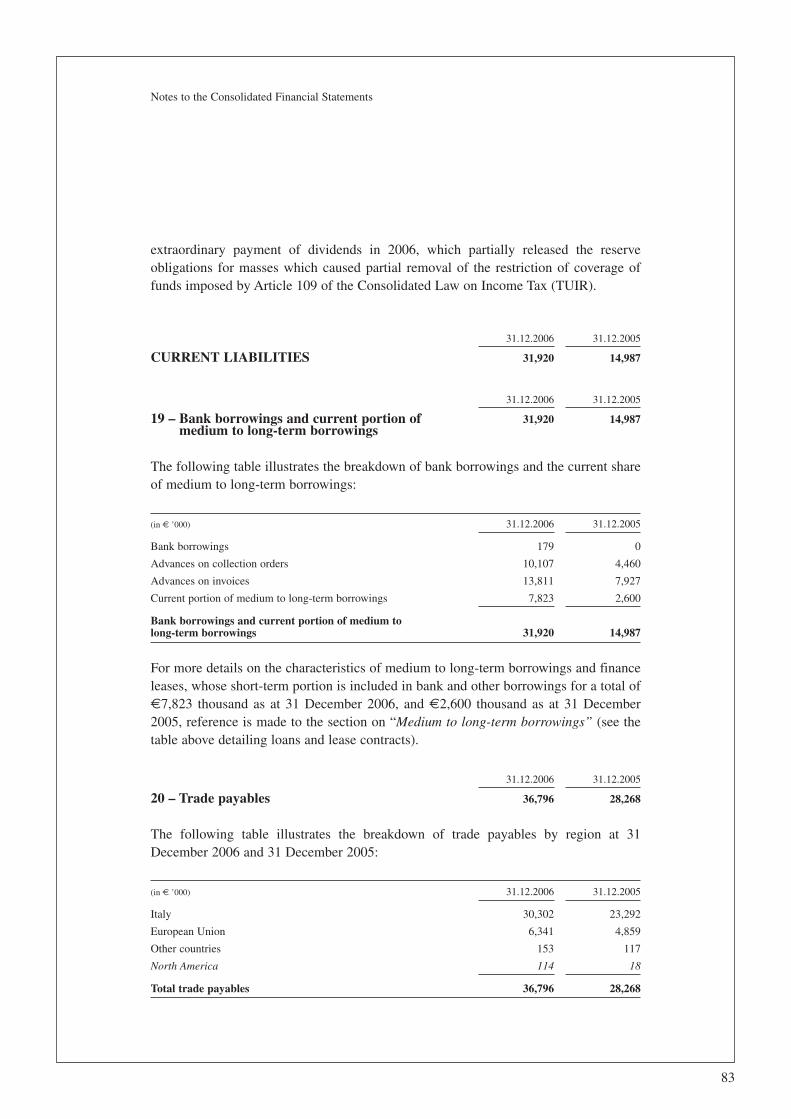
extraordinary payment of dividends in 2006, which partially released the reserveobligations for masses which caused partial removal of the restriction of coverage offunds imposed by Article 109 of the Consolidated Law on Income Tax (TUIR).
31.12.2006 31.12.2005
CURRENT LIABILITIES 31,920 14,987
31.12.2006 31.12.2005
19 – Bank borrowings and current portion of 31,920 14,987medium to long-term borrowings
The following table illustrates the breakdown of bank borrowings and the current shareof medium to long-term borrowings:
(in € ’000) 31.12.2006 31.12.2005
Bank borrowings 179 0
Advances on collection orders 10,107 4,460
Advances on invoices 13,811 7,927
Current portion of medium to long-term borrowings 7,823 2,600
Bank borrowings and current portion of medium tolong-term borrowings 31,920 14,987
For more details on the characteristics of medium to long-term borrowings and financeleases, whose short-term portion is included in bank and other borrowings for a total of€7,823 thousand as at 31 December 2006, and €2,600 thousand as at 31 December2005, reference is made to the section on “Medium to long-term borrowings” (see thetable above detailing loans and lease contracts).
31.12.2006 31.12.2005
20 – Trade payables 36,796 28,268
The following table illustrates the breakdown of trade payables by region at 31December 2006 and 31 December 2005:
(in € ’000) 31.12.2006 31.12.2005
Italy 30,302 23,292
European Union 6,341 4,859
Other countries 153 117
North America 114 18
Total trade payables 36,796 28,268
83
Notes to the Consolidated Financial Statements

Trade payables as at 31 December 2006 totaled €36,796 thousand and increased by€8,528 thousand compared with 31 December 2005. The increase in trade payablesstems primarily from the higher payables attributable to acquisition of Vetri Speciali, aswell as to services connected with the listing project and acquisitions carried out duringthe last part of the year.Trade payables as at 31 December 2005 totaled €28,268 thousand and decreased by€5,503 thousand (– 16.3%) compared with 31 December 2004. The decrease is largelyexplained by the fact that trade payables were outstanding as at 31 December 2004towards plant suppliers for the refurbishment of the Zignago Vetro furnace, which werepaid in 2005.
The payables to suppliers of non-current assets as at 31 December 2006 totaled €2,963thousand, against €1,991 thousand as at 31 December 2005.
31.12.2006 31.12.2005
21 – Other current liabilities 9,969 6,944
The following table illustrates the composition of other current liabilities as at 31December 2006 and 31 December 2005:
(in € ’000) 31.12.2006 31.12.2005
Payables to social security institutions 2,380 1,854
Payables to personnel 6,580 4,873
Payables to institutions for welfare and association contributions 23 23
Payable for Metan (gas) swap hedge 296 0
Advances from customers 156 0
Payables for emission rights 70 0
Other payables 309 194
Accrued liabilities and deferred income:
Interest expenses 135 0
Equipment grants 20 0
Total other current liabilities 9,969 6,944
The other current liabilities as at 31 December 2006 totaled €9,969 thousand, against€6,944 thousand as at 31 December 2005. The increase of €3,025 thousand includes€1,921 thousand for the changed scope of consolidation.
84
Notes to the Consolidated Financial Statements

Payables to social security institutions
The payables to social security institutions refer mainly to payables for contributionsowed on wages and salaries for the month of December, on agent commissions, and onfreelance worker compensation owed for the half-year period and paid in the followinghalf-year period.
Payables to personnel
The following table illustrates the composition of payables to personnel as at 31December 2006 and 31 December 2005:
(in € ’000) 31.12.2006 31.12.2005
Payables to personnel for unused holiday leave, monthly bonus,and accrued bonuses 5,260 3,020
Payables for December wages and salaries 1,320 1,273
Total payables to personnel 6,580 4,293
Payables to personnel for unused holiday leave, monthly bonus, and accrued bonusesrefer to holiday leave accrued but not used at that date and the monthly bonus andexecutive bonuses accrued during the first half, which are paid in the year following theone in which they are accrued.
31.12.2006 31.12.2005
22 – Payables for current taxes 6,071 3,419
(in € ’000) 31.12.2006 31.12.2005
Payables for consolidated corporate income tax (IRES) 3,875 2,133
Withholding on employee and freelance worker income 1,032 682
Income tax 1,100 220
Other income taxes relating to foreign companies 64 384
Total payables for current taxes 6,071 3,419
The payables for income tax principally refer to the payable for current income taxes,net of the associated tax prepayments.
These payables refer to Verreries Brosse and Vetri Speciali, while for Zignago Vetro theyare only for the regional business tax (IRAP). Zignago Vetro participated in the nationaltax consolidation program with the parent company IZSM. Thus, its IRES liabilities areincluded in “Payables for consolidated corporate income tax (IRES).”
85
Notes to the Consolidated Financial Statements

31.12.2006 31.12.2005
23 – Revenues 209,427 155,303
The following table illustrates the breakdown of revenues by type of revenue:
Balance at Balance at31.12.2006 31.12.2005
Core (i.e. ordinary) products 193,617 142,081
Sundry materials 10,401 8,658
Revenues for provision of services 4,357 3,787
Other 1,052 777
Total revenues 209,427 155,303
The following table illustrates the breakdown of revenues by region:
Balance at Balance at31.12.2006 31.12.2005
Italy 145.664 106.882
European Union 40.706 30.431
Other countries 23.057 17.990
North America 10.473 9.599
Total revenues 209.427 155.303
Fiscal 2006, which reflects the changed scope of consolidation due to inclusion of VetriSpeciali (€39,863 thousand), shows an increase in revenues as against 31 December2005. They rose from €155,303 thousand to €209,427 thousand (+ 34.9%). Sales to theItalian market rose from €106,882 thousand to €145,664 thousand (+ 35.3%). Sales toEuropean Union countries rose by 33.8%. Sales in countries outside the European Unionincreased by 28.2%. Sales to North America increased by 8.6%.
86
Notes to the Consolidated Financial Statements
COMMENTS ON THE PRINCIPAL ACCOUNTS OF THE INCOMESTATEMENT

31.12.2006 31.12.2005
24 – Costs for raw & ancillary materials, 52,552 38,891consumables, and merchandise
The following table illustrates the costs for raw & ancillary materials, consumables, andmerchandise:
(in € ’000) 2006 2005
Purchases of raw materials 23,388 19,321
Purchases of merchandise for sale 13,489 10,402
Purchases of ancillary materials and consumables 9,059 5,623
Purchases of maintenance materials 5,008 4,892
Other purchases 3,073 2,827
Total purchases 54,017 43,065
Change in raw & ancillary materials, consumables and merchandiseinventories 396 (86)
Change in work-in-progress, semi-finished, and finished productsinventories (1,741) (4,088)
Enhancements of asset value as a result of in-house work (120) 0
Costs for raw & ancillary materials, consumables, and merchandise 52,552 38,891
The increase in purchases recognized in fiscal 2006, which reflects the changed scopeof consolidation due to inclusion of Vetri Speciali (€9,442 thousand; + 35.1%), isrelated to the increase in sales for fiscal 2006 from the previous year.
31.12.2006 31.12.2005
25 – Costs for services 58,631 43,358
The following table illustrates the breakdown of costs for services:
(in € ’000) 2006 2005
Energy costs 27,460 20,607
Transport costs 8,746 6,957
Outside services 9,777 5,439
Outsourced processing 7,071 5,015
Insurance for industrial risks and trade receivables 1,106 932
Commission expense 1,025 668
Services for personnel 921 770
Rentals and hires 694 574
Technical, legal, tax, and advisory services 334 385
Telephone, fax, and similar costs 308 257
Advertising and promotion 177 133
Compensation paid to corporate bodies 189 101
Others 823 1,520
Total costs for services 58,631 43,358
87
Notes to the Consolidated Financial Statements
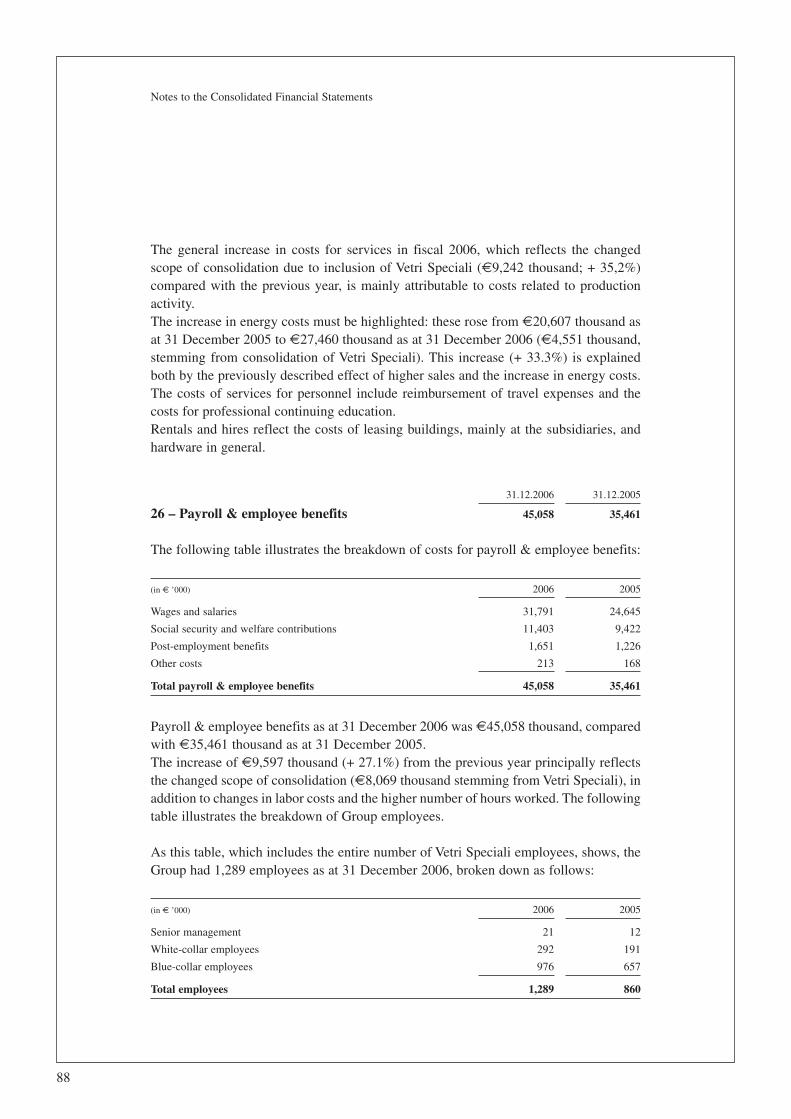
The general increase in costs for services in fiscal 2006, which reflects the changedscope of consolidation due to inclusion of Vetri Speciali (€9,242 thousand; + 35,2%)compared with the previous year, is mainly attributable to costs related to productionactivity.The increase in energy costs must be highlighted: these rose from €20,607 thousand asat 31 December 2005 to €27,460 thousand as at 31 December 2006 (€4,551 thousand,stemming from consolidation of Vetri Speciali). This increase (+ 33.3%) is explainedboth by the previously described effect of higher sales and the increase in energy costs.The costs of services for personnel include reimbursement of travel expenses and thecosts for professional continuing education.Rentals and hires reflect the costs of leasing buildings, mainly at the subsidiaries, andhardware in general.
31.12.2006 31.12.2005
26 – Payroll & employee benefits 45,058 35,461
The following table illustrates the breakdown of costs for payroll & employee benefits:
(in € ’000) 2006 2005
Wages and salaries 31,791 24,645
Social security and welfare contributions 11,403 9,422
Post-employment benefits 1,651 1,226
Other costs 213 168
Total payroll & employee benefits 45,058 35,461
Payroll & employee benefits as at 31 December 2006 was €45,058 thousand, comparedwith €35,461 thousand as at 31 December 2005.The increase of €9,597 thousand (+ 27.1%) from the previous year principally reflectsthe changed scope of consolidation (€8,069 thousand stemming from Vetri Speciali), inaddition to changes in labor costs and the higher number of hours worked. The followingtable illustrates the breakdown of Group employees.
As this table, which includes the entire number of Vetri Speciali employees, shows, theGroup had 1,289 employees as at 31 December 2006, broken down as follows:
(in € ’000) 2006 2005
Senior management 21 12
White-collar employees 292 191
Blue-collar employees 976 657
Total employees 1,289 860
88
Notes to the Consolidated Financial Statements

31.12.2006 31.12.2005
27 – Amortization and depreciation 22,111 18,617
The following table illustrates the breakdown of amortization and depreciation:
(in € ’000) 2006 2005
Depreciation of Property, plant and equipment 21,961 18,507
Amortization of intangible assets 150 110
Total amortization and depreciation 22,111 18,617
Amortization and depreciation in the fiscal year that ended 31 December 2006 totaled€22,111, compared with €18,617 thousand in the previous year, for an increase of€3,494 thousand. This change, representing an 18.8% increase, is entirely due to thechanged scope of consolidation (€3,723 thousand).
31.12.2006 31.12.2005
28 – Other operating costs 2,346 1,717
The following table illustrates the breakdown of other operating costs:
(in € ’000) 2006 2005
Accruals to provision for industrial risks 178 124
Accruals to supplemental customer indemnities 24 0
Accruals to provision for contractual risks 0 0
Accruals to provision for retirement indemnities 37 62
Accruals to provision for tax risks 0 0
Accruals for risk provisions 239 186
Accruals to provision for doubtful accounts 195 144
Sundry taxes 1,051 741
Losses on disposal of non-current assets 200 337
Association membership fees 252 197
Incidental expenses 274 55
Others 135 57
Other costs 1,912 1,387
Total other operating costs 2,346 1,717
The other operating costs as at 31 December 2006 totaled €2,346 thousand, comparedwith €1,717 thousand as at 31 December 2005.
89
Notes to the Consolidated Financial Statements

31.12.2006 31.12.2005
29 – Other operating income 1,136 2,631
The following table illustrates the breakdown of other income:
(in € ’000) 2006 2005
Incidental income 467 366
Incidental income due to use of provisions 0 1,661
Gains on disposal of non-current assets 125 533
Recovery of costs of production 0 0
Others 544 71
Total other operating income 1,136 2,631
The other operating income as at 31 December 2006 was €1,136 thousand, comparedwith €2,631 thousand as at 31 December 2005. The decrease is mainly attributable toincidental income in 2005 from release of the technical risks provision at Zignago Vetrofor €1,549 thousand.
The incidental income stems principally from differences in the amounts recognizedupon preparation of the financial statements.The gains from disposal of non-current assets stem mainly from Zignago Vetro for €115thousand and Vetri Speciali for €10 thousand.
31.12.2006 31.12.2005
30 – Financial income 667 510
The following table illustrates the breakdown of financial income:
(in € ’000) 2006 2005
Bank interest income 473 502
Effect of fair value measurement 124 0
Other 70 8
Total financial income 667 510
Financial income in fiscal 2006 totaled €667 thousand, compared with €510 thousandin the previous year, for an increase of €157 thousand. The increase is principally dueto the positive impact of fair value measurement of derivative instruments, in addition tothe changed scope of consolidation.
90
Notes to the Consolidated Financial Statements

31.12.2006 31.12.2005
31 – Financial expenses 2,787 576
The following table illustrates the breakdown of financial expenses:
(in € ’000) 2006 2005
Interest expenses on loans 1,291 550
Interest expenses on bank borrowings 915 0
Hedging expenses for Metan (gas) swap 296 0
Discounts and other financial expenses 254 9
Others 31 17
Total financial expenses 2,787 576
Financial expenses in fiscal 2006 increased by €2,787 thousand as against 31 December2005 due to the accrual of €296 thousand to hedge the Metan (gas) swap agreemententered into by Zignago Vetro, the increased cost of money in fiscal 2006 from theprevious year, and the effect attributable to accounting of loans according to theamortized cost method.
31.12.2006 31.12.2005
32 – Income taxes 12,274 7,806
The following table illustrates the breakdown of income taxes, distinguishing the currentcomponent from deferred tax liabilities and assets:
(in € ’000) 2006 2005
Current taxes 16,820 7,826
Deferred tax liabilities (assets) (4,546) (20)
Total income taxes 12,274 7,806
91
Notes to the Consolidated Financial Statements

The following table illustrates the ratio of income taxes to pre-tax income andhighlights the reconciliation of the theoretical and actual tax burden in each periodconsidered:
(in € ’000) 2006 2005
Income before taxes 27,689 19,659
Ordinary applicable rate 33.00% 33.00%
Theoretical tax burden 9,137 6,487
Permanent differences 326 (381)
Foreign company effect 37 0
Current corporate income tax (IRES) 9,500 6,106
Other taxes (including the regional business tax (IRAP) 2,774 1,700
Total effective tax burden 12,274 7,806
Effective tax burden 44.3% 39.7%
The accrual for income taxes in fiscal 2006, estimated according to current laws, was€12,274 thousand (44.3% of pre-tax income), compared with €7,806 thousand (39.7%of pre-tax income). The lower tax burden for fiscal 2005 is mainly due to the irrelevancefor taxation of the provisions for tax risks released by Zignago Vetro, against whichdeferred tax liabilities had not been accrued, in addition to the different scope ofconsolidation.The IRES and IRAP rates applied reflect the actual tax burden borne by the Company.
92
Notes to the Consolidated Financial Statements
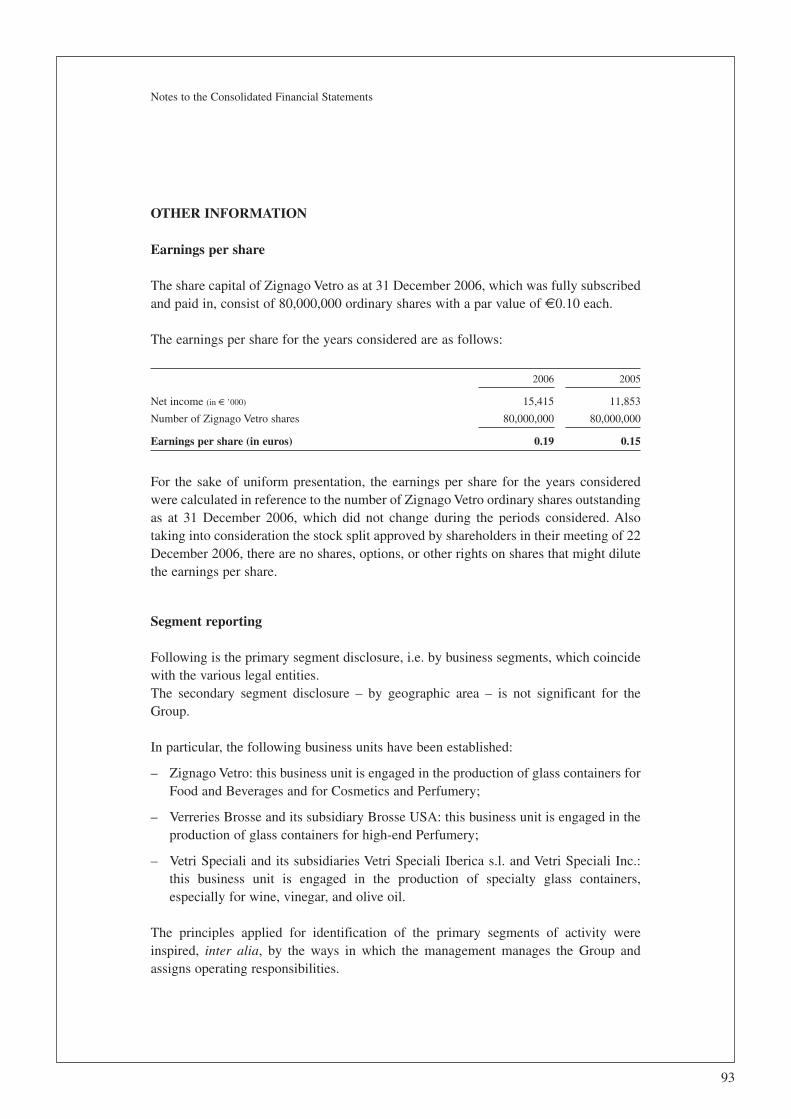
Earnings per share
The share capital of Zignago Vetro as at 31 December 2006, which was fully subscribedand paid in, consist of 80,000,000 ordinary shares with a par value of €0.10 each.
The earnings per share for the years considered are as follows:
2006 2005
Net income (in € ’000) 15,415 11,853
Number of Zignago Vetro shares 80,000,000 80,000,000
Earnings per share (in euros) 0.19 0.15
For the sake of uniform presentation, the earnings per share for the years consideredwere calculated in reference to the number of Zignago Vetro ordinary shares outstandingas at 31 December 2006, which did not change during the periods considered. Alsotaking into consideration the stock split approved by shareholders in their meeting of 22December 2006, there are no shares, options, or other rights on shares that might dilutethe earnings per share.
Segment reporting
Following is the primary segment disclosure, i.e. by business segments, which coincidewith the various legal entities.The secondary segment disclosure – by geographic area – is not significant for theGroup.
In particular, the following business units have been established:
– Zignago Vetro: this business unit is engaged in the production of glass containers forFood and Beverages and for Cosmetics and Perfumery;
– Verreries Brosse and its subsidiary Brosse USA: this business unit is engaged in theproduction of glass containers for high-end Perfumery;
– Vetri Speciali and its subsidiaries Vetri Speciali Iberica s.l. and Vetri Speciali Inc.:this business unit is engaged in the production of specialty glass containers,especially for wine, vinegar, and olive oil.
The principles applied for identification of the primary segments of activity wereinspired, inter alia, by the ways in which the management manages the Group andassigns operating responsibilities.
93
Notes to the Consolidated Financial Statements
OTHER INFORMATION

The following table illustrates the breakdown of segment reporting by segment activities:
2006
(in € ’000) Zignago Verreries Vetri (Elimina- AggregateVetro Brosse Speciali tions)
Revenues 135,935 36,325 39,863 (2,696) 209,427
Amortization and depreciation (14,878) (3,510) (3,723) 0 (22,111)
Operating income 17,840 2,499 9,441 85 29,865
Net income 9,913 1,102 4,319 81 15,415
Assets 132,333 35,334 63,065 (26,337) 204,395
Liabilities 75,677 27,364 40,715 (697) 143,059
Investments in:
Intangible assets (45) (140) (44) 0 (229)
Property, plant and equipment (9,715) (4,401) (1,183) 0 (15,299)
Non-current financial assets (21,471) 0 0 0 (21,471)
2005
(in € ’000) Zignago Verreries (Eliminations) AggregateVetro Brosse
Revenues 125,086 30,931 (714) 155,303
Amortization and depreciation (15,538) (3,079) 0 (18,617)
Operating income 17,811 2,079 0 19,890
Net income 10,880 973 0 11,853
Assets 143,616 31,914 (4,059) 171,471
Liabilities 56,873 24,997 (59) 81,811
Investments in:
intangible assets (31) (32) 0 (63)
Property, plant and equipment 15,477 3,702 0 19,179
Non-current financial assets 15 0 0 15
Related parties
The following table illustrates the breakdown of Zignago Vetro receivables from relatedcompanies at the closing date of each of the fiscal years presented:
(in € ’000) 31.12.2006 31.12.2005
Industrie Zignago Santa Margherita SpA 0 0
Santa Margherita SpA and its subsidiaries 455 542
New High Glass Inc. 596 388
Linificio e Canapificio Nazionale SpA 150 201
Owens-Illinois Manufacturing Italy SpA 9 0
Multitecno Srl 0 1
Receivables from related parties 1,210 1,132
94
Notes to the Consolidated Financial Statements

The following table illustrates the breakdown of Zignago Vetro payables to relatedparties at the closing date of each of the years presented:
(in € ’000) 31.12.2006 31.12.2005
Fimiz Srl 3,875 0
Industrie Zignago Santa Margherita SpA 13 2,134
Santa Margherita SpA and its subsidiaries 74 84
New High Glass Inc. 9 8
Linificio e Canapificio Nazionale SpA 55 41
La Vecchia Scarl 16 60
Multitecno Srl 0 1
Owens-Illinois Manufacturing Italy SpA 8 0
Payables to related parties 4,050 2,328
The following table illustrates the breakdown of Zignago Vetro revenues from therelated companies during the years presented:
(in € ’000) 2006 2005
New High Glass Inc. 2,312 2,845
Santa Margherita SpA and its subsidiaries 2,851 2,468
Linificio e Canapificio Nazionale SpA 1,083 1,115
Owens-Illinois Manufacturing Italy SpA 70 0
Multitecno Srl 4 4
Industrie Zignago Santa Margherita SpA 0 0
Revenues from related parties 6,320 6,432
The following table illustrates the breakdown of Zignago Vetro costs paid to relatedcompanies during the years presented:
(in € ’000) 2006 2005
Industrie Zignago Santa Margherita SpA 1,831 2,133
Linificio e Canapificio Nazionale SpA 318 277
La Vecchia Scarl 292 268
Santa Margherita SpA and its subsidiaries 160 155
New High Glass Inc. 0 8
Owens-Illinois Manufacturing Italy SpA 424 0
Multitecno Srl 10 4
Costs paid to related parties 3,035 2,845
95
Notes to the Consolidated Financial Statements

Exchange rate risk hedging policies
During the periods presented, the Group did not hedge exchange rate risk since thetransactions executed by the Group in foreign currencies were not consideredsignificant.
Interest rate risk hedging policies
The Group entered into an interest rate swap (IRS) to hedge its interest rate risk on amedium to long-term loan. This agreement, made with the Banca Popolare di Vicenzaand having an original notional value of €5,210 thousand (for its 43.5% share) expiring1 January 2010, envisages semi-annual payment of a differential for interest, referringto the change in the 6-month Euribor rate with respect to a pre-set fixed interest rateof 5.33%.
Methane price risk hedging policies
On 3 November 2006, the Group entered into a methane swap agreement with the Cassadi Risparmio di Venezia as counterparty and an expiration date of 30 September 2007 inorder to hedge the risk of changes in natural gas purchase prices for the period fromJanuary to September 2007. This agreement envisages a notional amount of 21,000,000cubic meters, for a notional value of €4,252,500.
Transition to IFRSs
The Consolidated Financial Statements and the Aggregate Financial Statementsprepared in compliance with the IFRSs that are presented in this prospectus are basedon the financial statements of Zignago Vetro and its subsidiaries (including the companysubject to joint control, Vetri Speciali). These financial statements have been restated incompliance with the IFRSs solely for preparation of the Consolidated FinancialStatements and the Aggregate Financial Statements, whose transition date to IFRSs was1 January 2004.
96
Notes to the Consolidated Financial Statements

Optional exemptions and mandatory exceptions to application of IFRSs
Optional exemptions envisaged by IFRS 1 that were exercised upon first-timeapplication of IFRSs:
– business combinations: Zignago Vetro and its subsidiaries did not apply IFRS 3retrospectively to the business combinations carried out prior to the transition date toIFRSs;
– measurement of property, plant, and equipment and intangible assets at fairvalue or, alternatively, at the cost revalued as the substitute value of cost:Zignago Vetro and its subsidiaries applied the revalued cost as the substitute value ofthe cost and did not opt to measure property, plant and equipment and intangibleassets at fair value;
– employee benefit plans: the actuarial gains and losses accumulated from theinception of the plans until transition to IFRSs were recognized directly in equity;
– classification and measurement of financial instruments: IAS 32 – FinancialInstruments: Disclosure and Presentation and IAS 39 – Financial Instruments:Recognition and Measurement are applied on a deferred basis at 1 January 2005, asallowed;
– reserve for net exchange differences resulting from translation of the financialstatements of consolidated companies operating in countries outside theeurozone: Zignago Vetro and its subsidiaries did not exercise the exemption andmaintained the net accumulated exchange differences stemming from the previoustranslations of the financial statements of the foreign companies as previouslydetermined.
Mandatory exceptions envisaged by IFRS 1 for first-time application of IFRSs
– elimination of financial assets and liabilities: the financial assets and/orliabilities different from derivatives concerning transactions executed before 1January 2004, which were eliminated from the financial statements prepared inaccordance with Italian GAAPs, must not be recognized and thus restored on thefinancial statements;
– estimates: the estimates made at the date of transition to IFRSs must comply withthe estimates made at the same date in accordance with Italian GAAPs (afteradjustments to reflect any differences in accounting standards);
97
Notes to the Consolidated Financial Statements

Selected treatment of accounting options envisaged by IFRSs
– inventories: in accordance with IAS 2, the cost of inventories must be determined byapplying the FIFO or the weighted average cost method. Zignago Vetro and itssubsidiaries opted to use the weighted average cost method;
– measurement of property, plant and equipment and intangible assets: followinginitial recognition of the cost, IAS 16 and IAS 38 envisage that these assets may bemeasured at cost (and depreciated or amortized) or at their fair value. Zignago Vetroand its subsidiaries decided to apply the cost method.
Events occurring after the end of the financial year
In February, Zignago Vetro will sell the electrical substation to the former parentcompany IZSM, without realizing a gain.
98
Notes to the Consolidated Financial Statements

Report of the Independent Auditor(Art. 156 – Legislative Decree 58 of 24 February 1998)
99

REPORT OF THE INDEPENDENT AUDITOR PURSUANT TO ARTICLE 156OF ITALIAN LEGISLATIVE DECREE NO. 58 OF 24 FEBRUARY 1998
To the Shareholder ofZignago Vetro SpA
1. We have audited the consolidated financial statements - consisting of the balancesheet, income statement, cash flow statement, statement of changes in equity, and ofrelated explanatory notes - of Zignago Vetro SpA and its subsidiaries (Zignago VetroGroup) for the financial year ending on 31 December 2006. Responsibility fordrawing up year-end financial statements lies with the directors of Zignago VetroSpA. We are responsible for the professional opinion expressed on the year-endfinancial statements, based on this audit. The aforesaid consolidated financialstatements have been prepared in compliance with the International FinancialReporting Standards (IFRSs) adopted by the European Union, for the purposes ofinclusion in the prospectus to be prepared as part of the process of listing of theZignagno Vetro SpA’s ordinary shares on the Milan electronic equity market(Mercato Telematico Azionario), in the STAR segment, organised and managed byBorsa Italiana SpA, and exercising the possibility envisaged by Article 3, paragraph2, of Italian Legislative Decree no. 38 of 28 February 2005.
2. We performed our work according to the standards and criteria for accounting auditsrecommended by the CONSOB (the Italian securities & exchange commission). Incompliance with the aforesaid standards and criteria, the audit was planned andperformed in order to acquire all elements necessary to ascertain whetherconsolidated year-end financial statements were flawed by material errors andwhether, taken as a whole, they were reliable. The auditing processes includes areview, based on random sampling, of supporting documentation of the figures andinformation contained in year-end financial statements, together with an evaluationof the adequacy and correctness of the accounting policies applied and of thereasonableness of estimates made by the directors. We believe that the workperformed provides a reasonable basis upon which to express our professionalopinion.
As regards the opinion concerning the previous year’s consolidated financialstatements, prepared in compliance with the same accounting standards, the figuresof which are presented for the purposes of comparison as required by law, see ourreport issued on 31 July 2006.
3. In our opinion the consolidated financial statements of Zignago Vetro SpA as at 31December 2006, identified in Paragraph 1 above - prepared for the purposes ofinclusion in the prospectus as required by the European Regulation 809/2004/CEand exercising the possibility envisaged by Article 3, paragraph 2 of Italian
100
Report of the Independent Auditor on the Consolidated Financial Statements

Legislative Decree no. 38 of 28 February 2005 – comply with the IFRSs adopted bythe European Union. They have therefore been drawn up clearly and truthfully andfairly represent the Zignago Vetro Group’s balance sheet, financial position,operating performance, changes in equity, and cash flows for the financial yearending on that date.
Treviso, 15 February 2007
Reconta Ernst & Young SpA
Michele Graziani
Partner
101
Report of the Independent Auditor on the Consolidated Financial Statements


ZIGNAGO VETRO SpA
Registered office: Via Ita Marzotto, 8 – Fossalta di Portogruaro (VE) – Italy


ZIG
NA
GO
VE
TRO
SpA
–C
onso
lidat
ed A
nnua
l Rep
ort a
nd A
ccou
nts
Fina
ncia
l Yea
r 20
06