0:; ' # '8& *#0 & 9 - intechcdn.intechopen.com/pdfs-wm/13317.pdfuse of som to...
TRANSCRIPT

3,350+OPEN ACCESS BOOKS
108,000+INTERNATIONAL
AUTHORS AND EDITORS115+ MILLION
DOWNLOADS
BOOKSDELIVERED TO
151 COUNTRIES
AUTHORS AMONG
TOP 1%MOST CITED SCIENTIST
12.2%AUTHORS AND EDITORS
FROM TOP 500 UNIVERSITIES
Selection of our books indexed in theBook Citation Index in Web of Science™
Core Collection (BKCI)
Chapter from the book Self Organiz ing Maps - Applications and Novel Algorithm DesignDownloaded from: http://www.intechopen.com/books/self-organiz ing-maps-applications-and-novel-algorithm-design
PUBLISHED BY
World's largest Science,Technology & Medicine
Open Access book publisher
Interested in publishing with IntechOpen?Contact us at [email protected]

29
Use of SOM to Study Cotton Growing and Spinning
Josphat Igadwa Mwasiagi School of Engineering, Moi University, Eldoret,
Kenya
1. Introduction
From time immemorial cotton has maintained its position as one of the most important textile fibers. The world cotton production has continued to hit new records year after year due to the increase in cotton demand. The demand for cotton has also maintained a steady rise. This has resulted in increasing cotton prices (ICAC, 2004). Globally, cotton growing and processing has remained one of the profitable industries, which employs large sections of the populations and also earns foreign exchange. The Government of Kenya adopted Sessional Paper No. 2 of 1996 on the Industrial transformation of Kenya to become a Newly Industrialized Country by the year 2020, where the Textile Industry was identified as one of the key industries which could spur industrial growth (Kenyan Government, 1996a; Kenyan Government 1996b). This was due to the fact that the Kenyan textile industry grew rapidly in the 1970's and 1980's. By 1983, the textile industry was the second largest manufacturing industry after food processing. The problems bedeviling the Kenyan cotton growing and processing industry can be traced back to the introduction of trade liberalization policies in 1982, continual deterioration of the Kenyan infrastructure, rising cost of energy and corruption practices (Kenya Government, 1982). The above mentioned problems left the industry without finances to keep up with the global changes in technology hence the Kenyan textile industry found itself using inefficient technology, which rendered its goods less competitive (Ikiara and Ndiragu, 2004). Currently Kenya is a net importer of textile products, a far cry from its state in the 1980's when Kenya was a net exporter of textile products (Mwangi, 2004). The need for Kenya to improve its cotton growing and processing industry can not be overemphasized. In 2000, for example the textile industry had an installed capacity to process 90,000 bales of cotton lint. Unfortunately the country produced only 20,000 bales and the short fall had to be imported, leading to a strain in the already meager foreign exchange (Ikiara and Ndirangu, 2004). A research carried out by the Kenyan Ministry of Agriculture to study Kenyan’s potential to produce more cotton revealed that cotton can be grown on 2 million hectares. However in the last ten years the acreage of cotton has stagnant at around 50,000 hectares with very low yields (Estur, 2004). The reduced cotton acreage has brought doom to the cotton ginning industry, with the spinning industry having to import cotton lint while the farmers remain poor due to lack of employment (Kimenyi, 2001). The Government of Kenya has taken several steps to try and revive the ailing cotton growing and processing industry. Some of the key steps include; the removal of taxes related to ginning and textile machinery, the
www.intechopen.com
Self Organizing Maps - Applications and Novel Algorithm Design
578
supply of free cotton seeds to farmers and the drafting of a bill to manage the textile sector. The problems of the cotton farmers are however further complicated by the trends in the world cotton market and the end of Multi-Fiber Arrangement (Hussein, 2004; Panagariya et al, 2001; Cling et al, 2005). These global changes are likely to have a negative impact on the cotton growing industry in Kenya. In view of the changing trends of the Kenyan cotton growing sub-sector, a study which emphasized on the seed cotton production, yield per hectare and the cost of cotton growing was undertaken. Self Organizing Map (SOM) was used to study the relationship between cotton yield and farming practices. This will form the first section of this chapter. Apart from considering the quantity of cotton grown the quality of the cotton is another key factor which will affect the competitiveness of the Kenyan cotton growing and processing industry. Cotton is a natural fiber and is therefore affected by the environment in which it is grown, ginned and marketed. This environment, which is responsible for the high variability of cotton lint characteristics, is as a result of complex interaction between several factors which include; climatic conditions, crop husbandry methods, government policies, spinners' requirements and the seed genetic inheritance (Rico, 2002; Joubert et al, 2002). Cotton lint characteristics such as: fiber length, length uniformity, spinning consistency index, elongation, micronaire, strength, color, short fiber index and trash measurements, are used in fiber selection and marketing and can be measured by a variety of instruments. When the measurement of single fiber characteristics is done using a stand alone measuring instrument, it takes a lot of time and manpower to measure many samples. Consequently only representative measurements were taken and used in cotton grading and spinning before the introduction of the High Volume Instrument (HVI). The HVI system which incorporates all fiber measuring instruments into one testing unit was developed due to a concerted effort by researchers to provide an accurate, reliable and timely system which can measure important cotton quality characteristics speedily. In fact the HVI system can measure most of the known cotton quality characteristics in about forty seconds per sample The introduction of High Volume Instrument (HVI) system has however changed the measurement of cotton lint (Jones & Yankey, 1999). The HVI system incorporates several cotton properties measuring equipments which include; length/strength, moisture content, micronaire and color/trash equipments. The HVI equipment is fully automated and is supplied with relevant computer software and hardware which makes it possible to test the following cotton properties;
• Micronaire (measured by relating airflow resistance to the specific surface of fibers), • Maturity (maturity ratio is calculated using a sophisticated algorithm based on several
HVI measurements), • length (upper half mean length, uniformity index and short fiber index; are measured
optically in a tapered fiber beard which is automatically prepared, carded, and brushed),
• Strength (fiber strength (g/tex) and elongation at break (%) are measured physically by clamping a fiber bundle between 2 pairs of clamps at known distance. The second pair of clamps pulls away from the first pair at a constant speed until the fiber bundle breaks, hence the strength and elongation at break are measured),
• color (Rd (whiteness) and +b (yellowness) are measured optically by different color filters and then converted to customized color chart),
• trash (trash particle count (%) and surface area covered by trash are measured optically by utilizing a digital camera, and converted to trash standards).
www.intechopen.com

Use of SOM to Study Cotton Growing and Spinning
579
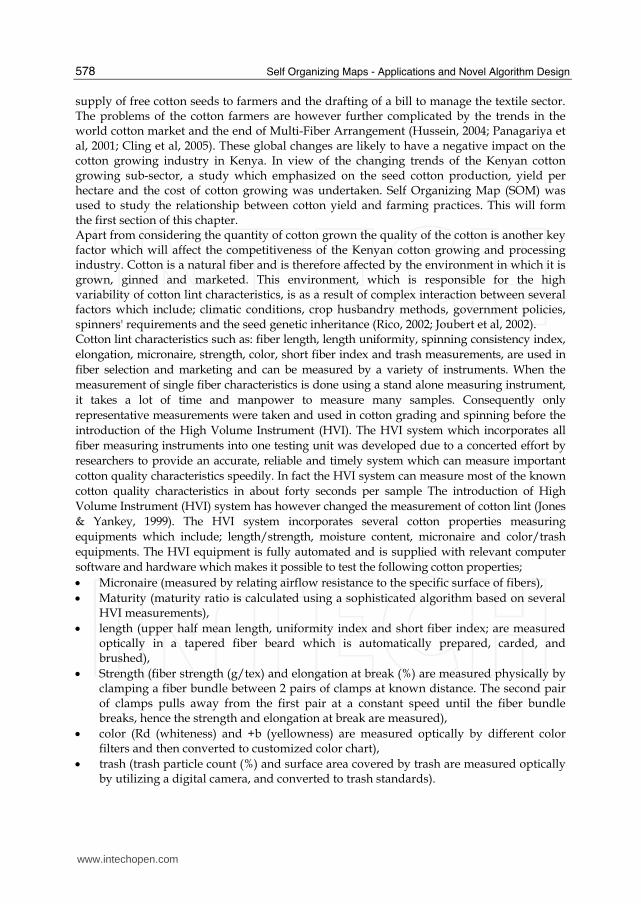
The popularity of HVI can be attested to by the fact that its results are being used to grade cotton in many countries. The high testing speed of the HVI system enables the spinning mill to test each individual bale of cotton. While HVI system provides a lot of data for cotton lint the utilization of the data has however been limited to a use of one or two important characteristics such as Spinning Consistency Index (SCI) and micronaire for bale selection (Kothari, 1999; Majumdar et al, 2004). According to Kothari (Kothari, 1999) cotton bale selection can be done by first considering SCI followed by other HVI characteristics such as micronaire, fiber length or length uniformity depending on the spinning system. The aim of this procedure is to gain between mix long-term and short term consistency of all properties from all of the cotton bales available for yarn spinning. The bale selection procedure can be simplified and made more objective by using clustering techniques together with other statistical tools used for measuring central tendency and measure of dispersion for multivariate data. Clustering techniques group items into sets of similar objects based on given attributes (Jain & Dubes, 1988). The second section of this chapter will consider the classification of Kenyan cotton lint using data analysis techniques such as SOM, k-means clustering technique and Probabilistic Neural Network (PNN). The aforementioned techniques can be used to classify cotton lint based on its characteristics. Since the samples obtained for the classification of Kenyan cotton lint was less than 200, it was deemed necessary to consider the classification of a much large sample. In this connection HVI data for over 2000 bales was obtained from a testing institution in China. The collected data was used to classify the cotton bales using a model consisting of Kohonen Self Organizing Maps (SOM) to visualize the high dimensional cotton lint HVI data and K-means technique for clustering. Having considered cotton growing and the classification of cotton lint using the SOM technique the final part of this chapter will consider the study of cotton yarn quality using SOM. The manufacture of cotton yarn involves assembling fibers in a set format and introducing some strength imparting twist. Consequently yarn may be defined as a linear assemblage of fibers formed into a continuous strand having textile-like characteristics. The textile-like characteristics referred to include good tensile strength and high flexibility (McCreight et al, 1997). The ring spinning process (Fig. 1) can be summarized into six stages; cotton mixing, blowroom, carding, drawing, speedframe and ringframe (Klein, 1987; Oxtoby, 1987; McCreight et al, 1997). From mixing to carding stages the cotton lint received from the ginnery undergo a series of processes which include opening, cleaning and fiber individualization and parallization. The cotton material is then gradually drafted (reduction in the diameter) in drawframe, speedframe and ringframe stages until the final yarn diameter is achieved. Twisting, which is also done at the ringframe stage is the final procedure in the yarn forming process. To ensure that the yarn manufactured in a spinning process meets specified standards, quality control measures are carried out. Quality control in the cotton spinning process involves the inspection of;
• Raw materials prior to entering the production line,
• Products at every stage in the spinning process, and • Final products prior to dispatching. The quality characteristics of the ring spun yarn include: yarn count, tensile properties, evenness and imperfections. Yarn count is a measure of the linear density of the yarn. It defines the yarn fineness and is highly correlated with other yarn quality characteristics like yarn strength, evenness and imperfections. The important yarn tensile properties are yarn
www.intechopen.com
Self Organizing Maps - Applications and Novel Algorithm Design
580
Fig. 1. The cotton Spinning process
breaking strength and breaking elongation. Yarn breaking strength (strength) is the force required to break the yarn when a tensile force is applied along its length. The percentage increase in length at break is referred to as breaking elongation (elongation). Yarn evenness (Kothari, 1999) refers to the variation in mass per unit length and can be measured using U%, which is the percentage mass deviation of unit length of material. CVm, which is the coefficient of variation of mass per unit length, has recently gained popularity as a yarn evenness unit. The relationship between the two factors is given in equation 1.
CVm 1.25 U%= × (1)
Another important yarn quality characteristic is yarn imperfections, which is defined as frequently occurring yarn faults and can be subdivided into three groups: Thin places/km, thick places/km and neps/km. Yarn imperfections are caused by defects in raw material (fiber) or improper machine settings. The standard sensitivity levels for ring spun yarn imperfections are:
• Thin place (-50% : yarn cross section is only 50% of the mean value), • Thick place (+50% : the cross section at thick place is 150% of yarn mean value), • Neps (200%: the cross section at the nep is 200% of the yarn mean value) Yarn irregularity occurs when there is a variation in any of the above yarn quality characteristics along the length of the yarn. Since many of the yarn quality characteristics are highly correlated with each other, a variation in one characteristic will adversely affect many other yarn properties. A case study of the Egyptian cotton spinning industry revealed that the main reason for quality problems were (Azzam & Mohamed, 2005):
• Unsuitable quality levels,
• Large quality variations, and • Unexplained quality exceptions. Unsuitable quality levels arise due to individual factories coming up with their own quality standards. This makes it difficult to compare products from different factories. This problem can however be solved by adapting internationally acceptable standards like Uster Quality Standards (Uster, 2007). Uster Statistics are quality reference figures which permit a classification of the quality of fibers, slivers, rovings and yarns with regard to world wide production. The samples which were used to formulate the latest Uster statistics were collected from different parts of the world. Uster standards can be used for quality benchmarking, product specification and comparison of spinning factories and products. In view of the potential of the latent in the cotton growing and processing industry it is goes without saying that any effort however small it may be, taken to improve the profitability of
www.intechopen.com

Use of SOM to Study Cotton Growing and Spinning
581
the industry is worthy the effort. The cotton growing industry generates high dimensional data, where many factors that affect the productivity of the industry can be linked to the yield of cotton. In the cotton spinning the quality of the lint which can be represented by over ten characteristics can be used to grade, hence improve its marketability and processing. Yarn spinning can also be improved if the high dimensional data generated from the quality characteristics of the yarn are analyzed accurately and timely. Given that, Self Organizing maps (SOM) can handle high dimensional data effectively enabling data visualization and clustering, this chapter will concentrate on the use of SOM, in the study of the cotton growing and processing industry.
2. Data processing algorithms
2.1 Kohonen Self Organizing Maps
Kohonen Self Organizing Maps (SOM) is an unsupervised competitive learning clustering network, in which only one neuron (or only one neuron in a group) is "on" at a time. SOM learns to recognize groups of similar input vectors in such a way that those neurons that are physically close together in the neuron layer respond to similar input vectors (Kohonen, 1997). The SOM algorithm has been applied in many areas due to its ability to provide an effective platform for visualization of high-dimensional data (Si et al, 2003). Kohonen Self Organizing Maps (SOM) learns to recognize groups of similar input vectors in such a way that neurons physically close together in the neuron layer respond to similar input vectors. The neurons in the layer of a SOM are arranged in physical positions according to a given topology and distance functions (Hagan et al, 2002). SOM learning algorithm exploits two fundamental interactions between neurons, namely, competition and cooperation. Competition during learning refers to the characteristics of a neuron, where each input vector is compared with each weight vector of the weight matrix. The winning neuron which is also referred to as the Best Matching Unit (BMU) is selected based on the least distance between the vector and the neuron. Cooperation learning on the other hand refers to the situation whereby all neurons located in a topological neighborhood of the winning neuron k have their weights updated in accordance with a neighborhood function φ(j) according to equation 2 (Jang & Mizutani, 1997).
2
2
( )( ) exp
2
jj
ρφ σ⎛ ⎞= −⎜ ⎟⎜ ⎟⎝ ⎠ (2)
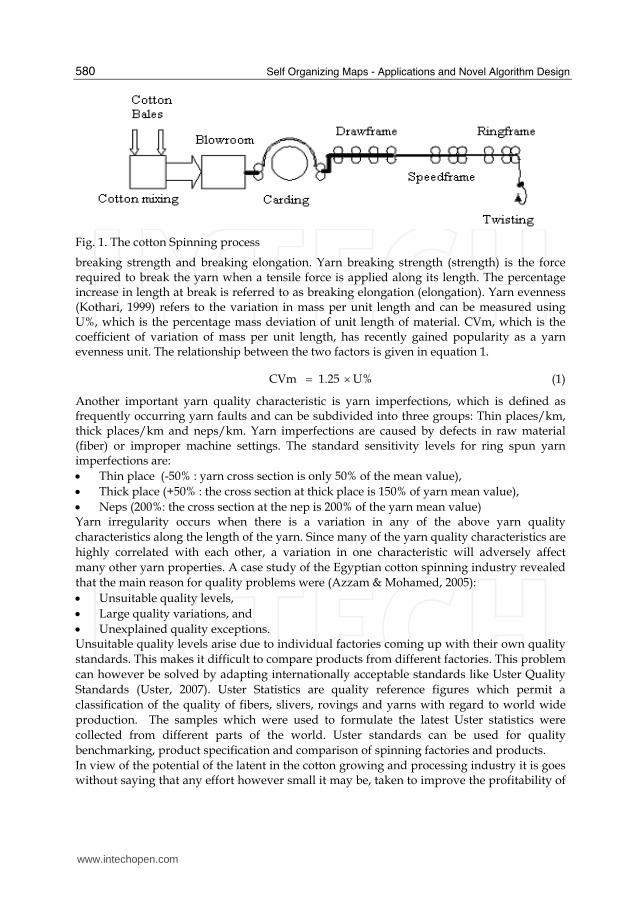
where ρ(j) = ||V(j,:) - V(k,:)|| is the distance between the jth and kth neurons in the l-D (l =1,2 or 3) feature space, and σ2 is a variance (or spread) of the Gaussian distribution. When a vector is presented, the vectors of the winning neuron and its close neighbors will move towards it. Consequently after many presentations, the neighboring neurons will have learnt vectors similar to each other. The architecture for SOM is given in Fig. 2. The ||dist || box accepts the input vector p and the input weight matrix IW1,1, and produces a vector having S1 elements. The competitive transfer function accepts a net input vector for a layer and returns neuron outputs of 0 for all neurons except for the winner. The quality of the SOM maps can be checked by using two factors: data representation accuracy and data set topology representation accuracy. Data representation accuracy can be measured using average distance between each data vector and its BMU. Data set topology representation accuracy
www.intechopen.com
Self Organizing Maps - Applications and Novel Algorithm Design
582
can be expressed as the topographic error which is the percentage of data vectors for which the first and second BMUs are not adjacent units.
Fig. 2. The Architecture of SOM Network
2.2 Probabilistic Neural Network
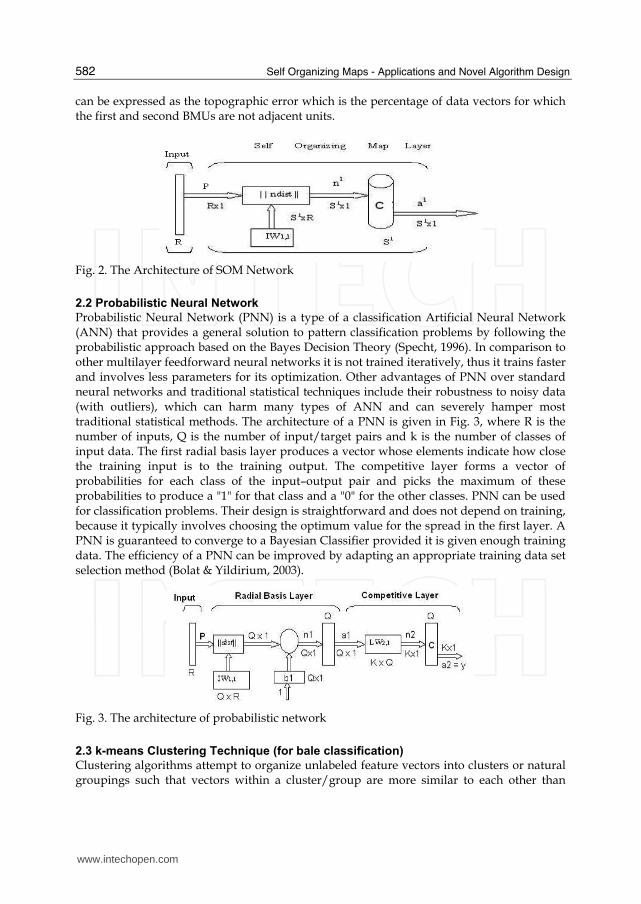
Probabilistic Neural Network (PNN) is a type of a classification Artificial Neural Network (ANN) that provides a general solution to pattern classification problems by following the probabilistic approach based on the Bayes Decision Theory (Specht, 1996). In comparison to other multilayer feedforward neural networks it is not trained iteratively, thus it trains faster and involves less parameters for its optimization. Other advantages of PNN over standard neural networks and traditional statistical techniques include their robustness to noisy data (with outliers), which can harm many types of ANN and can severely hamper most traditional statistical methods. The architecture of a PNN is given in Fig. 3, where R is the number of inputs, Q is the number of input/target pairs and k is the number of classes of input data. The first radial basis layer produces a vector whose elements indicate how close the training input is to the training output. The competitive layer forms a vector of probabilities for each class of the input–output pair and picks the maximum of these probabilities to produce a "1" for that class and a "0" for the other classes. PNN can be used for classification problems. Their design is straightforward and does not depend on training, because it typically involves choosing the optimum value for the spread in the first layer. A PNN is guaranteed to converge to a Bayesian Classifier provided it is given enough training data. The efficiency of a PNN can be improved by adapting an appropriate training data set selection method (Bolat & Yildirium, 2003).
Fig. 3. The architecture of probabilistic network
2.3 k-means Clustering Technique (for bale classification)
Clustering algorithms attempt to organize unlabeled feature vectors into clusters or natural groupings such that vectors within a cluster/group are more similar to each other than
www.intechopen.com
Use of SOM to Study Cotton Growing and Spinning
583
other vectors belonging to different clusters. K means is a partitioning nonhierarchical clustering method that constructs k (k fixed a priori) clusters for a given data set. The K-means algorithm defines k centers one for each cluster and hence has k groups. The grouping is done by minimizing the sum of squares of distances between the data members and the corresponding cluster centers. This is achieved by minimizing a squared error objective function;
2( )
1 1
k nj
jij i
J cx= =
= −∑∑ (3)
where 2
( )jji cx − is the chosen distance measure between a data point ( )j
ix and the cluster
centre cj, is an indicator of the distance of the n data points from their respective cluster centers. The algorithm is composed of the following steps; i. Place k points into the space represented by the objects that are being clustered ii. Assign each object to the group whose center is closest iii. When all objects have been assigned, recalculate the positions of the k centers iv. Repeat the second and third steps until the centers no longer move. This produces a
separation of the objects into groups from which the factor to be minimized can be calculated. These points represent initial group centers.
The quality of the data partitioning using K-means clustering techniques can be analyzed by using cluster validity methods such as Davies Bouldin (DB) index and silhouette means. The DB index is a function of the ratio of the sum of within-cluster scatter to between-cluster separation and can be computed as shown in equation 4. In Eq. (4) Sc and dce denotes the centroid intra-cluster and inter-cluster distances respectively. The intra-cluster distance for a given cluster is obtained as the average of all pair wise distances from points in the cluster to the cluster centroid.
1
( ( ) ( ))max1
( , )
cNj k
c j
Sc k Sc j
DBN dce k j
≠=
+= ∑ (4)
where
|| ||i ki
k
x c
ScN
−= ∑ and || ||k jdce c c= − .
The inter-cluster distance between two clusters is computed as the distance between their centroids. Nk is the number of objects belonging to cluster k, given that a total of Nc clusters are found to exist in the data. The DB index can be plotted for several numbers of clusters, whereby the cluster value with the lowest DB index will be deemed to be the optimum number of clusters for the data. The Silhouettes method on the other hand uses width plots. The silhouette width Si for the ith feature vector in a cluster q is defined by equation 5 (Jain & Dubes, 1988).
max( , )
i ii
i i
b aS
a b
−= (5)
In Eq. 5, ai is the average distance from the ith feature vector to all other feature vectors in the cluster k; bi is the minimum average distance from the ith feature vector to all the feature
www.intechopen.com
Self Organizing Maps - Applications and Novel Algorithm Design
584
vectors in another cluster j (j =1,….,q; j ≠ q). When Si is close to one, this implies that ai is small with respect to bi. This is an indication that the vector is correctly classified. If Si is close to zero, this implies that ai and bi are approximately equal, thus making it unclear which cluster i should belong to, while negative Si implies that i is assigned to the wrong cluster. For given k clusters, the overall average silhouette width is the average of the silhouette widths for all the feature vectors in the data set. The partition with the maximum overall average silhouette width is taken as the optimal partition. As stated earlier, in k-means clustering, the value of k is unknown a priori. There is need therefore to use another algorithm to determine the value of k. SOM is good at pattern recognition, and hence can be used to determine the nature of clustering in a given data. This information can be used to determine the value of k, which can then be passed on to the K-means clustering algorithm, for the clustering of the data (Vesanto & Alhoniemi, 2000).
2.4 Statistical techniques
There are many methods in statistical analysis which can be used to organize and summarize data. These can be studied in descriptive statistics. There are also many descriptive measures such as measure of tendency and measure of dispersion. Given a sample of data set for one attribute the measure of central tendency such as means, mode etc and the measure of variation such as standard deviation and coefficient of variation (CV) can be used to describe the data. (Bluman, 2004; Weiss, 1997). The results of the above analysis can be displayed using two dimensional graphs. In real life situation there are many occasions when the data to be analyzed is multivariate (i.e. it has more than one attribute). A good example of a multivariate data is HVI data, which may contain say 100 samples of cotton lint, samples each having over characteristics producing over 1000 data, having 100 rows and over ten columns. This type of data will be hard to visualize. Graphical display of data can only be done for at most three variables displayed in a three dimensional plots. For data with more than three variables it is hard to visualize their relationship. Boxplots (box-and –whisker diagram) together with principal components analysis technique can be used to study the characteristics of such high dimensional data. A common characteristic of many multivariate data is that the variables within a given data set often move together. This may be partly due to the fact that several variables may be measuring the same driving principle governing the behavior of the system. Another common characteristic of data set with many variables is that in many systems there are only a few such driving forces. There are however an abundance of instrumentation which can be used to variables. Taking advantage of this redundancy of information, simplifies the problem by replacing a group of variables with a single new variable. The above principles are referred to as Principal components analysis. This method generates a new set of variables, called principal components. Each principal component is a linear combination of the original variables. All the principal components are orthogonal to each other so there is no redundant information.
3. Application of SOM in the cotton growing and processing industries
3.1 Use of SOM to study Cotton growing 3.1.1 Data and sample collection
The cotton growing process involves farming management techniques which may involve handling a lot of data. In Kenya the District Agricultural officers (DAO) collect data
www.intechopen.com
Use of SOM to Study Cotton Growing and Spinning
585
pertaining to the growing conditions of all crops within a district. This data is archived at the Ministry Headquarters, which handles data from all the districts in the country. The data has been collected for many years and it has become too voluminous for the traditional data mining techniques to give a meaningful interpretation. An attempt to access the data so as to analyze it using SOM was not well received since the Agricultural officers were not very familiar with the advantages of the SOM techniques. The aim of this section was to collect data from the farmers in selected districts for the 2003/4 and 2004/05 cotton growing seasons and to use SOM techniques so as to demonstrate its advantages. Data on cotton growing was collected from District Agricultural officers (DAO) and cotton farmers in all the cotton growing regions. Data was also collected from the Ministry of Agriculture (MOA), which included districts, provincial and national levels. Interaction with all the stake holders in the cotton growing industry like farmers, ginners, DAO’s, fiber research institutions, cotton processing mills and MOA personnel was done through direct interviews and questionnaires. Cotton lint samples were collected from all the ginneries which were operating during the study period. The collected samples were analyzed using the internationally acceptable High Volume Instrument (HVI) system.
3.1.2 Results and discussions
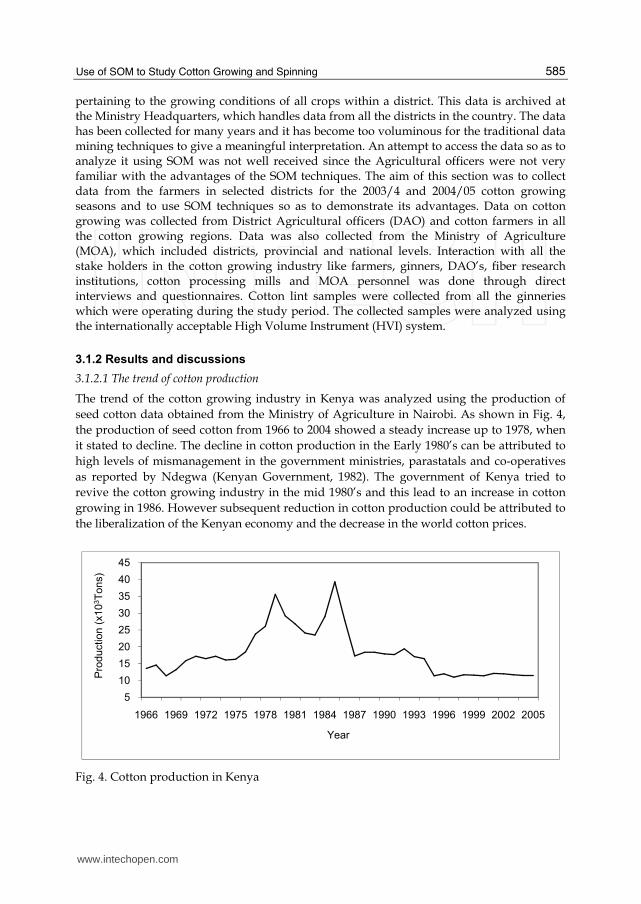
3.1.2.1 The trend of cotton production
The trend of the cotton growing industry in Kenya was analyzed using the production of
seed cotton data obtained from the Ministry of Agriculture in Nairobi. As shown in Fig. 4,
the production of seed cotton from 1966 to 2004 showed a steady increase up to 1978, when
it stated to decline. The decline in cotton production in the Early 1980’s can be attributed to
high levels of mismanagement in the government ministries, parastatals and co-operatives
as reported by Ndegwa (Kenyan Government, 1982). The government of Kenya tried to
revive the cotton growing industry in the mid 1980’s and this lead to an increase in cotton
growing in 1986. However subsequent reduction in cotton production could be attributed to
the liberalization of the Kenyan economy and the decrease in the world cotton prices.
5
10
15
20
25
30
35
40
45
1966 1969 1972 1975 1978 1981 1984 1987 1990 1993 1996 1999 2002 2005
Pro
du
ctio
n (
x1
03T
on
s)
Year
Fig. 4. Cotton production in Kenya
www.intechopen.com
Self Organizing Maps - Applications and Novel Algorithm Design
586
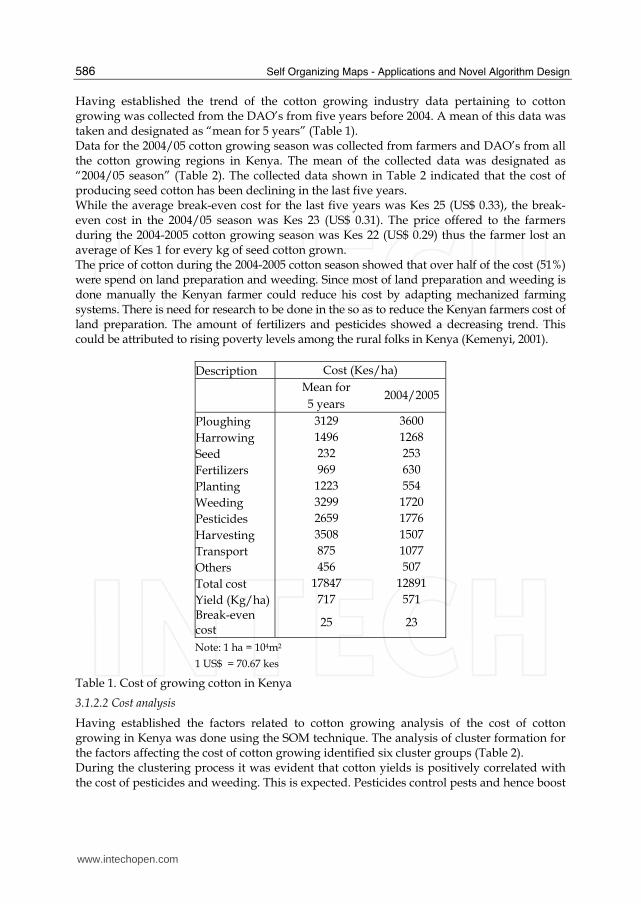
Having established the trend of the cotton growing industry data pertaining to cotton growing was collected from the DAO’s from five years before 2004. A mean of this data was taken and designated as “mean for 5 years” (Table 1). Data for the 2004/05 cotton growing season was collected from farmers and DAO’s from all the cotton growing regions in Kenya. The mean of the collected data was designated as “2004/05 season” (Table 2). The collected data shown in Table 2 indicated that the cost of producing seed cotton has been declining in the last five years. While the average break-even cost for the last five years was Kes 25 (US$ 0.33), the break-even cost in the 2004/05 season was Kes 23 (US$ 0.31). The price offered to the farmers during the 2004-2005 cotton growing season was Kes 22 (US$ 0.29) thus the farmer lost an average of Kes 1 for every kg of seed cotton grown. The price of cotton during the 2004-2005 cotton season showed that over half of the cost (51%) were spend on land preparation and weeding. Since most of land preparation and weeding is done manually the Kenyan farmer could reduce his cost by adapting mechanized farming systems. There is need for research to be done in the so as to reduce the Kenyan farmers cost of land preparation. The amount of fertilizers and pesticides showed a decreasing trend. This could be attributed to rising poverty levels among the rural folks in Kenya (Kemenyi, 2001).
Description Cost (Kes/ha)
Mean for
5 years 2004/2005
Ploughing 3129 3600
Harrowing 1496 1268
Seed 232 253
Fertilizers 969 630
Planting 1223 554
Weeding 3299 1720
Pesticides 2659 1776
Harvesting 3508 1507
Transport 875 1077
Others 456 507
Total cost 17847 12891
Yield (Kg/ha) 717 571
Break-even cost
25 23
Note: 1 ha = 104m2
1 US$ = 70.67 kes
Table 1. Cost of growing cotton in Kenya
3.1.2.2 Cost analysis
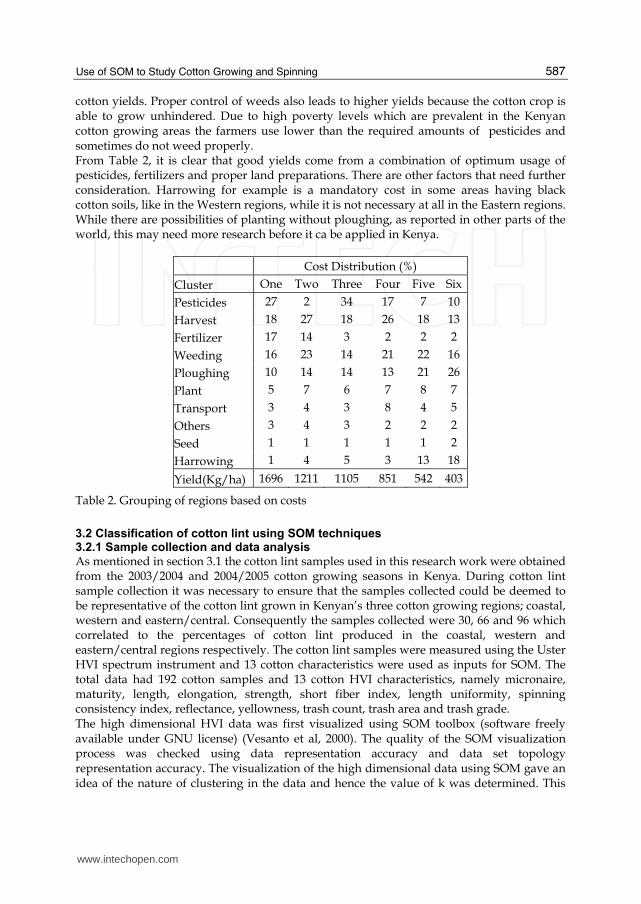
Having established the factors related to cotton growing analysis of the cost of cotton growing in Kenya was done using the SOM technique. The analysis of cluster formation for the factors affecting the cost of cotton growing identified six cluster groups (Table 2). During the clustering process it was evident that cotton yields is positively correlated with the cost of pesticides and weeding. This is expected. Pesticides control pests and hence boost
www.intechopen.com
Use of SOM to Study Cotton Growing and Spinning
587
cotton yields. Proper control of weeds also leads to higher yields because the cotton crop is able to grow unhindered. Due to high poverty levels which are prevalent in the Kenyan cotton growing areas the farmers use lower than the required amounts of pesticides and sometimes do not weed properly. From Table 2, it is clear that good yields come from a combination of optimum usage of pesticides, fertilizers and proper land preparations. There are other factors that need further consideration. Harrowing for example is a mandatory cost in some areas having black cotton soils, like in the Western regions, while it is not necessary at all in the Eastern regions. While there are possibilities of planting without ploughing, as reported in other parts of the world, this may need more research before it ca be applied in Kenya.
Cost Distribution (%)
Cluster One Two Three Four Five Six
Pesticides 27 2 34 17 7 10
Harvest 18 27 18 26 18 13
Fertilizer 17 14 3 2 2 2
Weeding 16 23 14 21 22 16
Ploughing 10 14 14 13 21 26
Plant 5 7 6 7 8 7
Transport 3 4 3 8 4 5
Others 3 4 3 2 2 2
Seed 1 1 1 1 1 2
Harrowing 1 4 5 3 13 18
Yield(Kg/ha) 1696 1211 1105 851 542 403
Table 2. Grouping of regions based on costs
3.2 Classification of cotton lint using SOM techniques 3.2.1 Sample collection and data analysis
As mentioned in section 3.1 the cotton lint samples used in this research work were obtained from the 2003/2004 and 2004/2005 cotton growing seasons in Kenya. During cotton lint sample collection it was necessary to ensure that the samples collected could be deemed to be representative of the cotton lint grown in Kenyan’s three cotton growing regions; coastal, western and eastern/central. Consequently the samples collected were 30, 66 and 96 which correlated to the percentages of cotton lint produced in the coastal, western and eastern/central regions respectively. The cotton lint samples were measured using the Uster HVI spectrum instrument and 13 cotton characteristics were used as inputs for SOM. The total data had 192 cotton samples and 13 cotton HVI characteristics, namely micronaire, maturity, length, elongation, strength, short fiber index, length uniformity, spinning consistency index, reflectance, yellowness, trash count, trash area and trash grade. The high dimensional HVI data was first visualized using SOM toolbox (software freely available under GNU license) (Vesanto et al, 2000). The quality of the SOM visualization process was checked using data representation accuracy and data set topology representation accuracy. The visualization of the high dimensional data using SOM gave an idea of the nature of clustering in the data and hence the value of k was determined. This
www.intechopen.com
Self Organizing Maps - Applications and Novel Algorithm Design
588
information was thereafter used to partition the data using k-means clustering technique. Having partitioned the data PNN was designed to classify the cotton lint clusters. The HVI data was divided into a ratio of 4:1 for training and simulation (unseen) data sets respectively. First the PNN was trained using the training data set and then tested with the unseen data set. Different levels of spread ranging from 1 to 20 were tried in order to study the effects of spread on the efficiency of the PNN, and hence be able to find the optimum operational design for PNN. The performance of the PNN algorithm was measured by taking a regression between the predicted and target value.
3.2.2 Results and discussions
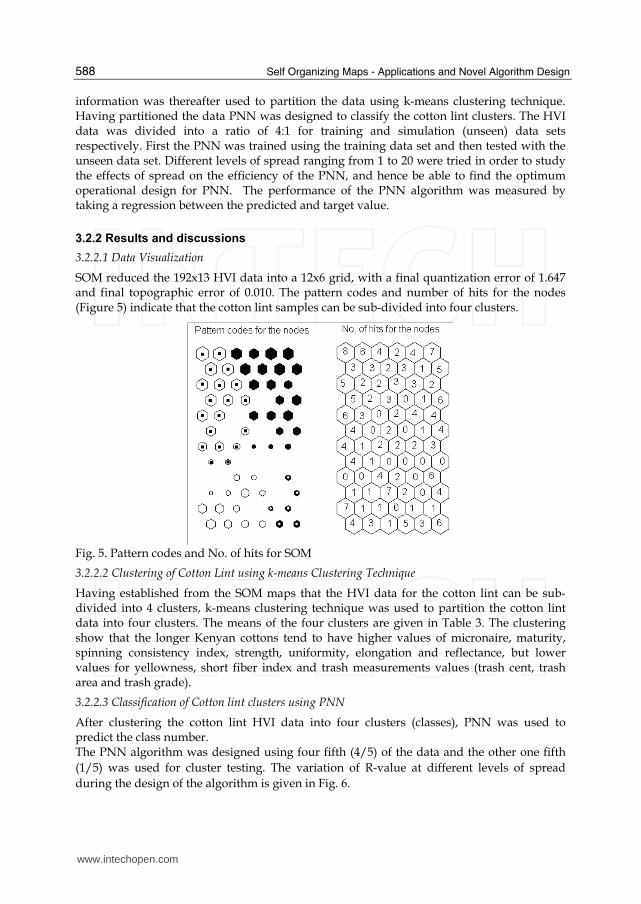
3.2.2.1 Data Visualization
SOM reduced the 192x13 HVI data into a 12x6 grid, with a final quantization error of 1.647 and final topographic error of 0.010. The pattern codes and number of hits for the nodes (Figure 5) indicate that the cotton lint samples can be sub-divided into four clusters.
Fig. 5. Pattern codes and No. of hits for SOM
3.2.2.2 Clustering of Cotton Lint using k-means Clustering Technique
Having established from the SOM maps that the HVI data for the cotton lint can be sub-divided into 4 clusters, k-means clustering technique was used to partition the cotton lint data into four clusters. The means of the four clusters are given in Table 3. The clustering show that the longer Kenyan cottons tend to have higher values of micronaire, maturity, spinning consistency index, strength, uniformity, elongation and reflectance, but lower values for yellowness, short fiber index and trash measurements values (trash cent, trash area and trash grade).
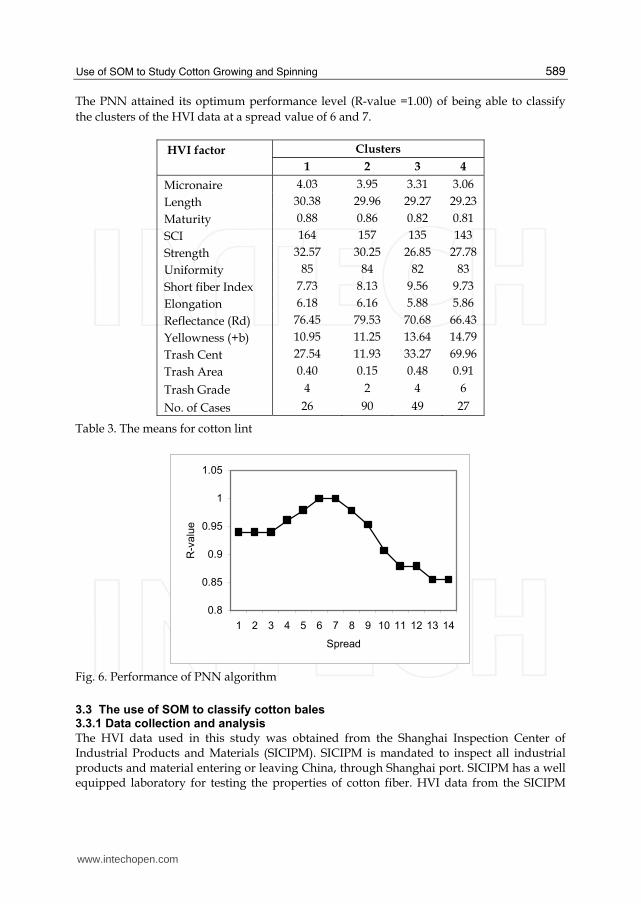
3.2.2.3 Classification of Cotton lint clusters using PNN
After clustering the cotton lint HVI data into four clusters (classes), PNN was used to predict the class number. The PNN algorithm was designed using four fifth (4/5) of the data and the other one fifth
(1/5) was used for cluster testing. The variation of R-value at different levels of spread
during the design of the algorithm is given in Fig. 6.
www.intechopen.com
Use of SOM to Study Cotton Growing and Spinning
589
The PNN attained its optimum performance level (R-value =1.00) of being able to classify
the clusters of the HVI data at a spread value of 6 and 7.
HVI factor Clusters
1 2 3 4
Micronaire 4.03 3.95 3.31 3.06
Length 30.38 29.96 29.27 29.23
Maturity 0.88 0.86 0.82 0.81
SCI 164 157 135 143
Strength 32.57 30.25 26.85 27.78
Uniformity 85 84 82 83
Short fiber Index 7.73 8.13 9.56 9.73
Elongation 6.18 6.16 5.88 5.86
Reflectance (Rd) 76.45 79.53 70.68 66.43
Yellowness (+b) 10.95 11.25 13.64 14.79
Trash Cent 27.54 11.93 33.27 69.96
Trash Area 0.40 0.15 0.48 0.91
Trash Grade 4 2 4 6
No. of Cases 26 90 49 27
Table 3. The means for cotton lint
0.8
0.85
0.9
0.95
1
1.05
1 2 3 4 5 6 7 8 9 10 11 12 13 14
Spread
R-v
alu
e
Fig. 6. Performance of PNN algorithm
3.3 The use of SOM to classify cotton bales 3.3.1 Data collection and analysis
The HVI data used in this study was obtained from the Shanghai Inspection Center of Industrial Products and Materials (SICIPM). SICIPM is mandated to inspect all industrial products and material entering or leaving China, through Shanghai port. SICIPM has a well equipped laboratory for testing the properties of cotton fiber. HVI data from the SICIPM
www.intechopen.com
Self Organizing Maps - Applications and Novel Algorithm Design
590
HVI data bank for cotton bales samples meant for importation into China through Shanghai port between October 2005 and July 2006 was selected. The total data sample had 2421 cotton bales and 13 cotton HVI characteristics, namely micronaire (Mic), maturity (Mat), length (Len), elongation (Elg), strength (Str), Short Fiber Index (Sfi), length uniformity (Unf), Spinning Consistency Index (Sci), reflectance (Rd), yellowness (+b), trash cent (Trc), trash area (Tra) and trash grade (Trg). The high dimensional HVI data containing 2421x13 inputs was first partitioned using K-means algorithm. DB index was run for all clusters partitioning starting from 2 to 2421 and the cluster with the lowest DB index was selected. Since DB index algorithm in the SOM toolbox starts out with random centers, the optimum cluster could vary from time to time depending on the random centers selected. The cluster validity using DB index was run for a 100 times and the least number of cluster was selected as the optimum cluster number and hence designated as k. The HVI data was then partitioned into k groups and the Coefficient of variation for each group was checked for all the HVI attributes. Any group which was found to have a CV higher than that of the main group (MG) for any of its attributes was declared to have failed. The failed groups were further analyzed using other cluster validity methods and statistical techniques, such silhouette means and principal component analysis. The bale classification model can be summarized as follows; i. Use SOM data visualization technique to get an idea of the nature of clustering within
HVI data, ii. Partition the HVI data using K-means technique. The value of k should be obtained
from (i) above, and iii. Check for data group compactness using other methods and techniques such as
silhouette means, coefficient of variation and principal component analysis.
3.3.2 Result and discussion
3.3.2.1 Data Visualization
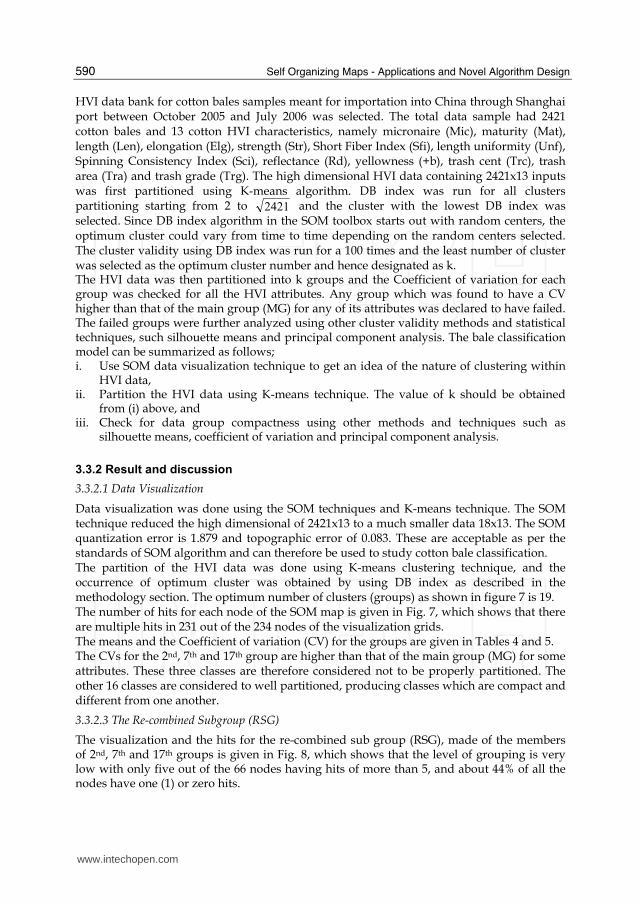
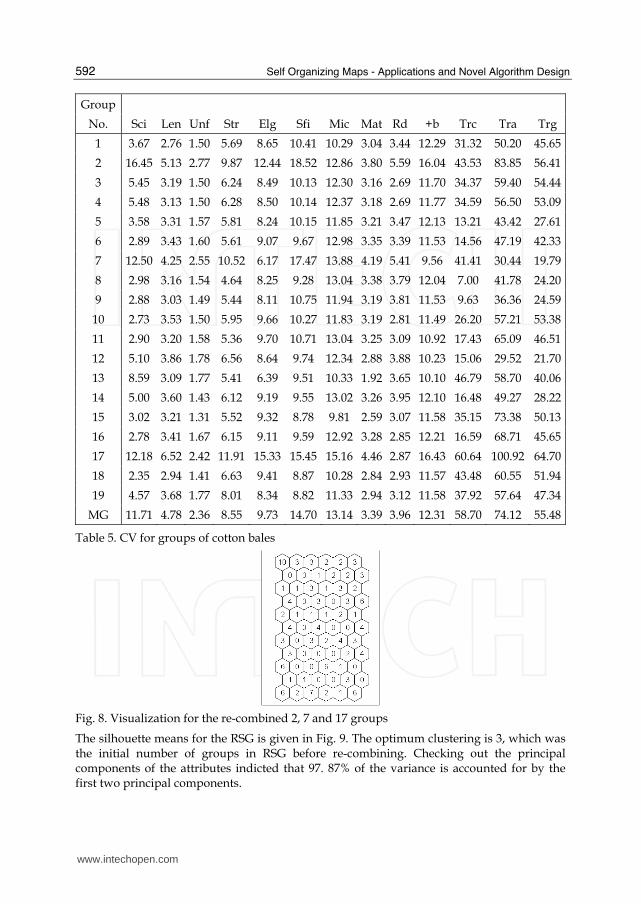
Data visualization was done using the SOM techniques and K-means technique. The SOM technique reduced the high dimensional of 2421x13 to a much smaller data 18x13. The SOM quantization error is 1.879 and topographic error of 0.083. These are acceptable as per the standards of SOM algorithm and can therefore be used to study cotton bale classification. The partition of the HVI data was done using K-means clustering technique, and the occurrence of optimum cluster was obtained by using DB index as described in the methodology section. The optimum number of clusters (groups) as shown in figure 7 is 19. The number of hits for each node of the SOM map is given in Fig. 7, which shows that there are multiple hits in 231 out of the 234 nodes of the visualization grids. The means and the Coefficient of variation (CV) for the groups are given in Tables 4 and 5. The CVs for the 2nd, 7th and 17th group are higher than that of the main group (MG) for some attributes. These three classes are therefore considered not to be properly partitioned. The other 16 classes are considered to well partitioned, producing classes which are compact and different from one another.
3.3.2.3 The Re-combined Subgroup (RSG)
The visualization and the hits for the re-combined sub group (RSG), made of the members of 2nd, 7th and 17th groups is given in Fig. 8, which shows that the level of grouping is very low with only five out of the 66 nodes having hits of more than 5, and about 44% of all the nodes have one (1) or zero hits.
www.intechopen.com

Use of SOM to Study Cotton Growing and Spinning
591
Fig. 7. Pattern codes and No. of Hits for Bale classification
Group No. of
No. Sci Len Unf Str Elg Sfi Mic Mat Rd +b Trc Tra Trg Data
1 99 1.05 78.59 24.04 5.79 12.71 4.36 0.86 77.70 9.14 21.94 0.28 2.56 34
2 108 1.05 79.44 25.30 5.94 12.39 4.38 0.86 78.96 10.37 24.12 0.34 2.93 57
3 110 1.07 79.78 25.01 5.88 11.80 4.28 0.86 79.46 9.23 13.35 0.17 1.58 84
4 110 1.07 79.79 25.01 5.89 11.81 4.28 0.86 79.49 9.23 13.31 0.16 1.55 83
5 111 1.07 80.18 25.93 5.79 11.68 4.44 0.87 75.38 8.62 34.66 0.43 3.54 71
6 116 1.07 80.27 26.16 6.05 11.18 4.31 0.86 79.19 9.69 22.00 0.26 2.47 123
7 117 1.09 80.86 26.44 5.90 11.11 4.28 0.86 74.28 9.03 52.20 0.66 4.68 25
8 122 1.09 81.49 27.27 6.11 10.51 4.37 0.87 74.98 8.96 47.47 0.55 4.20 55
9 123 1.09 81.42 27.18 6.01 10.34 4.42 0.87 77.81 9.40 30.56 0.33 3.06 125
10 124 1.09 80.82 26.70 6.07 10.70 4.18 0.86 80.89 9.63 11.71 0.16 1.56 186
11 129 1.10 81.57 27.34 6.04 10.21 4.15 0.86 80.36 9.70 19.75 0.25 2.32 310
12 132 1.11 81.49 27.77 5.94 10.55 3.72 0.84 76.51 8.97 45.21 0.48 3.82 82
13 136 1.12 80.91 27.58 6.12 10.98 3.16 0.82 78.60 8.98 40.27 0.39 3.16 49
14 137 1.12 82.78 28.62 6.03 9.50 4.25 0.87 78.27 9.32 33.26 0.43 3.57 176
15 138 1.13 82.45 28.07 6.17 9.55 4.10 0.86 81.15 9.18 8.93 0.12 1.22 306
16 142 1.14 82.66 28.56 5.98 9.45 3.98 0.86 80.64 9.54 18.51 0.26 2.32 279
17 149 1.17 84.04 29.48 6.80 8.78 4.45 0.89 81.46 9.89 12.76 0.19 1.95 62
18 151 1.17 83.86 29.57 6.13 8.68 4.16 0.87 81.48 9.48 11.07 0.15 1.49 205
19 162 1.19 84.83 31.70 6.15 8.46 4.17 0.88 80.80 9.54 19.03 0.26 2.39 109
Table 4. Means for the 19 groups of cotton bales
www.intechopen.com
Self Organizing Maps - Applications and Novel Algorithm Design
592
Group
No. Sci Len Unf Str Elg Sfi Mic Mat Rd +b Trc Tra Trg
1 3.67 2.76 1.50 5.69 8.65 10.41 10.29 3.04 3.44 12.29 31.32 50.20 45.65
2 16.45 5.13 2.77 9.87 12.44 18.52 12.86 3.80 5.59 16.04 43.53 83.85 56.41
3 5.45 3.19 1.50 6.24 8.49 10.13 12.30 3.16 2.69 11.70 34.37 59.40 54.44
4 5.48 3.13 1.50 6.28 8.50 10.14 12.37 3.18 2.69 11.77 34.59 56.50 53.09
5 3.58 3.31 1.57 5.81 8.24 10.15 11.85 3.21 3.47 12.13 13.21 43.42 27.61
6 2.89 3.43 1.60 5.61 9.07 9.67 12.98 3.35 3.39 11.53 14.56 47.19 42.33
7 12.50 4.25 2.55 10.52 6.17 17.47 13.88 4.19 5.41 9.56 41.41 30.44 19.79
8 2.98 3.16 1.54 4.64 8.25 9.28 13.04 3.38 3.79 12.04 7.00 41.78 24.20
9 2.88 3.03 1.49 5.44 8.11 10.75 11.94 3.19 3.81 11.53 9.63 36.36 24.59
10 2.73 3.53 1.50 5.95 9.66 10.27 11.83 3.19 2.81 11.49 26.20 57.21 53.38
11 2.90 3.20 1.58 5.36 9.70 10.71 13.04 3.25 3.09 10.92 17.43 65.09 46.51
12 5.10 3.86 1.78 6.56 8.64 9.74 12.34 2.88 3.88 10.23 15.06 29.52 21.70
13 8.59 3.09 1.77 5.41 6.39 9.51 10.33 1.92 3.65 10.10 46.79 58.70 40.06
14 5.00 3.60 1.43 6.12 9.19 9.55 13.02 3.26 3.95 12.10 16.48 49.27 28.22
15 3.02 3.21 1.31 5.52 9.32 8.78 9.81 2.59 3.07 11.58 35.15 73.38 50.13
16 2.78 3.41 1.67 6.15 9.11 9.59 12.92 3.28 2.85 12.21 16.59 68.71 45.65
17 12.18 6.52 2.42 11.91 15.33 15.45 15.16 4.46 2.87 16.43 60.64 100.92 64.70
18 2.35 2.94 1.41 6.63 9.41 8.87 10.28 2.84 2.93 11.57 43.48 60.55 51.94
19 4.57 3.68 1.77 8.01 8.34 8.82 11.33 2.94 3.12 11.58 37.92 57.64 47.34
MG 11.71 4.78 2.36 8.55 9.73 14.70 13.14 3.39 3.96 12.31 58.70 74.12 55.48
Table 5. CV for groups of cotton bales
Fig. 8. Visualization for the re-combined 2, 7 and 17 groups
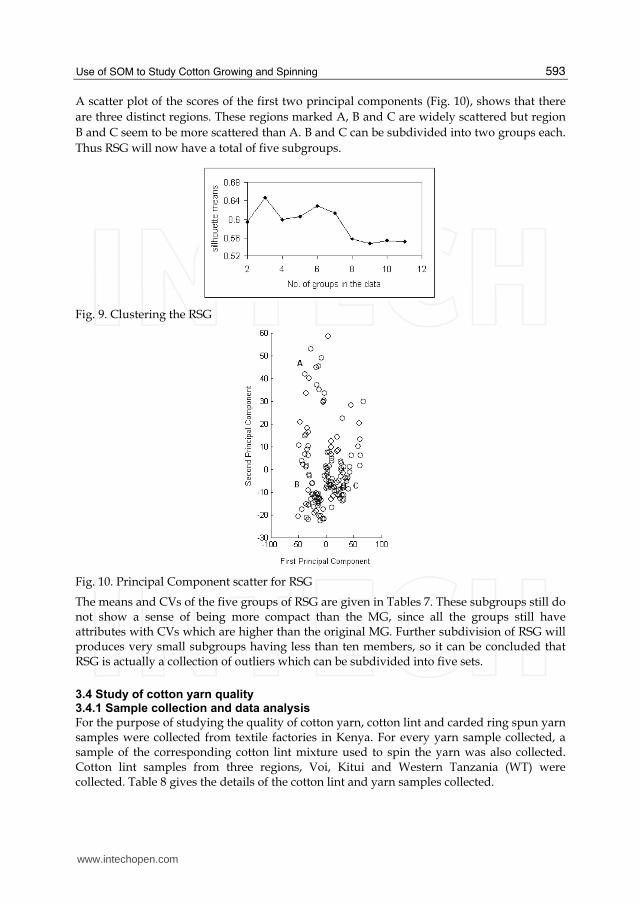
The silhouette means for the RSG is given in Fig. 9. The optimum clustering is 3, which was the initial number of groups in RSG before re-combining. Checking out the principal components of the attributes indicted that 97. 87% of the variance is accounted for by the first two principal components.
www.intechopen.com
Use of SOM to Study Cotton Growing and Spinning
593
A scatter plot of the scores of the first two principal components (Fig. 10), shows that there
are three distinct regions. These regions marked A, B and C are widely scattered but region
B and C seem to be more scattered than A. B and C can be subdivided into two groups each.
Thus RSG will now have a total of five subgroups.
Fig. 9. Clustering the RSG
Fig. 10. Principal Component scatter for RSG
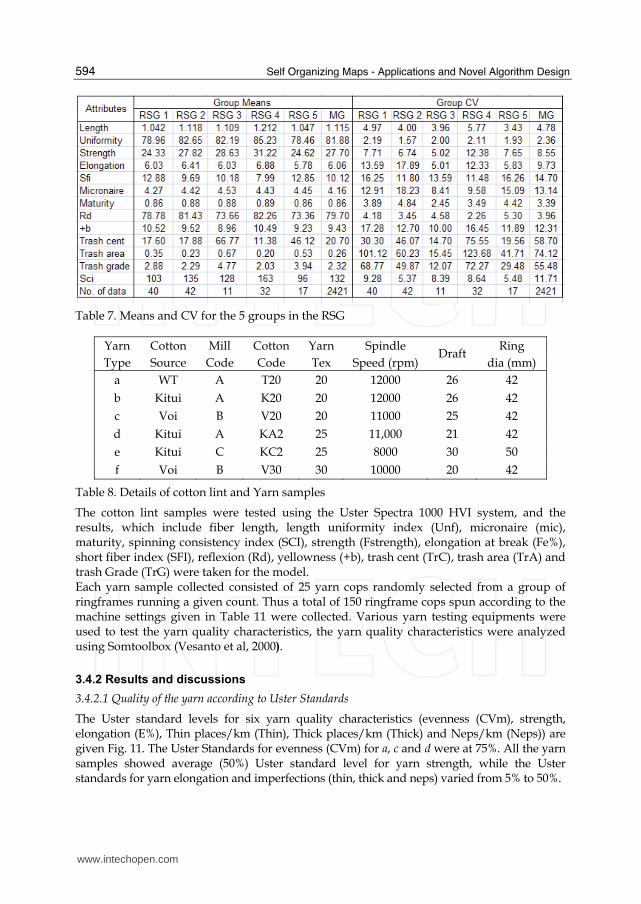
The means and CVs of the five groups of RSG are given in Tables 7. These subgroups still do not show a sense of being more compact than the MG, since all the groups still have attributes with CVs which are higher than the original MG. Further subdivision of RSG will produces very small subgroups having less than ten members, so it can be concluded that RSG is actually a collection of outliers which can be subdivided into five sets.
3.4 Study of cotton yarn quality 3.4.1 Sample collection and data analysis
For the purpose of studying the quality of cotton yarn, cotton lint and carded ring spun yarn samples were collected from textile factories in Kenya. For every yarn sample collected, a sample of the corresponding cotton lint mixture used to spin the yarn was also collected. Cotton lint samples from three regions, Voi, Kitui and Western Tanzania (WT) were collected. Table 8 gives the details of the cotton lint and yarn samples collected.
www.intechopen.com
Self Organizing Maps - Applications and Novel Algorithm Design
594
Table 7. Means and CV for the 5 groups in the RSG
Yarn Cotton Mill Cotton Yarn Spindle Ring
Type Source Code Code Tex Speed (rpm) Draft
dia (mm)
a WT A T20 20 12000 26 42
b Kitui A K20 20 12000 26 42
c Voi B V20 20 11000 25 42
d Kitui A KA2 25 11,000 21 42
e Kitui C KC2 25 8000 30 50
f Voi B V30 30 10000 20 42
Table 8. Details of cotton lint and Yarn samples
The cotton lint samples were tested using the Uster Spectra 1000 HVI system, and the results, which include fiber length, length uniformity index (Unf), micronaire (mic), maturity, spinning consistency index (SCI), strength (Fstrength), elongation at break (Fe%), short fiber index (SFI), reflexion (Rd), yellowness (+b), trash cent (TrC), trash area (TrA) and trash Grade (TrG) were taken for the model. Each yarn sample collected consisted of 25 yarn cops randomly selected from a group of ringframes running a given count. Thus a total of 150 ringframe cops spun according to the machine settings given in Table 11 were collected. Various yarn testing equipments were used to test the yarn quality characteristics, the yarn quality characteristics were analyzed using Somtoolbox (Vesanto et al, 2000).
3.4.2 Results and discussions
3.4.2.1 Quality of the yarn according to Uster Standards
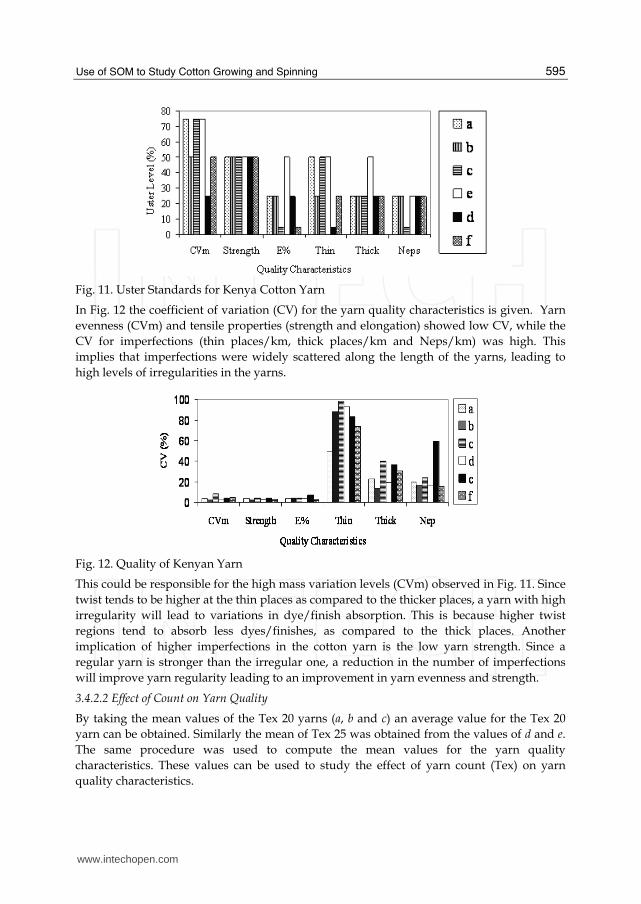
The Uster standard levels for six yarn quality characteristics (evenness (CVm), strength, elongation (E%), Thin places/km (Thin), Thick places/km (Thick) and Neps/km (Neps)) are given Fig. 11. The Uster Standards for evenness (CVm) for a, c and d were at 75%. All the yarn samples showed average (50%) Uster standard level for yarn strength, while the Uster standards for yarn elongation and imperfections (thin, thick and neps) varied from 5% to 50%.
www.intechopen.com
Use of SOM to Study Cotton Growing and Spinning
595
Fig. 11. Uster Standards for Kenya Cotton Yarn
In Fig. 12 the coefficient of variation (CV) for the yarn quality characteristics is given. Yarn
evenness (CVm) and tensile properties (strength and elongation) showed low CV, while the
CV for imperfections (thin places/km, thick places/km and Neps/km) was high. This
implies that imperfections were widely scattered along the length of the yarns, leading to
high levels of irregularities in the yarns.
Fig. 12. Quality of Kenyan Yarn
This could be responsible for the high mass variation levels (CVm) observed in Fig. 11. Since
twist tends to be higher at the thin places as compared to the thicker places, a yarn with high
irregularity will lead to variations in dye/finish absorption. This is because higher twist
regions tend to absorb less dyes/finishes, as compared to the thick places. Another
implication of higher imperfections in the cotton yarn is the low yarn strength. Since a
regular yarn is stronger than the irregular one, a reduction in the number of imperfections
will improve yarn regularity leading to an improvement in yarn evenness and strength.
3.4.2.2 Effect of Count on Yarn Quality
By taking the mean values of the Tex 20 yarns (a, b and c) an average value for the Tex 20
yarn can be obtained. Similarly the mean of Tex 25 was obtained from the values of d and e.
The same procedure was used to compute the mean values for the yarn quality
characteristics. These values can be used to study the effect of yarn count (Tex) on yarn
quality characteristics.
www.intechopen.com
Self Organizing Maps - Applications and Novel Algorithm Design
596
According to Figure 13 the tensile properties of cotton yarn (strength and elongation) increased with the increase in Tex, while yarn evenness (CVm) and imperfection (Thin, Thick Neps) decreased with the increase of Tex.
Fig. 13. Effect of count on yarn characteristics
Increase in yarn Tex increases the diameter of the yarn. The increase of imperfection as the count of the yarn decreases could have been caused by the decrease of the number of fibers in the yarn cross-section. As the number of fibers decreased the spinning limit was stretched due to the difficulties encountered as the fewer fibers try to combine together to form a yarn, hence leading to an increase in unevenness and imperfections.
3.4.2.3 Yarn Quality Analysis Using SOM
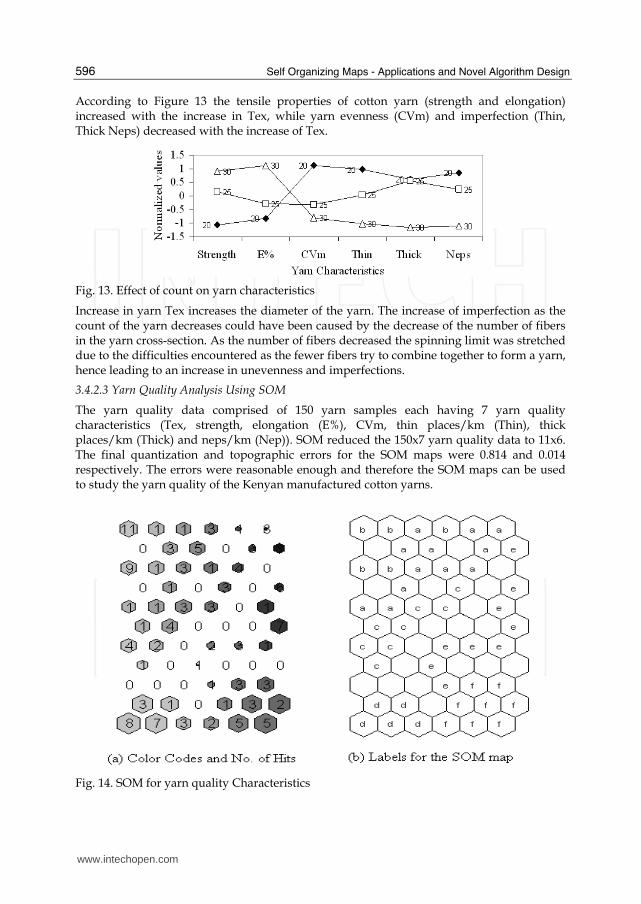
The yarn quality data comprised of 150 yarn samples each having 7 yarn quality characteristics (Tex, strength, elongation (E%), CVm, thin places/km (Thin), thick places/km (Thick) and neps/km (Nep)). SOM reduced the 150x7 yarn quality data to 11x6. The final quantization and topographic errors for the SOM maps were 0.814 and 0.014 respectively. The errors were reasonable enough and therefore the SOM maps can be used to study the yarn quality of the Kenyan manufactured cotton yarns.
Fig. 14. SOM for yarn quality Characteristics
www.intechopen.com

Use of SOM to Study Cotton Growing and Spinning
597
The SOM map with color codes and hits (number of samples per neuron) for yarn quality characteristics for the six cotton yarn samples is given in Fig. 14. The SOM algorithm was able to separate the fine counts (a, b and c) from the other three samples which were relatively coarser. Samples c and e were widely scattered in the map. This could be an indication of large variations in the quality of the yarn samples. Some members of sample e overlapped with samples a and f. This is a symptom of the presence of outliers in e, which implies that sample e has high irregularity. Sample e was spun at a lower speed when compared to sample d (same Tex). Lower spinning speed should lead to lower irregularity, but in this case the converse has happened. Therefore the only logically explanation for the presence of high irregularity in sample e is the presence of quality control problems in the concerned factory. Samples a, b, d and f were less scattered in the SOM map. There was an overlap between samples a and b. This was expected, as the two samples had everything in common except the raw material (cotton lint) used to spin them. The yarn quality characteristics for all the six yarn samples were visualized individually as shown in Figure 15. The SOM map for strength shows that the coarser counts (d, e and f) exhibited a higher strength as compared to the finer counts (a, b and c). It can also be noticed that the SOM map for count (Tex) is similar to that of strength. This is an indication of high correlation between the two characteristics. Similar results had been obtained in Fig. 13 and discussed in section 3.4.2.2. Sample e showed high CVm (bad from quality point of view).
Fig. 15. The Quality Characteristics of Kenyan Cotton
www.intechopen.com
Self Organizing Maps - Applications and Novel Algorithm Design
598
Sample d showed the best yarn evenness while the other remaining samples were average. Samples a, b and d showed a higher number of neps. This was unexpected especially for sample d which showed low level of thin and thick places. Given that the three samples (a, b and d) were collected from the same factory, it could be an indication of poor neps control in the concerned factory.
4. Conclusion and recommendations
4.1 The trend of cotton growing in Kenya Based on the collected samples and data the following conclusions can be made: • The production of seed cotton in Kenya has been declining in the last two decades • Kenyan farmers spend more on land preparations and at the expense of good yields
spend less than expected on farm inputs like fertilizers and pesticides • The break even cost of cotton growing in Kenya is US$ 0.31/ kg • The farmers received US$ 0.29 for a kg of seed cotton • There is a positive correlation between cotton yields and the costs of pesticides and weeding during cotton farming
Based on the results obtained in this study, it is hereby recommended that, • The Kenyan cotton farmers should adapt mechanized farming methods instead of the current manual farming methods • There is an urgent need for research to be done to establish the proper usage of fertilizers and other chemicals in the cotton growing industry • SOM techniques can be used to analyze the high dimensional data consisting factors which affect cotton yield.
4.2 Classification of Kenyan cotton lint
A cotton clustering algorithm consisting of data visualization by SOM, data clustering by k-means technique and the classification of cotton lint clusters by PNN was designed and tested using Kenyan cotton lint. SOM successfully visualized the HVI data reducing it from 192x13 to 12x6, indicating that the Kenyan cotton lint can be partitioned into four clusters. Clustering the Kenyan lint using k-means clustering technique revealed that the Kenyan cotton lint tend to have higher values of micronaire, maturity, spinning consistency index, strength, uniformity, elongation and reflectance but lower values for yellowness, short fiber index and trash measurements values. The PNN algorithm successfully classified the cotton lint into four clusters (R-value of 1).
4.3 Classification of cotton bales using SOM techniques
A cotton bale classification model has been proposed and used to classify 2421 cotton bales. The model reduced the 2421x13 HVI high dimensional data into 18x13 grids, with a quantization error of 1.879 and a topographic error of 0.083, and initially identified 19 groups in the data. Three of the groups containing a total of 144 data failed the compactness test. The final classification of the 2421 cotton bales contains 16 groups of cotton bales having a total of 2277 bales and five sets of 144 bales containing outliers.
4.4 Use of SOM techniques to study cotton yarn quality
The study of cotton ringframe yarn manufactured in Kenya was undertaken. The manufactured yarn samples showed low (good) CV for yarn evenness and tensile
www.intechopen.com
Use of SOM to Study Cotton Growing and Spinning
599
properties, while imperfection showed very high CV. This was an indication of high irregularity in the Kenyan manufactured yarns. The study of the effect of count on the yarn quality characteristics revealed that tensile properties increased with yarn count (Tex), while yarn evenness and imperfections decreased with increase in Tex. Use of Kohonen Self Organizing Maps (SOM) to study yarn quality characteristics produced the same results as reported above, hence SOM can also be used to analyze yarn quality characteristics. The SOM algorithm produced SOM maps which could easily show the behavior of the yarn quality characterizes for all the yarn samples. The SOM maps revealed that one of the factories had neps control problems. This study on the quality of carded cotton yarn manufactured in Kenya, revealed that the Kenyan manufactured yarn tend to show high levels of irregularity due to a high number of imperfections. Bases on the results obtained in this study, it is hereby recommended that an investigation should be done to find out the cause of the high level of imperfections in the Kenyan cotton yarn so that the industry can enhance the quality of its cotton ring spun yarns.
5. References
Majumdar, A.; Majumdar, P. K. & Sarkar, B. (2004). Selection of cotton bales by spinning consistency index and micronaire using artificial neural networks, Autex Research Journal, Vol. 4, No. 1, March 2004, 1-8, ISSN: 1470-9589.
Jain, A.K. & Dubes, R.C. (1988). Algorithms for Clustering Data, Prentice-Hall, ISBN 013022278X, Englewood Cliffs, NJ,
Azzam, H. A. & Mohamed, S. T. (2005): Adapting and tuning quality management in spinning industry, Autex Research Journal, Vol. 5, No. 4, December 2005, 246-258, ISSN: 14709589
Bluman, A. G., (2004). Elementary Statistics, McGraw Hill, ISBN: 10-000557689X, New York, 5th Edition
Panagariya, A; Shah, S & Mishra, D (2001). Demand Elasticities in International Trade: Are They Really Low, Journal of Development Economics, Vol. 64, No. 2, April 2001, 313-342, ISSN: 0304-3878
Bolat, B. & Yildirim, T. (2003), Performance Increasing Methods for Probabilistic Neural Networks, Pakistan Journal of Information and Technology, Vol. 2 No. 3, 250- 255, ISSN: 1682-6027
D. F. Specht (1996), Probabilistic neural networks and general regression neural networks, In : Fuzzy Logic and Neural Network Handbook, C.H. Chen (Ed.), 301-344, McGraw-Hill Inc., ISBN:0-07-011189-8, New York
White, E. Jones, P. & Yankey, J (1999), Cotton Testing, In: Progress in Textiles: Science & Technology, vol. 1, V.K. Kothari, (Ed.), 45-91, ISBN: 81-901033-0-X, New Delhi
G.D. Joubert, A. Swanepoel, E.G. Eulitz, A.P.F. Cornelissen, and D. Venter, An interdisciplinary approach to the improvement of fibre quality, Proc. of the 61st International Cotton Advisory Committee, pp. 14-17, Cairo, Egypt, October 2002, ICAC, Washington
H. Demuth, and M. Beale, (2005), Neural Network Toolbox User Guide, chapt. 7, 8 and 9, The MathWorks, Natick
ICAC, Cotton: Review of world situation, Vol. 58, No.2, 2004, pp. 3-5, Washingtone Frydrych, and M. Malgorzata, (2002), Proc. of the 61st International Cotton Advisory Committee, 7
www.intechopen.com
Self Organizing Maps - Applications and Novel Algorithm Design
600
Cling, J.-P., Razafindrakoto, M., & Roubaud, O. (2005), Export Processing Zones in Madagascar: Success Story under Threat, World Development, 2005, Vol 33, No. 5, 785–803, ISSN: 0305-750X
Jang, J.-S.R., & Mizutani, E. (1997), Unsupervised Learning and Other Neural Networks, In Neuro-Fuzzy and Soft Computing, Jang, J.-S.R.; Sun, C.-T, & Mizutani, E., (Ed. ), 310-310, Prentice Hall, ISBN: 0-13-261066-3, Upper Saddle River, NJ
Klein, W. (1987): The Technology of Short Staple Spinning, In D.H. Stalder (Eds), short staple spinning series, The Textile Institute, Manchester. ISBN:1870812859.
Karim Hussein (2004), Importance of Cotton Production and Trade in West Africa, Proceedings of WTO African Regional Workshop on Cotton, Cotonou, Benin, March 2004.
Kenya Government, (1996a): Industrial Transformation to the Year 2020, Sessional paper No.2, Government Printers, Nairobi.
Kenya Government, 1996b: Rapid Industrialization for Sustained Development, Development plan 1997-2001, Government Printers, Nairobi.
Kenya Government, 1982, Report and Recommendations of the Working Party on Government Expenditures (Ndegwa Report), Government Printers, Nairobi.
Kothari, V.K., 1999, Yarn evenness and appearance, In Kothari, V.K. (Eds): Progress in Textiles: Science & Technology, vol. 1: Testing & Quality Management, IAFL Publications, New Delhi., ISBN-10: 0412540304
Mario Rodriguez Rico (2002), Impact of low prices on production practices and fiber quality-A farmer’s perspective, Proceedings of the International Cotton Advisory Committee Technology, Management and Processing for Quality Fiber, 61st Meeting, Cairo, Egypt, October, 2002: 3-7.
McCreight, D. J.; Feil, R. W; Booterbaugh, J. H. and Backe, E. E. (1997): Short Staple Yarn Manufacturing, Carolina Academic Press, Durham, North Carolina, ISBN-10: 0890898537
Hagan, M.T.; Demuth, H,B & Beale, M, (2002), Neural Network Design, China Machine Press, Beijing, ISBN: 10-0971732108
Mwangi MI.M. (2004), The Textile Industry in Kenya, Nairobi, Government Printers, 2004 Kimenyi M.S. (2001). Agriculture: The Solution to Economic Problems and Poverty,
Agriculture, Economic Growth and Poverty Reduction, Economic Management, Nairobi, 2001.
Weiss, N. A., (1997), Introductory Statistics, Addison-Wesley Publishing Company, Inc., New York, 4th Edition, pp. 41-178(1997), ISBN: 0201539292
Oxtoby E, (1987): Spun Yarn Technology, Butterworth & Co (Publishers) Ltd, London, ISBN: 10-0408014644
Uster, (2007): Uster Statistics 2007, Uster Technologies AG, Wilstrasse. Kohonen, T. (1997), Self-Organizing Maps, pp. 85-144, Springer-Verlag Berlin/Heidelberg,
1997, ISBN 3-540-67921-9 Vesanto, J.; Himberg, J. Alhoniemi, E. and ParhanKangas, J. (2000): SOM Toolbox for Matlab 5,
Helsinki University of Technology, ISBN: 951-22-4951-0 Si, J.; Nelson B.J. & Runger G.C. (2003), Artificial Neural Network Models for Data Mining,
In: The Handbook of Data Mining, Ye, N., (Ed.), LEA Publishers, 2003, London, ISBN 0-8058-4081-8, pp. 42-65
Ikiara, M.M. and L.K. Ndirangu (2004). Prospects for Kenya’s Clothing Exports Under AGOA after 2004, Chapter in Clothing and Footwear in Africa’s Industrialisation, edited by D. McCormick and C. Rogerson. African Institute of South African Publishers.
www.intechopen.com

Self Organizing Maps - Applications and Novel Algorithm DesignEdited by Dr Josphat Igadwa Mwasiagi
ISBN 978-953-307-546-4Hard cover, 702 pagesPublisher InTechPublished online 21, January, 2011Published in print edition January, 2011
InTech EuropeUniversity Campus STeP Ri Slavka Krautzeka 83/A 51000 Rijeka, Croatia Phone: +385 (51) 770 447 Fax: +385 (51) 686 166www.intechopen.com
InTech ChinaUnit 405, Office Block, Hotel Equatorial Shanghai No.65, Yan An Road (West), Shanghai, 200040, China
Phone: +86-21-62489820 Fax: +86-21-62489821
Kohonen Self Organizing Maps (SOM) has found application in practical all fields, especially those which tendto handle high dimensional data. SOM can be used for the clustering of genes in the medical field, the study ofmulti-media and web based contents and in the transportation industry, just to name a few. Apart from theaforementioned areas this book also covers the study of complex data found in meteorological and remotelysensed images acquired using satellite sensing. Data management and envelopment analysis has also beencovered. The application of SOM in mechanical and manufacturing engineering forms another important areaof this book. The final section of this book, addresses the design and application of novel variants of SOMalgorithms.
How to referenceIn order to correctly reference this scholarly work, feel free to copy and paste the following:
Josphat Igadwa Mwasiagi (2011). Use of SOM to Study Cotton Growing and Spinning, Self Organizing Maps -Applications and Novel Algorithm Design, Dr Josphat Igadwa Mwasiagi (Ed.), ISBN: 978-953-307-546-4,InTech, Available from: http://www.intechopen.com/books/self-organizing-maps-applications-and-novel-algorithm-design/use-of-som-to-study-cotton-growing-and-spinning