0 2 4 6 8 days after subculture f e osmolarity (osm) c 0.2 0.1 b 6.0 5.0 4.0 ph cell density (g/ml)...
TRANSCRIPT

0 2 4 6 8 Days after subculture
f
e
Osm
olar
ity (
Osm
) c
0.2
0.1
b6.0
5.0
4.0
pHCe
ll de
nsity
(g/
ml)
0.4
0.2
0.0
a ± 5-phosphatase
d± 5-kinase
0 2 4 6 8
WTC-5 I2-8I2-2
WT GFPHsPIPKla-2HsPIPKIa-3
Figure S1Ma et al., 2014
Cont. on next page

Figure S1Ma et al., 2014
Cont. from previous page
Fig. S1 Time course of cell growth and culture parameters. a-c Ptase cells group (I2-2 and I2-8, 5-phosphatase-transformed cells, C5: empty-vector-transformed cells, WT: wild-type cells; Perera et al. 2002). d-f PIPK cells group (HsPIPKIa-2 and HsPIPKIa-3, 5-kinase-transformed cells, GFP, GFP-transformed cells, WT; Im et al., 2007). a, d Growth curves obtained from fresh weight of cells in1 mL samples (centrifuged to obtain packed cells, with the supernatant discarded). For each cell line, the cells were harvested on consecutive days after subculture (inoculation), from one of initially seven 125 mL culture flasks, containing each 16 mL of simultaneously inoculated cultures. The flask contents were discarded after sampling. Symbols are means ( SE) of four replicate samples from two (a) or three (d) independent experiments (culture cycles). The full symbols indicate lipid-modified cell lines and the open symbols – their respective controls. b, c, e, f Osmolarity and pH of the media (mean SE), determined using a vapor pressure osmometer and a pH electrode, respectively, on each day of the culture cycle, from two (b, c) and three (e, f) independent experiments (culture cycles). Note the similarity of culture parameters among the different cell lines on the harvest day for P f determinations (4 days after inoculation)

WT
GF
PH
sPIP
KIa
-2
Figure S2Ma et al., 2014
Cont. on next page

Figure S2Ma et al., 2014
Cont. from previous page
Fig. S2 Verification of the transgene presence in the cell cultures. Representative images of WT, GFP and PIPK (HsPIPKIα-2) cells (two different fields each), photographed at the conclusion of all our reported experiments (about the same time as the experiments of Fig. 5 and over five years after the generation of the GFP and PIPK cells transgenic lines (Im et al. 2007). The protoplasts were isolated 4 days after inoculation and visualized using epifluorescence microscopy (Ex: 290 nm, Em: 510 nm). Cells designations are as in the preceding figures. Note the plasma membrane localization of the GFP-labeled PIP 5-kinase in the PIPK cells (arrows), and the cytosolic localization of GFP in the GFP cells (arrows). Mean cell diameters (Suppl. Fig. S4) of these cells has not changed during the several years period

Figure S- 3 Ma et al., 2014Cont. on next page
BEFORE TREATMENT WASHa+
PA
- P
A
PIP
KC
sW
T
+ P
A-
PA

Figure S- 3 Ma et al., 2014
Cont. on next page
Cont. from previous page
Fig. S3 Verification, that propionic acid induces cytosolic acidification.a Representative fluorescence images of protoplasts from the WT and PIPK (HsPIPKIα-2) cell lines, all transformed transiently with GFP (in the PIPK cells GFP fluorescence is added on top of the fluorescence of the GFP-fused plasma-membrane kinase) to monitor the cytosolic pH (as in Pinton et al. 2007). The images were captured in control conditions (-PA) (BEFORE), then at the end of the 7 min incubation (TREATMENT), with isotonic solution with propionic acid (+PA) or without it (-PA), as in the preparation for the 1st assay of Pf in Fig. 3, and subsequently, after approx. 1 min of
wash and 6 min of incubation with the isotonic solution without propionic acid (WASH), as in the preparation for the 2nd assay of Pf
in Suppl. Fig. S5b. Note the decline of GFP fluorescence in the propionic-acid-treated cells (marked with yellow asteriscs), which signifies acidification, followed, in some cells, by the partial restoration of GFP fluorescence (i.e., partial alkalinization) upon the propionic acid washout. Scale bar: 10 mm.

Cont. from previous page
Figure S3 Ma et al., 2014
b Mean net (background subtracted) values of GFP fluorescence (±SE) in the experiments described in a. The fluorescence of each cell was normalized to its initial fluorescence (BEFORE). The data are pooled from the indicated numbers of protoplasts from two independent experiments. *, the decline of fluorescence upon propionic acid (+PA) treatment was significant (at P<0.01) relative to the fluorescence prior to treatment, while the treatment with the same solution without PA (-PA) did not affect the fluorescence. The fluorescence in the acidified-then-washed-out cells was quite variable and hence, on average, did not show a significant restoration in the few protoplasts assayed. This is in contrast to the significant (though small) restoration of the mean P f in the acidified-then-washed-out PIPK cells of Suppl. Fig. S5b (and Fig. 3) experiments, perhaps because of the additional burden (here) of the GFP transformation, and /or the skipped hypotonic assays (used in fig 3 experiments to determine Pf)
WT -PA WT +PA High PIs -PA High PIs +PA
0
50
100
BEFORE -PA / +PA TREATMENT WASH
5
*
574
NE
T F
LU
OR
ES
CE
NC
E I
NT
EN
SIT
Y
(r
el.
un
its)
b
0
50
100
*
WT –PAWT +PA
PIPKCs +PA
PIPKCs -PA

aRa
dius
(µm
)
WT
WT
b
cd
cc c de e
NT1 cell lines
C-5 I2-8 I2-2GFP
HsPIPKa
-2
HsPIPKIa
-3
30
20
10
0
Controls / PIPK cellsControls / Ptase cells
48 61 49 2342 22 23 19
Figure S4Ma et al., 2014
Fig. S4 Protoplasts baseline radii. The mean radii (±SE) of protoplasts in isotonic medium extracted from their top-view images, averaged over the indicated numbers of cells. Data of Fig. 1. a Ptase cells, and their controls, b PIPK cells and their controls. Different letters (c, d and e) denote significantly differing cell sizes, compared among all of the cell lines (P<0.05). Note, that although not all mean protoplasts sizes were equal (in the PIPK cells group, the PIPK cells were smaller than their corresponding controls, WT and GFP cells, by ~20 % and ~15 %, respectively, and the GFP cells were smaller than their corresponding WT cells by ~15%, and in the Ptase cells group, WT were smaller by ~15% than the cells of other lines), the different sizes were inherently accounted for in our calculations (Moshelion et al. 2004). In other words, these differences did not affect the resulting calculated osmotic permeability values which characterize a unit surface area of the cell membrane. Hence, in spite of the difference in size between the WT protoplasts of the two groups (related to their analysis being done many months apart, as noted already by Ma et al. 2009), their membrane water permeability values did not differ (Fig. 2)

Fig. S5 Pf inhibition by cytosolic acidification reveals the aquaporin component
of Pf. a The effect on Pf of acidification by propionic acid: the detailed statistics
of Fig. 3 data (Materials and methods). Indicated are the evaluated comparisons between means. The Pf in the PIPK cells was 3.6 and 4.1 times
higher than in WT or in GFP cells, respectively. Asteriscs indicate the level of significance of the differences within the indicated pairs of means: *, P< 0.02, **, P<0.01, ***, P<0.001, no asteriscs, P> 0.05 (insignificant difference). Other details as in Fig. 3. b Pf recovery from acidification was checked in a 2nd P f
assay, by washing the cell after the 1st Pf assay (flushing roughly 5-10 bath volumes) with a non-acidifying isotonic solution (Isotonic solution-PA, Materials and methods), incubating the cell in this solution for 6 minutes and assaying P f
in the same cell again by a non-acidifying hypotonic solution (Hypotonic solution-PA, Materials and methods). Thus, the non-acidified cells (-PA) differed from the acidified cells (+PA) only in their propionic acid treatment during both the initial incubation and the 1st Pf assay. Asteriscs, as above, except *,
P<0.05; **, s<0.02; ***, P<0.001. Other details as in a. Note the significant reversal [albeit, still partial] of the PIPK cells P f in the 2nd assay after the
propionic acid washout
Figure S5 Ma et al., 2014
WT WT+acid HsPIPK2 HsPIP2+acid -- --
0
2
4
))
CellTypes
no
AC
ID (
m s
-1)
WT WT +w WT+acidWT+acid +wHsPIPK2HsPIPK2 +wHsPIP2+acid HsPIP2+acid +w-- -- --
0
2
4
CellTypes
1st assay 2nd assay (- PA)- PA
+PA
post ‘- PA’
post ‘+PA’
NT1 cell lines
b
6 4 9 4 1713 10 6
*
*****
6 179 13
***
**
4
2
Pf
(re
l. un
its)
0
a
WT PIPKCsWT PIPKCs

WT GFP P2 P30
10
20
30
40
A
S1
NtPIP1;1 NtPIP1;2a NtPIP1;3 NtPIP1;4 NtPIP1;5
WT GFP P2 P30
2
40
50
60
A
S1
NtPIP2;1 NtPIP2;2 NtPIP2;3 NtPIP2;4 NtPIP2;5 NtPIP2;6a NtPIP2;6b NtPIP2;7a NtPIP2;7b NtPIP2;8 NtPIP2;9
Gen
e ex
pres
sion
leve
l (re
l.)
10
NT1 cell lines
HsPIPKIa-20
GFP
HsPIPKIa-3WT
20
30
40
a
0
2
40
50
60
b
HsPIPKIa-2GFP
HsPIPKIa-3WT
Cont. on next. page
Figure S6Ma et al., 2014
NtPIP1
NtPIP2
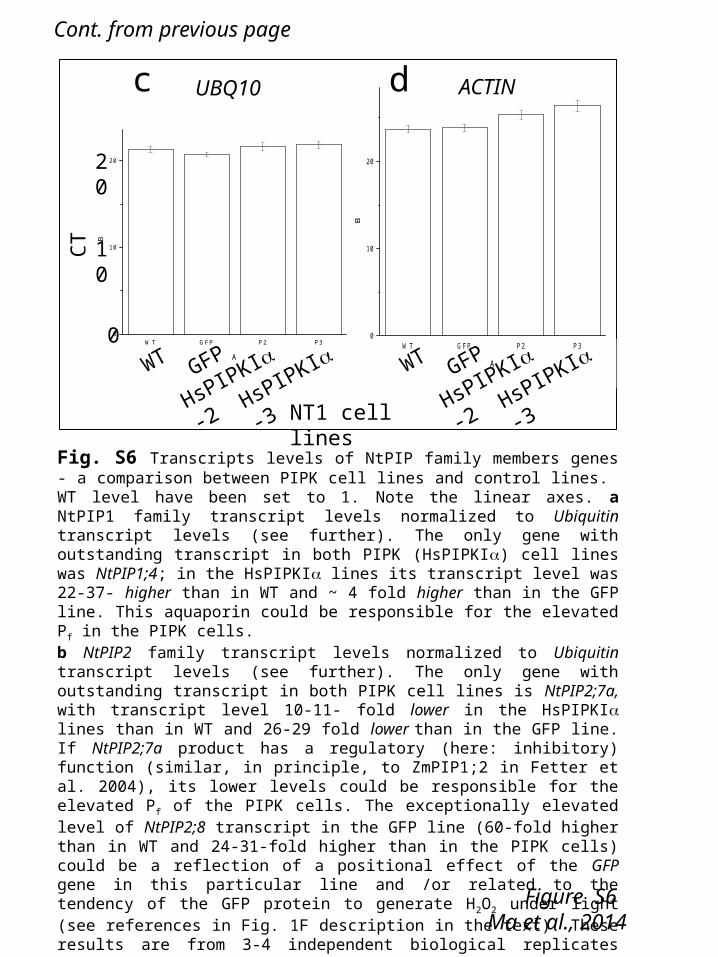
Figure S6Ma et al., 2014
Cont. from previous page
Fig. S6 Transcripts levels of NtPIP family members genes - a comparison between PIPK cell lines and control lines. WT level have been set to 1. Note the linear axes. a NtPIP1 family transcript levels normalized to Ubiquitin transcript levels (see further). The only gene with outstanding transcript in both PIPK (HsPIPKIa) cell lines was NtPIP1;4; in the HsPIPKIa lines its transcript level was 22-37- higher than in WT and ~ 4 fold higher than in the GFP line. This aquaporin could be responsible for the elevated P f in the PIPK cells. b NtPIP2 family transcript levels normalized to Ubiquitin transcript levels (see further). The only gene with outstanding transcript in both PIPK cell lines is NtPIP2;7a, with transcript level 10-11- fold lower in the HsPIPKIa lines than in WT and 26-29 fold lower than in the GFP line. If NtPIP2;7a product has a regulatory (here: inhibitory) function (similar, in principle, to ZmPIP1;2 in Fetter et al. 2004), its lower levels could be responsible for the elevated P f of the PIPK cells. The exceptionally elevated level of NtPIP2;8 transcript in the GFP line (60-fold higher than in WT and 24-31-fold higher than in the PIPK cells) could be a reflection of a positional effect of the GFP gene in this particular line and /or related to the tendency of the GFP protein to generate H2O2 under light (see references in Fig. 1F description in the text). These results are from 3-4 independent biological replicates (each transcript assayed in triplicate). c and d qPCR results (cycle threshold, CT) of Ubiquitin (UBQ10, c) and Actin (d) transcript levels from 4-6 qPCR separate assays (4 independent biological assays). The trends of the major changes noted in a and b were detectable with either actin or ubiquitin as the normalizer
WT GFP P2 P30
10
20
B
AWT GFP P2 P3
0
10
20
BA
UBQ10 ACTINC
Tc d
10
20
HsPIPKIa-2GFP
HsPIPKIa-3WT
HsPIPKIa-2GFP
HsPIPKIa-3WT0
NT1 cell lines
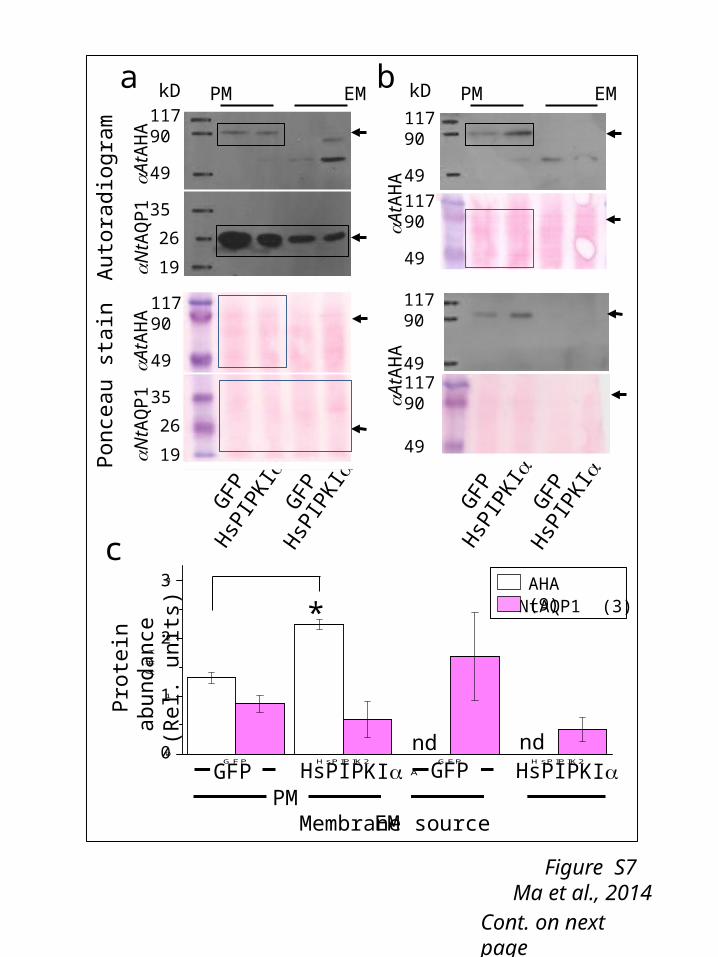
Figure S7Ma et al., 2014
Cont. on next page
baP
once
au s
tain
Aut
orad
iogr
am117
90
49
35
kD
26
19
HsP
IPKIa
HsP
IPKIa
GFP
GFP
PM EM
aN
tAQ
P1
aA
tAH
Aa
NtA
QP
1a
AtA
HA 117
90
49
35
26
19
aA
tAH
A
kD PM EM
117 90
49
HsP
IPKIa
HsP
IPKIa
GFP
GFP
GFP HsPIPIK2 GFP HsPIPIK20
1
2
3
AH
A
AHsPIPKIa HsPIPKIaGFPGFPPM EM
3
2
1
0Pro
tein
abu
ndan
ce
(Rel
. uni
ts) NtAQP1 (3)
AHA (9)
Membrane source
c
*
ndnd
117 90
49
117 90
49117
90
49
aA
tAH
A

Figure S7Ma et al., 2014
Cont. from previous page
Fig. S7 PIPK cells background (PtdInsP2 / IP3 enrichment) did not increase the abundance of an ensemble of NtPIP1-subfamily proteins. a Autoradiograms (grey, above) of the same Ponceau-stained (pink, below) protein blots of plasma membrane (PM) and endosomal membranes (EM) of tobacco NT1 cells, obtained from microsomes by aqueous two-phase partitioning, as described by Perera et al. 1999), then resolved by SDS-PAGE. The protein blot was cut into two parts and each part was probed with a different antibody (kind gifts from Prof. Maeshima and Prof. Kaldenhoff), as follows: top part: rabbit antibody (aAtAHA) raised against the α subunit of the Arabidopsis AHA3 (plasma membrane proton ATPase; Kobae et al. 2004); bottom part: chicken anti-NtPIP1;1 antibody (aNtAQP1; Biela et al. 1999, Otto and Kaldenhoff 2000); Arrows: top (~93 kD) AHA, bottom (~25 kD), NtAQP1 (containing perhaps also additional NtPIP1s). Rectangles: areas used for the quantification; see details below, in Suppl. Materials & methods). b Same as a, except only AHA bands (two additional examples from different cell harvests) are included. c Mean relative abundance (band intensities, ±SE) of the presumed AHA and NtAQP1 proteins (determined as described below, in Suppl. Materials and methods) in the indicated number of independent cell harvests. Note that while the PIPK cells had ~60% more AHA protein than the control GFP line, the cell lines did not differ in their general NtPIP1 and NtAQP1 protein abundance. nd, not determined.
If the anti-NtPIP1;1 (anti-NtAQP1) antibody was not selective among the tobacco PIP1 aquaporins (based on Bots et al. 2005), it could report only the overall combined protein abundance of all or some NtPIP1s. That this protein abundance was no different between the PIPK cells and the control cells could mean either that the abundance of each of the PIP1s was indeed similar, or that the sum of increases and decrease in protein expression of the different PIP1s cancelled out
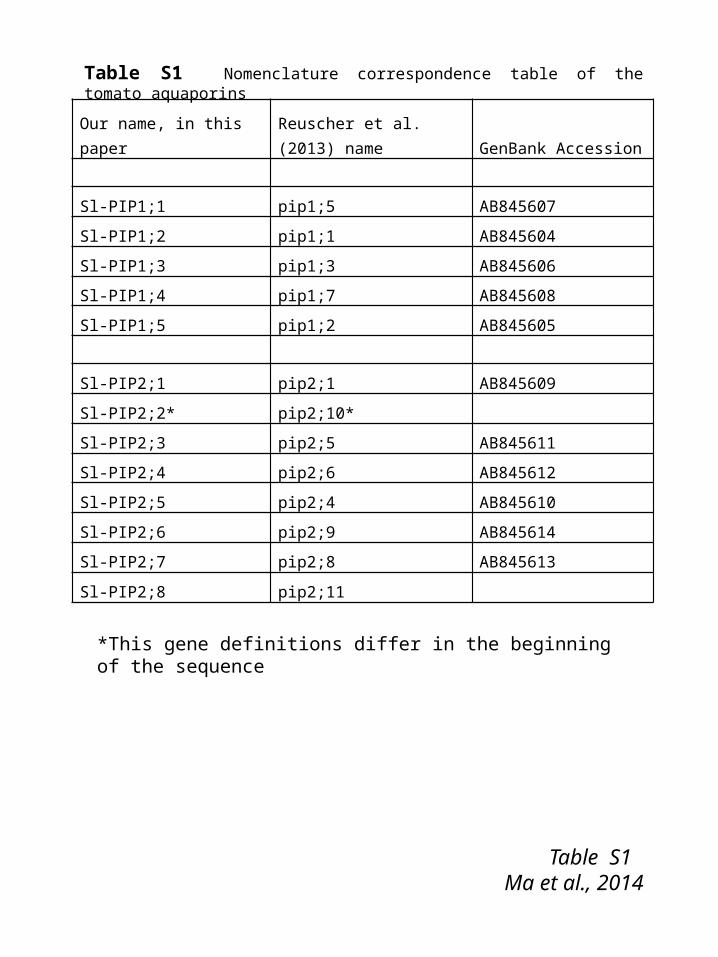
Our name, in this paper Reuscher et al. (2013) name GenBank Accession
Sl-PIP1;1 pip1;5 AB845607
Sl-PIP1;2 pip1;1 AB845604
Sl-PIP1;3 pip1;3 AB845606
Sl-PIP1;4 pip1;7 AB845608
Sl-PIP1;5 pip1;2 AB845605
Sl-PIP2;1 pip2;1 AB845609
Sl-PIP2;2* pip2;10*
Sl-PIP2;3 pip2;5 AB845611
Sl-PIP2;4 pip2;6 AB845612
Sl-PIP2;5 pip2;4 AB845610
Sl-PIP2;6 pip2;9 AB845614
Sl-PIP2;7 pip2;8 AB845613
Sl-PIP2;8 pip2;11
Table S1 Nomenclature correspondence table of the tomato aquaporins
Table S1Ma et al., 2014
*This gene definitions differ in the beginning of the sequence

Table S2Ma et al., 2014
Cont. on next. page
a
Primer ID Primer sequence Tm Based on ver 5 TC ID
NtPIP1;1_F CCGGGCAGGTGTACTATCCACTTAGCA 61.8 AF024511
NtPIP1;1_R GGCTGTGTTTCTCTGAATTTGTTAGCTCCA 61.4
NtPIP1;2a_F CCCCTTTTCTGATGCTGTTGTCTCA 63.8 TC40230
NtPIP1;2a_R GGCACGAGAAATCTTTCACTTGATATGGA 64.3
NtPIP1;3_F TTCTGGGTTGGACCATTCATTGGA 61.3 AF440271
NtPIP1;3_R TGGAATACAGAGTCTTGAAAAAGGCAAA 61.4
NtPIP1;4_F GGATGACCACTGGATATTCTGGGTTGGA 63.2 SGN-U446937
NtPIP1;4_R GGCCACATGATGATTCAGCTTGAGA 62.6
NtPIP1;5_F CTTGTACCACCAGGTTATCATAAGAGCCA 62.6 TC43989
NtPIP1;5_R TGCCAATCATAGCAAACTAACCAATTACAGA 62.2
Table S2 Primers for RT-PCR based on sequences of tobacco aquaporins, designed for identification of PIP1 or PIP2 aquaporins. F, forward, R, reverse, Tm: melting temperature in oC, TC ID, Tentative consensus sequence identification numbers. Numbers in red are accession numbers of previously identified aquaporin genes. a NtPIP1 gene primers. Note that the primers for the “paired” genes (a_ and b_) were identical. Accession Nos. AF024511 and AF440271, aquaporins known, respectively, as NtAQP1 (Biela et al. 1999) and NtPIP1;1 (Bots et al. 2005). b NtPIP2 gene primers (see also Fig. 5 and Materials and methods, and Suppl. Materials and methods). Accession No. AF440272, aquaporin known as NtPIP2;1 (Bots et al. 2005)

Cont. from prev. page
bPrimer ID Primer sequence Tm Based on ver5
TC ID
NtPIP2;1_F TTCTCCTCTCTCAAAATTAGCAAAGCTCA 62.6 TC40517
NtPIP2;1_R GTCTTGGTAGTCTTTTGGGGCGTA 61.8
NtPIP2;2_F TTAAAATTTCCAACTCCATAAATACCCCA 60.0 TC45235
NtPIP2;2_R CCATATTTGCCCTTTGTTTAATTCGGCTA 60.6
NtPIP2;3a_F GAGCCTTAATTTAGAGAACAGAGTGCAAA 62.2 TC56589
NtPIP2;3a_R GGTGCTGGAGGTGGATCTTGGTA 62.6
NtPIP2;4a_F GTCTAAAGAAGTAGAGGCAGTGTCTGA 61.7 SGN-U444340
NtPIP2;4a_R CAGCAATACAAGCTCTGTAAAGTGACCA 61.8
NtPIP2;5_F GCCTACCACCAGTATATCCTCCGA 61.1 TC40729
NtPIP2;5_R TTGAGCAATGAGAAGTCTTAGGCA 60.5
NtPIP2;6a_F CGGGGAGACAAAAGCAGAAAACCAAA 60.4 TC40251
NtPIP2;6a_R TCCTTCCTCAATTACGTCCTTTGACA 60.4
NtPIP2;6b_F GATTCTGTGTATGAGGAATGTACGAACCA 63.5 TC42036
NtPIP2;6b_R AGGAAAACACCACCAACACTAGTCATACCAA 63.7
NtPIP2;7a_F TTAAAACAACATTTGCAATCACAACCAGA 61.2 TC40912
NtPIP2;7a_R AAGGGAGAGTTCCATAGTTTCCTCTTACACA 61.2
NtPIP2;7b_F GTTTTGCTGTTTTCATGGTTCATTTGGCTA 61.0 AF440272
NtPIP2;7b_R CAACCCAGAAAATCCATTGATCATCCCA 61.1
NtPIP2;8_F CTCTCCTCATTAATAATGCTGTATCTACCCA 61.1 TC14419
NtPIP2;8_R ACCAAAACAACCGTGGTCGACA 61.5
NtPIP2;9a_F GGTGCAGCAGTTATTTACAATCAGGA 60.7 SGN-U447246
NtPIP2;9a_R AGGCTCCGATGAAGGGACCCA 61.3
Table S2Ma et al., 2014