| westpac group full year 2016 presentation & investor … · | westpac group full year 2016...
TRANSCRIPT

| Westpac Group Full Year 2016 Presentation & Investor Discussion Pack 1

| Westpac Group Full Year 2016 Presentation & Investor Discussion Pack
Westpac Full Year 2016 result index
2
Full Year 2016 Result Presentation 3
Investor Discussion Pack of Full Year 2016 Result 29
Strategy 30
OverviewPerformance disciplineService leadershipDigital transformationWorkforce revolutionSustainable futures
353741435051
Earnings driversNet interest incomeNon-interest incomeMarkets and Treasury incomeExpensesImpairment charges
545559606164
Asset quality 65
Capital, Funding and Liquidity 83
Divisional resultsConsumer BankBusiness BankBT Financial GroupWestpac Institutional BankWestpac New Zealand
93949698
101105
Economics 109
Appendix and Disclaimer 126
Contact us 132

Westpac Banking Corporation ABN 33 007 457 141.
Brian HartzerChief Executive Officer
Financial results based on cash earnings unless otherwise stated. Refer page 36 for definition. Results principally cover the FY16, FY15 and 2H16 and 1H16 periods. Comparison of 2H16 versus 1H16 (unless otherwise stated)

| Westpac Group Full Year 2016 Presentation & Investor Discussion Pack
Consistent operating performance; strengthening the franchise
4
• Core earnings up 3%, cash earnings flat, ROE lower
• Disciplined management in an environment of increased competition, low interest rates, and higher capital
• Consumer and Business Banks strong; more difficult conditions in Wealth and WIB
• Good progress on productivity and digital transformation
• Franchise value has grown – world’s most sustainable bank1
• Dividend unchanged
1 Global banking leader in the Dow Jones Sustainability Index 2016.
| Westpac Group Full Year 2016 Presentation & Investor Discussion Pack
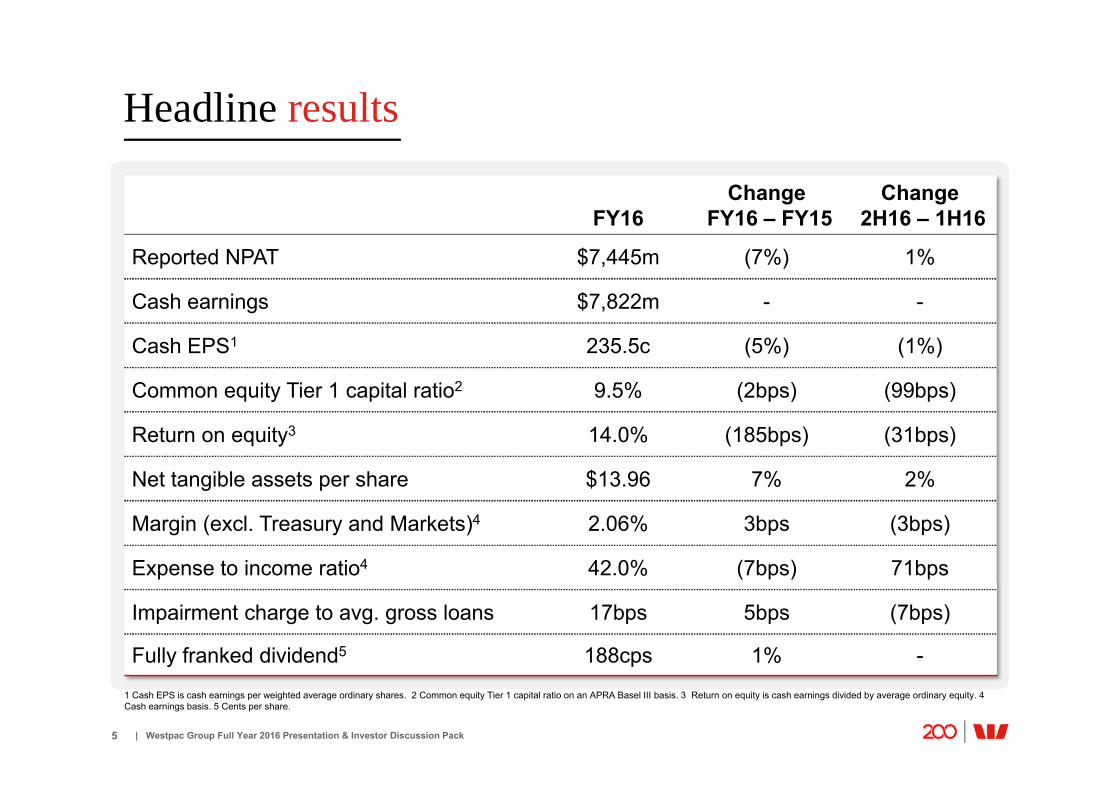
Headline results
5
FY16Change
FY16 – FY15Change
2H16 – 1H16
Reported NPAT $7,445m (7%) 1%
Cash earnings $7,822m - -
Cash EPS1 235.5c (5%) (1%)
Common equity Tier 1 capital ratio2 9.5% (2bps) (99bps)
Return on equity3 14.0% (185bps) (31bps)
Net tangible assets per share $13.96 7% 2%
Margin (excl. Treasury and Markets)4 2.06% 3bps (3bps)
Expense to income ratio4 42.0% (7bps) 71bps
Impairment charge to avg. gross loans 17bps 5bps (7bps)
Fully franked dividend5 188cps 1% -
1 Cash EPS is cash earnings per weighted average ordinary shares. 2 Common equity Tier 1 capital ratio on an APRA Basel III basis. 3 Return on equity is cash earnings divided by average ordinary equity. 4 Cash earnings basis. 5 Cents per share.
| Westpac Group Full Year 2016 Presentation & Investor Discussion Pack
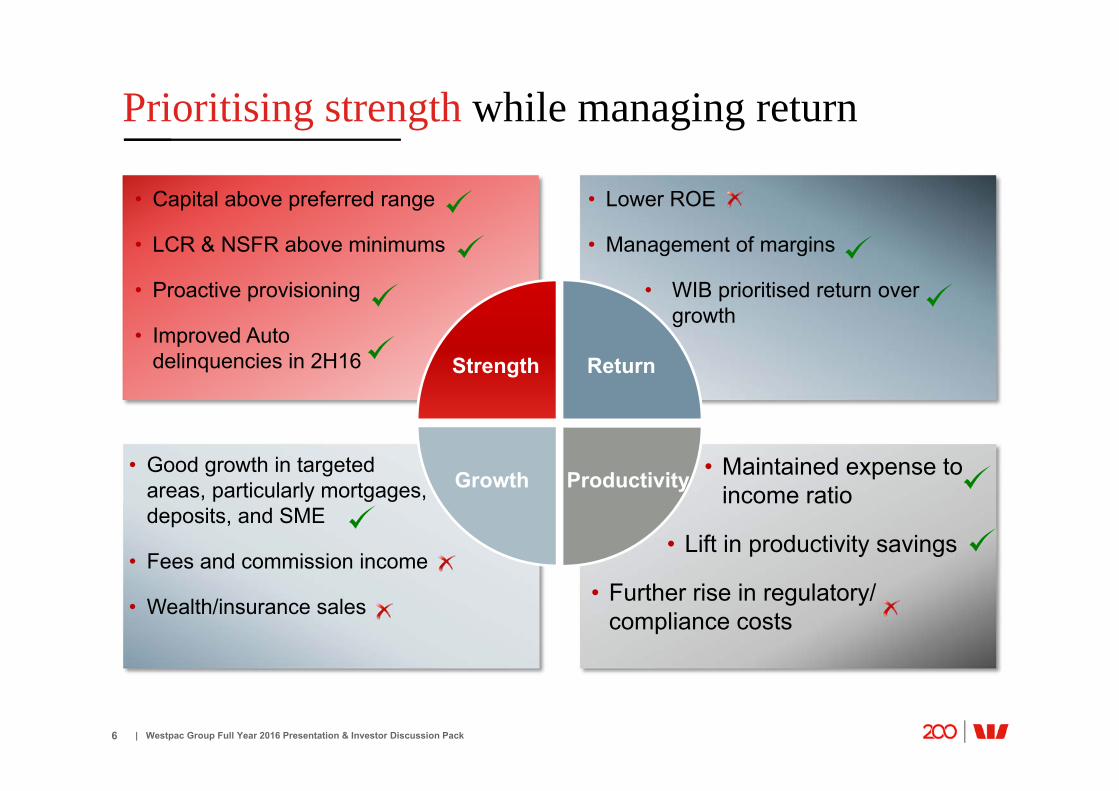
Prioritising strength while managing return
6
• Capital above preferred range
• LCR & NSFR above minimums
• Proactive provisioning
• Improved Auto delinquencies in 2H16 Strength Return
ProductivityGrowth • Maintained expense to income ratio
• Lift in productivity savings
• Further rise in regulatory/compliance costs
• Good growth in targeted areas, particularly mortgages, deposits, and SME
• Fees and commission income
• Wealth/insurance sales
• Lower ROE
• Management of margins
• WIB prioritised return over growth

| Westpac Group Full Year 2016 Presentation & Investor Discussion Pack
Continued focus on productivity
7
219 239
263
FY14 FY15 FY16
1 Digital sales as % of total sales 22% in 2H16.
• Upgraded St.George Hogan to Celeriti
• Customer Service Hub underway
• Key modules of Panorama launched and delivering
• 7 of top 10 manual activities digitised
• New online business banking in St.George
• Extended online origination via LOLA
• Digital sales as a % of total sales 22%
• CashNav (money management app) launched in NZ
Annual productivity savings ($m)
Re-platforming
• Maintained positive jaws• Increased productivity savings to
$263m• Continued to invest in service strategy
Dealing with the current environment Building for the futureDigitising the business
1

| Westpac Group Full Year 2016 Presentation & Investor Discussion Pack
Growing the retail franchise
8
New Zealand • Customer numbers up 1%• Lending up 9%3
• Deposits up 11%3
Business Bank• Customer numbers up 5%• SME lending up 8%• Deposits up 9%
Consumer Bank• Customer numbers up 3%• Lending up 8% • Deposits up 7%
1 New Zealand reported in A$. In NZ$ cash earnings for FY14 NZ$864m, FY15 NZ$905m and FY16 NZ$872m. 2 Reflects changes from FY15. 3 Growth in NZ$
Cash earnings1 ($m) Expanding the franchise2
FY14 FY15 FY16
New Zealand
Business Bank
Consumer Bank
5,0525,440
5,792
1

| Westpac Group Full Year 2016 Presentation & Investor Discussion Pack
Consumer Bank consistently delivering
9
Revenue ($m) Expense to income ratio (%)
Core earnings ($m) Cash earnings ($m)
3,560 3,776
3,970 4,051
1H15 2H15 1H16 2H16
2,0252,198
2,333 2,418
1H15 2H15 1H16 2H16
43.141.8 41.2
40.3
1H15 2H15 1H16 2H16
1,240
1,3801,444
1,537
1H15 2H15 1H16 2H16

| Westpac Group Full Year 2016 Presentation & Investor Discussion Pack
Tougher conditions impact Wealth and WIB
10
1 TCE is total committed exposure.
WIB Cash earnings ($m) BTFG Cash earnings ($m)
Movement FY16 – FY15FUM (spot) 5%
FUA (spot) 7%
Life in-force premiums 9%
General insurance gross written premiums 2%
Private wealth cash earnings growth 24%
Life insurance claims ratio +269bps
Movement FY16 – FY15Lending (3%)
Deposits 10%
Markets customer income (2%)
Margin YoY (7bps)
Margin HoH +4bps
Impaired assets to TCE1 +19bps
469 536 520
333291 309
FY14 FY15 FY16
Funds management (Excl BTIM) Insurance
1,519 1,343
1,098
FY14 FY15 FY16

| Westpac Group Full Year 2016 Presentation & Investor Discussion Pack
Seeking to achieve ROE in the range of 13-14%
11
5 7 9
11 13 15 17 19 21 23
2000
2001
2002
2003
2004
2005
2006
2007
2008
2009
2010
2011
2012
2013
2014
2015
2016
1 Average interest-earning assets. 2 Equity is average ordinary equity.
ROE considerations
• ROE has structurally fallen since GFC– Decline in interest rates– Lower margins– Increased regulatory capital
• Healthy ROE is required to attract investment and support the economy through the cycle
• Seeking to achieve a ROE in the range of 13-14% in the medium term
Cash return on equity (%)
Pre GFC average Post GFC average
DuPont analysis 2006 2011 2016 Comments
Return on AIEA1 1.23% 1.15% 1.08% • Lower margins and fee income
Leverage (AIEA/equity2) 18.8x 13.9x 12.9x • More capital
Return on equity 23% 16% 14%

| Westpac Group Full Year 2016 Presentation & Investor Discussion Pack
Dividends
12
1 Growth in RWA before changes in calculation of mortgage RWA. 2 Effective payout ratio assumes 2H16 DRP participation of 10.0%.
Dividend considerations in 2H16
Dividend payout ratio (%)
• Strong capital position; comfortably above preferred range
• Modest RWA growth1
• Sustainability of the payout ratio over the long term
• Surplus franking credits
78 76 76 77 74 74 77 74 80 80
63 6076 77 74
6549
6472 72
1H12 2H12 1H13 2H13 1H14 2H14 1H15 2H15 1H16 2H16
Payout ratio (cash earnings basis)Effective payout ratio (after DRP)
82 84 86 88 90 92 93 94 94 94
10 10
1H12 2H12 1H13 2H13 1H14 2H14 1H15 2H15 1H16 2H16
Dividends (cents per share)
Special dividends
2

| Westpac Group Full Year 2016 Presentation & Investor Discussion Pack
Sustainably increasing the value of the franchise
13
More customers;deeper
relationships
Improvingefficiency
No compromises
on risk
• Customer numbers up 2% in FY16• Deepening relationships• Customer complaints down 31%; more to do on
customer satisfaction
• Targeting a sub 40% expense to income ratio• Significant progress on digitising the company• Major steps in re-platforming technology
• Balance sheet stronger across all dimensions• Asset quality in good shape; proactive provisioning• Simplifying business; focussed on relationship
customers

| Westpac Group Full Year 2016 Presentation & Investor Discussion Pack
Expectations for operating environment
14
• Australian outlook remains positive; transition to a more innovative services-based economy is continuing
• Signs of housing market moderating although underlying demand remains
• Some uncertainty in global markets, particularly Europe (including the UK) and China, likely to continue
• Westpac is well positioned to manage to the environment while delivering on our strategy
Westpac Banking Corporation ABN 33 007 457 141.
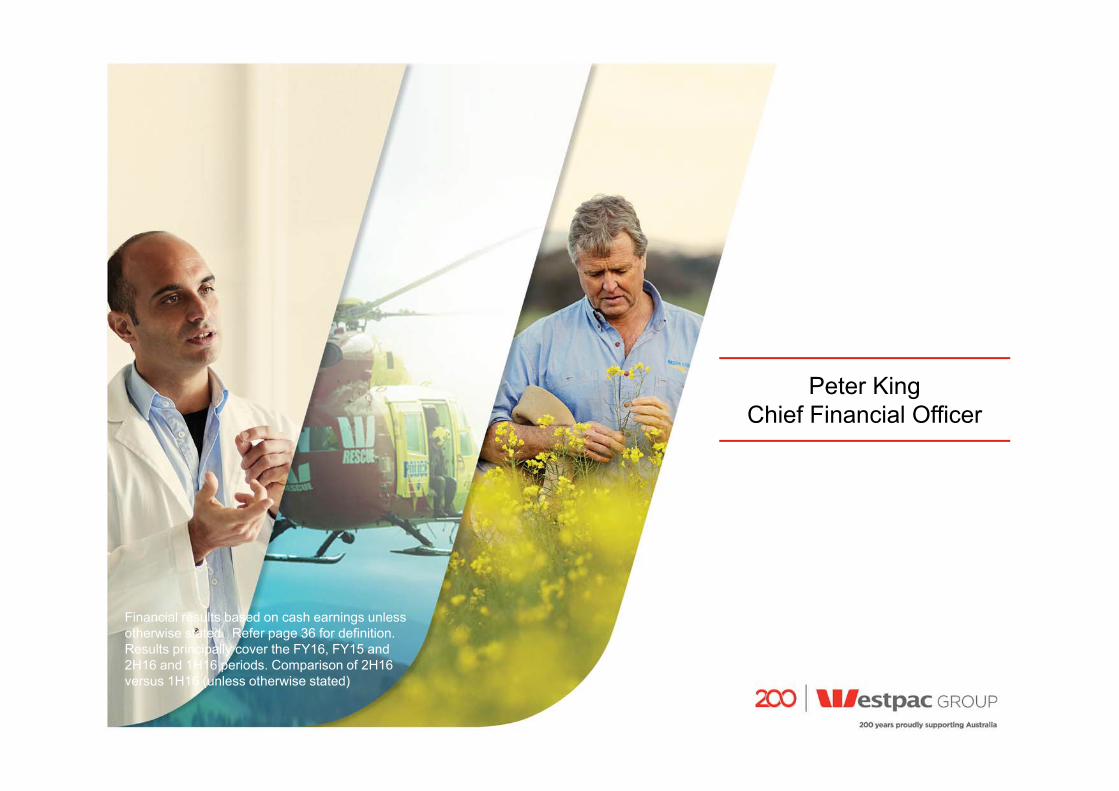
Peter KingChief Financial Officer
Financial results based on cash earnings unless otherwise stated. Refer page 36 for definition. Results principally cover the FY16, FY15 and 2H16 and 1H16 periods. Comparison of 2H16 versus 1H16 (unless otherwise stated)

| Westpac Group Full Year 2016 Presentation & Investor Discussion Pack
Results at a glance
16
1 CVA is credit valuation adjustment.
Infrequent/volatile items ($m)
Cash earnings impact 2H15 1H16 2H16
Asset sales 64 0 (4)
Performance fees 25 0 22
Group CVA1 (1) 3 3
Tax matters resolved 57 57 0
Total cash earnings impact 145 60 21
Cash earnings 2H16 – 1H16 ($m)
3,904 42 210 3,918(77) (60)(101)
1H16
Net
inte
rest
inco
me
Non
-inte
rest
inco
me
Exp
ense
s
Impa
irmen
tch
arge
s
Tax
& n
on-
cont
rollin
gin
tere
sts
2H16
$41m in additional regulatory and
compliance costs
AIEA up 2%, margins down 3bps
Trading income down 16%
Flat
No large institutional impairments this half

| Westpac Group Full Year 2016 Presentation & Investor Discussion Pack
Targeted balance sheet growth
17
1 Total Australian mortgages across all divisions. 2 Institutional bank includes Australian and offshore balance sheet
Loan/deposit growth 2H16 v 1H16 (%)
Growth3 3
(2)
6
AustralianHousing
Business Bank(Excl. Mortgages)
InstitutionalBank
Customer deposits
SME up 5%
Includes 21% fall in trade
exposures overseas
Strong deposit growth lifted customer deposit to loan ratio over 70%
1 2

| Westpac Group Full Year 2016 Presentation & Investor Discussion Pack
Margins impacted by cost of funds
18
1 Term deposit rates less equivalent term swap rate. 2 Three year swap rate average moving average which reflects a return on capital balances and other low rate deposits.
Net interest margin (NIM) (%)
Net interest margin drivers
1%
3%
5%
7%
9%
3 year swap rate (spot)Tractor
0.5%
0.7%
0.9%
1.1%
1.3%
1.5%
2.07 2.04
0.072.14 3bps (2bps) (3bps) (1bp) 0 0
1H16
Ass
ets
Cus
tom
erde
posi
ts
Term
who
lesa
lefu
ndin
g
Cap
ital &
othe
r
Liqu
idity
cost
s
Trea
sury
& m
arke
ts 2H16
Treasury & Marketsimpact on NIM
NIM excl. Treasury& Markets
NIM excl. Treasury and Markets down 3bps
0.072.11
2
Australian term deposit costs over benchmark1 Lower interest rates

| Westpac Group Full Year 2016 Presentation & Investor Discussion Pack
Non-interest income
19
1 New Zealand in A$. 2 Other includes Group Businesses.
Non-interest income by division ($m) Markets income, long term view ($m)
Non-interest income growth in 2H16 (%)
2,966
2,889
18 6
12
(18) (94)
(1)
1H16 CB
BB
BTF
G
WIB NZ
Oth
er
2H16
54%45%
53%
46%55%
47%
1,082 1,047
1,155
FY14 FY15 FY16
2H1H
Consumer Bank 4
Business Bank 1
BTFG (2)
WIB (12)
New Zealand (in NZ$) (2)
1 2

| Westpac Group Full Year 2016 Presentation & Investor Discussion Pack
Consumer Bank 0
Business Bank 0
BTFG 5
WIB 1
New Zealand (in NZ$) 1
Group Businesses 4
20
Expense growth in 2H16 (%)
Productivity benefits ($m)
Expenses include a rise in regulatory & compliance costs
Expense movement ($m)
4,419 4,438
4,479 99
67
41(147)
1H16
Ong
oing
exp
ense
s
Pro
duct
ivity
Inve
stm
ents
2H16
pre
-re
g/co
mpl
ianc
e
Add
ition
alre
g/co
mpl
ianc
e
2H16
0.4% 1.0%
Productivity accelerated in 2H16 $263m for year
1.4%
219 239 263
FY14 FY15 FY16

| Westpac Group Full Year 2016 Presentation & Investor Discussion Pack
Drivers of investment spend
21
Investment spendingInvestment spend ($m)
Capitalised software ($bn)
FY15 FY16
2H
1H
1,025
43%
1,227 • FY16 spend $1.23bn, skewed to 2H16
• Per cent expensed increased from change in accounting approach
– 42% in FY16 – 37% in FY1557%
45%
55%
1.65 1.78
0.55 0.57
FY15 FY16
Balance
Annualamortisation3.8 2.9
Average amortisation period (years)

| Westpac Group Full Year 2016 Presentation & Investor Discussion Pack
1.30
3.09 3.20
2.482.17
1.60
1.240.99
1.20
Sep
-08
Sep
-09
Sep
-10
Sep
-11
Sep
-12
Sep
-13
Sep
-14
Sep
-15
Sep
-16
Watchlist & substandard
90+ days past due and not impaired
Impaired
Asset quality remains sound
22
1 TCE is total committed exposure.
Stressed exposure by sector/industry ($bn)Stressed exposures as a % of TCE1
0.0
0.5
1.0
1.5
2.0
2.5
3.0
3.5
Con
sum
er
Agri,
fore
stry
& fi
shin
g
W's
ale
& re
tail
trade
Busi
ness
ser
vice
s
Man
ufac
turin
g
Pro
perty
Ser
vice
s in
dust
ries
Tran
spor
t & s
tora
ge
Con
stru
ctio
n
Min
ing
Acco
m'ti
on &
rest
aura
nts
Fina
nce
& in
sura
nce
Oth
er
Util
ities
Sep-15 Mar-16 Sep-16

| Westpac Group Full Year 2016 Presentation & Investor Discussion Pack
Asset quality – commercial property
23
1 There are no completions currently in the portfolio for 2019.
Residential development portfolio >$20m
LVRs of residential apartment development portfolio >$20m, by completion date (%)
Commercial property (%)
Mortgages for inner city apartments
Loans $13.0bn
Average LVR at origination 69%
Average dynamic LVR 54%
Dynamic LVR >90% 2.9%
90+ day delinquencies 30bps
58.0 55.1 49.9 45.0
2016 2017 2018 2020
Lending for residential apartmentdevelopment >$20m (“high rise”) $5.1bn
Weighted average LVR 54%
Estimated market share 14%
Exposure to Sydney major markets, Perth metro, Inner Brisbane, Inner Melbourne $3.2bn
Average 54%
-
5
10
15
20
- 2 4 6 8
10
Sep
-09
Sep
-10
Sep
-11
Sep
-12
Sep
-13
Sep
-14
Sep
-15
Sep
-16
% of TCE (lhs) % of TCE in stress (rhs)
Year of completion
1

| Westpac Group Full Year 2016 Presentation & Investor Discussion Pack
Asset quality –consumer delinquencies and NZ dairy
24
1 RBNZ Agricultural market share. 2 Includes impaired.
Aust. mortgage 90+ day delinquencies (%)
Aust. other personal 90+ day delinquencies (%)
NZ dairy portfolio
Sept-15 Sept-16
Market share1 (%) 12.3 13.0
NZ dairy TCE (NZ$bn) 5.6 5.9
% of NZ dairy stressed2 4.74 25.29
% of NZ dairy impaired 0.13 0.340.0
0.5
1.0
1.5
Sep-13 Sep-14 Sep-15 Sep-16
NSW/ACT VIC/TAS QLDWA SA/NT ALL
0.85
1.82
1.170.91
0.0
0.5
1.0
1.5
2.0
2.5
Sep-13 Sep-14 Sep-15 Sep-16
Credit cards Personal (excl. auto)Total unsecured Auto
Prudent management of NZ dairy
• Built dairy economic overlay since 2014• Comprehensive file review using milk
price of NZ$4.25• Stressed assets increased $647m in 4Q16• Impaired 0.34% (up from 0.13% at Mar-16)• In September 2016, Fonterra lifted milk price
forecast to NZ$5.25 (from NZ$4.25)
0.66
0.450.470.53

| Westpac Group Full Year 2016 Presentation & Investor Discussion Pack
Impairment charge reflects sound asset quality
25
Impairment charge components ($m)
New IAPs Write-backs& recoveries
Write-offs direct
Other movements in collective provisions
TotalIndividually assessed provisions (IAP) Collectively assessed provisions
293 273
471
256
(218)(210)(174)(173)
330
463 418484
(64)(114)
(48)(110)
341412
667
457
1H15
2H15
1H16
2H16
1H15
2H15
1H16
2H16
1H15
2H15
1H16
2H16
1H15
2H15
1H16
2H16
1H15
2H15
1H16
2H16
$298m increase from larger names

| Westpac Group Full Year 2016 Presentation & Investor Discussion Pack
CET1 capital ratio above preferred range
26
theetete
1. APRA’s revision to the calculation of RWA for Australian residential mortgages, which came into effect on 1 July 2016. 2 Internationally comparable methodology aligns with the APRA study titled ‘International Capital Comparison Study’ dated 13 July 2015.
CET1 capital ratio (% and bps)
9.50 196 10.47 96
14 9.48
14.43
(110) (69)(6) (6) (12) (6)
Sep
-15
AP
RA
Oth
erm
ovem
ents
Ent
itlem
ent
offe
r
Mar
-16
AP
RA
Mor
tgag
e R
WA
chan
ges
Cas
h ea
rnin
gs
Inte
rimdi
vide
nd(n
et o
f DR
P)
Ord
inar
yR
WA
grow
th
Oth
erm
ovem
ents
RW
A e
ffici
ency
inita
itive
s
Reg
ulat
ory
mod
ellin
gch
ange
s
FX -
Cre
dit
RW
A
Sep
-16
AP
RA
Sep
-16
Int.
Com
p.
Loan growth largely offset by lower interest rate risk in the banking book and
market risk RWA
Includes 9bps for credit spread risk in the liquids portfolio
1
2
Data improvements, lower unutilised limits,
lower exposures
(14bps)
Organic 15bps Other (4bps)
| Westpac Group Full Year 2016 Presentation & Investor Discussion Pack 27
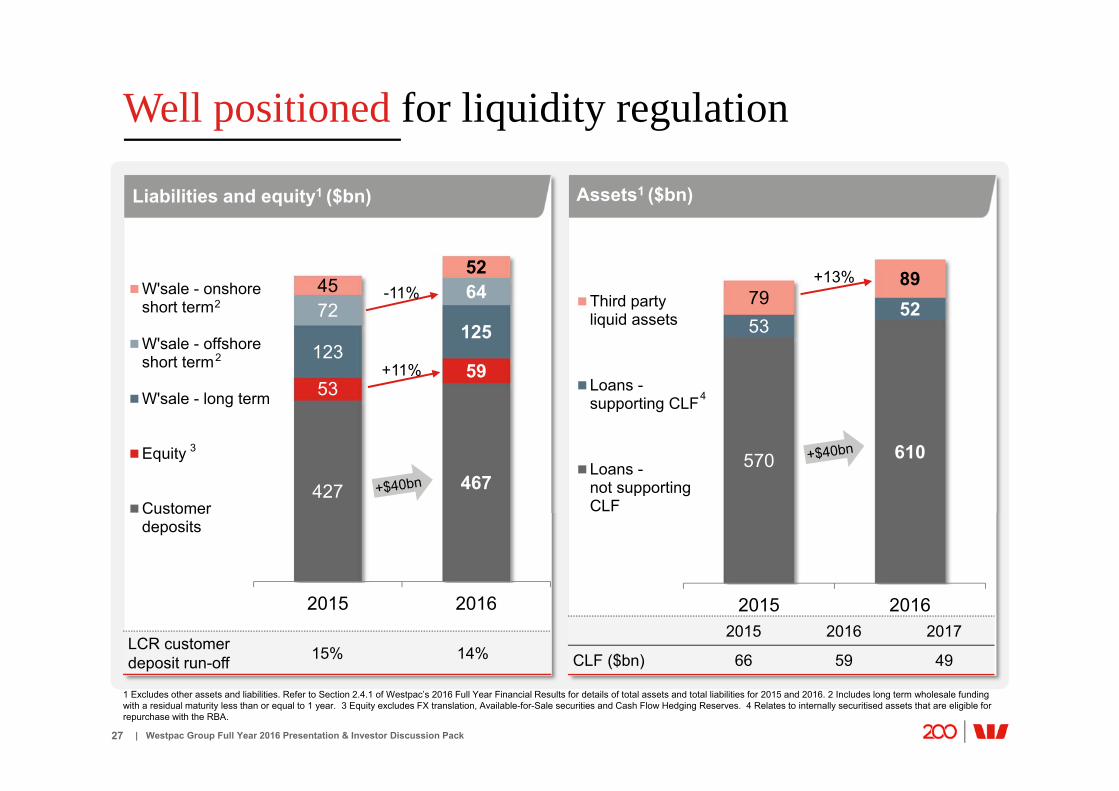
1 Excludes other assets and liabilities. Refer to Section 2.4.1 of Westpac’s 2016 Full Year Financial Results for details of total assets and total liabilities for 2015 and 2016. 2 Includes long term wholesale funding with a residual maturity less than or equal to 1 year. 3 Equity excludes FX translation, Available-for-Sale securities and Cash Flow Hedging Reserves. 4 Relates to internally securitised assets that are eligible for repurchase with the RBA.
Liabilities and equity1 ($bn) Assets1 ($bn)
Well positioned for liquidity regulation
427 467
5359
123125
72644552
2015 2016
W'sale - onshoreshort term
W'sale - offshoreshort term
W'sale - long term
Equity
Customerdeposits
570 610
53527989
2015 2016
Third partyliquid assets
Loans -supporting CLF
Loans -not supportingCLF
-11%
+11%2
2
3
LCR customer deposit run-off 15% 14%
2015 2016 2017
CLF ($bn) 66 59 49
4
+13%

| Westpac Group Full Year 2016 Presentation & Investor Discussion Pack
Considerations for FY17
• Continued discipline on growth/return
• New liquidity rules see tighter link between loan and deposit growth
• Active margin management required given competition and higher funding costs
• Target expense growth at bottom end of 2-3% range
• Productivity gains similar to FY16
• Asset quality expected to remain sound
• Continue to invest to support franchise growth and productivity
28

Westpac Banking Corporation ABN 33 007 457 141.
Financial results based on cash earnings unless otherwise stated. Refer page 36 for definition. Results principally cover the FY16 and FY15 years, including 2H16 and 1H16. Comparison of 2H16 versus 1H16 (unless otherwise stated)
Investor Discussion Pack

Westpac Banking Corporation ABN 33 007 457 141.
Strategy
Financial results based on cash earnings unless otherwise stated. Refer page 36 for definition. Results principally cover the FY16 and FY15 years, including 2H16 and 1H16. Comparison of 2H16 versus 1H16 (unless otherwise stated)

| Westpac Group Full Year 2016 Presentation & Investor Discussion Pack
Institutional Bank
Westpac New Zealand
Consumer Bank
Westpac Group at a glance: Australia’s First Bank
31
1 30 September 2016. Source: S&P Capital IQ, based in US Dollars. 2 S&P Global Ratings, Moody’s Investors Service and Fitch Ratings respectively. S&P Global Ratings and Moody’s Investors Services have Westpac on a negative outlook, Fitch Ratings has Westpac on a stable outlook. 3 Credit Suisse analysis of expense to income ratio of world’s largest banks September 2016. 4 Included in 2016 Global 100 most sustainable companies, announced at World Economic Forum in January 2016. 5 APRA Banking Statistics, September 2016. 6 RBA Financial Aggregates, September 2016. 7 RBNZ, September 2016. 8 Strategic Insight, June 2016, All Master Funds Admin. 9 Cash earnings basis. 10 Based on share price as at 30 September 2016, $29.51.
Customers 13.4m
Australian household deposit market share5 23%
Australian mortgage market share6 23%
Australian business market share6 19%
New Zealand deposit market share7 20%
New Zealand consumer lending market share7 20%
Australian wealth platforms market share8 19%
• Australia’s first bank and first company, opened in 1817• Australia’s 2nd largest bank and 13th largest bank in the world, ranked by
market capitalisation1
• Well positioned across key markets with a service-led strategy focused on customers and differentiated through service
• Supporting consumers and businesses in Australia and New Zealand and customers with ties to these markets
• Unique portfolio of brands providing a full range of financial services including consumer, business and institutional banking, wealth management and insurance
• Strong capital, funding, liquidity, with sound asset quality• Credit ratings AA- / Aa2 / AA-3
• One of the most efficient banks globally2
• Consistent earnings profile over time• Leader in sustainability4
Reported net profit after tax $7,445m
Cash earnings $7,822m
Expense to income ratio9 42.0%
Common equity Tier 1 capital ratio (APRA basis) 9.5%
Return on equity9 14.0%
Total assets $839bn
Market capitalisation10 $99bn
Key statistics as at 30 Sep 2016 Key financial data for FY16 (30 Sep 2016)
Business Bank
BT Financial Group
WBClisted on
ASX & NZX
Pacific
STRATEGY

| Westpac Group Full Year 2016 Presentation & Investor Discussion Pack
To be one of the world’s great service companies, helping our customers, communities and people to prosper and grow
Delivering on our five strategic priorities
32
Service Leadership
Digital Transformation
PerformanceDiscipline
TargetedGrowth
WorkforceRevolution
Stra
tegi
c Pr
iorit
ies
Mea
sure
s Seeking13% - 14%
ROE (medium-term)
+1m customers (2015-2017)
Cost growth 2-3% per annum and expense to
income ratio below 40%
Stronger growth in wealth and SME
Employee engagement in top performing norms,
women in leadership
50% by end of 2017
Prog
ress
in
FY16 ROE
14.0%
13.4m customers Up 2%
Sep16 – Sep15
Digitised 7of the10 top manual
transactions, $263m productivity
benefits, and expense to income
ratio 42%
SME business loan growth of 8%
and FUM/FUA growth of 9% and 7% respectively
Employee engagement
69%Women in leadership
48%
STRATEGY
Visi
on

| Westpac Group Full Year 2016 Presentation & Investor Discussion Pack
Sources of comparative advantage
33
Sector leading balance sheet
Global efficiency leader• Expense to income ratio at lower end of global peers and
below average of Australian major banks at 42.0%
• Only major Australian bank with a target of reducing expense to income ratio below 40%
• Productivity focus has delivered $1.8bn of savings FY09 to FY16
• Asset quality− Sector leading through global financial crisis − Sound quality; balance sheet skewed to mortgages− Low impaired assets; well provisioned at 49%1
• Capital− CET1 capital ratio in top quartile of international peers
• Liquidity− 85% of funding from stable sources− High liquidity levels; LCR of 134%
• Seeking to differentiate on service• No. 1 or 2 position across key markets - all divisions well
placed• Unique portfolio of brands, reaching a broader customer set • Comparative advantage in wealth platforms• Actively embracing digital opportunities with leading online
and mobile capability• Underweight mining sector, NZ dairy and Western Australia
Excellent strategic position
Sustainability culture• Australia’s first bank and company, approaching 200 year
anniversary in 2017
• Global banking leader in Dow Jones Sustainability Index since 2002, named sector leader 9 times, including 2014, 2015 and 2016
• Ranked as one of the Global 100 most sustainable corporations in the world by Corporate Knights for 10 of the last 11 years
• Only major Australian bank SEC registered and listed on NYSE
1 Gross impaired asset provisions to gross impaired loans.
STRATEGY

| Westpac Group Full Year 2016 Presentation & Investor Discussion Pack
Consistent performer over the long term
34
1 Refer slide 89 for details of internationally comparable CET1 capital ratio.
Cash earnings ($bn) Cash earnings per share (cents)
Common equity Tier 1 capital ratio (%)3.1
3.5
5.04.7
5.96.3
6.67.1
7.6 7.8 7.8
7.4 8.2 9.1 9.0 9.5 9.5
14.4
Sep-11 Sep-12 Sep-13 Sep-14 Sep-15 Sep-16 Int.comparable
167.2189.4 198.3
163.7197.8 209.3 214.8 227.8
245.4 248.2 235.5
1
STRATEGY

Westpac Banking Corporation ABN 33 007 457 141.
Overview
Financial results based on cash earnings unless otherwise stated. Refer page 36 for definition. Results principally cover the FY16 and FY15 years, including 2H16 and 1H16. Comparison of 2H16 versus 1H16 (unless otherwise stated)

| Westpac Group Full Year 2016 Presentation & Investor Discussion Pack
Cash earnings and reported net profit reconciliation
36
FY16($m)
% change FY16-FY15
% change 2H16-1H16
Cash earnings 7,822 - -
Cash EPS (cents) 235.5 (5) (1)
Reported net profit 7,445 (7) 1
• Westpac Group uses a measure of performance referred to as cash earnings to assess financial performance at both a Group and divisional level
• This measure has been used in the Australian banking market for well over a decade and management believes it is the most effective way to assess performance for the current period against prior periods and to compare performance across divisions and across peer companies
• To calculate cash earnings, reported net profit is adjusted for:– Material items that key decision makers at the Westpac Group believe do not reflect ongoing
operations (both positive and negative)– Items that are not considered when dividends are recommended, such as the amortisation of
intangibles, impact of Treasury shares and economic hedging impacts– Accounting reclassifications between individual line items that do not impact reported results
1 Cash earnings is not a measure of cash flow or net profit determined on a cash accounting basis, as it includes non-cash items reflected in net profit determined in accordance with AAS (Australian Accounting Standards). The specific adjustments outlined include both cash and non-cash items. Cash earnings is reported net profit adjusted for material items to ensure they appropriately reflect profits available to ordinary shareholders. All adjustments shown are after tax. For further details refer to slide 127.
Cash earnings1 policy Reported net profit and cash earnings1
adjustments ($m)
Reported profit and cash earnings ($bn)
7.0
5.9
6.8
7.68.0
7.4
6.36.6
7.1
7.6 7.8 7.8
FY11 FY12 FY13 FY14 FY15 FY16
Reported profit Cash earnings
RESULTS
FY15 FY16
Reported net profit 8,012 7,445
Partial sale of BTIM (665) -
Capitalised technology cost balances 354 -
Amortisation of intangible assets 149 158
Acquisition transaction and integration expenses 66 15
Lloyds tax adjustments (64) -
Fair value (gain)/loss on economic hedges (33) 203
Ineffective hedges 1 (9)
Treasury shares 1 10
Buyback of government guaranteed debt (1) -
Cash earnings 7,820 7,822

| Westpac Group Full Year 2016 Presentation & Investor Discussion Pack
FY16 financial snapshot
37
1 All measures on a cash earnings basis. 2 Internationally comparable methodology aligns with the APRA study titled ‘International Capital Comparison Study’ of 13 July 2015. 3 Total liquid assets represent cash, interbank deposits and assets eligible for existing repurchase agreements with a central bank
FY16Change
FY16 – FY15Change
2H16 – 1H16
Earnings1
Earnings per share (cents) 235.5 (5%) (1%)
Core earnings ($m) 12,305 3% (2%)
Cash earnings ($m) 7,822 - -
Return on equity (%) 14.0 (185bps) (31bps)
Dividend (cents per share) 188 1% -
Expense to income ratio (%) 42.0 (7bps) 71bps
Net interest margin (%) 2.13 5bps (3bps)
Asset quality
Impairment charges to average gross loans (bps) 17 5bps (7bps)
Gross impaired assets to gross loans (bps) 32 2bps (7bps)
Gross impaired asset provisions to gross impaired assets (%) 49.4 314bps 177bps
FY16Change
FY16 – FY15Change
2H16 – 1H16
Balance sheet
Total assets ($bn) 839.2 3% 1%
Common equity Tier 1 (CET1) capital ratio (APRA basis) (%) 9.5 (2bps) (99bps)
CET1 capital ratio (Internationally comparable2) (%) 14.4 123bps (24bps)
CET1 capital ($bn) 38.9 14% 2%
Risk weighted assets ($bn) 410.1 14% 13%
Loans ($bn) 661.9 6% 3%
Customer deposits ($bn) 466.6 9% 6%
Net tangible assets per share ($) 13.96 7% 2%
Funding and Liquidity
Customer deposit to loan ratio (%) 70.5 196bps 151bps
Liquidity coverage ratio (%) 134 Large Large
Total liquid assets3 ($bn) 144 6% 4%
PERFORMANCE DISCIPLINE

| Westpac Group Full Year 2016 Presentation & Investor Discussion Pack
Cash earnings flat over the year and prior half
38
FY16 ($m)
% chgFY16-FY15
% chg2H16-1H16
Net interest income 15,348 8 1
Non-interest income 5,855 (7) (3)
Expenses 8,898 3 1
Core earnings 12,305 3 (2)
Impairment charges 1,124 49 (31)
Cash earnings 7,822 - -
Reported net profit 7,445 (7) 1
7,820
1,109
7,822
(446)(263) (371)
(27)
FY15 Net interestincome
Non-interestincome
Expenses Impairmentcharges
Tax & NCI FY16
Additional investment and higher regulatory and compliance costs
Cash earnings features of FY16 - FY15 ($m)
Cash earnings features of 2H16 - 1H16 ($m)
3,904 42 210 3,918(77) (60) (101)
1H16 Net interestincome
Non-interestincome
Expenses Impairmentcharges
Tax & NCI 2H16
Flat
Flat
AIEA up 6%, margins up
5pbs
$280m partial sale and deconsolidation of BTIM; $102m lower asset sales; lower cards income and
debt origination fees
AIEA up 2%, margins down
3bps
Lower trading income, higher insurance claims
paid
Increased provisions from small number of large names, higher
delinquencies and NZ dairy stress
Absence of large single names versus 1H16
PERFORMANCE DISCIPLINE
Additional investment and higher regulatory and
compliance costs
1H16 benefitted from finalisation of
prior period tax matters

| Westpac Group Full Year 2016 Presentation & Investor Discussion Pack
Consumer Bank and Business Bank the main contributors
39
1 Refer to division definitions, slide 128. 2 In A$. 3 Other is Group Businesses (including Treasury).
7,820361 20
7,822(38) (245) (29) (67)
FY15 CB
BB
BTFG
WIB NZ
Oth
er
FY16
FY16 divisional1 cash earnings movements ($m)
11,905 12,305 528 163 (105) (146) (20) (20)
FY15 CB
BB
BTFG
WIB NZ
Oth
er
FY16
FY16 divisional1 core earnings movements ($m)
FY16 ($m) CB BB BTFG WIB NZ2 Other3 Group
Operating income 8,021 5,063 2,406 3,098 2,037 578 21,203
Expenses (3,270) (1,796) (1,160) (1,347) (856) (469) (8,898)
Core earnings 4,751 3,267 1,246 1,751 1,181 109 12,305
Impairment (charges) / benefits (492) (410) - (177) (54) 9 (1,124)
Tax & non-controlling interests (1,278) (858) (370) (476) (315) (62) (3,359)
Cash earnings 2,981 1,999 876 1,098 812 56 7,822
% of Group cash earnings 38 26 11 14 10 1
Up 3%Flat
3 32 2
PERFORMANCE DISCIPLINE

| Westpac Group Full Year 2016 Presentation & Investor Discussion Pack
80
72
Payout ratioEffective payout ratio (after DRP)
Dividends
40
1 Effective payout ratio assumes 2H16 DRP participation of 10.0%. 2 Data using half year dividends and share price as at 31 March and 30 September in each period. 3 On cash earnings basis.
• Strong capital position; comfortably above preferred range
• Modest RWA growth
• Sustainability of the payout ratio over the long term
• Surplus franking credits
Dividends (cents per share)Key dividend considerations for 2H16
2H16 dividend Westpac dividend yield2 (%) Ordinary dividend payout ratio3 (%)
Special dividends
84 86 88 90 92 93 94 94 94
10 10
2H12 1H13 2H13 1H14 2H14 1H15 2H15 1H16 2H16
5.74.7
6.3 6.2 6.4
8.26.8
9.0 8.8 9.1
2H14 1H15 2H15 1H16 2H16
Ordinary yield Yield after franking• 2H16 ordinary dividend of 94 cps, no change on 1H16 and 2H15
• Full year dividend of 188 cps, FY15 187 cps• Payout ratio for 2H16 of 80.3%, FY16 80.3%
– Effective payout ratio1 72%. Issuing shares to satisfy Final 2016 DRP with no discount
• 2H16 dividend yield2 6.4%, FY16 6.4%– Equivalent to a fully franked dividend
yield2 of 9.1%. FY16 9.1%
PERFORMANCE DISCIPLINE

| Westpac Group Full Year 2016 Presentation & Investor Discussion Pack
28.4
Sep-14 Sep-15 Sep-16
Building franchise value
41
1 Refer slide 131 for metric definition. 2 No peer data available for New Zealand.
Customers with a wealth product 1,2(%)Customer numbers (#’m)
SERVICE LEADERSHIP
8.49 8.61 8.74 8.88
1.45 1.48 1.52 1.56
Mar-15 Sep-15 Mar-16 Sep-16
Consumer Bank Business Bank
1.32 1.34 1.35 1.35
Mar-15 Sep-15 Mar-16 Sep-16
21.3
16.2 15.0
19.8
11.8
Sep-14 Sep-15 Sep-16
Westpac St.George brands Peers9.94 10.09 10.26 10.44Australia
New ZealandNew Zealand

| Westpac Group Full Year 2016 Presentation & Investor Discussion Pack
Building franchise value
42
1 Refer slide 131 for metric definition and details of provider.
Customer satisfaction1
Consumer and New Zealand (%), Business (mean)Customer complaints (#)
SERVICE LEADERSHIP
2H14 1H15 2H15 1H16 2H16
Australian retail (CB, BB and BT)
2H14 1H15 2H15 1H16 2H16
Down 37%
Down 22%
New Zealand retail
Con
sum
erB
usin
ess
69%
74%
72%74%
65%
Sep-14 Sep-15 Sep-16
Peers Westpac
New
Zea
land
Down 10%
Down 50%
7.27.6
7.2
6.97.2
Sep-14 Sep-15 Sep-16
Westpac St.George brands Peers
79.6%
84.8%83.4%81.3%79.7%
Sep-14 Sep-15 Sep-16
Westpac St.George brands Peers

| Westpac Group Full Year 2016 Presentation & Investor Discussion Pack
Significant momentum in our technology transformation
43
Longer-term consolidation opportunities
*
*
Assisted Unassisted
Westpac St.George BT
Common
Infrastructure
Systems of record
Customer
Channels(customer interface)
Today UnderwayOmni-channel
Westpac St.George BT St.GeorgeWestpac BT
Pano-rama
Customer Service Hub
Westpac St.George
Common
BT
1
2 3
4
1. Common IaaS (Infrastructure as a Service) foundations implemented across group.2. St. George Hogan deposit & transaction core system upgraded to Celeriti.3. Significant Panorama functionality delivered including SMSF.4. Customer Service Hub vendor selected and “steel thread” developed to prove strategy of connecting
channels and systems of record through a customer hub.
DIGITALTRANSFORMATION
DIGITALTRANSFORMATION

| Westpac Group Full Year 2016 Presentation & Investor Discussion Pack 44
• Customers can place their card on hold using online or mobile without calling a contact centre
• Launched November 2015• 168k cards locked to date • Empowers customers with the
flexibility of temporarily locking and unlocking their card
• Activate card on mobile saves customers calling a contact centre or visiting a branch
• 3k customers per week activate their card via mobile device
• St.George customers can connect through to contact centre from mobile app with no need to verity with security questions
• Saving 50-60 seconds per call (15-20% handle time)
1 LOLA is the business lending origination system. 2 Video conferencing and product capability via business connect and connect now. 3 New online platform is called NBBO.
Card on hold Activate card on mobile Banker in your pocket
Digital for bankers Digital for customers Payments
CO
NSU
MER
BA
NK
BU
SIN
ESS
BA
NK
Improving the digital customer experience: Consumer & Business Bank (7 of top 10 processes digitised)
• Extended LOLA1 to new Westpac customers and across a wider product range; $1.4bn approved since launch
• 96% increase in Connect2 lending
• 77% customers migrated to new online platform3 with NPS improved by 52 points
• Wider range of digital self service options – including term deposit roll over and new business credit cards
• 127,000 new, state-of-the-art merchant terminals rolled out
• On-boarding completed in 5 days, down from 23
• 16% increase in Merchant customer growth, 30% reduction in complaints
DIGITALTRANSFORMATION

| Westpac Group Full Year 2016 Presentation & Investor Discussion Pack
• 45% reduction in turn-around times to identify and verify new entities for Anti-Money Laundering / Know Your Customer purposes to 11 days from 20
• Launched UnionPay2 as a payment channel through QuickStream and PayWay
• Provides payments capabilities for holders of Chinese UnionPay credit cards to WIB and Business Bank customers who use QuickStream and PayWay receivables solutions
• Commercialised data analytics capability
• Delivered keystroke automation, reducing the end-to-end transaction account opening process
• Piloting LanternPay to facilitate payments through the National Disability Insurance Scheme
1 Changes since 2013. 2 UnionPay http://www.unionpayintl.com/.
Westpac One CashNav Transforming the network
Digitised customer forms UnionPay Other digital innovations
NEW
ZEA
LAN
DW
IBImproving the digital customer experience: New Zealand and WIB
45
• Market leading platform. Canstar Best Online Bank in New Zealand 2016, 2015
• Around 32% of all applications are online with over 50% of all card applications
• 736k active digital customers
• Up 8% since WestpacOnelaunched in April 2015
• Active digital customers now 54%
• Launched CashNav, the first integrated app in New Zealand to track finances and deliver spending insights
• Over 50,000 registrations to date since launched on 1 September 2016
• Further enhanced 24/7 capability
• 162 Smart ATMs now in two thirds of branches
• Half of branches have 24/7 banking lobbies
• 34% reduction in branch transactions1
• 9 (9%) branches closed1
with another 19 to close 1Q17
2016 CanstarBest Online Bank in New Zealand
DIGITALTRANSFORMATION

| Westpac Group Full Year 2016 Presentation & Investor Discussion Pack
Digital in insurance
Functionality and capability
Commercialising Panorama – a market leading wealth management platform for customers and advisers
Improving the digital customer experience: BTFGSU
PER
AN
NU
ATI
ON
& IN
SUR
AN
CE
Modular - flexible architecture to cater to different clients needs
Connectivity - connect to existing accounting software
Collaboration - collaborate with accounting partner to complete fund administration for SMSF
Compliance - embedded trading platform to assist administration
PAN
OR
AM
A
• Personalised tool enabling members to evaluate their current and future financial situation
• Accessible to members across Australia
Wealth review
• Launched BT Super Profile • Supports customers by providing 7
key actions to get their super “sorted”• Customers are given a score out of
100%, and a list of actions to complete their profile
Super profile
• An innovative solution helping reunite customers with their lost super
• Westpac Live customers can search and see all their super savings in less than 60 seconds
• Customers can choose to open a BT Super for Life account and combine their super savings
SuperCheck
46
• Policy display – customers can see their home and contents insurance policies in their Online Banking
• Single sign-on and pre-population of customer details into online Home & Contents quotes
• 2,764 registered Advisers now on Panorama
• Full Westpac live integration
• Over 2,000 SMSF accounts –growing momentum in activity
• Advised Investment Platform and Direct Investor offers now complete
• SMSF offer - a complete end to end offer for all customers including trustees, advisers and accountants
DIGITALTRANSFORMATION

| Westpac Group Full Year 2016 Presentation & Investor Discussion Pack
Examples of digitisation improving service and efficiency for contact centres
47
1 Connect, the ability to connect with a contact centre via mobile banking for the St George brand, was launched in April 2016. 2 Card lock/unlock launched November 2015. 3 NPS score based on post-call customer survey captured through internal systems of NICE (Westpac) and Qfinity (SGB).
Contact centre average call times1 (seconds) Card lock/unlock calls2 (#)
Contact centre complaints (#) NPS3 contact centre
2,1362,394
1,7391,448
1H15 2H15 1H16 2H16
66 6667 68
1H15 2H15 1H16 2H16
378
319
Standard call Call via mobile bankinglink
284,883
238,380
100000120000140000160000180000200000220000240000260000280000300000
Pre digitisation Post digitisation
Saving an average of 150 hours per month since launch1
Saving around 388 hours per month since launch2
DIGITALTRANSFORMATION
| Westpac Group Full Year 2016 Presentation & Investor Discussion Pack
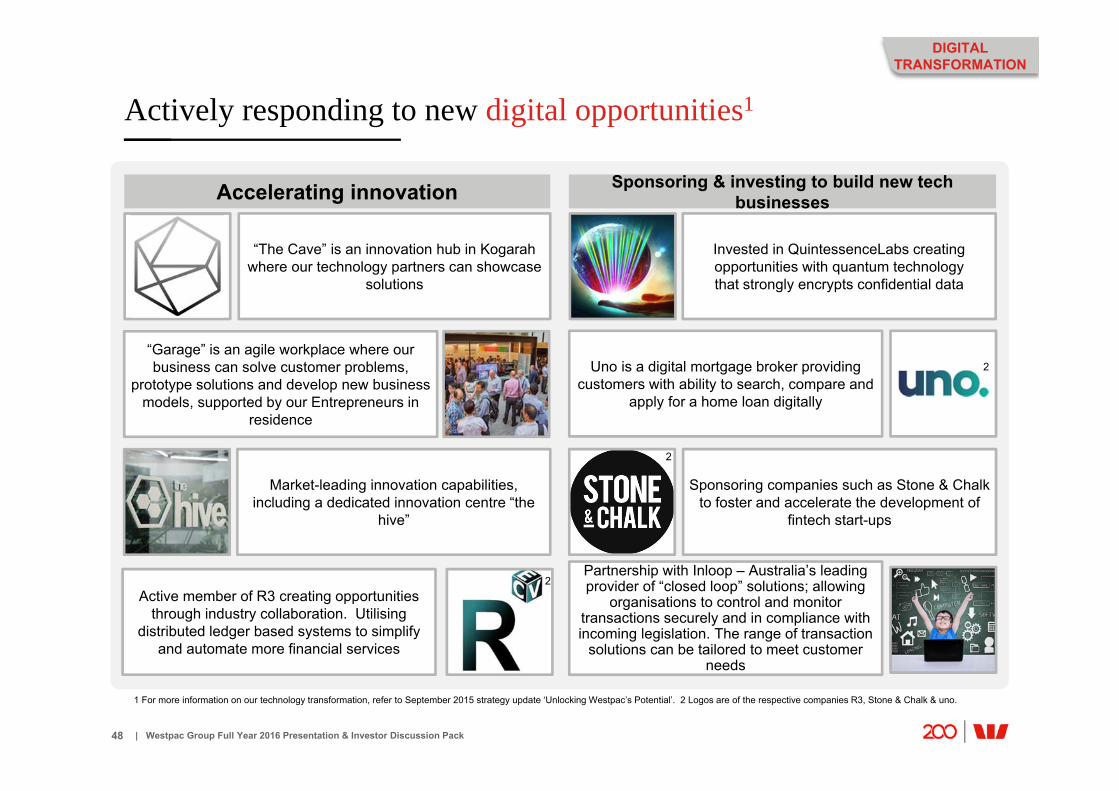
Invested in QuintessenceLabs creating opportunities with quantum technology that strongly encrypts confidential data
Uno is a digital mortgage broker providing customers with ability to search, compare and
apply for a home loan digitally
Sponsoring companies such as Stone & Chalk to foster and accelerate the development of
fintech start-ups
Partnership with Inloop – Australia’s leading provider of “closed loop” solutions; allowing
organisations to control and monitor transactions securely and in compliance with incoming legislation. The range of transaction
solutions can be tailored to meet customer needs
“The Cave” is an innovation hub in Kogarah where our technology partners can showcase
solutions
“Garage” is an agile workplace where our business can solve customer problems,
prototype solutions and develop new business models, supported by our Entrepreneurs in
residence
Market-leading innovation capabilities, including a dedicated innovation centre “the
hive”
Actively responding to new digital opportunities1
48
1 For more information on our technology transformation, refer to September 2015 strategy update ‘Unlocking Westpac’s Potential’. 2 Logos are of the respective companies R3, Stone & Chalk & uno.
Accelerating innovation Sponsoring & investing to build new tech businesses
Active member of R3 creating opportunities through industry collaboration. Utilising
distributed ledger based systems to simplify and automate more financial services
2
2
2
DIGITALTRANSFORMATION

| Westpac Group Full Year 2016 Presentation & Investor Discussion Pack
Reinventure – Investing in new technology businesses
49
Westpac has committed $100m to Reinventure, an independently run venture capital fund. The operation allows Westpac to gain insights into emerging fintech business models,
adjacent business opportunities and entrepreneurial ways to execute at speed
A peer-to-peer lending platform reducing the cost of originating and managing consumer loans, sharing its operating cost advantage with
both borrowers and investors to get a better deal
Via data, sheds light on high volume crimes, improving prevention and detection
A bitcoin wallet and platform where merchants and
consumers can transact the digital currency, bitcoin
A trust framework and secure platform that allows users to exchange data safely and
securely
An app to revolutionise the payment process for customers when dining out or grabbing a
coffee on the go
A social media platform for local communities. Nabo differentiates
itself by helping residents develop real online geographical
communities (by suburbs)
A one-stop payments platform that helps marketplaces,
merchants and their customers transact simply and securely
online
A global Big Data, business intelligence and enterprise data
warehousing company
A free, all-in-one HR and benefits platform that manages on-boarding and compliance
and lets HR professionals focus on value added tasks
A business loan marketplace that matches SMEs to the best
lender based on their characteristics and needs
A platform to help home sellers find and compare real estate
agents
DIGITALTRANSFORMATION
| Westpac Group Full Year 2016 Presentation & Investor Discussion Pack
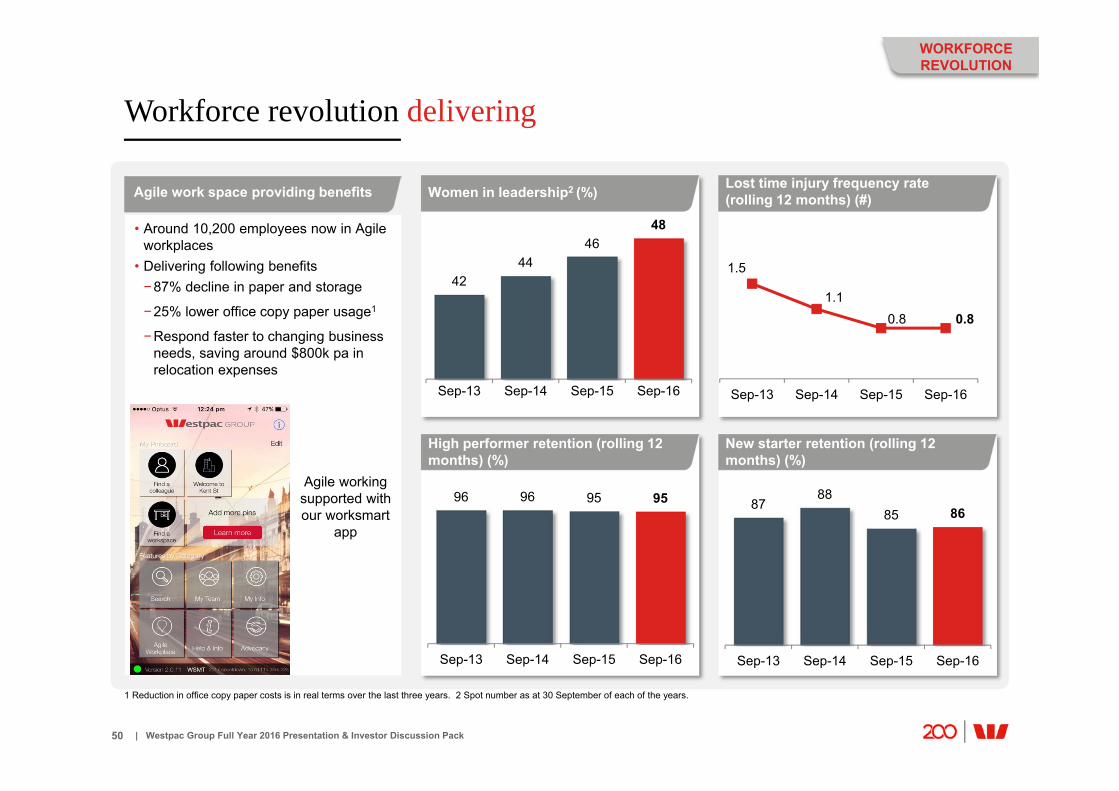
Workforce revolution delivering
50
Lost time injury frequency rate (rolling 12 months) (#)Women in leadership2 (%)
New starter retention (rolling 12 months) (%)
High performer retention (rolling 12 months) (%)
1 Reduction in office copy paper costs is in real terms over the last three years. 2 Spot number as at 30 September of each of the years.
WORKFORCE REVOLUTION
4244
4648
Sep-13 Sep-14 Sep-15 Sep-16
1.5
1.10.8 0.8
Sep-13 Sep-14 Sep-15 Sep-16
96 96 95 95
Sep-13 Sep-14 Sep-15 Sep-16
8788
85 86
Sep-13 Sep-14 Sep-15 Sep-16
• Around 10,200 employees now in Agile workplaces
• Delivering following benefits−87% decline in paper and storage
−25% lower office copy paper usage1
−Respond faster to changing business needs, saving around $800k pa in relocation expenses
Agile work space providing benefits
Agile working supported with our worksmart
app

| Westpac Group Full Year 2016 Presentation & Investor Discussion Pack
Continued sustainability leadership
51
Help improve the way people work and live as our society changes
• Proportion of leadership roles held by women moved closer to our 2017 target of 50%, increasing to 48%, up from 46% last year
• Recruited an additional 140 Indigenous Australians in 2016
Help find solutions to environmental challenges
• Total committed exposure to the CleanTech and environmental services sector was $6.2bn as at 30 September 2016, remaining ahead of target1
• St.George’s Barangaroo branch was the first retail fit-out in Australia to be awarded a 6 Star Green Star rating, the first bank branch nationally to be rated by the GBCA2
Help customers to have a better relationship with money, for a better life
• Over 64,000 customers brought into the banking system in the Pacific in 2016, and over 100,000 mobile banking activations since 2014
• Increased lending to the social and affordable housing sector to $1.05bn, up from $1.02bn as at 30 September 2015
Further information on Westpac’s Sustainability and progress on our strategic priorities is available at www.westpac.com.au/sustainability
• Most sustainable bank globally in the 2016 Dow Jones Sustainability Index for the third time in a row, and among sector leaders annually since 2002
• Included in the Global 100 Most Sustainable Corporations in the World by Corporate Knights for 10 of the last 11 years
• Included in the 2016 CDP3 Climate A list, ranking Westpac among the top 9% of participating companies globally
• External Stakeholder Advisory Council appointed
• Social enterprises supported by Westpac Foundation created 2,912 employment pathways including 839 jobs
• Made significant progress against our Sustainability Strategy with more than half of the 2017 targets met or exceeded ahead of schedule
Leading track record
Significant achievements
Strategic priorities and FY16 progress highlights
1
2
3
1 From 2015, a higher threshold for green buildings was introduced in line with industry trends. 2 Rated by Green Building Council of Australia (GBCA) under the Green Star Interiors tool. 3 Formerly the Carbon Disclosure Project.
Embracing societal change
Environmental solutions
Better financial futures
SUSTAINABLE FUTURES

| Westpac Group Full Year 2016 Presentation & Investor Discussion Pack
Continued support for CleanTech and renewable electricitygeneration (Australia and New Zealand)
52
1 In 2016 Westpac had no exposure to waster or land remediation projects that met the criteria for the Group’s CleanTech exposures. 2 TCE represents exposures in WIB.
For further details refer to Westpac Group 2016 Sustainability Performance Report or www.westpac.com.au/sustainability.
CleanTech1 and environmental services TCE by type (%) Electricity generation portfolio (%)
55.334.2
5.33.1 1.3 0.5 0.4 Green buildings
Renewable energy
Forestry
Waste
Other
Energy efficiency
Green businesses
Electricity generation TCE by type (%)
59.419.7
15.8
3.1 2.0Renewable energy
Gas
Black coal
Brown coal
Liquid fuel
Emissions intensity (tCO2-e/MWh) – Australia only
0.44 0.41 0.38 0.38
0.87 0.87 0.91 0.90
2013 2014 2015 2016
Westpac electricty generation portfolio
National Electrcity Market (NEM) Benchmark
TCE2 at 30 September 2016 $6.2bn
TCE2 at 30 September 2016 $3.1bn
45.2 51.7 54.9 58.6 60.7 59.4
54.8 48.3 45.1 41.4 39.3 40.6
2011 2012 2013 2014 2015 2016
Renewable Non-renewable
SUSTAINABLE FUTURES

| Westpac Group Full Year 2016 Presentation & Investor Discussion Pack
Actively supporting Australia
53
1 All figures for the full year to 30 September 2016 unless otherwise stated. Divdends paid represents the 1H16 and 2H16 dividend. 2 New mortgage and new business lending in Australian retail operations which includes CB, BB and BTFG. 3 Source: Bloomberg.
Supporting communities1
• 3rd largest Australian taxpayer3 payingmore than $3bn in income tax in 2015
• Employ 39,568 people
$103bnnew lending2
$576bn total Aust. loans
• Provide loans to help Australians own their home or grow their business
• Support the efficient flow of funds in the economy and keep deposits safe
Backing economic activity
$6.3bnin dividends;
Market capitalisation
$99bn
• Support working and retired Australians either directly (622K shareholders) or via their super funds
Wealthof many Australians
>$3.3bn in income tax
expense
The bottom line
$4.6bn in payments to
employees
The workforce
>1%community
contributions to pre-tax profit
• $10m launch of Westpac 200 Businesses of tomorrow
• First 100 Westpac Scholars• 40+ years continuous support of the
Westpac Rescue Helicopter Service
The nation
Income tax expense on a cash earnings basis ($m) FY15 FY16
Notional income tax based on the Australian company tax rate of 30% 3,346 3,354
Net amounts not deductible/(not assessable) (72) (10)
Total income tax expense in the income statement 3,274 3,344
Effective tax rate (%) 29.4 29.9
Other tax/government payments ($m) FY15 FY16
Net GST, Payroll tax, FBT 443 447
Westpac also makes a number of other government and regulatory payments including fees for committed liquidity facility, APRA fees and stamp duties which are not included in the above. Similarly, Westpac also collects tax on behalf of others, such as withholding tax, PAYG and GST. These are excluded from this analysis
SUSTAINABLE FUTURES

Westpac Banking Corporation ABN 33 007 457 141.
Earnings Drivers
Financial results based on cash earnings unless otherwise stated. Refer page 36 for definition. Results principally cover the FY16 and FY15 years, including 2H16 and 1H16. Comparison of 2H16 versus 1H16 (unless otherwise stated)

| Westpac Group Full Year 2016 Presentation & Investor Discussion Pack
Net operating income flat over half, up 3% over year
55
10,520 10,619 10,584 273 75
71 (82) 150 (108) (96)(89)
(149) 5 29 (15)
2H15 AIEAgrowth
Margins Fees &commissions
Wealth Trading Other 1H16 AIEAgrowth
Margins Fees &commissions
Wealth Trading Other 2H16
10,520 194 69
3 10,619 81 39 41
10,584 (95)
(51) (21)(12) (100) (84)
2H15 CB BB BTFG WIB NZ Group 1H16 CB BB BTFG WIB NZ Group 2H1633
1 AIEA is average interest-earning assets. 2 Impact of partial sale and deconsolidation of BTIM. 3 New Zealand contribution represented in A$. 4 Group Businesses.
Net operating income movement ($m)
Net operating income by division ($m) and divisional contribution to net operating income 2H16 (%)
38%
24%
11%
14%
10%
3%
2H16 Divisional contribution
CB
BB
BTFG
WIB
NZ
Group
4Up 1% Flat
Net interest up 5% Non-interest down 8% Net interest
up 1% Non-interest down 3%
3
1 1
4 4
REVENUE
2
2

| Westpac Group Full Year 2016 Presentation & Investor Discussion Pack
145.5 148.710.0
(1.0) 150.2(7.6)
0.1
Sep-
15
Mar
-16
BB
new
lend
ing
BB
run-
off
WIB
net
lend
ing
Oth
er
Sep-
16
Composition of lending
56
1 In A$. 2 Gross loans. 3.Run-off includes repayment. 4 Other includes business lending in Private Wealth.
623.3640.7 11.1 4.2 7.1 0.4 661.9(1.6)
Sep-
15
Mar
-16
Con
sum
erB
ank
Bus
ines
sB
ank WIB
New
Zeal
and
Oth
er(in
c. B
T)
Sep-
16
Net loans ($bn)
Australian mortgage lending2 ($bn) New Zealand net loans (NZ$bn)
Up 3%
Australian business lending2 ($bn)
69.0 71.7 1.6 1.8 75.1
Sep-
15
Mar
-16
Con
sum
er
Bus
ines
s
Sep-
16
61.013.3
9.23.6
12.9 Australian mortgages
Australian business
Australian institutional
Australian other consumer
Other (NZ & Overseas)
375.8 390.841.8
404.2(28.4)
Sep-
15
Mar
-16
New
lend
ing
Net
run-
off
Sep-
16
Up 3% Up 1%
Composition of lending (% of total)
REVENUE
Up 5%
43 3
1

| Westpac Group Full Year 2016 Presentation & Investor Discussion Pack
156 171 189
70 68 6480 80 84
121 123 130427 442 467
Sep-15 Mar-16 Sep-16
Term deposits Savings Online Transaction
Customer deposits
57
1 Included in transaction accounts.
New Zealand customer deposits (NZ$bn)
Customer deposit composition ($bn)Customer deposit mix ($bn) and % of total
Mortgage offset1 balances ($bn)
168 174 181
102 106 11180 83 8877 79 87
Sep-15 Mar-16 Sep-16
CB BB WIB BTFG, NZ & Other427 442
467
40%
14%18%
28%
11.914.6
18.423.5
30.535.1
Sep-11 Sep-12 Sep-13 Sep-14 Sep-15 Sep-16
6%3%
LCR customer deposit run-off 13.5%15.2% 14.2%
REVENUE
24 25 29
3 4311 1212
13 14 1452 55 58
Sep-15 Mar-16 Sep-16
Term deposits Savings Online Transaction
51%
6%
20%
24%
5%6%

| Westpac Group Full Year 2016 Presentation & Investor Discussion Pack
Net interest margin down 3bps, primarily due to higher funding costs and lower interest rates
58
Net interest margin (NIM) movement (%)
Net interest margin by division (%)
2.21 2.112.08 2.04
1H11 2H11 1H12 2H12 1H13 2H13 1H14 2H14 1H15 2H15 1H16 2H16
NIM NIM excl. Treasury & Markets
2.28
2.74
1.78
2.272.372.75
1.712.152.34
2.74
1.752.11
CB BB WIB NZ
2H15 1H16 2H16
Net interest margin (NIM) (%)
2.05 2.072.04
0.060.07
0.07
2.112.14
3bps (2bps)(3bps)
(1bps) 0bp 0bp 2.11
2H15
1H16
Asse
ts
Cus
tom
erde
posi
ts
Term
who
lesa
lefu
ndin
g
Cap
ital &
oth
er
Liqu
idity
cos
ts
Trea
sury
& M
arke
ts 2H16
NIM excl. Treasury & Markets Treasury & Markets impact on NIM
Full period impact of repricing decisions in 1H16, partly offset by competition
Widening of spreads, and lengthening of average tenor in
preparation for NSFR
Term deposit competition
and the impact of
lower interest rates on
transactional deposit spreads
Lower CLF fee offset by cost of
holding more HQLA
REVENUE

| Westpac Group Full Year 2016 Presentation & Investor Discussion Pack
Non-interest income down 3%, primarily from lower trading income
59
Wealth and insurance income ($m) Trading income ($m)
Non-interest income contributors ($m) Fees and commission income ($m)
1,478 1,464 1,375 1,380
1H15 2H15 1H16 2H16
1,134 1,090941 970
1H15 2H15 1H16 2H16
425539
610514
1H15 2H15 1H16 2H16
Higher Hastings performance fees, higher funds management income from increased flows
partly offset by higher insurance claims
Higher cards income partly offset by lower institutional income
Lower commodities risk management and lower sales
activity
REVENUE
3,215 2,966 5 29
2,889 (96) (15)
2H15 1H16 Fees andcommision
Wealthand
insurance
Tradingincome
Other 2H16
Down 3%

| Westpac Group Full Year 2016 Presentation & Investor Discussion Pack
Markets and Treasury income
60
Group market risk related income1 ($m)Markets income by activity1 ($m)
473462465447
14713114289
(153)
(13)
2 10
467
580609
546
1H15
2H15
1H16
2H16
1H15
2H15
1H16
2H16
1H15
2H15
1H16
2H16
1H15
2H15
1H16
2H16
119
231259250
14713114289
(153)
(13)
2 10
113
349403
349
1H15
2H15
1H16
2H16
1H15
2H15
1H16
2H16
1H15
2H15
1H16
2H16
1H15
2H15
1H16
2H16
Customer income
Market risk related income
Derivative valuation
adjustments
Total markets income
Treasuryincome
Market riskrelated income
Derivative valuation
adjustments
Total Group risk related
income
Lower FX and commodities
result
4% lower, with FX and Fixed Income sales
impacted by lower activity
Treasury income 3% lower
Group market risk related income
13% lower
Markets income 10% lower
1 Prior periods have been restated to include Westpac Pacific . 2 1H15 includes charge for methodology changes to derivative valuations of $122m (pre-tax) and CVA of $31m (pre-tax).
2 2
REVENUE

| Westpac Group Full Year 2016 Presentation & Investor Discussion Pack
Peer leading expense to income ratio, at 42%
61
1 Company data, Credit Suisse. Expense to income ratio average for banks based on their FY16 results, European average excludes Deutsche Bank.
Divisional expense to income (%) Global peer comparison of expense to income ratios1 (%)
64.0 61.9 60.555.4
50.646.4 42.7 42.4 42.0
Eur
opea
nav
erag
e
US
regi
onal
aver
age
Can
adia
nav
erag
e
Kor
ean
aver
age
Pee
r 1
Sin
gapo
reav
erag
e
Pee
r 3
Pee
r 2
WBC
41.8
36.0
48.2
41.2 40.541.2
35.7
46.7
41.8 42.240.3
35.3
49.7
45.241.8
CB BB BTFG WIB NZ
2H15 1H16 2H16
Expense movements ($m)
EXPENSES
35,241 34,677 35,280
25 149 454(589)
2H15
Run
Cha
nge
1H16
Run
Cha
nge
2H16
FTE run versus change (#)
4,419 4,438 4,479 99
6741
1H16
Ope
ratin
gex
pens
es
Pro
duct
ivity
bene
fits
Inve
stm
ents
2H16
regu
lato
ry/
com
plia
nce
cost
s
Add
ition
alre
gula
tory
/co
mpl
ianc
eco
sts 2H
16
(147)
Productivity benefits accelerated in 2H16. $263m over the year
Up 0.4% Up 1.0%
| Westpac Group Full Year 2016 Presentation & Investor Discussion Pack
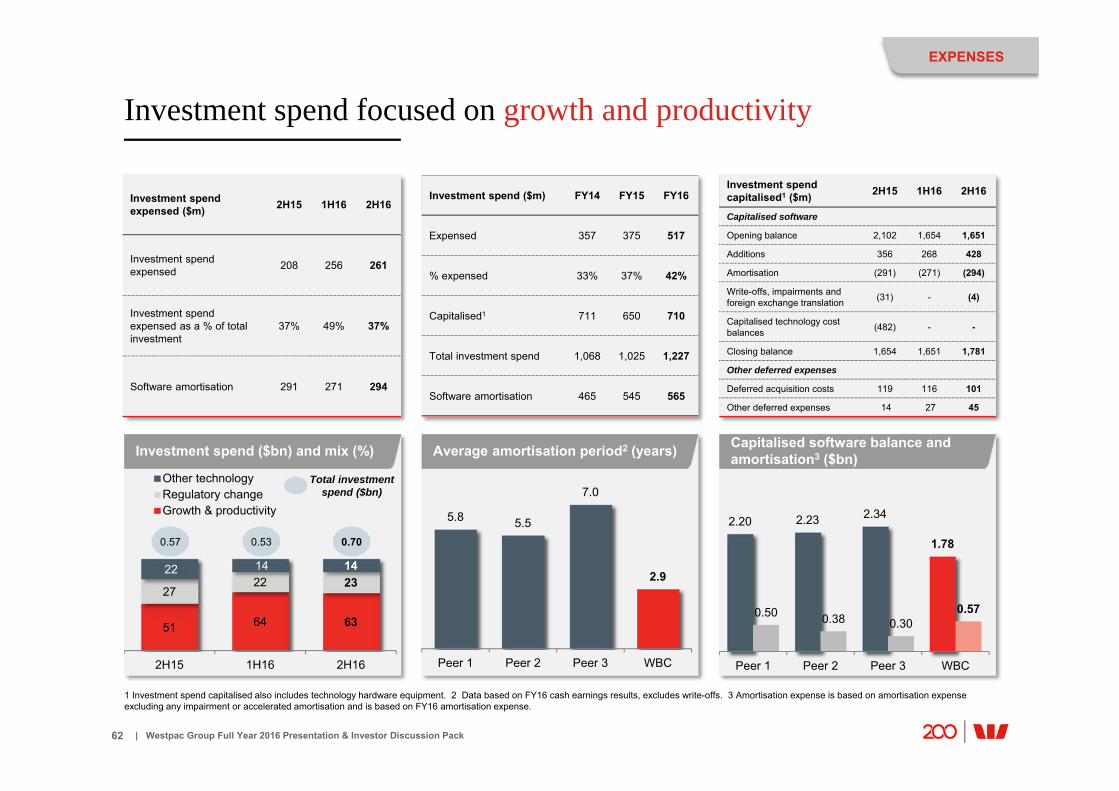
Investment spend focused on growth and productivity
62
1 Investment spend capitalised also includes technology hardware equipment. 2 Data based on FY16 cash earnings results, excludes write-offs. 3 Amortisation expense is based on amortisation expense excluding any impairment or accelerated amortisation and is based on FY16 amortisation expense.
Investment spend expensed ($m) 2H15 1H16 2H16
Investment spend expensed 208 256 261
Investment spend expensed as a % of total investment
37% 49% 37%
Software amortisation 291 271 294
Investment spend ($m) FY14 FY15 FY16
Expensed 357 375 517
% expensed 33% 37% 42%
Capitalised1 711 650 710
Total investment spend 1,068 1,025 1,227
Software amortisation 465 545 565
Investment spend capitalised1 ($m) 2H15 1H16 2H16
Capitalised software
Opening balance 2,102 1,654 1,651
Additions 356 268 428
Amortisation (291) (271) (294)
Write-offs, impairments and foreign exchange translation (31) - (4)
Capitalised technology cost balances (482) - -
Closing balance 1,654 1,651 1,781
Other deferred expenses
Deferred acquisition costs 119 116 101
Other deferred expenses 14 27 45
2.20 2.23 2.34
1.78
0.50 0.38 0.300.57
Peer 1 Peer 2 Peer 3 WBC
Average amortisation period2 (years) Capitalised software balance and amortisation3 ($bn)
5.8 5.5
7.0
2.9
Peer 1 Peer 2 Peer 3 WBC
Investment spend ($bn) and mix (%)
51 64 63
2722 23
22 14 14
2H15 1H16 2H16
Other technologyRegulatory changeGrowth & productivity
0.700.530.57
Total investment spend ($bn)
EXPENSES

| Westpac Group Full Year 2016 Presentation & Investor Discussion Pack
Consistent track record of delivering productivity savings: $1.8bn in last 8 years
63
• Business Connect and Connect Now video conferencing now in 89% of sites1
• 31% reduction in retail and business banking and wealth complaints over last 12 months
• 65,000 Westpac customers requested to temporarily lock or unlock cards 298,000 times online since launched in November 2015. Online now accounts for 59% of all card locks
• 600,000 downloads of Proof of Balance and interim statements online since launch. Previously these customers would have needed to visit a branch or call a contact centre
• Connect – the ability of customers to connect to a banker via their mobile without needing to be re-verified. This has driven reduction, on average, of between 50 – 60 seconds per call
• E-statement functionality launched on Westpac One in New Zealand in March has grown from 13,000 elections in the first month to 121,000 as at September 2016
• Over 50% of credit card applications in New Zealand originated online
$1.8bn saved from efficiency programs since FY09 ($m)
Metrics
1 Sites includes branches and standalone business banking centres and excludes instores. 2 Branches excluding instores. 3 Cumulative numbers. 4 Total branches Australia, New Zealand and Westpac Pacific.
1,5651,828
143212
289238
225219
239
263
FY09 FY10 FY11 FY12 FY13 FY14 FY15 FY09-FY15cumulative
FY16 Cumulative
FY14 FY15 FY16
% of new format Australian branches2,3 25% 36% 45%
Australia % of Smart ATMs of ATM network3 25% 34% 41%
Number of branches4 1,534 1,429 1,309
Consumer Bank and Business Bank active digital customers3 (# m) 4.0 4.0 4.2
Number of IT applications closed3 77 119 151
Targeting FY16-FY18 annual productivity savings to average $270m
EXPENSES

| Westpac Group Full Year 2016 Presentation & Investor Discussion Pack
2H16 impairment charges down due to lower new IAPs
64
1 Pre-2008 does not include St.George. 2008 and 2009 are pro forma including St.George for the entire period with 1H09 ASX Profit Announcement providing details of pro forma adjustments.
IMPAIRMENTS
Impairment charges and stressed exposures1 (bps)
14bps
120bps
0
100
200
300
400
500
0
20
40
60
80
100
120
2007 2008 2009 2010 2011 2012 2013 2014 1H15 2H15 1H16 2H16
Impairment charge to average loansannualised (lhs)
Stressed exposures to TCE (rhs)
293 273471
256
(218)(210) (174) (173)
330463 418 484
(64) (114)(48) (110)
341 412
667457
1H15 2H15 1H16 2H16 1H15 2H15 1H16 2H16 1H15 2H15 1H16 2H16 1H15 2H15 1H16 2H16 1H15 2H15 1H16 2H16
New IAPs Write-backs& recoveries
Write-offs direct Other movementsin CAP
TotalIndividually assessed Collectively assessed
Impairment charges ($m)

Westpac Banking Corporation ABN 33 007 457 141.
Asset Quality
Financial results based on cash earnings unless otherwise stated. Refer page 36 for definition. Results principally cover the FY16 and FY15 years, including 2H16 and 1H16. Comparison of 2H16 versus 1H16 (unless otherwise stated)

| Westpac Group Full Year 2016 Presentation & Investor Discussion Pack
High quality portfolio with bias to secured consumer lending
66
1 Risk grade equivalent. 2 Exposure by booking office.
Standard and Poor’s risk grade1 Australia NZ / Pacific Asia Americas Europe Group % of TotalAAA to AA- 91,355 7,852 1,145 8,181 917 109,450 11%A+ to A- 28,317 5,570 5,443 3,980 3,257 46,567 5%BBB+ to BBB- 60,039 10,718 8,859 1,806 2,303 83,725 9%BB+ to BB 73,544 10,342 1,959 338 561 86,744 9%BB- to B+ 57,836 9,915 126 15 32 67,924 7%<B+ 6,058 3,382 - 31 - 9,471 1%Secured consumer 468,952 51,576 778 - - 521,306 53%Unsecured consumer 46,286 5,410 - - - 51,696 5%Total committed exposures (TCE) 832,387 104,765 18,310 14,351 7,070 976,883 Exposure by region2 (%) 85% 11% 2% 1% 1% 100%
On balance sheet lendingTotal assets
68
17
11
4
Housing
Business
Institutional
Other consumer
ASSETQUALITY
Updated
7910
42
2 1
11
Loans
Trading securities, financial assets at fair valueand available-for-sale securitiesDerivative financial instruments
Cash and balances with central banks
Life insurance assets
Goodwill
Receivables due from other financial institutions
Other assets
Asset composition as at 30 September 2016 (%)
Exposure by risk grade as at 30 September 2016 ($m)

| Westpac Group Full Year 2016 Presentation & Investor Discussion Pack
A well diversified portfolio across industries and large exposures
67
• Largest corporation/NBFI single name exposure represents less than 0.2% of TCE
Top 10 exposures to corporations & NBFIs5
as at 30 September 2016 ($m)
0 300 600 900 1,200
BBB-A-
BBB-A
BBB-A
BBB+BBB+
AA-A-
S&P
ratin
g or
equ
ival
ent
Top 10 exposures to corporations and NBFIs5
as a % of TCE6 (%)
1 Exposures at default represents an estimate of the amount of committed exposure expected to be drawn by the customer at the time of default. Chart excludes consumer lending. 2 Finance and insurance includes banks, non-banks, insurance companies and other firms providing services to the finance and insurance sectors. 3 Property includes both residential and non-residential property investors and developers, and excludes real estate agents. 4 Construction includes building and non-building construction, and industries serving the construction sector. 5 NBFI is Non-Bank Financial Institutions. 6 Includes St.George from 2009 onwards.
2.0 1.9
1.4 1.31.1 1.2
1.31.1 1.2
1.0
Sep-07 Sep-08 Sep-09 Sep-10 Sep-11 Sep-12 Sep-13 Sep-14 Sep-15 Sep-16
Exposures at default1 by sector ($bn)
0 20 40 60 80 100
Other
Accommodation, cafes& restaurants
Construction
Mining
Utilities
Agriculture, forestry & fishing
Transport & storage
Property services & businessservices
Services
Manufacturing
Wholesale & retail trade
Government admin. & defence
Property
Finance & insurance
Sep-15
Mar-16
Sep-16
2
3
4
ASSETQUALITY

| Westpac Group Full Year 2016 Presentation & Investor Discussion Pack
Strong provisioning maintained
68
Asset quality 2H15 1H16 2H16
Impairment charges to average loans annualised (bps) 13 21 14
Impairment charges to average loans annualised (bps) including interest carrying adjustment
16 24 17
Gross impaired assets to gross loans (%) 0.30 0.39 0.32
Stressed exposures to TCE (%) 0.99 1.03 1.20
Provisions
Total provisions to gross loans (bps) 53 57 54
Impaired asset provisions to impaired assets (%) 46 48 49
Collectively assessed provisions to credit RWA (bps) 86 87 761
Economic overlay ($m) 388 393 389
87bps excluding the impact of increase in mortgage risk weights from 1 July 2016
1,2281,622 1,461 1,470 1,364
867 669952 869
3,004
2,9862,607 2,408
2,196
2,2252,275
2,324 2,344
502
453
346363
389
389388
393 389
4,7345,061
4,4144,241
3,949
3,4813,332
3,669 3,602
Sep-09 Sep-10 Sep-11 Sep-12 Sep-13 Sep-14 Sep-15 Mar-16 Sep-16
Total provisions
Economic overlay
Collectively assessed provisions
Total provisions up 8% over the year
Total provisions ($m)
1 Change in mortgage risk weights increased credit RWA by $43bn, reducing the collectively assessed provisions to credit RWA ratio by 11bps.
ASSETQUALITY

| Westpac Group Full Year 2016 Presentation & Investor Discussion Pack
New impaired assets lower;Increase in stress mainly in Watchlist and Substandard
69
Stressed exposures as a % of TCE (%)
0.13 0.240.57 0.67 0.62 0.58 0.44
0.27 0.24 0.20 0.26 0.220.13
0.15
0.290.46 0.41 0.35
0.31
0.26 0.26 0.25 0.28 0.330.62
0.91
2.232.07
1.45
1.24
0.85
0.71 0.620.54 0.49
0.650.88
1.30
3.09 3.20
2.48
2.17
1.60
1.24 1.120.99 1.03
1.20
Sep-
07
Sep-
08
Sep-
09
Sep-
10
Sep-
11
Sep-
12
Sep-
13
Sep-
14
Mar
-15
Sep-
15
Mar
-16
Sep-
16
.
Watchlist & substandard
90+ day past due and not impaired
Impaired
Movement in stress categories (bps)
99 6 3 (2) (3) 103 (4) 56
10 120
Sep-
15
Impa
ired
90+
dpd
not
impa
ired
Sub
stan
dard
Wat
chlis
t
Mar
-16
Impa
ired
90+
dpd
not
impa
ired
Sub
stan
dard
Wat
chlis
t
Sep-
16
WIB large names downgraded from
stressed to impaired
New and increased gross impaired assets ($m)
1,218
1,748 1,519
1,343
1,060 1,194
997 958 708 609 607 633
1,078
477 1H
10
2H10
1H11
2H11
1H12
2H12
1H13
2H13
1H14
2H14
1H15
2H15
1H16
2H16
Mainly NZ Dairy and a small number of
single names in WIB
ASSETQUALITY

| Westpac Group Full Year 2016 Presentation & Investor Discussion Pack
0.0
0.5
1.0
1.5
2.0
2.5
Agr
icul
ture
, for
estry
&fis
hing
Who
lesa
le &
reta
il tra
de
Pro
perty
ser
vice
s &
busi
ness
ser
vice
s
Man
ufac
turin
g
Pro
perty
Ser
vice
s
Tran
spor
t & s
tora
ge
Con
stru
ctio
n
Min
ing
Acc
omm
odat
ion,
caf
es&
rest
aura
nts
Fina
nce
& in
sura
nce
Oth
er
Util
ities
Sep-15 Mar-16 Sep-16
Increase in stressed exposures by industry mainly in NZ dairy and mining-related exposures
70
Corporate and business portfolio stressed exposures by industry ($bn)
• Across sectors, the increase in stress is due to higher Watchlist and Substandard facilities. These facilities are still performing but have been downgraded due to early signs of stress. Provisions have increased as a result.
• Increases in stress across sectors are mainly due to
− Agriculture, forestry and fishing – mostly NZ dairy, where our review of all our major customers in 2H16 led to an increase in provisions
− Services – associated with a specific development
− Increases in wholesale and retail trade, construction and mining due to companies directly in mining services or supporting mining activities
ASSETQUALITY

| Westpac Group Full Year 2016 Presentation & Investor Discussion Pack
Areas of interest: Commercial property
71
1 Includes impaired exposures. 2 Following a review of the commercial property sector mapping $4.6bn (6.9% of total commercial property) was reclassified from “Commercial offices & diversified groups” to “Residential”.
44
27
20
9Commercial offices& diversifiedgroupsResidential
Retail
Industrial
17
10
9
659
44
NSW & ACT
VIC
QLD
SA & NT
WA
NZ & Pacific
Institutional (diversified)
43
11
30
16Exposures <$10m
Developers >$10m
Investors >$10m
Diversified PropertyGroups and PropertyTrusts >$10m
Commercial property portfolio Mar-16 Sep-16
Total committed exposures (TCE) $67.5bn $67.1bn
Lending $52.1bn $52.6bn
Commercial property as a % of Group TCE 7.06 6.87
Median risk grade1 BB equivalent BB equivalent
% of portfolio graded as ‘stressed’1 1.34 1.32
% of portfolio in impaired 0.54 0.53
Commercial property exposures % of TCE and % in stress
-
5
10
15
20
-
2
4
6
8
10
1H09
2H09
1H10
2H10
1H11
2H11
1H12
2H12
1H13
2H13
1H14
2H14
1H15
2H15
1H16
2H16
Commercial property as % of TCE (lhs)
Commercial property % in stress (rhs)
Borrower type (%)Region (%) Sector2 (%)
Commercial property portfolio composition (%)
ASSETQUALITY

| Westpac Group Full Year 2016 Presentation & Investor Discussion Pack
Areas of interest: Inner city apartments
72
Commercial property portfolio TCE ($bn) Sep-16 %
Commercial property total committed exposures 67.1 100%
Residential apartment development >$20m (“high rise”) 5.1 7.6%
Residential apartment development >$20m (“high rise”)in major markets 3.2 4.8%
Inner Melbourne 1.4 2.1%
Inner Brisbane 0.4 0.6%
Perth metro area 0.2 0.3%
Sydney major markets 1.2 1.8%
Residential apartment development >$20mweighted average LVR (%)
Consumer mortgage lending standards are tighter for inner city apartmentsUnderwriting standards tightening
• We have been progressively tightening risk appetite in areas of higher concern since 2012
• LVRs have been reducing, limiting the impact on debt repayment of any slow down in settlements. Weighted average LVR for total high rise residential development portfolio 54%; more recent projects have significantly lower LVRs
• All 2H16 debt facilities with presale settlements have been repaid in full
• Active management of concentration risk, including exposure to residential apartment developments taking into consideration both the commercial property and residential mortgage portfolios
58.0 55.149.9
45.0
2016 2017 2018 2020Year of completion
Total consumer mortgage loans for inner city apartments $13.0bn
Average LVR at origination 69%
Average Dynamic LVR 54%
Dynamic LVR >90% 2.9%
90+ day delinquencies 30bps
(No completions on book for 2019)
Average LVR 54%
ASSETQUALITY

| Westpac Group Full Year 2016 Presentation & Investor Discussion Pack
Areas of interest: Mining and New Zealand dairy
73
1 Includes impaired exposures.
Mining portfolio Mar-16 Sep-16
Total committed exposures (TCE) $11.8bn $11.3bn
Lending $5.9bn $6.2bn
Mining as a % of Group TCE 1.23 1.16
Median risk grade1 BBB- equivalent BBB- equivalent
% of portfolio graded as ‘stressed’1 3.03 3.94
% of portfolio in impaired 1.26 1.32
44
1215
8
129
Oil and gas Iron ore
Other metal ore Coal
Mining services Other
• Diversified by commodity, customers and region
• Focused on operators with efficient, lower cost operating models
• Approx. 65% of the performing portfolio is Investment Grade
• Specific provisions to impaired assets at 48%
• Approximately half of the economic overlay allocated to the mining and mining-related sectors
• Oil and gas exposure $5.0bn
New Zealand dairy portfolio Mar-16 Sep-16
Total committed exposure (TCE) NZ$5.8bn NZ$5.9bn
Lending NZ$5.5bn NZ$5.7bn
New Zealand dairy as a % of Group TCE 0.55 0.58
% of portfolio graded as ‘stressed’1 10.04 25.29
% of portfolio in impaired 0.13 0.34
• Impaired assets remain low• Increase in stress from a portfolio review
undertaken in 2H16 at a milk price of NZ$4.25kgm/s
• Origination standards sound− Max 65% LVR on farmland− Majority of dairy security assets are in prime
farming areas where values have been maintained
− Focused on quality operators with efficient, lower cost models
Mining portfolio (TCE) by sector (%)
NZ dairy portfolio (%)
71
28
1
Fully secured
Partially secured
Unsecured
− Averaged payout used to determine long term viability and debt servicing ability
• Growth in dairy exposures mostly existing customers drawing on facilities
ASSETQUALITY

| Westpac Group Full Year 2016 Presentation & Investor Discussion Pack
Provision cover by portfolio category
74
Exposures as a % of TCE
0.24 0.20 0.26 0.22
0.26 0.25 0.28 0.33
0.620.54 0.49
0.65
98.88 99.01 98.9798.80
Mar-15 Sep-15 Mar-16 Sep-16
Fully performing portfolio
• Small cover as low probability of default (PD)
• Includes economic overlay0.22 0.21 0.22 0.22
Provisioning to TCE (%)
Mar-15 Sep-15 Mar-16 Sep-16
Watchlist & substandard
• Still performing but higher cover reflects elevated PD 6.55 6.93 4.89 4.51
90+ day past due and not impaired
• In default but strong security 5.36 5.28 4.99 4.57
Impaired assets
• In default. High provision cover reflects expected recovery 47.82 46.27 47.65 49.44
Collective provisions
Impaired
asset provisions
Fully performing portfolio
Watchlist & substandard
90+ day past due and not impaired
Impaired
ASSETQUALITY

| Westpac Group Full Year 2016 Presentation & Investor Discussion Pack
Australian consumer unsecured lending portfolio performance remains sound
75
Australian consumer unsecured lending portfolio (% and $bn)
Group Consumer unsecured portfolio
3.5% of Group lending
10
57
22
10
58
23
10
58
23
Credit cards Personal loans Auto loans(consumer)
Total consumerunsecured
Sep-15 Mar-16 Sep-16
Australian unsecured lending 90+ day delinquencies (%)
1.17
0.85
1.82
0.91
- 0.50 1.00 1.50 2.00 2.50 3.00
Sep-
10
Mar
-11
Sep-
11
Mar
-12
Sep-
12
Mar
-13
Sep-
13
Mar
-14
Sep-
14
Mar
-15
Sep-
15
Mar
-16
Sep-
16
Total unsecured lending Credit cards
Personal loans (excl Auto) Auto loans (consumer)
Australian consumer unsecured lending
• Australian consumer unsecured lending remains a very small part of the Group portfolio
• 90+ day delinquencies decreased by 32bps to 117bps, primarily driven by the improvement in personal loans and auto finance delinquencies
• Changes in hardship reporting are expected to see a rise in reported delinquencies in 2017. Write-offs and recoveries will also increase as a result of changes in the treatment of hardship
Australian consumer unsecured lending portfolio ($bn)Australian consumer unsecured lending portfolio (%)
ASSETQUALITY

| Westpac Group Full Year 2016 Presentation & Investor Discussion Pack
Australian housing loan-to-value ratios (LVRs)2,3 (%)
High levels of borrower equity create buffers in the Australian mortgage portfolio
76
1 Flow is all new mortgage originations settled during the 6 month period ended 30 September 2016 and includes RAMS. 2 Excludes RAMS. 3 Dynamic LVR represents the loan-to-value ratio taking into account the current outstanding loan balance, changes in security value and other loan adjustments. Property valuation source Australian Property Monitors. 4 Average LVR of new loans is based on rolling 6 month window. 5 Portfolio as at 30 September 2016 including amortisation. 6 Customer loans ahead on payments exclude equity/line of credit products as there are no scheduled principal payments. Includes mortgage offset account balances. ‘Behind’ is more than 30 days past due. ‘On time’ includes up to 30 days past due. 7 Mortgage insurance claims 2H16 $7m (1H16 $4m, 2H15 $3, 1H15 $1m).
0
20
40
60
80
100
0<=60 60<=70 70<=80 80<=90 90<=95 95+
FY16 drawdowns LVR at originationPortfolio LVR at originationPortfolio dynamic LVR
Australian housing portfolio Sep-15 balance
Mar-16 balance
Sep-16 balance
2H16flow1
Total portfolio ($bn) 375.8 390.8 404.2 41.8
Owner occupied (%) 48.9 54.3 55.0 58.6
Investment property loans (%) 44.5 39.5 39.3 39.5
Portfolio loan/line of credit (%) 6.6 6.2 5.7 1.9
Variable rate / Fixed rate (%) 80 / 20 83 / 17 83 / 17 77 / 23
Low Doc (%) 3.0 2.7 2.4 0.5
Proprietary channel (%) 59.1 58.2 57.9 55.9
First Home Buyer (%) 9.2 8.9 8.6 8.4
Mortgage insured (%) 19.4 18.8 18.4 15.0
Sep-15 Mar-16 Sep-16
Average LVR at origination2 (%) 70 70 70
Average dynamic LVR2,3 (%) 43 43 43
Average LVR of new loans2,4 (%) 71 70 70
Average loan size5 ($’000) 242 249 254
Customers ahead on repayments including offset accts2,6 (%) 74 72 72
Actual mortgage losses net of insurance7 ($m) 32 35 31
Actual mortgage loss rateannualised (bps) 2 2 2
93% of portfolio with dynamic LVR ≤80%
0
5
10
15
20
25
30
Behind On Time < 1 Month < 1 Year < 2 Years > 2 Years
Sep-15 Mar-16 Sep-16
Australian home loan customers ahead on repayments2,6 (%)
72% ahead on repayments
ASSETQUALITY

| Westpac Group Full Year 2016 Presentation & Investor Discussion Pack
Lending standards on a tightening bias since 2015
Serviceability
• Minimum assessment (floor) rate 7.25% and buffer rate of at least 2.25% from September 2015
• Tightened policy on assessment of living expenses and income verification in November 2015
• Discounting of rental income, annuity and pension income increased for certain loans in January 2016
Non-resident and ex-pat lending
• From April 2016, non-resident customers no longer qualify for mortgage loans (limited exceptions)
• For Australian and NZ citizens and permanent visa holders using foreign income, tightened verification processes and LVR restricted to 70% maximum
Pricing • Different rates for investment property loans and interest onlyrepayment types progressively introduced from August 2015
Sound credit fundamentals underpin Australian mortgages
Full recourse • Banks in Australia have full recourse to the borrower’s mortgaged property, other assets and future earnings
Tax • Interest payments on primary residence are not tax deductible –provides incentive to pay off mortgage
Well regulated• Strict prudential supervision by one national regulator, APRA• National Consumer Protection Bill requires sound underwriting and
origination standards
Sound mortgage products
• 83% are variable rate• Fixed rate loans for short periods of time – 3 to 5 years• Interest only loans assessed on a principal and interest repayment
basis over the remaining term
Prudent lending standards support Australian mortgage portfolio quality
77
4.39
7.25
3
5
7
9
Mar
-14
Jun-
14
Sep-
14
Dec
-14
Mar
-15
Jun-
15
Sep-
15
Dec
-15
Mar
-16
Jun-
16
Sep-
16
Westpac owner occupied SVR inc package discount
Westpac minimum assessment ('floor') rate
Mortgage interest rate buffers (%)
Owner occupied vs Investment property lending growth (%)
5.9
8.9
0.02.04.06.08.0
10.012.014.016.0
Mar
-15
Jun-
15
Sep-
15
Dec
-15
Mar
-16
Jun-
16
Sep-
16
Investor Owner occupied
APRA 10% limit on investment property growth effective September 2015
ASSETQUALITY

| Westpac Group Full Year 2016 Presentation & Investor Discussion Pack
Australian mortgage delinquencies remain low;Impacted by changes in hardship treatment
78
1 Source ABA Cannex August 2016.
Australian mortgage portfolio Sep-15 Mar-16 Sep-16
30+ day delinquencies (bps) 102 134 130
90+ day delinquencies (bps)(includes impaired mortgages)
45 55 66
Estimated impact of changes to hardship treatment (bps) (total impact 13bps) 4 9
90+ day delinquencies –investment property loans (bps) 31 38 48
Consumer properties in possession (#) 255 253 262
Australian mortgages delinquencies (%)
0.0
1.0
2.0
3.0
Mar
-11
Sep-
11
Mar
-12
Sep-
12
Mar
-13
Sep-
13
Mar
-14
Sep-
14
Mar
-15
Sep-
15
Mar
-16
Sep-
16
NSW/ACT VIC/TAS QLDWA SA/NT ALL
Australian mortgages 90+ day delinquencies by state (%)Westpac Australian housing portfolio and banking system by State (%)
35
27
1813
7
40
26
1710
7
42
28
16
7 6
NSW & ACT VIC & TAS QLD WA SA & NT
Australian banking systemWestpac Group portfolioFY16 Westpac Group drawdowns
1
Introduction of new hardship treatment
-
1.0
2.0
3.0
Mar
-11
Sep-
11
Mar
-12
Sep-
12
Mar
-13
Sep-
13
Mar
-14
Sep-
14
Mar
-15
Sep-
15
Mar
-16
Sep-
16
90+ day past due total 90+ day past due investor30+ day past due total Loss rates
ASSETQUALITY

| Westpac Group Full Year 2016 Presentation & Investor Discussion Pack
Changes in the treatment of hardship now largely flowed through Australian mortgage portfolio
79
• Following guidance from APRA the industry is aligning treatment of hardship in delinquencies
• Westpac changed measurement and delinquency treatment of new hardship accounts in 1H16
• No impact on the risk profile of the Group or asset classes
• At the same time, hardship policies have tightened
• Further deterioration from mortgage hardship changes expected to be minimal
When an account enters hardship their position in the delinquency flow (30, 60, or 90 days etc) is frozen until they return to performing (or not)
• An account in hardship is no longer frozen and continues to migrate through delinquency buckets until 90+ days
• Accounts continue to be reported as delinquent until the customer has maintained repayments for 6 months – called the ‘serviceability period’
• Average hardship period granted 3-4 months
• Hardship + serviceability period = 10 months average
• Allows customers the opportunity to reduce or defer current repayment obligations in the short term so they can manage through a period of financial hardship (e.g. injury, illness, separation, natural disasters etc)
• May take the form of extending loan duration or restructuring
• Hardship solutions will differ based on customer circumstance, payment serviceability and recoverable position
What is hardship?
Previous approach Changes made in 1H16
What is changing?
90+ day mortgage delinquencies (%)
0.450.51 0.53
0.010.010.03
0.12
0.2
0.3
0.4
0.5
0.6
0.7
Sep-15 Mar-16 Sep-16
Accounts in serviceabilityperiodAccounts in hardshipincrease90+ day delinquenciesexcl. hardship changes
13bps
ASSETQUALITY

| Westpac Group Full Year 2016 Presentation & Investor Discussion Pack
Westpac’s Australian investment property mortgageportfolio performing well
80
1 Self-Managed Super Fund (SMSF) IPLs are limited recourse however do require member guarantees. 2 An adequate surplus test measures the extent to which a borrowers income exceeds loan repayments, expenses and other commitments, as assessed. 3 Excludes RAMS. 4 Dynamic LVR represents the loan-to-value ratio taking into account the current outstanding loan balance, changes in security value and other loan adjustments. 5 Property valuation source Australian Property Monitors. 6 Average LVR of new loans is based on rolling 6 month window.
• Investment property loans (IPLs)1 are full recourse
• Maximum LVR for stand alone investment property loans capped at 90%
• Majority of IPLs interest only, however repayment behaviour closely tracks the profile of the principal and interest portfolio
• Discounts applied to certain forms of income. For example dividends / rental income / bonus / overtime are all discounted by 20%
• Loan serviceability assessments include an interest rate buffer (at least 2.25%), minimum assessment rate (7.25%) and adequate surplus test2
• Interest only loans are assessed on a principal and interest basis over the residual term
• Specific credit policies apply to assist risk mitigation, including
‒ Holiday apartments may be subject to tighter acceptance requirements (e.g. holiday resort style developments require approval prior to individual loans being considered)
‒ Additional LVR restrictions and additional income discounting apply to single industry towns and higher risk areas
‒ Minimum property size and location restrictions apply
• Loans to Australian citizens and permanent visa holders using foreign-sourced income restricted to maximum 70% LVR and discounts apply to foreign income recognition (up to 20%)
Investment property lending IPL portfolio statistics Sep-15 Mar-16 Sep-16
Average LVR at origination3 (%) 72 72 72
% IPL loans originated at or below 80% LVR 87 87 88
Average dynamic LVR3,4,5 (%) 48 48 48
Average LVR of new loans3,6 (%) 68 67 66
Average loan size ($’000) 297 299 305Customers ahead on repaymentsincluding offset accounts3 (%) 65 62 62
90+ day delinquencies (bps) 31 38 48
Annualised loss rate (net of insurance claims) (bps) 2 2 2
Applicants by gross income band2 (%)
0
5
10
15
20
25
<=50
50<=
75
75<=
100
100<
=125
125<
=150
150<
=200
200<
=500
500<
=1m
1m+
Owner occupied IPL
0
10
20
30
40
50
0<=6
0
60<=
70
70<=
75
75<=
80
80<=
85
85<=
90
90<=
95
95<=
97 97+
Owner occupied IPL
LVR at origination2 (%)
ASSETQUALITY

| Westpac Group Full Year 2016 Presentation & Investor Discussion Pack
Lenders mortgage insurance
81
Insurance statistics 2H15 1H16 2H16
Insurance claims ($m) 3 4 7
WLMI loss ratio4 (%) 12 10 17
WLMI gross written premiums5 ($m) 68 133 154
LVR Band Insurance
• LVR ≤80% • Low Doc LVR ≤60%
Not required
• LVR >80% to ≤ 90%• Low Doc
LVR >60% to ≤ 80%
• Where insurance required, insured through captive insurer, WLMI • LMI not required for certain borrower groups. • Reinsurance arrangements:
− 40% risk retained by WLMI− 60% risk transferred through quota share arrangements2 with
Arch Capital Group Limited, Tokio Millennium Re, Endurance Re, Everest Re, Trans Re and AWAC
• LVR >90% • From 18 May 2015, insured externally through Arch Capital Group Limited for all new business − Transitional arrangements are currently in place with LMI policies
initially written by WLMI and then fully reinsured with Arch Capital• Prior to 18 May 2015, external insurance provided by QBE and
Genworth. Existing LMI policies remain in force
1 Prudential Capital Requirement (PCR) determined by APRA. 2 For all new business effective from 1 October 2014. 3 Insured coverage is net of quota share. 4 Loss ratio is claims over the total of earned premium plus reinsurance plus exchange commission. 5 LMI gross written premium includes loans >90% LVR reinsured with Arch Capital. 2H16 gross written premium includes $125m from transitional arrangements (1H16: $102m).
82
108
Not insured
Insured by thirdparties
Insured byWLMI
• Where mortgage insurance is required, mortgages are insured through Westpac’s captive mortgage insurer, Westpac Lenders Mortgage Insurance (WLMI), and through external LMI providers, based on risk profile
• WLMI is well capitalised (separate from bank capital) and subject to APRA regulation. Capitalised at 1.45x PCR1
• Scenarios indicate sufficient capital to fund claims arising from events of severe stress –estimated losses for WLMI from a 1 in 200 year event are $132m net of re-insurance recoveries (1H16: $143m)
3
Australian mortgage portfolio (%)
Lenders mortgage insurance arrangementsLenders mortgage insurance
ASSETQUALITY

| Westpac Group Full Year 2016 Presentation & Investor Discussion Pack
Mortgage portfolio stress testing outcomes
82
1 Assumes 30% of LMI claims will be rejected in a stressed scenario. 2 Stressed loss rates are calculated as a percentage of mortgage exposure at default.
Australian mortgage portfolio stress testing as at 30 September 2016
Key assumptions Stressed scenario
Current Year 1 Year 2 Year 3
Portfolio size ($bn) 404 384 376 374
Unemployment rate (%) 5.6 11.6 10.6 9.4
Interest rates (cash rate, %) 1.50 0.50 0.50 0.50
House prices (% change cumulative) 0.0 (13.0) (22.4) (26.2)
Annual GDP growth (%) 3.3 (3.9) (0.2) 1.7
Stressed loss outcomes (net of LMI recoveries)1
$ million 66 1,069 1,581 467
Basis points2 2 23 36 11
• Westpac regularly conducts a range of portfolio stress tests as part of its regulatory and risk management activities
• The Australian mortgage portfolio stress testing scenario presented represents a severe recession and assumes that significant reductions in consumer spending and business investment lead to six consecutive quarters of negative GDP growth. This results in a material increase in unemployment and nationwide falls in property and other asset prices
• Estimated Australian housing portfolio losses under these stressed conditions are manageable and within the Group’s risk appetite and capital base
– Cumulative total losses of $2.9bn over three years for the uninsured portfolio (1H16: $2.6bn)
– Cumulative claims on LMI, both WLMI and external insurers, of $856m over the three years (1H16: $875m)
– Cumulative loss rates have increased (69bps compared to 59bps at 1H16) mainly due to more conservative modelling assumptions, changes in portfolio quality, including as a result of changes in the treatment of hardship and some weakness in mining-related regions, as well as changes in the non-delinquent portfolio
– WLMI separately conducts stress testing to test the sufficiency of its capital position to cover mortgage claims arising from a stressed mortgage environment
• Preferred capital ranges incorporate buffers at the Westpac Group level that also consider the combined impact on the mortgage portfolio and WLMI of severe stress scenarios
ASSETQUALITY

Westpac Banking Corporation ABN 33 007 457 141.
Capital, Funding and Liquidity
Financial results based on cash earnings unless otherwise stated. Refer page 36 for definition. Results principally cover the FY16 and FY15 years, including 2H16 and 1H16. Comparison of 2H16 versus 1H16 (unless otherwise stated)

| Westpac Group Full Year 2016 Presentation & Investor Discussion Pack
CET1 capital ratio above preferred range
84
1 Capital Conservation Buffer. 2 Domestic Systemically Important Bank. 3 Countercyclical buffer. 4 Internationally comparable methodology aligns with the APRA study titled ‘International Capital Comparison Study’ of 13 July 2015. 5 Peer 1 and 3 are as at 30 Sep 2016, peer 2 is as at 30 June 2016. Peer 1 and 3 based on pro forma CET1 capital ratio. 6 Refer APRA media release entitled “APRA increases capital adequacy requirements for residential mortgage exposures under the internal ratings-based approach”; 20 July 2016.
Peer CET1 capital ratios on a comparable basis, adjusted for mortgage RWA change and the impact of wealth leverage5 (%)
8.7
8.4
9.1
8.3
8.8
8.3
9.0
8.4
8.8
9.0
9.5 10.2
10.510.1
9.5
Mar-13 Sep-13 Mar-14 Sep-14 Mar-15 Sep-15 Mar-16 Sep-16
Preferred CET1 capital ratio range 8.75% - 9.25%
Key capital ratios (%) Sep-15 Mar-16 Sep-16
CET1 capital ratio 9.5 10.5 9.5
Additional Tier 1 capital 1.9 1.6 1.7
Tier 1 capital ratio 11.4 12.1 11.2
Tier 2 capital 1.9 1.9 1.9
Total regulatory capital ratio 13.3 14.0 13.1
CET1 capital ratio (internationally comparable4) 13.2 14.7 14.4
Risk weighted assets (RWA) ($bn) 359 363 410
Leverage ratio (APRA) 4.8 5.0 5.2
Leverage ratio (internationally comparable4) 5.5 5.8 5.9
Regulatory minimum 4.5%plus capital buffers 3.5% (including CCB1,
D-SIB2 and CCyB3) – total of 8.0%
Common equity Tier 1 capital ratio (CET1) (%)
Impact of change to Australian residential mortgage RWA methodology6 from 1 July 2016
CAPITAL
9.5 9.6 9.1
9.6
1.0
0.5
0.2
Westpac Peer 1 Peer 2 Peer 3
CET1 capital ratio Mortgage RWA change Wealth leverage6
As at 30 September 2016
CET1 Capital
ratio ($bn)
Risk weighted assets ($bn)
CET1 capitalratio
Pre-mortgage RWA change 39 367 10.6%
Impact of mortgage RWA change - 43 (1.1%)
Post mortgage RWA change 39 410 9.5%
Mortgage RWA changes

| Westpac Group Full Year 2016 Presentation & Investor Discussion Pack
Basel III regulatory capital ratios
85
CAPITAL
9.5 11.2 13.1 14.4 16.2 17.714.4
16.619.1
13.1 14.116.6
CET1 Tier 1 Totalregulatory
capital
CET1 Tier 1 Totalregulatory
capital
CET1 Tier 1 Totalregulatory
capital
CET1 Tier 1 Totalregulatory
capital
1 Internationally comparable methodology aligns with the APRA study titled ‘International Capital Comparison Study’ dated 13 July 2015. For more details on adjustments refer slide 89. 2 Includes transitional capital instruments eligible as Additional Tier 1 and Tier 2 capital under APRA Basel III rules. 3 Group 1 banks BIS 75th percentile fully phased-in Basel III capital ratios from BIS monitoring report released 13 September 2016.
Regulatory capital ratios (%)
APRA basis Internationally comparable1
basis
• Internationally comparable ratios exclude Basel III transitional instruments, which are included in the APRA capital ratios on a transitional basis
• Westpac is seeking to replace Basel III transitional instruments with Basel III instruments. Should Westpac do this, pro forma internationally comparable:
− Tier 1 capital ratio would be 16.6%2 (up from 16.2%)
− Total regulatory capital ratio would be 19.1%2 (up from 17.7%)
− CET1 capital ratio would be unchanged
Internationally comparable basisincl. transitional instruments2
Internationally comparable capital ratios
BIS 75th percentile3

| Westpac Group Full Year 2016 Presentation & Investor Discussion Pack
APRA CET1 capital ratio lower in 2H16 as mortgage RWA change implemented
86
theetete
1. APRA’s revision to the calculation of RWA for Australian residential mortgages, which came into effect on 1 July 2016. 2 Internationally comparable methodology aligns with the APRA study titled ‘International Capital Comparison Study’ dated 13 July 2015.
CET1 capital ratio (% and bps)
9.50 1
96 10.47 9614 9.48
14.43
(110) (69)(6) (6) (12) (6)
Sep-
15A
PR
A
Oth
erm
ovem
ents
Entit
lem
ent o
ffer
Mar
-16
AP
RA
Mor
tgag
e R
WA
chan
ge
Cas
h ea
rnin
gs
Inte
rim d
ivid
end
(net
of D
RP
)
Ord
inar
yR
WA
grow
th
Oth
erm
ovem
ents
RW
A e
ffici
ency
inita
itive
s
Reg
ulat
ory
mod
ellin
gch
ange
s
FX -
Cre
dit R
WA
Sep-
16A
PR
A
Sep-
16In
t. C
omp.
Loan growth largely offset by lower interest rate risk in the banking book and market risk
RWA
Includes 9bps for credit spread risk in the liquids
portfolio
1
CAPITAL
2
Data improvements, lower unutilised limits,
lower exposures
(14bps)
Organic 15bps Other (4bps)

| Westpac Group Full Year 2016 Presentation & Investor Discussion Pack
Total risk weighted assets up 1% (excluding mortgage RWA methodology impact)
87
• Australian residential mortgages RWA methodology changed on 1 July 2016, increased RWA by $43.0bn
• Excluding the impact of the mortgage RWA change, total RWA increased $3.8bn (or 1%)
• Credit RWA increased $2.8bn (1%) from:
− Increase of $8.5bn from business growth ($7.0bn), translation impacts from the higher NZ$ ($2.3bn), modelling changes ($1.0bn) related to parameter updates and reclassification of exposures in the corporate, business and small business portfolios, partly offset by benefits from improved credit quality ($1.2bn) and a decrease in mark-to-market credit risk ($0.6bn)
− RWA efficiency initiatives reduced credit RWA $5.7bn, from data improvements and refinements to parameters ($2.7bn) and management of unutilised limits and exposures ($3.0bn)
• Market risk RWA down $1.2bn mostly from reduced interest rate risk exposure
• Interest rate risk in the banking book (IRRBB) RWA increased $0.7bn. Capital for credit spread risk for liquid assets increased IRRBB RWA $3.6bn. This was partially offset by a higher embedded gain in the portfolio and lower RWA for repricing and yield curve risk ($2.9bn)
Movement in risk weighted assets ($bn)
Movements in credit risk weighted assets ($bn)
CAPITAL
406.2
358.6 363.2
43.0 8.5 1.0 0.7 0.5 410.0(5.7) (1.2)
Sep
-15
Mar
-16
Mor
tgag
eR
WA
Net
cre
dit
risk
RW
Aef
ficie
ncy
initi
ativ
es
Mar
ket
risk
Ope
ratio
nal
risk
IRR
BB
Oth
er
Sep
-16
Up $3.8bn or 1%
43.0 7.0 2.3 1.0
310.3 313.0
356.0 358.8(1.2) (0.6) (5.7)
Sep
-15
Mar
-16
Mor
tgag
eR
WA
Bus
ines
sgr
owth
FXtra
nsla
tion
impa
cts
Reg
ulat
ory
mod
ellin
gch
ange
s
Cre
dit
qual
ity
Mar
k-to
-m
arke
t
RW
Aef
ficie
ncy
initi
ativ
es
Sep
-16
Up $2.8bn or 1%
$2.8bn
$8.5bn

| Westpac Group Full Year 2016 Presentation & Investor Discussion Pack
Basel III CET1 capital ratios global comparison1
88
1 Based on CET1 capital ratios as at 30 June 2016 unless otherwise stated, assuming Basel III capital reforms fully implemented. For those banks where accrued expected dividends have been deducted these have been added back for comparability. 2 As at 30 September 2016. 3 As at 31 July 2016.
Peer group comprises listed commercial banks with total assets in excess of A$700 billion and which have disclosed fully implemented Basel III ratios or provided sufficient disclosure for an estimate. Based on company reports and investor presentations.
14.4%
Nor
dea
Mor
gan
Sta
nley
RB
S
UB
S
AN
Z
Wes
tpac
CB
A
NA
B
ING
Lloy
ds
Inte
sa S
anpa
olo
Sta
ndar
d C
harte
red
Chi
na C
onst
ruct
ion
Ban
k
Citi
grou
p
ICB
C
Rab
oban
k
HS
BC
Gol
dman
Sac
hs
Mits
ubis
hi U
FG
Chi
na M
erch
ants
Ban
k
Cre
dit S
uiss
e
Sum
itom
o M
itsui
JPM
orga
n C
hase
Bar
clay
s
Com
mer
zban
k
Soc
iete
Gen
eral
e
Cre
dit A
gric
ole
SA
BN
P P
arib
as
Nat
ixis
Ban
k of
Chi
na
Ban
k of
Com
mun
icat
ions
BB
VA
Deu
tsch
e B
ank
Miz
uho
FG
San
tand
er
Wel
ls F
argo
Sco
tiaba
nk
Uni
cred
it
Ban
k of
Mon
treal
Ban
k of
Am
eric
a
Roy
al B
ank
of C
anad
a
Toro
nto
Dom
inio
n B
ank
Agr
icul
tura
l Ban
k of
Chi
na
2 2 33
CAPITAL
2 3 3

| Westpac Group Full Year 2016 Presentation & Investor Discussion Pack
Internationally comparable capital ratio reconciliation
89
1 Methodology aligns with the APRA study titled “International capital comparison study", dated 13 July 2015
APRA’s Basel III capital requirements are more conservative than those of the Basel Committee on Banking Supervision (BCBS), leading to lower reported capital ratios. In July 2015, APRA published a study that compared the major banks’ capital ratios against a set of international peers1. The following provides details of the adjustments applied to the APRA Basel III capital requirements to derive internationally comparable ratios, which are aligned to this study
APRA Study1 (%)
Westpac’s CET1 capital ratio (APRA basis) 9.5
Equity investments Balances below prescribed threshold are risk weighted, compared to a 100% CET1 deduction under APRA’s requirements 0.5
Deferred tax assets Balances below prescribed threshold are risk weighted, compared to a 100% CET1 deduction under APRA’s requirements 0.4
Interest rate risk in the banking book (IRRBB)
APRA requires capital to be held for IRRBB. The BCBS does not have a Pillar 1 capital requirement for IRRBB 0.2
Residential mortgages Loss given default (LGD) of 15%, compared to the 20% LGD floor under APRA’s requirements. APRA also applies a correlation factor for mortgages higher than the 15% factor prescribed in the Basel rules 1.6
Unsecured non-retail exposures LGD of 45%, compared to the 60% or higher LGD under APRA’s requirements 0.6
Non-retail undrawn commitments Credit conversion factor of 75%, compared to 100% under APRA’s requirements 0.4
Specialised lendingUse of internal-ratings based (IRB) probabilities of default (PD) and LGDs for income producing real estate and project finance exposures, reduced by application of a scaling factor of 1.06. APRA applies higher risk weights under a supervisory slotting approach, but does not require the application of the scaling factors
0.6
Currency conversionthreshold
Increase in the A$ equivalent concessional threshold level for small business retail and small to medium enterprise corporate exposures 0.2
Capitalised expenses APRA requires these items to be deducted from CET1. The BCBS only requires exposures classified as intangible assets under relevant accounting standards to be deducted from CET1 0.4
Internationally comparable CET1 capital ratio 14.4
CAPITAL

| Westpac Group Full Year 2016 Presentation & Investor Discussion Pack
Optimising returns by actively managing capital
90
1 Ordinary equity is spot and also includes reserves. 2 Divisional amounts do not total to the Group given additional capital is held for Treasury, Group functions and for future dividends.
Actively managing returns
Capital allocated to divisions ($bn) Return on equity (%)
• FY16 ROE decreased due to the significant capital raised during calendar year 2015. Average ordinary equity (AOE) rose 3% over the half and 13% over the year
• Leverage ratio improved from the increased AOE
• Continue to refine capital allocation model with more capital allocated to divisions in 2016
• Capital held centrally includes: surplus capital, capital for Treasury, and capital for the next dividend payment
1H15 2H15 1H16 2H16
Group2 47.9 50.8 55.2 56.6
Consumer Bank and Business Bank 19.2 19.7 23.3 24.6
BTFG 3.1 3.3 3.5 3.6
WIB 8.9 8.8 9.3 9.2
Westpac NZ (A$) 3.7 3.7 3.4 3.7
CAPITAL
Division FY15 FY16
Group 15.8 14.0
Consumer Bank and Business Bank 17.5 16.1
BTFG 15.8 15.0
WIB 13.8 11.0
Westpac NZ (A$) 19.5 19.4
Ordinary equity1 ($bn)
53.157.2 58.13.5 0.4 0.2 0.3 0.6
Sep
-15
Ent
itlem
ent
offe
r DR
P
Oth
er
Mar
-16
DR
P
Oth
er
Sep
-16

| Westpac Group Full Year 2016 Presentation & Investor Discussion Pack
Stable sources provide 85% of all funding
91
1 Includes HQLA as defined in APS 210, RBNZ eligible liquids, less RBA open repos funding end of day ESA balances with the RBA. 2 The RBA makes available to Australian Authorised Deposit-taking Institutions a committed liquidity facility (CLF) that, subject to qualifying conditions, can be accessed to meet LCR requirements under APS210 – Liquidity. 3 Other flows include credit and liquidity facilities, collateral outflows and inflows from customers. 4 LCR is calculated as the percentage ratio of stock of HQLA and CLF over the total net cash outflows in a modelled 30 day defined stressed scenario. Calculated on a spot basis. 5 Private securities include Bank paper, RMBS, and Supra-nationals. 6 Includes long term wholesale funding with a residual maturity less than or equal to 1 year. 7 Scroll represents wholesale funding with an original maturity >12months that now has a residual maturity <12months. 8 Equity excludes FX translation, Available-for-Sale securities and Cash Flow Hedging Reserves.
Unencumbered liquid assets ($bn)
67.6
116.121.0
55.7
Sep-16 Total shortterm wholesale
debt outstandingat 30 Sep 16
Self securitisation
Private securitiesand deposits withother banks
Cash, governmentand semi-governmentbonds
6
Funding composition by residual maturity (%)
5
FUNDING & LIQUIDITY
44
59 61
5
7 8
1
2 1
10
11 11
4
5 420
10 816
6 7
Sep-08 Sep-15 Sep-16
Wholesale onshore <1yr
Primarily NCDs and long term to short term scroll7
Wholesale offshore <1yr
Primarily USCP and Yankee CDs and long term to short term scroll7
Wholesale onshore >1yr
Domestic senior unsecured bonds, covered bonds, Additional Tier 1 and Tier 2
Wholesaleoffshore >1yr
Offshore senior unsecured bonds, covered bonds and Tier 2
Securitisation RMBS and ABS
Equity Equity and reserves8
Customer deposits
Consumer, business and corporate customer deposits
Stab
le fu
ndin
g so
urce
s
144.3
Key liquidity and funding ratios ($m) Mar-16 Sep-16
HQLA1 66.2 69.4
CLF2 58.6 58.6
Total LCR Liquid assets 124.8 128.0
Customer deposits 63.2 63.5
Wholesale funding 13.4 13.1
Other flows3 21.3 19.2
Total cash outflows 97.9 95.8
LCR4 127% 134%
Estimated NSFR n/a >100%

| Westpac Group Full Year 2016 Presentation & Investor Discussion Pack
Targeting a diversified funding base
92
77
123
4
5
By type
Senior Unsecured Covered BondsABS HybridSubordinated Debt
1 Based on residual maturity and FX spot currency translation. Includes all debt issuance with contractual maturity greater than 370 days excluding US Commercial Paper and Yankee Certificates of Deposit. 2 Contractual maturity date for hybrids and callable subordinated instruments is the first scheduled conversion date or call date for the purposes of this disclosure. 3 Tenor excludes RMBS and ABS. 4 Perpetual sub-debt has been included in >FY21 maturity bucket. Maturities exclude securitisation amortisation. 5 Sources: Westpac, APRA Banking Statistics September 2016.
FY16 new term issuance composition1 (%) Australian covered bond issuance5
($bn)
Term debt issuance and maturity profile1,2,4 ($bn)
0.4
25
2
45
28
By tenor
2 Years 3 Years4 Years 5 Years>5 years
28
54
64 3
6
By currency
AUD USDEUR JPYGBP Other
25
33
22
33 31
42
2926 27
1926
17
FY11 FY12 FY13 FY14 FY15 FY16 FY17 FY18 FY19 FY20 FY21 FY>21
Sub Debt
Senior
Hybrid
Covered Bond
Issuance Maturities
2,3
1327
2027
26
2729
29
Peer 1 Peer 2 Peer 3 Westpac
Remaining capacity(8% cap & over-collateralisation)Outstanding
Higher new issuance driven by preparation for NSFR and some pre funding for FY17
Charts do not add to 100 due to rounding.
FUNDING & LIQUIDITY

Westpac Banking Corporation ABN 33 007 457 141.
Divisional results
Financial results based on cash earnings unless otherwise stated. Refer page 36 for definition. Results principally cover the FY16 and FY15 years, including 2H16 and 1H16. Comparison of 2H16 versus 1H16 (unless otherwise stated)

| Westpac Group Full Year 2016 Presentation & Investor Discussion Pack
Consumer Bank disciplined 2H16 result
94
Cash earnings ($m)
Key operating metrics
Volume growth and mortgage price changes,
partly offset by competition for new lending and higher
funding costs
Key financial metrics
2H15 1H16 2H16Change on 1H16
Revenue ($m) 3,776 3,970 4,051 +2%
Net interest margin (%) 2.28 2.37 2.34 (3bps)
Expense to income (%) 41.8 41.2 40.3 (92bps)
Customer deposit to loan ratio (%) 52.4 52.1 52.4 +24bps
Stressed assets to TCE (%) 0.41 0.51 0.61 +10bps
2H15 1H16 2H16Change on 1H16
Total customers (#’m) 8.6 8.7 8.9 2%
Active digital customers (#’m) 3.5 3.6 3.7 3%
Total branches (#) 1,201 1,096 1,085 (11)
Customer satisfaction1 (%) 83.8 83.1 81.3 (180bps)
Service quality – complaints (‘000’s) 20.7 16.8 13.1 (20%)
1,380 1,444
63 18 4 46 1,537(38)
2H15
1H16
Net
inte
rest
inco
me
Non
-inte
rest
inco
me
Ope
ratin
gex
pens
es
Impa
irmen
tch
arge
s
Tax
and
NC
I
2H16
Up $93m or 6%
Higher cards income from changes to
rewards program
Decline in other consumer lending
delinquencies
Lower operating expenses with productivity offsetting
run cost increases and higher investment
1 Refer slide 89for metric definition and details of provider.
CONSUMER BANK

| Westpac Group Full Year 2016 Presentation & Investor Discussion Pack
Consumer Bank consistently delivering
95
Revenue ($m)
Expense to income ratio (%) Revenue per FTE ($’000)
Core earnings ($m) Cash earnings ($m)
Loans ($bn) and customer deposit to loan ratio (%)
3,560
3,776
3,970 4,051
1H15 2H15 1H16 2H16
2,025
2,1982,333
2,418
1H15 2H15 1H16 2H16
1,240
1,3801,444
1,537
1H15 2H15 1H16 2H16
43.141.8
41.240.3
1H15 2H15 1H16 2H16
369404
439 444
1H15 2H15 1H16 2H16
311321
334345
51.7 52.4 52.1 52.4
Mar-15 Sep-15 Mar-16 Sep-16
Loans Customer deposit to loan ratio
CONSUMER BANK

| Westpac Group Full Year 2016 Presentation & Investor Discussion Pack
Business Bank delivered a solid FY16 result
96
Cash earnings ($m)
Key operating metrics
AIEA up 2%, margin down 1bp, pricing changes to
business lending was offset by increased funding costs and lower deposit spreads
Key financial metrics
2H15 1H16 2H16Change on 1H16
Revenue ($m) 2,443 2,512 2,551 2%
Net interest margin (%) 2.74 2.75 2.74 (1bp)
Expense to income (%) 36.0 35.7 35.3 (39bps)
Customer deposit to loan ratio (%) 69.5 71.2 72.1 92bps
Stressed assets to TCE (%) 2.20 2.13 2.24 11bps
2H15 1H16 2H16Change on 1H16
Total business customers (‘000’s) 986 1,019 1,043 2%
Customer satisfaction1 (rank) #2 =#2 #1 Up 1
Customer satisfaction - SME1 (rank) =#1 #2 #1 Up 1
Digital sales (%) 6 9 9 -
Loans via LOLA ($m) 253 336 729 117%
962
988 1,011
33 6 (4) (2) (10)
2H15
1H16
Net
inte
rest
inco
me
Non
-inte
rest
inco
me
Ope
ratin
gex
pens
es
Impa
irmen
tch
arge
s
Tax
and
NC
I
2H16
Up $23m or 2%
Rise in facility fees
Higher business lending charges
offset by lower Auto finance charge
Increased investment
1 Refer slide 89 for metric definition and details of provider.
BUSINESS BANK

| Westpac Group Full Year 2016 Presentation & Investor Discussion Pack
Sound fundamentals, trending positively
97
141 146 149 153
72.569.5 71.2 72.1
Mar-15 Sep-15 Mar-16 Sep-16
Loans Customer deposit to loan ratio
2,392 2,443
2,512 2,551
1H15 2H15 1H16 2H16
Revenue ($m)
Expense to income ratio (%) Revenue per FTE ($’000)
Core earnings ($m) Cash earnings ($m)
Loans ($bn) and customer deposit to loan ratio (%)
1,541 1,563 1,616 1,651
1H15 2H15 1H16 2H16
1,017
962 988
1,011
1H15 2H15 1H16 2H16
35.6 36.0 35.7
35.3
1H15 2H15 1H16 2H16
725
792
822 814
1H15 2H15 1H16 2H16
BUSINESS BANK

| Westpac Group Full Year 2016 Presentation & Investor Discussion Pack
BTFG franchise, impacted by challenging environment
98
Cash earnings movement FY15 ─ FY16 ($m)
Key operating metrics
Key financial metrics
36 4
(24)
(39) (58)
(4) (1)
914
890
48
876
FY15
BTI
M p
artia
l sal
e
FY15
exc
ludi
ng B
TIM
impa
ct
Fund
s M
gt U
nder
lyin
g
FX im
pact
s on
Fun
ds M
gt
Insu
ranc
e in
com
e
Cap
ital &
oth
er in
com
e
Exp
ense
s
Impa
irmen
t cha
rge
Tax
and
NC
I
FY16
Down $14m or 2%
Increased lending and improved
margins in Private Wealth
FX impactsAscalon
Higher premiums and lower weather related claims paid
Increased investment and higher regulatory and compliance costs
FY14 FY15 FY16Change on
FY15
Revenue ($m) 2,663 2,637 2,406 (9%)
Expense to income (%) 49.7 48.8 48.2 (56bps)
FUM ($bn) ex BTIM (spot) 43.2 46.3 48.4 5%
FUA ($bn) (spot) 112.7 121.9 130.8 7%
Revenue impact of partial sale of BTIM ($m) 381 280 0 (100%)
1 Refer slide 131 for wealth metrics provider. 2 Spot number as at balance date. 3 Strategic Insight, All Master Funds Admin as at June 2016 (for 2H16), as at December 2015 (for 1H16) and as at June 2015 (for 2H15) and represents the BT Wealth business market share at these times. 4 Strategic Insight (Individual Risk) rolling 12 month average. New sales includes sales, premium re-rates, age and CPI indexation June2016. 5 Internally calculated from APRA quarterly general insurance performance statistics, June 2016.
2H15 1H16 2H16Change on 1H16
Customers with a wealth product1 (%) 19.7 19.2 19.1 (10bps)
Planners (salaried & aligned)2 (#) 1,192 1,116 1,134 2%
BT Super for Life customers (#’000) 482 489 506 3%
Platform market share3 (inc. Corp Super) (%) 19.9 19.6 19.0 (60bps)
Retail market share3 (exc. cash) (%) 18.9 18.6 18.0 (60bps)
Life Insurance market share4 (%) 11.3 10.9 11.0 10bps
H&C insurance market share5 (%) 5.7 5.7 5.7 -
Women in leadership2 (%) 44 42.1 45.0 290bps

| Westpac Group Full Year 2016 Presentation & Investor Discussion Pack
Funds management, positive flows impacted by FX movements
99
1 J O Hambro Capital Management.
Earning drivers FUA ($bn)
FUM ($bn) FUA by asset class (%)
91.7 101.5 98.7 100.1 106.5
18.120.1 19.3 19.6 20.52.9
3.4 3.9 3.63.8
2H14 1H15 2H15 1H16 2H16
BT Wrap/Asgard/Panorama Corporate Super Other
Up 7%
121.9 123.3 130.8
• Significant growth in Private Wealth• Advice income lower from reduced activity• FX movements from revaluation of Ascalon seed pool funds have also
reduced revenue• FUM related revenue was flat to FY15
– Positive net flows in BT Super for Life retail FUM up 13% to $6.5bn– FUM margins down 1bp from shift in portfolio mix and competition
• FUA related revenue up 2% on FY15– Panorama had positive flows of $1.3bn – BT Wrap/Asgard platforms FUA up 8% – FUA margins were well managed, flat on FY15
25.2 28.8 28.0 28.6 30.118.0 19.8 18.3 17.8 18.318.1 19.627.7
35.189.0
103.3
46.3 46.4 48.4
2H14 1H15 2H15 1H16 2H16
Advance Retail Super/other BTIM (exc JOHCM ) JOHCM
Deconsolidation of BTIM
1
39 39 37 36 36
19 19 20 20 195 4 4 6 619 18 19 18 18
12 12 13 13 126 8 7 7 9
2H14 1H15 2H15 1H16 2H16
Equities Aust. Equities Intl. PropertyCash Fixed interest Other inc. diversified
112.7125
1

| Westpac Group Full Year 2016 Presentation & Investor Discussion Pack
Insurance, premium growth continues
100
1 Strategic Insight June 2016.
Insurance premiums ($m) Insurance claims rates (%)
Life Insurance individual new sales market share1 (%) Life Insurance lapse rates1 (%)
246 246 245 258
827 892 927 973
1H15 2H15 1H16 2H16
General Insurance gross written premiums Life in-force premiumsUp 9%
62
51 50 49
34 33 34 38
1H15 2H15 1H16 2H16
General Insurance claims rate Life Insurance claims rates
5
10
15
20
Jun-11 Jun-12 Jun-13 Jun-14 Jun-15 Jun-16
WBC Peer1 Peer2 Avg next top 4
Up 5%
10
15
20
Jun-11 Jun-12 Jun-13 Jun-14 Jun-15 Jun-16
WBC Peer 1 Peer 2 Market Avg

| Westpac Group Full Year 2016 Presentation & Investor Discussion Pack
WIB 2H16 cash earnings rose as impairment charges fell
101
Cash earnings ($m)
Operating metrics
Financial metrics
2H15 1H16 2H16Change on 1H16
Revenue ($m) 1,650 1,599 1,499 (6%)
Net interest margin (%) 1.78 1.71 1.75 4bps
Expense to income (%) 41.2 41.8 45.2 339bps
Customer deposit to loan ratio (%) 105.2 110.6 119.8 large
Stressed assets to TCE (bps) 78 77 88 11bps
2H15 1H16 2H16Change on 1H16
Customer revenue1 / total revenue (%) 81 82 82 (11bps)
Trading revenue / total revenue (%) 7 9 6 (286bps)
Revenue per average FTE ($’000) 552 571 553 (3%)
Transactional banking relationships (#) 873 887 900 13
Deposits ($bn) 80.3 83.4 88.4 6%
Loans ($bn) 76.3 75.4 73.8 (2%)
690
517 (6) (94)
(9)
179 (6) 581
2H15
1H16
Net
inte
rest
inco
me
Non
-inte
rest
inco
me
Exp
ense
s
Impa
irmen
t cha
rges
Tax
and
NC
I
2H16
No repeat of large single name impairments (occurring1H16)
Lower fee and trading income, partly offset by
higher Hastings fees
Up $64m or 12%
1 WIB customer revenue is lending revenue, deposit revenue, sales and fee income. Excludes trading, derivative valuation adjustments and Hastings.
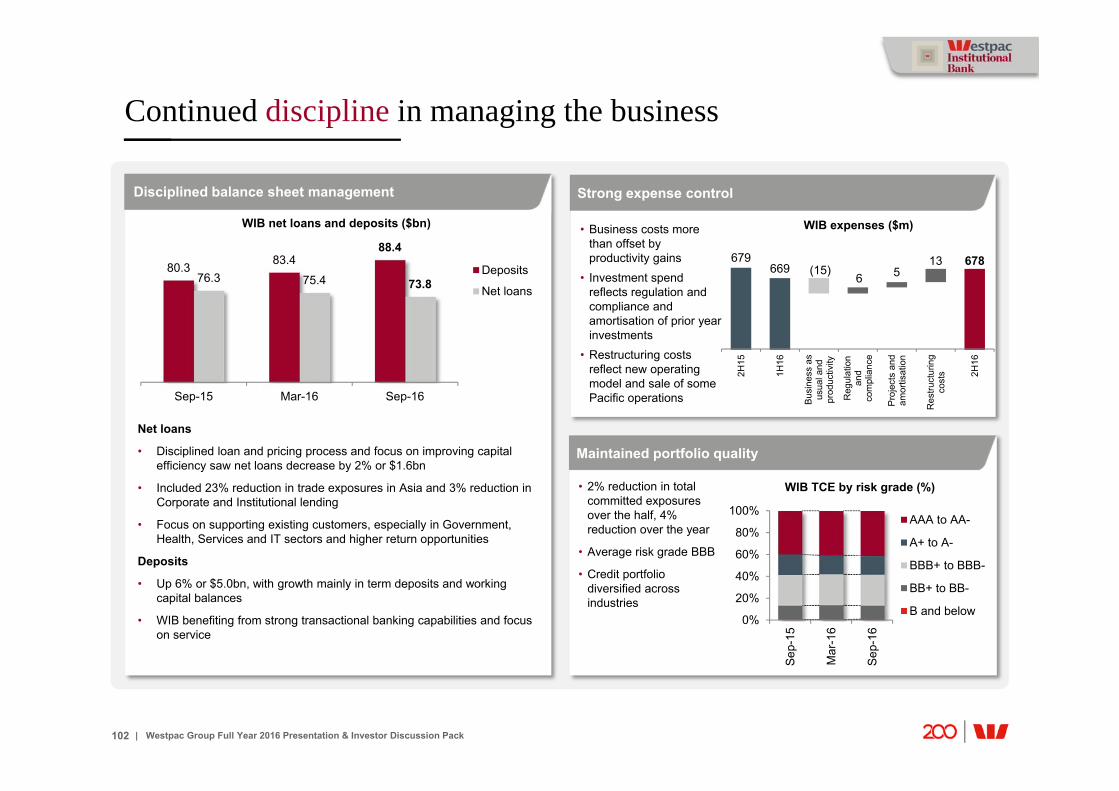
| Westpac Group Full Year 2016 Presentation & Investor Discussion Pack
Continued discipline in managing the business
102
Strong expense control
WIB expenses ($m)
Disciplined balance sheet management
WIB net loans and deposits ($bn)
679669 (15)
6 513 678
2H15
1H16
Bus
ines
s as
usua
l and
prod
uctiv
ity
Reg
ulat
ion
and
com
plia
nce
Pro
ject
s an
dam
ortis
atio
n
Res
truct
urin
gco
sts 2H
16
Maintained portfolio quality
Net loans
• Disciplined loan and pricing process and focus on improving capital efficiency saw net loans decrease by 2% or $1.6bn
• Included 23% reduction in trade exposures in Asia and 3% reduction in Corporate and Institutional lending
• Focus on supporting existing customers, especially in Government, Health, Services and IT sectors and higher return opportunities
Deposits
• Up 6% or $5.0bn, with growth mainly in term deposits and working capital balances
• WIB benefiting from strong transactional banking capabilities and focus on service
• Business costs more than offset by productivity gains
• Investment spend reflects regulation and compliance and amortisation of prior year investments
• Restructuring costs reflect new operating model and sale of some Pacific operations
WIB TCE by risk grade (%)• 2% reduction in total committed exposures over the half, 4% reduction over the year
• Average risk grade BBB
• Credit portfolio diversified across industries
80.3 83.488.4
76.3 75.4 73.8
Sep-15 Mar-16 Sep-16
Deposits
Net loans
0%
20%
40%
60%
80%
100%
Sep-
15
Mar
-16
Sep-
16
AAA to AA-
A+ to A-
BBB+ to BBB-
BB+ to BB-
B and below

| Westpac Group Full Year 2016 Presentation & Investor Discussion Pack
Consistent focus on customer service and innovation
103
Focus on innovation, service and digitisation…
1 WIB customer revenue is lending revenue, deposit revenue, sales and fee income. Excludes trading, derivative valuation adjustments and Hastings. 2 Euromoney FX Survey 2016. Qualitative ranking from 3,435 industry votes. 3 FinanceAsia Achievement Awards 2012, 2013, 2014, 2015 - Australia and New Zealand. 4 The Asset Triple A Treasury, Trade and Risk Management Award 2016. 5 Project finance deal of the year/Best power deal, Australia - acquisition of TransGrid by NSW Electricity Networks - joint mandated lead arranger. Awarded by The Asset Triple A Asia Infrastructure Awards 2016.
• Introduced Digital Client Forms
− 45% reduction in turn-around-times to identify and verify new entities for AML/KYC purposes from 20 days to 11 days
• Launched UnionPay as a payment channel in QuickStream and PayWay
− UnionPay provides bank card services and major card schemes in China
• Implemented BT and Asgard onto the QuickSuper clearing house
− 65% of BT’s employer customers now on the new platform
• Piloted LanternPay
− Facilitates payments through the National Disability Insurance Scheme
• Delivered keystroke automation
− Reduced the end-to-end transaction account opening process
• Expansion of financial markets products available via online banking platforms and simplified access to services, including access to pricing via online banking
• Commercialised WIB’s data analytics capability
Mee
ting
cust
omer
s’ of
fsho
re n
eeds
WIB complements its core franchise in Australia and New Zealand with a presence in key global centres to meet customer needs
Inno
vatio
n, S
ervi
ce a
nd D
igiti
satio
n
… driving Australasia’s leading Institutional Bank
• Delivering better service− Creation of a global client
experience team− Sales coverage aligned to customer
needs− Dedicated industry analytics and
insights team− Better alignment to industry sectors− Increased digitisation
• Improved efficiency, with the reduction of around 100 roles
New
ope
ratin
g m
odel
93% of the ASX Top 100 bank with WIB
82% of WIB revenue from customer business1
900transactional banking relationships
No.1globally for consistent pricing/liquidity in spot/forward: Voice trading2
BestDebt Finance House, Australia last 4 years3
BestE-Solutions Partner Bank Australia4
2,800+ customers across a diversified portfolio
Bestpower deal / project finance deal of the year, Australia5

| Westpac Group Full Year 2016 Presentation & Investor Discussion Pack
Maintaining asset quality in the Institutional Bank
104
Stressed exposures as a % of TCE1
0.1 0.20.7 0.9 0.7 0.6 0.4 0.2 0.1 0.4 0.3
0.7 0.8
3.63.5
1.81.4
0.70.7 0.7 0.4 0.6
0.8 1.0
4.34.6
2.62.1
1.20.9 0.8 0.8 0.9
FY07 FY08 FY09 FY10 FY11 FY12 FY13 FY14 FY15 1H16 2H16
Impaired
90+ days past due and not impaired
Watchlist & substandard
.
Impairments (charges) / benefits ($m)
(37) (54)
(328)
(48)
54 58 41 416 11
109
8 23 15
(178)
1
1H15 2H15 1H16 2H16 1H15 2H15 1H16 2H16 1H15 2H15 1H16 2H16 1H15 2H15 1H16 2H16
New IAPs Write-backs and recoveries Change in CAP Total impairment benefit / (charge)
2H15 1H16 2H16
Impairment provisions to impaired assets (%) 45.0 46.1 46.8
Collectively assessed provisions to credit RWA (bps)
46 35 36
WIB coverage ratios
1 Prior periods have not been restated for changes in the WIB loan portfolio.
11bps rise in stress driven by a small number of
exposures

| Westpac Group Full Year 2016 Presentation & Investor Discussion Pack
Core earnings up 3%, margins excl. Treasury flat
105
1 Refer slide 131 for metric definition.
Key operating metrics
468
445
427
28
4
(4) (5)(41)
2H15
1H16
Net
inte
rest
inco
me
Non
-inte
rest
inco
me
Ope
ratin
gex
pens
es
Impa
irmen
tch
arge
s
Tax
and
NC
I
2H16
Down $18m or 4%
2H15 1H16 2H16Change on 1H16
Revenue (NZ$m) 1,106 1,082 1,106 2%
Net interest margin (%) 2.27 2.15 2.11 (4bps)
Net interest margin excl. Treasury (%) 2.45 2.35 2.36 1bp
Expense to income (%) 40.5 42.2 41.8 (47bps)
Customer deposit to loan ratio (%) 75.2 76.6 76.6 (1bp)
Stressed assets to TCE (%) 1.60 1.78 2.54 76bps
Cash earnings (NZ$m)
AIEA up 6% partly offset by margin, down 4bps driven by
reduced Treasury income. Margins, excl. Treasury, in
2H16 up 1bp
Key financial metrics
2H15 1H16 2H16Change on 1H16
Customers (#m) 1.34 1.35 1.35 -
Customers with a wealth product1(%) 28.1 28.3 28.4 6bps
FUM (NZ$bn) 6.5 7.0 7.5 7%
FUA (NZ$bn) 2.0 2.0 2.0 -
Service quality - complaints (‘000’s) 14.7 13.4 13.2 (2%)
Credit card and wealth income growth offset by
higher return on an investment in 1H16
Increased investment in digital and costs of business transformation program
NEW ZEALAND
Driven by increased dairy provisioning

| Westpac Group Full Year 2016 Presentation & Investor Discussion Pack
Maintaining sound results
106
Core earnings (NZ$m) Cash earnings (NZ$m)
Expense to income ratio (%) Revenue per FTE (NZ$’000) Loans (NZ$bn) and customer deposit to loan ratio (%)
1,058 1,106
1,082 1,106
1H15 2H15 1H16 2H16
634658
625 644
1H15 2H15 1H16 2H16
437468
445427
1H15 2H15 1H16 2H16
40.1 40.5
42.2 41.8
1H15 2H15 1H16 2H16
241251
257 260
1H15 2H15 1H16 2H16
67 69 72 75
77.3 75.2 76.6 76.6
Mar-15 Sep-15 Mar-16 Sep-16
Loans Customer deposit to loan ratio
Revenue (NZ$m)
NEW ZEALAND

| Westpac Group Full Year 2016 Presentation & Investor Discussion Pack
Increase in stress reflects review of dairy exposures
107
1 Large reduction in stressed exposures from Sep 2011 to Sep 2012 due primarily to transfer of WIB assets during 2012. 2 Included impaired exposures.
Agribusiness portfolio Total provisions to gross loans (bps)
Business stressed exposures as a % of New Zealand business TCE
1
Sep-15 Mar-16 Sep-16
TCE (NZ$bn) 7.8 8.1 8.6
Agriculture as a % of total TCE 7.9 7.9 8.1
% of portfolio graded as ‘stressed’2 3.9 7.8 18.6
% of portfolio in impaired 0.34 0.32 0.42
Key messages
NEW ZEALAND
• 2H16 dairy file review, using milk price of NZ$4.25 saw more customers classified as watchlist and substandard
• Portfolio will benefit from recent milk price rise which has boosted confidence and lifted forecast payouts
• Focus on supporting existing customers with proven long term financial viability
60 57 58
2H15 1H16 2H16
0.5 1.4 2.6 3.4 2.2 1.5 0.8 0.9 1.1 0.8 0.7 0.50.1
0.40.2 0.3
0.2 0.10.1 0.1 0.0 0.2 0.1 0.1
7.1
14.4 12.89.6
4.43.2
2.9 2.3 2.3 2.4 2.95.0
7.7
16.215.6
13.2
6.8
4.93.8 3.3 3.6 3.4 3.7
5.5
Sep-08 Sep-09 Sep-10 Sep-11 Sep-12 Sep-13 Mar-14 Sep-14 Mar-15 Sep-15 Mar-16 Sep-16
Watchlist & substandard
90+ day past due not impaired
Impaired 9 6
63
43
16
Property
Manufacturing
Agriculture,forestry & fishingWholesale trade
Construction
Other

| Westpac Group Full Year 2016 Presentation & Investor Discussion Pack
Consumer asset quality in good shape
108
169
5
39 50
(1)
(2)
2H15 1H16 New IAPS Write-backand recoveries
CAP changesand other
Write-offs 2H16
1 LVR based on current loan balance and latest assessment of property value.
Movement in impairment charges (NZ$m) Unsecured consumer 90+ day delinquencies (%)
Mortgage portfolio LVR1 (%) of portfolio Mortgage 90+ day delinquencies (%) Mortgage loss rates each half (%)
NEW ZEALAND
0.48
0.0
0.5
1.0
1.5
Mar
-10
Sep
-10
Mar
-11
Sep
-11
Mar
-12
Sep
-12
Mar
-13
Sep
-13
Mar
-14
Sep
-14
Mar
-15
Sep
-15
Mar
-16
Sep
-16
0.10 0.0
0.5
1.0
Mar
-10
Sep-
10M
ar-1
1Se
p-11
Mar
-12
Sep-
12M
ar-1
3Se
p-13
Mar
-14
Sep-
14M
ar-1
5Se
p-15
Mar
-16
Sep-
16
Up $41m
45%
19%22%
11%
2% 2%
0<=60 60<=70 70<=80 80<=90 90<=95 95+
86% of mortgage portfolio less than 80% LVR
0.02
0.00
0.05
0.10
0.15
0.20
0.25
1H09
2H09
1H10
2H10
1H11
2H11
1H12
2H12
1H13
2H13
1H14
2H14
1H15
2H15
1H16
2H16
Up 2% in FY16 (FY15: 84%)

Westpac Banking Corporation ABN 33 007 457 141.
Economics

| Westpac Group Full Year 2016 Presentation & Investor Discussion Pack
Australia’s economy is diversified and flexible
Australian housing sector: geographic differences
SnapshotMore than mining, the Australian economy is diverse and flexible
110
Sources: ABS, Westpac Economics. 1 Excludes ownership of dwellings and taxes less subsidies.
117
9
8
10613
6
10
13
24
MiningManufacturingConstructionTransport, UtilitiesWholesale, RetailHousehold servicesEducation & HealthGovernmentFinanceProperty, Business servicesRuralCommunications
Sources: ABS, CoreLogic, APM, Residex, Westpac Economics.
Sector contribution to GDP (%)1
2
79
6
14
1313
8
6
4 153
MiningManufacturingConstructionTransport, UtilitiesWholesale, RetailHousehold servicesHealth, Social AssistanceEducationPublic AdministrationFinanceBusiness servicesAgriculture
Australian employment by sector 2015/16 (%)
-20
-10
0
10
20
30
40
Oct-10 Oct-11 Oct-12 Oct-13 Oct-14 Oct-15 Oct-16
%
Sydney Melbourne Brisbane Perth
House price growth rates (%)6mth annualised growth rates, all dwellings, composite of all measures, seasonally adjusted
Australian economy key statistics(latest available as at 2 November 2016)
GDP 3.3%Westpac Forecast(end 2017) 3.3%
5.6%
Westpac Forecast(end 2017) 5.8%
Inflation 1.3%Westpac Forecast(end 2017) 1.7%
Cash Rate 1.50%Westpac Forecast(June 2018) 1.50%
AUD/USD US$0.76Westpac Forecast(June 2018) US$0.68
UnemploymentRate
Sources: RBA, ABS, Westpac Economics.

| Westpac Group Full Year 2016 Presentation & Investor Discussion Pack
Australian and New Zealand economic forecasts
111
1 Source: Westpac Economics. 2 GDP and component forecasts updated following the release of quarterly national accounts. 3 Business investment adjusted to exclude the effect of private sector purchases of public assets.
Key economic indicators1 (%) as at October 2016Calendar year
2014 2015 2016f 2017f
World GDP 3.4 3.1 3.2 3.4
Australia GDP 2.7 2.4 2.9 3.0
Private consumption 2.8 2.8 2.7 3.0
Business investment2,3 -4.2 -9.2 -9.2 -4.5
Unemployment – end period 6.2 5.8 5.5 5.7
CPI headline – year end 1.7 1.7 1.5 1.7
Interest rates – cash rate 2.50 2.00 1.50 1.50
Credit growth, Total – year end 5.8 6.6 5.4 5.5
Credit growth, Housing – year end 7.0 7.4 6.4 5.7
Credit growth, Business – year end 4.7 6.4 4.5 5.5
New Zealand GDP 3.8 2.5 3.6 3.4
Unemployment – end period 5.5 5.0 5.1 4.6
Consumer prices 0.8 0.1 1.0 1.7
Interest rates – official cash rate 3.50 2.50 1.75 1.75
Credit growth – Total 4.6 6.2 7.5 6.6
Credit growth – Housing 5.1 6.0 8.6 8.1
Credit growth – Business 3.7 6.7 6.5 4.8

| Westpac Group Full Year 2016 Presentation & Investor Discussion Pack
Australian economy outlook sound, though some soft spots
112
Economy continues to grow
Sources: RBA, Westpac Economics.
% growth, year-ended
Sources: ABS, Westpac Economics.
Real GDP growth (%)
Income shock starting to ease
0
2
4
6
Sep-08 Sep-10 Sep-12 Sep-14 Sep-16
%
0
1
2
3
4
5
Jun-08 Jun-10 Jun-12 Jun-14 Jun-16
Non-mining economy advancing
Sources: ABS, Westpac Economics.
AUD close to post float average
-200-100
0100200300400500600700
Jun-09 Jun-11 Jun-13 Jun-15
Household servicesBusiness servicesMiningConstructionGoods distributionManufacturing
‘000
Source: ABS, Westpac Economics
0.400.500.600.700.800.901.001.101.20
Sep-08 Sep-10 Sep-12 Sep-14 Sep-16
F’casts
Australian unemployment rate (%)
AUD/USD actual & forecast
AUD/USD average post float
= 0.76
Employment (# ’000)
Sources: ABS, Westpac Economics.
-2
0
2
4
6
8
10
12
-40
-30
-20
-10
0
10
20
30
Jun-92 Jun-96 Jun-00 Jun-04 Jun-08 Jun-12 Jun-16
% ann% annTerms of trade (lhs)National income, nominal GDP (rhs)
period avg: 5.6% yr
Terms of trade and National incomes (%)
Westpac forecasts

| Westpac Group Full Year 2016 Presentation & Investor Discussion Pack
Service exports performing strongly, supported by ‘consumer’ China
113
02468
101214161820
Jun-92 Jun-98 Jun-04 Jun-10 Jun-16
$bnEducation
Leisure travel
Businessservices1
Transportation
Businesstravel
Rolling annual, nominal
International arrivals in Australia (millions)
Sources: ABS, Westpac Economics
1 Includes legal & professional services, financial services , IT & Telecommunications, Intellectual property rights and other.
Education
Business services
Service exports ($bn)• International trade in services is contributing to the rebalancing of growth in Australia
• Service exports represent 4% of GDP and given the labour intensive nature of these activities, have a significant spill-over effect
• Service exports 3-year growth is the fastest since 2001, boosted by the lower Australian dollar and supported by consumer demand from China
• NSW and Victoria are benefitting, attracting international visitors and foreign students
• NSW accounts for 42% of total service exports, 10ppts above its share of the national economy
0
20
40
60
80
100
120
140
160
0
20
40
60
80
100
120
140
160
2002 2004 2006 2008 2010 2012 20142016#
’000’000 Commencements, Australian universities
Total
China
India
Sources: AEI.gov.au, Westpac Economics
# 2016, preliminary
0.0
0.2
0.4
0.6
0.8
1.0
1.2
1.4
1.6
Jun-86 Jun-94 Jun-02 Jun-10
Financial services
Professionalservices
$bn
0.0
0.2
0.4
0.6
0.8
1.0
1.2
1.4
1.6
Jun-86 Jun-94 Jun-02 Jun-10
IT & telecommunications
Technical services
$bn
Sources: ABS, Westpac Economics Sources: ABS, Westpac Economics
0.0
0.5
1.0
1.5
2.0
2.5
3.0
0.0
0.5
1.0
1.5
2.0
2.5
3.0
1992 1996 2000 2004 2008 2012 2016 2020
mnmn
Asia, ex-China
Annual arrivals, financial years
Europe
ChinaNZ
USOther
2015/16: +18% vs 2 years ago

| Westpac Group Full Year 2016 Presentation & Investor Discussion Pack
Australian labour market Widening of employment gains to more sectors
114
Sources: ABS, Westpac Economics.
Australia: employment by sector (annual change, ’000)
Sources: ABS, Westpac Economics.
117
9
8
10613
6
10
13
24
MiningManufacturingConstructionTransport, UtilitiesWholesale, RetailHousehold servicesEducation & HealthGovernmentFinanceProperty, Business servicesRuralCommunications
Sector contribution to GDP (%)1
2 79
6
14
1313
8
6
4
153
MiningManufacturingConstructionTransport, UtilitiesWholesale, RetailHousehold servicesHealth, Social AssistanceEducationPublic AdministrationFinanceBusiness servicesAgriculture
Australian employment by sector 2015/16 (%)
Australia: more than just mining
-50 -25 0 25 50 75 100 125 150
Manufacturing
Mining
Utilities
Wholesale & transp.
Retail
Agriculture
Business services
Government
Finance & real estate
Construction
Leisure & hospitality
Health & education
change in employment*
Q3 2015
Q3 2016
*6mth avg level compared to 6mth avg level a year ago
1 Excludes ownership of dwellings and taxes less subsidies.

| Westpac Group Full Year 2016 Presentation & Investor Discussion Pack
NSW and Victoria performing strongly; weakness in WA
115
Australian population by State (#m)
Sources: ABS, Westpac Economics
7.7
6.0
4.8
2.61.7
0.5 0.4 0.2012345678
NSW(32%)
Vic (25%) Qld (20%)WA (11%) SA (7%) Tas ACT NT
mn• Total population: 24.1 million (Mar 2016)• 57% of the population live in 2 states –
NSW and Victoria
Domestic final demand (% ann)
Sources: ABS, Westpac Economics
-1.7
-3.7
1.3 1.6 2.13.6 3.4
-7.3
0.41.3 1.7 1.9
3.8 3.5
-8
-6
-4
-2
0
2
4
6
WA Qld Aus SA Tas NSW Vic
% ann Jun-15 yr Jun-16 yr
Sources: ABS, Westpac Economics
96
100
104
108
112
116
Sep-10 Sep-12 Sep-14 Sep-16
WA (11%)Qld (20%)SA (7%)
index
96
100
104
108
112
116
Sep-10 Sep-12 Sep-14 Sep-16
Vic (25%)NSW (32%)Tas (2%)
index Dec ’09 = 100
State jobs markets (index, share of total employment)
44
75
27
47
2428
1419
39
0.2 10
10
20
30
40
50
60
70
80
0
10
20
30
40
50
60
70
80
NSW Vic Qld WA SA Tas
$bn $bnPossibleUnder considerationDefinite
2013 Q1* vs 2016 Q2
Public transport project pipeline ($bn)
* 2013 Q1 was the low point
Sources: Deloitte Access Economics, Westpac Economics

| Westpac Group Full Year 2016 Presentation & Investor Discussion Pack
Australian state economies
116
NSWPOPULATION7.7 millionSIZE OF ECONOMY31% of Australian GDPGROWTH3.4% forecast for 2015/163.3% forecast for 2016/17HOUSE PRICESSydney dwelling prices up 9.7%yr to October 2016
QLDPOPULATION4.8 millionSIZE OF ECONOMY19% of Australian GDPGROWTH2.5% forecast for 2015/16 4.0% forecast for 2016/17HOUSE PRICESBrisbane dwelling prices up 4.1%yr to October 2016
VICPOPULATION6.0 millionSIZE OF ECONOMY22% of Australian GDPGROWTH3.7% forecast for 2015/163.2% forecast for 2016/17HOUSE PRICESMelbourne dwelling prices up 8.3%yr to October 2016
WAPOPULATION2.6 millionSIZE OF ECONOMY17% of Australian GDPGROWTH1.0% forecast for 2015/16 1.1% forecast for 2016/17HOUSE PRICESPerth dwelling prices down 4.4%yr to October 2016
SAPOPULATION1.7 millionSIZE OF ECONOMY6% of Australian GDPGROWTH2.5% forecast for 2015/16 2.0% forecast for 2016/17HOUSE PRICESAdelaide dwelling prices up 1.6%yr to October 2016
Sources: ABS, CoreLogic, Westpac Economics

| Westpac Group Full Year 2016 Presentation & Investor Discussion Pack
Credit growth expanding at a modest pace
117
Sources: Westpac MI, NAB, Westpac Economics.
-40
-30
-20
-10
0
10
20
30
60
70
80
90
100
110
120
130
Sep-04 Sep-08 Sep-12 Sep-16
Consumer (lhs) Business * (rhs)
monthly
* rebased to avg 0
Business confidence and consumer confidence (net balance)
-10
-5
0
5
10
15
20
25
(10)
(5)
5
10
15
20
25
Sep-92 Sep-96 Sep-00 Sep-04 Sep-08 Sep-12 Sep-16
Housing Total credit Business
Forecastsend 2017
Australian private sector credit growth (% ann)
Sources: RBA, Westpac Economics.
% annual % annual
• Consumer sentiment has broadly improved over the last year but has been choppy month to month. Most recently sentiment has lifted following the RBA’s May and August rate cuts
• Heightened job loss fears have been a recurring consumer theme in recent years but have also shown some signs of improvement
• Business confidence is at around historic averages, supported by improved business conditions Actual business conditions have lifted to above average readings as the non-mining economy strengthens, responding to lower rates and a lower dollar
• Credit grew by 5.4% in the year to September 2016, moderating from 6.6% at end 2015 as housing cooled following tighter lending conditions in 2015 and due to a soft spot in business ahead of the July Federal election. Over the past three months, credit grew 4.7% annualised
• Credit growth is expected to grow at around 5.5% in the year to Dec 2017, similar to that achieved in 2016. In terms of composition, housing credit growth is expected to moderate as regulatory constraints limit investor credit growth, while business credit growth is expected to be a little higher than in 2016.

| Westpac Group Full Year 2016 Presentation & Investor Discussion Pack
Australia’s high rise apartment market
118
• Construction in Australia has responded to low rates and the end of the mining boom
• A pick-up in apartment construction in recent years will see a large number of completions in 2016 and 2017
• Inner-city Melbourne is forecast to have the largest number of completions (around 16,000) over the next two years, followed by Brisbane (12,000) and Sydney (10,000)1
• New completions will start to address the large structural deficit in Australian housing that accumulated over the past decade, driven by strong migration-led population growth and low levels of building during the mining boom
• Market-wide oversupply not likely but pockets of oversupply may emerge over the short to medium term as new supply is absorbed
Sources: ABS, Westpac Economics. Sources: REIA, Westpac Economics.
Population versus dwelling stock (annual average change ‘000)
0
50
100
150
200
250
300
350
400
0
50
100
150
200
250
300
350
400
1950s 1960s 1970s 1980s 1990s 2000s last 6yrs
next4yrs#
Population New 'high rise' apartments^ Total dwelling stock^
*Average annual change
^Net of demolitions – implied by Census data; ‘high rise’ is completions only;
#Westpac estimates
Dwelling construction: indicative completion times2
0102030405060708090100
0102030405060708090
100
0 12 24 36 48 60
%%
detached houseslow-mid risehigh rise
1 Source: RBA, CoreLogic. 2 Estimated proportion of approved dwellings completed by months after approval. Note that not all approved dwellings are completed, reflecting both cancellations and reductions in project size. Also, ‘high rise’ projects often have significant delays between approval and commencement.
Average construction time for‘high rise’ about 2-2½yrs

| Westpac Group Full Year 2016 Presentation & Investor Discussion Pack
Australian housing market has sound fundamentals, Sector moderating
119
Sources: ABS, Westpac Economics.
Sources: REIA, Westpac Economics.
Population versus dwelling stock (annual average change ‘000)
New dwelling completions v population growth - NSW (#)
210 226 187
236 196
300 351
77 98 114 125 136 125 140
1950s 1960s 1970s 1980s 1990s 2000s last 6years
population dwelling stock** net of demolitions – implied by Census data; Westpac estimates
2.8
1.9
3.0
0
1
2
3
4
5
6
7
Sep-86 Sep-91 Sep-96 Sep-01 Sep-06 Sep-11 Sep-16
Australia Sydney Melbourne
investor housing
boom
Residential rental vacancy rates (%)
%
0
20,000
40,000
60,000
80,000
100,000
120,000
140,000
Jun-82 Jun-86 Jun-90 Jun-94 Jun-98 Jun-02 Jun-06 Jun-10 Jun-14
Population Completions
80
120
160
200
240
Aug-96 Aug-00 Aug-04 Aug-08 Aug-12 Aug-16
trend sa
Private approvals
long run avg: 160k
RBA easing cycles
Dwelling approvals: 2% off their peak (‘000 mth, annualised)
Sources: ABS, Westpac Economics.
Sources: RBA, Westpac Economics

| Westpac Group Full Year 2016 Presentation & Investor Discussion Pack
House price growth and activity Some moderation, geographic differences
120
1 Sources: ABS, CoreLogic, Westpac Economics. Sources: ABS, CoreLogic, APM, Residex, Westpac Economics.
Capital city dwelling prices – growth rates (%)
Sources: RBA, Westpac Economics.
Housing credit (6mnth % change annualised)
5.96.5
4.7048
12162024283236
Aug-02 Aug-04 Aug-06 Aug-08 Aug-10 Aug-12 Aug-14 Aug-16
Total
Owner-occupier
Investor
Sydney dwelling prices vs rest of Australia (ratio of weighted medians other major capital cities)
0.8
1.0
1.2
1.4
1.6
1.8
2.0
Sep-81 Sep-86 Sep-91 Sep-96 Sep-01 Sep-06 Sep-11 Sep-16
%
Sources: ABS, CoreLogic, APM, Residex, Westpac Economics.
-20
-10
0
10
20
30
Oct-10 Oct-11 Oct-12 Oct-13 Oct-14 Oct-15 Oct-16
%
Sydney Melbourne Brisbane Perth
* 6mth annualised growth rates, all dwellings, composite of all measures, seasonally adjusted
Capital city Population % Change Year on Year (Oct-16)
Average since 2007
Sydney 4.9m Up 9.7% Up 7.3%
Melbourne 4.9m Up 8.3% Up 6.2%
Brisbane 2.3m Up 4.1% Up 1.4%
Perth 2.0m Down 4.4% Down 0.2%
Adelaide 1.3m Up 1.6% Up 1.7%

| Westpac Group Full Year 2016 Presentation & Investor Discussion Pack
Investment property lending off highs
121
Sources: ABS, Westpac Economics.
0
5
10
15
20
Aug-96 Aug-01 Aug-06 Aug-11 Aug-16
'upgraders', ex-refinancing
investor finance
first home buyers
Investor housing yields vs shares, deposits (% p.a.)
Housing finance approvals: value of housing finance ($bn/mth)
$bn/mth
0
2
4
6
8
10
Mar-96 Mar-00 Mar-04 Mar-08 Mar-12 Mar-16
rental yield*ASX 200 dividend yield1yr term deposit
*gross yield, median rent on 2bdrm unit as % of median unit price
• Investor activity responded in 2014 and into 2015 to low vacancy rates, solid rental yields and returns compared to other asset classes, and low interest rates, including low fixed rates offering attractive opportunities to hedge interest rate risk
• Regulators moved in 2015 to contain growth in this sector with measures having a clear effect: investor credit growth slowed from 11.9% in November 2014 to 5.3% in November 2015 on a three month annualised basis1
• Total market turnover has fallen back to relatively low levels and is well below the both recent peaks and the extreme highs seen in 2002-03, when market activity was particularly strong (high turnover is often associated with greater speculative activity)
Sources: CoreLogic, REIA, RBA, Westpac Economics.
Dwelling turnover (quarterly # ‘000)
020406080
100120140160180200
Jun-96 Jun-00 Jun-04 Jun-08 Jun-12 Jun-16
estimated investor purchasesall dwellingsunitsFIRB approvals
Sources: CoreLogic, ABS, FIRB, Westpac Economics
1 Source: RBA

| Westpac Group Full Year 2016 Presentation & Investor Discussion Pack
Australian households A cautious approach to household finances
122
Sources: ABS, RBA, Westpac Economics.
Australian households: debt to income ratio (%)
Household savings rate (% income)
-20
30
80
130
180
Sep-82 Sep-87 Sep-92 Sep-97 Sep-02 Sep-07 Sep-12 Sep-17
total (gross) debttotal debt net of offset accountstotal debt net of all deposits*trend since Jun-07
* Westpac estimates prior to 1988
Consumer survey: ‘Wisest place for savings’
Sources: ABS, Westpac Economics.
Sources: Melbourne Institute, Westpac Economics.
0
10
20
30
40
50
60
70
0
10
20
30
40
50
60
70
Sep-98 Sep-01 Sep-04 Sep-07 Sep-10 Sep-13 Sep-16
%% sharesreal estatedepositspay down debt
6.8
-3
0
3
6
9
12
15
Jun-92 Jun-96 Jun-00 Jun-04 Jun-08 Jun-12 Jun-16
% income*annual national accounts estimates
debt net of all deposits also excludes funds held in mortgage offset accounts–23pts since peak
%
Sources: CoreLogic, Residex, Westpac Economics.
Housing affordability: all dwellings
10
15
20
25
30
35
40
Sep-81 Sep-86 Sep-91 Sep-96 Sep-01 Sep-06 Sep-11 Sep-16
estimates based on capital cities prior to 1993
% income required to service mortgage of 75% median dwelling, all regions
long run avg
deteriorate
improve
10yr avg
if mortgagerate was 1% higher
%

| Westpac Group Full Year 2016 Presentation & Investor Discussion Pack
New Zealand economy
123
123
GDP growth (%)
-4
-2
0
2
4
6
8
-4
-2
0
2
4
6
8
2000 2002 2004 2006 2008 2010 2012 2014 2016
Qtr % chg Annual average % change Westpac forecast
Source: Statistics NZ, Westpac Economics
Key economic statistics FY15 FY16f Change
GDP annual average growth 2.9% 3.2% 30 bps
Inflation rate 0.4% 0.2% (20 bps)
Official cash rate (OCR) 3.0% 2.0% (100 bps)
Unemployment rate 5.5% 4.9% (60 bps)
Dairy payout (ex dividend)1,2 $4.40 $3.90 ($0.50)
1 Westpac NZ Economics forecast (ex dividend), Fonterra forecast is $3.90/kg. 2 Seasons ended May.
Source: RBNZ, Westpac Economics
NZD/USD, NZD/AUD and TWI
New Zealand unemployment rate (%)
3
4
5
6
7
8
9
10
11
12
3
4
5
6
7
8
9
10
11
12
1990 1993 1996 1999 2002 2005 2008 2011 2014 2017
% %Westpac Forecast
4045505560657075808590
0.40
0.50
0.60
0.70
0.80
0.90
1.00
2003 2006 2009 2012 2015 2018
NZD/USDNZD/AUDTWI (right axis)
Westpac forecast
Source: Statistics NZ, Westpac Economics
Source: RBNZ, Westpac Economics

| Westpac Group Full Year 2016 Presentation & Investor Discussion Pack
New Zealand economyConditions are improving for the dairy sector
124
124
Dairy payout and dividend1
1 Westpac NZ Economics forecast (ex dividend), Fonterra forecast is $3.90/kg. 2 Seasons ended May.
Source: Fonterra, Westpac Economics
• Global dairy prices have improved significantly in recent months as fundamentals have shifted in favour of dairy producers
• The sustained period of lower prices has led to milk supply contracting in key dairy exporting regions including Europe, New Zealand and Australia
• In addition, there have been some signs of firmer demand, particularly out of China
• Consequently, Westpac Economics has upgraded our forecast of the farm gate milk price for this season to $5.80. However, while this is a significant improvement for farmers, it will take some time for farmers to repair their balance sheets following two seasons of very low prices, and the sector is likely to remain cautious for some time yet
• The New Zealand tourism sector continues to perform strongly. Visitor arrivals in September were up 13% on a year ago
Break-even dairy payout
Source: RBNZ, DairyNZ, Westpac, Fonterra
NZ export commodity price index (NZD)
Source: ANZ, Westpac
050100150200250300350400
050
100150200250300350400
Jan-00 Jan-02 Jan-04 Jan-06 Jan-08 Jan-10 Jan-12 Jan-14 Jan-16
Indexed to 100 Jan 2000
Indexed to 100 Jan 2000
Meat, Skins and Wool Dairy ProductsHorticultural Products Seafood
$0$1$2$3$4$5$6$7$8$9$10
$0$1$2$3$4$5$6$7$8$9
$10Kg MsKg Ms
DividendMilk price
Westpac forecast
$0$1$2$3$4$5$6$7$8$9$10
$0$1$2$3$4$5$6$7$8$9
$10
2002/03 2004/05 2006/07 2008/09 2010/11 2012/13 2014/15 2016/17
Kg MsKg Ms Break Even Effective Payout
Fonterra payout including dividend Forecast

| Westpac Group Full Year 2016 Presentation & Investor Discussion Pack
• House prices have been rising at a rapid pace, including strong growth in many regions outside of Auckland. This has been encouraged by record low interest rates. In addition, in parts of the country such as Auckland, housing supply has not kept up with population growth
• Increases in house prices have seen credit growth accelerating and household debt climbing to record levels. House prices appear overvalued compared to metrics such as price-to-rents and price-to-incomes. This has raised financial stability concerns. In response, the RBNZ recently tightened restrictions on mortgage lending further− For investors, 95% of loans must now have at least a 40% deposit− For owner occupiers, 90% of loans must now have at least a 20%
deposit• The tightening in lending restrictions has seen some moderation in house
price inflation. However, as with previous changes, the impact of these latest changes is expected to have only a temporary impact on prices
New Zealand economyHousing market trends prompt policy response
125
125
New Zealand house prices by region (index)
Sources: REINZ, Westpac Economics
80
100
120
140
160
180
200
220
80
100
120
140
160
180
200
220
Jan-07 Jan-09 Jan-11 Jan-13 Jan-15
WellingtonChristchurchOther Nth IslandOther Sth IslandAuckland
Inde
x =
100
in 2
007 Index = 100 in 2007
Household debt, share of disposable income (%)
3,000
4,000
5,000
6,000
7,000
8,000
9,000
10,000
2,000
3,000
4,000
5,000
6,000
7,000
2008 2009 2010 2011 2012 2013 2014 2015 2016
salesNZ$mMortgage approvals, value (left axis)
House sales, number (right axis)
Housing turnover
Sources: RBNZ, REINZSource: RBNZ
100
125
150
175
100
125
150
175
1999 2002 2005 2008 2011 2014
% %

Financial results based on cash earnings unless otherwise stated. Refer page 36 for definition. Results principally cover 1H16 and 2H15. Comparison of 1H16 versus 2H15 (unless otherwise stated)
Appendix & Disclaimer

| Westpac Group Full Year 2016 Presentation & Investor Discussion Pack
Appendix 1: Cash earnings adjustments
127
Cash earnings adjustment 2H15$m
1H16$m
2H16$m Description
Reported net profit 4,403 3,701 3,744 Net profit attributable to owners of Westpac Banking Corporation
Partial sale of BTIM (665) 0 0During Second Half 2015 the Group recognised a significant gain following the partial sale and deconsolidation of the Group’sshareholding in BT Investment Management. This gain has been treated as a cash earnings adjustment given its size and that it does not reflect ongoing operations
Capitalised technology cost balances 354 0 0
Following changes to the Group’s technology and digital strategy, rapid changes in technology and evolving regulatory requirements a number of accounting changes have been introduced, including moving to an accelerated amortisation methodology for most existingassets with a useful life of greater than three years, writing off the capitalised cost of regulatory program assets where the regulatory requirements have changed and directly expensing more project costs. The expense recognised in 2H15 to reduce the carrying valueof impacted assets has been treated as a cash earnings adjustment given its size and that it did not reflect ongoing operations
Amortisation of intangible assets 76 79 79
The merger with St.George, the acquisition of J O Hambro Capital Management and acquisition of Lloyds resulted in the recognition of identifiable intangible assets. The commencement of equity accounting for BTIM also resulted in the recognition of notional identifiable intangible assets within the investments in associate’s carrying value. The intangible assets recognised relate to core deposits, customer relationships, management contracts and distribution relationships. These intangible items are amortised over their useful lives, ranging between four and twenty years. The amortisation of these intangible assets (excluding capitalised software) is a cash earnings adjustment because it is a non-cash flow item and does not affect cash distributions available to shareholders
Acquisition transaction and integration expenses
31 7 8 Costs associated with the acquisition of Lloyds have been treated as a cash earnings adjustment as they do not reflect the earnings expected from the acquired businesses following the integration period
Lloyds tax adjustments (64) 0 0 Tax adjustments arising from the acquisition of Lloyds have been treated as a cash earnings adjustment in line with our treatment of Lloyds acquisition and integration costs
Fair value (gain)/loss on economic hedges (59) 83 120
Unrealised fair value (gain)/loss on economic hedges: FX hedges on future NZ earnings and accrual accounted term funding transactions are reversed as they may create a material timing difference on reported earnings in the current period, which does not affect cash earnings over the life of the hedge
Ineffective hedges 2 26 (35) The (gain)/loss on ineffective hedges is reversed in deriving cash earnings for the period because the gain or loss arising from the fair value movement in these hedges reverses over time and does not affect the Group’s profits over time
Treasury shares (36) 8 2Under AAS, Westpac shares held by the Group in the managed funds and life businesses are deemed to be Treasury shares and theresults of holding these shares are not permitted to be recognised as income in the reported results. In deriving cash earnings, these results are included to ensure there is no asymmetrical impact on the Group’s profits because the Treasury shares support policyholder liabilities and equity derivative transactions which are re-valued in determining income
Cash earnings 4,042 3,904 3,918

| Westpac Group Full Year 2016 Presentation & Investor Discussion Pack
Appendix 2: Definitions
128
BTFG
BT Financial Group (Australia) (BTFG) is the wealth management and insurance arm of the Westpac Group providing a broad range of associated services. BTFG’s funds management operations include the manufacturing and distribution of investment, superannuation, retirement products, wealth administration platforms, private banking, margin lending and equities broking. BTFG’s insurance business covers the manufacturing and distribution of life, general and lenders mortgage insurance. The division also uses third parties for the manufacture of certain general insurance products as well as actively reinsuring its risk using external providers across all insurance classes. BTFG operates a range of wealth, funds management (including Ascalon which is a boutique incubator of emerging fund managers), and financial advice brands and operates under the banking brands of Westpac, St.George, Bank of Melbourne and BankSA for Private Wealth and Insurance. BT Investment Management Limited (BTIM) is 29.5% owned by BTFG (following a partial sale in 2015) with the business being equity accounted from July 2015. BTFG works in an integrated way with all the Group’s Australian divisions in supporting the insurance and wealth needs of customers
Westpac NZ
Westpac New Zealand is responsible for sales and service of banking, wealth and insurance products for consumers, business and institutional customers in New Zealand. Westpac conducts its New Zealand banking business through two banks in New Zealand: Westpac New Zealand Limited, which is incorporated in New Zealand and Westpac Banking Corporation (New Zealand Branch), which is incorporated in Australia. Westpac New Zealand operates via an extensive network of branches and ATMs across both the North and South Islands. Business and institutional customers are also served through relationship and specialist product teams. Banking products are provided under the Westpac brand while insurance and wealth products are provided under Westpac Life and BT brands, respectively. New Zealand also has its own infrastructure, including technology, operations and treasury
Group Businesses or GBU
This segment provides centralised Group functions including Treasury,Technology and Core Support (finance, human resources etc.). Costs arepartially allocated to other divisions in the Group, with costs attributed toenterprise activity retained in Group Businesses. This segment also reflectsGroup items including: earnings on capital not allocated to divisions,earnings from non-core asset sales and certain other head office items suchas centrally raised provisions
Westpac’s divisions Westpac’s divisions
Consumer Bank
Consumer Bank (CB) is responsible for sales and service to consumer customers in Australia under the Westpac, St.George, BankSA, Bank of Melbourne and RAMS brands. Activities are conducted through a dedicated team of specialist consumer relationship managers along with an extensive network of branches, contact centres and ATMs. Customers are also supported by a range of internet and mobile banking solutions. CB also works in an integrated way with BTFG and WIB in the sales and service of select financial services and products including in wealth and foreign exchange. The revenue from these products is mostly retained by the product originators
Business Bank
Business Bank (BB) is responsible for sales and service to micro, SME and commercial business customers for facilities up to approximately $150 million. The division operates under the Westpac, St.George, BankSA and Bank of Melbourne brands. Customers are provided with a wide range of banking and financial products and services to support their lending, payments and transaction needs. In addition, specialist services are provided for cash flow finance, trade finance, automotive and equipment finance, property finance and treasury services. The division is also responsible for certain consumer customers with auto finance loans. BB works in an integrated way with BTFG and WIB in the sales and service of select financial services and products including corporate superannuation, foreign exchange and interest rate hedging. The revenue from these products is mostly retained by the product originators
WIB
Westpac Institutional Bank (WIB) delivers a broad range of financialproducts and services to commercial, corporate, institutional andgovernment customers with connections to Australia and New Zealand. WIBoperates through dedicated industry relationship and specialist productteams, with expert knowledge in transactional banking, financial and debtcapital markets, specialised capital, and alternative investment solutions.Customers are supported throughout Australia as well as via branches andsubsidiaries located in New Zealand, the US, UK and Asia. WIB is alsoresponsible for Westpac Pacific currently providing a range of bankingservices in Fiji and PNG. WIB works in an integrated way with all the Group’sdivisions in the provision of more complex financial needs including acrossforeign exchange and fixed interest solutions
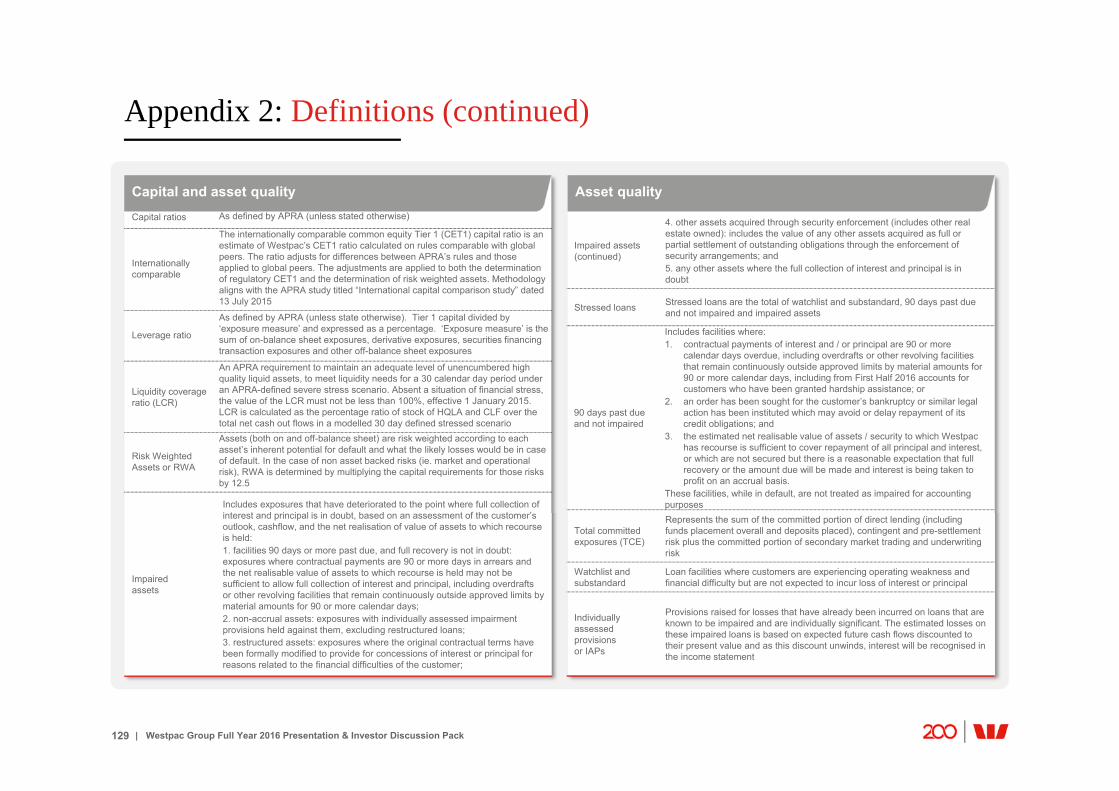
| Westpac Group Full Year 2016 Presentation & Investor Discussion Pack
Appendix 2: Definitions (continued)
129
Capital and asset quality Asset qualityCapital ratios As defined by APRA (unless stated otherwise)
Internationally comparable
The internationally comparable common equity Tier 1 (CET1) capital ratio is an estimate of Westpac’s CET1 ratio calculated on rules comparable with global peers. The ratio adjusts for differences between APRA’s rules and those applied to global peers. The adjustments are applied to both the determination of regulatory CET1 and the determination of risk weighted assets. Methodology aligns with the APRA study titled “International capital comparison study” dated 13 July 2015
Leverage ratio
As defined by APRA (unless state otherwise). Tier 1 capital divided by ‘exposure measure’ and expressed as a percentage. ‘Exposure measure’ is the sum of on-balance sheet exposures, derivative exposures, securities financing transaction exposures and other off-balance sheet exposures
Liquidity coverage ratio (LCR)
An APRA requirement to maintain an adequate level of unencumbered high quality liquid assets, to meet liquidity needs for a 30 calendar day period under an APRA-defined severe stress scenario. Absent a situation of financial stress, the value of the LCR must not be less than 100%, effective 1 January 2015.LCR is calculated as the percentage ratio of stock of HQLA and CLF over the total net cash out flows in a modelled 30 day defined stressed scenario
Risk Weighted Assets or RWA
Assets (both on and off-balance sheet) are risk weighted according to each asset’s inherent potential for default and what the likely losses would be in case of default. In the case of non asset backed risks (ie. market and operational risk), RWA is determined by multiplying the capital requirements for those risksby 12.5
Impaired assets
Includes exposures that have deteriorated to the point where full collection of interest and principal is in doubt, based on an assessment of the customer’s outlook, cashflow, and the net realisation of value of assets to which recourse is held:1. facilities 90 days or more past due, and full recovery is not in doubt: exposures where contractual payments are 90 or more days in arrears and the net realisable value of assets to which recourse is held may not be sufficient to allow full collection of interest and principal, including overdrafts or other revolving facilities that remain continuously outside approved limits by material amounts for 90 or more calendar days;2. non-accrual assets: exposures with individually assessed impairment provisions held against them, excluding restructured loans;3. restructured assets: exposures where the original contractual terms have been formally modified to provide for concessions of interest or principal for reasons related to the financial difficulties of the customer;
Impaired assets (continued)
4. other assets acquired through security enforcement (includes other real estate owned): includes the value of any other assets acquired as full or partial settlement of outstanding obligations through the enforcement of security arrangements; and5. any other assets where the full collection of interest and principal is in doubt
Stressed loans Stressed loans are the total of watchlist and substandard, 90 days past due and not impaired and impaired assets
90 days past due and not impaired
Includes facilities where:1. contractual payments of interest and / or principal are 90 or more
calendar days overdue, including overdrafts or other revolving facilities that remain continuously outside approved limits by material amounts for 90 or more calendar days, including from First Half 2016 accounts for customers who have been granted hardship assistance; or
2. an order has been sought for the customer’s bankruptcy or similar legal action has been instituted which may avoid or delay repayment of its credit obligations; and
3. the estimated net realisable value of assets / security to which Westpac has recourse is sufficient to cover repayment of all principal and interest, or which are not secured but there is a reasonable expectation that full recovery or the amount due will be made and interest is being taken to profit on an accrual basis.
These facilities, while in default, are not treated as impaired for accounting purposes
Total committed exposures (TCE)
Represents the sum of the committed portion of direct lending (including funds placement overall and deposits placed), contingent and pre-settlement risk plus the committed portion of secondary market trading and underwriting risk
Watchlist and substandard
Loan facilities where customers are experiencing operating weakness and financial difficulty but are not expected to incur loss of interest or principal
Individually assessed provisions or IAPs
Provisions raised for losses that have already been incurred on loans that are known to be impaired and are individually significant. The estimated losses on these impaired loans is based on expected future cash flows discounted to their present value and as this discount unwinds, interest will be recognised in the income statement

| Westpac Group Full Year 2016 Presentation & Investor Discussion Pack
Appendix 2: Definitions (continued)
130
Collectively assessed provisions or CAPs
Loans not found to be individually impaired or significant will be collectively assessed in pools of similar assets with similar risk characteristics. The size of the provision is an estimate of the losses already incurred and will be estimated on the basis of historical loss experience for assets with credit characteristics similar to those in the collective pool. The historical loss experience will be adjusted based on current observable data. Included in the collectively assessed provision is an economic overlay provision which is calculated based on changes that occurred in sectors of the economy or in the economy as a whole
Cash earnings
Is a measure of the level of profit that is generated by ongoing operation and is therefore available for distribution to shareholders. Three categories of adjustments are made to reported results to determine cash earnings: material items that key decision makers at Westpac believe do not reflect ongoing operations; items that are not considered when dividends are recommended; and accounting reclassifications that do not impact reported results. For details of these adjustments refer to slide 127.
Core earnings Net operating income less operating expenses
AIEAAverage interest-earning assets and is the average balance of assets held by the Group that generate interest income. Where possible, daily balances are used to calculate the average balance for the period
Net interest margin Calculated by dividing net interest income by average interest-earning assets
Full-time equivalent employees (FTE)
A calculation based on the number of hours worked by full and part-time employees as part of their normal duties. For example, the full-time equivalent of one FTE is 76 hours paid work per fortnight
Net tangible assets per ordinary share
Net tangible assets (total equity less goodwill and other intangible assets less minority interests) divided by the number of ordinary shares on issue (reported)
Cash earnings per ordinary share
Cash earnings divided by the weighted average ordinary shares (cash earnings basis)
Weighted average ordinary shares (cash earnings)
Weighted average number of fully paid ordinary shares listed on the ASX for the relevant period
Weighted average ordinary shares (reported)
Weighted average number of fully paid ordinary shares listed on the ASX for the relevant period less Westpac shares held by the Group (‘Treasury shares’)
Asset quality (continued) & financial performance Other
High quality liquid assets (HQLA)
As defined by APRA in Australian Prudential Standard APS210 Liquidity, including BS-13 qualifying liquid assets, less RBA open repos funding end of day ESA balances with the RBA
Committed liquidity facility (CLF)
The RBA makes available to Australian Authorised Deposit-taking Institutions a CLF that, subject to qualifying conditions, can be accessed to meet LCRrequirements under APS210 Liquidity
Net Stable Funding Ratio (NSFR)
The NSFR is defined as the ratio of the amount of available stable funding (ASF) to the amount of required stable funding (RSF) defined by APRA. The amount of ASF is the portion of an ADI’s capital and liabilities expected to be a reliable source of funds over a one year time horizon. The amount of RSF is a function of the liquidity characteristics and residual maturities of an ADI’sassets and off-balance sheet activities. When it is implemented by APRA from 1 January 2018, ADI’s must maintain an NSFR of at least 100%
Credit value adjustment (CVA)
CVA adjusts the fair value of over-the-counter derivatives for credit risk. CVAis employed on the majority of derivative positions and reflects the market view of the counterparty credit risk. A Debit Valuation Adjustment (DVA) is employed to adjust for our own credit risk
Funding valuation adjustment (FVA)
FVA reflects the estimated present value of the future market funding cost or benefit associated with funding uncollateralised derivatives

| Westpac Group Full Year 2016 Presentation & Investor Discussion Pack
Appendix 2: Definitions (continued)
131
Australian customers with wealth products metrics provider
Data based on Roy Morgan Research, Respondents aged 14+ and 12 month rolling. Wealth penetration is defined as the proportion of Australians who have a Deposit or Transaction Account, Mortgage, Personal Lending or Major Card with a Banking Group and also have Managed Investments, Superannuation or Insurance with the same Banking Group
Westpac includes Westpac, Bank of Melbourne (until Jul-11), BT, Challenge Bank, RAMS (until Dec-11), Rothschild, ASGARD, and Sealcorp
St.George brands include St. George, Advance Bank, BankSA, Bank of Melbourne (from Aug-11), Dragondirect, RAMS (from Jan-12).
Westpac Group includAdvance Bank, ASGARD, BankSA, Bank of Melbourne, BT, Challenge Bank, Dragondirect, RAMS, Rothschild, and Sealcorp.
‘Peers includes: ANZ Group, CBA Group, NAB Group, Westpac and St.George brands’
NZ customers with wealth products (%)
Number of customers who have managed investments or superannuation with Westpac NZ as a proportion of the total active customers in Westpac NZ Retail, Private and Business Bank
Customer satisfaction –overall consumer
Source: Roy Morgan Research, September 2014 - 2016, 6MMA. Main Financial Institution (as defined by the customer). Satisfaction ratings are based on the relationship with the financial institution. Customers must have at least a Deposit/Transaction account relationship with the institution and are aged 14 or over. Satisfaction is the percentage of customers who answered ‘Very’ or ‘Fairly satisfied’ with their overall relationship with their MFI
Customer satisfaction –overall business
Source: DBM Consultants Business Financial Services Monitor, September 2014 - 2016, 6MMA. MFI customers, all businesses. The Customer Satisfaction score is an average of customer satisfaction ratings of the customer’s main financial institution for business banking on a scale of 0 to 10 (0 means ‘extremely dissatisfied’ and 10 means ‘extremely satisfied’)
Other Other
Customer satisfaction –SME
Source: DBM Consultants Business Financial Services Monitor, September 2014 - 2016, 6MMA. MFI customers, SME businesses. The Customer Satisfaction score is an average of customer satisfaction ratings of the customer’s main financial institution for small business banking on a scale of 0 to 10 (0 means ‘extremely dissatisfied’ and 10 means ‘extremely satisfied’)
Westpac Group rank
The ranking refers to Westpac’s position relative to the other three major Australian banks (ANZ, CBA and NAB)
Customer satisfaction –New Zealand
Source: Camorra Research. % of main bank customers who rated excellent or very good, rolling three month as at September 2016
NPS
Net Promoter Score measures the net likelihood of recommendation to others of the customer’s main financial institution for retail or business banking. Net Promoter ScoreSM is a trademark of Bain & Co Inc., SatmetrixSystems, Inc., and Mr Frederick Reichheld.For retail banking, using a scale of 1 to 10 (1 means ‘very unlikely’ and 10 means ‘very likely’), the 1-6 raters (detractors) are deducted from the 9-10 raters (promoters).For business banking, using a scale of 0 to 10 (0 means ‘extremely unlikely’ and 10 means ‘extremely likely’), the 0-6 raters (detractors) are deducted from the 9-10 raters (promoters)
NPS contact centre and online platform
Based on Internal surveys, September 2016, 6 month moving average

| Westpac Group Full Year 2016 Presentation & Investor Discussion Pack
Investor Relations Team
132
Andrew Bowden
Head of Investor Relations
+61 2 8253 4008
Nicole Mehalski
Director
+61 2 8253 1667
Equity Investor Relations www.westpac.com.au/investorcentre
Jacqueline Boddy
Director
+61 2 8253 3133
Louise Coughlan
Director (Rating Agencies)
+61 2 8254 0549
Debt Investor Relations
Retail Shareholder Investor Relations
Danielle Stock
Senior Manager
+61 2 8253 0922
Rebecca Plackett
Senior Manager
+61 2 8253 6556
Or email: [email protected]

| Westpac Group Full Year 2016 Presentation & Investor Discussion Pack
Disclaimer
133
The material contained in this presentation is intended to be general background information on Westpac Banking Corporation (Westpac) and its activities.
The information is supplied in summary form and is therefore not necessarily complete. It is not intended that it be relied upon as advice to investors or potential investors, who should consider seeking independent professional advice depending upon their specific investment objectives, financial situation or particular needs. The material contained in this presentation may include information derived from publicly available sources that have not been independently verified. No representation or warranty is made as to the accuracy, completeness or reliability of the information.
All amounts are in Australian dollars unless otherwise indicated.
Unless otherwise noted, financial information in this presentation is presented on a cash earnings basis. Cash earnings is a non-GAAP measure. Refer to Westpac’s Full Year 2016 Financial Results (incorporating the requirements of Appendix 4E) for the twelve months ended 30 September 2016 available at www.westpac.com.au for details of the basis of preparation of cash earnings. Refer to slides 36 for an explanation of cash earnings and Appendix 1 slide 127 for a reconciliation of reported net profit to cash earnings.
This presentation contains statements that constitute “forward-looking statements” within the meaning of Section 21E of the US Securities Exchange Act of 1934. Forward-looking statements are statements about matters that are not historical facts. Forward-looking statements appear in a number of places in this presentation and include statements regarding our intent, belief or current expectations with respect to our business and operations, market conditions, results of operations and financial condition, including, without limitation, future loan loss provisions, financial support to certain borrowers, indicative drivers, forecasted economic indicators and performance metric outcomes.
We use words such as ‘will’, ‘may’, ‘expect’, 'indicative', ‘intend’, ‘seek’, ‘would’, ‘should’, ‘could’, ‘continue’, ‘plan’, ‘probability’, ‘risk’, ‘forecast’, ‘likely’, ‘estimate’, ‘anticipate’, ‘believe’, ‘aim’, or other similar words to identify forward-looking statements. These forward-looking statements reflect our current views with respect to future events and are subject to change, certain risks, uncertainties and assumptions which are, in many instances, beyond our control, and have been made based upon management’s expectations and beliefs concerning future developments and their potential effect upon us. There can be no assurance that future developments will be in accordance with our expectations or that the effect of future developments on us will be those anticipated. Actual results could differ materially from those which we expect, depending on the outcome of various factors. Factors that may impact on the forward-looking statements made include, but are not limited to, those described in the section titled ‘Risk factors' in Westpac’s Interim Financial Results for the six months ended 31 March 2016 (or Annual Report for year ended 30 September 2015) available at www.westpac.com.au. When relying on forward-looking statements to make decisions with respect to us, investors and others should carefully consider such factors and other uncertainties and events. We are under no obligation to update any forward-looking statements contained in this presentation, where as a result of new information, future events or otherwise, after the date of this presentation.