· web viewthreats to mussel beds include bait collection (maddock, 2008), gathering for human...
TRANSCRIPT

Stock Assessment of the Edible Mussel (Mytilus edulis) Beds in Blyth Estuary
2016
Report prepared by: Natalie Wallace
Northumberland Inshore Fisheries and Conservation Authority8 Ennerdale RoadBlythNE24 4RT
Tel: 01670 797676Email: [email protected]: www.nifca.gov.uk
Abstract
The purpose of this report is to assess the state of the mussel bed in Blyth estuary. The perimeter of the mussel bed was mapped and percentage cover of mussels was estimated using the MarinX ‘Dutch Wand’
survey technique. Samples of mussels were collected and total shell length and weight were measured.
The mussel bed at Blyth estuary covered an area of 13,477 m² however percentage cover and density varied across the site. The length distributions for mussels were skewed towards larger mussels and mean
length of mussels sampled was 41.79mm.
This report is intended to provide baseline information relating to the health and distribution of the mussel bed in the Blyth estuary in order to inform future management of the site.
Introduction
The edible mussel (Mytilus edulis) is widely distributed, occurring in boreal and temperate waters, in both the southern and northern hemispheres (OSPAR, 2010). M. edulis is tolerant of a wide range of environmental conditions (FAO, n.d.) including fluctuations in salinity (Andrews et al., 2011), and therefore occurs in both marine and brackish waters (Gardner, 1996). Mussels can form dense beds on estuarine flats (Fenton, 1978) attaching to substratum using byssus threads (Babarro et al., 2008). Spat (juvenile mussels) settles on existing beds, hard substrates (such as shells or stones) or may be washed as clumps to other parts of the estuary (Verwey, 1952).
M. edulis beds are included in the OSPAR (Annex V) list of threatened and declining species and habitats and are listed as a UK biodiversity action Plan (BAP) Priority Habitat (Maddock, 2008). Threats to mussel beds include bait collection (Maddock, 2008), gathering for human consumption (Fenton, 1978), pollution (Hilgerloh, 1997), coastal development and anchoring (Maddock, 2008). It is currently unknown whether mussel beds are declining because of the aforementioned threats, due to bird predation or a combination of factors (Hilgerloh, 1997).
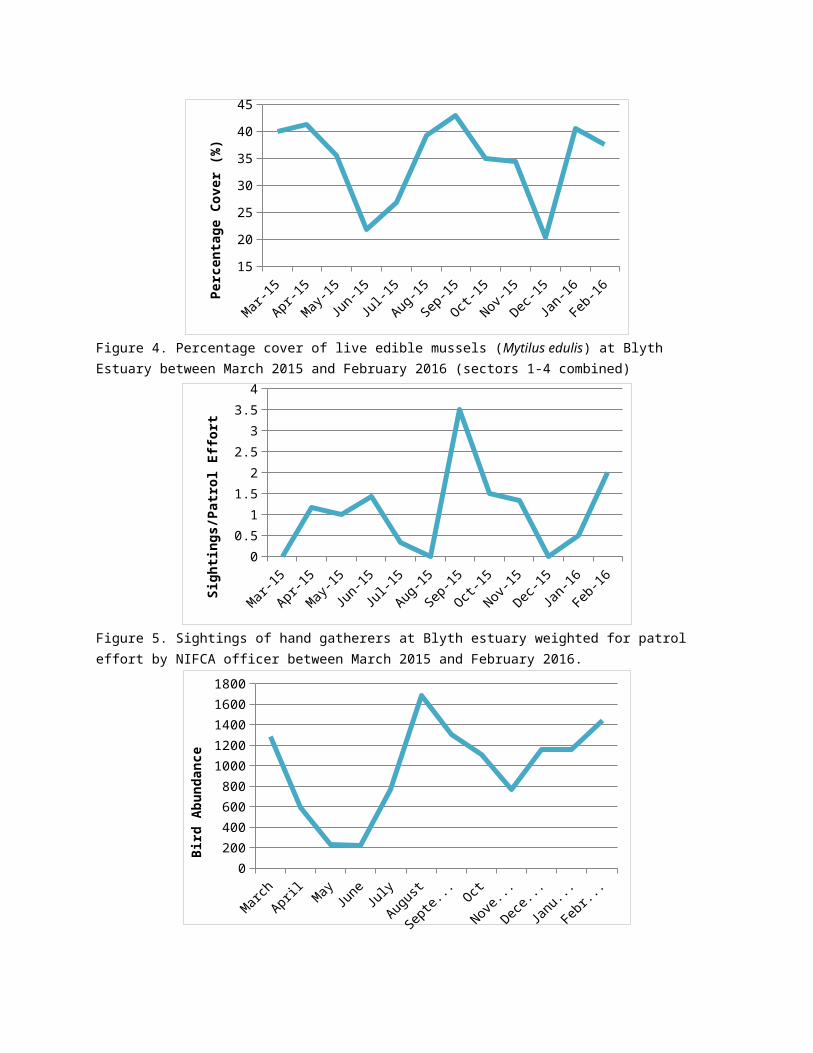
Blyth Estuary is part of the Northumberland Shore SSSI and provides important feeding and roosting grounds for overwintering waders, such as redshank, dunlin and turnstone as well as resident species such as oystercatcher, ringed plover, curlew and eider duck (Holliday, 2000). Mussels are an important dietary component for Turnstones (Arenaria interpres) and Oystercatchers (Haematopus ostrelegus) in particular at Blyth (Eaton, 2000). There is a concern that a decline in mussels on the Blyth estuary may have negative impacts on the bird populations at the site.
In late 2014 the Northumberland Inshore Fisheries and Conservation Authority (NIFCA) was approached by Blyth Boat Club about unregulated hand gathering and bait digging amongst the mussel beds on the Blyth Estuary. Due to the importance of the site for important birds and concerns from the public, in March 2015, NIFCA began monthly stock assessment surveys of the mussel beds to assess stock health.Methods
A series of surveys have been conducted monthly on the mussel bed at Blyth estuary between March 2015 and March 2016 by NIFCA staff, committee members and volunteers from the Environment Agency.

Study Site
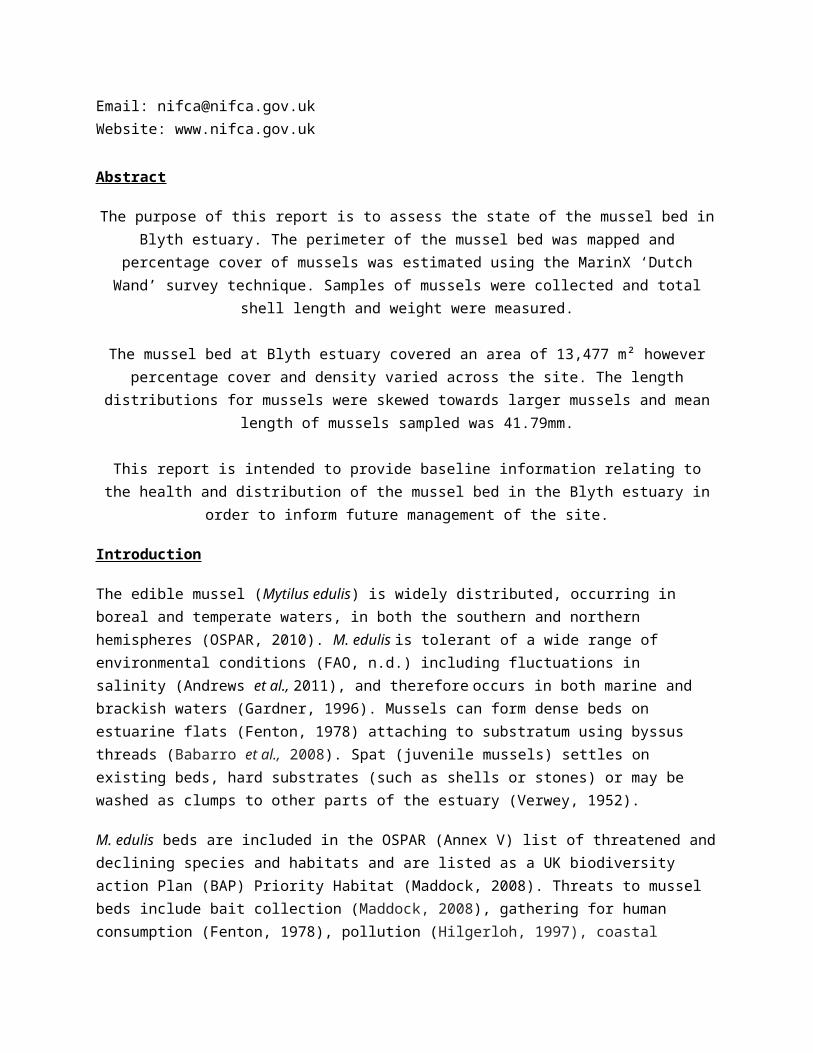
The study site is located on the Blyth Estuary in Northumberland. The mussel bed extends from the Blyth Boat Club slipway upstream to just beyond the sewage outfall beneath Cowley Road. For the purpose of this study the mussel bed has been divided into four sectors based on the feeding/roosting sites defined in Holliday (2000) (Figure 1). The Blyth Estuary is part of the Northumberland Shore Site of Scientific Interest (SSSI). The site provides important feeding and roosting grounds for several bird species.
Figure 1. Survey area on the Blyth Estuary, showing the location of the four sectors and the access point at the Blyth Boat Club slipway.
Survey Methods
In order to map the area of the mussel bed, officers walked the perimeter of the mussel bed with a handheld GPS during each survey.
The percentage cover of mussels on the mussel bed was estimated using the MarinX ‘Dutch Wand’ survey technique (McGrorty et al., 1990). Surveyors walked in a zigzag across the mussel bed, in a randomly determined direction. The Dutch wand (a 4ft bamboo cane with an 11cm ring attached to the end) was placed out to one side every three steps and the result of either a ‘hit’ (if the ring contained live mussels) or a ‘miss’ (if the ring did not contain live mussels) was recorded. Percentage cover was then calculated using the Equation:
Percentage Cover = Number of Hits _ X 100 Number of Hits + Number of Misses
A mussel sample was taken from inside the 11cm ring at the site of every third ‘hit’. All mussel samples from the same transect were collected together and the total number of samples taken per transect was recorded. The samples were sieved (6mm mesh size) and cleaned in estuarine water. Total shell lengths of all the mussels sampled were then measured (to the nearest millimetre) using a vernier caliper and divided into the following size groups: <25mm, 26-49mm and >50mm. The total weight (in grams) of mussels in each size category was also recorded for each sample. The density of mussels on the mussel bed was then calculated the following equation:
Mussel Density = Number of mussels per m² Percentage Cover
NIFCA officers monitored bait digging activity on Blyth Estuary, recording numbers of hand gatherers and bait diggers at the site at low tide.
Results
Mussel Bed Extent
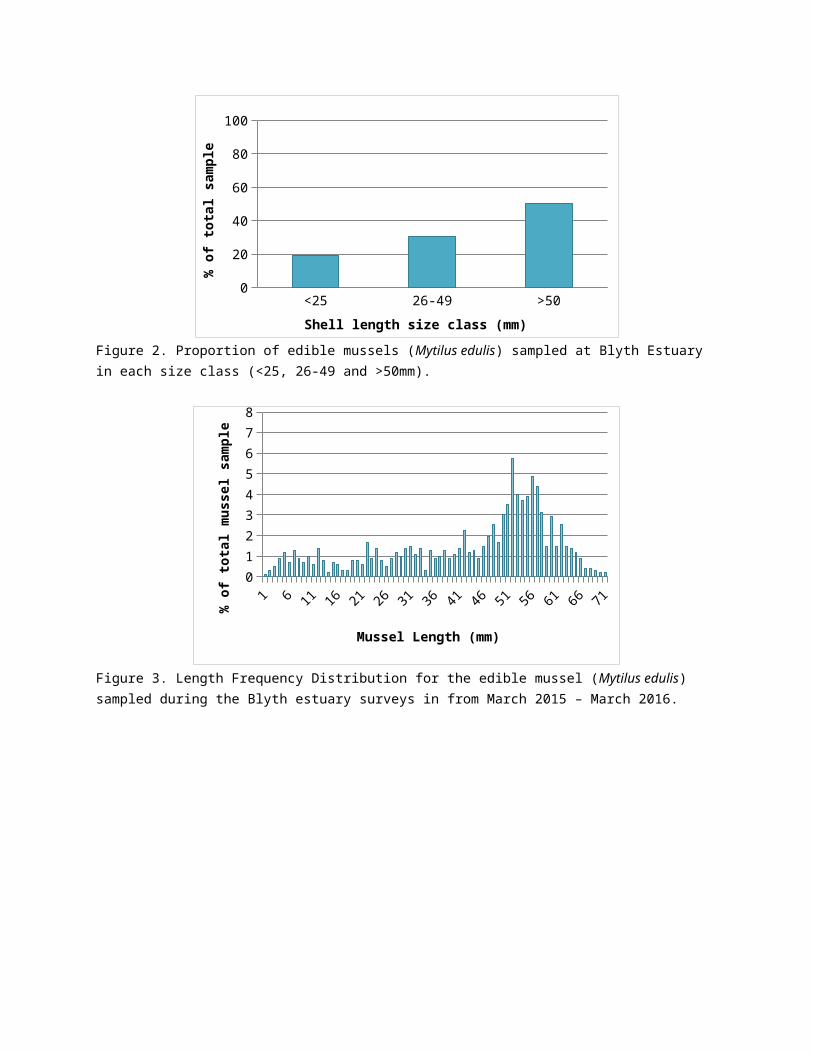
The mussel bed at Blyth estuary covered an estimated area of 22,247 m² in 2016. Percentage cover and density is shown in Table 1 and Figure 4 shows change in percentage cover over the duration of the study.
Table1. Summary of results obtained from the data collected during the Blyth estuary mussel surveys (March 2015-2016 data combined). Showing number of samples, number of mussels, percentage cover, total mussel weight, area and density by location.
Location No. of Samples
No. of Mussels Mean Percentage Cover (%)
Weight (g) Area (m²) Density (mussels/m²)
Blyth Estuary
334 1005 35.2 17405.5 22247 111.45
Sector 1 65 160 39.2 2760 4114 101.53Sector 2 119 399 30.6 5783.5 11649 107.96Sector 3 58 180 29.0 4276 4760 94.70Sector 4 92 266 36.2 4586 1724 110.14
Mussel Samples
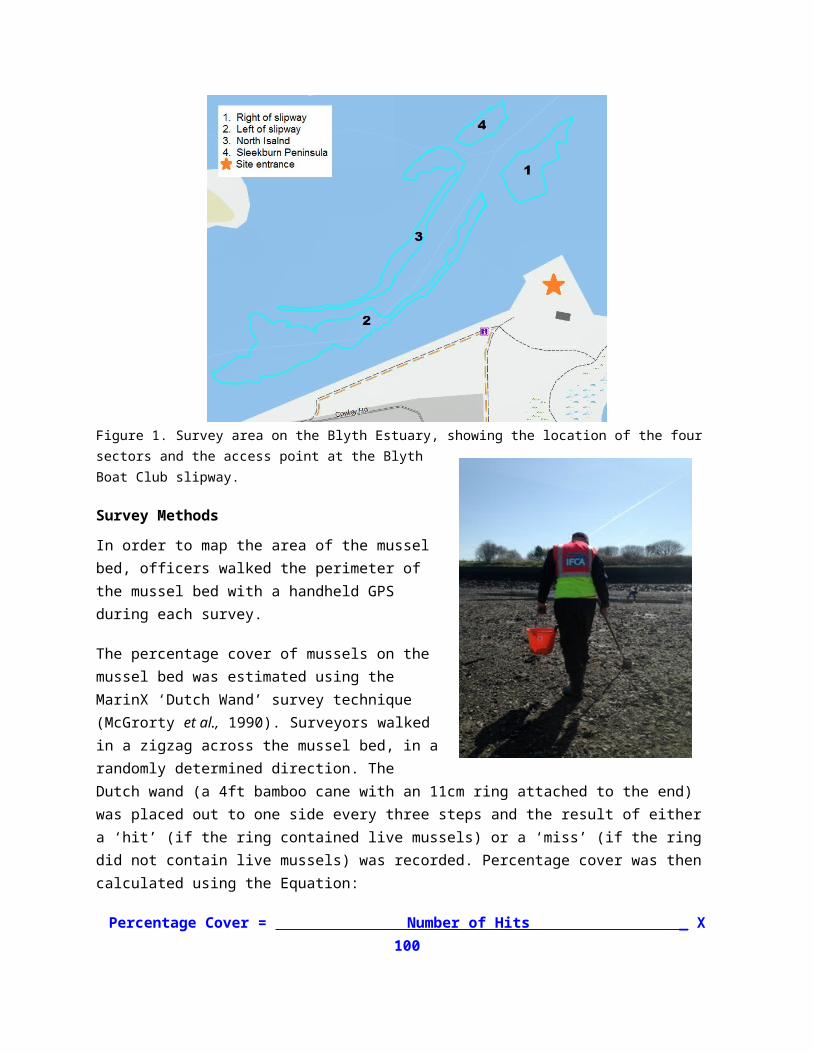
A total of 1036 mussels were sampled during the course of the surveys. Mean length of mussels sampled at Blyth estuary was 41.79mm (Table 2). The proportion of mussels sampled in each size class (<25, 26-49 and >50mm) is shown in Figure 2. The length frequency distributions for Blyth estuary and the four sectors are shown in Figure 3 and Appendix 1 respectively. The total weight of mussels sampled was 18,119.5g, total weight and mussel density at all of the sites is summarised in Table 1.
Table 2: Mean Length and proportion of sample below 30mm in length.Location Mean Length (mm) % of sample <30mm in lengthBlyth Estuary 41.79 22.53Sector 1 42.17 22.64Sector 2 39.36 30.90Sector 3 49.62 8.07Sector 4 43.24 22.56

Bait Collection
A total of 38 hand gatherers and 21 bait diggers were observed collecting bait at Blyth Estuary between March 2015 and February 2016. Monthly variation in the magnitude of hand gathering at the site is shown in Figure 6.
<25 26-49 >500
20
40
60
80
100
Shell length size class (mm)
% o
f tot
al sa
mpl
e
Figure 2. Proportion of edible mussels (Mytilus edulis) sampled at Blyth Estuary in each size class (<25, 26-49 and >50mm).
1 5 9 13 17 21 25 29 33 37 41 45 49 53 57 61 65 690
1
2
3
4
5
6
7
8
Mussel Length (mm)
% o
f tot
al m
usse
l sam
ple
Figure 3. Length Frequency Distribution for the edible mussel (Mytilus edulis) sampled during the Blyth estuary surveys in from March 2015 – March 2016.

Mar-15
Apr-15
May-15
Jun-15Jul-1
5
Aug-15
Sep-15
Oct-15
Nov-15
Dec-15
Jan-16
Feb-16
15
20
25
30
35
40
45
Perc
enta
ge C
over
(%)
Figure 4. Percentage cover of live edible mussels (Mytilus edulis) at Blyth Estuary between March 2015 and February 2016 (sectors 1-4 combined)
Mar-15
Apr-15
May-15
Jun-15Jul-1
5
Aug-15
Sep-15
Oct-15
Nov-15
Dec-15
Jan-16
Feb-16
0
0.5
1
1.5
2
2.5
3
3.5
4
Sigh
tings
/Pat
rol E
ffort
Figure 5. Sightings of hand gatherers at Blyth estuary weighted for patrol effort by NIFCA officer between March 2015 and February 2016.
March
AprilMay June
July
August
Septem
ber
October
November
December
January
February
0200
400
600800
10001200
14001600
1800
Bird
Abu
ndan
ce
Figure 6. Estimates of monthly low tide feeding bird activity on Blyth Estuary (adapted from Holliday, 2000).
Discussion
The Mussel Bed
The mussel bed was not evenly distributed across the site, percentage cover and density varied between the four sectors (Table 1). Mean percentage cover was above the site average (35.2%) in sector 4 (36.2%), mussel density is also highest at within this sector (110.14 mussels per m²). Holliday (2000) shows that the Sleekburn Peninsula (Sector 4) is a high tide roosting site with relatively low levels of low tide feeding activity, potentially explaining the high proportion of mussels in this sector. Holliday (2000) also highlights that the Upper Blyth Banks (approximately corresponding with sectors 2 and 3) experience the highest levels of low tide feeding activity in the estuary. Sector 2 and 3 both exhibits lower than average mean percentage covers (30.6% and 29.0% respectively). Factors including high levels of feeding activity on the mussel bed and ease of access for bait collectors may explain the lower percentage cover of mussels in this sector. Appendix 1 highlights a potential lack of recruitment in sector 3 as there are fewer mussels below 30mm in length at this site compared to the other sectors.
Percentage cover also varied over time (Figure 4) with peaks in percentage cover occurring in April 2015, September 2015 and January 2016. Both bait collection effort (Figure 5) and bird abundance on the estuary (figure 6) follow similar seasonal patterns suggesting 1) bait collectors and birds target the mussel bed when mussel coverage is greatest or 2) bait collection and predation help to regulate the seasonal variation exhibited in the mussel bed.
Weather may also control mussel abundance, high levels of freshwater were observed at the site during surveys in December, January and February due to winter storms. Nehls and Thiel (1993) identified storms as a major factor limiting the distribution of mussel beds.
Mussel Samples
The length distributions for mussels at all sites were skewed towards larger mussels (Figure 2, 3 and Appendix 1). The total shell lengths of 58.98% of mussels sampled were greater than the recommended minimum size of 45mm. Several studies have identified bimodal length distributions for mussels (Hilgerloh, 1997; Gray, 2011) one theory for this is the predation of medium sized mussels (between 25 an 38mm) by birds (Gray, 2011). Meire and Ervynck (1986) found that oystercatchers select mussels between 30mm and 45mm in length. Hilgerloh (1997) suggests that dominance by one size class of mussels occurs due to larger mussels growing out of the size range exploited by predators. The length distribution observed for the current study is unimodal, skewed towards the larger sized mussels (Figure 3). However the number of smaller individuals may be lower than expected as 1) smaller mussels may escape through the 6mm mesh of the sieve (unlikely as spat were attached to adult shells using byssus threads) and 2) recruitment may be limited at the site.
As discussed above low tide feeding activity is greatest in sector 2 and birds selectively target mussels between 25mm and 38mm (Gray, 2011). Sector 2 has the smallest mean shell length (39.36mm) and a greater proportion of mussels in the smaller size classes (Appendix 1) therefore sector 2 may be frequented by birds more often due to the more suitable prey size at this site.
Further Study
This survey creates a baseline dataset for the Blyth estuary mussel beds. As a pre-existing baseline dataset is not available the mussel bed characteristics cannot be attributed to any particular factor. Further study is needed to determine whether the Blyth Estuary population is naturally skewed towards larger individuals or whether there is a lack of recruitment at the site. NIFCA plan to continue with the stock assessment surveys on a quarterly basis as well as regular monitoring of bait collection activity at the site.
Conclusion
The purpose of this report is to assess the state of the mussel bed in Blyth estuary and to provide baseline information to inform future management of the site. This study has provided an initial assessment of the size and distribution of the mussel bed, length distributions of the mussels and levels of bait collection at the site. Whilst the results indicate a dominace of larger mussels at the site, further study is needed to determine whether the population is naturally skewed towards larger individuals or whether there is a lack of recruitment at the site. NIFCA plan to complete quarterly surveys of the mussel bed to monitor the mussel bed against this baseline dataset.
Acknowledgements
Thank you to all the IFCOs, committee members and volunteers from the Environment Agency who participated in the Blyth estuary surveys.
References
Andrews, J.W., Brand, A.R., and Maar, M. (2011). MSC Assessment Report for Isefjord and East Jutland Danish Blue Shell Mussel Fishery. Available at: www.msc.org.
Babarro, J. M., Reiriz, M. J. F., & Labarta, U. (2008). Secretion of byssal threads and attachment strength of Mytilus galloprovincialis: the influence of size and food availability. Journal of the Marine Biological Association of the UK, 88(04), 783-791.
Eaton, M. (2000). Studies on Purple Sandpipers (Calidris maritima) at Blyth 1996-99. In: Holliday, S. (2000). Blyth Birds. Eds. Kingston Upon Hull. pp. 140-152.
FAO (n.d.) Mytilus Edulis. Food and Agriculture Organization of the United Nations. Available at: http://www.fao.org/fishery/culturedspecies/Mytilus_edulis/en [Accessed: 15/02/2016].
Fenton, A. (1978). Shellfish as bait: the interface between domestic and commercial fishing. In: Smout, T.C. (Ed.), Scotland and the Sea, John Donald, Edinburgh, pp. 81–88.
Gardner, J.P.A. (1996). The Mytilus edulis species complex in southwest England: effects of hybridization and introgression upon interlocus associations and morphometric variation. Marine Biology. 125, 385-399.
Gray, K. (2011). Taw Torridge Estuary. Mussel Stock Assessment. Devon and Severn Inshore Fisheries and Conservation Authority.
Hilgerloh, G. (1997). Predation by birds on blue mussel Mytilus edulis beds of the tidal flats of Spiekeroog (southern North Sea). Marine Ecology Progress Series, 146(1), 61-72.
Holliday, S. (2000). Birds of Blyth Estuary & Harbour Areas in the 1990’s. In: Holliday, S. (2000). Blyth Birds. Eds. Kingston Upon Hull. pp. 15-89.

Maddock, A. (2008). UK biodiversity Action Plan; Priority Habitat Descriptions. BRIG.
McGrorty, S., Clarke, R. T., Reading, C. J., & Goss-Custard, J. D. (1990). Population dynamics of the mussel Mytilus edulis: density changes and regulation of the population in the Exe estuary, Devon. Marine ecology progress series. Oldendorf, 6(2), 157-169.
Meire, P. M., & Ervynck, A. (1986). Are oystercatchers (Haematopus ostralegus) selecting the most profitable mussels (Mytilus edulis)?. Animal Behaviour, 34(5), 1427-1435.
Nehls, G., & Thiel, M. (1993). Large-scale distribution patterns of the mussel Mytilus edulis in the Wadden Sea of Schleswig-Holstein: Do storms structure the ecosystem? Netherlands Journal of Sea Research, 31(2), 181-187.
OSPAR (2010). Quality Status Report 2010. Intertidal Mytilus edulis beds on mixed and sandy sediments. Case Reports for the OSPAR List of threatened and/or declining species and habitats. Available at: http://qsr2010.ospar.o rg/media/assessments/Species/p0010_supplements/CH10_03_ Intertidal_mytilus_edulis.pdf [Accessed:08/02/2016].
Verwey, J. (1952). On the ecology and distribution of cockle and mussel in the Dutch Wadden Sea, their role in sedimentation and food supply. Arch. Neerl. Zool. 10: 171-239.
Appendix 1: Size Frequency Distributions for mussels collected from each of the four Sectors on Blyth estuary.
012345678
Sector 1
Length (mm)
% o
f mus
sels
in sa
mpl
e
012345678
Sector 3
Length (mm)
% o
f mus
sels
in sa
mpl
e
012345678
Sector 2
Length (mm)
% o
f mus
sels
in sa
mpl
e
012345678
Sector 4
Length (mm)
% o
f mus
sels
in sa
mpl
e