thorax.bmj.comthorax.bmj.com/.../0/thorax_appendix_1_133280.docx · web viewonline data supplement...
TRANSCRIPT
[Type text]
ONLINE DATA SUPPLEMENT FOR:
Severity assessment tools for predicting mortality in hospitalised patients with Community-Acquired Pneumonia: Systematic review and Meta-Analysis.
James D Chalmers1, Aran Singanayagam2, Ahsan R Akram2, Pallavi Mandal2, Philip M Short3, Gourab Chowdhury2, Victoria Wood1, Adam T Hill2
1. University of Edinburgh, Edinburgh, UK.2. Department of Respiratory Medicine, Royal Infirmary of Edinburgh, Edinburgh, UK3. University of Dundee, Tayside, UK.
Corresponding author
Dr James Chalmers
Department of Respiratory Medicine
Royal Infirmary of Edinburgh
51 Little France CrescentOld Dalkeith RoadEdinburghEH16 4SA
E-mail: [email protected]
Keywords: Pneumonia, Severity assessment, mortality, meta-analysis
[Type text]
ADDITIONAL METHODS
Definition of Severity scores
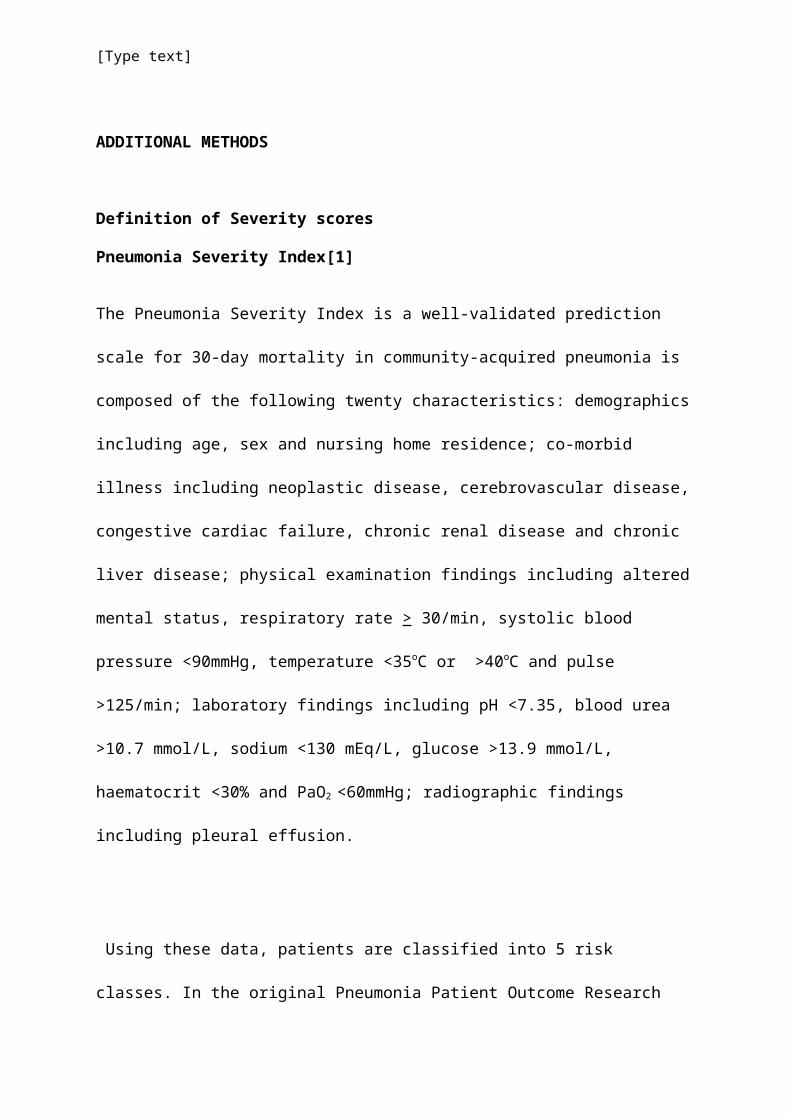
Pneumonia Severity Index[1]
The Pneumonia Severity Index is a well-validated prediction scale for 30-day mortality in
community-acquired pneumonia is composed of the following twenty characteristics:
demographics including age, sex and nursing home residence; co-morbid illness including
neoplastic disease, cerebrovascular disease, congestive cardiac failure, chronic renal disease
and chronic liver disease; physical examination findings including altered mental status,
respiratory rate > 30/min, systolic blood pressure <90mmHg, temperature <35oC or >40oC
and pulse >125/min; laboratory findings including pH <7.35, blood urea >10.7 mmol/L,
sodium <130 mEq/L, glucose >13.9 mmol/L, haematocrit <30% and PaO2 <60mmHg;
radiographic findings including pleural effusion.
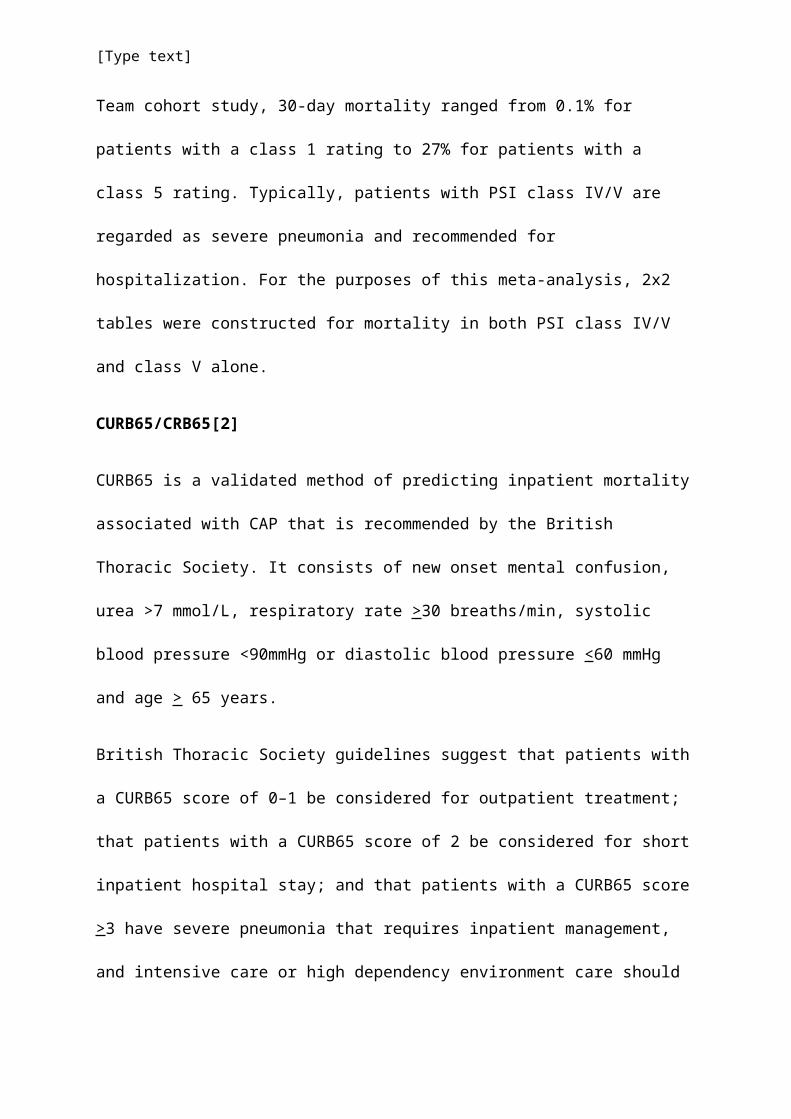
Using these data, patients are classified into 5 risk classes. In the original Pneumonia Patient
Outcome Research Team cohort study, 30-day mortality ranged from 0.1% for patients with a
class 1 rating to 27% for patients with a class 5 rating. Typically, patients with PSI class IV/V
are regarded as severe pneumonia and recommended for hospitalization. For the purposes of
this meta-analysis, 2x2 tables were constructed for mortality in both PSI class IV/V and class
V alone.
CURB65/CRB65[2]
CURB65 is a validated method of predicting inpatient mortality associated with CAP that is
recommended by the British Thoracic Society. It consists of new onset mental confusion,
[Type text]
urea >7 mmol/L, respiratory rate >30 breaths/min, systolic blood pressure <90mmHg or
diastolic blood pressure <60 mmHg and age > 65 years.
British Thoracic Society guidelines suggest that patients with a CURB65 score of 0–1 be
considered for outpatient treatment; that patients with a CURB65 score of 2 be considered for
short inpatient hospital stay; and that patients with a CURB65 score >3 have severe
pneumonia that requires inpatient management, and intensive care or high dependency
environment care should be considered, particularly for patients with a CURB65 score >4.
For the purposes of this meta-analysis both > 3 and > 4 were used to construct 2 x 2 tables of
the relationship between CURB65 and mortality.
CRB65 is a simplified version of the CURB65 score that does not include the urea criterion.
It stratifies patients into low risk (CRB65= 0 or 1), intermediate risk (CRB65= 2) or high risk
groups (CRB65 = 3 or 4). CRB65 is recommended for outpatient use in the British Thoracic
Society guidelines.[3]
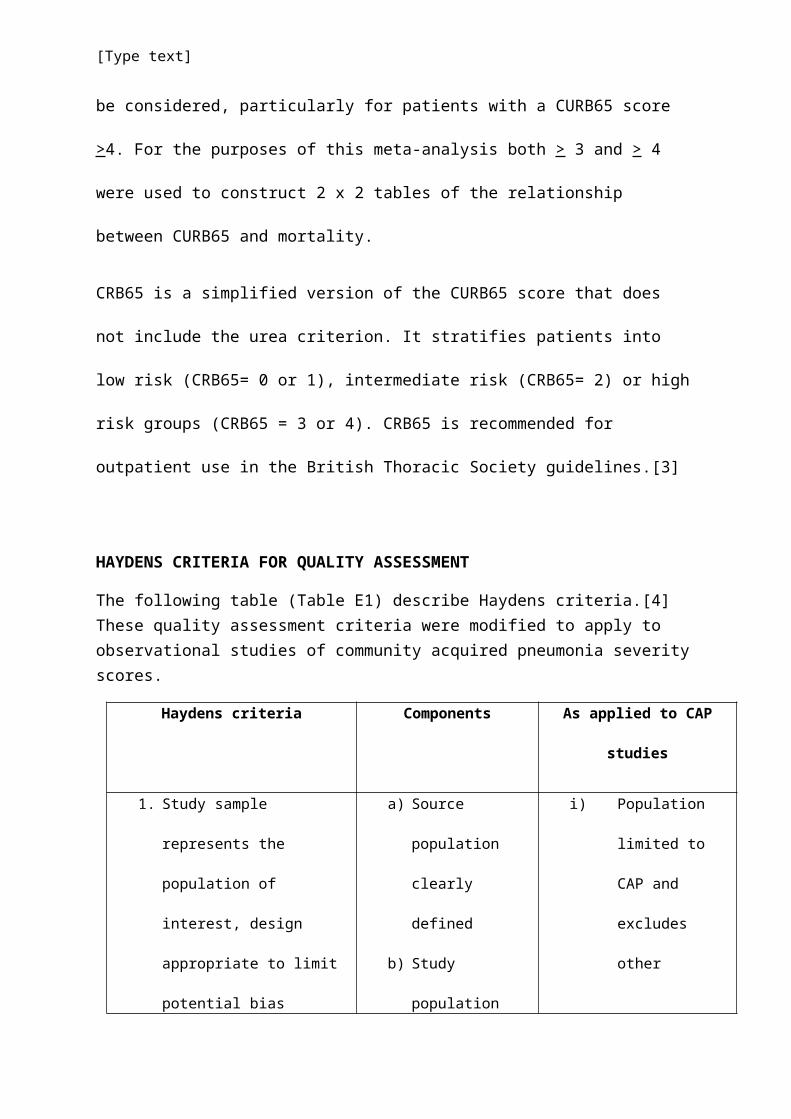
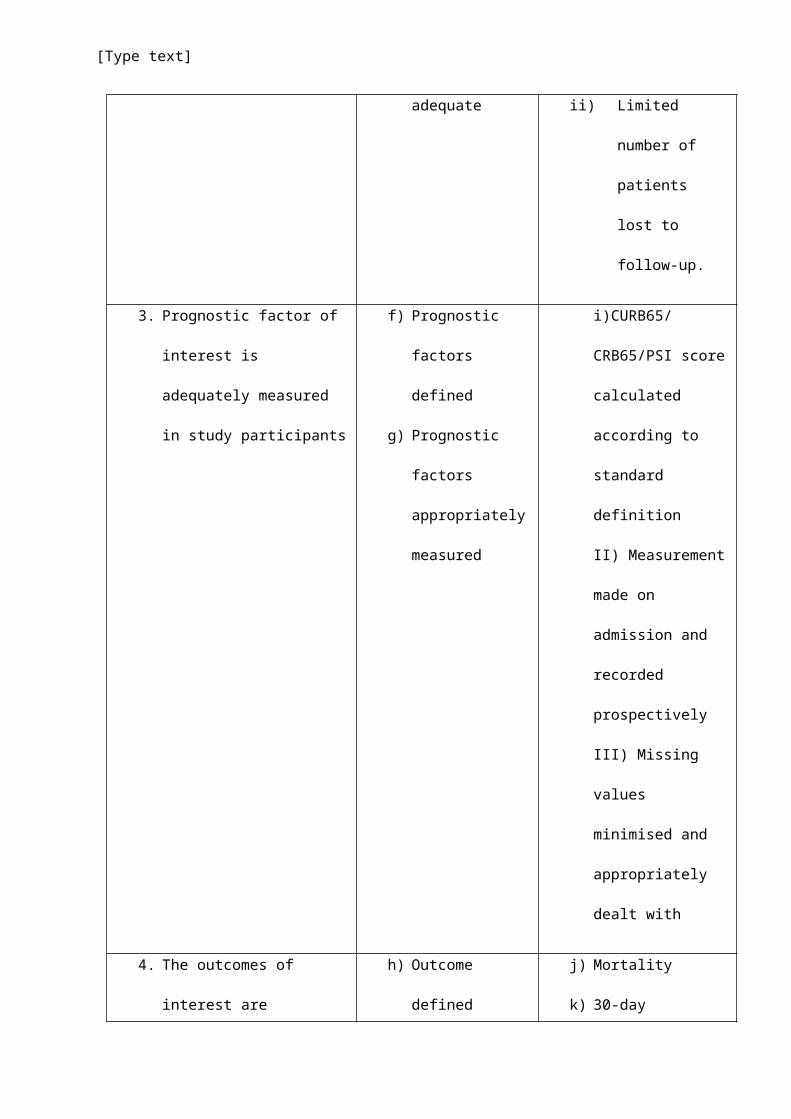
HAYDENS CRITERIA FOR QUALITY ASSESSMENT
The following table (Table E1) describe Haydens criteria.[4] These quality assessment criteria were modified to apply to observational studies of community acquired pneumonia severity scores.
Haydens criteria Components As applied to CAP studies
1. Study sample represents the
population of interest, design
appropriate to limit potential
bias
a) Source population
clearly defined
b) Study population
described
c) Study population
represents
i) Population limited
to CAP and
excludes other
diagnoses
ii) Requires Chest x-
ray confirmation
[Type text]
population of
interest
and uses
recognised
definition
iii) Enrolls
consecutive,
unselected
patients
iv) Demographics are
representative of
CAP cohorts
internationally.
2. Loss to follow-up, study data
adequately represent the
sample
d) Completeness of
follow-up described
e) Completeness of
follow-up adequate
i) Appropriate follow
up to determine
mortality
ii) Limited number of
patients lost to
follow-up.
3. Prognostic factor of interest is
adequately measured in study
participants
f) Prognostic factors
defined
g) Prognostic factors
appropriately
measured
i)CURB65/CRB65/PSI
score calculated
according to standard
definition
II) Measurement made
on admission and
recorded

[Type text]
prospectively
III) Missing values
minimised and
appropriately dealt
with
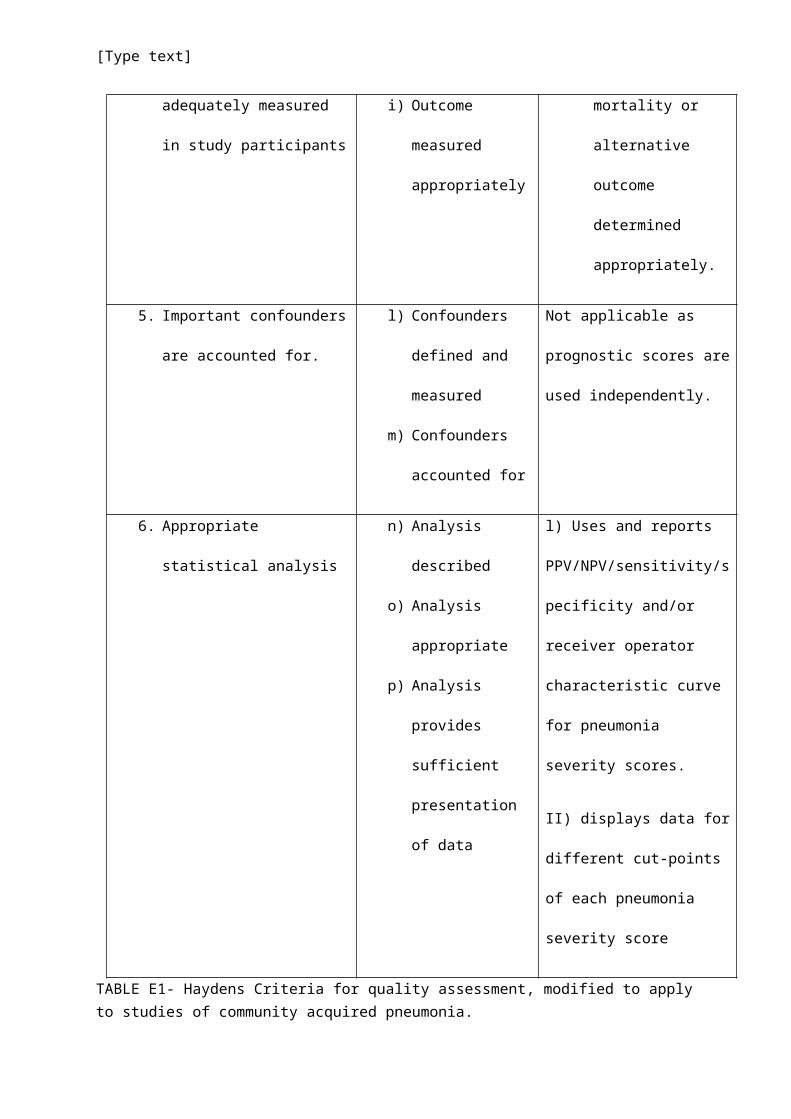
4. The outcomes of interest are
adequately measured in study
participants
h) Outcome defined
i) Outcome measured
appropriately
j) Mortality
k) 30-day mortality or
alternative outcome
determined
appropriately.
5. Important confounders are
accounted for.
l) Confounders
defined and
measured
m) Confounders
accounted for
Not applicable as prognostic
scores are used
independently.
6. Appropriate statistical analysis n) Analysis described
o) Analysis
appropriate
p) Analysis provides
sufficient
presentation of
data
l) Uses and reports
PPV/NPV/sensitivity/specificity
and/or receiver operator
characteristic curve for
pneumonia severity scores.
II) displays data for different
cut-points of each pneumonia
severity score
TABLE E1- Haydens Criteria for quality assessment, modified to apply to studies of community acquired pneumonia.
[Type text]
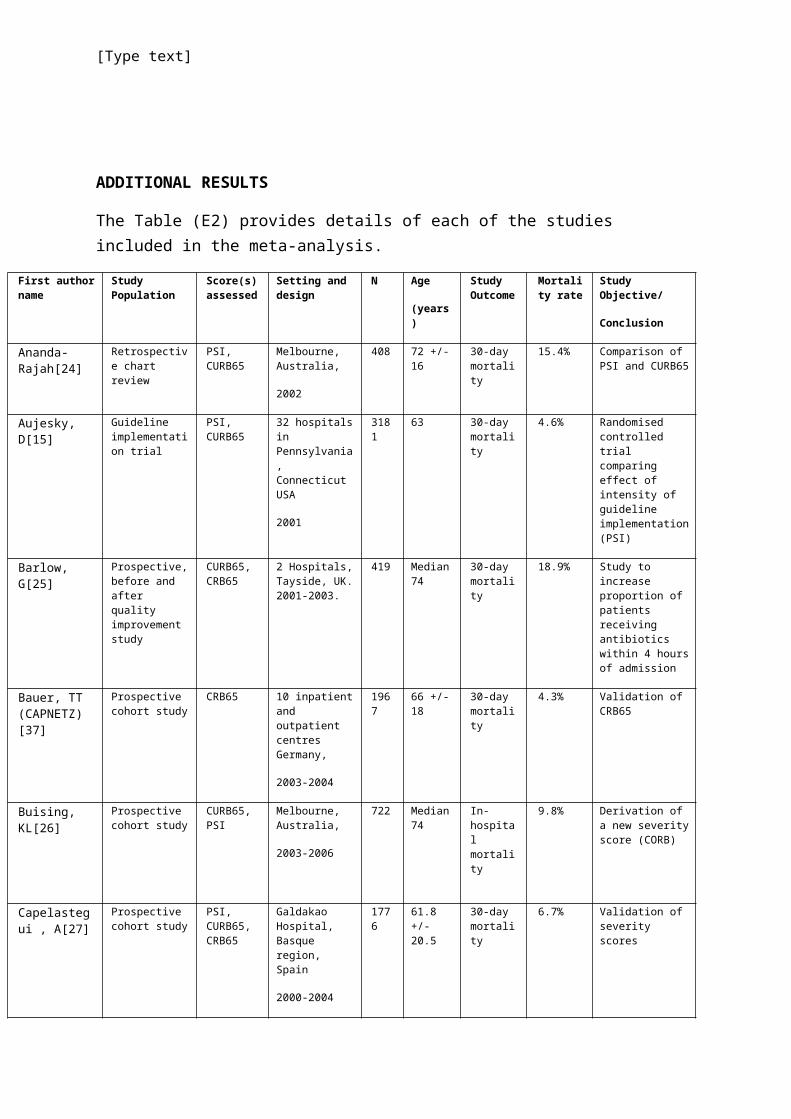
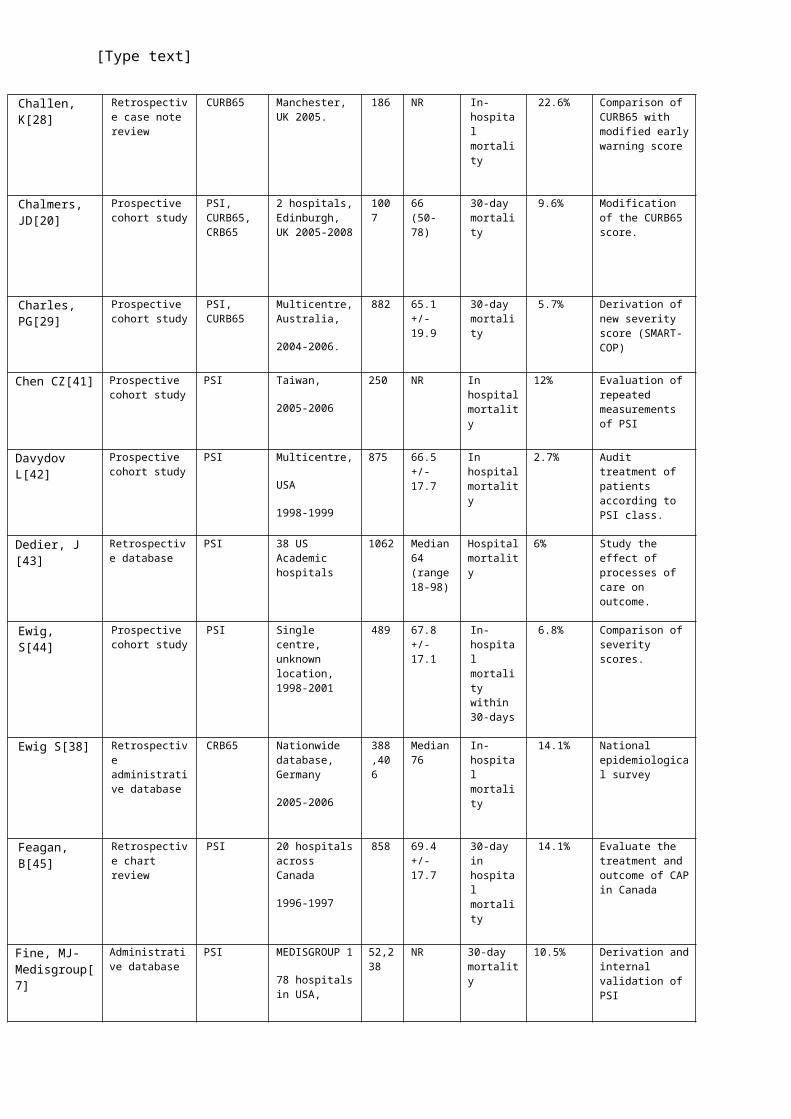
ADDITIONAL RESULTS
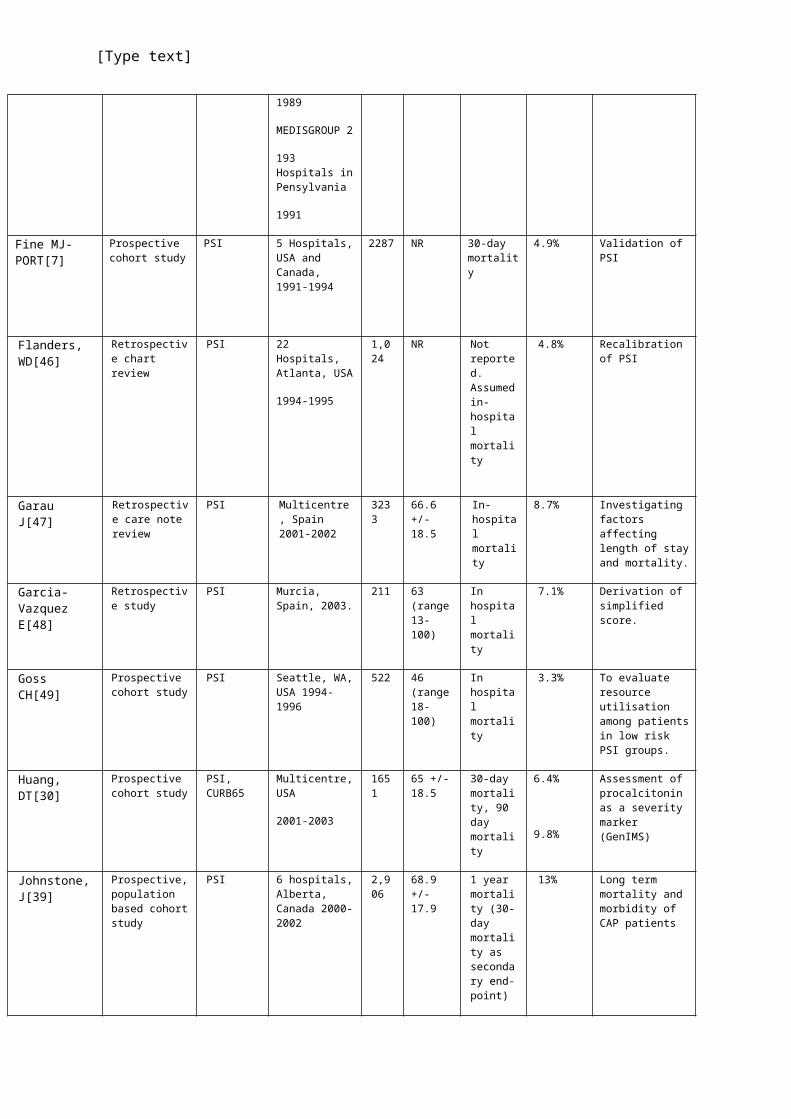
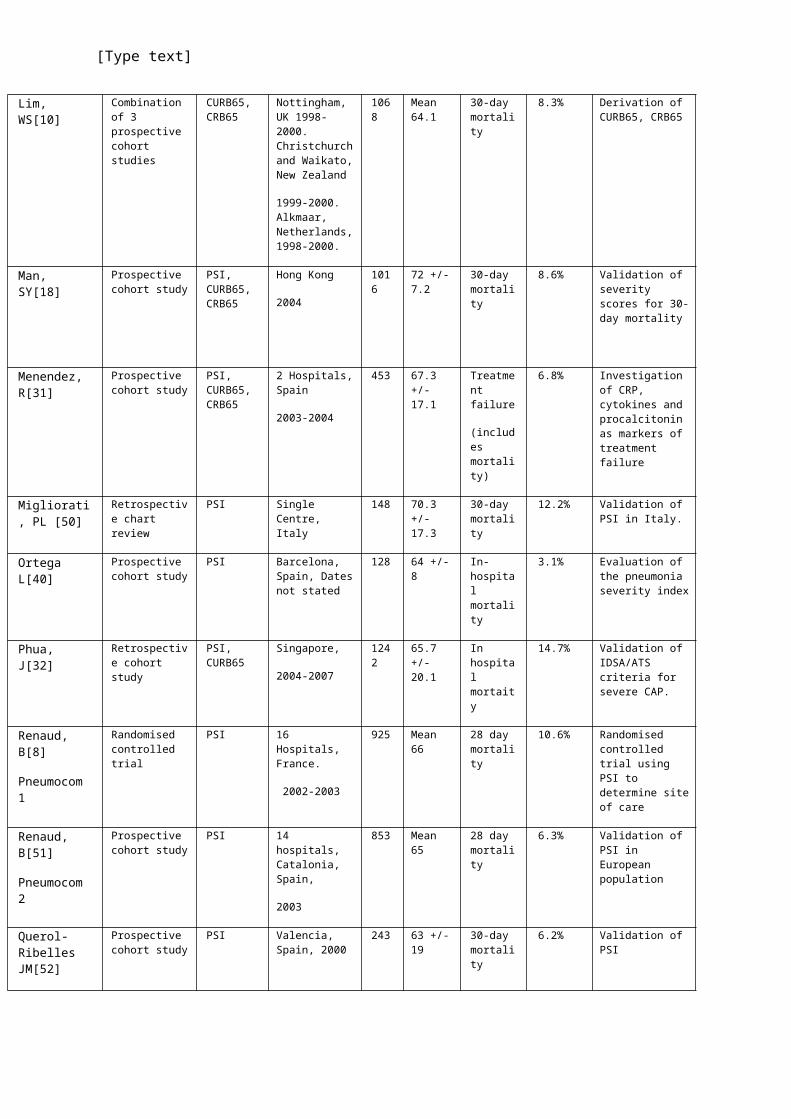
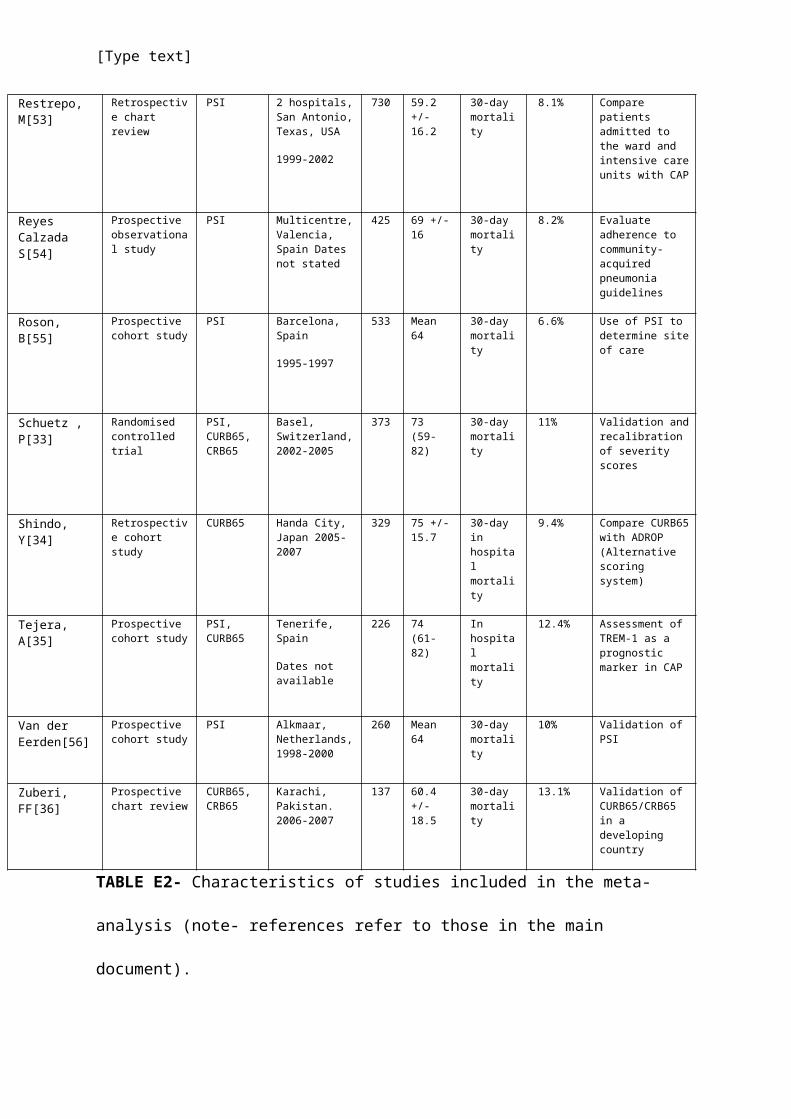
The Table (E2) provides details of each of the studies included in the meta-analysis.
First author name
Study Population
Score(s) assessed
Setting and design
N Age
(years)
Study Outcome
Mortality rate
Study Objective/
Conclusion
Ananda-Rajah[24]
Retrospective chart review
PSI, CURB65
Melbourne, Australia,
2002
408 72 +/- 16 30-day mortality
15.4% Comparison of PSI and CURB65
Aujesky, D[15] Guideline implementation trial
PSI, CURB65
32 hospitals in Pennsylvania, Connecticut USA
2001
3181 63 30-day mortality
4.6% Randomised controlled trial comparing effect of intensity of guideline implementation (PSI)
Barlow, G[25] Prospective, before and after quality improvement study
CURB65, CRB65
2 Hospitals, Tayside, UK. 2001-2003.
419 Median 74
30-day mortality
18.9% Study to increase proportion of patients receiving antibiotics within 4 hours of admission
Bauer, TT (CAPNETZ)[37]
Prospective cohort study
CRB65 10 inpatient and outpatient centres Germany,
2003-2004
1967 66 +/- 18 30-day mortality
4.3% Validation of CRB65
Buising, KL[26]
Prospective cohort study
CURB65, PSI
Melbourne, Australia,
2003-2006
722 Median 74
In-hospital mortality
9.8% Derivation of a new severity score (CORB)
Capelastegui , A[27]
Prospective cohort study
PSI, CURB65, CRB65
Galdakao Hospital, Basque region, Spain
2000-2004
1776 61.8 +/- 20.5
30-day mortality
6.7% Validation of severity scores
Challen, K[28] Retrospective case note review
CURB65 Manchester, UK 2005.
186 NR In-hospital mortality
22.6% Comparison of CURB65 with modified early warning score
[Type text]
Chalmers, JD[20]
Prospective cohort study
PSI, CURB65, CRB65
2 hospitals, Edinburgh, UK 2005-2008
1007 66 (50-78)
30-day mortality
9.6% Modification of the CURB65 score.
Charles, PG[29]
Prospective cohort study
PSI, CURB65
Multicentre, Australia,
2004-2006.
882 65.1 +/- 19.9
30-day mortality
5.7% Derivation of new severity score (SMART-COP)
Chen CZ[41] Prospective cohort study
PSI Taiwan,
2005-2006
250 NR In hospital mortality
12% Evaluation of repeated measurements of PSI
Davydov L[42] Prospective cohort study
PSI Multicentre,
USA
1998-1999
875 66.5 +/- 17.7
In hospital mortality
2.7% Audit treatment of patients according to PSI class.
Dedier, J [43] Retrospective database
PSI 38 US Academic hospitals
1062 Median 64 (range 18-98)
Hospital mortality
6% Study the effect of processes of care on outcome.
Ewig, S[44] Prospective cohort study
PSI Single centre, unknown location, 1998-2001
489 67.8 +/- 17.1
In-hospital mortality within 30-days
6.8% Comparison of severity scores.
Ewig S[38] Retrospective administrative database
CRB65 Nationwide database, Germany
2005-2006
388,406
Median 76
In-hospital mortality
14.1% National epidemiological survey
Feagan, B[45] Retrospective chart review
PSI 20 hospitals across Canada
1996-1997
858 69.4 +/- 17.7
30-day in hospital mortality
14.1% Evaluate the treatment and outcome of CAP in Canada
Fine, MJ- Medisgroup[7]
Administrative database
PSI MEDISGROUP 1
78 hospitals in USA,
1989
MEDISGROUP 2
193 Hospitals in Pensylvania
1991
52,238
NR 30-day mortality
10.5% Derivation and internal validation of PSI
[Type text]
Fine MJ- PORT[7]
Prospective cohort study
PSI 5 Hospitals, USA and Canada, 1991-1994
2287 NR 30-day mortality
4.9% Validation of PSI
Flanders, WD[46]
Retrospective chart review
PSI 22 Hospitals, Atlanta, USA
1994-1995
1,024 NR Not reported. Assumed in-hospital mortality
4.8% Recalibration of PSI
Garau J[47] Retrospective care note review
PSI Multicentre, Spain 2001-2002
3233 66.6 +/- 18.5
In-hospital mortality
8.7% Investigating factors affecting length of stay and mortality.
Garcia-Vazquez E[48]
Retrospective study
PSI Murcia, Spain, 2003.
211 63 (range 13-100)
In hospital mortality
7.1% Derivation of simplified score.
Goss CH[49] Prospective cohort study
PSI Seattle, WA, USA 1994-1996
522 46 (range 18-100)
In hospital mortality
3.3% To evaluate resource utilisation among patients in low risk PSI groups.
Huang, DT[30] Prospective cohort study
PSI, CURB65
Multicentre, USA
2001-2003
1651 65 +/- 18.5
30-day mortality, 90 day mortality
6.4%
9.8%
Assessment of procalcitonin as a severity marker (GenIMS)
Johnstone, J[39]
Prospective, population based cohort study
PSI 6 hospitals, Alberta, Canada 2000-2002
2,906 68.9 +/- 17.9
1 year mortality (30-day mortality as secondary end-point)
13% Long term mortality and morbidity of CAP patients
Lim, WS[10] Combination of 3 prospective cohort studies
CURB65, CRB65
Nottingham, UK 1998-2000. Christchurch and Waikato, New Zealand
1999-2000. Alkmaar, Netherlands, 1998-2000.
1068 Mean 64.1
30-day mortality
8.3% Derivation of CURB65, CRB65
Man, SY[18] Prospective cohort study
PSI, CURB65, CRB65
Hong Kong
2004
1016 72 +/- 7.2 30-day mortality
8.6% Validation of severity scores for 30-day mortality
[Type text]
Menendez, R[31]
Prospective cohort study
PSI, CURB65, CRB65
2 Hospitals, Spain
2003-2004
453 67.3 +/- 17.1
Treatment failure
(includes mortality)
6.8% Investigation of CRP, cytokines and procalcitonin as markers of treatment failure
Migliorati, PL [50]
Retrospective chart review
PSI Single Centre, Italy
148 70.3 +/- 17.3
30-day mortality
12.2% Validation of PSI in Italy.
Ortega L[40] Prospective cohort study
PSI Barcelona, Spain, Dates not stated
128 64 +/- 8 In-hospital mortality
3.1% Evaluation of the pneumonia severity index
Phua, J[32] Retrospective cohort study
PSI, CURB65
Singapore,
2004-2007
1242 65.7 +/- 20.1
In hospital mortaity
14.7% Validation of IDSA/ATS criteria for severe CAP.
Renaud, B[8]
Pneumocom 1
Randomised controlled trial
PSI 16 Hospitals, France.
2002-2003
925 Mean 66 28 day mortality
10.6% Randomised controlled trial using PSI to determine site of care
Renaud, B[51]
Pneumocom 2
Prospective cohort study
PSI 14 hospitals, Catalonia, Spain,
2003
853 Mean 65 28 day mortality
6.3% Validation of PSI in European population
Querol-Ribelles JM[52]
Prospective cohort study
PSI Valencia, Spain, 2000
243 63 +/- 19 30-day mortality
6.2% Validation of PSI
Restrepo, M[53]
Retrospective chart review
PSI 2 hospitals, San Antonio, Texas, USA
1999-2002
730 59.2 +/- 16.2
30-day mortality
8.1% Compare patients admitted to the ward and intensive care units with CAP
Reyes Calzada S[54]
Prospective observational study
PSI Multicentre, Valencia, Spain Dates not stated
425 69 +/- 16 30-day mortality
8.2% Evaluate adherence to community-acquired pneumonia guidelines
Roson, B[55] Prospective cohort study
PSI Barcelona, Spain
1995-1997
533 Mean 64 30-day mortality
6.6% Use of PSI to determine site of care
Schuetz , P[33] Randomised controlled trial
PSI, CURB65, CRB65
Basel, Switzerland, 2002-2005
373 73 (59-82)
30-day mortality
11% Validation and recalibration of severity scores
[Type text]
Shindo, Y[34] Retrospective cohort study
CURB65 Handa City, Japan 2005-2007
329 75 +/- 15.7
30-day in hospital mortality
9.4% Compare CURB65 with ADROP (Alternative scoring system)
Tejera, A[35] Prospective cohort study
PSI, CURB65
Tenerife, Spain
Dates not available
226 74 (61-82)
In hospital mortality
12.4% Assessment of TREM-1 as a prognostic marker in CAP
Van der Eerden[56]
Prospective cohort study
PSI Alkmaar, Netherlands, 1998-2000
260 Mean 64 30-day mortality
10% Validation of PSI
Zuberi, FF[36] Prospective chart review
CURB65, CRB65
Karachi, Pakistan. 2006-2007
137 60.4 +/- 18.5
30-day mortality
13.1% Validation of CURB65/CRB65 in a developing country
TABLE E2- Characteristics of studies included in the meta-analysis (note- references refer to
those in the main document).
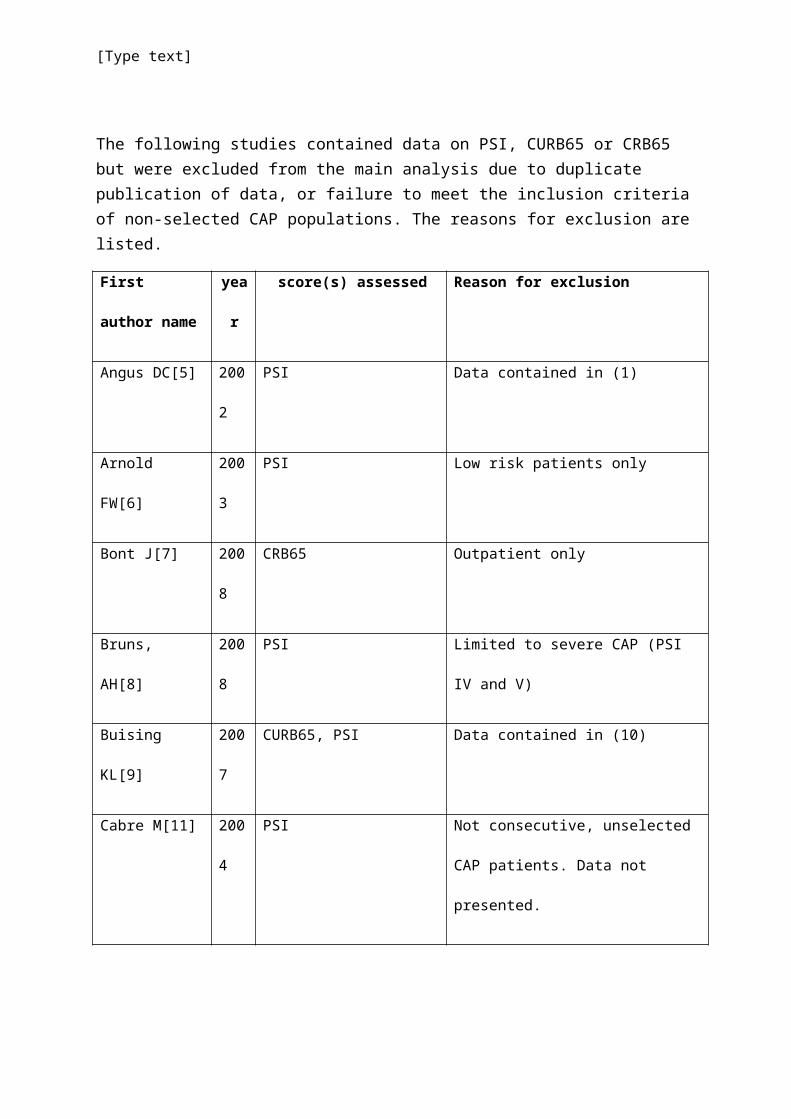
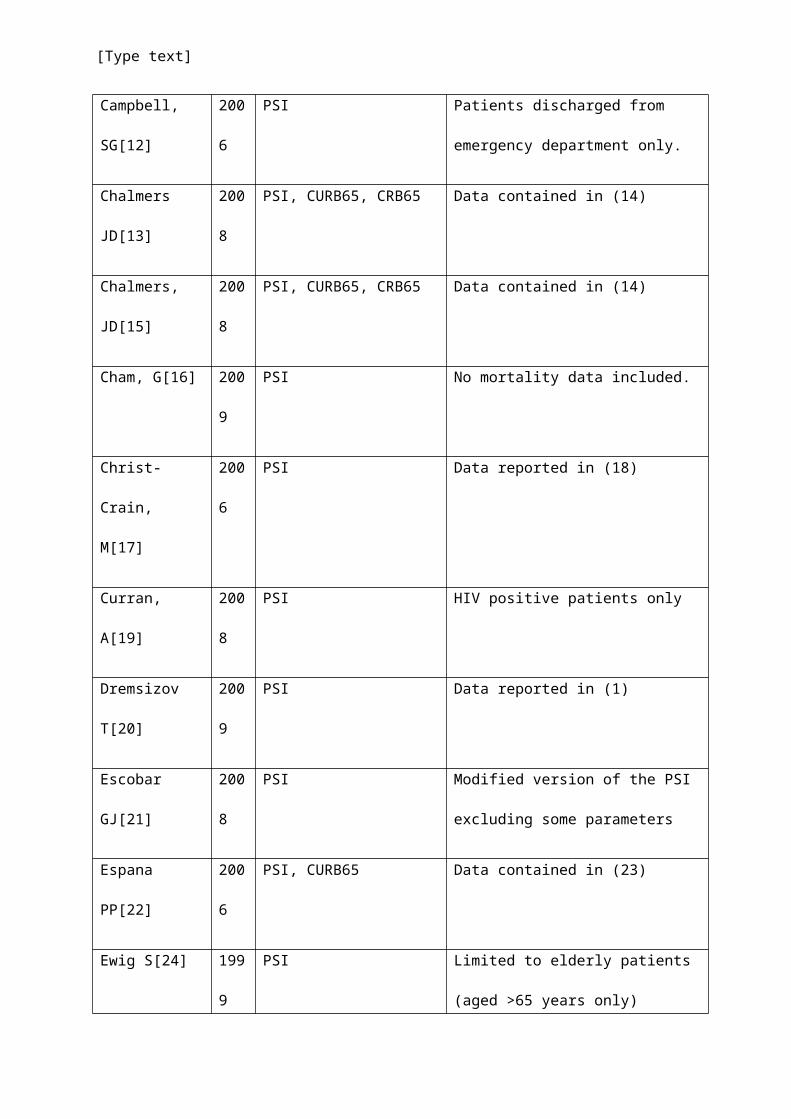
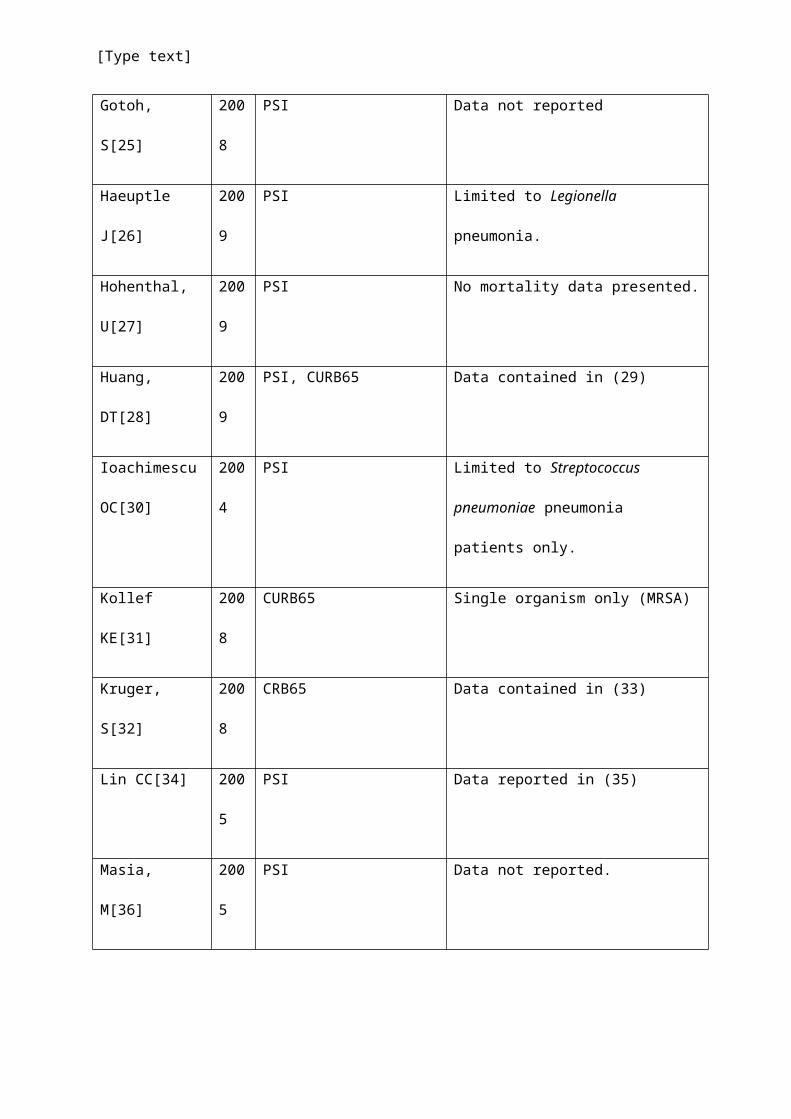
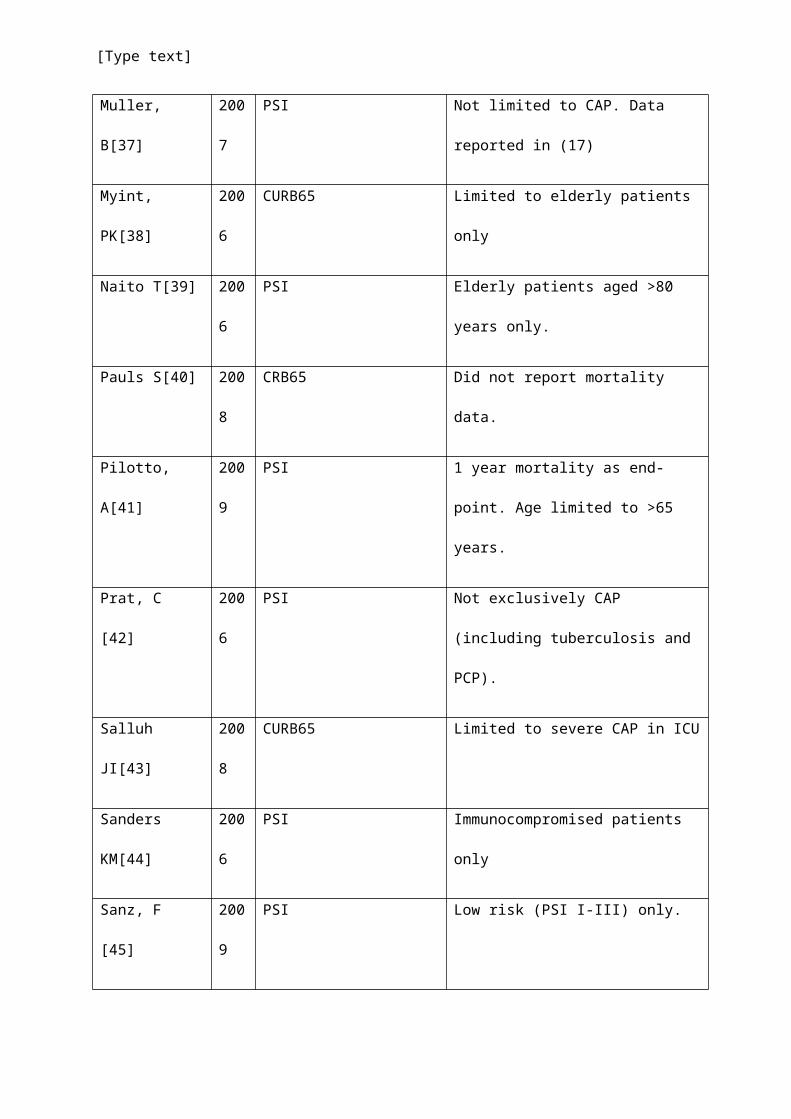
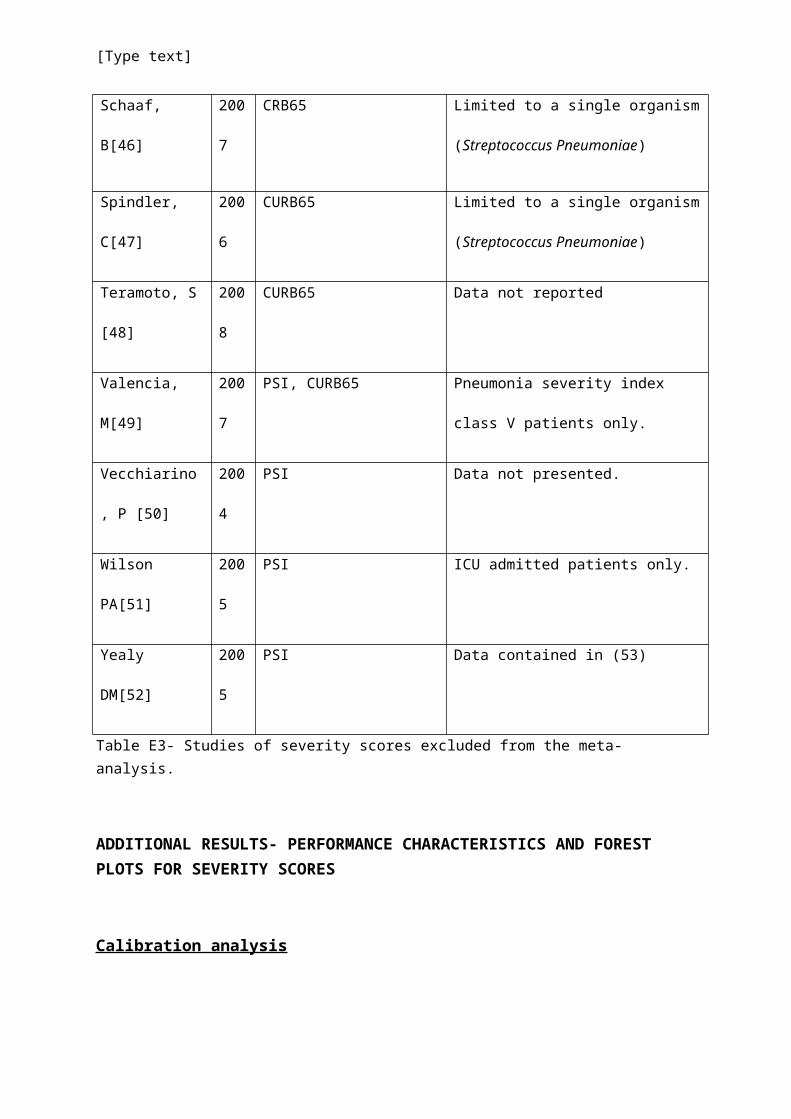
The following studies contained data on PSI, CURB65 or CRB65 but were excluded from the main analysis due to duplicate publication of data, or failure to meet the inclusion criteria of non-selected CAP populations. The reasons for exclusion are listed.
First author
name
year score(s) assessed Reason for exclusion
Angus DC[5] 2002 PSI Data contained in (1)
Arnold FW[6] 2003 PSI Low risk patients only
Bont J[7] 2008 CRB65 Outpatient only
Bruns, AH[8] 2008 PSI Limited to severe CAP (PSI IV and V)
Buising KL[9] 2007 CURB65, PSI Data contained in (10)
Cabre M[11] 2004 PSI Not consecutive, unselected CAP
[Type text]
patients. Data not presented.
Campbell, SG[12] 2006 PSI Patients discharged from emergency
department only.
Chalmers JD[13] 2008 PSI, CURB65, CRB65 Data contained in (14)
Chalmers, JD[15] 2008 PSI, CURB65, CRB65 Data contained in (14)
Cham, G[16] 2009 PSI No mortality data included.
Christ-Crain,
M[17]
2006 PSI Data reported in (18)
Curran, A[19] 2008 PSI HIV positive patients only
Dremsizov T[20] 2009 PSI Data reported in (1)
Escobar GJ[21] 2008 PSI Modified version of the PSI excluding
some parameters
Espana PP[22] 2006 PSI, CURB65 Data contained in (23)
Ewig S[24] 1999 PSI Limited to elderly patients (aged >65
years only)
Gotoh, S[25] 2008 PSI Data not reported
Haeuptle J[26] 2009 PSI Limited to Legionella pneumonia.
Hohenthal, U[27] 2009 PSI No mortality data presented.
Huang, DT[28] 2009 PSI, CURB65 Data contained in (29)
Ioachimescu 2004 PSI Limited to Streptococcus pneumoniae
[Type text]
OC[30] pneumonia patients only.
Kollef KE[31] 2008 CURB65 Single organism only (MRSA)
Kruger, S[32] 2008 CRB65 Data contained in (33)
Lin CC[34] 2005 PSI Data reported in (35)
Masia, M[36] 2005 PSI Data not reported.
Muller, B[37] 2007 PSI Not limited to CAP. Data reported in (17)
Myint, PK[38] 2006 CURB65 Limited to elderly patients only
Naito T[39] 2006 PSI Elderly patients aged >80 years only.
Pauls S[40] 2008 CRB65 Did not report mortality data.
Pilotto, A[41] 2009 PSI 1 year mortality as end-point. Age limited
to >65 years.
Prat, C [42] 2006 PSI Not exclusively CAP (including
tuberculosis and PCP).
Salluh JI[43] 2008 CURB65 Limited to severe CAP in ICU
Sanders KM[44] 2006 PSI Immunocompromised patients only
Sanz, F [45] 2009 PSI Low risk (PSI I-III) only.
Schaaf, B[46] 2007 CRB65 Limited to a single organism
(Streptococcus Pneumoniae)
Spindler, C[47] 2006 CURB65 Limited to a single organism
(Streptococcus Pneumoniae)
[Type text]
Teramoto, S [48] 2008 CURB65 Data not reported
Valencia, M[49] 2007 PSI, CURB65 Pneumonia severity index class V
patients only.
Vecchiarino, P
[50]
2004 PSI Data not presented.
Wilson PA[51] 2005 PSI ICU admitted patients only.
Yealy DM[52] 2005 PSI Data contained in (53)
Table E3- Studies of severity scores excluded from the meta-analysis.
ADDITIONAL RESULTS- PERFORMANCE CHARACTERISTICS AND FOREST PLOTS FOR SEVERITY SCORES
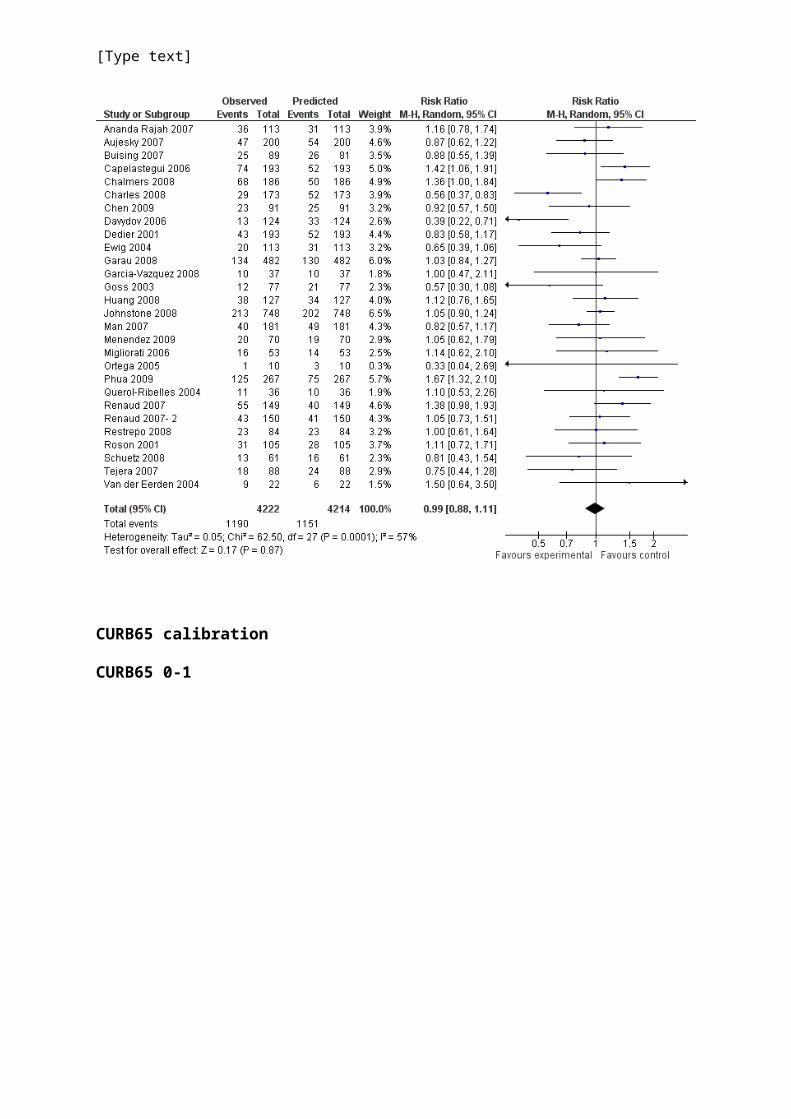
Calibration analysis
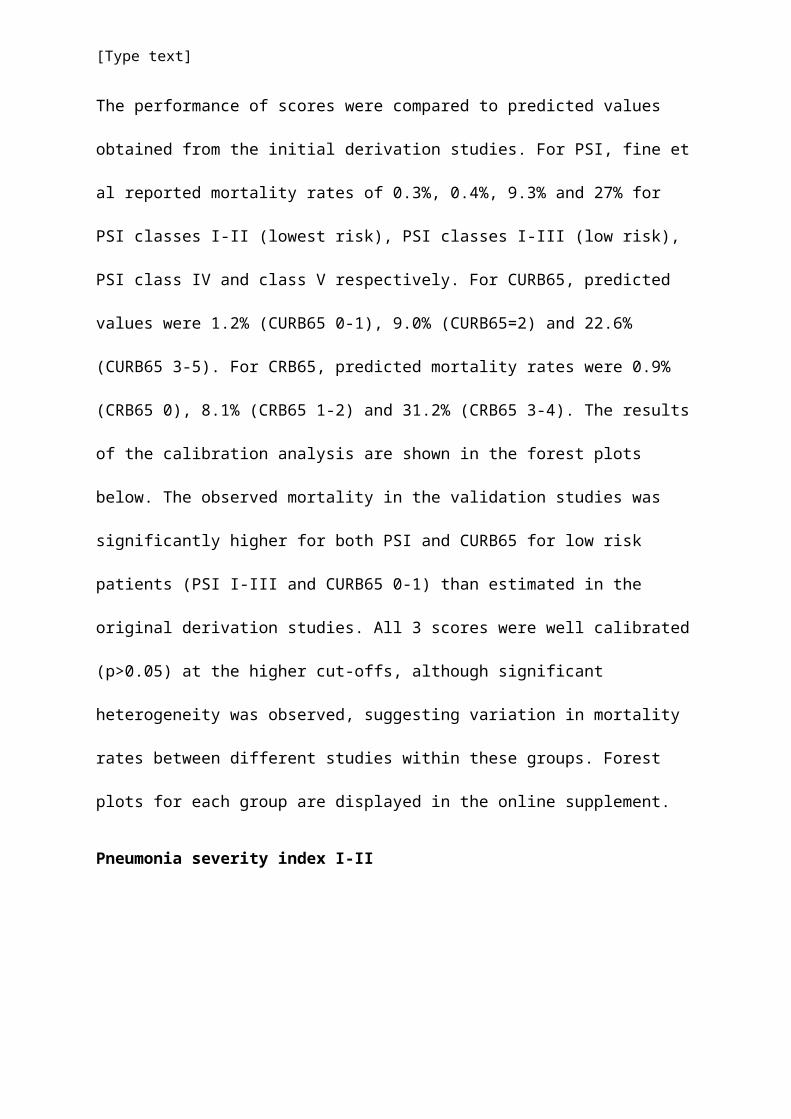
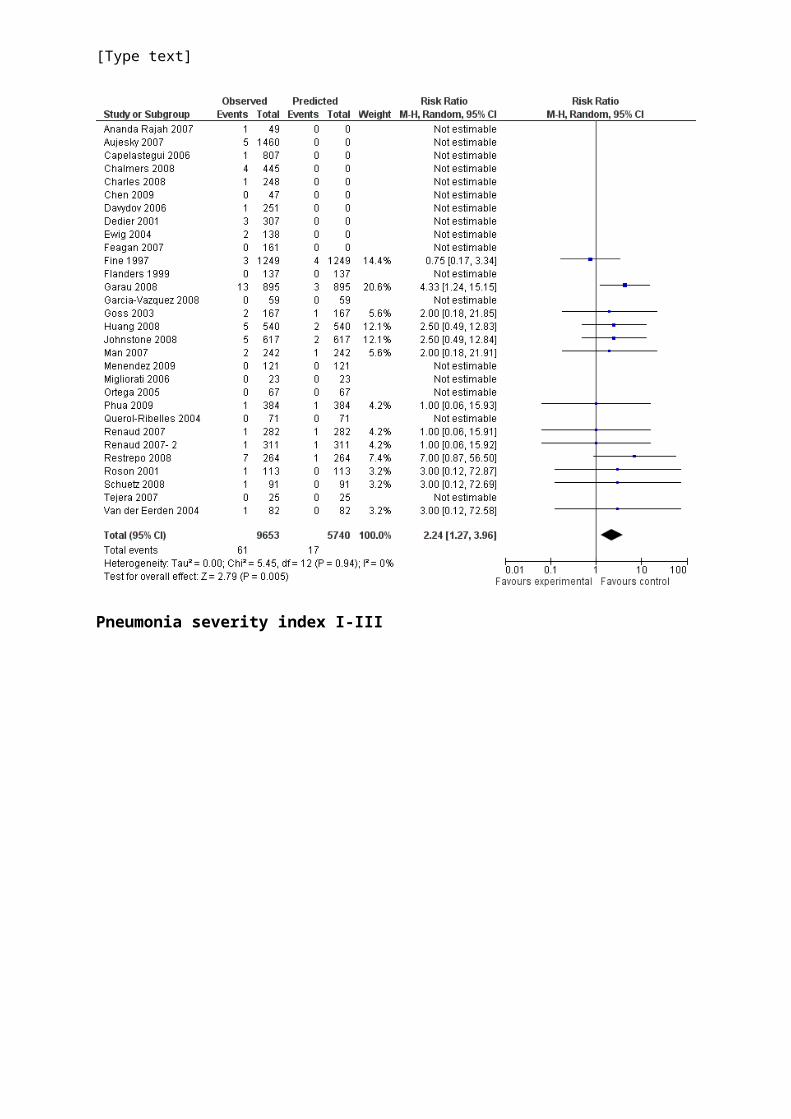
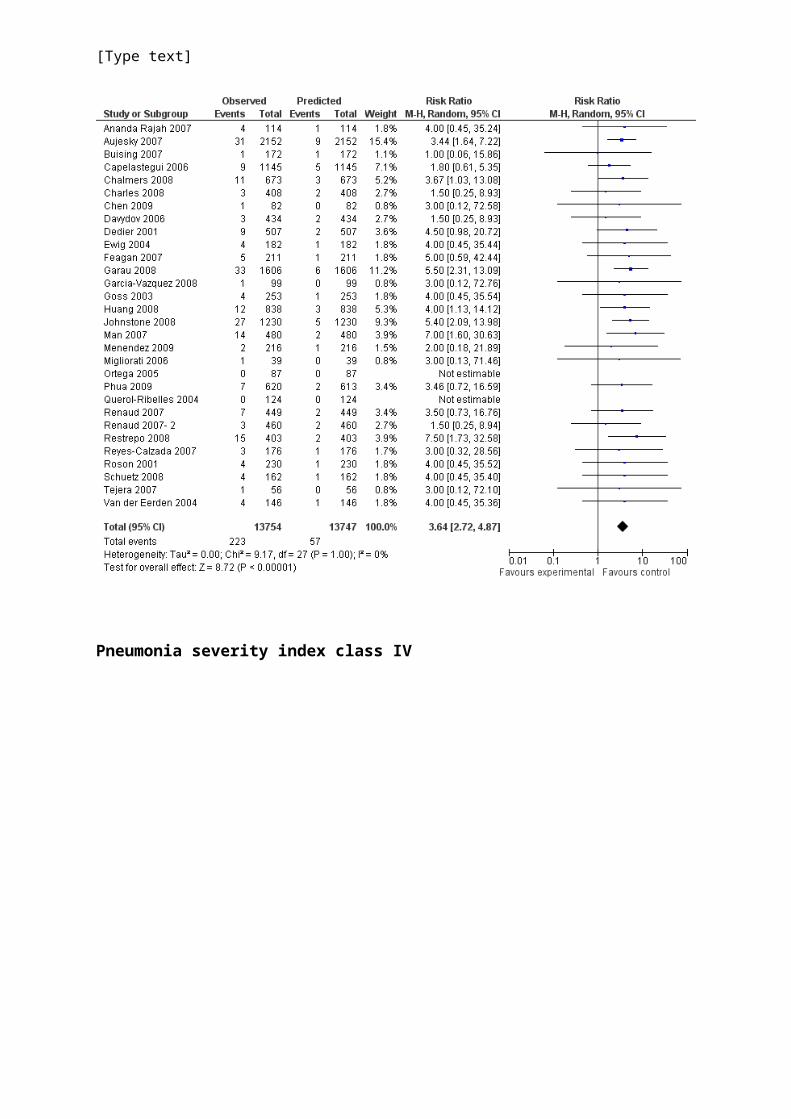
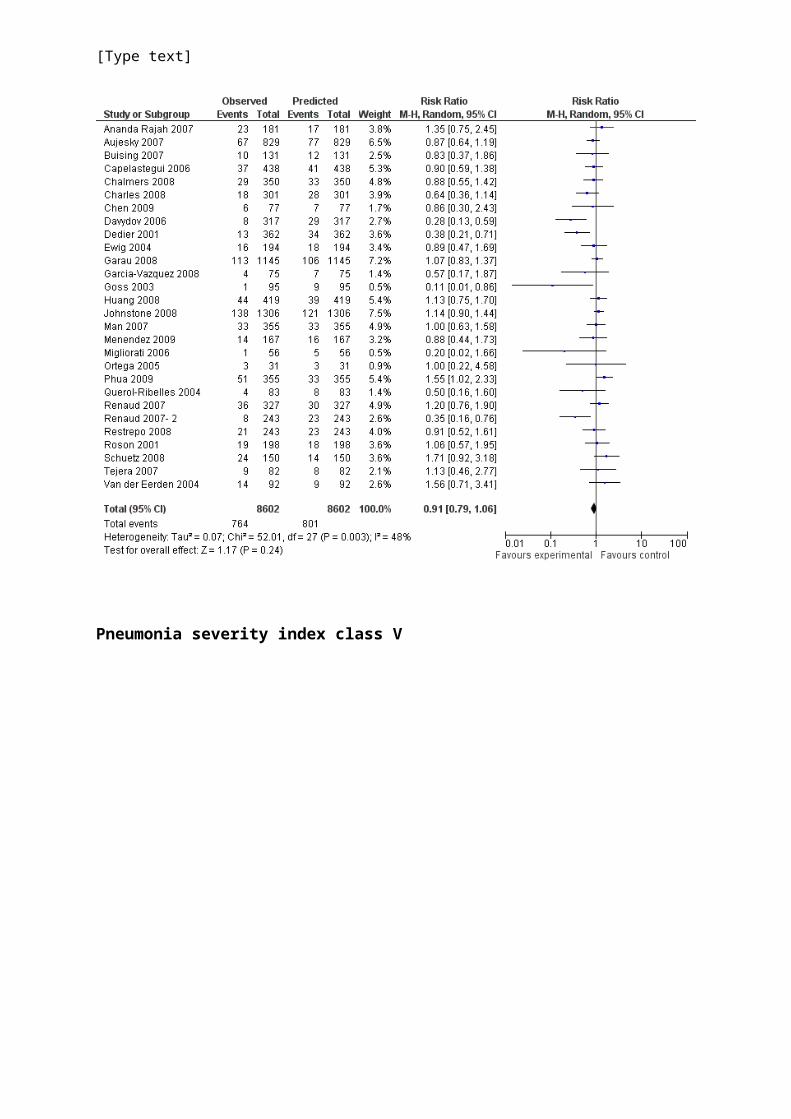
The performance of scores were compared to predicted values obtained from the initial
derivation studies. For PSI, fine et al reported mortality rates of 0.3%, 0.4%, 9.3% and 27%
for PSI classes I-II (lowest risk), PSI classes I-III (low risk), PSI class IV and class V
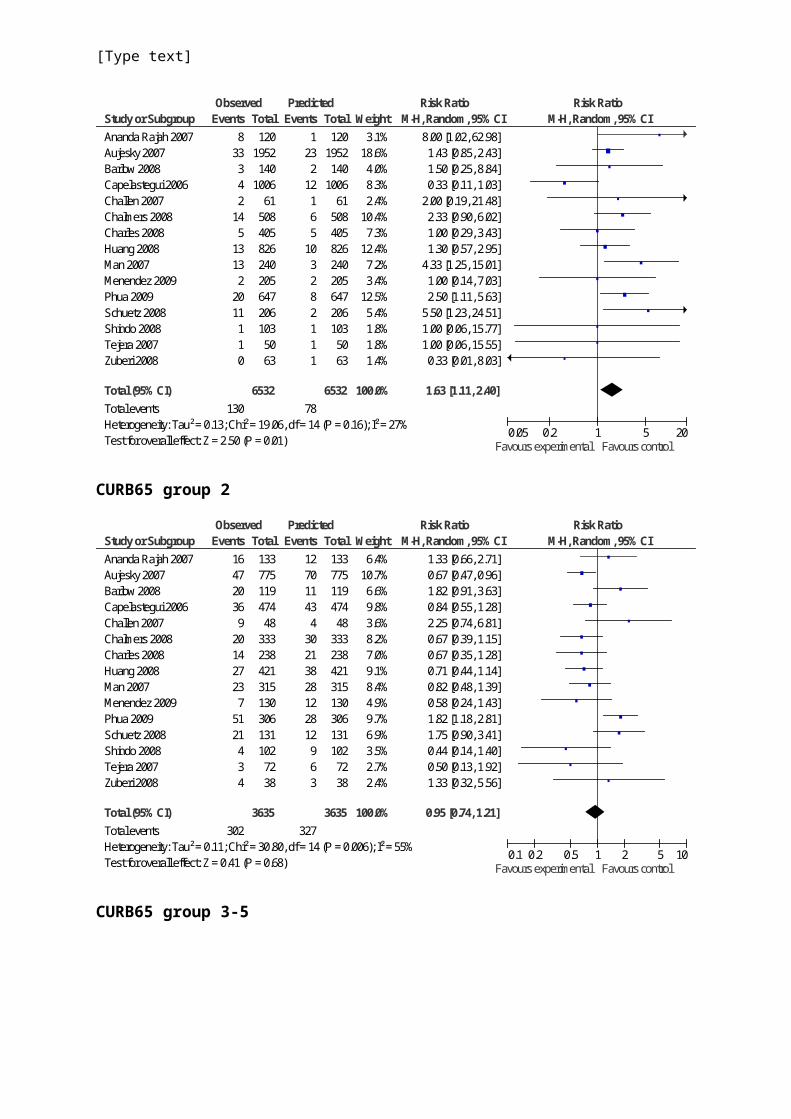
respectively. For CURB65, predicted values were 1.2% (CURB65 0-1), 9.0% (CURB65=2)
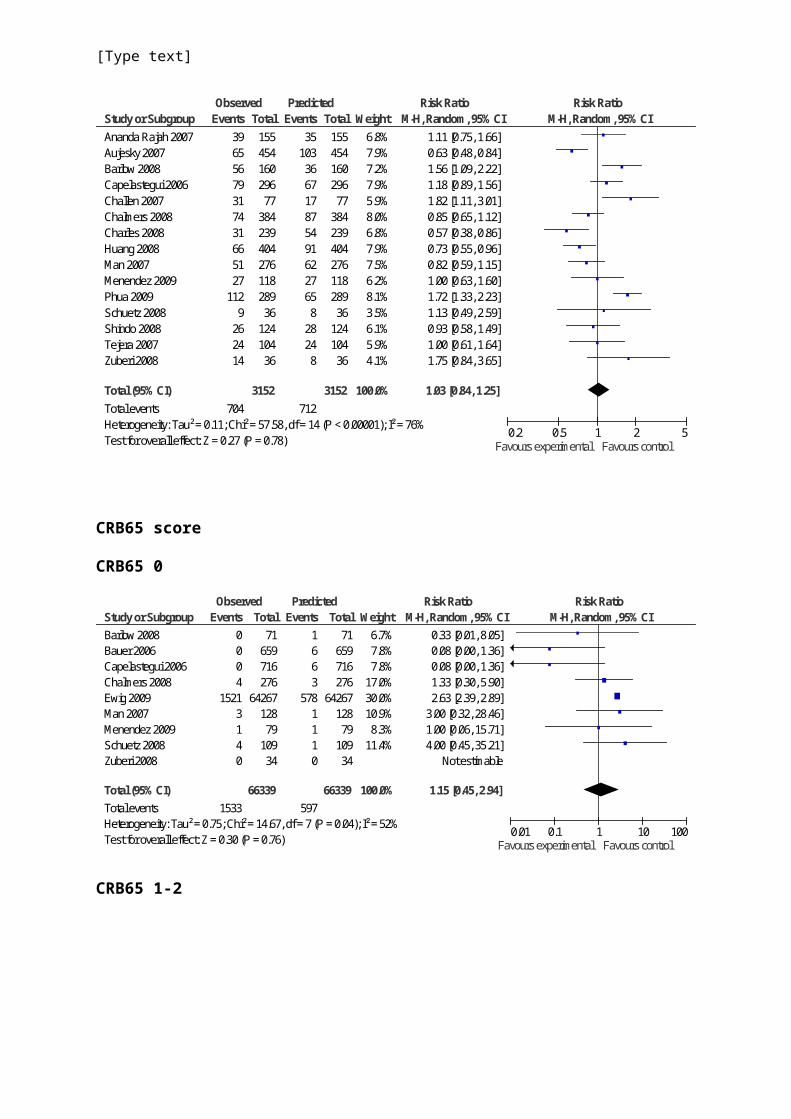
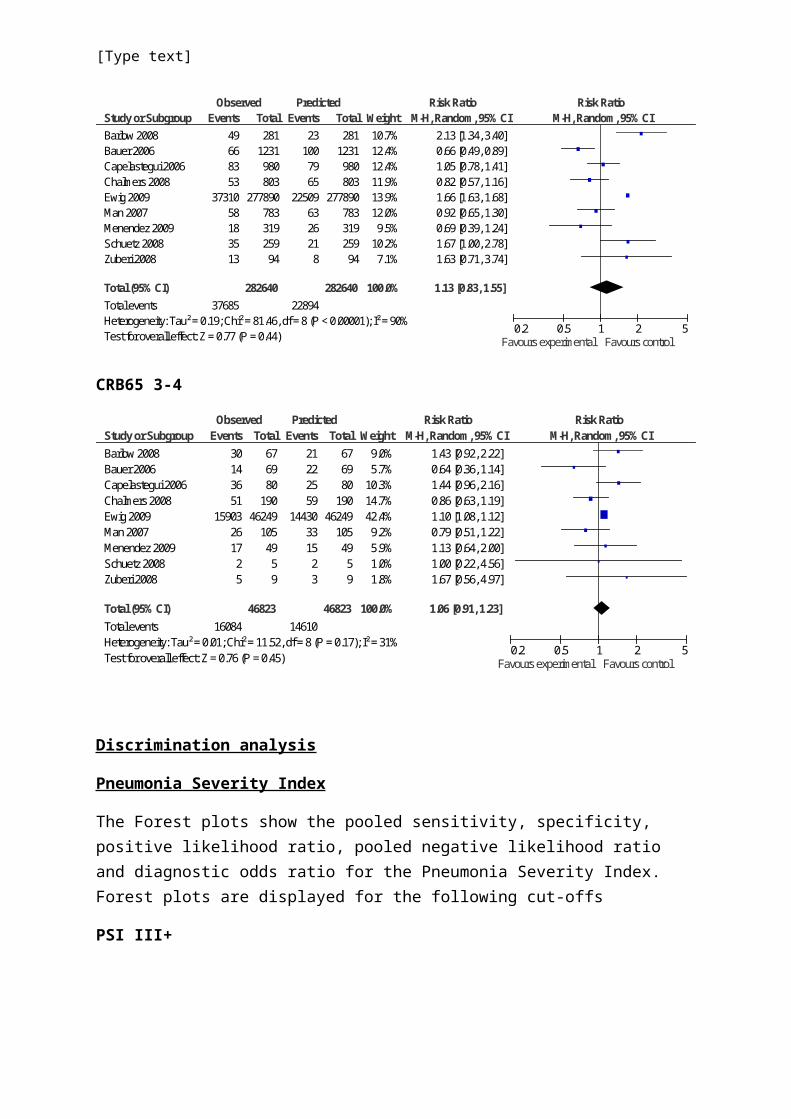
and 22.6% (CURB65 3-5). For CRB65, predicted mortality rates were 0.9% (CRB65 0),
8.1% (CRB65 1-2) and 31.2% (CRB65 3-4). The results of the calibration analysis are shown
in the forest plots below. The observed mortality in the validation studies was significantly
higher for both PSI and CURB65 for low risk patients (PSI I-III and CURB65 0-1) than
estimated in the original derivation studies. All 3 scores were well calibrated (p>0.05) at the
higher cut-offs, although significant heterogeneity was observed, suggesting variation in
[Type text]
mortality rates between different studies within these groups. Forest plots for each group are
displayed in the online supplement.
Pneumonia severity index I-II
Pneumonia severity index I-III
[Type text]
Pneumonia severity index class IV
[Type text]
Pneumonia severity index class V
[Type text]
CURB65 calibration
CURB65 0-1
[Type text]
Study or SubgroupAnanda Rajah 2007Aujesky 2007Barlow 2008Capelastegui 2006Challen 2007Chalmers 2008Charles 2008Huang 2008Man 2007Menendez 2009Phua 2009Schuetz 2008Shindo 2008Tejera 2007Zuberi 2008
Total (95% CI)Total eventsHeterogeneity: Tau² = 0.13; Chi² = 19.06, df = 14 (P = 0.16); I² = 27%Test for overall effect: Z = 2.50 (P = 0.01)
Events8
33342
145
13132
2011110
130
Total120
1952140
100661
5084058262402056472061035063
6532
Events1
232
12165
103282111
78
Total120
1952140
100661
5084058262402056472061035063
6532
Weight3.1%
18.6%4.0%8.3%2.4%
10.4%7.3%
12.4%7.2%3.4%
12.5%5.4%1.8%1.8%1.4%
100.0%
M-H, Random, 95% CI8.00 [1.02, 62.98]1.43 [0.85, 2.43]1.50 [0.25, 8.84]0.33 [0.11, 1.03]
2.00 [0.19, 21.48]2.33 [0.90, 6.02]1.00 [0.29, 3.43]1.30 [0.57, 2.95]
4.33 [1.25, 15.01]1.00 [0.14, 7.03]2.50 [1.11, 5.63]
5.50 [1.23, 24.51]1.00 [0.06, 15.77]1.00 [0.06, 15.55]0.33 [0.01, 8.03]
1.63 [1.11, 2.40]
Observed Predicted Risk Ratio Risk RatioM-H, Random, 95% CI
0.05 0.2 1 5 20Favours experimental Favours control
CURB65 group 2
Study or SubgroupAnanda Rajah 2007Aujesky 2007Barlow 2008Capelastegui 2006Challen 2007Chalmers 2008Charles 2008Huang 2008Man 2007Menendez 2009Phua 2009Schuetz 2008Shindo 2008Tejera 2007Zuberi 2008
Total (95% CI)Total eventsHeterogeneity: Tau² = 0.11; Chi² = 30.80, df = 14 (P = 0.006); I² = 55%Test for overall effect: Z = 0.41 (P = 0.68)
Events164720369
201427237
5121434
302
Total13377511947448
3332384213151303061311027238
3635
Events127011434
30213828122812963
327
Total13377511947448
3332384213151303061311027238
3635
Weight6.4%
10.7%6.6%9.8%3.6%8.2%7.0%9.1%8.4%4.9%9.7%6.9%3.5%2.7%2.4%
100.0%
M-H, Random, 95% CI1.33 [0.66, 2.71]0.67 [0.47, 0.96]1.82 [0.91, 3.63]0.84 [0.55, 1.28]2.25 [0.74, 6.81]0.67 [0.39, 1.15]0.67 [0.35, 1.28]0.71 [0.44, 1.14]0.82 [0.48, 1.39]0.58 [0.24, 1.43]1.82 [1.18, 2.81]1.75 [0.90, 3.41]0.44 [0.14, 1.40]0.50 [0.13, 1.92]1.33 [0.32, 5.56]
0.95 [0.74, 1.21]
Observed Predicted Risk Ratio Risk RatioM-H, Random, 95% CI
0.1 0.2 0.5 1 2 5 10Favours experimental Favours control
CURB65 group 3-5
[Type text]
Study or SubgroupAnanda Rajah 2007Aujesky 2007Barlow 2008Capelastegui 2006Challen 2007Chalmers 2008Charles 2008Huang 2008Man 2007Menendez 2009Phua 2009Schuetz 2008Shindo 2008Tejera 2007Zuberi 2008
Total (95% CI)Total eventsHeterogeneity: Tau² = 0.11; Chi² = 57.58, df = 14 (P < 0.00001); I² = 76%Test for overall effect: Z = 0.27 (P = 0.78)
Events39655679317431665127
1129
262414
704
Total15545416029677
38423940427611828936
12410436
3152
Events35
1033667178754916227658
28248
712
Total15545416029677
38423940427611828936
12410436
3152
Weight6.8%7.9%7.2%7.9%5.9%8.0%6.8%7.9%7.5%6.2%8.1%3.5%6.1%5.9%4.1%
100.0%
M-H, Random, 95% CI1.11 [0.75, 1.66]0.63 [0.48, 0.84]1.56 [1.09, 2.22]1.18 [0.89, 1.56]1.82 [1.11, 3.01]0.85 [0.65, 1.12]0.57 [0.38, 0.86]0.73 [0.55, 0.96]0.82 [0.59, 1.15]1.00 [0.63, 1.60]1.72 [1.33, 2.23]1.13 [0.49, 2.59]0.93 [0.58, 1.49]1.00 [0.61, 1.64]1.75 [0.84, 3.65]
1.03 [0.84, 1.25]
Observed Predicted Risk Ratio Risk RatioM-H, Random, 95% CI
0.2 0.5 1 2 5Favours experimental Favours control
CRB65 score
CRB65 0
Study or SubgroupBarlow 2008Bauer 2006Capelastegui 2006Chalmers 2008Ewig 2009Man 2007Menendez 2009Schuetz 2008Zuberi 2008
Total (95% CI)Total eventsHeterogeneity: Tau² = 0.75; Chi² = 14.67, df = 7 (P = 0.04); I² = 52%Test for overall effect: Z = 0.30 (P = 0.76)
Events0004
15213140
1533
Total71
659716276
6426712879
10934
66339
Events1663
5781110
597
Total71
659716276
6426712879
10934
66339
Weight6.7%7.8%7.8%
17.0%30.0%10.9%8.3%
11.4%
100.0%
M-H, Random, 95% CI0.33 [0.01, 8.05]0.08 [0.00, 1.36]0.08 [0.00, 1.36]1.33 [0.30, 5.90]2.63 [2.39, 2.89]
3.00 [0.32, 28.46]1.00 [0.06, 15.71]4.00 [0.45, 35.21]
Not estimable
1.15 [0.45, 2.94]
Observed Predicted Risk Ratio Risk RatioM-H, Random, 95% CI
0.01 0.1 1 10 100Favours experimental Favours control
CRB65 1-2
[Type text]
Study or SubgroupBarlow 2008Bauer 2006Capelastegui 2006Chalmers 2008Ewig 2009Man 2007Menendez 2009Schuetz 2008Zuberi 2008
Total (95% CI)Total eventsHeterogeneity: Tau² = 0.19; Chi² = 81.46, df = 8 (P < 0.00001); I² = 90%Test for overall effect: Z = 0.77 (P = 0.44)
Events49668353
3731058183513
37685
Total281
1231980803
27789078331925994
282640
Events23
1007965
225096326218
22894
Total281
1231980803
27789078331925994
282640
Weight10.7%12.4%12.4%11.9%13.9%12.0%9.5%
10.2%7.1%
100.0%
M-H, Random, 95% CI2.13 [1.34, 3.40]0.66 [0.49, 0.89]1.05 [0.78, 1.41]0.82 [0.57, 1.16]1.66 [1.63, 1.68]0.92 [0.65, 1.30]0.69 [0.39, 1.24]1.67 [1.00, 2.78]1.63 [0.71, 3.74]
1.13 [0.83, 1.55]
Observed Predicted Risk Ratio Risk RatioM-H, Random, 95% CI
0.2 0.5 1 2 5Favours experimental Favours control
CRB65 3-4
Study or SubgroupBarlow 2008Bauer 2006Capelastegui 2006Chalmers 2008Ewig 2009Man 2007Menendez 2009Schuetz 2008Zuberi 2008
Total (95% CI)Total eventsHeterogeneity: Tau² = 0.01; Chi² = 11.52, df = 8 (P = 0.17); I² = 31%Test for overall effect: Z = 0.76 (P = 0.45)
Events30143651
15903261725
16084
Total676980
19046249
1054959
46823
Events21222559
14430331523
14610
Total676980
19046249
1054959
46823
Weight9.0%5.7%
10.3%14.7%42.4%9.2%5.9%1.0%1.8%
100.0%
M-H, Random, 95% CI1.43 [0.92, 2.22]0.64 [0.36, 1.14]1.44 [0.96, 2.16]0.86 [0.63, 1.19]1.10 [1.08, 1.12]0.79 [0.51, 1.22]1.13 [0.64, 2.00]1.00 [0.22, 4.56]1.67 [0.56, 4.97]
1.06 [0.91, 1.23]
Observed Predicted Risk Ratio Risk RatioM-H, Random, 95% CI
0.2 0.5 1 2 5Favours experimental Favours control
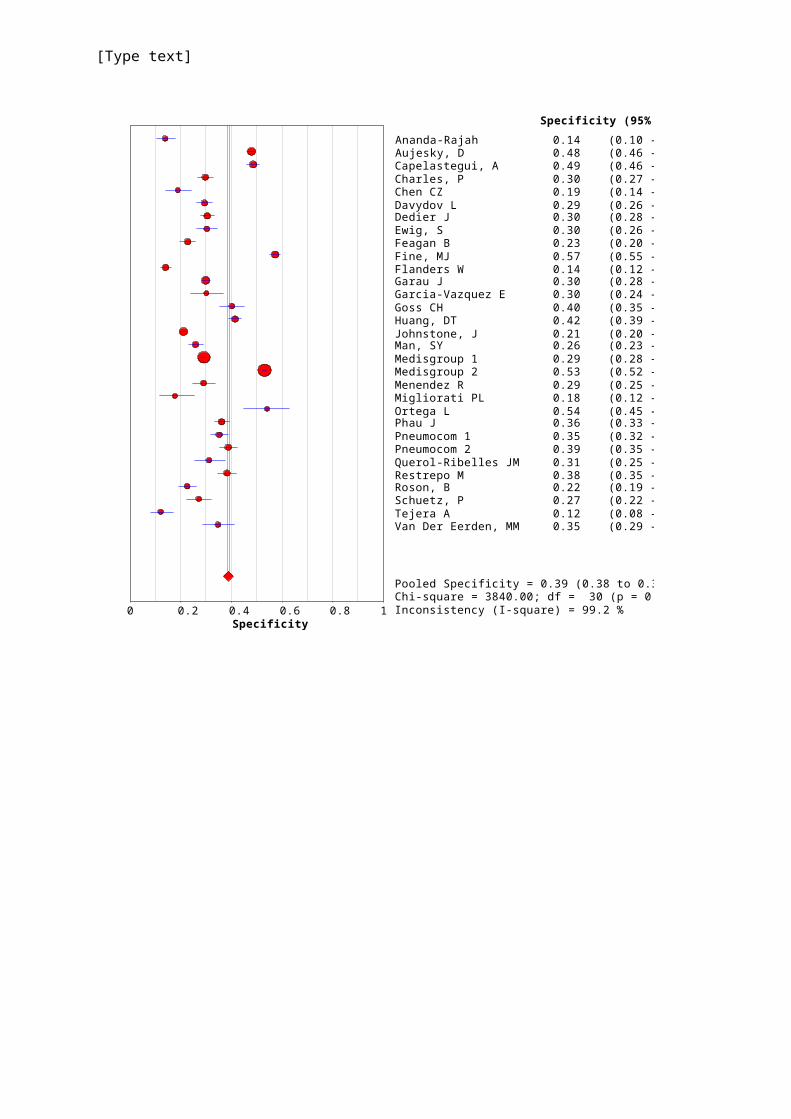
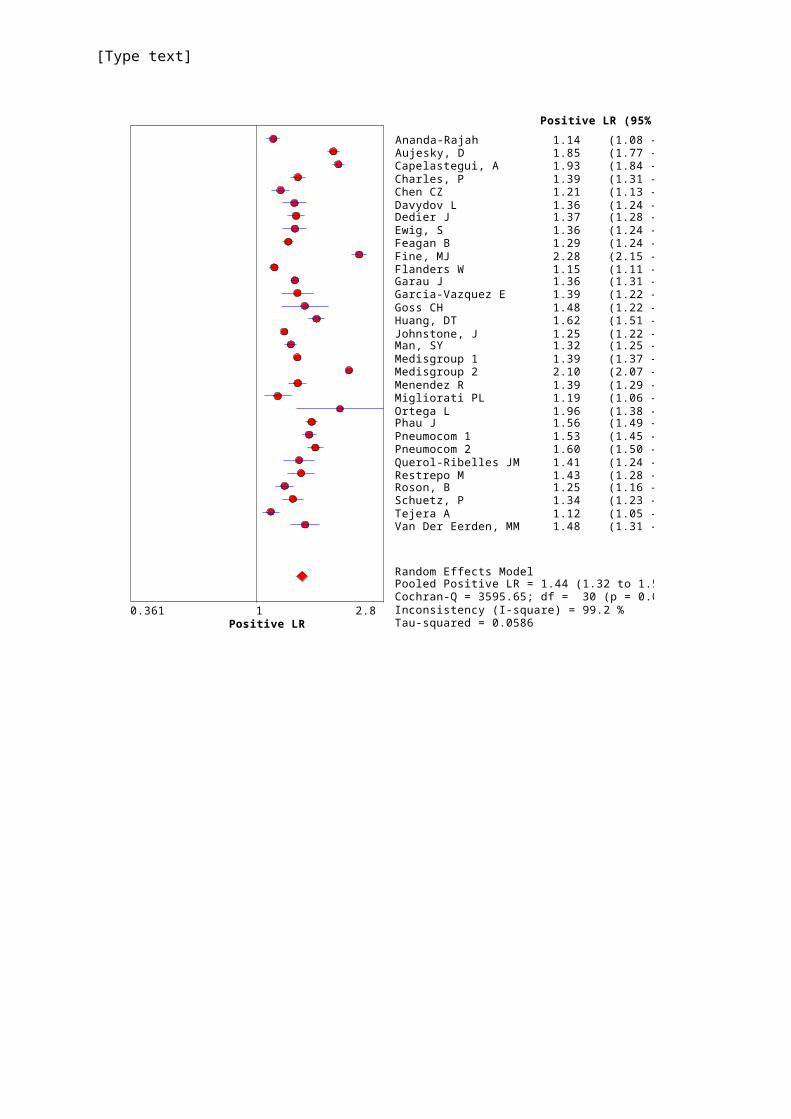
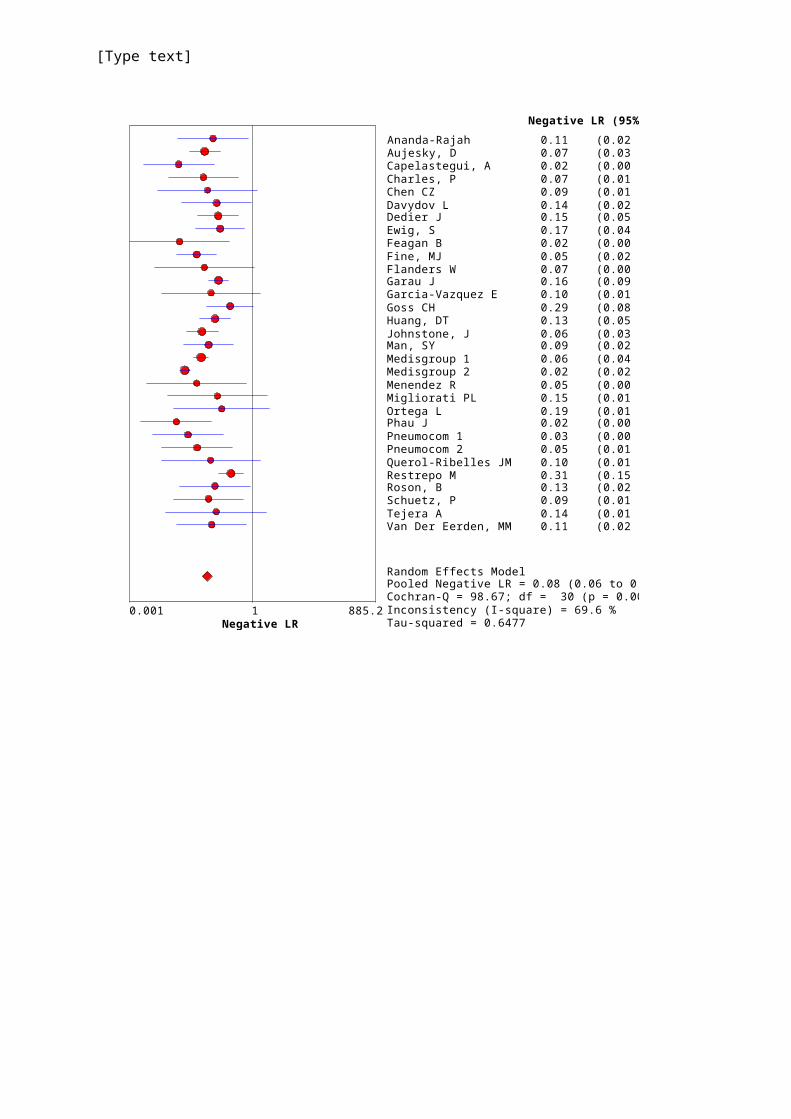
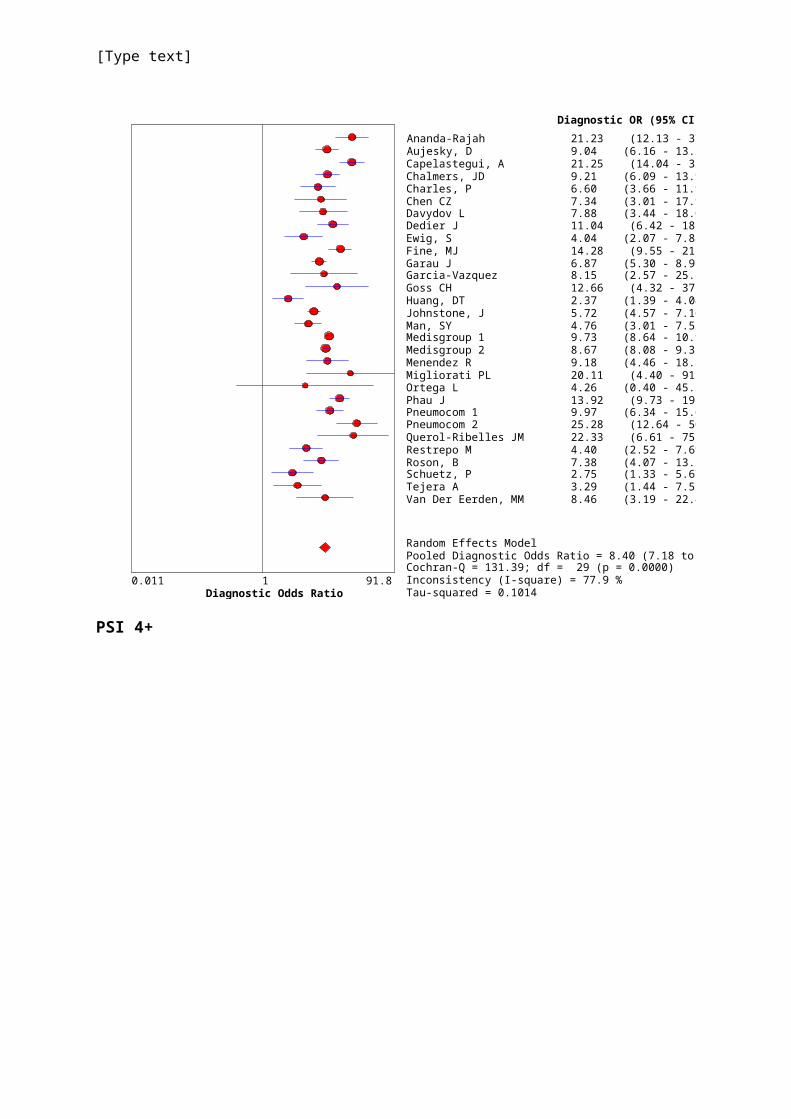
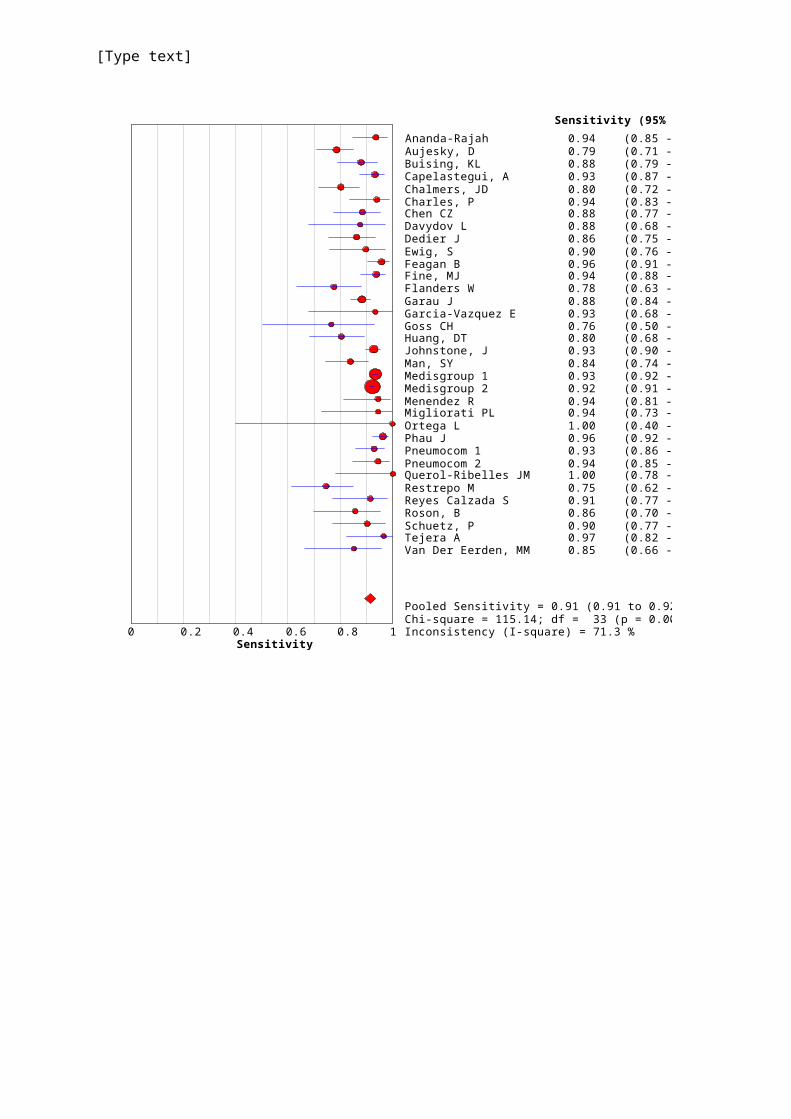
Discrimination analysis
Pneumonia Severity Index
The Forest plots show the pooled sensitivity, specificity, positive likelihood ratio, pooled negative likelihood ratio and diagnostic odds ratio for the Pneumonia Severity Index. Forest plots are displayed for the following cut-offs
PSI III+
[Type text]
Sensi t i vi t y0 0. 2 0. 4 0. 6 0. 8 1
Ananda- Rajah 0. 98 ( 0. 91 - 1. 00)Aujesky, D 0. 97 ( 0. 92 - 0. 99)Capelast egui, A 0. 99 ( 0. 95 - 1. 00)Char les, P 0. 98 ( 0. 89 - 1. 00)Chen CZ 1. 00 ( 0. 88 - 1. 00)Davydov L 0. 96 ( 0. 79 - 1. 00)Dedier J 0. 95 ( 0. 87 - 0. 99)Ewig, S 0. 95 ( 0. 83 - 0. 99)Feagan B 1. 00 ( 0. 97 - 1. 00)Fine, M J 0. 97 ( 0. 92 - 0. 99)Flander s W 1. 00 ( 0. 93 - 1. 00)G ar au J 0. 95 ( 0. 92 - 0. 98)G ar cia- Vazquez E 1. 00 ( 0. 78 - 1. 00)G oss CH 0. 88 ( 0. 64 - 0. 99)Huang, DT 0. 95 ( 0. 88 - 0. 98)Johnst one, J 0. 99 ( 0. 97 - 1. 00)M an, SY 0. 98 ( 0. 92 - 1. 00)M edisgr oup 1 0. 98 ( 0. 97 - 0. 99)M edisgr oup 2 0. 99 ( 0. 98 - 0. 99)M enendez R 1. 00 ( 0. 90 - 1. 00)M iglior at i PL 1. 00 ( 0. 81 - 1. 00)O r t ega L 1. 00 ( 0. 40 - 1. 00)Phau J 0. 99 ( 0. 97 - 1. 00)Pneum ocom 1 0. 99 ( 0. 94 - 1. 00)Pneum ocom 2 0. 98 ( 0. 90 - 1. 00)Q uer ol- Ribelles JM 1. 00 ( 0. 78 - 1. 00)Rest r epo M 0. 88 ( 0. 77 - 0. 95)Roson, B 0. 97 ( 0. 85 - 1. 00)Schuet z, P 0. 98 ( 0. 87 - 1. 00)Tejer a A 1. 00 ( 0. 88 - 1. 00)Van Der Eer den, M M 0. 96 ( 0. 81 - 1. 00)
Sensi t i vi t y ( 95% CI )
Pooled Sensit ivit y = 0. 98 ( 0. 98 t o 0. 99)Chi- squar e = 60. 35; df = 30 ( p = 0. 0008)I nconsist ency ( I - squar e) = 50. 3 %
[Type text]
Speci f i ci t y0 0. 2 0. 4 0. 6 0. 8 1
Ananda- Rajah 0. 14 ( 0. 10 - 0. 18)Aujesky, D 0. 48 ( 0. 46 - 0. 50)Capelast egui, A 0. 49 ( 0. 46 - 0. 51)Char les, P 0. 30 ( 0. 27 - 0. 33)Chen CZ 0. 19 ( 0. 14 - 0. 24)Davydov L 0. 29 ( 0. 26 - 0. 33)Dedier J 0. 30 ( 0. 28 - 0. 33)Ewig, S 0. 30 ( 0. 26 - 0. 35)Feagan B 0. 23 ( 0. 20 - 0. 26)Fine, M J 0. 57 ( 0. 55 - 0. 59)Flander s W 0. 14 ( 0. 12 - 0. 16)G ar au J 0. 30 ( 0. 28 - 0. 32)G ar cia- Vazquez E 0. 30 ( 0. 24 - 0. 37)G oss CH 0. 40 ( 0. 35 - 0. 45)Huang, DT 0. 42 ( 0. 39 - 0. 44)Johnst one, J 0. 21 ( 0. 20 - 0. 23)M an, SY 0. 26 ( 0. 23 - 0. 29)M edisgr oup 1 0. 29 ( 0. 28 - 0. 30)M edisgr oup 2 0. 53 ( 0. 52 - 0. 54)M enendez R 0. 29 ( 0. 25 - 0. 34)M iglior at i PL 0. 18 ( 0. 12 - 0. 25)O r t ega L 0. 54 ( 0. 45 - 0. 63)Phau J 0. 36 ( 0. 33 - 0. 39)Pneum ocom 1 0. 35 ( 0. 32 - 0. 39)Pneum ocom 2 0. 39 ( 0. 35 - 0. 42)Q uer ol- Ribelles JM 0. 31 ( 0. 25 - 0. 38)Rest r epo M 0. 38 ( 0. 35 - 0. 42)Roson, B 0. 22 ( 0. 19 - 0. 26)Schuet z, P 0. 27 ( 0. 22 - 0. 32)Tejer a A 0. 12 ( 0. 08 - 0. 17)Van Der Eer den, M M 0. 35 ( 0. 29 - 0. 41)
Speci f i ci t y ( 95% CI )
Pooled Specif icit y = 0. 39 ( 0. 38 t o 0. 39)Chi- squar e = 3840. 00; df = 30 ( p = 0. 0000)I nconsist ency ( I - squar e) = 99. 2 %
[Type text]
Posi t i ve LR0. 361 2. 81
Ananda- Rajah 1. 14 ( 1. 08 - 1. 21)Aujesky, D 1. 85 ( 1. 77 - 1. 94)Capelast egui, A 1. 93 ( 1. 84 - 2. 03)Char les, P 1. 39 ( 1. 31 - 1. 48)Chen CZ 1. 21 ( 1. 13 - 1. 31)Davydov L 1. 36 ( 1. 24 - 1. 49)Dedier J 1. 37 ( 1. 28 - 1. 47)Ewig, S 1. 36 ( 1. 24 - 1. 50)Feagan B 1. 29 ( 1. 24 - 1. 34)Fine, M J 2. 28 ( 2. 15 - 2. 42)Flander s W 1. 15 ( 1. 11 - 1. 20)G ar au J 1. 36 ( 1. 31 - 1. 41)G ar cia- Vazquez E 1. 39 ( 1. 22 - 1. 58)G oss CH 1. 48 ( 1. 22 - 1. 79)Huang, DT 1. 62 ( 1. 51 - 1. 73)Johnst one, J 1. 25 ( 1. 22 - 1. 28)M an, SY 1. 32 ( 1. 25 - 1. 38)M edisgr oup 1 1. 39 ( 1. 37 - 1. 40)M edisgr oup 2 2. 10 ( 2. 07 - 2. 14)M enendez R 1. 39 ( 1. 29 - 1. 49)M iglior at i PL 1. 19 ( 1. 06 - 1. 32)O r t ega L 1. 96 ( 1. 38 - 2. 77)Phau J 1. 56 ( 1. 49 - 1. 63)Pneum ocom 1 1. 53 ( 1. 45 - 1. 61)Pneum ocom 2 1. 60 ( 1. 50 - 1. 71)Q uer ol- Ribelles JM 1. 41 ( 1. 24 - 1. 59)Rest r epo M 1. 43 ( 1. 28 - 1. 60)Roson, B 1. 25 ( 1. 16 - 1. 35)Schuet z, P 1. 34 ( 1. 23 - 1. 45)Tejer a A 1. 12 ( 1. 05 - 1. 20)Van Der Eer den, M M 1. 48 ( 1. 31 - 1. 66)
Posi t i ve LR ( 95% CI )
Random Ef f ect s M odelPooled Posit ive LR = 1. 44 ( 1. 32 t o 1. 57)Cochr an- Q = 3595. 65; df = 30 ( p = 0. 0000)I nconsist ency ( I - squar e) = 99. 2 %Tau- squar ed = 0. 0586
[Type text]
Negat i ve LR0. 001 885. 21
Ananda- Rajah 0. 11 ( 0. 02 - 0. 81)Aujesky, D 0. 07 ( 0. 03 - 0. 17)Capelast egui, A 0. 02 ( 0. 00 - 0. 12)Char les, P 0. 07 ( 0. 01 - 0. 47)Chen CZ 0. 09 ( 0. 01 - 1. 35)Davydov L 0. 14 ( 0. 02 - 0. 97)Dedier J 0. 15 ( 0. 05 - 0. 46)Ewig, S 0. 17 ( 0. 04 - 0. 66)Feagan B 0. 02 ( 0. 00 - 0. 29)Fine, M J 0. 05 ( 0. 02 - 0. 14)Flander s W 0. 07 ( 0. 00 - 1. 12)G ar au J 0. 16 ( 0. 09 - 0. 27)G ar cia- Vazquez E 0. 10 ( 0. 01 - 1. 60)G oss CH 0. 29 ( 0. 08 - 1. 08)Huang, DT 0. 13 ( 0. 05 - 0. 30)Johnst one, J 0. 06 ( 0. 03 - 0. 15)M an, SY 0. 09 ( 0. 02 - 0. 35)M edisgr oup 1 0. 06 ( 0. 04 - 0. 09)M edisgr oup 2 0. 02 ( 0. 02 - 0. 03)M enendez R 0. 05 ( 0. 00 - 0. 73)M iglior at i PL 0. 15 ( 0. 01 - 2. 32)O r t ega L 0. 19 ( 0. 01 - 2. 58)Phau J 0. 02 ( 0. 00 - 0. 11)Pneum ocom 1 0. 03 ( 0. 00 - 0. 20)Pneum ocom 2 0. 05 ( 0. 01 - 0. 33)Q uer ol- Ribelles JM 0. 10 ( 0. 01 - 1. 54)Rest r epo M 0. 31 ( 0. 15 - 0. 63)Roson, B 0. 13 ( 0. 02 - 0. 88)Schuet z, P 0. 09 ( 0. 01 - 0. 63)Tejer a A 0. 14 ( 0. 01 - 2. 18)Van Der Eer den, M M 0. 11 ( 0. 02 - 0. 73)
Negat i ve LR ( 95% CI )
Random Ef f ect s M odelPooled Negat ive LR = 0. 08 ( 0. 06 t o 0. 12)Cochr an- Q = 98. 67; df = 30 ( p = 0. 0000)I nconsist ency ( I - squar e) = 69. 6 %Tau- squar ed = 0. 6477
[Type text]
Di agnost i c O dds Rat i o0. 011 91. 81
Ananda- Rajah 21. 23 ( 12. 13 - 37. 15)Aujesky, D 9. 04 ( 6. 16 - 13. 27)Capelast egui, A 21. 25 ( 14. 04 - 32. 18)Chalm er s, JD 9. 21 ( 6. 09 - 13. 94)Char les, P 6. 60 ( 3. 66 - 11. 90)Chen CZ 7. 34 ( 3. 01 - 17. 94)Davydov L 7. 88 ( 3. 44 - 18. 02)Dedier J 11. 04 ( 6. 42 - 18. 98)Ewig, S 4. 04 ( 2. 07 - 7. 88)Fine, M J 14. 28 ( 9. 55 - 21. 36)G ar au J 6. 87 ( 5. 30 - 8. 91)G ar cia- Vazquez 8. 15 ( 2. 57 - 25. 81)G oss CH 12. 66 ( 4. 32 - 37. 16)Huang, DT 2. 37 ( 1. 39 - 4. 04)Johnst one, J 5. 72 ( 4. 57 - 7. 16)M an, SY 4. 76 ( 3. 01 - 7. 52)M edisgr oup 1 9. 73 ( 8. 64 - 10. 95)M edisgr oup 2 8. 67 ( 8. 08 - 9. 31)M enendez R 9. 18 ( 4. 46 - 18. 86)M iglior at i PL 20. 11 ( 4. 40 - 91. 80)O r t ega L 4. 26 ( 0. 40 - 45. 23)Phau J 13. 92 ( 9. 73 - 19. 91)Pneum ocom 1 9. 97 ( 6. 34 - 15. 69)Pneum ocom 2 25. 28 ( 12. 64 - 50. 55)Q uer ol- Ribelles JM 22. 33 ( 6. 61 - 75. 44)Rest r epo M 4. 40 ( 2. 52 - 7. 69)Roson, B 7. 38 ( 4. 07 - 13. 36)Schuet z, P 2. 75 ( 1. 33 - 5. 67)Tejer a A 3. 29 ( 1. 44 - 7. 52)Van Der Eer den, M M 8. 46 ( 3. 19 - 22. 46)
Di agnost i c O R ( 95% CI )
Random Ef f ect s M odelPooled Diagnost ic O dds Rat io = 8. 40 ( 7. 18 t o 9. 82)Cochr an- Q = 131. 39; df = 29 ( p = 0. 0000)I nconsist ency ( I - squar e) = 77. 9 %Tau- squar ed = 0. 1014
PSI 4+

[Type text]
Sensi t i vi t y0 0. 2 0. 4 0. 6 0. 8 1
Ananda- Rajah 0. 94 ( 0. 85 - 0. 98)Aujesky, D 0. 79 ( 0. 71 - 0. 85)Buising, KL 0. 88 ( 0. 79 - 0. 94)Capelast egui, A 0. 93 ( 0. 87 - 0. 97)Chalm er s, JD 0. 80 ( 0. 72 - 0. 87)Char les, P 0. 94 ( 0. 83 - 0. 99)Chen CZ 0. 88 ( 0. 77 - 0. 95)Davydov L 0. 88 ( 0. 68 - 0. 97)Dedier J 0. 86 ( 0. 75 - 0. 93)Ewig, S 0. 90 ( 0. 76 - 0. 97)Feagan B 0. 96 ( 0. 91 - 0. 99)Fine, M J 0. 94 ( 0. 88 - 0. 97)Flander s W 0. 78 ( 0. 63 - 0. 88)G ar au J 0. 88 ( 0. 84 - 0. 92)G ar cia- Vazquez E 0. 93 ( 0. 68 - 1. 00)G oss CH 0. 76 ( 0. 50 - 0. 93)Huang, DT 0. 80 ( 0. 68 - 0. 89)Johnst one, J 0. 93 ( 0. 90 - 0. 95)M an, SY 0. 84 ( 0. 74 - 0. 91)M edisgr oup 1 0. 93 ( 0. 92 - 0. 95)M edisgr oup 2 0. 92 ( 0. 91 - 0. 93)M enendez R 0. 94 ( 0. 81 - 0. 99)M iglior at i PL 0. 94 ( 0. 73 - 1. 00)O r t ega L 1. 00 ( 0. 40 - 1. 00)Phau J 0. 96 ( 0. 92 - 0. 98)Pneum ocom 1 0. 93 ( 0. 86 - 0. 97)Pneum ocom 2 0. 94 ( 0. 85 - 0. 99)Q uer ol- Ribelles JM 1. 00 ( 0. 78 - 1. 00)Rest r epo M 0. 75 ( 0. 62 - 0. 85)Reyes Calzada S 0. 91 ( 0. 77 - 0. 98)Roson, B 0. 86 ( 0. 70 - 0. 95)Schuet z, P 0. 90 ( 0. 77 - 0. 97)Tejer a A 0. 97 ( 0. 82 - 1. 00)Van Der Eer den, M M 0. 85 ( 0. 66 - 0. 96)
Sensi t i vi t y ( 95% CI )
Pooled Sensit ivit y = 0. 91 ( 0. 91 t o 0. 92)Chi- squar e = 115. 14; df = 33 ( p = 0. 0000)I nconsist ency ( I - squar e) = 71. 3 %
[Type text]
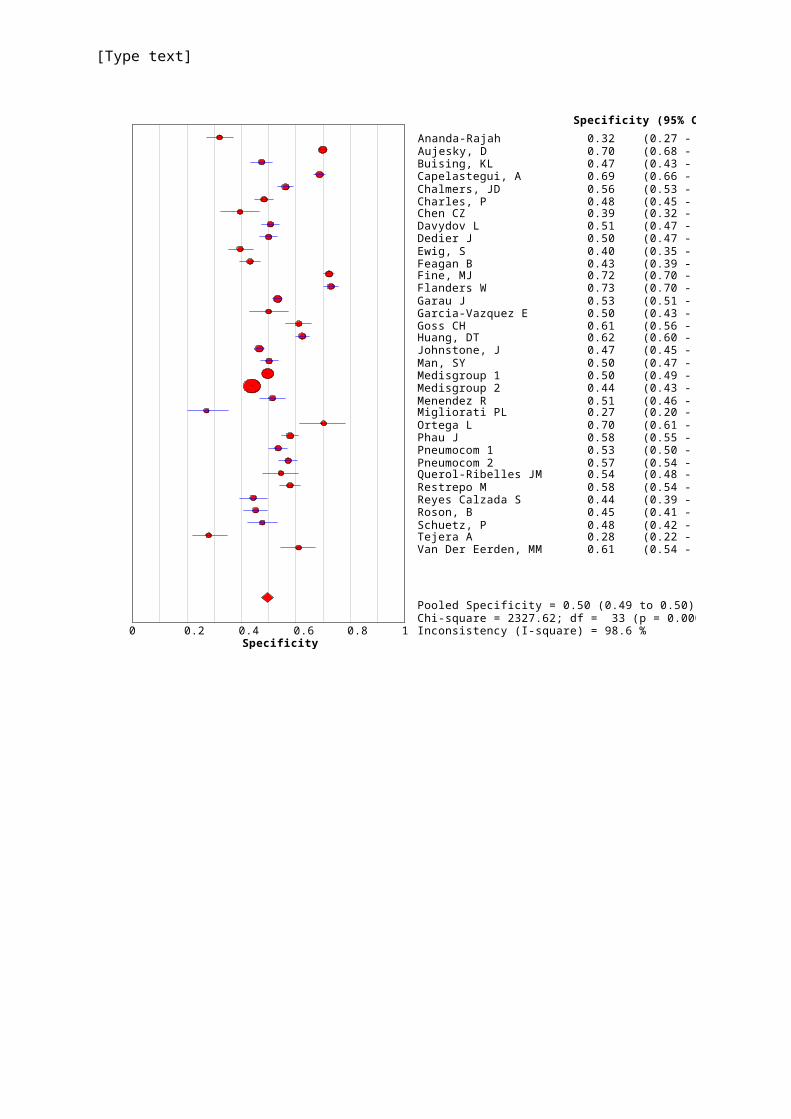
Speci f i ci t y0 0. 2 0. 4 0. 6 0. 8 1
Ananda- Rajah 0. 32 ( 0. 27 - 0. 37)Aujesky, D 0. 70 ( 0. 68 - 0. 71)Buising, KL 0. 47 ( 0. 43 - 0. 51)Capelast egui, A 0. 69 ( 0. 66 - 0. 71)Chalm er s, JD 0. 56 ( 0. 53 - 0. 59)Char les, P 0. 48 ( 0. 45 - 0. 52)Chen CZ 0. 39 ( 0. 32 - 0. 47)Davydov L 0. 51 ( 0. 47 - 0. 54)Dedier J 0. 50 ( 0. 47 - 0. 53)Ewig, S 0. 40 ( 0. 35 - 0. 44)Feagan B 0. 43 ( 0. 39 - 0. 47)Fine, M J 0. 72 ( 0. 70 - 0. 74)Flander s W 0. 73 ( 0. 70 - 0. 76)G ar au J 0. 53 ( 0. 51 - 0. 55)G ar cia- Vazquez E 0. 50 ( 0. 43 - 0. 57)G oss CH 0. 61 ( 0. 56 - 0. 66)Huang, DT 0. 62 ( 0. 60 - 0. 65)Johnst one, J 0. 47 ( 0. 45 - 0. 48)M an, SY 0. 50 ( 0. 47 - 0. 53)M edisgr oup 1 0. 50 ( 0. 49 - 0. 50)M edisgr oup 2 0. 44 ( 0. 43 - 0. 44)M enendez R 0. 51 ( 0. 46 - 0. 56)M iglior at i PL 0. 27 ( 0. 20 - 0. 35)O r t ega L 0. 70 ( 0. 61 - 0. 78)Phau J 0. 58 ( 0. 55 - 0. 61)Pneum ocom 1 0. 53 ( 0. 50 - 0. 57)Pneum ocom 2 0. 57 ( 0. 54 - 0. 61)Q uer ol- Ribelles JM 0. 54 ( 0. 48 - 0. 61)Rest r epo M 0. 58 ( 0. 54 - 0. 62)Reyes Calzada S 0. 44 ( 0. 39 - 0. 49)Roson, B 0. 45 ( 0. 41 - 0. 50)Schuet z, P 0. 48 ( 0. 42 - 0. 53)Tejer a A 0. 28 ( 0. 22 - 0. 35)Van Der Eer den, M M 0. 61 ( 0. 54 - 0. 67)
Speci f i ci t y ( 95% CI )
Pooled Specif icit y = 0. 50 ( 0. 49 t o 0. 50)Chi- squar e = 2327. 62; df = 33 ( p = 0. 0000)I nconsist ency ( I - squar e) = 98. 6 %
[Type text]
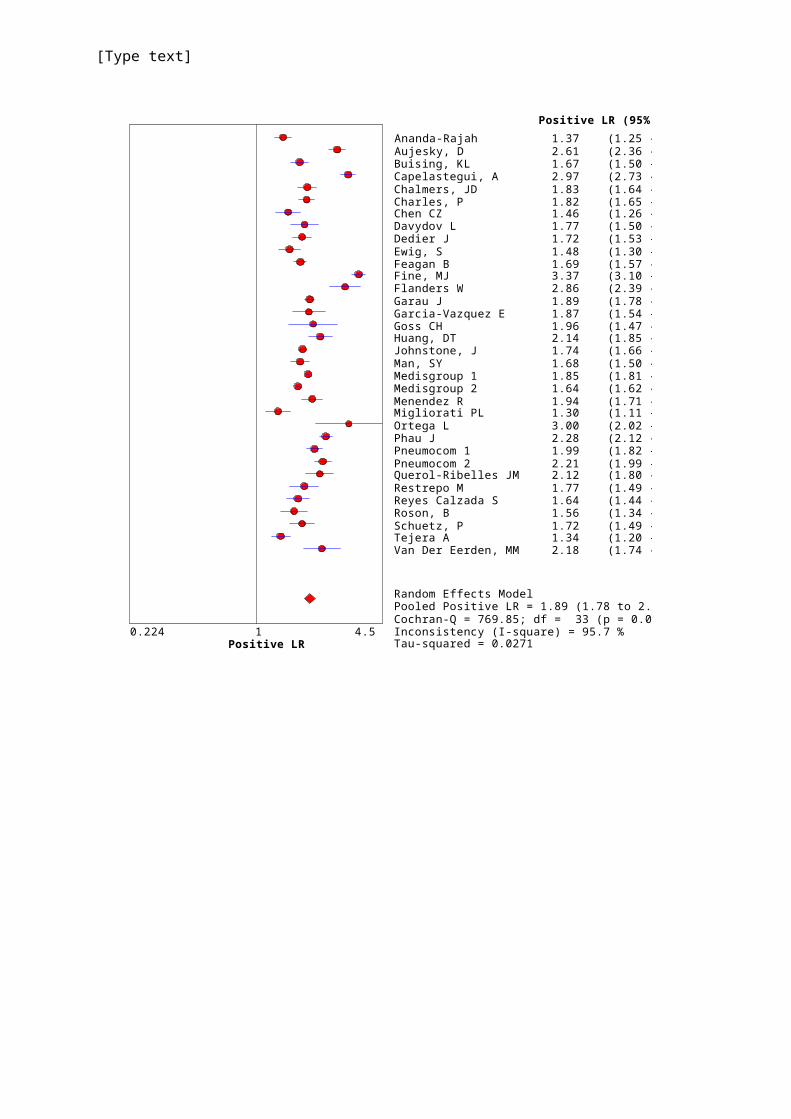
Posi t i ve LR0. 224 4. 51
Ananda- Rajah 1. 37 ( 1. 25 - 1. 51)Aujesky, D 2. 61 ( 2. 36 - 2. 88)Buising, KL 1. 67 ( 1. 50 - 1. 86)Capelast egui, A 2. 97 ( 2. 73 - 3. 24)Chalm er s, JD 1. 83 ( 1. 64 - 2. 05)Char les, P 1. 82 ( 1. 65 - 2. 00)Chen CZ 1. 46 ( 1. 26 - 1. 69)Davydov L 1. 77 ( 1. 50 - 2. 09)Dedier J 1. 72 ( 1. 53 - 1. 93)Ewig, S 1. 48 ( 1. 30 - 1. 69)Feagan B 1. 69 ( 1. 57 - 1. 82)Fine, M J 3. 37 ( 3. 10 - 3. 65)Flander s W 2. 86 ( 2. 39 - 3. 44)G ar au J 1. 89 ( 1. 78 - 2. 00)G ar cia- Vazquez E 1. 87 ( 1. 54 - 2. 27)G oss CH 1. 96 ( 1. 47 - 2. 62)Huang, DT 2. 14 ( 1. 85 - 2. 47)Johnst one, J 1. 74 ( 1. 66 - 1. 82)M an, SY 1. 68 ( 1. 50 - 1. 88)M edisgr oup 1 1. 85 ( 1. 81 - 1. 89)M edisgr oup 2 1. 64 ( 1. 62 - 1. 67)M enendez R 1. 94 ( 1. 71 - 2. 20)M iglior at i PL 1. 30 ( 1. 11 - 1. 51)O r t ega L 3. 00 ( 2. 02 - 4. 46)Phau J 2. 28 ( 2. 12 - 2. 46)Pneum ocom 1 1. 99 ( 1. 82 - 2. 19)Pneum ocom 2 2. 21 ( 1. 99 - 2. 45)Q uer ol- Ribelles JM 2. 12 ( 1. 80 - 2. 51)Rest r epo M 1. 77 ( 1. 49 - 2. 10)Reyes Calzada S 1. 64 ( 1. 44 - 1. 88)Roson, B 1. 56 ( 1. 34 - 1. 83)Schuet z, P 1. 72 ( 1. 49 - 1. 99)Tejer a A 1. 34 ( 1. 20 - 1. 50)Van Der Eer den, M M 2. 18 ( 1. 74 - 2. 73)
Posi t i ve LR ( 95% CI )
Random Ef f ect s M odelPooled Posit ive LR = 1. 89 ( 1. 78 t o 2. 00)Cochr an- Q = 769. 85; df = 33 ( p = 0. 0000)I nconsist ency ( I - squar e) = 95. 7 %Tau- squar ed = 0. 0271
[Type text]
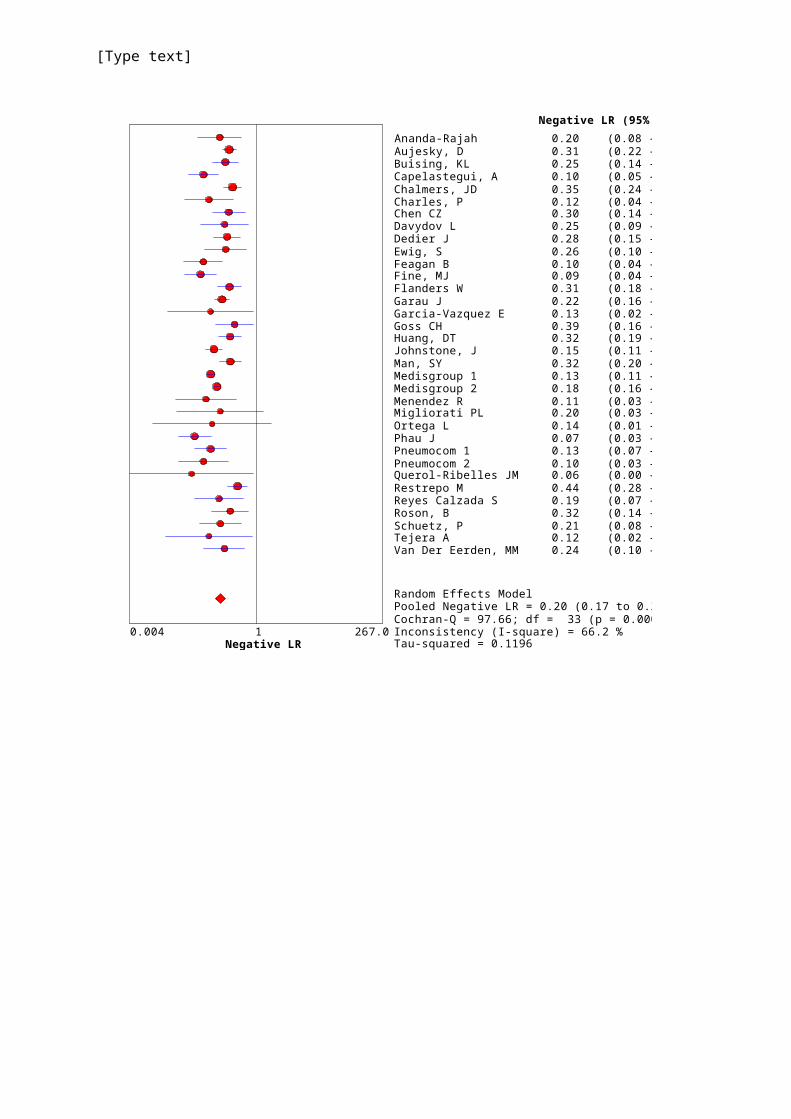
Negat i ve LR0. 004 267. 01
Ananda- Rajah 0. 20 ( 0. 08 - 0. 52)Aujesky, D 0. 31 ( 0. 22 - 0. 42)Buising, KL 0. 25 ( 0. 14 - 0. 46)Capelast egui, A 0. 10 ( 0. 05 - 0. 19)Chalm er s, JD 0. 35 ( 0. 24 - 0. 51)Char les, P 0. 12 ( 0. 04 - 0. 37)Chen CZ 0. 30 ( 0. 14 - 0. 61)Davydov L 0. 25 ( 0. 09 - 0. 71)Dedier J 0. 28 ( 0. 15 - 0. 51)Ewig, S 0. 26 ( 0. 10 - 0. 66)Feagan B 0. 10 ( 0. 04 - 0. 23)Fine, M J 0. 09 ( 0. 04 - 0. 18)Flander s W 0. 31 ( 0. 18 - 0. 52)G ar au J 0. 22 ( 0. 16 - 0. 31)G ar cia- Vazquez E 0. 13 ( 0. 02 - 0. 89)G oss CH 0. 39 ( 0. 16 - 0. 91)Huang, DT 0. 32 ( 0. 19 - 0. 52)Johnst one, J 0. 15 ( 0. 11 - 0. 22)M an, SY 0. 32 ( 0. 20 - 0. 52)M edisgr oup 1 0. 13 ( 0. 11 - 0. 16)M edisgr oup 2 0. 18 ( 0. 16 - 0. 20)M enendez R 0. 11 ( 0. 03 - 0. 42)M iglior at i PL 0. 20 ( 0. 03 - 1. 40)O r t ega L 0. 14 ( 0. 01 - 1. 99)Phau J 0. 07 ( 0. 03 - 0. 14)Pneum ocom 1 0. 13 ( 0. 07 - 0. 27)Pneum ocom 2 0. 10 ( 0. 03 - 0. 29)Q uer ol- Ribelles JM 0. 06 ( 0. 00 - 0. 88)Rest r epo M 0. 44 ( 0. 28 - 0. 68)Reyes Calzada S 0. 19 ( 0. 07 - 0. 57)Roson, B 0. 32 ( 0. 14 - 0. 72)Schuet z, P 0. 21 ( 0. 08 - 0. 52)Tejer a A 0. 12 ( 0. 02 - 0. 86)Van Der Eer den, M M 0. 24 ( 0. 10 - 0. 60)
Negat i ve LR ( 95% CI )
Random Ef f ect s M odelPooled Negat ive LR = 0. 20 ( 0. 17 t o 0. 24)Cochr an- Q = 97. 66; df = 33 ( p = 0. 0000)I nconsist ency ( I - squar e) = 66. 2 %Tau- squar ed = 0. 1196
[Type text]
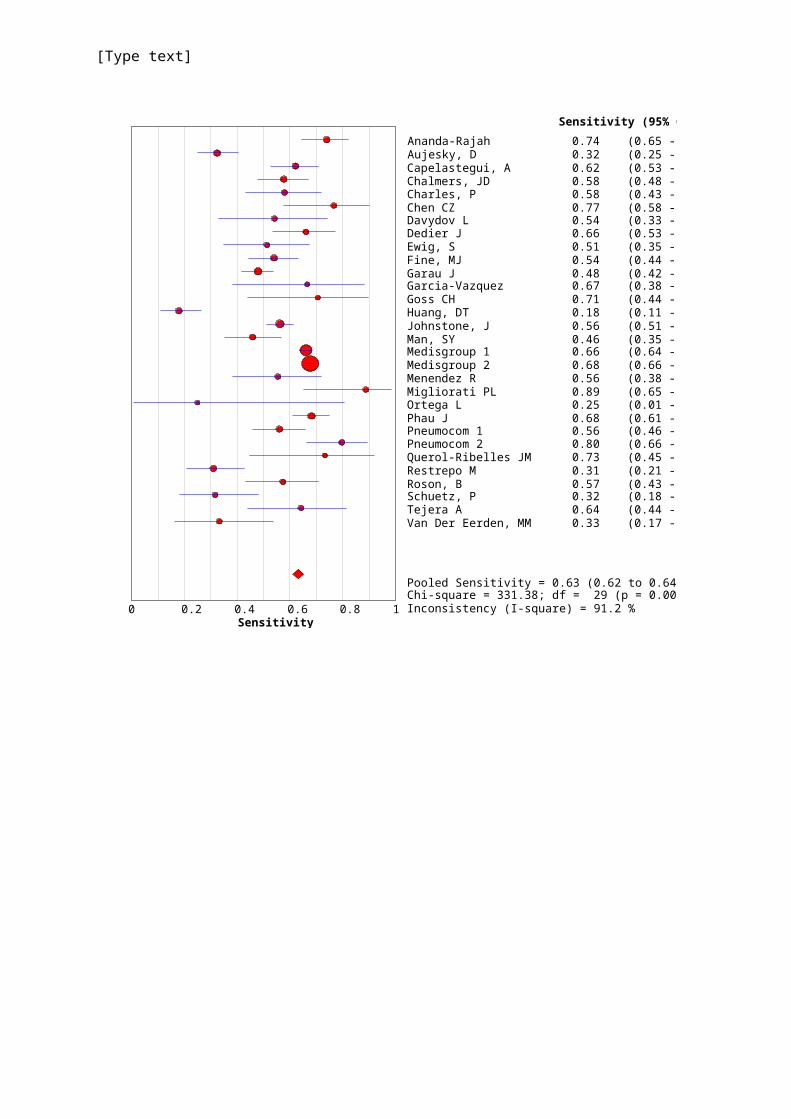
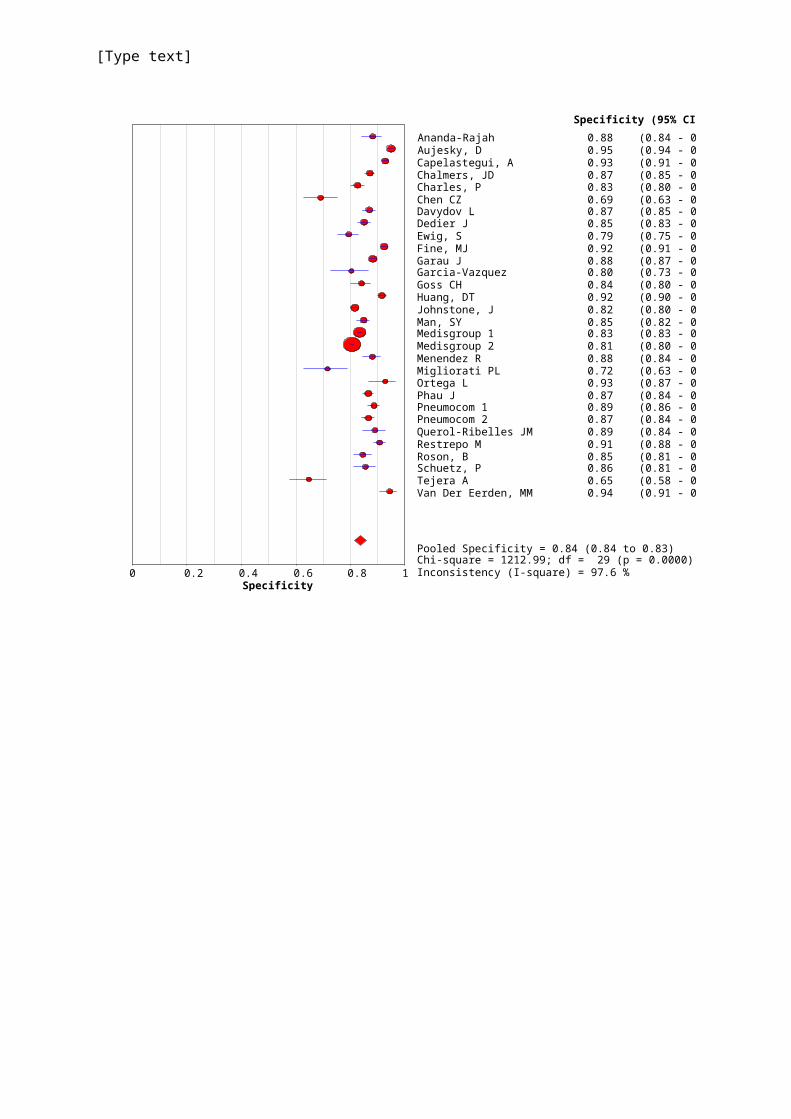
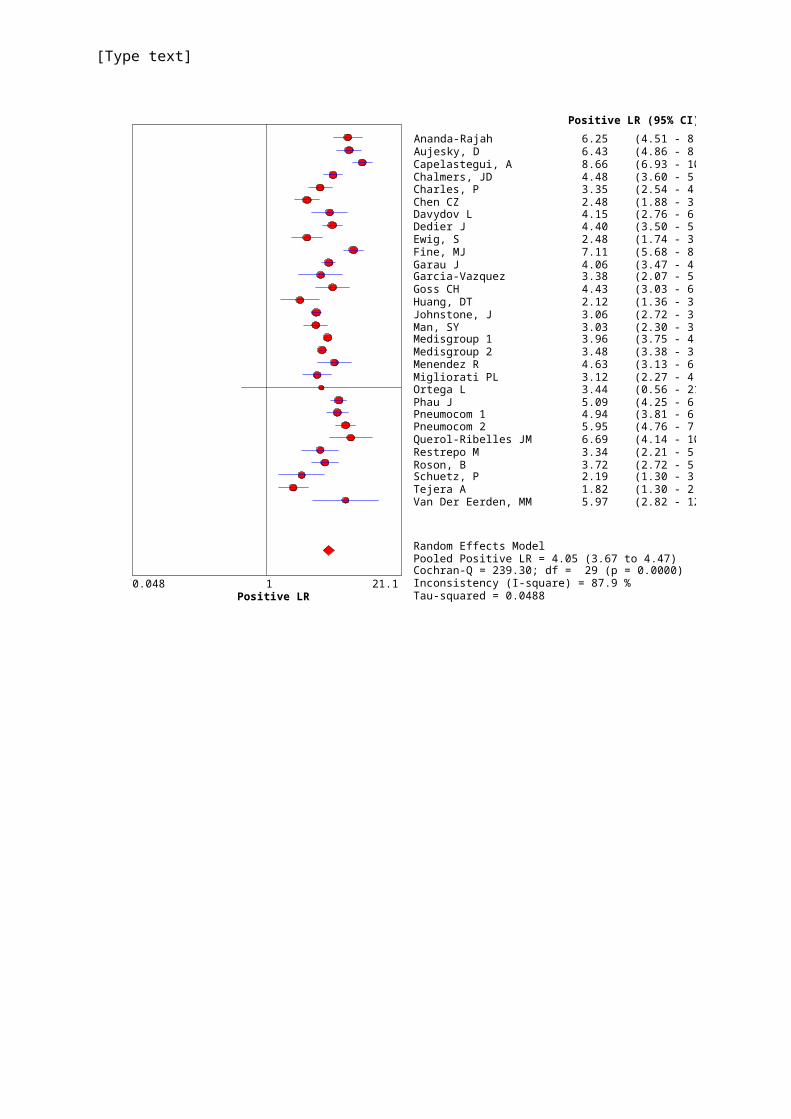
PSI V
[Type text]
Sensi t i vi t y0 0. 2 0. 4 0. 6 0. 8 1
Ananda-Rajah 0. 74 ( 0. 65 - 0. 82)Aujesky, D 0. 32 ( 0. 25 - 0. 41)Capelast egui, A 0. 62 ( 0. 53 - 0. 71)Chalm ers, JD 0. 58 ( 0. 48 - 0. 67)Char les, P 0. 58 ( 0. 43 - 0. 72)Chen CZ 0. 77 ( 0. 58 - 0. 90)Davydov L 0. 54 ( 0. 33 - 0. 74)Dedier J 0. 66 ( 0. 53 - 0. 77)Ewig, S 0. 51 ( 0. 35 - 0. 68)Fine, MJ 0. 54 ( 0. 44 - 0. 63)G ar au J 0. 48 ( 0. 42 - 0. 54)G ar cia-Vazquez 0. 67 ( 0. 38 - 0. 88)G oss CH 0. 71 ( 0. 44 - 0. 90)Huang, DT 0. 18 ( 0. 11 - 0. 27)Johnst one, J 0. 56 ( 0. 51 - 0. 61)Man, SY 0. 46 ( 0. 35 - 0. 57)Medisgroup 1 0. 66 ( 0. 64 - 0. 69)Medisgroup 2 0. 68 ( 0. 66 - 0. 69)Menendez R 0. 56 ( 0. 38 - 0. 72)M iglior at i PL 0. 89 ( 0. 65 - 0. 99)O r t ega L 0. 25 ( 0. 01 - 0. 81)Phau J 0. 68 ( 0. 61 - 0. 75)Pneumocom 1 0. 56 ( 0. 46 - 0. 66)Pneumocom 2 0. 80 ( 0. 66 - 0. 89)Q uer ol-Ribelles JM 0. 73 ( 0. 45 - 0. 92)Rest r epo M 0. 31 ( 0. 21 - 0. 43)Roson, B 0. 57 ( 0. 43 - 0. 71)Schuet z, P 0. 32 ( 0. 18 - 0. 48)Tejer a A 0. 64 ( 0. 44 - 0. 81)Van Der Eer den, MM 0. 33 ( 0. 17 - 0. 54)
Sensi t i vi t y ( 95% CI )
Pooled Sensit ivit y = 0. 63 ( 0. 62 t o 0. 64)Chi-squar e = 331. 38; df = 29 ( p = 0. 0000)I nconsist ency ( I - squar e) = 91. 2 %
[Type text]
Speci f i ci t y0 0. 2 0. 4 0. 6 0. 8 1
Ananda-Rajah 0. 88 ( 0. 84 - 0. 92)Aujesky, D 0. 95 ( 0. 94 - 0. 96)Capelast egui, A 0. 93 ( 0. 91 - 0. 94)Chalmers, JD 0. 87 ( 0. 85 - 0. 89)Char les, P 0. 83 ( 0. 80 - 0. 85)Chen CZ 0. 69 ( 0. 63 - 0. 75)Davydov L 0. 87 ( 0. 85 - 0. 89)Dedier J 0. 85 ( 0. 83 - 0. 87)Ewig, S 0. 79 ( 0. 75 - 0. 83)Fine, MJ 0. 92 ( 0. 91 - 0. 93)G ar au J 0. 88 ( 0. 87 - 0. 89)G ar cia-Vazquez 0. 80 ( 0. 73 - 0. 87)G oss CH 0. 84 ( 0. 80 - 0. 87)Huang, DT 0. 92 ( 0. 90 - 0. 93)Johnst one, J 0. 82 ( 0. 80 - 0. 83)Man, SY 0. 85 ( 0. 82 - 0. 87)Medisgroup 1 0. 83 ( 0. 83 - 0. 84)Medisgroup 2 0. 81 ( 0. 80 - 0. 81)Menendez R 0. 88 ( 0. 84 - 0. 91)Migliorat i PL 0. 72 ( 0. 63 - 0. 79)O r t ega L 0. 93 ( 0. 87 - 0. 97)Phau J 0. 87 ( 0. 84 - 0. 89)Pneum ocom 1 0. 89 ( 0. 86 - 0. 91)Pneum ocom 2 0. 87 ( 0. 84 - 0. 89)Q uerol-Ribelles JM 0. 89 ( 0. 84 - 0. 93)Rest repo M 0. 91 ( 0. 88 - 0. 93)Roson, B 0. 85 ( 0. 81 - 0. 88)Schuet z, P 0. 86 ( 0. 81 - 0. 89)Tejer a A 0. 65 ( 0. 58 - 0. 71)Van Der Eerden, M M 0. 94 ( 0. 91 - 0. 97)
Speci f i ci t y (95% CI )
Pooled Specif icit y = 0. 84 ( 0. 84 t o 0. 83)Chi- squar e = 1212. 99; df = 29 ( p = 0. 0000)I nconsist ency ( I -squar e) = 97. 6 %
[Type text]
Posi t i ve LR0. 048 21. 11
Ananda- Rajah 6. 25 ( 4. 51 - 8. 67)Aujesky, D 6. 43 ( 4. 86 - 8. 52)Capelast egui, A 8. 66 ( 6. 93 - 10. 82)Chalmers, JD 4. 48 ( 3. 60 - 5. 57)Char les, P 3. 35 ( 2. 54 - 4. 43)Chen CZ 2. 48 ( 1. 88 - 3. 28)Davydov L 4. 15 ( 2. 76 - 6. 24)Dedier J 4. 40 ( 3. 50 - 5. 52)Ewig, S 2. 48 ( 1. 74 - 3. 54)Fine, MJ 7. 11 ( 5. 68 - 8. 90)G ar au J 4. 06 ( 3. 47 - 4. 75)G ar cia-Vazquez 3. 38 ( 2. 07 - 5. 53)G oss CH 4. 43 ( 3. 03 - 6. 47)Huang, DT 2. 12 ( 1. 36 - 3. 31)Johnst one, J 3. 06 ( 2. 72 - 3. 44)Man, SY 3. 03 ( 2. 30 - 3. 98)Medisgroup 1 3. 96 ( 3. 75 - 4. 18)Medisgroup 2 3. 48 ( 3. 38 - 3. 59)Menendez R 4. 63 ( 3. 13 - 6. 85)Migliorat i PL 3. 12 ( 2. 27 - 4. 29)O r t ega L 3. 44 ( 0. 56 - 21. 05)Phau J 5. 09 ( 4. 25 - 6. 11)Pneumocom 1 4. 94 ( 3. 81 - 6. 39)Pneumocom 2 5. 95 ( 4. 76 - 7. 42)Q uerol-Ribelles JM 6. 69 ( 4. 14 - 10. 80)Rest repo M 3. 34 ( 2. 21 - 5. 06)Roson, B 3. 72 ( 2. 72 - 5. 07)Schuet z, P 2. 19 ( 1. 30 - 3. 69)Tejer a A 1. 82 ( 1. 30 - 2. 54)Van Der Eerden, MM 5. 97 ( 2. 82 - 12. 66)
Posi t i ve LR (95% CI )
Random Ef f ect s ModelPooled Posit ive LR = 4. 05 (3. 67 t o 4. 47)Cochran- Q = 239. 30; df = 29 (p = 0. 0000)I nconsist ency ( I - squar e) = 87. 9 %Tau- squared = 0. 0488
[Type text]
Negat i ve LR0. 042 23. 91
Ananda-Rajah 0. 29 ( 0. 21 - 0. 41)Aujesky, D 0. 71 ( 0. 64 - 0. 80)Capelast egui, A 0. 41 ( 0. 32 - 0. 51)Chalmers, JD 0. 49 ( 0. 39 - 0. 60)Char les, P 0. 51 ( 0. 37 - 0. 70)Chen CZ 0. 34 ( 0. 18 - 0. 65)Davydov L 0. 53 ( 0. 34 - 0. 81)Dedier J 0. 40 ( 0. 28 - 0. 56)Ewig, S 0. 61 ( 0. 44 - 0. 85)Fine, MJ 0. 50 ( 0. 41 - 0. 61)G ar au J 0. 59 ( 0. 53 - 0. 66)G ar cia-Vazquez 0. 42 ( 0. 20 - 0. 85)G oss CH 0. 35 ( 0. 17 - 0. 73)Huang, DT 0. 90 ( 0. 82 - 0. 98)Johnst one, J 0. 54 ( 0. 48 - 0. 60)Man, SY 0. 64 ( 0. 52 - 0. 77)Medisgroup 1 0. 41 ( 0. 38 - 0. 44)Medisgroup 2 0. 40 ( 0. 38 - 0. 42)Menendez R 0. 50 ( 0. 35 - 0. 73)M iglior at i PL 0. 16 ( 0. 04 - 0. 58)O r t ega L 0. 81 ( 0. 46 - 1. 43)Phau J 0. 37 ( 0. 30 - 0. 45)Pneum ocom 1 0. 50 ( 0. 40 - 0. 62)Pneum ocom 2 0. 24 ( 0. 14 - 0. 40)Q uer ol-Ribelles JM 0. 30 ( 0. 13 - 0. 69)Rest r epo M 0. 76 ( 0. 65 - 0. 89)Roson, B 0. 50 ( 0. 37 - 0. 69)Schuet z, P 0. 80 ( 0. 65 - 0. 99)Tejer a A 0. 55 ( 0. 33 - 0. 92)Van Der Eerden, MM 0. 71 ( 0. 54 - 0. 92)
Negat i ve LR (95% CI )
Random Ef f ect s ModelPooled Negat ive LR = 0. 50 (0. 44 t o 0. 58)Cochr an- Q = 489. 89; df = 29 ( p = 0. 0000)I nconsist ency ( I - squar e) = 94. 1 %Tau- squar ed = 0. 1104

[Type text]
Di agnost i c O dds Rat i o0. 011 91. 81
Ananda- Rajah 21. 23 ( 12. 13 - 37. 15)Aujesky, D 9. 04 ( 6. 16 - 13. 27)Capelast egui, A 21. 25 ( 14. 04 - 32. 18)Chalm er s, JD 9. 21 ( 6. 09 - 13. 94)Char les, P 6. 60 ( 3. 66 - 11. 90)Chen CZ 7. 34 ( 3. 01 - 17. 94)Davydov L 7. 88 ( 3. 44 - 18. 02)Dedier J 11. 04 ( 6. 42 - 18. 98)Ewig, S 4. 04 ( 2. 07 - 7. 88)Fine, M J 14. 28 ( 9. 55 - 21. 36)G ar au J 6. 87 ( 5. 30 - 8. 91)G ar cia- Vazquez 8. 15 ( 2. 57 - 25. 81)G oss CH 12. 66 ( 4. 32 - 37. 16)Huang, DT 2. 37 ( 1. 39 - 4. 04)Johnst one, J 5. 72 ( 4. 57 - 7. 16)M an, SY 4. 76 ( 3. 01 - 7. 52)M edisgr oup 1 9. 73 ( 8. 64 - 10. 95)M edisgr oup 2 8. 67 ( 8. 08 - 9. 31)M enendez R 9. 18 ( 4. 46 - 18. 86)M iglior at i PL 20. 11 ( 4. 40 - 91. 80)O r t ega L 4. 26 ( 0. 40 - 45. 23)Phau J 13. 92 ( 9. 73 - 19. 91)Pneum ocom 1 9. 97 ( 6. 34 - 15. 69)Pneum ocom 2 25. 28 ( 12. 64 - 50. 55)Q uer ol- Ribelles JM 22. 33 ( 6. 61 - 75. 44)Rest r epo M 4. 40 ( 2. 52 - 7. 69)Roson, B 7. 38 ( 4. 07 - 13. 36)Schuet z, P 2. 75 ( 1. 33 - 5. 67)Tejer a A 3. 29 ( 1. 44 - 7. 52)Van Der Eer den, M M 8. 46 ( 3. 19 - 22. 46)
Di agnost i c O R ( 95% CI )
Random Ef f ect s M odelPooled Diagnost ic O dds Rat io = 8. 40 ( 7. 18 t o 9. 82)Cochr an- Q = 131. 39; df = 29 ( p = 0. 0000)I nconsist ency ( I - squar e) = 77. 9 %Tau- squar ed = 0. 1014
CURB65
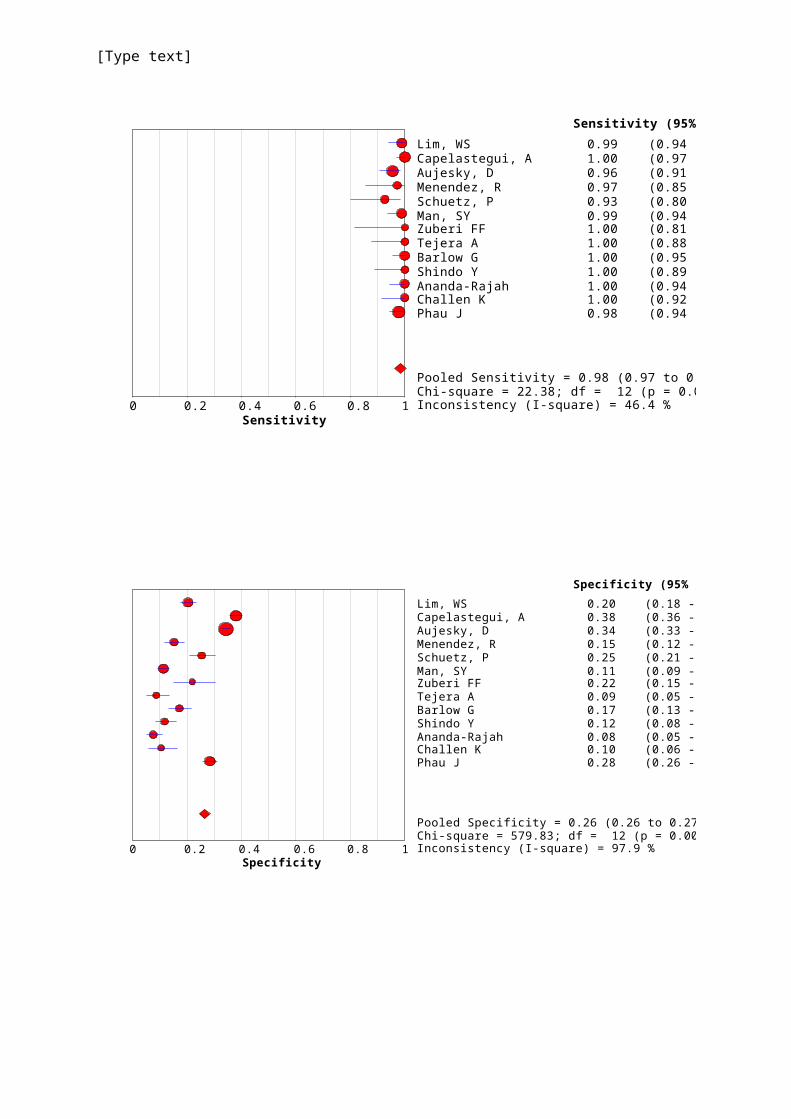
CURB65 1+
[Type text]
Sensi t i vi t y0 0. 2 0. 4 0. 6 0. 8 1
Lim, WS 0. 99 ( 0. 94 - 1. 00)Capelast egui, A 1. 00 ( 0. 97 - 1. 00)Aujesky, D 0. 96 ( 0. 91 - 0. 98)Menendez, R 0. 97 ( 0. 85 - 1. 00)Schuet z, P 0. 93 ( 0. 80 - 0. 98)Man, SY 0. 99 ( 0. 94 - 1. 00)Zuber i FF 1. 00 ( 0. 81 - 1. 00)Tejer a A 1. 00 ( 0. 88 - 1. 00)Bar low G 1. 00 ( 0. 95 - 1. 00)Shindo Y 1. 00 ( 0. 89 - 1. 00)Ananda- Rajah 1. 00 ( 0. 94 - 1. 00)Challen K 1. 00 ( 0. 92 - 1. 00)Phau J 0. 98 ( 0. 94 - 0. 99)
Sensi t i vi t y (95% CI )
Pooled Sensit ivit y = 0. 98 ( 0. 97 t o 0. 99)Chi- squar e = 22. 38; df = 12 (p = 0. 0335)I nconsist ency ( I - squar e) = 46. 4 %
Speci f i ci t y0 0. 2 0. 4 0. 6 0. 8 1
Lim, WS 0. 20 ( 0. 18 - 0. 23)Capelast egui, A 0. 38 ( 0. 36 - 0. 40)Aujesky, D 0. 34 ( 0. 33 - 0. 36)Menendez, R 0. 15 ( 0. 12 - 0. 19)Schuet z, P 0. 25 ( 0. 21 - 0. 30)Man, SY 0. 11 ( 0. 09 - 0. 13)Zuber i FF 0. 22 ( 0. 15 - 0. 30)Tejer a A 0. 09 ( 0. 05 - 0. 13)Bar low G 0. 17 ( 0. 13 - 0. 22)Shindo Y 0. 12 ( 0. 08 - 0. 16)Ananda-Rajah 0. 08 ( 0. 05 - 0. 11)Challen K 0. 10 ( 0. 06 - 0. 17)Phau J 0. 28 ( 0. 26 - 0. 31)
Speci f i ci t y ( 95% CI )
Pooled Specif icit y = 0. 26 ( 0. 26 t o 0. 27)Chi- squar e = 579. 83; df = 12 ( p = 0. 0000)I nconsist ency ( I - squar e) = 97. 9 %
[Type text]
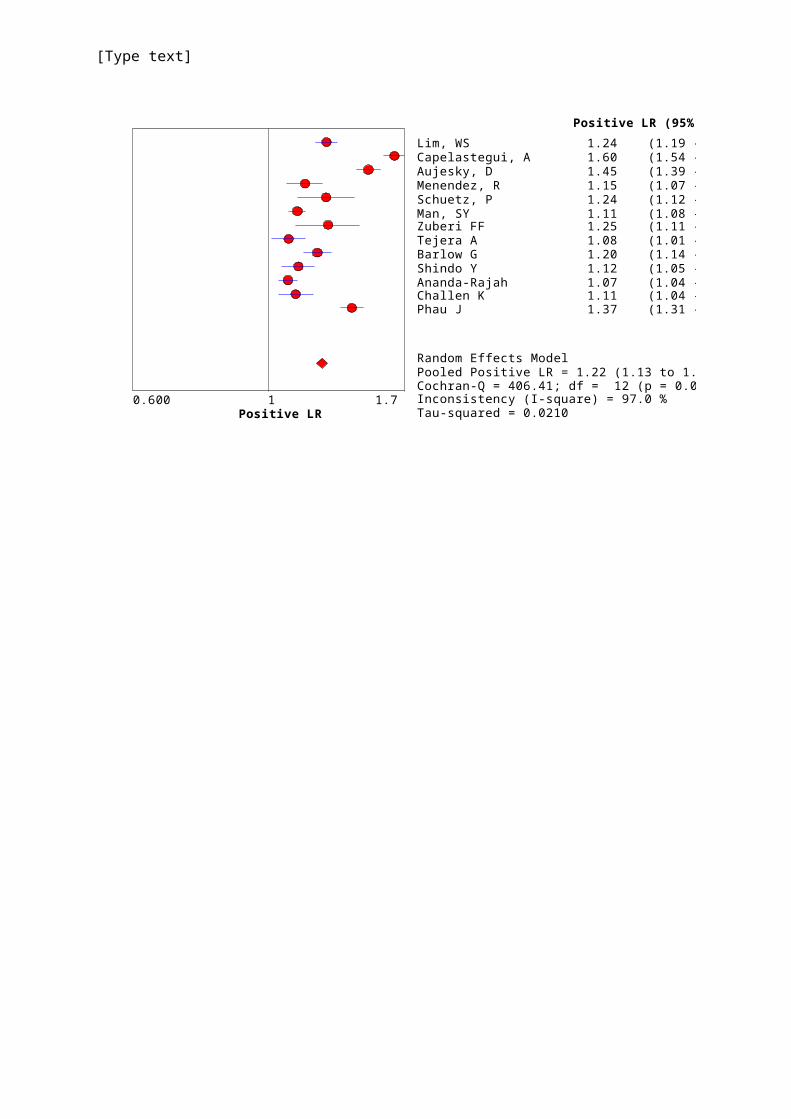
Posi t i ve LR0. 600 1. 71
Lim , WS 1. 24 ( 1. 19 - 1. 29)Capelast egui, A 1. 60 ( 1. 54 - 1. 67)Aujesky, D 1. 45 ( 1. 39 - 1. 52)Menendez, R 1. 15 ( 1. 07 - 1. 23)Schuet z, P 1. 24 ( 1. 12 - 1. 38)Man, SY 1. 11 ( 1. 08 - 1. 15)Zuber i FF 1. 25 ( 1. 11 - 1. 41)Tejer a A 1. 08 ( 1. 01 - 1. 15)Bar low G 1. 20 ( 1. 14 - 1. 26)Shindo Y 1. 12 ( 1. 05 - 1. 19)Ananda- Rajah 1. 07 ( 1. 04 - 1. 12)Challen K 1. 11 ( 1. 04 - 1. 18)Phau J 1. 37 ( 1. 31 - 1. 43)
Posi t i ve LR ( 95% CI )
Random Ef f ect s ModelPooled Posit ive LR = 1. 22 ( 1. 13 t o 1. 32)Cochr an- Q = 406. 41; df = 12 ( p = 0. 0000)I nconsist ency ( I - squar e) = 97. 0 %Tau- squar ed = 0. 0210
[Type text]
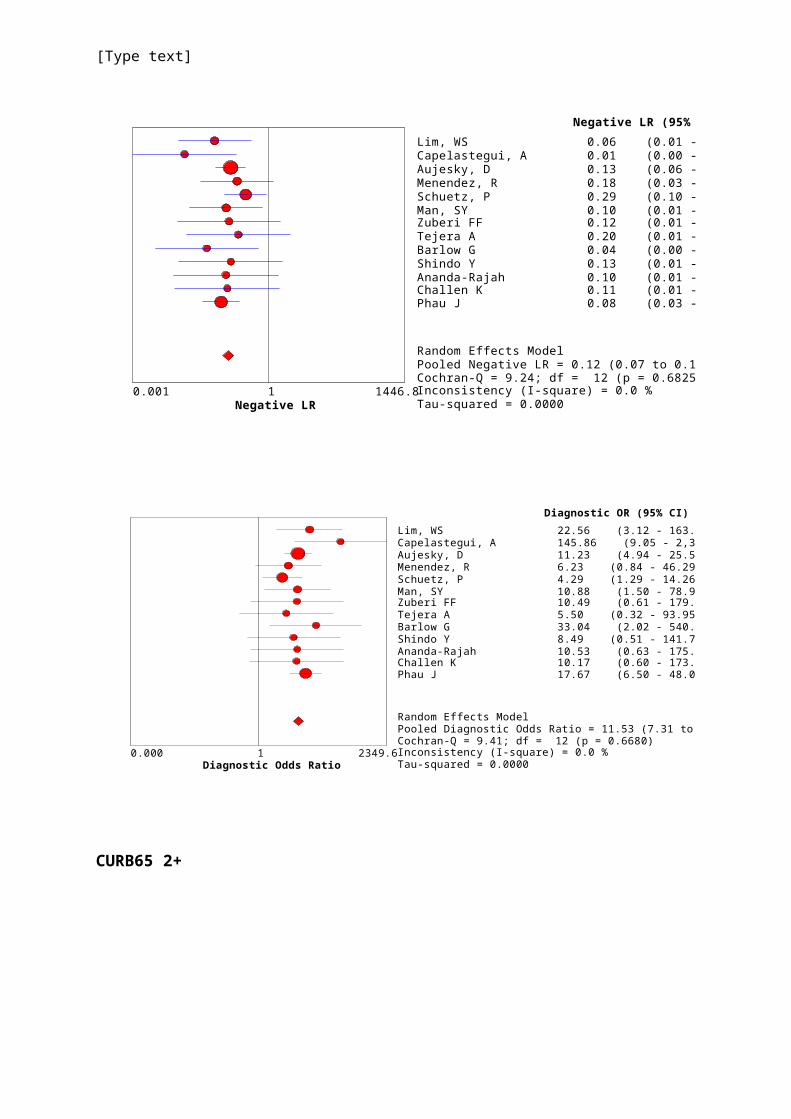
Negat i ve LR0. 001 1446. 81
Lim, WS 0. 06 ( 0. 01 - 0. 39)Capelast egui, A 0. 01 ( 0. 00 - 0. 17)Aujesky, D 0. 13 ( 0. 06 - 0. 28)Menendez, R 0. 18 ( 0. 03 - 1. 29)Schuet z, P 0. 29 ( 0. 10 - 0. 87)Man, SY 0. 10 ( 0. 01 - 0. 72)Zuber i FF 0. 12 ( 0. 01 - 1. 87)Tejer a A 0. 20 ( 0. 01 - 3. 17)Bar low G 0. 04 ( 0. 00 - 0. 58)Shindo Y 0. 13 ( 0. 01 - 2. 09)Ananda- Rajah 0. 10 ( 0. 01 - 1. 65)Challen K 0. 11 ( 0. 01 - 1. 78)Phau J 0. 08 ( 0. 03 - 0. 20)
Negat i ve LR (95% CI )
Random Ef f ect s ModelPooled Negat ive LR = 0. 12 ( 0. 07 t o 0. 18)Cochr an- Q = 9. 24; df = 12 (p = 0. 6825)I nconsist ency ( I - squar e) = 0. 0 %Tau- squared = 0. 0000
Di agnost i c O dds Rat i o0. 000 2349. 61
Lim , WS 22. 56 ( 3. 12 - 163. 08)Capelast egui, A 145. 86 ( 9. 05 - 2, 349. 59)Aujesky, D 11. 23 ( 4. 94 - 25. 54)M enendez, R 6. 23 ( 0. 84 - 46. 29)Schuet z, P 4. 29 ( 1. 29 - 14. 26)M an, SY 10. 88 ( 1. 50 - 78. 92)Zuber i FF 10. 49 ( 0. 61 - 179. 84)Tejer a A 5. 50 ( 0. 32 - 93. 95)Bar low G 33. 04 ( 2. 02 - 540. 53)Shindo Y 8. 49 ( 0. 51 - 141. 77)Ananda- Rajah 10. 53 ( 0. 63 - 175. 10)Challen K 10. 17 ( 0. 60 - 173. 68)Phau J 17. 67 ( 6. 50 - 48. 03)
Di agnost i c O R ( 95% CI )
Random Ef f ect s M odelPooled Diagnost ic O dds Rat io = 11. 53 ( 7. 31 t o 18. 19)Cochr an- Q = 9. 41; df = 12 ( p = 0. 6680)I nconsist ency ( I - squar e) = 0. 0 %Tau- squar ed = 0. 0000
CURB65 2+

[Type text]
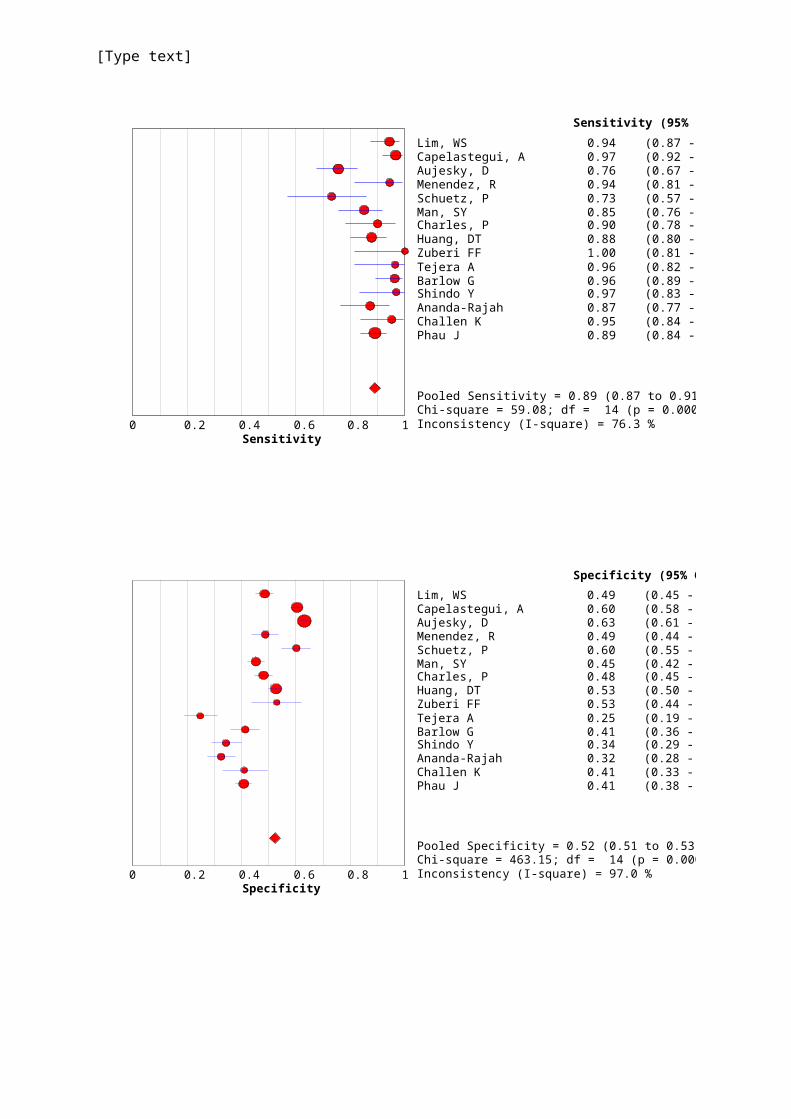
Sensi t i vi t y0 0. 2 0. 4 0. 6 0. 8 1
Lim , WS 0. 94 ( 0. 87 - 0. 98)Capelast egui, A 0. 97 ( 0. 92 - 0. 99)Aujesky, D 0. 76 ( 0. 67 - 0. 83)M enendez, R 0. 94 ( 0. 81 - 0. 99)Schuet z, P 0. 73 ( 0. 57 - 0. 86)M an, SY 0. 85 ( 0. 76 - 0. 92)Char les, P 0. 90 ( 0. 78 - 0. 97)Huang, DT 0. 88 ( 0. 80 - 0. 93)Zuber i FF 1. 00 ( 0. 81 - 1. 00)Tejer a A 0. 96 ( 0. 82 - 1. 00)Bar low G 0. 96 ( 0. 89 - 0. 99)Shindo Y 0. 97 ( 0. 83 - 1. 00)Ananda- Rajah 0. 87 ( 0. 77 - 0. 94)Challen K 0. 95 ( 0. 84 - 0. 99)Phau J 0. 89 ( 0. 84 - 0. 93)
Sensi t i vi t y ( 95% CI )
Pooled Sensit ivit y = 0. 89 ( 0. 87 t o 0. 91)Chi- squar e = 59. 08; df = 14 ( p = 0. 0000)I nconsist ency ( I - squar e) = 76. 3 %
Speci f i ci t y0 0. 2 0. 4 0. 6 0. 8 1
Lim , WS 0. 49 ( 0. 45 - 0. 52)Capelast egui, A 0. 60 ( 0. 58 - 0. 63)Aujesky, D 0. 63 ( 0. 61 - 0. 65)M enendez, R 0. 49 ( 0. 44 - 0. 54)Schuet z, P 0. 60 ( 0. 55 - 0. 65)M an, SY 0. 45 ( 0. 42 - 0. 48)Char les, P 0. 48 ( 0. 45 - 0. 52)Huang, DT 0. 53 ( 0. 50 - 0. 55)Zuber i FF 0. 53 ( 0. 44 - 0. 62)Tejer a A 0. 25 ( 0. 19 - 0. 31)Bar low G 0. 41 ( 0. 36 - 0. 47)Shindo Y 0. 34 ( 0. 29 - 0. 40)Ananda- Rajah 0. 32 ( 0. 28 - 0. 38)Challen K 0. 41 ( 0. 33 - 0. 49)Phau J 0. 41 ( 0. 38 - 0. 44)
Speci f i ci t y ( 95% CI )
Pooled Specif icit y = 0. 52 ( 0. 51 t o 0. 53)Chi- squar e = 463. 15; df = 14 ( p = 0. 0000)I nconsist ency ( I - squar e) = 97. 0 %

[Type text]
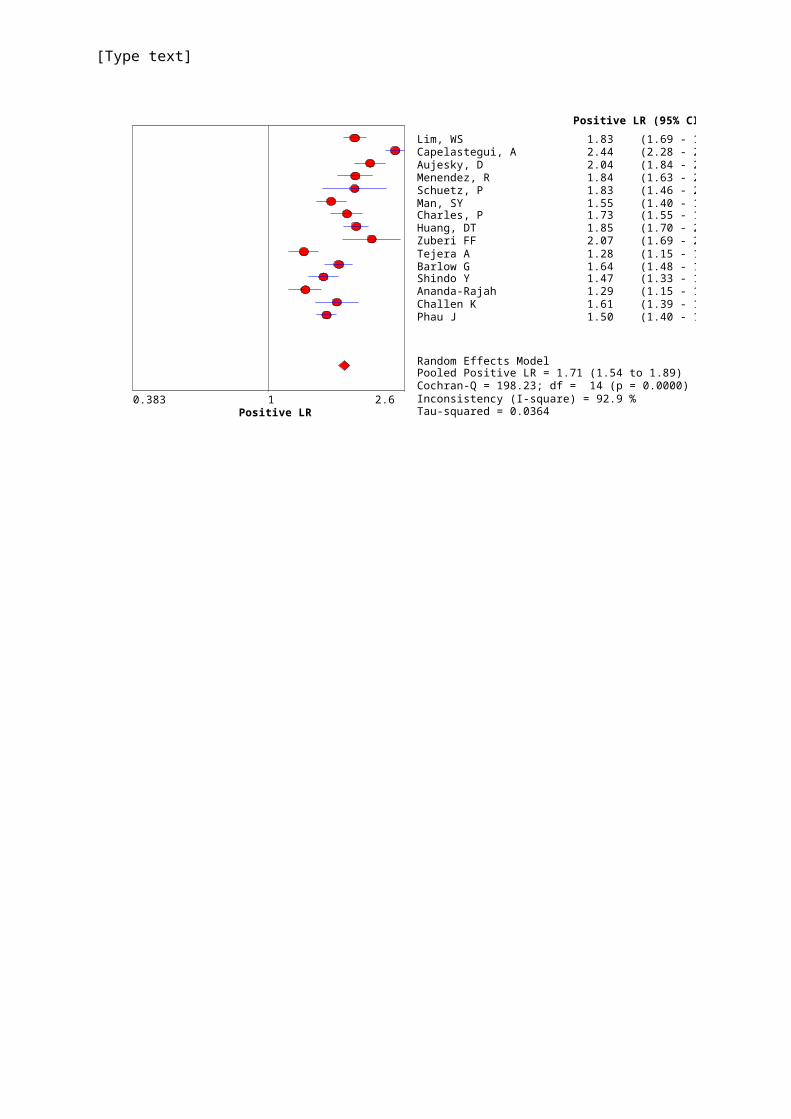
Posi t i ve LR0. 383 2. 61
Lim , WS 1. 83 ( 1. 69 - 1. 99)Capelast egui, A 2. 44 ( 2. 28 - 2. 61)Aujesky, D 2. 04 ( 1. 84 - 2. 27)M enendez, R 1. 84 ( 1. 63 - 2. 08)Schuet z, P 1. 83 ( 1. 46 - 2. 30)M an, SY 1. 55 ( 1. 40 - 1. 73)Char les, P 1. 73 ( 1. 55 - 1. 94)Huang, DT 1. 85 ( 1. 70 - 2. 02)Zuber i FF 2. 07 ( 1. 69 - 2. 53)Tejer a A 1. 28 ( 1. 15 - 1. 43)Bar low G 1. 64 ( 1. 48 - 1. 81)Shindo Y 1. 47 ( 1. 33 - 1. 63)Ananda- Rajah 1. 29 ( 1. 15 - 1. 46)Challen K 1. 61 ( 1. 39 - 1. 88)Phau J 1. 50 ( 1. 40 - 1. 61)
Posi t i ve LR ( 95% CI )
Random Ef f ect s M odelPooled Posit ive LR = 1. 71 ( 1. 54 t o 1. 89)Cochr an- Q = 198. 23; df = 14 ( p = 0. 0000)I nconsist ency ( I - squar e) = 92. 9 %Tau- squar ed = 0. 0364
[Type text]
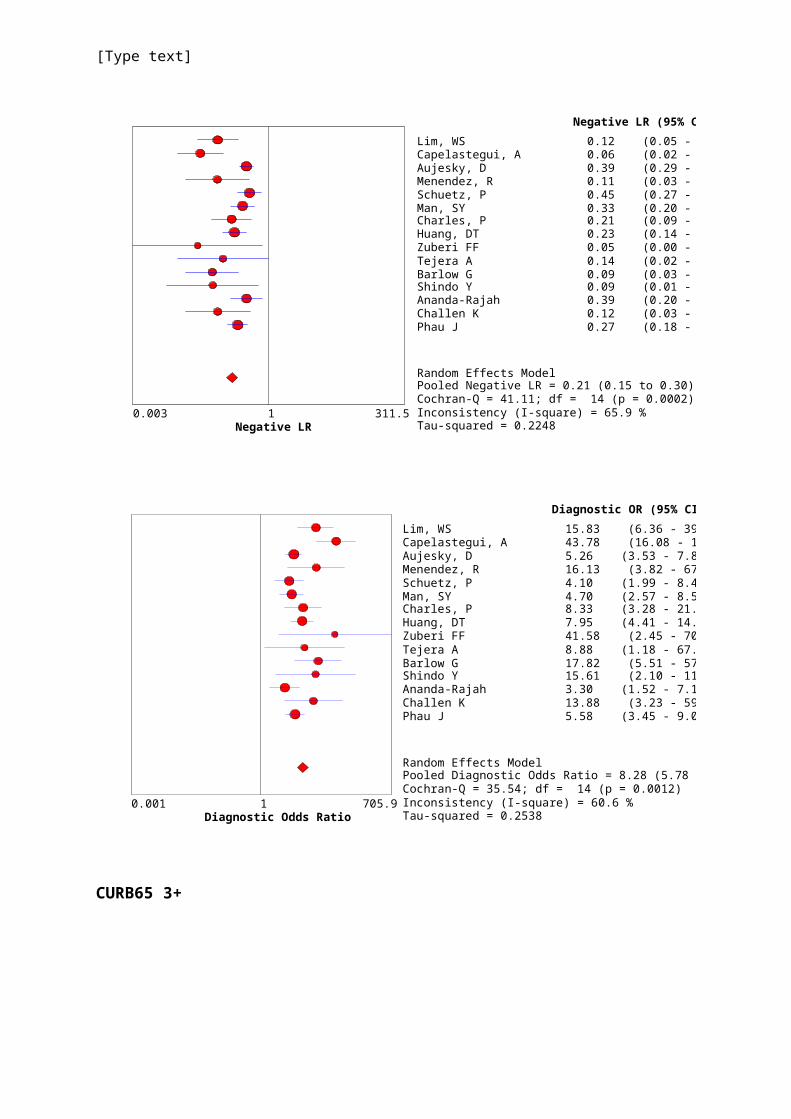
Negat i ve LR0. 003 311. 51
Lim , WS 0. 12 ( 0. 05 - 0. 27)Capelast egui, A 0. 06 ( 0. 02 - 0. 15)Aujesky, D 0. 39 ( 0. 29 - 0. 52)M enendez, R 0. 11 ( 0. 03 - 0. 44)Schuet z, P 0. 45 ( 0. 27 - 0. 75)M an, SY 0. 33 ( 0. 20 - 0. 55)Char les, P 0. 21 ( 0. 09 - 0. 48)Huang, DT 0. 23 ( 0. 14 - 0. 39)Zuber i FF 0. 05 ( 0. 00 - 0. 77)Tejer a A 0. 14 ( 0. 02 - 1. 00)Bar low G 0. 09 ( 0. 03 - 0. 28)Shindo Y 0. 09 ( 0. 01 - 0. 65)Ananda- Rajah 0. 39 ( 0. 20 - 0. 76)Challen K 0. 12 ( 0. 03 - 0. 46)Phau J 0. 27 ( 0. 18 - 0. 41)
Negat i ve LR ( 95% CI )
Random Ef f ect s M odelPooled Negat ive LR = 0. 21 ( 0. 15 t o 0. 30)Cochr an- Q = 41. 11; df = 14 ( p = 0. 0002)I nconsist ency ( I - squar e) = 65. 9 %Tau- squar ed = 0. 2248
Di agnost i c O dds Rat i o0. 001 705. 91
Lim , WS 15. 83 ( 6. 36 - 39. 42)Capelast egui, A 43. 78 ( 16. 08 - 119. 21)Aujesky, D 5. 26 ( 3. 53 - 7. 85)M enendez, R 16. 13 ( 3. 82 - 67. 99)Schuet z, P 4. 10 ( 1. 99 - 8. 46)M an, SY 4. 70 ( 2. 57 - 8. 59)Char les, P 8. 33 ( 3. 28 - 21. 20)Huang, DT 7. 95 ( 4. 41 - 14. 32)Zuber i FF 41. 58 ( 2. 45 - 705. 93)Tejer a A 8. 88 ( 1. 18 - 67. 06)Bar low G 17. 82 ( 5. 51 - 57. 64)Shindo Y 15. 61 ( 2. 10 - 116. 13)Ananda- Rajah 3. 30 ( 1. 52 - 7. 17)Challen K 13. 88 ( 3. 23 - 59. 68)Phau J 5. 58 ( 3. 45 - 9. 02)
Di agnost i c O R ( 95% CI )
Random Ef f ect s M odelPooled Diagnost ic O dds Rat io = 8. 28 ( 5. 78 t o 11. 88)Cochr an- Q = 35. 54; df = 14 ( p = 0. 0012)I nconsist ency ( I - squar e) = 60. 6 %Tau- squar ed = 0. 2538
CURB65 3+
[Type text]
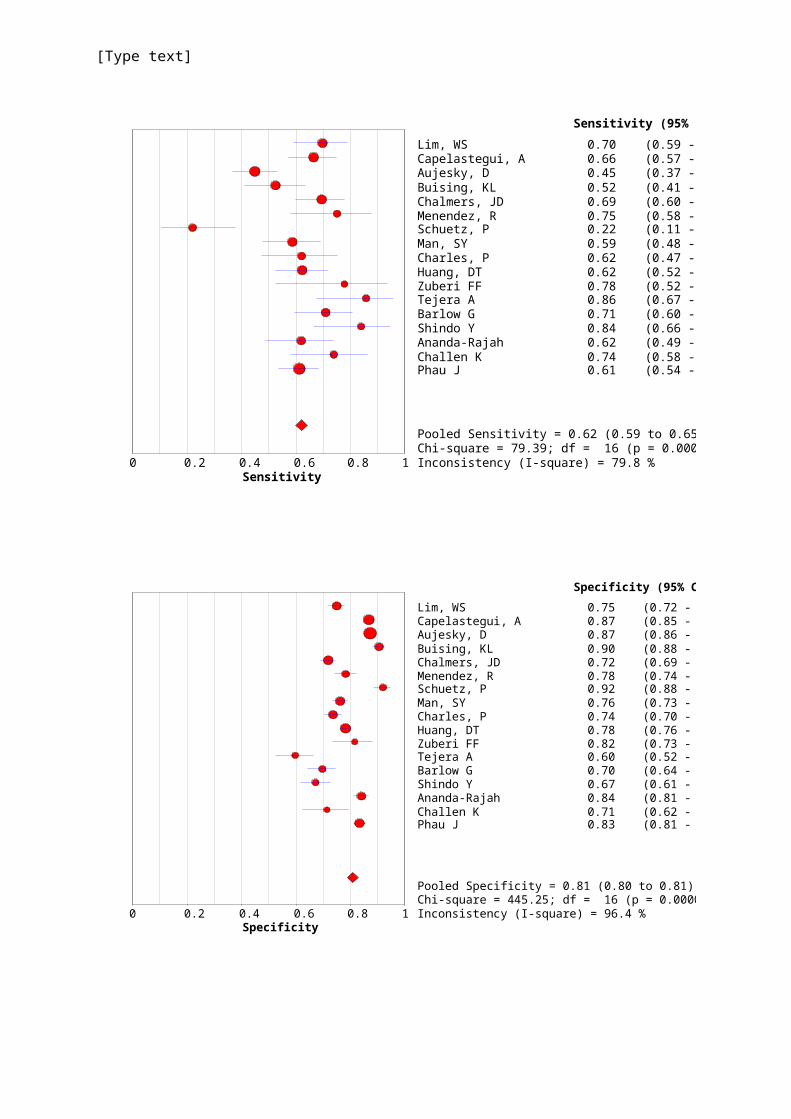
Sensi t i vi t y0 0. 2 0. 4 0. 6 0. 8 1
Lim , WS 0. 70 ( 0. 59 - 0. 79)Capelast egui, A 0. 66 ( 0. 57 - 0. 75)Aujesky, D 0. 45 ( 0. 37 - 0. 53)Buising, KL 0. 52 ( 0. 41 - 0. 64)Chalm er s, JD 0. 69 ( 0. 60 - 0. 78)M enendez, R 0. 75 ( 0. 58 - 0. 88)Schuet z, P 0. 22 ( 0. 11 - 0. 38)M an, SY 0. 59 ( 0. 48 - 0. 69)Char les, P 0. 62 ( 0. 47 - 0. 75)Huang, DT 0. 62 ( 0. 52 - 0. 71)Zuber i FF 0. 78 ( 0. 52 - 0. 94)Tejer a A 0. 86 ( 0. 67 - 0. 96)Bar low G 0. 71 ( 0. 60 - 0. 81)Shindo Y 0. 84 ( 0. 66 - 0. 95)Ananda- Rajah 0. 62 ( 0. 49 - 0. 74)Challen K 0. 74 ( 0. 58 - 0. 86)Phau J 0. 61 ( 0. 54 - 0. 68)
Sensi t i vi t y ( 95% CI )
Pooled Sensit ivit y = 0. 62 ( 0. 59 t o 0. 65)Chi- squar e = 79. 39; df = 16 ( p = 0. 0000)I nconsist ency ( I - squar e) = 79. 8 %
Speci f i ci t y0 0. 2 0. 4 0. 6 0. 8 1
Lim , WS 0. 75 ( 0. 72 - 0. 78)Capelast egui, A 0. 87 ( 0. 85 - 0. 88)Aujesky, D 0. 87 ( 0. 86 - 0. 88)Buising, KL 0. 90 ( 0. 88 - 0. 93)Chalm er s, JD 0. 72 ( 0. 69 - 0. 74)M enendez, R 0. 78 ( 0. 74 - 0. 82)Schuet z, P 0. 92 ( 0. 88 - 0. 95)M an, SY 0. 76 ( 0. 73 - 0. 79)Char les, P 0. 74 ( 0. 70 - 0. 77)Huang, DT 0. 78 ( 0. 76 - 0. 80)Zuber i FF 0. 82 ( 0. 73 - 0. 88)Tejer a A 0. 60 ( 0. 52 - 0. 66)Bar low G 0. 70 ( 0. 64 - 0. 74)Shindo Y 0. 67 ( 0. 61 - 0. 72)Ananda- Rajah 0. 84 ( 0. 81 - 0. 87)Challen K 0. 71 ( 0. 62 - 0. 79)Phau J 0. 83 ( 0. 81 - 0. 85)
Speci f i ci t y ( 95% CI )
Pooled Specif icit y = 0. 81 ( 0. 80 t o 0. 81)Chi- squar e = 445. 25; df = 16 ( p = 0. 0000)I nconsist ency ( I - squar e) = 96. 4 %
[Type text]
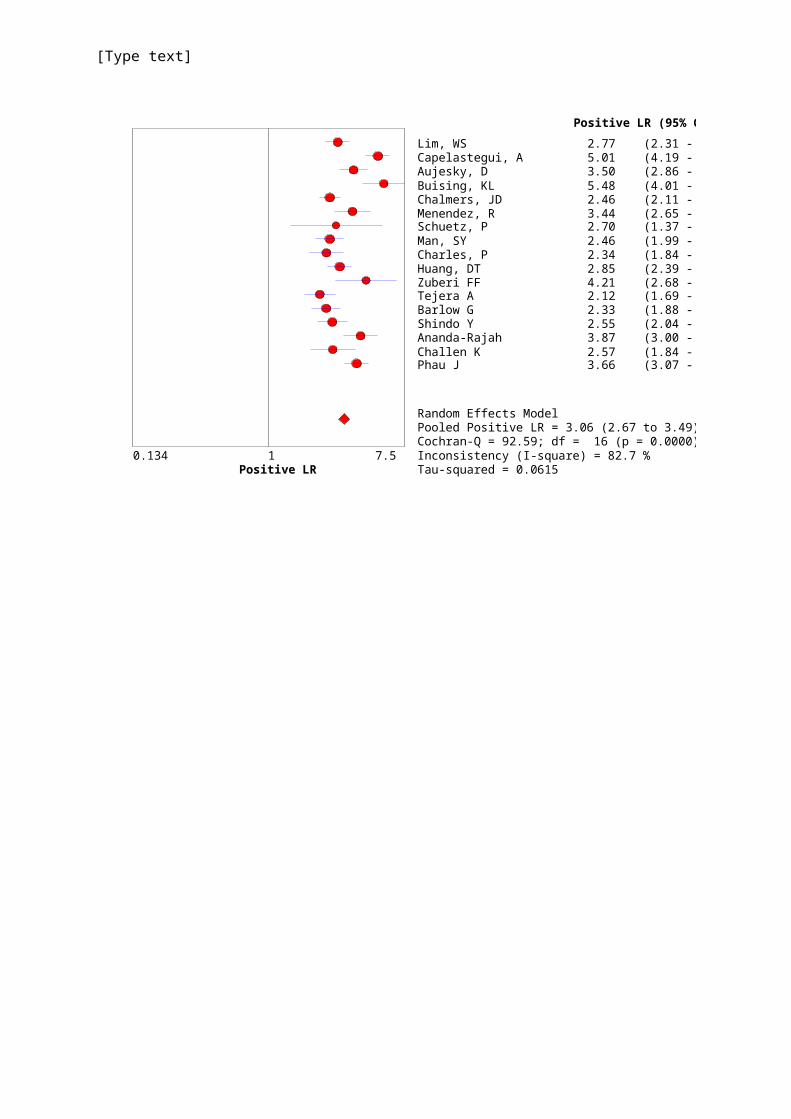
Posi t i ve LR0. 134 7. 51
Lim , WS 2. 77 ( 2. 31 - 3. 32)Capelast egui, A 5. 01 ( 4. 19 - 5. 98)Aujesky, D 3. 50 ( 2. 86 - 4. 29)Buising, KL 5. 48 ( 4. 01 - 7. 49)Chalm er s, JD 2. 46 ( 2. 11 - 2. 87)M enendez, R 3. 44 ( 2. 65 - 4. 47)Schuet z, P 2. 70 ( 1. 37 - 5. 33)M an, SY 2. 46 ( 1. 99 - 3. 03)Char les, P 2. 34 ( 1. 84 - 3. 00)Huang, DT 2. 85 ( 2. 39 - 3. 39)Zuber i FF 4. 21 ( 2. 68 - 6. 60)Tejer a A 2. 12 ( 1. 69 - 2. 66)Bar low G 2. 33 ( 1. 88 - 2. 89)Shindo Y 2. 55 ( 2. 04 - 3. 19)Ananda- Rajah 3. 87 ( 3. 00 - 5. 00)Challen K 2. 57 ( 1. 84 - 3. 59)Phau J 3. 66 ( 3. 07 - 4. 37)
Posi t i ve LR ( 95% CI )
Random Ef f ect s M odelPooled Posit ive LR = 3. 06 ( 2. 67 t o 3. 49)Cochr an- Q = 92. 59; df = 16 ( p = 0. 0000)I nconsist ency ( I - squar e) = 82. 7 %Tau- squared = 0. 0615
[Type text]
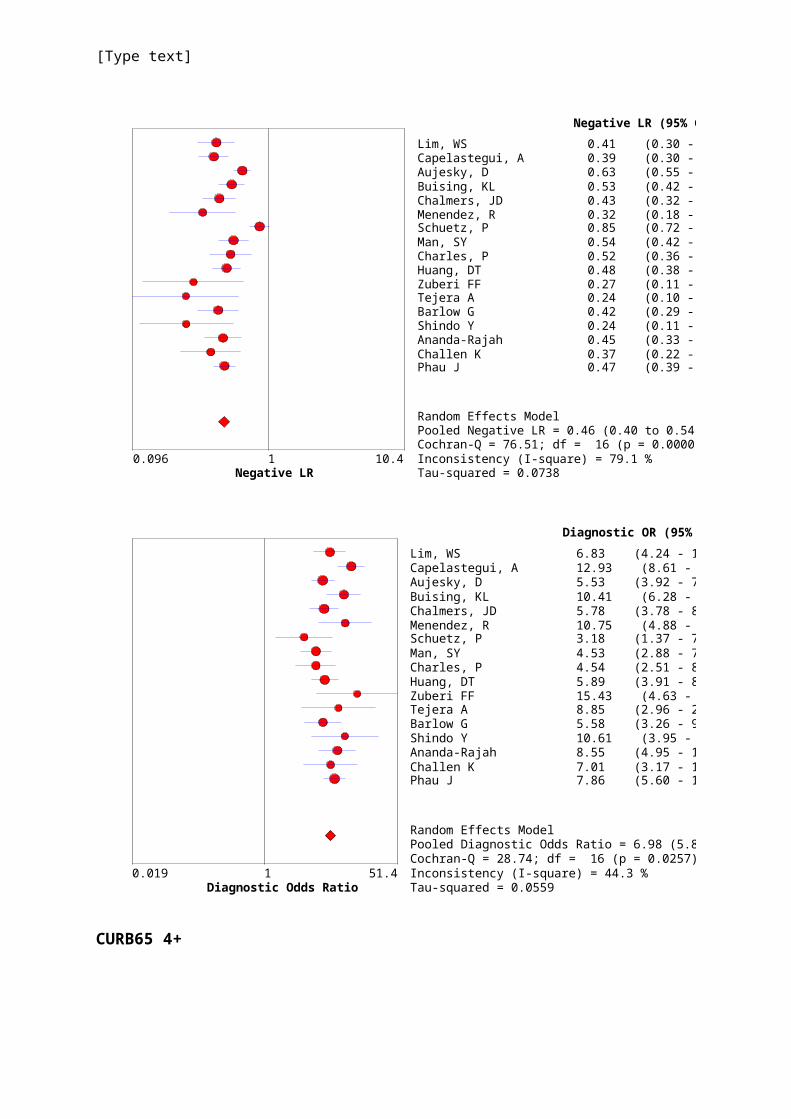
Negat i ve LR0. 096 10. 41
Lim , WS 0. 41 ( 0. 30 - 0. 56)Capelast egui, A 0. 39 ( 0. 30 - 0. 50)Aujesky, D 0. 63 ( 0. 55 - 0. 73)Buising, KL 0. 53 ( 0. 42 - 0. 66)Chalm er s, JD 0. 43 ( 0. 32 - 0. 57)M enendez, R 0. 32 ( 0. 18 - 0. 56)Schuet z, P 0. 85 ( 0. 72 - 1. 00)M an, SY 0. 54 ( 0. 42 - 0. 70)Char les, P 0. 52 ( 0. 36 - 0. 74)Huang, DT 0. 48 ( 0. 38 - 0. 62)Zuber i FF 0. 27 ( 0. 11 - 0. 65)Tejer a A 0. 24 ( 0. 10 - 0. 60)Bar low G 0. 42 ( 0. 29 - 0. 59)Shindo Y 0. 24 ( 0. 11 - 0. 54)Ananda- Rajah 0. 45 ( 0. 33 - 0. 62)Challen K 0. 37 ( 0. 22 - 0. 62)Phau J 0. 47 ( 0. 39 - 0. 56)
Negat i ve LR ( 95% CI )
Random Ef f ect s M odelPooled Negat ive LR = 0. 46 ( 0. 40 t o 0. 54)Cochr an- Q = 76. 51; df = 16 ( p = 0. 0000)I nconsist ency ( I - squar e) = 79. 1 %Tau- squar ed = 0. 0738
Di agnost i c O dds Rat i o0. 019 51. 41
Lim , WS 6. 83 ( 4. 24 - 11. 02)Capelast egui, A 12. 93 ( 8. 61 - 19. 40)Aujesky, D 5. 53 ( 3. 92 - 7. 80)Buising, KL 10. 41 ( 6. 28 - 17. 26)Chalm er s, JD 5. 78 ( 3. 78 - 8. 83)M enendez, R 10. 75 ( 4. 88 - 23. 67)Schuet z, P 3. 18 ( 1. 37 - 7. 34)M an, SY 4. 53 ( 2. 88 - 7. 12)Char les, P 4. 54 ( 2. 51 - 8. 20)Huang, DT 5. 89 ( 3. 91 - 8. 89)Zuber i FF 15. 43 ( 4. 63 - 51. 43)Tejer a A 8. 85 ( 2. 96 - 26. 48)Bar low G 5. 58 ( 3. 26 - 9. 55)Shindo Y 10. 61 ( 3. 95 - 28. 48)Ananda- Rajah 8. 55 ( 4. 95 - 14. 75)Challen K 7. 01 ( 3. 17 - 15. 46)Phau J 7. 86 ( 5. 60 - 11. 03)
Di agnost i c O R ( 95% CI )
Random Ef f ect s M odelPooled Diagnost ic O dds Rat io = 6. 98 ( 5. 84 t o 8. 33)Cochr an- Q = 28. 74; df = 16 ( p = 0. 0257)I nconsist ency ( I - squar e) = 44. 3 %Tau- squar ed = 0. 0559
CURB65 4+
[Type text]
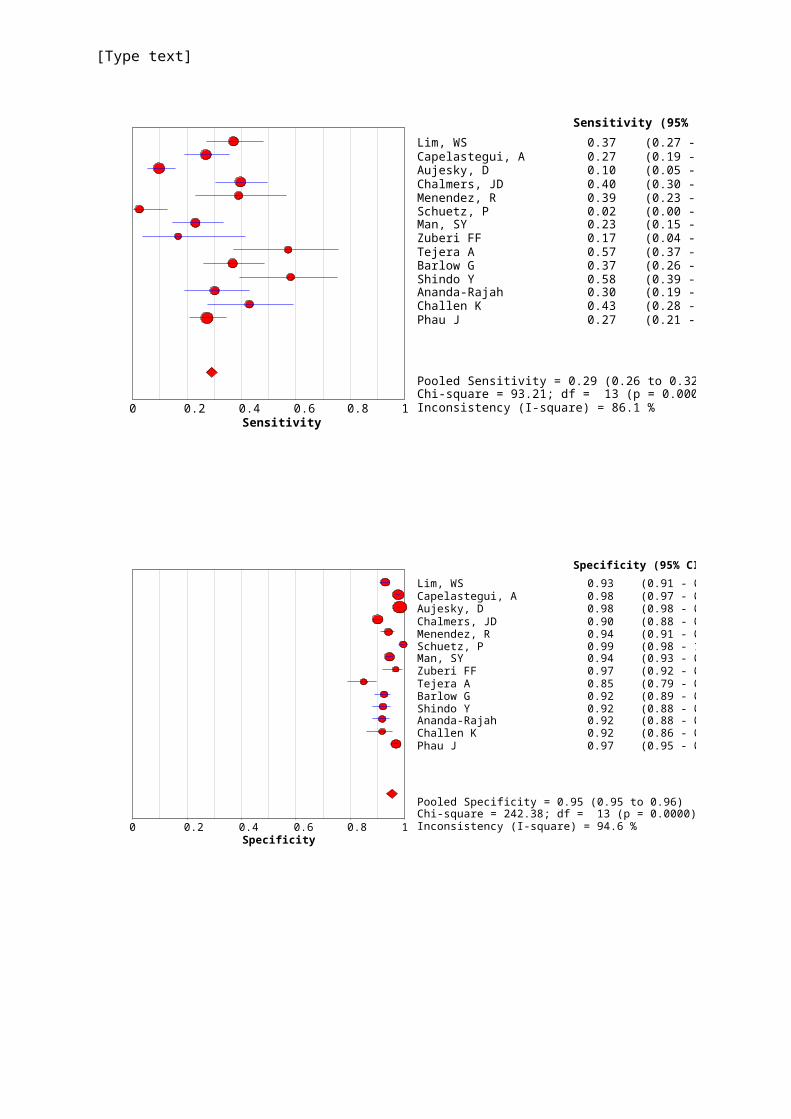
Sensi t i vi t y0 0. 2 0. 4 0. 6 0. 8 1
Lim, WS 0. 37 (0. 27 - 0. 48)Capelast egui, A 0. 27 (0. 19 - 0. 36)Aujesky, D 0. 10 (0. 05 - 0. 16)Chalmers, JD 0. 40 (0. 30 - 0. 49)Menendez, R 0. 39 (0. 23 - 0. 57)Schuet z, P 0. 02 (0. 00 - 0. 13)Man, SY 0. 23 (0. 15 - 0. 33)Zuber i FF 0. 17 (0. 04 - 0. 41)Tejer a A 0. 57 (0. 37 - 0. 76)Bar low G 0. 37 (0. 26 - 0. 48)Shindo Y 0. 58 (0. 39 - 0. 75)Ananda-Rajah 0. 30 (0. 19 - 0. 43)Challen K 0. 43 (0. 28 - 0. 59)Phau J 0. 27 (0. 21 - 0. 34)
Sensi t i vi t y (95% CI )
Pooled Sensit ivit y = 0. 29 ( 0. 26 t o 0. 32)Chi- squar e = 93. 21; df = 13 (p = 0. 0000)I nconsist ency ( I - squar e) = 86. 1 %
Speci f i ci t y0 0. 2 0. 4 0. 6 0. 8 1
Lim, WS 0. 93 ( 0. 91 - 0. 94)Capelast egui, A 0. 98 ( 0. 97 - 0. 98)Aujesky, D 0. 98 ( 0. 98 - 0. 99)Chalmer s, JD 0. 90 ( 0. 88 - 0. 92)Menendez, R 0. 94 ( 0. 91 - 0. 96)Schuet z, P 0. 99 ( 0. 98 - 1. 00)Man, SY 0. 94 ( 0. 93 - 0. 96)Zuber i FF 0. 97 ( 0. 92 - 0. 99)Tejer a A 0. 85 ( 0. 79 - 0. 90)Bar low G 0. 92 ( 0. 89 - 0. 95)Shindo Y 0. 92 ( 0. 88 - 0. 95)Ananda- Rajah 0. 92 ( 0. 88 - 0. 94)Challen K 0. 92 ( 0. 86 - 0. 96)Phau J 0. 97 ( 0. 95 - 0. 98)
Speci f i ci t y ( 95% CI )
Pooled Specif icit y = 0. 95 ( 0. 95 t o 0. 96)Chi-squar e = 242. 38; df = 13 ( p = 0. 0000)I nconsist ency ( I - squar e) = 94. 6 %
[Type text]
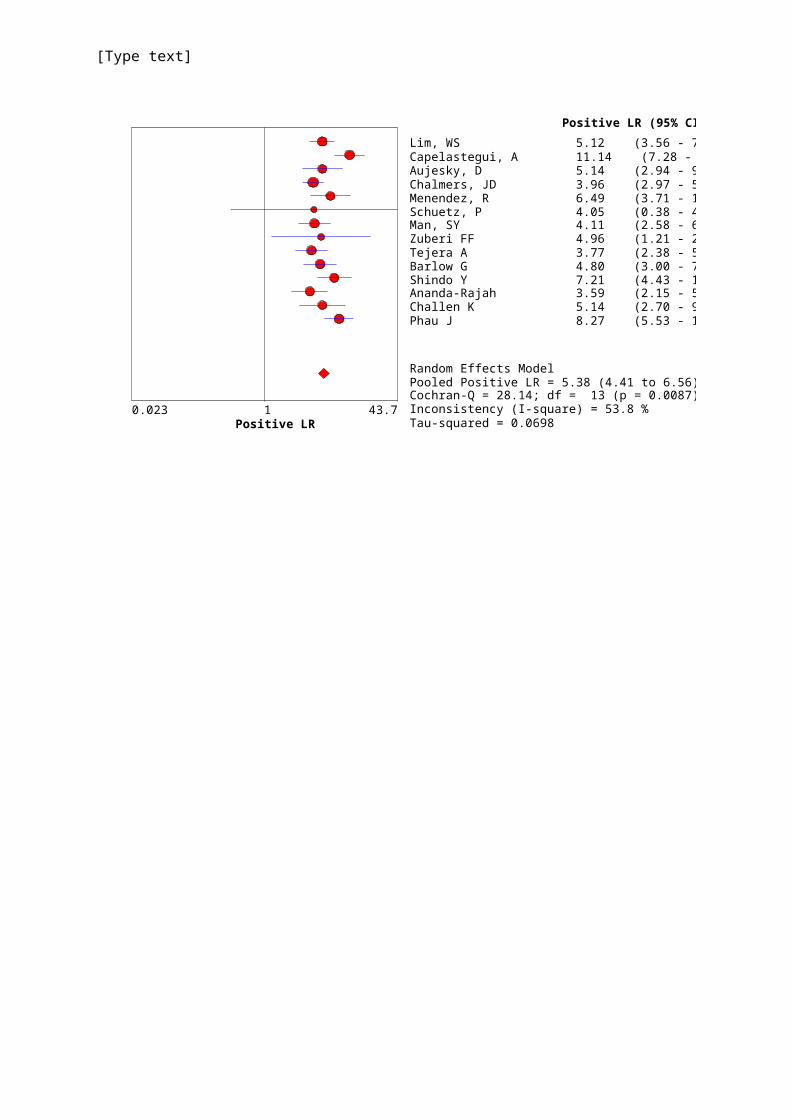
Posi t i ve LR0. 023 43. 71
Lim , WS 5. 12 ( 3. 56 - 7. 37)Capelast egui, A 11. 14 ( 7. 28 - 17. 06)Aujesky, D 5. 14 ( 2. 94 - 9. 01)Chalm er s, JD 3. 96 ( 2. 97 - 5. 27)M enendez, R 6. 49 ( 3. 71 - 11. 34)Schuet z, P 4. 05 ( 0. 38 - 43. 68)M an, SY 4. 11 ( 2. 58 - 6. 55)Zuber i FF 4. 96 ( 1. 21 - 20. 36)Tejer a A 3. 77 ( 2. 38 - 5. 97)Bar low G 4. 80 ( 3. 00 - 7. 68)Shindo Y 7. 21 ( 4. 43 - 11. 73)Ananda- Rajah 3. 59 ( 2. 15 - 5. 99)Challen K 5. 14 ( 2. 70 - 9. 80)Phau J 8. 27 ( 5. 53 - 12. 36)
Posi t i ve LR ( 95% CI )
Random Ef f ect s M odelPooled Posit ive LR = 5. 38 ( 4. 41 t o 6. 56)Cochr an- Q = 28. 14; df = 13 ( p = 0. 0087)I nconsist ency ( I - squar e) = 53. 8 %Tau- squar ed = 0. 0698
[Type text]
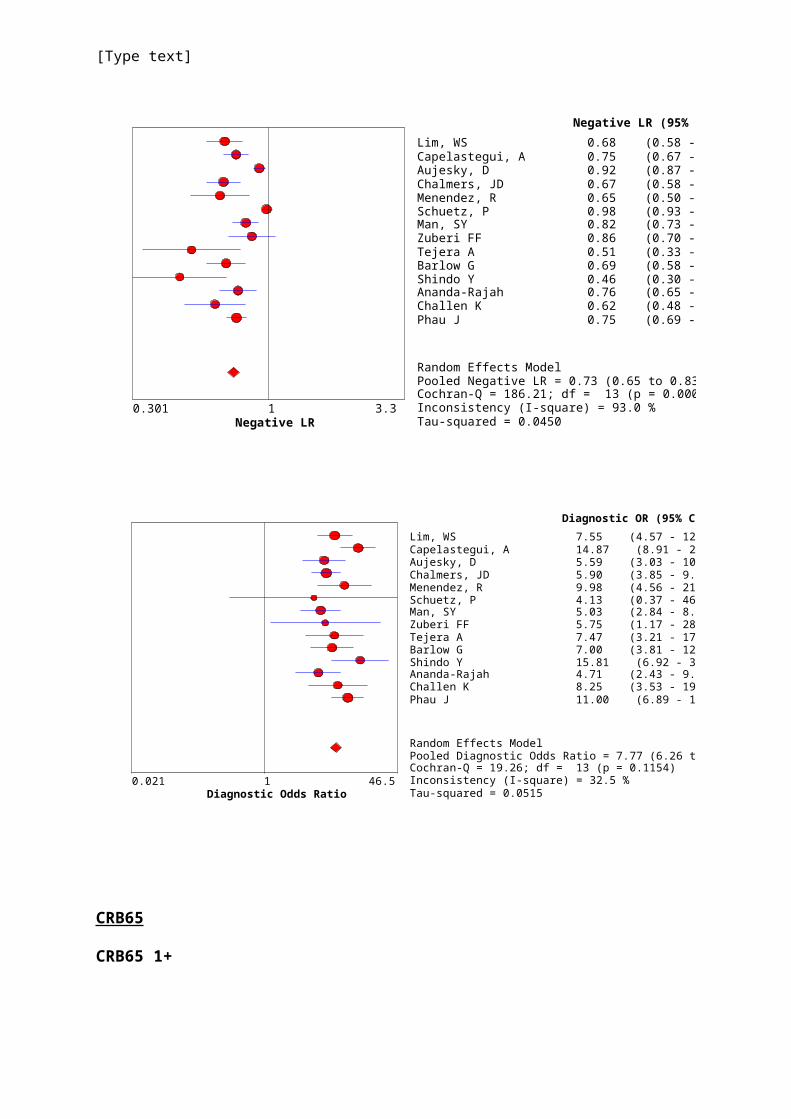
Negat i ve LR0. 301 3. 31
Lim, WS 0. 68 (0. 58 - 0. 80)Capelast egui, A 0. 75 (0. 67 - 0. 84)Aujesky, D 0. 92 (0. 87 - 0. 97)Chalmers, JD 0. 67 (0. 58 - 0. 78)Menendez, R 0. 65 (0. 50 - 0. 84)Schuet z, P 0. 98 (0. 93 - 1. 03)Man, SY 0. 82 (0. 73 - 0. 92)Zuber i FF 0. 86 (0. 70 - 1. 06)Tejer a A 0. 51 (0. 33 - 0. 78)Bar low G 0. 69 (0. 58 - 0. 81)Shindo Y 0. 46 (0. 30 - 0. 69)Ananda-Rajah 0. 76 (0. 65 - 0. 90)Challen K 0. 62 (0. 48 - 0. 81)Phau J 0. 75 (0. 69 - 0. 82)
Negat i ve LR (95% CI )
Random Ef f ect s ModelPooled Negat ive LR = 0. 73 ( 0. 65 t o 0. 83)Cochran- Q = 186. 21; df = 13 ( p = 0. 0000)I nconsist ency ( I - squar e) = 93. 0 %Tau- squared = 0. 0450
Di agnost i c O dds Rat i o0. 021 46. 51
Lim , WS 7. 55 ( 4. 57 - 12. 49)Capelast egui, A 14. 87 ( 8. 91 - 24. 82)Aujesky, D 5. 59 ( 3. 03 - 10. 28)Chalm er s, JD 5. 90 ( 3. 85 - 9. 03)M enendez, R 9. 98 ( 4. 56 - 21. 82)Schuet z, P 4. 13 ( 0. 37 - 46. 52)M an, SY 5. 03 ( 2. 84 - 8. 92)Zuber i FF 5. 75 ( 1. 17 - 28. 22)Tejer a A 7. 47 ( 3. 21 - 17. 35)Bar low G 7. 00 ( 3. 81 - 12. 86)Shindo Y 15. 81 ( 6. 92 - 36. 12)Ananda- Rajah 4. 71 ( 2. 43 - 9. 09)Challen K 8. 25 ( 3. 53 - 19. 30)Phau J 11. 00 ( 6. 89 - 17. 57)
Di agnost i c O R ( 95% CI )
Random Ef f ect s M odelPooled Diagnost ic O dds Rat io = 7. 77 ( 6. 26 t o 9. 64)Cochr an- Q = 19. 26; df = 13 ( p = 0. 1154)I nconsist ency ( I - squar e) = 32. 5 %Tau- squar ed = 0. 0515
CRB65
CRB65 1+
[Type text]
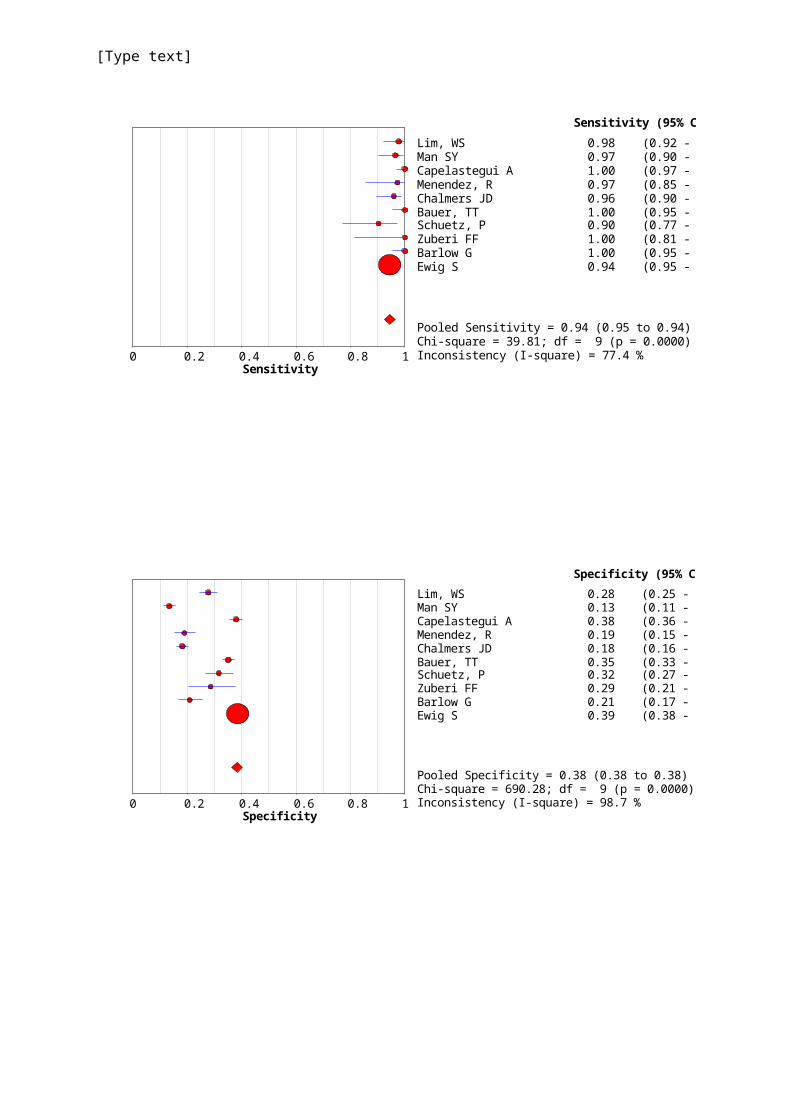
Sensi t i vi t y0 0. 2 0. 4 0. 6 0. 8 1
Lim, WS 0. 98 ( 0. 92 - 1. 00)Man SY 0. 97 ( 0. 90 - 0. 99)Capelast egui A 1. 00 ( 0. 97 - 1. 00)Menendez, R 0. 97 ( 0. 85 - 1. 00)Chalmer s JD 0. 96 ( 0. 90 - 0. 99)Bauer , TT 1. 00 ( 0. 95 - 1. 00)Schuet z, P 0. 90 ( 0. 77 - 0. 97)Zuber i FF 1. 00 ( 0. 81 - 1. 00)Bar low G 1. 00 ( 0. 95 - 1. 00)Ewig S 0. 94 ( 0. 95 - 0. 94)
Sensi t i vi t y (95% CI )
Pooled Sensit ivit y = 0. 94 ( 0. 95 t o 0. 94)Chi- squar e = 39. 81; df = 9 ( p = 0. 0000)I nconsist ency ( I - squar e) = 77. 4 %
Speci f i ci t y0 0. 2 0. 4 0. 6 0. 8 1
Lim, WS 0. 28 ( 0. 25 - 0. 31)Man SY 0. 13 ( 0. 11 - 0. 16)Capelast egui A 0. 38 ( 0. 36 - 0. 40)Menendez, R 0. 19 ( 0. 15 - 0. 23)Chalmer s JD 0. 18 ( 0. 16 - 0. 21)Bauer , TT 0. 35 ( 0. 33 - 0. 37)Schuet z, P 0. 32 ( 0. 27 - 0. 37)Zuber i FF 0. 29 ( 0. 21 - 0. 38)Bar low G 0. 21 ( 0. 17 - 0. 26)Ewig S 0. 39 ( 0. 38 - 0. 39)
Speci f i ci t y (95% CI )
Pooled Specif icit y = 0. 38 ( 0. 38 t o 0. 38)Chi- squar e = 690. 28; df = 9 (p = 0. 0000)I nconsist ency ( I - squar e) = 98. 7 %
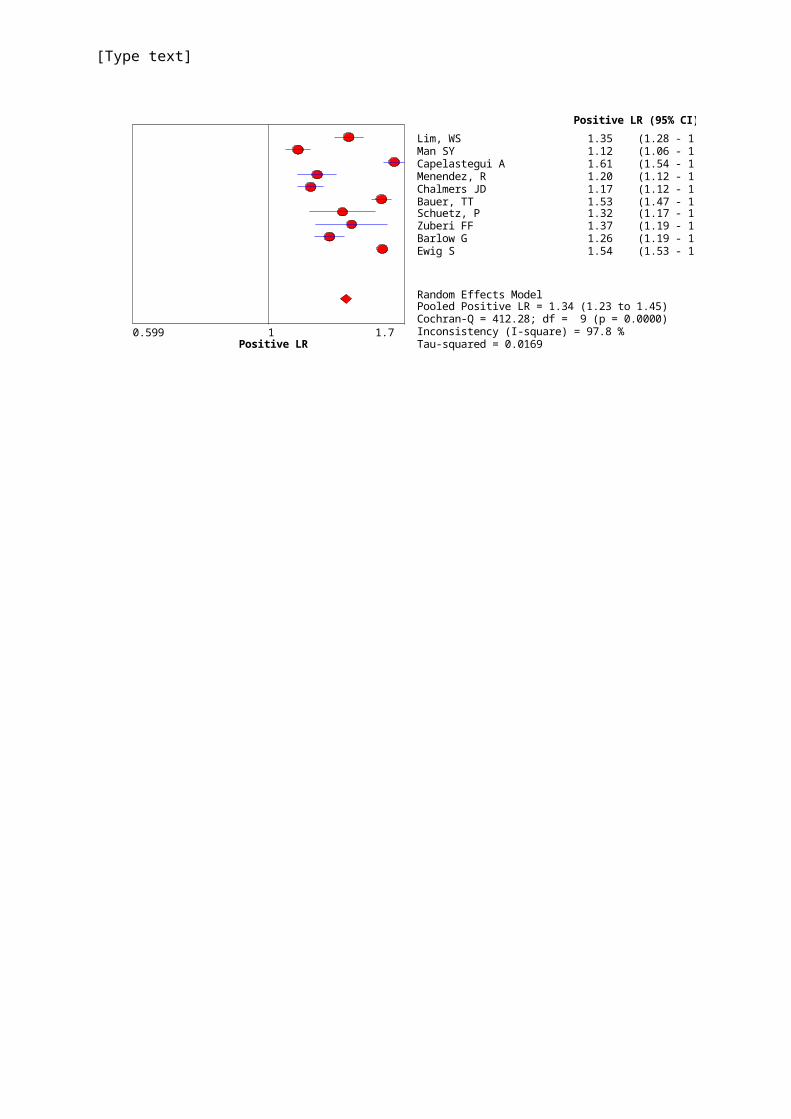
[Type text]
Posi t i ve LR0. 599 1. 71
Lim, WS 1. 35 (1. 28 - 1. 43)Man SY 1. 12 (1. 06 - 1. 17)Capelast egui A 1. 61 (1. 54 - 1. 67)Menendez, R 1. 20 (1. 12 - 1. 29)Chalmer s JD 1. 17 (1. 12 - 1. 23)Bauer , TT 1. 53 (1. 47 - 1. 59)Schuet z, P 1. 32 (1. 17 - 1. 49)Zuber i FF 1. 37 (1. 19 - 1. 57)Bar low G 1. 26 (1. 19 - 1. 33)Ewig S 1. 54 (1. 53 - 1. 54)
Posi t i ve LR (95% CI )
Random Ef f ect s ModelPooled Posit ive LR = 1. 34 ( 1. 23 t o 1. 45)Cochr an- Q = 412. 28; df = 9 ( p = 0. 0000)I nconsist ency ( I - squar e) = 97. 8 %Tau- squar ed = 0. 0169
[Type text]
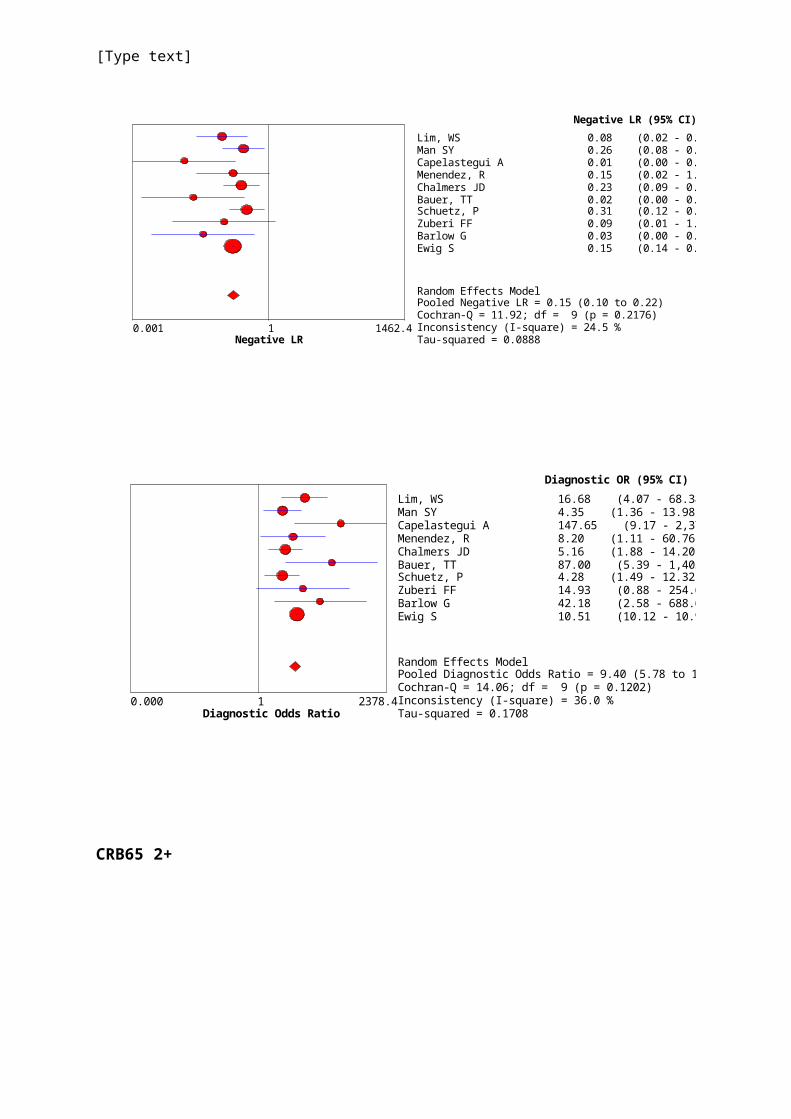
Negat i ve LR0. 001 1462. 41
Lim, WS 0. 08 ( 0. 02 - 0. 32)Man SY 0. 26 ( 0. 08 - 0. 79)Capelast egui A 0. 01 ( 0. 00 - 0. 17)Menendez, R 0. 15 ( 0. 02 - 1. 02)Chalmer s JD 0. 23 ( 0. 09 - 0. 60)Bauer , TT 0. 02 ( 0. 00 - 0. 28)Schuet z, P 0. 31 ( 0. 12 - 0. 79)Zuber i FF 0. 09 ( 0. 01 - 1. 43)Bar low G 0. 03 ( 0. 00 - 0. 48)Ewig S 0. 15 ( 0. 14 - 0. 15)
Negat i ve LR ( 95% CI )
Random Ef f ect s ModelPooled Negat ive LR = 0. 15 ( 0. 10 t o 0. 22)Cochr an- Q = 11. 92; df = 9 (p = 0. 2176)I nconsist ency ( I - squar e) = 24. 5 %Tau- squar ed = 0. 0888
Di agnost i c O dds Rat i o0. 000 2378. 41
Lim , WS 16. 68 ( 4. 07 - 68. 38)M an SY 4. 35 ( 1. 36 - 13. 98)Capelast egui A 147. 65 ( 9. 17 - 2, 378. 37)M enendez, R 8. 20 ( 1. 11 - 60. 76)Chalm er s JD 5. 16 ( 1. 88 - 14. 20)Bauer , TT 87. 00 ( 5. 39 - 1, 405. 14)Schuet z, P 4. 28 ( 1. 49 - 12. 32)Zuber i FF 14. 93 ( 0. 88 - 254. 69)Bar low G 42. 18 ( 2. 58 - 688. 66)Ewig S 10. 51 ( 10. 12 - 10. 90)
Di agnost i c O R ( 95% CI )
Random Ef f ect s M odelPooled Diagnost ic O dds Rat io = 9. 40 ( 5. 78 t o 15. 27)Cochr an- Q = 14. 06; df = 9 ( p = 0. 1202)I nconsist ency ( I - squar e) = 36. 0 %Tau- squar ed = 0. 1708
CRB65 2+
[Type text]
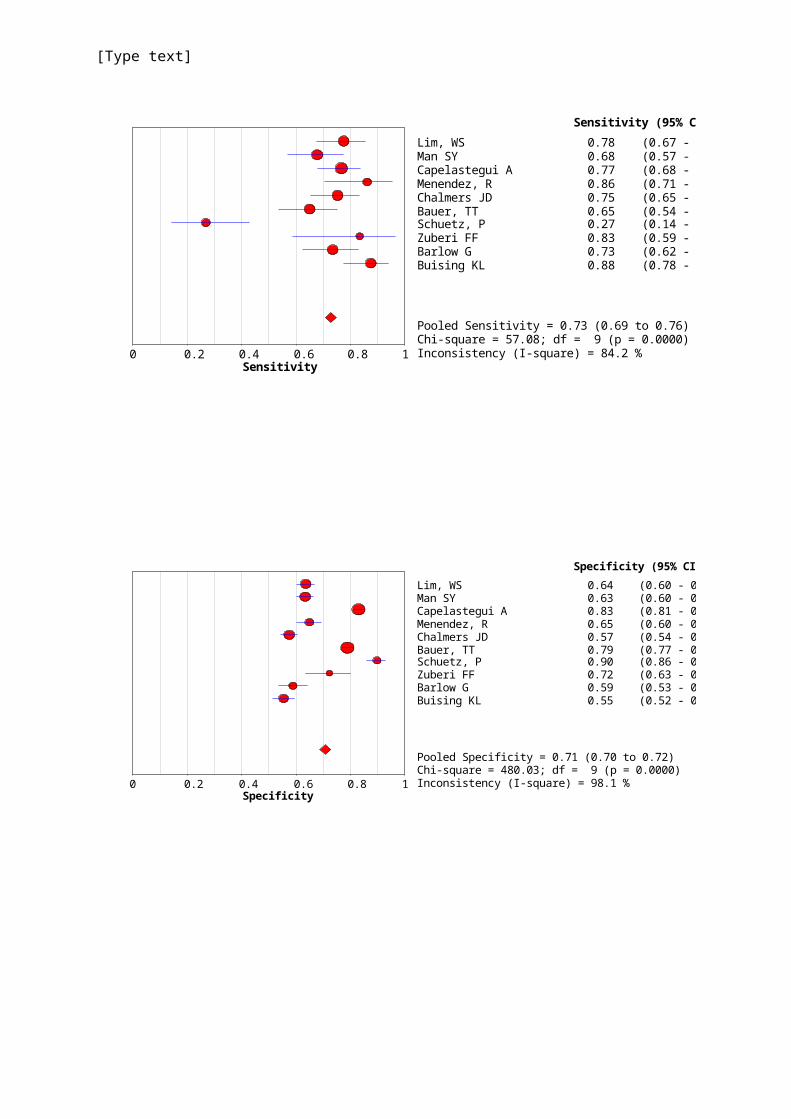
Sensi t i vi t y0 0. 2 0. 4 0. 6 0. 8 1
Lim, WS 0. 78 ( 0. 67 - 0. 86)Man SY 0. 68 ( 0. 57 - 0. 77)Capelast egui A 0. 77 ( 0. 68 - 0. 84)Menendez, R 0. 86 ( 0. 71 - 0. 95)Chalmers JD 0. 75 ( 0. 65 - 0. 83)Bauer , TT 0. 65 ( 0. 54 - 0. 75)Schuet z, P 0. 27 ( 0. 14 - 0. 43)Zuber i FF 0. 83 ( 0. 59 - 0. 96)Bar low G 0. 73 ( 0. 62 - 0. 83)Buising KL 0. 88 ( 0. 78 - 0. 94)
Sensi t i vi t y ( 95% CI )
Pooled Sensit ivit y = 0. 73 ( 0. 69 t o 0. 76)Chi- squar e = 57. 08; df = 9 ( p = 0. 0000)I nconsist ency ( I - squar e) = 84. 2 %
Speci f i ci t y0 0. 2 0. 4 0. 6 0. 8 1
Lim, WS 0. 64 ( 0. 60 - 0. 67)Man SY 0. 63 ( 0. 60 - 0. 67)Capelast egui A 0. 83 ( 0. 81 - 0. 85)Menendez, R 0. 65 ( 0. 60 - 0. 70)Chalmer s JD 0. 57 ( 0. 54 - 0. 61)Bauer , TT 0. 79 ( 0. 77 - 0. 81)Schuet z, P 0. 90 ( 0. 86 - 0. 93)Zuber i FF 0. 72 ( 0. 63 - 0. 80)Bar low G 0. 59 ( 0. 53 - 0. 64)Buising KL 0. 55 ( 0. 52 - 0. 59)
Speci f i ci t y (95% CI )
Pooled Specif icit y = 0. 71 ( 0. 70 t o 0. 72)Chi- squar e = 480. 03; df = 9 (p = 0. 0000)I nconsist ency ( I - squar e) = 98. 1 %
[Type text]
Posi t i ve LR0. 192 5. 21
Lim, WS 2. 13 ( 1. 85 - 2. 46)Man SY 1. 85 ( 1. 57 - 2. 19)Capelast egui A 4. 50 ( 3. 89 - 5. 21)Menendez, R 2. 46 ( 2. 04 - 2. 96)Chalmers JD 1. 77 ( 1. 54 - 2. 03)Bauer , TT 3. 08 ( 2. 57 - 3. 70)Schuet z, P 2. 62 ( 1. 44 - 4. 76)Zuber i FF 3. 01 ( 2. 10 - 4. 29)Bar low G 1. 78 ( 1. 48 - 2. 14)Buising KL 1. 96 ( 1. 74 - 2. 22)
Posi t i ve LR (95% CI )
Random Ef f ect s ModelPooled Posit ive LR = 2. 39 (1. 93 t o 2. 95)Cochran- Q = 130. 43; df = 9 ( p = 0. 0000)I nconsist ency ( I - squar e) = 93. 1 %Tau- squared = 0. 1033
[Type text]
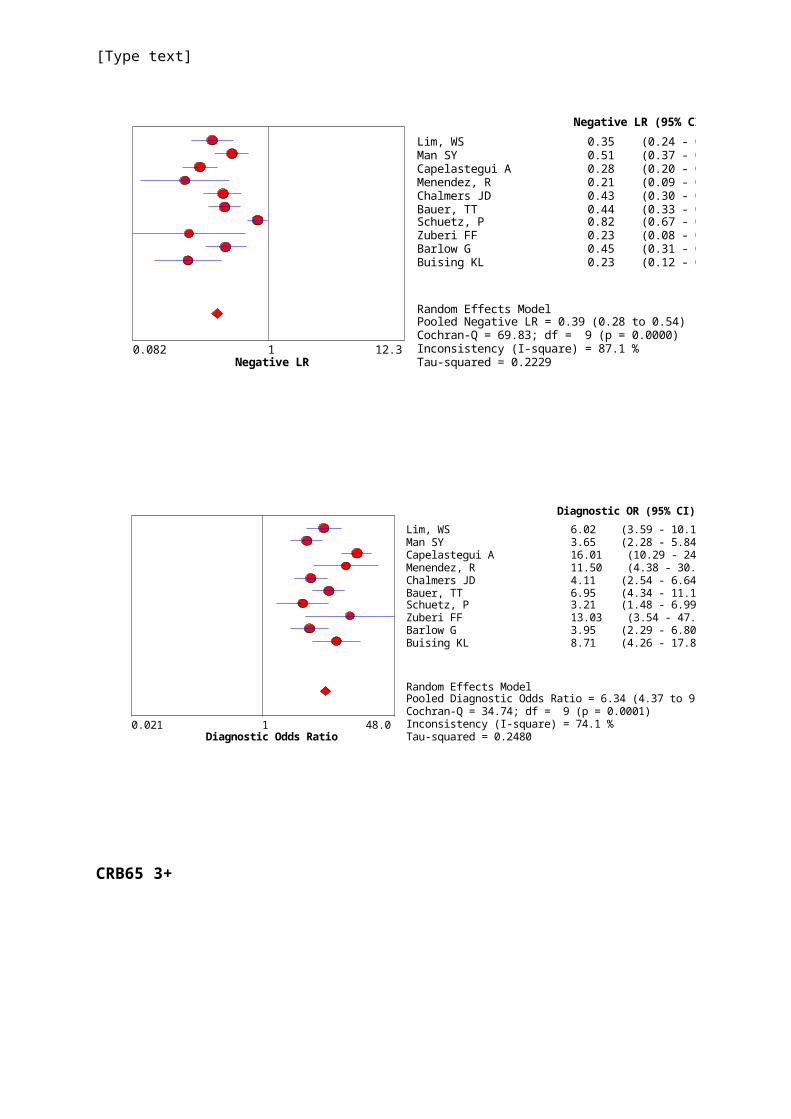
Negat i ve LR0. 082 12. 31
Lim, WS 0. 35 ( 0. 24 - 0. 52)Man SY 0. 51 ( 0. 37 - 0. 69)Capelast egui A 0. 28 ( 0. 20 - 0. 39)Menendez, R 0. 21 ( 0. 09 - 0. 48)Chalmers JD 0. 43 ( 0. 30 - 0. 61)Bauer , TT 0. 44 ( 0. 33 - 0. 60)Schuet z, P 0. 82 ( 0. 67 - 0. 98)Zuber i FF 0. 23 ( 0. 08 - 0. 65)Bar low G 0. 45 ( 0. 31 - 0. 66)Buising KL 0. 23 ( 0. 12 - 0. 42)
Negat i ve LR (95% CI )
Random Ef f ect s ModelPooled Negat ive LR = 0. 39 (0. 28 t o 0. 54)Cochran- Q = 69. 83; df = 9 (p = 0. 0000)I nconsist ency ( I - squar e) = 87. 1 %Tau- squared = 0. 2229
Di agnost i c O dds Rat i o0. 021 48. 01
Lim , WS 6. 02 ( 3. 59 - 10. 10)M an SY 3. 65 ( 2. 28 - 5. 84)Capelast egui A 16. 01 ( 10. 29 - 24. 91)M enendez, R 11. 50 ( 4. 38 - 30. 21)Chalm er s JD 4. 11 ( 2. 54 - 6. 64)Bauer , TT 6. 95 ( 4. 34 - 11. 16)Schuet z, P 3. 21 ( 1. 48 - 6. 99)Zuber i FF 13. 03 ( 3. 54 - 47. 95)Bar low G 3. 95 ( 2. 29 - 6. 80)Buising KL 8. 71 ( 4. 26 - 17. 82)
Di agnost i c O R ( 95% CI )
Random Ef f ect s M odelPooled Diagnost ic O dds Rat io = 6. 34 ( 4. 37 t o 9. 18)Cochr an- Q = 34. 74; df = 9 ( p = 0. 0001)I nconsist ency ( I - squar e) = 74. 1 %Tau- squar ed = 0. 2480
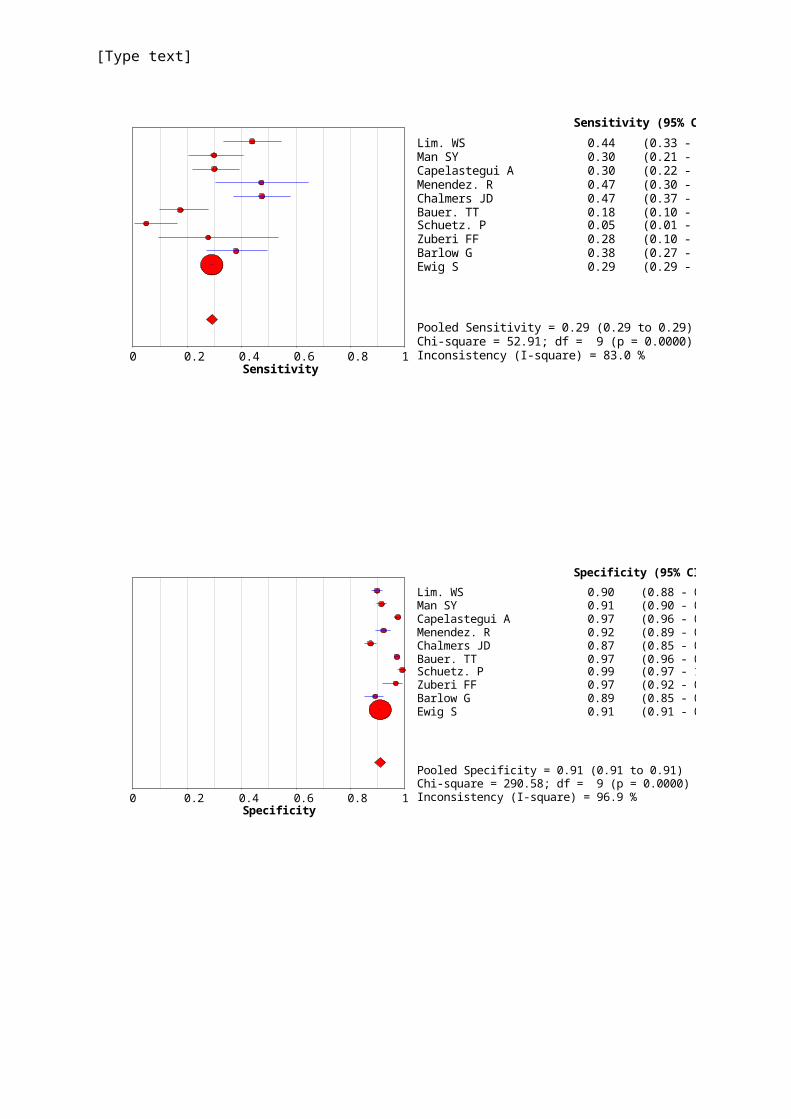
CRB65 3+
[Type text]
Sensi t i vi t y0 0. 2 0. 4 0. 6 0. 8 1
Lim. WS 0. 44 ( 0. 33 - 0. 55)Man SY 0. 30 ( 0. 21 - 0. 41)Capelast egui A 0. 30 ( 0. 22 - 0. 39)Menendez. R 0. 47 ( 0. 30 - 0. 65)Chalmer s JD 0. 47 ( 0. 37 - 0. 58)Bauer . TT 0. 18 ( 0. 10 - 0. 28)Schuet z. P 0. 05 ( 0. 01 - 0. 17)Zuber i FF 0. 28 ( 0. 10 - 0. 53)Bar low G 0. 38 ( 0. 27 - 0. 50)Ewig S 0. 29 ( 0. 29 - 0. 29)
Sensi t i vi t y (95% CI )
Pooled Sensit ivit y = 0. 29 ( 0. 29 t o 0. 29)Chi- squar e = 52. 91; df = 9 ( p = 0. 0000)I nconsist ency ( I - squar e) = 83. 0 %
Speci f i ci t y0 0. 2 0. 4 0. 6 0. 8 1
Lim. WS 0. 90 ( 0. 88 - 0. 92)Man SY 0. 91 ( 0. 90 - 0. 93)Capelast egui A 0. 97 ( 0. 96 - 0. 98)Menendez. R 0. 92 ( 0. 89 - 0. 95)Chalmers JD 0. 87 ( 0. 85 - 0. 89)Bauer . TT 0. 97 ( 0. 96 - 0. 98)Schuet z. P 0. 99 ( 0. 97 - 1. 00)Zuber i FF 0. 97 ( 0. 92 - 0. 99)Bar low G 0. 89 ( 0. 85 - 0. 92)Ewig S 0. 91 ( 0. 91 - 0. 91)
Speci f i ci t y ( 95% CI )
Pooled Specif icit y = 0. 91 ( 0. 91 t o 0. 91)Chi- squar e = 290. 58; df = 9 (p = 0. 0000)I nconsist ency ( I - squar e) = 96. 9 %
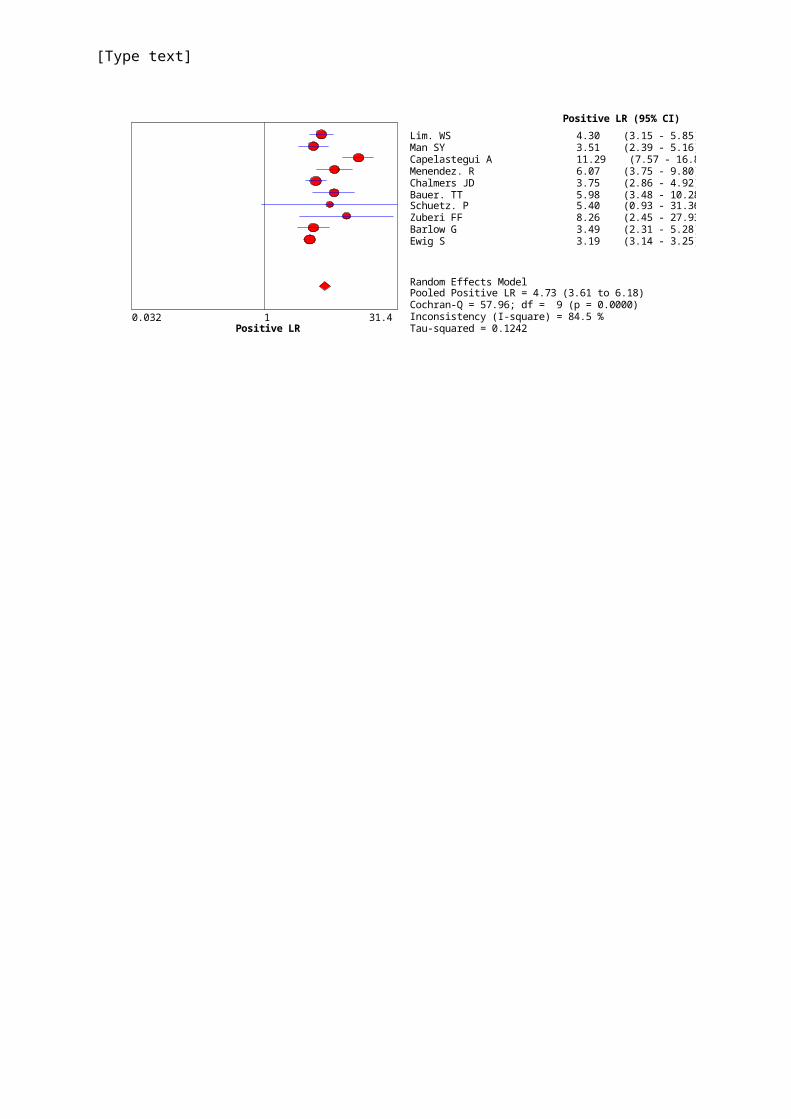
[Type text]
Posi t i ve LR0. 032 31. 41
Lim . WS 4. 30 ( 3. 15 - 5. 85)M an SY 3. 51 ( 2. 39 - 5. 16)Capelast egui A 11. 29 ( 7. 57 - 16. 84)M enendez. R 6. 07 ( 3. 75 - 9. 80)Chalm er s JD 3. 75 ( 2. 86 - 4. 92)Bauer . TT 5. 98 ( 3. 48 - 10. 28)Schuet z. P 5. 40 ( 0. 93 - 31. 36)Zuber i FF 8. 26 ( 2. 45 - 27. 93)Bar low G 3. 49 ( 2. 31 - 5. 28)Ewig S 3. 19 ( 3. 14 - 3. 25)
Posi t i ve LR ( 95% CI )
Random Ef f ect s M odelPooled Posit ive LR = 4. 73 ( 3. 61 t o 6. 18)Cochr an- Q = 57. 96; df = 9 ( p = 0. 0000)I nconsist ency ( I - squar e) = 84. 5 %Tau- squar ed = 0. 1242
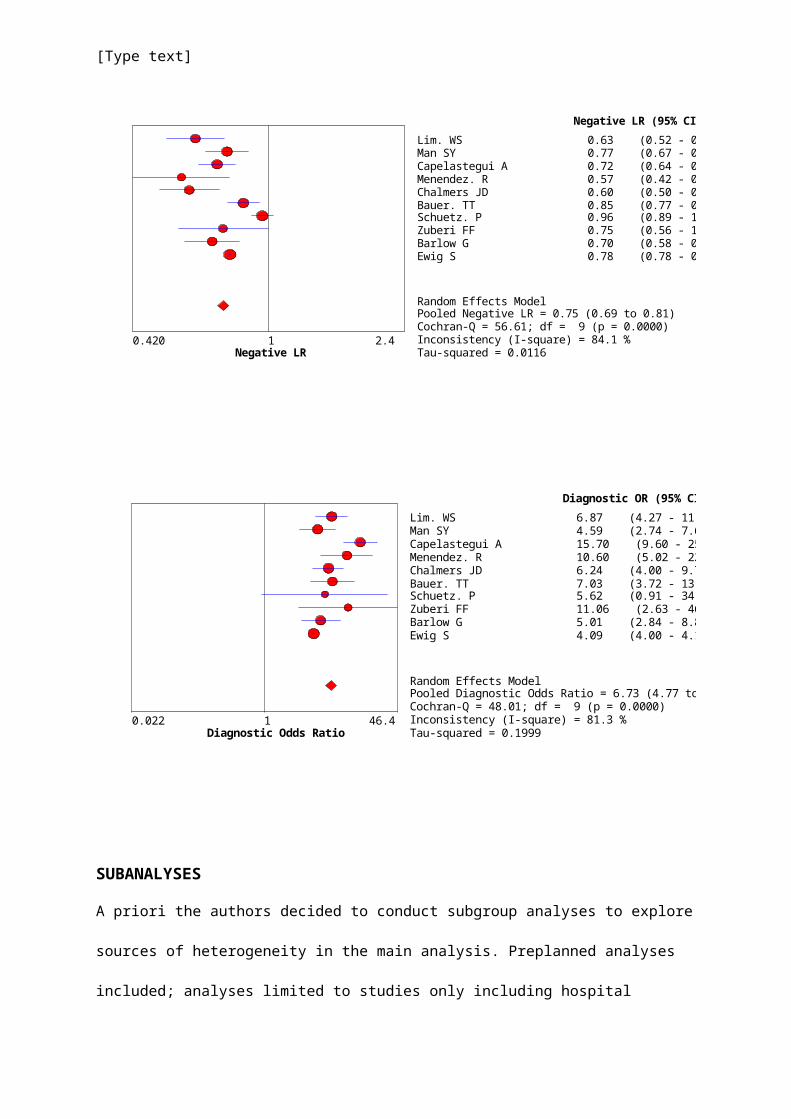
[Type text]
Negat i ve LR0. 420 2. 41
Lim. WS 0. 63 ( 0. 52 - 0. 75)Man SY 0. 77 ( 0. 67 - 0. 88)Capelast egui A 0. 72 ( 0. 64 - 0. 81)Menendez. R 0. 57 ( 0. 42 - 0. 78)Chalmer s JD 0. 60 ( 0. 50 - 0. 73)Bauer . TT 0. 85 ( 0. 77 - 0. 94)Schuet z. P 0. 96 ( 0. 89 - 1. 03)Zuber i FF 0. 75 ( 0. 56 - 1. 00)Bar low G 0. 70 ( 0. 58 - 0. 83)Ewig S 0. 78 ( 0. 78 - 0. 78)
Negat i ve LR (95% CI )
Random Ef f ect s ModelPooled Negat ive LR = 0. 75 ( 0. 69 t o 0. 81)Cochr an- Q = 56. 61; df = 9 (p = 0. 0000)I nconsist ency ( I - squar e) = 84. 1 %Tau- squar ed = 0. 0116
Di agnost i c O dds Rat i o0. 022 46. 41
Lim . WS 6. 87 ( 4. 27 - 11. 03)M an SY 4. 59 ( 2. 74 - 7. 67)Capelast egui A 15. 70 ( 9. 60 - 25. 68)M enendez. R 10. 60 ( 5. 02 - 22. 37)Chalm er s JD 6. 24 ( 4. 00 - 9. 72)Bauer . TT 7. 03 ( 3. 72 - 13. 29)Schuet z. P 5. 62 ( 0. 91 - 34. 70)Zuber i FF 11. 06 ( 2. 63 - 46. 41)Bar low G 5. 01 ( 2. 84 - 8. 85)Ewig S 4. 09 ( 4. 00 - 4. 18)
Di agnost i c O R ( 95% CI )
Random Ef f ect s M odelPooled Diagnost ic O dds Rat io = 6. 73 ( 4. 77 t o 9. 50)Cochr an- Q = 48. 01; df = 9 ( p = 0. 0000)I nconsist ency ( I - squar e) = 81. 3 %Tau- squar ed = 0. 1999
SUBANALYSES
A priori the authors decided to conduct subgroup analyses to explore sources of heterogeneity in the
main analysis. Preplanned analyses included; analyses limited to studies only including hospital
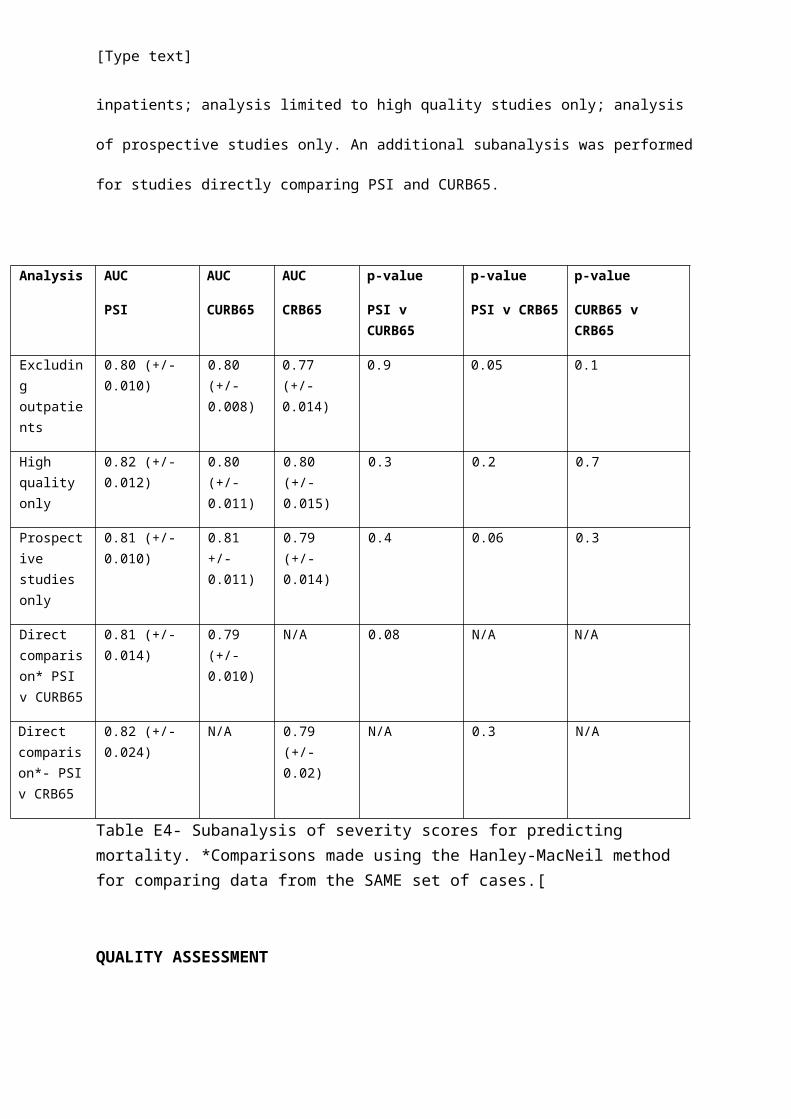
inpatients; analysis limited to high quality studies only; analysis of prospective studies only. An
additional subanalysis was performed for studies directly comparing PSI and CURB65.

[Type text]
Analysis AUC
PSI
AUC
CURB65
AUC
CRB65
p-value
PSI v CURB65
p-value
PSI v CRB65
p-value
CURB65 v CRB65
Excluding outpatients
0.80 (+/- 0.010) 0.80 (+/- 0.008)
0.77 (+/- 0.014)
0.9 0.05 0.1
High quality only
0.82 (+/- 0.012) 0.80 (+/- 0.011)
0.80 (+/- 0.015)
0.3 0.2 0.7
Prospective studies only
0.81 (+/- 0.010) 0.81 +/- 0.011)
0.79 (+/- 0.014)
0.4 0.06 0.3
Direct comparison* PSI v CURB65
0.81 (+/- 0.014) 0.79 (+/- 0.010)
N/A 0.08 N/A N/A
Direct comparison*- PSI v CRB65
0.82 (+/- 0.024) N/A 0.79 (+/- 0.02)
N/A 0.3 N/A
Table E4- Subanalysis of severity scores for predicting mortality. *Comparisons made using the Hanley-MacNeil method for comparing data from the SAME set of cases.[
QUALITY ASSESSMENT
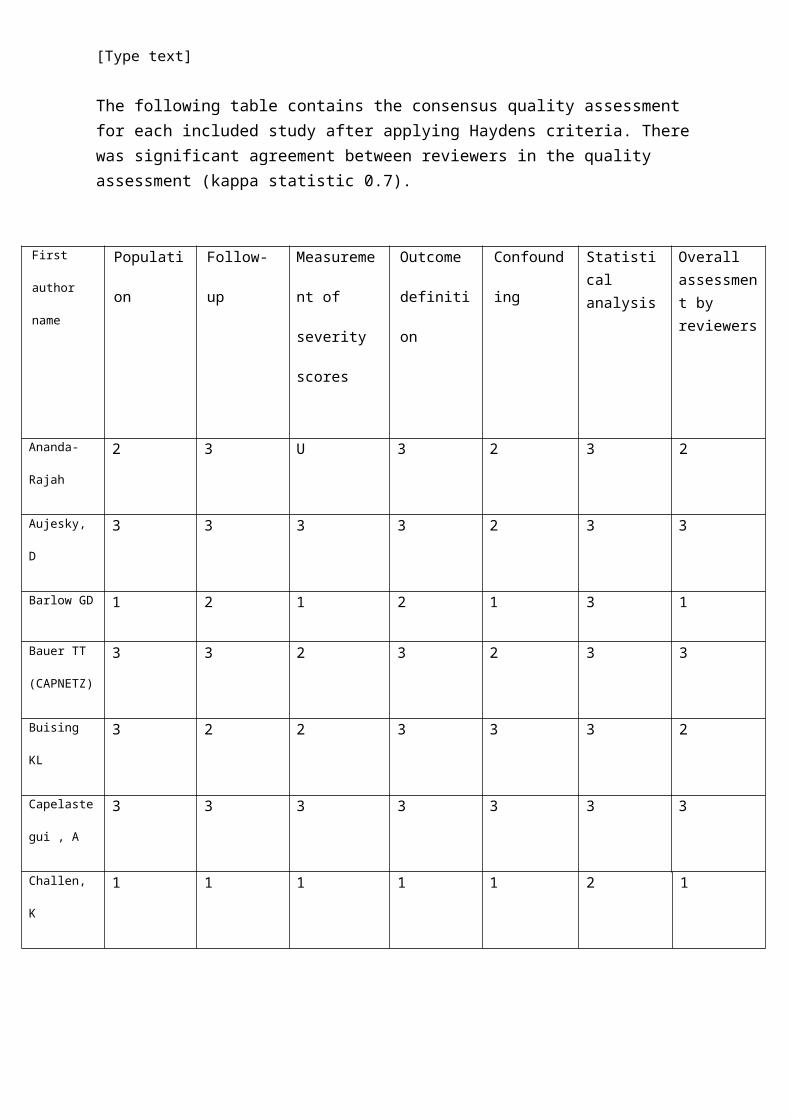
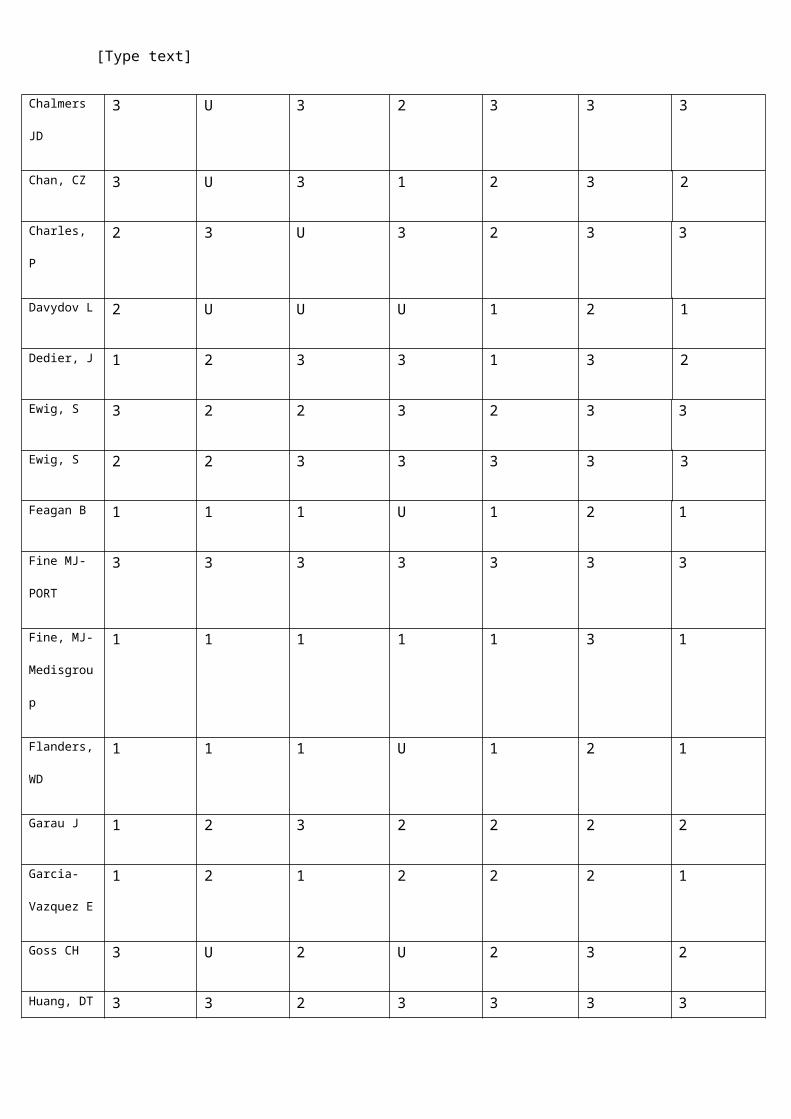
The following table contains the consensus quality assessment for each included study after applying Haydens criteria. There was significant agreement between reviewers in the quality assessment (kappa statistic 0.7).
First author
name
Population Follow-up Measurement
of severity
scores
Outcome
definition
Confounding Statistical analysis
Overall assessment by reviewers
Ananda-Rajah 2 3 U 3 2 3 2
Aujesky, D 3 3 3 3 2 3 3
Barlow GD 1 2 1 2 1 3 1
[Type text]
Bauer TT
(CAPNETZ)
3 3 2 3 2 3 3
Buising KL 3 2 2 3 3 3 2
Capelastegui ,
A
3 3 3 3 3 3 3
Challen, K 1 1 1 1 1 2 1
Chalmers JD 3 U 3 2 3 3 3
Chan, CZ 3 U 3 1 2 3 2
Charles, P 2 3 U 3 2 3 3
Davydov L 2 U U U 1 2 1
Dedier, J 1 2 3 3 1 3 2
Ewig, S 3 2 2 3 2 3 3
Ewig, S 2 2 3 3 3 3 3
Feagan B 1 1 1 U 1 2 1
Fine MJ-
PORT
3 3 3 3 3 3 3
Fine, MJ-
Medisgroup
1 1 1 1 1 3 1
Flanders, WD 1 1 1 U 1 2 1
Garau J 1 2 3 2 2 2 2
[Type text]
Garcia-
Vazquez E
1 2 1 2 2 2 1
Goss CH 3 U 2 U 2 3 2
Huang, DT 3 3 2 3 3 3 3
Johnstone, J 2 2 1 1 2 3 2
Lim, WS 3 3 3 3 3 2 3
Man, SY 3 U 3 3 3 3 3
Menendez R 3 3 2 3 3 3 3
Migliorati PL 2 1 2 2 1 2 1
Ortega L 2 2 U 2 2 3 2
Phau, J 2 3 2 2 2 3 2
Querol-
Ribelles JM
3 U 2 2 2 3 2
Renaud B
Pneumocom
1
3 U 3 3 3 3 3
Renaud B
Pneumocom
2
3 U 3 3 3 3 3
Restrepo MI 1 U 2 U 1 3 2
[Type text]
Reyes Calzada
S
1 2 3 3 1 3 2
Roson, B 3 3 3 3 3 3 3
Schuetz , P 2 3 3 3 2 3 2
Shindo, Y 1 1 1 2 1 3 1
Tejera, A 2 1 U 1 2 3 1
Van der
Eerden
3 3 3 3 3 3 3
Zuberi FF 2 2 U 2 2 3 2
TABLE E4- Quality assessment of included and excluded studies. U= unclear. 3= Good methodology, low likelihood of significant bias or confounding. 2= moderate methodology, possible confounding or bias. 1= Suboptimal methodology, significant likelihood of bias or confounding.
[Type text]
Online Supplement References
1. Fine MJ, Auble TE, Yealy DM, Iet al.. A prediction rule to identify low-risk patients
with community- acquired pneumonia. N Engl J Med 1997;336: 243–50
2. Lim WS, van der Eerden MM, Laing R, et al. Defining community-acquired
pneumonia severity on presentation to hospital: an international derivation and
validation study. Thorax 2003; 58: 377-82
3. Lim WS, Baudouin SV, George RC, et al. The British Thoracic Society Guidelines
for the Management of Community Acquired Pneumonia in Adults. Update 2009.
Thorax 2009; 64 (Suppl 3):iii1-iii55.
4. Hayden JA, Cote P, Bombardier C. Evaluation of the quality of prognostic studies in
systematic reviews. Ann intern Med 2006; 144:427-437.
5. Angus DC, Marrie TJ, Obrosky DS, et al. Severe community-acquired pneumonia:
use of intensive care services and evaluation of American and British Thoracic
Society Diagnostic criteria. Am J Respir Crit Care Med; 2002; 166(5):717-23.
6. Arnold FW, Ramirez JA, McDonald LC, et al. Hospitalisation for community-
acquired pneumonia: the pneumonia severity index vs clinical judgement. Chest 2003;
124(1):121-4.
7. Bont J, Hak E, Hoes AW, et al. Predicting death in elderly patients with community-
acquired pneumonia: a prospective validation study re-evaluating the CRB65 severity
assessment tool. Arch Intern Med 2008; 168: 1465-8.
8. Bruns AH, Oosterheert JJ, Hak E, et al. Usefulness of consecutive C-reactive protein
measurements in follow-up of severe community acquired pneumonia. Eur Respir J
2008; 32: 726-32.
[Type text]
9. Buising KL, Thursky KA, Black JF, et al. A prospective comparison of severity
scores for identifying patients with severe community acquired pneumonia:
reconsidering what is meant by severe pneumonia. Thorax 2006; 61(5):419-24.
10. Buising KL, Thursky KA, Black JF, et al. Identifying severe community-acquired
pneumonia in the emergency department: a simple clinical prediction tool. Emerg
Med Australas 2007; 19: 418-26.
11. Cabre M, Bolivar I, Pera G, et al. Factors influencing length of hospital stay in
community-acquired pneumonia: a study in 27 community hospitals. Epidemiol Infect
2004; 132(5):821-9.
12. Campbell SG, Patrick W, Urquhart DG et al. Patients with community-acquired
pneumonia discharged from the emergency department according to a clinical practice
guideline. Emerg Med J. 2004;21(6):667-9.
13. Chalmers JD, Singanayagam A, Hill AT. C-reactive protein is an independent
predictor of severity in community-acquired pneumonia. Am J Med 2008; 121: 219-
25.
14. Chalmers JD, Singanayagam A, Hill AT. Systolic blood pressure is superior to other
haemodynamic predictors of outcome in community-acquired pneumonia. Thorax
2008; 698-702.
15. Chalmers JD, Singanayagam A, Hill AT. Predicting the need for mechanical
ventilation and/or inotropic support for young adults admitted to hospital with
community-acquired pneumonia. Clin Infect Dis; 47(12):1571-4.
16. Cham G, Yan S, Heng BH, Seow E. Predicting positive blood cultures in patients
presenting with pneumonia at an emergency department in Singapore. Ann Acad Med
Singapore 2009, 38(6):508-7.
[Type text]
17. Christ-Crain M, Stolz D, Bingisser R, et al. Procalcitonin guidance of antibiotic
therapy in community-acquired pneumonia: a randomised trial. Am J Respir Crit Care
2006; 174: 84-93.
18. Schuetz P, Koller M, Christ-Crain M, et al. Predicting mortality with pneumonia
severity scores: importance of model recalibration to local settings. Epidemiol Infect
2008; 136(12):1628-37.
19. Curran A, Falco V, Crespo M, et al. Bacterial pneumonia in HIV-infected patients:
use of the pneumonia severity index and impact of current management on incidence,
aetiology and outcome. HIV Med 2008;9(8):609-15.
20. Dremsizov T, Clermont G, Kellum JA, et al. Severe sepsis in community-acquired
pneumonia: when does it happen, and do systemic inflammatory response syndrome
criteria help predict course? Chest 2006; 129(4):968-78.
21. Escobar GJ, Fireman BH, Palen TE, et al. Risk adjusting community-acquired
pneumonia hospital outcomes using automated databases. Am J Manag Care 2008;
14(3):158-66.
22. Espana PP, Capelastegui A, Gorordo I, et al. Development and validation of a
clinical prediction rule for severe community-acquired pneumonia. Am J Respir Crit
Care Med. 2006; 174(11):1249-56.
23. Yandiola PP, Capelastegui A, Quintana J, et al. Prospective comparison of severity
scores for predicting clinically revelant outcomes for patients hospitalized with
community-acquired pneumonia. Chest 2009; 135(6):1572-9.
24. Ewig S, Kleinfeld T, Bauer T, et al. Comparative validation of prognostic rules for
community-acquired pneumonia in an elderly population. Eur Respir J 1999;
14(2):370-5.
[Type text]
25. Gotoh S, Nishimura N, Takahashi O et al. Adrenal function in patients with
community-acquired pneumonia. Eur Respir J. 2008;31(6):1268-73.
26. Haeuptle J, Zaborsky R, Flumefreddo R, et al. Prognostic value of procalcitonin in
legionella pneumonia. Eur J Clin Microbiol Infect Dis. 2009; 28(1):55-60.
27. Hohenthal U, Hurme S, Helenius H et al. Utility of C-reactive protein in assessing the
disease severity and complications of community-acquired pneumonia. Clin
Microbiol Infect. 2009; 15(11):1026-32.
28. Huang DT, Angus DC, Kellum JA et al. Midregional proadrenomedullin as a
prognostic tool in community-acquired pneumonia. Chest 2009; 136(3):823-31.
29. Huang DT, Weissfeld LA, Kellum JA, et al. Risk prediction with procalcitonin and clinical
rules in community-acquired pneumonia. Ann Emerg Med 2008; 52(1):48-58.e2.
30. Ioachimescu OC, Ioachimescu AG, Iannini PB. Severity scoring in community-
acquired pneumonia caused by Streptococcus pneumonia: a 5 year experience. Int J
Antimicrob Agents. 2004; 24(5):485-90.
31. Kollef KE, Reichley RM, Micek ST, et al. The modified APACHE II score
outperforms CURB65 pneumonia severity score as a predictor of 30-day mortality in
patients with methicillin-resistant staphylococcus aureus pneumonia. Chest 2008;
133(2):363-9.
32. Kruger S, Ewig S, Marre R, Papassotiriou J, et al. Procalcitonin predicts patients at
low risk of death from community-acquired pneumonia across all CRB-65 classes.
Eur Respir J 2008; 31(2):349-55.
33. Bauer TT, Ewig S, Marre R, et al. CRB-65 predicts death from community-acquired
pneumonia. J Intern Med 2006; 260: 93-101.
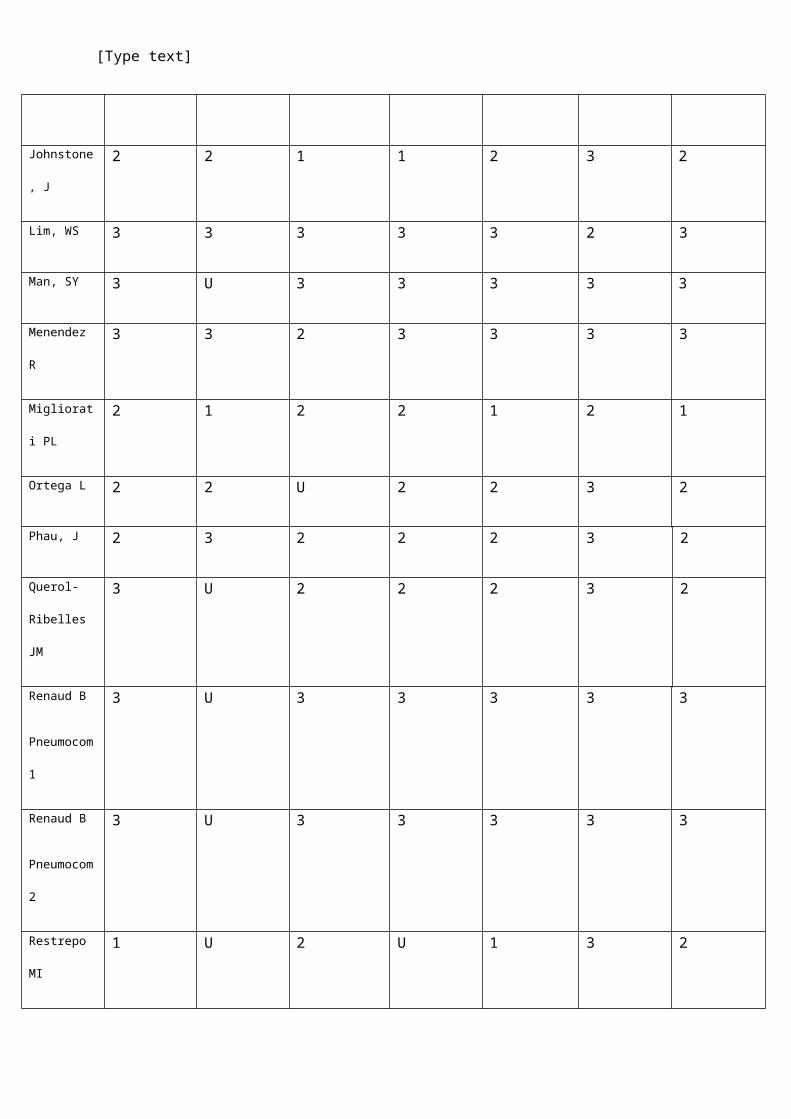
[Type text]
34. Lin CC, Lee CH, Chen CZ, et al. Value of the pneumonia severity index in
assessment of community-acquired pneumonia. J Formos Med Assoc. 2005;
104(3):164-7.
35. Chen CZ, Fan PS, Lin CC, et al. Repeated pneumonia severity index measurement
after admission increases its predictive value for mortality in severe community-
acquired pneumonia. J Formos Med Assoc. 2009; 108(3):219-23.
36. Masia M, Gutierrez F, Shum C. Usefulness of procalcitonin levels in community-
acquired pneumonia according to the patients outcome research team pneumonia
severity index. Chest 2005; 128(4):2223-9.
37. Muller B, Morgenthaler N, Stolz D, et al. Circulating levels of copeptin, a novel
biomarker in lower respiratory tract infections. Eur J Clin Invest 2007; 37: 145-52.
38. Myint PK, Kamath AV, Vowler SL. Severity assessment criteria recommended by the
British Throacic Society (BTS) for community acquired pneumonia (CAP) and older
patients. Should SOAR (systolic blood pressure, oxygenation, age and respiratory
rate) criteria be used in older people? A compilation study of two prospective cohorts.
Age Aging 2006; 35(3):286-91.
39. Naito T, Suda T, Yasuda K, et al. A validation and potential modification of the
pneumonia severity index in elderly patients with community-acquired pneumonia. J
Am Geriatr Soc 2006; 54(8):1212-9.
40. Pauls S, Kruger S, Muche R, et al. Assessment of pneumonia severity: Multidetector-
row CT in comparisons to clinical score CRB-65. Clin Imaging 2008; 32(5):342-5.
41. Pilotto A, Addante F, Ferrucci L et al. The multidimensional prognostic index
predicts short and long term mortality in hospitalized geriatric patients with
pneumonia. J Gerontol A Biol Sci Med Sci. 2009; 64(8):880-7.
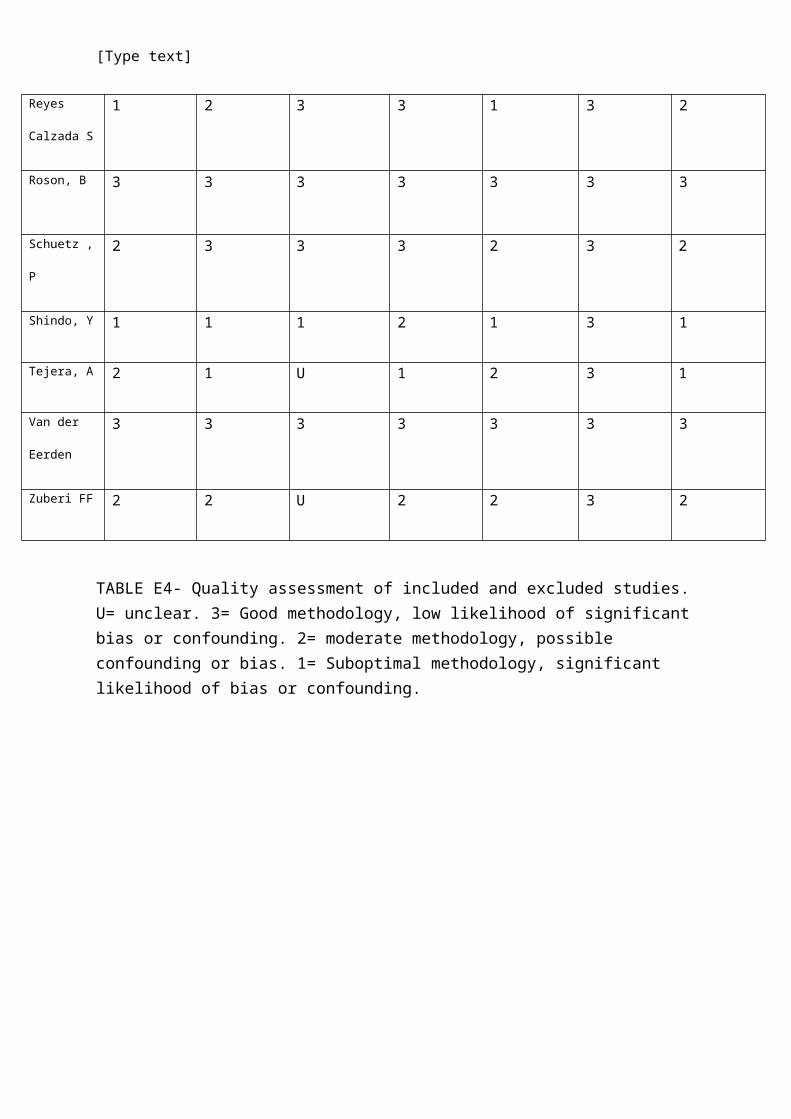
[Type text]
42. Prat C, Lacoma A, Dominguez J et al. Midregional pro-atrial natriuretic peptide as a
prognostic marker in pneumonia. J Infect 2007; 55(5):400-7.
43. Salluh JI, Bozza FA, Soares M, et al. Adrenal response in severe community-acquired
pneumonia: impact on outcomes and disease severity. Chest 2008; 134(5):947-54.
44. Sanders KM, Marras TK, Chan CK. Pneumonia severity index in the
immunocompromised. Can Respir J 2006; 13(2):89-93.
45. Sanz F, Restrepo MI, Fernandez E et al. Is it possible to predict which patients with
mild pneumonias will develop hypoxaemia? Respir Med. 2009’ 103(12):1871-7.
46. Schaaf B, Kruse J, Rupp J, et al. Sepsis severity predicts outcome in community-
acquired pneumococcal pneumonia. Eur Respir J 2007; 30(3):517-24.
47. Spindler C, Ortqvist A. Prognostic score systems and community-acquired
bacteraemia pneumococcal pneumonia. Eur Respir J 2006; 28:816-23.
48. Teramoto S, Yamamoto H, Yamaguchi Y et al. Lower respiratory tract infection
outcomes are predicted better by an age >80 years than by CURB-65. Eur Respir J.
2008; 31(2):477-8.
49. Valencia M, Badia JR, Cavalcanti M, et al. Pneumonia severity index class V patients
with community acquired pneumonia: characteristics, outcomes and value of severity
scores. Chest 2007; 132(2):515-22.
50. Vecchiarino P, Bohannon RW, Ferullo J, Maljanian R. Short-term outcomes and their
predictors for patients hospitalized with community-acquired pneumonia. Heart Lung
2004;33(5):301-7.
51. Wilson PA, Ferguson J. Severe community-acquired pneumonia: an Australian
perspective. Intern Med J. 2005; 35(12):699-705.

[Type text]
52. Yealy DM, Auble TE, Stone RA, et al. Effect of increasing the intensity of implanting
pneumonia guidelines: a randomized, controlled trial. Ann Intern Med; 2005;
143(12):881-94.
53. Aujesky D, Auble TE, Yealy DM, et al. Prospective comparison of three validated
prediction rules for prognosis in community-acquired pneumonia. Am J Med 2005;
118(4):384-92.
[Type text]
SUPPLEMENTAL FIGURE LEGENDS
Figure E1: Forest plots for positive likelihood ratio, negative likelihood ratio and Diagnostic odds
ratio for Pneumonia severity index.
Figure E2: Forest plots for positive likelihood ratio, negative likelihood ratio and Diagnostic odds
ratio for the CURB65 score.
Figure E3- Forest plots of positive likelihood ratio, negative likelihood ratio and Diagnostic odds ratio
for the CURB65 score.