€¦ · web viewhsc chemistry module 9.4 summary. much of the work of chemists involves...
TRANSCRIPT

HSC Chemistry Module 9.4 Summary
1. Much of the work of chemists involves monitoring the reactants and products of reactions and managing reaction conditions
Outline the role of a chemist employed in a named industry or enterprise, identifying the branch of chemistry undertaken by the chemist and explaining a chemical principle that the chemist uses
NAME Robert Evans
EMPLOYER Government agency – Department of Mines and Energy
BRANCH OF CHEMISTRY Analytical chemistry => inorganic chemistry in environmental monitoring
DUTIES Fieldwork collection of water and soil samples from mining sites and mine rehabilitation
areas Coordinate the duties of technicians within the laboratory Maintain analytical standards of the laboratory to Australian standards specifications so that
results can be compared between laboratories Preparing reports on the samples for both private groups and other government agencies
(e.g. EPA, Department of Land and Water Conservation) and making recommendations Liaise with community groups, local councils and mine managers on managing
contamination of soil by runoff and groundwater near mine sitesANALYTICAL METHODS USED
Flame Atomic Absorption Spectrometry (AAS) for heavy metal analysisCHEMICAL PRINCIPLE
Many ores contain metal sulfides, which are very insoluble and in this form do not pose a problem
When exposed to air and water the metal sulfides oxidise to sulfates. The solubility of sulfates is much greater than for sulfides, so heavy metals can enter ground water as metal sulfate salts.
Maintaining acidity of mullock or slag heaps helps to prevent the mobilisation of heavy metals into ground water, so the acidity of the ores must be monitored
Gather, process and present information from secondary sources about the work of practising scientists identifying:
the variety of chemical occupations a specific chemical occupation for a more detailed study

VARIETY OF CHEMICAL OCCUPATIONS Analytical chemistry Bio-molecular chemistry Colloid and surface science chemistry Environmental chemistry Industrial chemistry Inorganic chemistry Electrochemistry Organic chemistry Physical chemistry (the study of physical aspects of compounds and reactions, such as rates
of reactions, energy aspects, and the structures of compounds) Polymer chemistry
ENVIRONMENTAL CHEMISTRY An environmental chemists deals with the following jobs:
o Reviewing the operation of effluent water treatments systems, and ensuring compliance with government environmental regulations
o Reviewing industry’s compliance with government environmental noise standardso Assessing levels of potential contamination in wastes (e.g. soil) intended for landfill
disposal and classifying them in accordance with government guidelineso Managing disposal of contaminated wasteso Investigating reports of contamination in soil or groundwater to determine source
and then arranging to correct ito Determining whether gas stack emissions contain unacceptable levels of regulated
materialso Advising engineers and managers of corrective actions needed if any of the above
parameters show faults in systemso Answering public or professional enquiries or complaints regarding environmental
performance
Identify the need for collaboration between chemists as they collect and analyse data
As can be seen above, chemistry is a broad field of knowledge with many specialist areas In real life however, many chemical problems require expertise and in-depth knowledge
from a wide range of chemical branches Hence collaboration between chemists is essential for solving chemical issues, or when
dealing with large amounts of collected data, as the chemists provide input and expertise from their own particular field to solve problems
As chemists often work in teams, collaboration and communication is required to collectively benefit the team as they collect and analyse data
Describe an example of a chemical reaction such as combustion, where reactants form different products under different conditions and thus would need monitoring
COMBUSTION
Combustion is an example of a reaction that form different products under different conditions
Consider the combustion of a simple hydrocarbon, octane (C8H18)o In an environment where the oxygen to fuel ratio is high, octane combusts
completely, producing only carbon dioxide and water
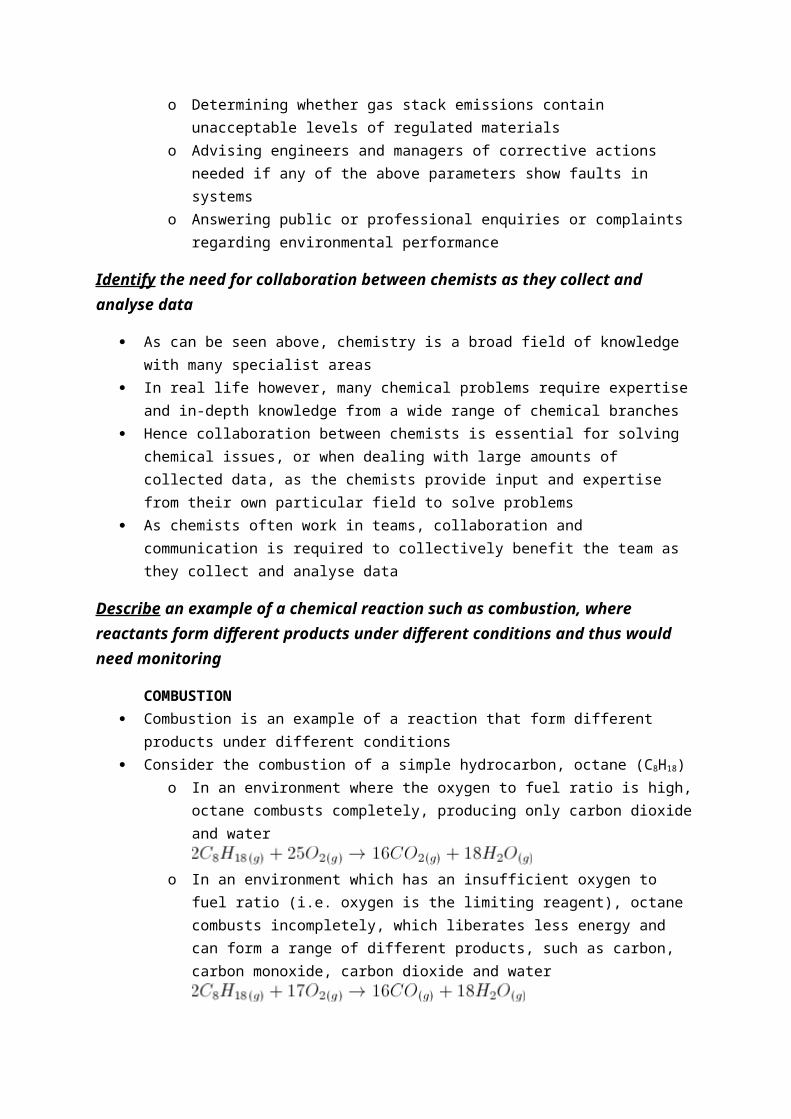
o In an environment which has an insufficient oxygen to fuel ratio (i.e. oxygen is the limiting reagent), octane combusts incompletely, which liberates less energy and can form a range of different products, such as carbon, carbon monoxide, carbon dioxide and water
MONITORING As can be seen, combustion reactions can produce different products under different
conditions, such as carbon monoxide and carbono Carbon monoxide is a toxic gas, as it can cause respiratory and circulatory problems
if inhaledo Carbon is carcinogenic to humans, and can be irritating to the lungs
Incomplete combustion also decreases fuel efficiency, as it results in a decreased energy yield from the fuel
Thus in most situations (such the combustion of octane in car engines), the oxygen-to-fuel ratio needs to be monitored to reduce production of toxic gases and to increase the efficiency of the fuel

2. Chemical processes in industry require monitoring and management to maximise production
Identify and describe the industrial uses of ammonia
Ammonia (NH3) is a gas that has many industrial uses, including:o Solid and liquid fertilisers (sulfates of ammonia, ammonium nitrate, urea)o Nitric acid (through the Ostwald Process)o Industrial production of detergents and cleanerso Fibres and plastics (rayon, acrylics, nylon)o Production of explosiveso Pharmaceuticals
Identify that ammonia can be synthesised from its component gases, nitrogen and hydrogen
Under pressure and heat, nitrogen gas (N2) and hydrogen gas (H2) can be synthesised to produce ammonia (NH3) according to the reaction below
Describe that synthesis of ammonia occurs as a reversible reaction that will reach equilibrium
The industrial production of ammonia is called the Haber Process As can be seen above, the synthesis of ammonia from nitrogen and hydrogen gas is a
reversible reaction, thus the reaction will reach a point of equilibrium rather than going to completion
Identify the reaction of hydrogen with nitrogen as exothermic
The synthesis of ammonia in the Haber Process is shown below
As can be seen from the chemical equation, ΔH is less than zero, hence the reaction is an exothermic reaction
Explain that the use of a catalyst will lower the reaction temperature required and identify the catalyst(s) used in the Haber process
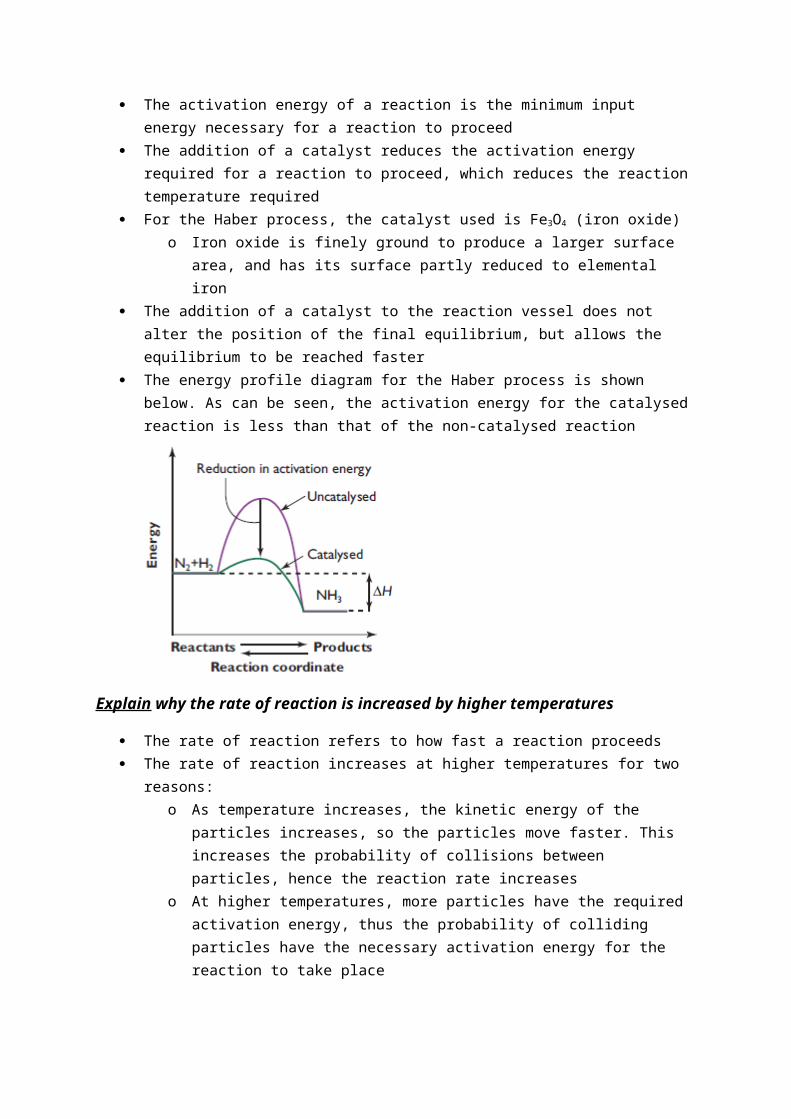
The activation energy of a reaction is the minimum input energy necessary for a reaction to proceed
The addition of a catalyst reduces the activation energy required for a reaction to proceed, which reduces the reaction temperature required
For the Haber process, the catalyst used is Fe3O4 (iron oxide)o Iron oxide is finely ground to produce a larger surface area, and has its surface partly
reduced to elemental iron The addition of a catalyst to the reaction vessel does not alter the position of the final
equilibrium, but allows the equilibrium to be reached faster
The energy profile diagram for the Haber process is shown below. As can be seen, the activation energy for the catalysed reaction is less than that of the non-catalysed reaction
Explain why the rate of reaction is increased by higher temperatures
The rate of reaction refers to how fast a reaction proceeds The rate of reaction increases at higher temperatures for two reasons:
o As temperature increases, the kinetic energy of the particles increases, so the particles move faster. This increases the probability of collisions between particles, hence the reaction rate increases
o At higher temperatures, more particles have the required activation energy, thus the probability of colliding particles have the necessary activation energy for the reaction to take place
For reversible reactions such as the Haber process, the rates of reaction of both the forward and reverse reactions increase at higher temperatures. Thus the equilibrium is reached faster, but the yield of product is not increased.
Explain why the yield of product in the Haber process is reduced at higher temperatures using Le Chatelier’s principle
For industrial reversible reactions, the yield of product describes how much product is formed at the point of equilibrium (it has nothing to do with the rate of reaction)
As the Haber process is an exothermic reaction, the effect of increased temperatures can be predicted using Le Chatelier’s principle
o If the temperature of the reaction vessel is increased, the equilibrium will favour the reverse reaction since it is endothermic, which will minimise the change to the system
As the reverse reaction is favoured at higher temperatures, the yield of product (i.e. ammonia) is decreased
Analyse the impact of increased pressure on the system involved in the Haber process
In the synthesis of ammonia, there are four moles of gas of reactants (one mole N2, three moles H2) for every two moles of NH3
According to Le Chatelier’s principle, increasing the pressure of the reaction vessel in the Haber process will favour the forward reaction, as this reduces pressure by decreasing the number of moles of gas in the system.
Thus increasing the pressure on the system in the Haber process will increase the yield of ammonia
In addition, higher pressures also increase the rate of reaction, as the gas molecules are closer together and at higher concentrations
Explain why the Haber process is based on a delicate balancing act involving reaction energy, reaction rate and equilibrium
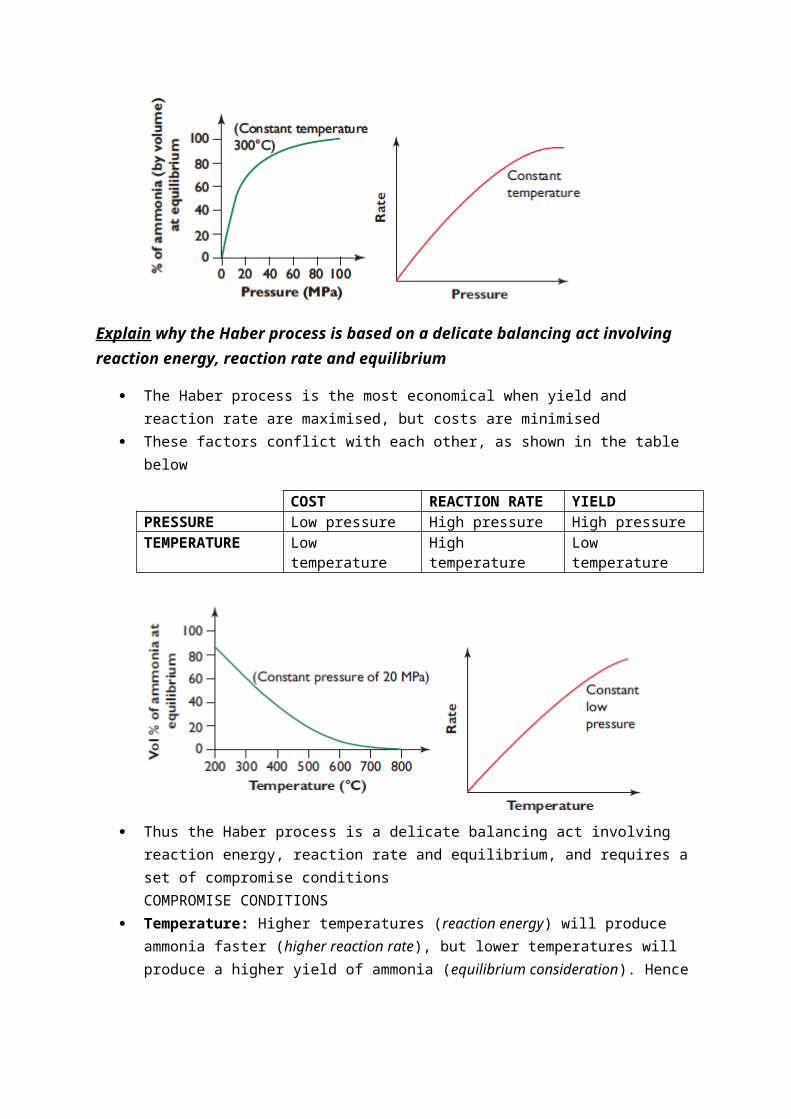
The Haber process is the most economical when yield and reaction rate are maximised, but costs are minimised
These factors conflict with each other, as shown in the table below
COST REACTION RATE YIELDPRESSURE Low pressure High pressure High pressureTEMPERATURE Low temperature High temperature Low temperature
Thus the Haber process is a delicate balancing act involving reaction energy, reaction rate and equilibrium, and requires a set of compromise conditionsCOMPROMISE CONDITIONS
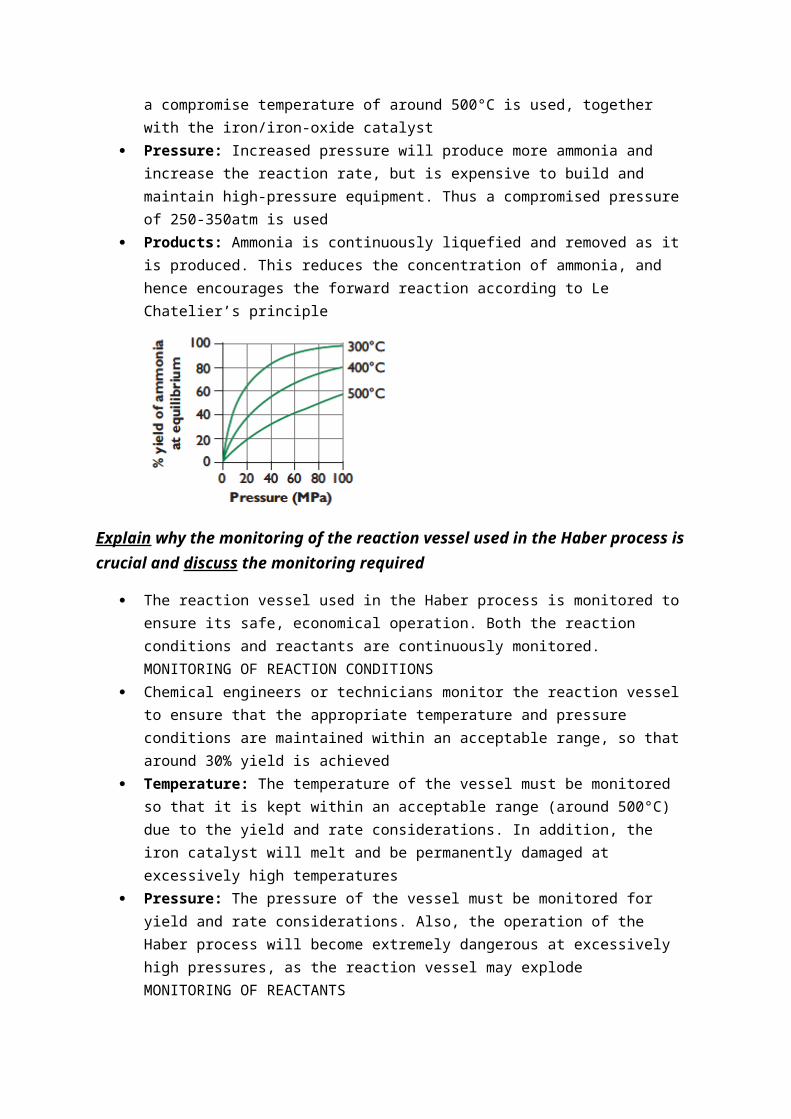
Temperature: Higher temperatures (reaction energy) will produce ammonia faster (higher reaction rate), but lower temperatures will produce a higher yield of ammonia (equilibrium

consideration). Hence a compromise temperature of around 500°C is used, together with the iron/iron-oxide catalyst
Pressure: Increased pressure will produce more ammonia and increase the reaction rate, but is expensive to build and maintain high-pressure equipment. Thus a compromised pressure of 250-350atm is used
Products: Ammonia is continuously liquefied and removed as it is produced. This reduces the concentration of ammonia, and hence encourages the forward reaction according to Le Chatelier’s principle
Explain why the monitoring of the reaction vessel used in the Haber process is crucial and discuss the monitoring required
The reaction vessel used in the Haber process is monitored to ensure its safe, economical operation. Both the reaction conditions and reactants are continuously monitored.MONITORING OF REACTION CONDITIONS
Chemical engineers or technicians monitor the reaction vessel to ensure that the appropriate temperature and pressure conditions are maintained within an acceptable range, so that around 30% yield is achieved
Temperature: The temperature of the vessel must be monitored so that it is kept within an acceptable range (around 500°C) due to the yield and rate considerations. In addition, the iron catalyst will melt and be permanently damaged at excessively high temperatures
Pressure: The pressure of the vessel must be monitored for yield and rate considerations. Also, the operation of the Haber process will become extremely dangerous at excessively high pressures, as the reaction vessel may explodeMONITORING OF REACTANTS
Ratio of reactants: The ratio of the incoming gases has to be monitored so that the ratio of N2 to H2 is maintained at a constant 1:3, as a build-up of any gas may dangerously increase the pressure within the reaction vessel
Contaminants: The concentration of contaminants must be monitored for various reasonso O2 must be completely removed, as it introduces the risk of an explosive reaction
with H2
o CO, CO2 and sulfur compounds must be at very low levels, as they may damage the surface of the catalyst
o Argon and methane must be kept at low concentrations, as they lower the efficiency of the reaction
Catalyst: The quality of the surface of the iron catalyst must be monitored to ensure the efficient absorption of N2 and H2 molecules
Gather and process information from secondary sources to describe the conditions under which Haber developed the industrial synthesis of ammonia and evaluate its significance at that time in world history
Before the development of the Haber process in 1913, the primary source of nitrates for fertilisers and explosives came from the mineral saltpetre from Chile
Available supplies of nitrate minerals were dwindling in the early 20th century, whilst the global population boomed => this placed a greater need on developing a synthetic method of producing fertilisers and explosives on a commercial and industrial scale
Haber developed the process for ammonia production to relieve Germany’s reliance on natural fertilisers, and to provide a cheap, synthetic alternative
The Allied blockade restricted Germany’s supply of natural nitrates, which led to the Haber process to be adopted on a widespread scale to produce ammonia for fertiliser and explosives
The Haber process was very significant at that time in world history, as it allowed cheaper method of manufacturing fertilisers and weapons. This allowed for greater agricultural output, which helped mitigate potential food shortages in Germany due to its booming population, and blockades on trade during WWI
3. Manufactured products, including food, drugs and household chemicals, are analysed to determine or ensure their chemical composition
Deduce the ions present in a sample from the results of tests
The ions to be tested are listed below:o Cations: Ba2+, Ca2+, Pb2+, Cu2+, Fe2+, Fe3+
o Anions: PO43-, SO4
2-, CO32-, Cl-
The table below shows the solubility of the compounds of the above ions => MEMORISE
IONS PO43- SO4
2- CO32- Cl- OH-
Ba2+ White ppt White ppt White ppt NO REACTION White pptCa2+ White ppt White ppt White ppt NO REACTION White pptPb2+ White ppt White ppt White ppt White ppt* White pptCu2+ Blue ppt NO REACTION Green ppt NO REACTION Blue pptFe2+ Green ppt NO REACTION Grey ppt NO REACTION Green pptFe3+ Pink ppt NO REACTION NO REACTION NO REACTION Brown ppt
* - Soluble when heated Precipitation reactions are used to identify ions in solution. Gravimetric analysis, volumetric
analysis, and AAS can be used for quantitative analysis (see practical below) In ion detection tests, there may be only one ion in the sample, or a mixture of ions in the
sample. The tests below explain the individual detection tests, whilst the flowcharts highlight the order of tests when more than one ion is present in the sample
All tests should use 1-2mL samples of concentration of at least 0.1M For samples containing a mixture of ions, each test needs to be conducted in a specific
sequence (i.e. the ion is removed via complete precipitation and filtration, then the next test is conducted)CATION TESTS
To determine the cations present, HCl, H2SO4 and NaOH is added in that order, and the formation of a precipitate indicates which ion is present
The flowchart below shows describes the relevant cation testing

The table below describes the individual cation tests. The tests must be conducted in this order in a sample containing multiple cations, so that the cation can completely precipitate out of the solution (i.e. until no more precipitate forms)
CATION TEST VERIFICATIONPb2+ Add HCl solution (Cl- ions) => a white
precipitate indicates the presence of Pb2+ ions
Add a few drops of potassium iodide (KI) to a fresh sample => a vibrant yellow precipitate should form
Ca2+ and Ba2+
Add H2SO4 solution (SO4 ions) => a white precipitate indicates the presence of Ca2+ or Ba2+ ions
Add a few drops of sodium fluoride (NaF) to a fresh sample => Ca2+ forms a precipitate with F, whilst Ba2+ doesn’t.
Cu2+ Add NaOH solution (OH- ions) => a blue precipitate indicates the presence of Cu2+ ions, an initially green precipitate indicates Fe2+ ions (though it may rapidly turn brown), and a brown precipitate indicates Fe3+ ions
Dissolve the precipitate in ammonia (NH3) => Cu(OH)2 will form a deep-blue solution (only form single ion tests)
Fe2+ Add a few drops of purple potassium permanganate solution (KMnO4) => the decolourisation of the solution indicates the presence of Fe2+
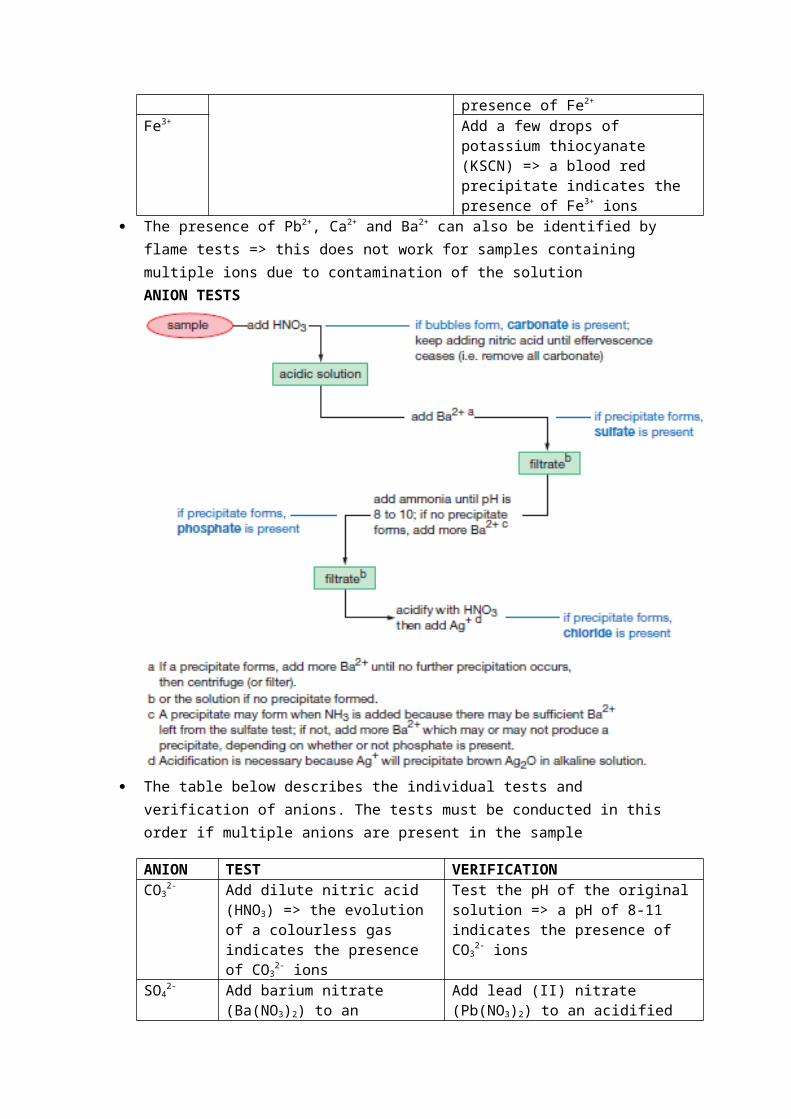
Fe3+ Add a few drops of potassium thiocyanate (KSCN) => a blood red precipitate indicates the presence of Fe3+ ions
The presence of Pb2+, Ca2+ and Ba2+ can also be identified by flame tests => this does not work for samples containing multiple ions due to contamination of the solutionANION TESTS

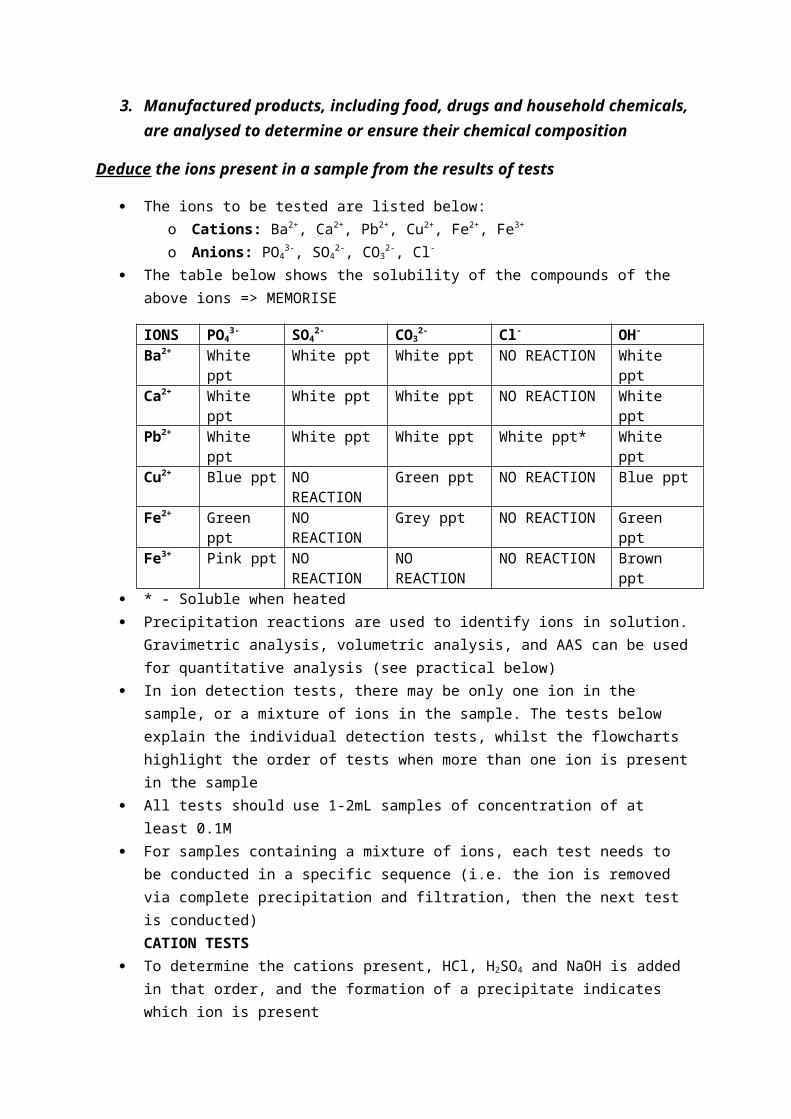
The table below describes the individual tests and verification of anions. The tests must be conducted in this order if multiple anions are present in the sample
ANION TEST VERIFICATIONCO3
2- Add dilute nitric acid (HNO3) => the evolution of a colourless gas indicates the presence of CO3
2- ions
Test the pH of the original solution => a pH of 8-11 indicates the presence of CO3
2- ionsSO4
2- Add barium nitrate (Ba(NO3)2) to an acidified sample => the formation of a thick white precipitate indicates the presence of SO4
2- ions
Add lead (II) nitrate (Pb(NO3)2) to an acidified sample => the formation of a white precipitate indicates the presence of SO4
2- ionsPO4
3- Add barium nitrate (Ba(NO3)2) to an alkaline sample => the formation of a white precipitate indicates the presence of PO4
3- ions
Add ammonium molybate solution ((NH4)MoO4) to an acidified sample => the formation of a yellow precipitate indicates the presence of PO4
3- ionsCl- Add silver nitrate (AgNO3) to an
acidified sample => the formation of a white precipitate that decomposes in sunlight indicates the presence of Cl- ions
Add 1-2mL of 10% ammonia solution to the precipitate suspension => decolourisation indicates the confirms the formation of the AgCl precipitate
When acidifying the solution, HNO3 must be added, as other acids may contaminate the tests (e.g. H2SO4, HCl). Use ammonia (NH3) to make a sample basic
Gather, process and present information to describe and explain evidence for the need to monitor levels of one of the above ions in substances used in society
LEAD (Pb2+)Sources:
Lead was widely used as an additive in petrol, which led to high levels of lead in the atmosphere via vehicle exhaust
Paints manufactured before the 1950s contained a high percentage of lead. Lead in paints is released into the atmosphere by deterioration with age, sanding, burning, or demolition.
Mining and refining of lead produces fumes, dust, tailings, and slag wastes contaminated with lead
Plumbing fixtures that contain trace amounts of lead can cause lead to be dissolved in drinking water suppliesEffects:
Lead released into the environment can enter the body by ingestion, inhalation, and absorption through the skin.
Because of its similarity in size to calcium ions, lead can be taken up in bones and teeth, and can also be absorbed by fatty tissue => this leads to accumulation in organisms as lead is difficult to excrete
Lead poisoning can lead to reduced cognitive abilities, nausea, abdominal pain, seizures and comas
As a neurotoxin, lead can also cause neurological damage (particularly in young children), which can retard intellectual development, behaviour, size, and hearing
Lead inhibits the formation of haemoglobin in blood, which can cause anaemia Lead also disrupts enzyme systems, which can cause brain, kidney and reproductive damage
Process of monitoring: The World Health Organisation recommends a range of 0.5-1.0x10⁻³ μgL-1 as the maximum
safe level of lead in air, and 50μgL-1 as the maximum safe level in drinking water Environmental protection agencies around the world typically use AAS to measure the lead
concentration in paint, water, and soils K-fluorescent X-ray metering can measure bone-lead. Portable X-ray fluorescence (XRF)
equipment can be used to measure lead concentrations and exposures in the field, from lead paint, children’s toys etc.
NOTE: The dot-point asks to explain evidence for the need to monitor lead’s use in society => keep these key terms in mind when answering questions on monitoring toxic ions
Describe the use of atomic absorption spectroscopy (AAS) in detecting concentrations of metal ions in solutions and assess its impact on scientific understanding of the effects of trace elements
Each element has its own characteristic absorption spectrum that is related to its electron energy levels. An absorption spectrum is produced when electrons absorb discrete wavelengths of light as they transition to higher energy states.
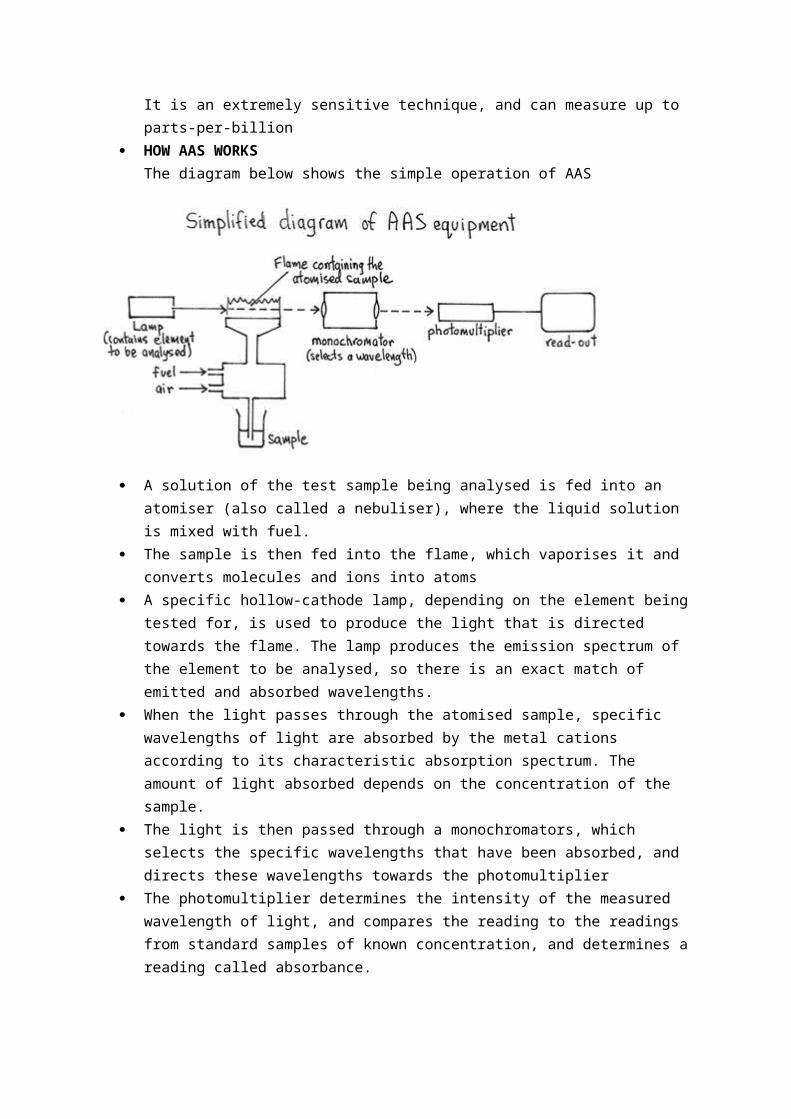
Atomic absorption spectroscopy, or AAS, is used to measure the concentration of metal ions in solution using the characteristic absorption spectrum of the desired metal ions. It is an extremely sensitive technique, and can measure up to parts-per-billion
HOW AAS WORKSThe diagram below shows the simple operation of AAS

A solution of the test sample being analysed is fed into an atomiser (also called a nebuliser), where the liquid solution is mixed with fuel.
The sample is then fed into the flame, which vaporises it and converts molecules and ions into atoms
A specific hollow-cathode lamp, depending on the element being tested for, is used to produce the light that is directed towards the flame. The lamp produces the emission spectrum of the element to be analysed, so there is an exact match of emitted and absorbed wavelengths.
When the light passes through the atomised sample, specific wavelengths of light are absorbed by the metal cations according to its characteristic absorption spectrum. The amount of light absorbed depends on the concentration of the sample.
The light is then passed through a monochromators, which selects the specific wavelengths that have been absorbed, and directs these wavelengths towards the photomultiplier
The photomultiplier determines the intensity of the measured wavelength of light, and compares the reading to the readings from standard samples of known concentration, and determines a reading called absorbance.
o Absorbance is an arbitrary unit of determining the amount of light absorbed, so the AAS device must be calibrated using standard solutions of known concentration
Absorbance is proportional to concentration, as the amount of light absorbed by the atomised sample depends on its concentration, so the measured absorbance can be used to calculate the concentration of the particular metal cation being examinedIMPACT OF AAS ON UNDERSTANDING OF TRACE ELEMENTS
Trace elements are elements that are required by living organisms in very small amounts, generally in the range of 1 to 100 ppm
Trace elements are needed in minute quantities for the growth, health, and nutrition of organisms
Examples of trace elements include zinc, cobalt, copper, nickel, molybdenum, and selenium Deficiencies in these trace elements in soils or animal diets resulted in significant health
problemso Iron is required for the production and functioning of haemoglobin in the blood, so a
deficiency in iron can cause significant circulatory problems
o Zinc is needed for amino acid metabolism, energy production, and the enzymes that produce insulin
Before the introduction of AAS, the commonly used analytical methods, such as gravimetric analysis, were not sensitive enough to detect the low concentrations of these elements. The presence of these elements were often unnoticed, and the causes of diseases relating to trace-element deficiency were unknown
The high sensitivity, selectivity, and accuracy of AAS was significant in not only identifying the trace amounts of elements in all organism, but their need for proper functioning and well-being. Thus AAS has had a great impact on the understanding scientific effects of trace elements
o For example, arid areas of Victoria could not support legume crops until molybdenum deficiencies were detected by AAS and rectified
Gather, process and present information to interpret secondary data from AAS measurements and evaluate the effectiveness of this in pollution control
AAS can also be used to detect very small concentrations (ppm) from samples of air, food, and water. A calibration graph can be drawn from the absorbance values obtained using solutions of known concentration, which can be used to determine the concentration of a pollutant in a sample
Small concentrations of pollutants such as lead, mercury, cadmium and chromium are toxic to humans and animals. As such pollutants are introduced to the food chain, they can accumulate to toxic levels
Samples can be taken from a variety areas, such as the following:o Mercury in fisho Copper and aluminium in waterwayso Zinc in oysterso Lead fallout besides highways
AAS is used to detect low concentrations of these pollutants, as it is cost-effective, scientifically valid, highly sensitive, easy to use, and readily available.
AAS is extremely effective in pollution control for metal pollutants, as AAS is able to accurately calculate the concentrations of such pollutants in low concentrations, which was not possible before. This has given us a broader understanding of the state of our environment, and helps to improve the health and safety of ecosystems and the public
o For example, AAS was used in Bangladesh to monitor levels of arsenic in drinking water, which led to more rigorous control of water supplies
Perform first-hand investigations to carry out a range of tests, including flame tests, to identify the following ions:
phosphate sulfate carbonate chloride barium
calcium lead copper iron
METHOD The following solutions (0.1M) were used in this practical
o ANIONS: NaCO3, NaCl, Na2SO4, Na3PO4 [sodium carbonate, sodium chloride, sodium sulfate, sodium phosphate]
o CATIONS: Pb(NO3)2, Cu(NO3)2, Ca(NO3)2, FeSO4, Fe(NO3)3 [lead(II) nitrate, copper(II) nitrate, calcium nitrate, iron(II) sulfate, iron(III) nitrate
The solutions were identified using both precipitation tests and flame testsPrecipitation tests
See above for details on how to test each of the above solutions to identify ions 10 drops of each solution were tested in small test tubes, and any observations were
recordedFlame tests
The flame tests were used to identify Ca2+, Ba2+ and Cu2+ => flame tests cannot be used to identify anions, Pb2+ releases toxic fumes in flame tests, and iron(II) and iron(III) ions do not produce characteristic flames
Each solution was carefully sprayed using a spray bottle into the tip of a non-luminous ‘hot’ Bunsen flame, and any colour changes were observed
Alternatively, dip a platinum wire mounted in the end of glass tube in the solution to be tested, and then place it in the tip of a non-luminous ‘hot’ Bunsen flame. Clean the wire before each test by dipping it in hydrochloric acidSAFETY:
Many of the solutions used are toxic if ingested, and solutions containing lead ions are toxic by all routes of exposure => use solutions of low concentrations, use a dropper to transfer solutions, wear eye and skin protectionRESULTSPrecipitation tests
See the relevant dot point above for the results of precipitation testsFlame tests
Ca2+ => brick red Ba2+ => yellow-green (apple green) Cu2+ => blue-green The flame test was particularly useful in distinguishing between calcium ions and barium
ionsACCURACY/RELIABILITY/VALIDITY
No quantitative measurements were taken, so accuracy is largely irrelevant The results of both tests were compared to others in the class, and the results were similar,
thus the precipitation test was reliable Solutions of low concentration were used in the precipitation tests, and each test was
conducted in a small test tube, so the results were easily observed => thus the results from the precipitation tests were valid

The solutions used for the flame tests could be contaminated, which would produce different flame colours in flame tests (e.g. sodium ions produce a bright yellow flame) => this reduces the validity of the flame test
o The platinum wire was dipped in hydrochloric acid first to remove any contaminating sodium ions
Whilst the calcium ions could easily be identified by their brick red flame, barium and copper ions both produce a green flame, so the flame tests was not a valid test to identify solutions containing barium and copper ions
Identify data, plan, select equipment and perform first-hand investigations to measure the sulfate content of lawn fertiliser and explain the chemistry involved
METHOD 0.5g of grounded ammonium sulfate fertiliser was weighed and dissolved in 25mL of
deionised water in a 250mL beaker. 100mL of 0.5M HCl solution was slowly added until all the fertiliser dissolved to ensure all the CO3
2- reacted The mixture was then heated up until boiling point, and then the flame was turned off. 10mL
of warm 5% BaCl2 solution was added drop-by-drop, until no more precipitate formed. The barium and sulfate ions formed an insoluble white precipitate:
IONIC EQUATION:
FULL EQUATION: After the precipitate had settled, 10mL of 0.1% w/v agar solution was added to coagulate the
BaSO4 particles (i.e. to clump the particles together into bigger particles). The solution was washed-down with a wash bottle and filtered through a pre-weighed sintered glass funnel with vacuum pump. If a sintered glass funnel is not available, use pre-weighed fine-grade filter paper.
The funnel was placed in a desiccator and left to dry overnight (dry the filter paper to evaporation if used). The dried funnel and barium sulfate were weighed, and the weight of barium sulfate was calculated. The percentage concentration of sulfate in the original sample per mass was then calculated.SAFETY:
Barium sulfate is extremely toxic if ingested => a drop bottle was used to transfer the BaCl2 solution, and a low concentration was usedRESULTS
m(BaSO4) = 0.833g m(SO4
2-) = 0.343g %( SO4
2-) = 0.343g/0.5g = 68.6% Theoretical result = 72% The filtrate was slightly cloudy, which indicated that not all the BaSO4 had been removed
from the original solution after filtration SEE BELOW FOR ACCURACY/VALIDITY/RELIABILITY
Analyse information to evaluate the reliability of the results of the above investigation and to propose solutions to problems encountered in the procedure
RELIABILITY Reliability in an experimental context refers to the reproducibility of the obtained results. In
other words, whilst accuracy is concerned with the obtained result, reliability is concerned with the inherent error of the result.
To improve reliability, take the following steps:o Repeat analysis at least three times and average the results, excluding outlierso Have a larger sample size (i.e. conduct the experiment simultaneously with other
groups, and compare results)o Use a larger mass of fertiliser to minimise percentage error
The experiment above was conducted simultaneously with other groups following the same method. Similar results were obtained, thus the results is reliable, despite its inaccuracyACCURACY/VALIDITY
The validity of the experiment depends on the following assumptions:o The filter collected all the BaSO4 particleso No other species present in the fertiliser was precipitated by barium ions, such as
CO32- or OH- ions
The table below lists the possible problems with the experiment, and proposed solutions
PROBLEM PROPOSED SOLUTIONWeighing – some mass may have been unaccounted for due to errors in collection and weighing
Wash down the beaker when transferring to the filter to ensure all BaSO4 is transferred. Filter paper should be dried in an oven instead of air, as moisture could still be present and contaminants added. Use a very precise electronic scale.
Incomplete precipitation – BaSO4 forms in an equilibrium, and thus production of precipitate may not reach equilibrium
Add excess BaCl2 to shift the equilibrium to the right until no more additional white precipitate forms. Cool the mixture after adding BaCl2 in ice-water to greatly reduce the solubility of BaSO4. Do not use great volumes of water and solutions, as BaSO4 is more soluble in dilute solutions.
Presence of contaminant ions – Phosphate and carbonates present may react with barium to form excess precipitate
Addition of HCl dissolves these precipitates
Small size of precipitate crystals – BaSO4 forms very fine crystals, which easily go through normal filter paper, and even sintered glass crucibles
Heating the solution before adding BaSO4 and constantly stirring increases the energy of the solution, which increases the number of collisions, thus larger particles are formed. Adding BaCl2 slowly allows the BaSO4 crystals to grow, and thus become larger. Adding a coagulating agent such as agar solution causes the crystals to coagulate
Contaminated precipitate – unreacted ions (Ba2+, SO4
2-, NH4+) may remain in the
precipitate in the filter paper
Wash precipitate with deionised water before drying and weighing
4. Human activity has caused changes in the composition and the structure of the atmosphere. Chemists monitor these changes so that further damage can be limited
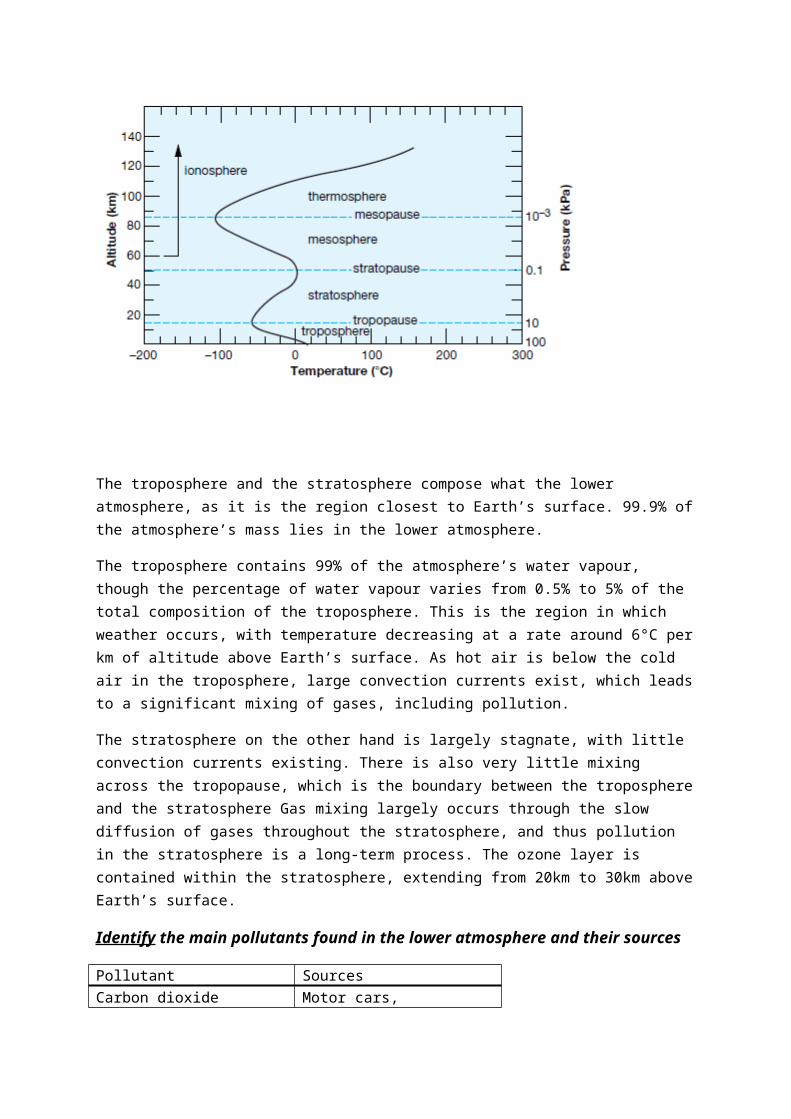
Describe the composition and layered structure of the atmosphere
The atmosphere is the layer of gas that surrounds Earth, extending 200-300km above Earth’s surface. The atmosphere comprises primarily of nitrogen (N2), oxygen (O2) and argon (Ar). The percentages (volume to volume) of these gases are as follows:
N2 = 78.08% O2 = 20.95% Ar = 0.93 %
The atmosphere also comprises other gases that occur in such small quantities that they are generally measured in ppm. These gases are carbon dioxide, neon, helium, methane, krypton, hydrogen, carbon monoxide, and ozone.
The atmosphere also exists in several layers, namely the troposphere, stratosphere, mesosphere, thermosphere and ionosphere.
Layer Range (km)
Characteristics
Troposphere 0-15 Consists of 75% of the atmosphere’s mass, and is where Earth’s weather occurs
Stratosphere 15-50 Ozone layer lies in this regionMesosphere 50-80 Few particles, coldest region of
atmosphereThermosphere and ionosphere
80+ High-frequency radiation absorbed

The troposphere and the stratosphere compose what the lower atmosphere, as it is the region closest to Earth’s surface. 99.9% of the atmosphere’s mass lies in the lower atmosphere.
The troposphere contains 99% of the atmosphere’s water vapour, though the percentage of water vapour varies from 0.5% to 5% of the total composition of the troposphere. This is the region in which weather occurs, with temperature decreasing at a rate around 6°C per km of altitude above Earth’s surface. As hot air is below the cold air in the troposphere, large convection currents exist, which leads to a significant mixing of gases, including pollution.
The stratosphere on the other hand is largely stagnate, with little convection currents existing. There is also very little mixing across the tropopause, which is the boundary between the troposphere and the stratosphere Gas mixing largely occurs through the slow diffusion of gases throughout the stratosphere, and thus pollution in the stratosphere is a long-term process. The ozone layer is contained within the stratosphere, extending from 20km to 30km above Earth’s surface.
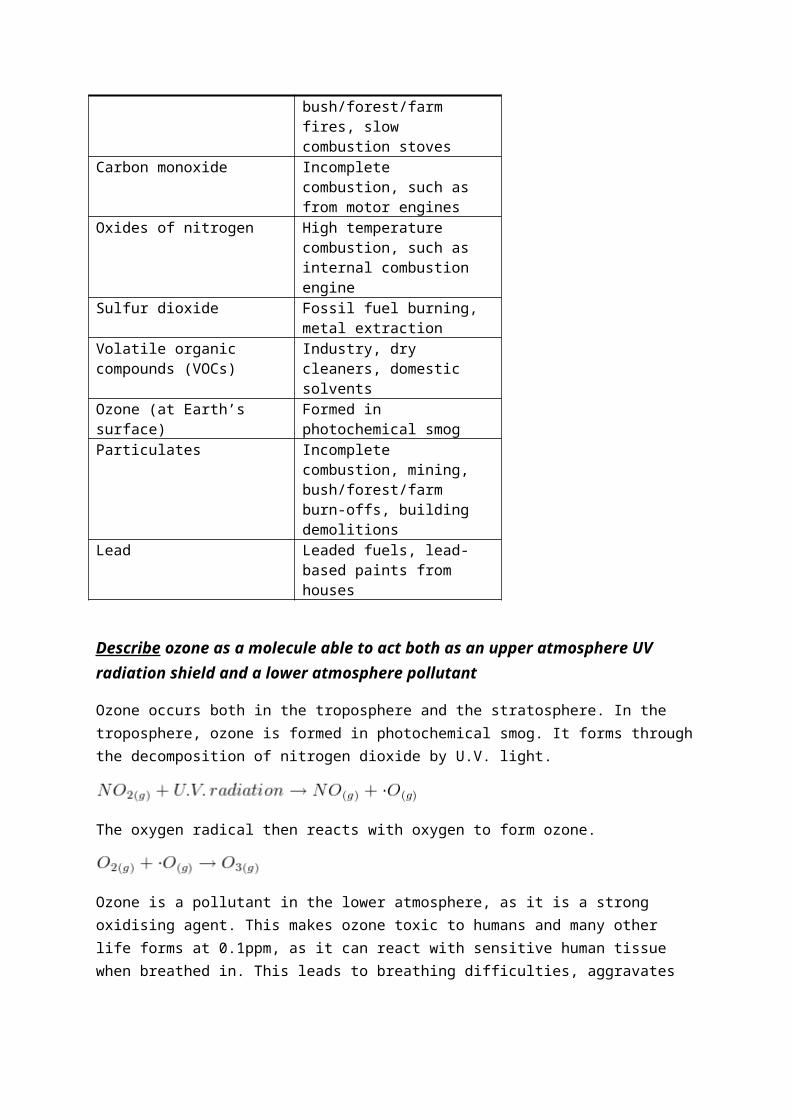
Identify the main pollutants found in the lower atmosphere and their sources
Pollutant SourcesCarbon dioxide Motor cars, bush/forest/farm
fires, slow combustion stovesCarbon monoxide Incomplete combustion, such as
from motor enginesOxides of nitrogen High temperature combustion,
such as internal combustion engine
Sulfur dioxide Fossil fuel burning, metal extraction
Volatile organic compounds (VOCs)
Industry, dry cleaners, domestic solvents
Ozone (at Earth’s surface) Formed in photochemical smogParticulates Incomplete combustion,
mining, bush/forest/farm burn-offs, building demolitions
Lead Leaded fuels, lead-based paints from houses
Describe ozone as a molecule able to act both as an upper atmosphere UV radiation shield and a lower atmosphere pollutant
Ozone occurs both in the troposphere and the stratosphere. In the troposphere, ozone is formed in photochemical smog. It forms through the decomposition of nitrogen dioxide by U.V. light.
The oxygen radical then reacts with oxygen to form ozone.
Ozone is a pollutant in the lower atmosphere, as it is a strong oxidising agent. This makes ozone toxic to humans and many other life forms at 0.1ppm, as it can react with sensitive human tissue when breathed in. This leads to breathing difficulties, aggravates respiratory problems, and produces headaches. It can also cause eye and throat irritation.
Ozone in the stratosphere, however, is vital to life on Earth, as it acts as a U.V. radiation shield. If ozone did not exist in the stratosphere, rates of skin cancer and other genetic mutations would be much higher. Ozone exists as a layer called the ozone layer, and it is in this layer where U.V. light is absorbed. U.V. light exists in three different forms – UV-A, UV-B, and UV-C. The ozone layer absorbs UV-B and UV-C, which are harmful, whilst allowing UV-A to pass through, which are needed for photosynthesis. Ozone protects Earth from harmful U.V. radiation through its formation and decomposition, absorbing U.V. radiation in the process.
Describe the formation of a coordinate covalent bond
A coordinate covalent bond is a covalent bond where the two electrons in shared pair of electrons have both been donated by a single atom. Whilst its formation differs from a normal covalent bond, it acts in a similar manner to a covalent bond once formed. Compounds that form coordinate covalent bonds include ozone, carbon monoxide, the ammonium ion, the hydronium ion, and complex ions.
Demonstrate the formation of coordinate covalent bonds using Lewis electron dot structures
RECALL:
Lewis electron dot structures represent the electrons in the valence shell, and their bonds with other atoms
The dots surround the letter of the element, and charges are shown by square brackets surrounding the structure, with the charge in superscript
Only use black dots when constructing Lewis dot diagrams Double and triple bonds can also be represented Check that each atom has the number of electrons surrounding it corresponding to the
number in the valence shell (e.g. oxygen has 6), but that there are eight in total for each atom in a stable bond.
Coordinate bond formations
Ozone
Carbon monoxide
Ammonium ion
Hydronium ion
Compare the properties of the oxygen allotropes O2 and O3 and account for them on the basis of molecular structure and bonding
Recall that allotropes are the different structural forms in which several elements can exist, which can exhibit different physical and chemical properties. Oxygen is one of these elements, as it can exist in two stable structures: the O2 molecule and O3 molecule.

The different molecular structure and bonding of each of these allotropes are show below.
Feature O2 O3
Structure Linear
Lewis dot diagram
Bent
Lewis dot diagram
Bonding The two oxygen atoms are bonded by a strong double covalent bond
Two of the oxygen atoms are in a double bond, one is in a coordinate covalent bond. Both are weaker than the double bond in O2
The differences in molecular structure and bonding lead to the allotropes to exhibit different properties:
Boiling point
O2 has a boiling point of -183°C, and O3 has a boiling point of -111°C. The difference in boiling point is due to O3 having a slight polarity due to the bent shape, and thus can form stronger dipole-dipole forces between molecules. Also, O3 has a larger molecular mass than O2, so the dispersion forces in O3 are stronger. This means that more energy is required to break the intermolecular forces in O3 than in O2.
Solubility in water
O3 is much more soluble in water than O2. This is because ozone’s bent structure and uneven distribution of electrons causes a slight polarity in the molecule, and thus it can form stronger dipole-dipole bonds with water. O2 is non-polar, and thus does not form strong intermolecular bonds with water, which is a polar molecule.
Chemical stability
O2 is very stable, whilst O3 is easily decomposed to O2. This is because the double bond in O2 is very strong, and requires a significant quantity of energy to be broken. The single bond in O3 is relatively weak however, and thus less energy is needed to break it.
Oxidising strength
O2 is a moderately strong oxidising agent, as it reacts with most other elements to produce oxides. But O3 is a much stronger oxidising agent, as the single coordinate bond in O3 is easily decomposed,

as it is weaker than the double bond in O2. This produces an oxygen radical, which is highly reactive and readily oxidises other compounds.
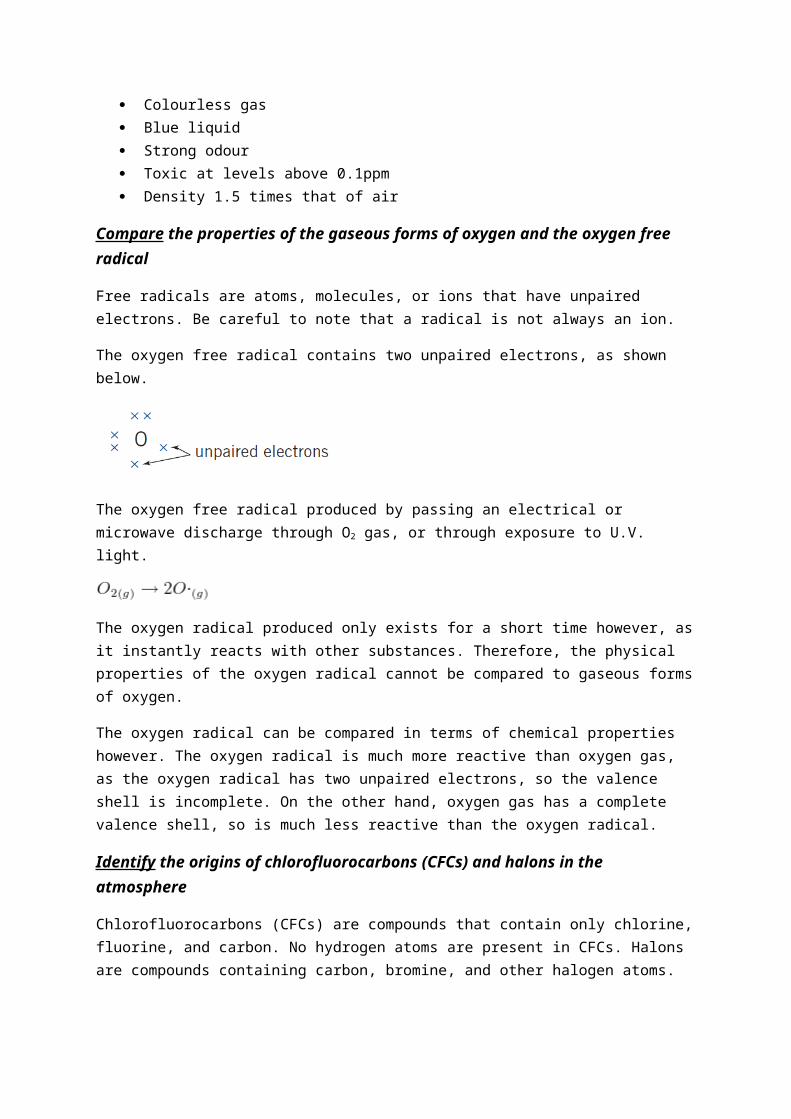
Other properties of O2 and O3 which are not caused by molecular structure or bonding are listed below.
O2
Colourless gas Pale blue liquid Odourless Similar density to air
O3
Colourless gas Blue liquid Strong odour Toxic at levels above 0.1ppm Density 1.5 times that of air
Compare the properties of the gaseous forms of oxygen and the oxygen free radical
Free radicals are atoms, molecules, or ions that have unpaired electrons. Be careful to note that a radical is not always an ion.
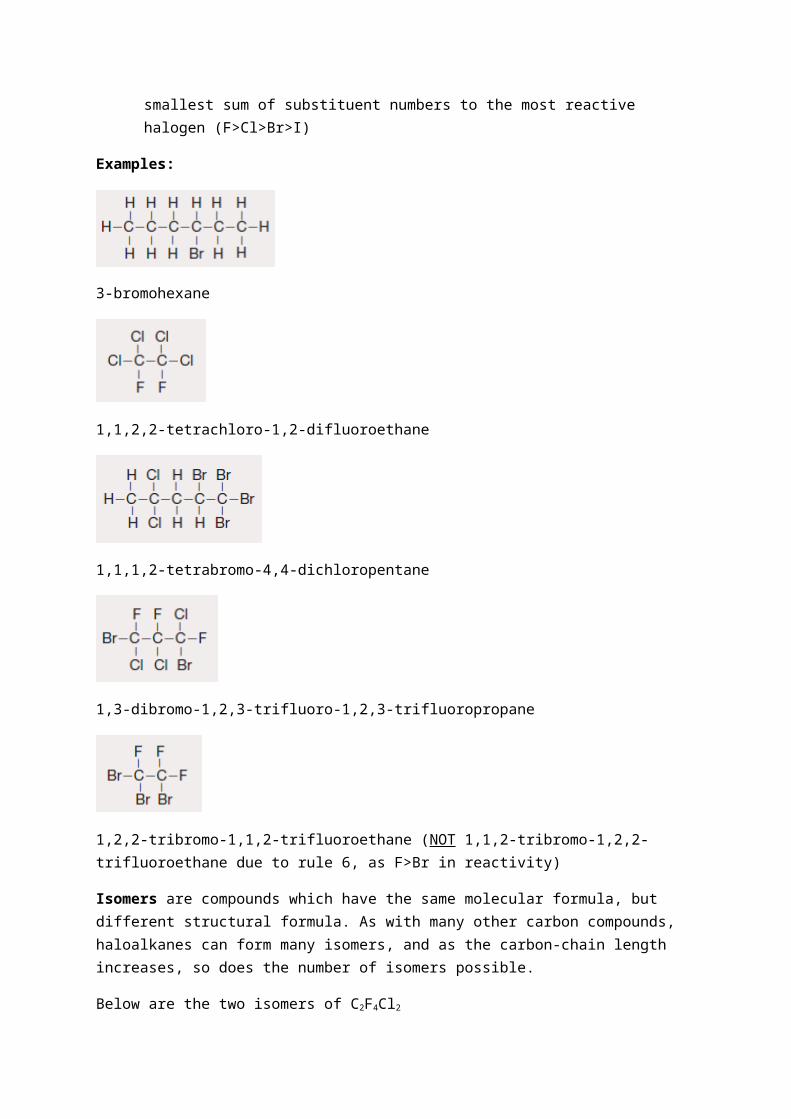
The oxygen free radical contains two unpaired electrons, as shown below.
The oxygen free radical produced by passing an electrical or microwave discharge through O2 gas, or through exposure to U.V. light.
The oxygen radical produced only exists for a short time however, as it instantly reacts with other substances. Therefore, the physical properties of the oxygen radical cannot be compared to gaseous forms of oxygen.
The oxygen radical can be compared in terms of chemical properties however. The oxygen radical is much more reactive than oxygen gas, as the oxygen radical has two unpaired electrons, so the valence shell is incomplete. On the other hand, oxygen gas has a complete valence shell, so is much less reactive than the oxygen radical.
Identify the origins of chlorofluorocarbons (CFCs) and halons in the atmosphere

Chlorofluorocarbons (CFCs) are compounds that contain only chlorine, fluorine, and carbon. No hydrogen atoms are present in CFCs. Halons are compounds containing carbon, bromine, and other halogen atoms.
Chlorofluorocarbons were originally introduced to a commercial scale in refrigeration, replacing ammonia. This was because CFCs were odourless, non-flammable, non-toxic, inert, and were dependent on pressure, which was a significant improvement on ammonia.
CFCs became more widespread in uses during the mid-20th century, such as the following uses:
Refrigerants in fridges and air-conditioners Aerosol spray can propellants Foaming agents for the manufacturing of foam plastics Cleaning agents for electric circuit boards
The above uses led to CFCs to be directly exposed to the atmosphere. CFCs have spread and remained in the atmosphere as they are inert and insoluble in water. In addition, CFCs have very slowly diffused through the tropopause into the stratosphere, and continued to spread throughout the stratosphere.
Halons are dense, non-flammable liquids, which made them ideally suited for use in fire extinguishers. These included small BCF fire extinguishers and sometimes in automated fire extinguishing systems. As they were used on open fires, they were directly exposed into the atmosphere, and have spread in a similar fashion to CFCs.
Identify and name examples of isomers (excluding geometrical and optical) of haloalkanes up to eight carbon atoms
Naming haloalkanes
1. Count the number of carbons in the longest carbon, and name it according to alkane name.2. Identify the halogens present and name them as prefixes, with the chemical name minus the
–ine (i.e. fluoro-, chloro-, bromo-, iodo-)3. If more than one atom of the same halogen is present, the prefixes di-, tri-, tetra-, penta-
etc. are placed in front of the halogen4. Name the carbon atoms from the end that will end up with the smallest sum of all the
substituent numbers of the halogens.5. Halogen prefixes are listed alphabetically6. If the above rules lead to more than one possible name, then the carbons are numbered
from the end that will give the smallest sum of substituent numbers to the most reactive halogen (F>Cl>Br>I)
Examples:
3-bromohexane
1,1,2,2-tetrachloro-1,2-difluoroethane
1,1,1,2-tetrabromo-4,4-dichloropentane
1,3-dibromo-1,2,3-trifluoro-1,2,3-trifluoropropane
1,2,2-tribromo-1,1,2-trifluoroethane (NOT 1,1,2-tribromo-1,2,2-trifluoroethane due to rule 6, as F>Br in reactivity)
Isomers are compounds which have the same molecular formula, but different structural formula. As with many other carbon compounds, haloalkanes can form many isomers, and as the carbon-chain length increases, so does the number of isomers possible.
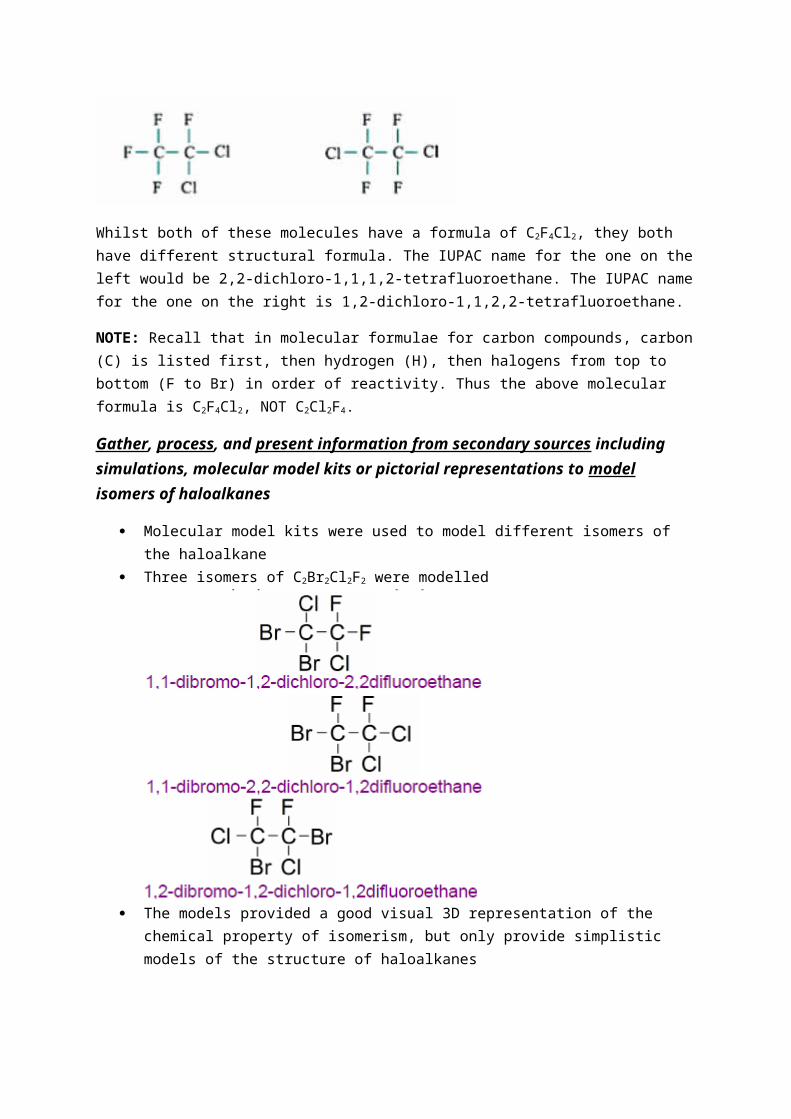
Below are the two isomers of C2F4Cl2
Whilst both of these molecules have a formula of C2F4Cl2, they both have different structural formula. The IUPAC name for the one on the left would be 2,2-dichloro-1,1,1,2-tetrafluoroethane. The IUPAC name for the one on the right is 1,2-dichloro-1,1,2,2-tetrafluoroethane.
NOTE: Recall that in molecular formulae for carbon compounds, carbon (C) is listed first, then hydrogen (H), then halogens from top to bottom (F to Br) in order of reactivity. Thus the above molecular formula is C2F4Cl2, NOT C2Cl2F4.
Gather, process, and present information from secondary sources including simulations, molecular model kits or pictorial representations to model isomers of haloalkanes
Molecular model kits were used to model different isomers of the haloalkane Three isomers of C2Br2Cl2F2 were modelled
The models provided a good visual 3D representation of the chemical property of isomerism, but only provide simplistic models of the structure of haloalkanes
Discuss the problems associated with the use of CFCs and assess the effectiveness of steps taken to alleviate these problems
Ozone depletion
The most significant problem with CFCs is their production of the chlorine radical in the stratosphere, which leads to the destruction of ozone. CFCs originally came into widespread use as they were very inert and insoluble in water. These properties also mean that CFCs released into the atmosphere remain there for a long time, as they neither do react with atmospheric chemicals, nor are soluble in the water vapour in the troposphere.
CFCs slowly diffuse into the stratosphere, where they are subject to a higher level of UV exposure. The increase UV light causes the photodissociation of the chlorine atom from CFCs to form a highly reactive chlorine radical.
The chlorine radical then abstracts an oxygen atom from the ozone molecule, producing oxygen gas and a chlorine monoxide radical.

The chlorine monoxide radical is also highly reactive, and proceeds to react with an oxygen radical to produce oxygen gas and a chlorine radical.
The chlorine radical is therefore regenerated in the process, and acts as a catalyst in the destruction of ozone. The chlorine radical can proceed and attack another ozone molecule, and repeat the process thousands of times. The destruction of ozone by the chlorine radical is thus called a chain reaction. This means that only a small quantity of CFCs have to reach the stratosphere in order to cause significant destruction to ozone. The chain reaction is stopped eventually however, as other processes in the stratosphere eventually remove the chlorine and chlorine monoxide radical, though this normally occurs when the chlorine radical has destroyed around 4000 ozone molecules.
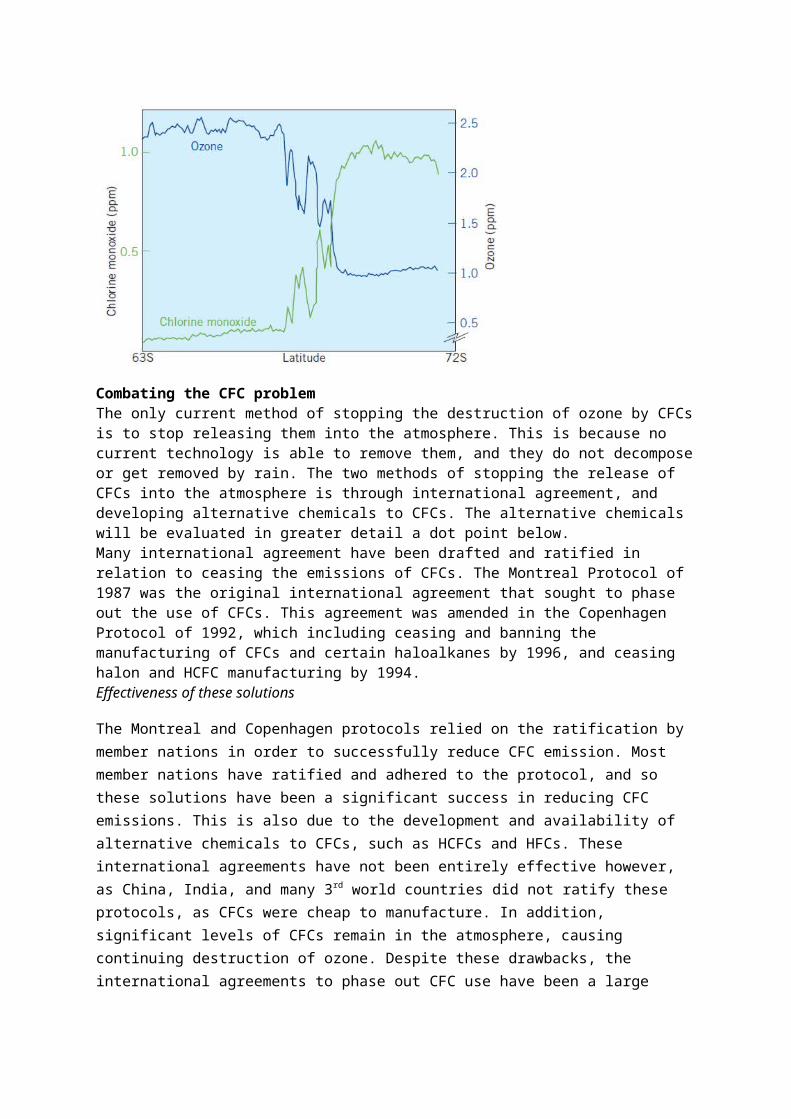
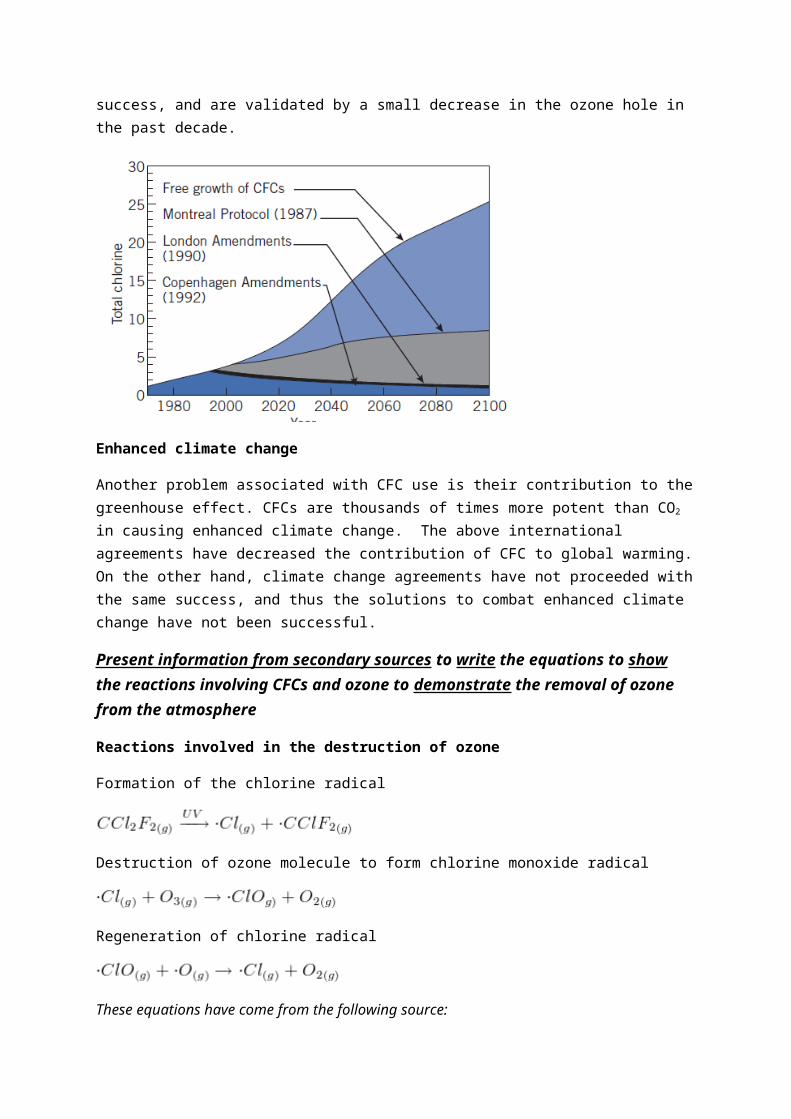
Combating the CFC problemThe only current method of stopping the destruction of ozone by CFCs is to stop releasing them into the atmosphere. This is because no current technology is able to remove them, and they do not decompose or get removed by rain. The two methods of stopping the release of CFCs into the atmosphere is through international agreement, and developing alternative chemicals to CFCs. The alternative chemicals will be evaluated in greater detail a dot point below.Many international agreement have been drafted and ratified in relation to ceasing the emissions of CFCs. The Montreal Protocol of 1987 was the original international agreement that sought to phase out the use of CFCs. This agreement was amended in the Copenhagen Protocol of 1992, which including ceasing and banning the manufacturing of CFCs and certain haloalkanes by 1996, and ceasing halon and HCFC manufacturing by 1994.Effectiveness of these solutions
The Montreal and Copenhagen protocols relied on the ratification by member nations in order to successfully reduce CFC emission. Most member nations have ratified and adhered to the protocol, and so these solutions have been a significant success in reducing CFC emissions. This is also due to the development and availability of alternative chemicals to CFCs, such as HCFCs and HFCs. These international agreements have not been entirely effective however, as China, India, and many 3 rd world countries did not ratify these protocols, as CFCs were cheap to manufacture. In addition,

significant levels of CFCs remain in the atmosphere, causing continuing destruction of ozone. Despite these drawbacks, the international agreements to phase out CFC use have been a large success, and are validated by a small decrease in the ozone hole in the past decade.
Enhanced climate change
Another problem associated with CFC use is their contribution to the greenhouse effect. CFCs are thousands of times more potent than CO2 in causing enhanced climate change. The above international agreements have decreased the contribution of CFC to global warming. On the other hand, climate change agreements have not proceeded with the same success, and thus the solutions to combat enhanced climate change have not been successful.
Present information from secondary sources to write the equations to show the reactions involving CFCs and ozone to demonstrate the removal of ozone from the atmosphere
Reactions involved in the destruction of ozone
Formation of the chlorine radical
Destruction of ozone molecule to form chlorine monoxide radical
Regeneration of chlorine radical
These equations have come from the following source:
U.S. Environmental Protection Agency. Ozone. 10 Aug. 2010. 08 Nov. 2010. <http://www.epa.gov/ozone/>

Present information from secondary sources to identify alternative chemicals used to replace CFCs and evaluate the effectiveness of their use as a replacement for CFCs
There are many alternative chemicals used to replace CFCs. These include hydrochlorofluorocarbons (HCFCs), hydrofluorocarbons (HCFs).
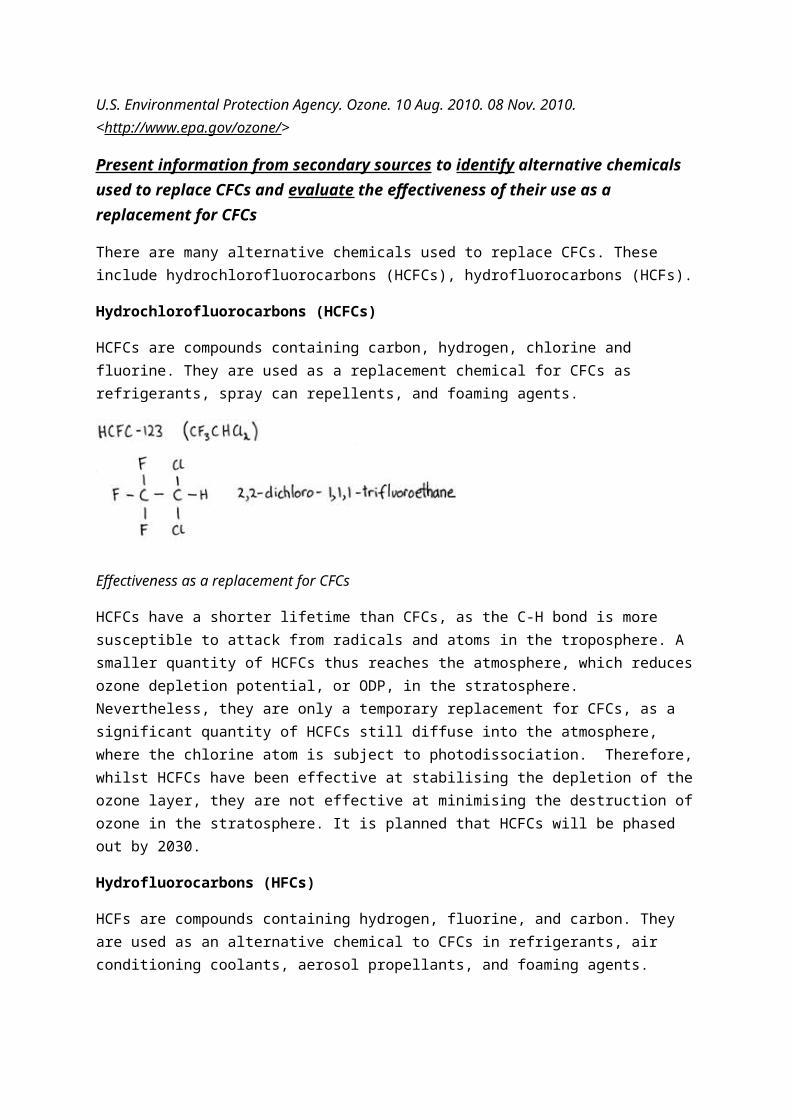
Hydrochlorofluorocarbons (HCFCs)
HCFCs are compounds containing carbon, hydrogen, chlorine and fluorine. They are used as a replacement chemical for CFCs as refrigerants, spray can repellents, and foaming agents.
Effectiveness as a replacement for CFCs
HCFCs have a shorter lifetime than CFCs, as the C-H bond is more susceptible to attack from radicals and atoms in the troposphere. A smaller quantity of HCFCs thus reaches the atmosphere, which reduces ozone depletion potential, or ODP, in the stratosphere. Nevertheless, they are only a temporary replacement for CFCs, as a significant quantity of HCFCs still diffuse into the atmosphere, where the chlorine atom is subject to photodissociation. Therefore, whilst HCFCs have been effective at stabilising the depletion of the ozone layer, they are not effective at minimising the destruction of ozone in the stratosphere. It is planned that HCFCs will be phased out by 2030.
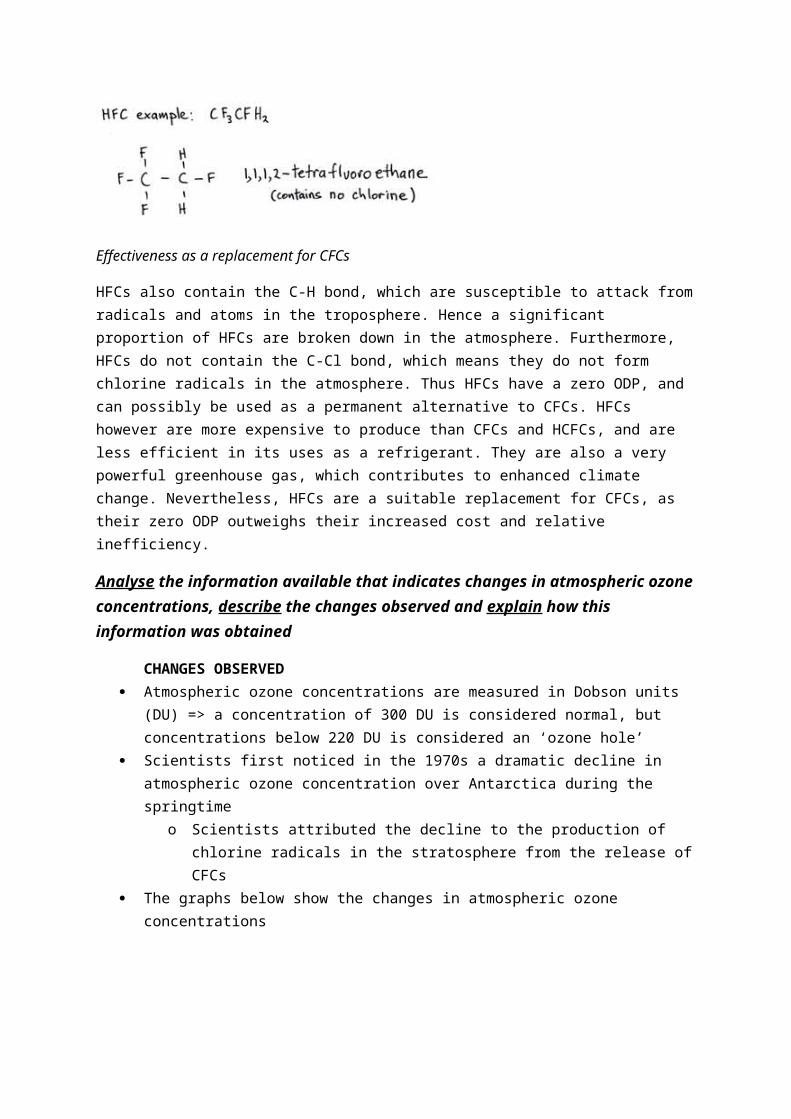
Hydrofluorocarbons (HFCs)
HCFs are compounds containing hydrogen, fluorine, and carbon. They are used as an alternative chemical to CFCs in refrigerants, air conditioning coolants, aerosol propellants, and foaming agents.
Effectiveness as a replacement for CFCs
HFCs also contain the C-H bond, which are susceptible to attack from radicals and atoms in the troposphere. Hence a significant proportion of HFCs are broken down in the atmosphere. Furthermore, HFCs do not contain the C-Cl bond, which means they do not form chlorine radicals in the atmosphere. Thus HFCs have a zero ODP, and can possibly be used as a permanent alternative to CFCs. HFCs however are more expensive to produce than CFCs and HCFCs, and are less efficient in its
uses as a refrigerant. They are also a very powerful greenhouse gas, which contributes to enhanced climate change. Nevertheless, HFCs are a suitable replacement for CFCs, as their zero ODP outweighs their increased cost and relative inefficiency.
Analyse the information available that indicates changes in atmospheric ozone concentrations, describe the changes observed and explain how this information was obtained
CHANGES OBSERVED Atmospheric ozone concentrations are measured in Dobson units (DU) => a concentration of
300 DU is considered normal, but concentrations below 220 DU is considered an ‘ozone hole’
Scientists first noticed in the 1970s a dramatic decline in atmospheric ozone concentration over Antarctica during the springtime
o Scientists attributed the decline to the production of chlorine radicals in the stratosphere from the release of CFCs
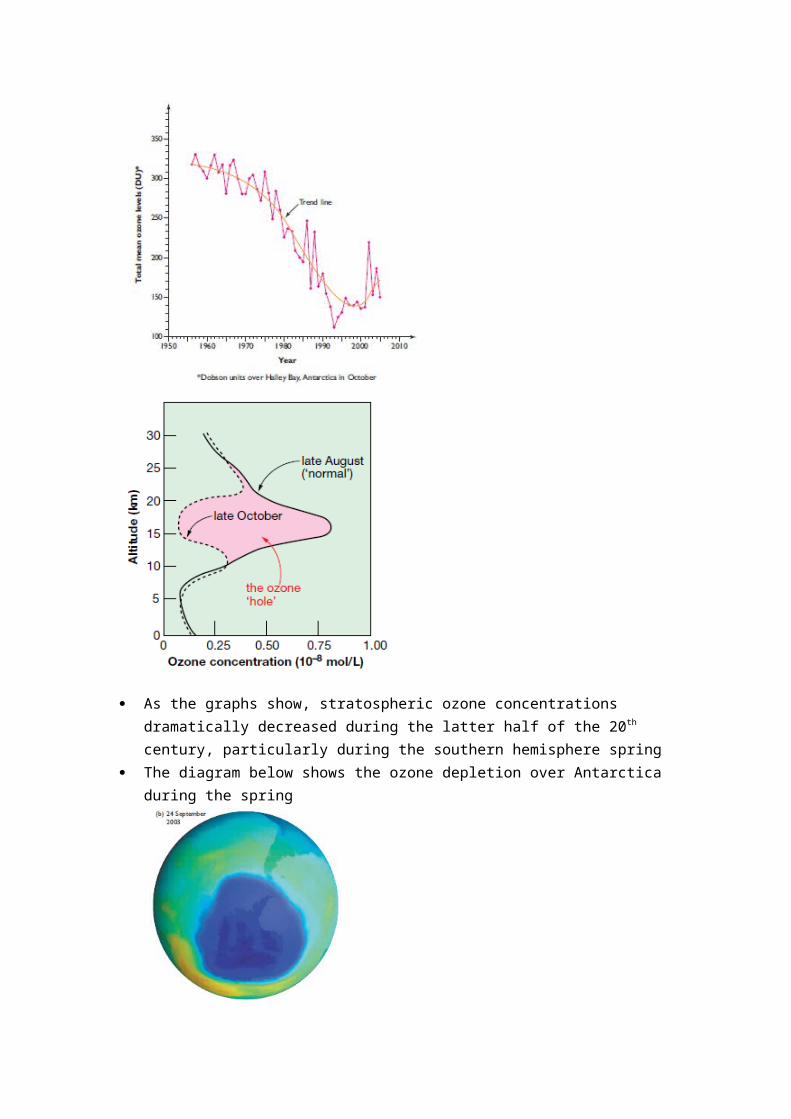
The graphs below show the changes in atmospheric ozone concentrations
As the graphs show, stratospheric ozone concentrations dramatically decreased during the latter half of the 20th century, particularly during the southern hemisphere spring
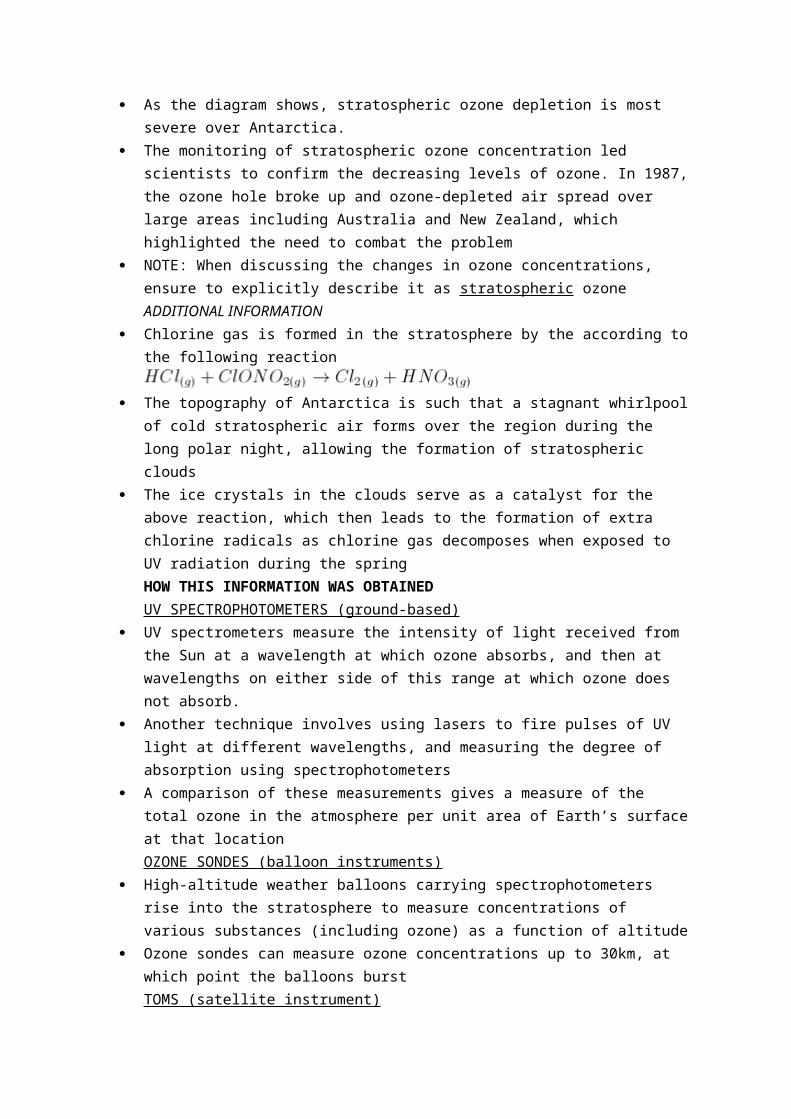
The diagram below shows the ozone depletion over Antarctica during the spring
As the diagram shows, stratospheric ozone depletion is most severe over Antarctica. The monitoring of stratospheric ozone concentration led scientists to confirm the decreasing
levels of ozone. In 1987, the ozone hole broke up and ozone-depleted air spread over large areas including Australia and New Zealand, which highlighted the need to combat the problem
NOTE: When discussing the changes in ozone concentrations, ensure to explicitly describe it as stratospheric ozoneADDITIONAL INFORMATION
Chlorine gas is formed in the stratosphere by the according to the following reaction
The topography of Antarctica is such that a stagnant whirlpool of cold stratospheric air forms over the region during the long polar night, allowing the formation of stratospheric clouds
The ice crystals in the clouds serve as a catalyst for the above reaction, which then leads to the formation of extra chlorine radicals as chlorine gas decomposes when exposed to UV radiation during the springHOW THIS INFORMATION WAS OBTAINEDUV SPECTROPHOTOMETERS (ground-based)
UV spectrometers measure the intensity of light received from the Sun at a wavelength at which ozone absorbs, and then at wavelengths on either side of this range at which ozone does not absorb.
Another technique involves using lasers to fire pulses of UV light at different wavelengths, and measuring the degree of absorption using spectrophotometers
A comparison of these measurements gives a measure of the total ozone in the atmosphere per unit area of Earth’s surface at that locationOZONE SONDES (balloon instruments)
High-altitude weather balloons carrying spectrophotometers rise into the stratosphere to measure concentrations of various substances (including ozone) as a function of altitude
Ozone sondes can measure ozone concentrations up to 30km, at which point the balloons burstTOMS (satellite instrument)
Total Ozone Mapping Spectrophotometers (TOMS) have been used for the past 20 years in order to observe changes in ozone concentrations. These spectrophotometers are able to provide much larger-scale operations as they orbit the Earth
These instruments use the same principle as ground-based spectrophotometers, as they scan through the atmosphere and measure ozone concentration as a function of altitude and geographic position
They also can produce contour maps of total ozone concentrations over different areas of Earth’s surface

5. Human activity also impacts on waterways. Chemical monitoring and management assists in providing safe water for human use and to protect the habitats of other organisms
Identify that water quality can be determined by considering:
concentrations of common ions total dissolved solids hardness turbidity acidity dissolved oxygen and biochemical oxygen demand
Water quality can be determined by a number of factors, all of which are important in monitoring polluted water, and determining whether a water source is potableCONCENTRATION OF COMMON IONS
Potable water typically has low concentrations of common ions, whereas sea water has high ion concentrations
The table below shows the typical and maximum concentrations of common ions
Ions Concentration (Sydney water supply) (ppm)
Recommended maximum (ppm)
Chloride 20 400Sulfate 8 400Nitrate 0.4 10Fluoride 1 1.7Sodium 10 300Calcium 9 200Aluminium 0.2 0.2
The concentration of sodium (Na+) and chloride (Cl-) ions are important indicators of the salinity of a water system, and also affect the taste of water
Magnesium and calcium ions are indicators of water hardness => see below for more details Phosphate and nitrate ions need to be monitored to prevent eutrophication of a water
system => see below for more detailsTESTS
Qualitative tests include precipitation tests and flame tests Quantitative tests include gravimetric analysis, volumetric analysis (e.g. titration), and AAS
o Chloride levels can be measured by titrating the sample against silver nitrate, with potassium chromate as the indicator
TOTAL DISSOLVED SOLIDS Total dissolved solids (TDS) is the total mass of solids dissolved per unit volume of water,
generally reported as mgL-1 or ppm (equivalent units) => TDS mainly comprises dissolved salts
The recommended maximum TDS for potable water is 500ppm, though seawater naturally contains very high levels of TDS
TESTS TDS can be quantitatively measured by filtering a water sample to remove suspended solids,
then evaporating to dryness => this gravimetric method is liable to inaccuracies and is very laborious
As TDS is mainly composed of ionic salts, measuring the electrical conductivity of water provides field scientists a quick method of quantitatively measuring the TDS of a water sampleHARDNESS
The hardness of water refers to the levels of calcium (Ca2+) and magnesium (Mg2+) ions => hard water contains high levels of these divalent metal ions, whilst soft water contains low levels
Variations in hardness occur due to changes in the use of surrounding lands and the chemical composition of the soils (typically limestone)
Hardness is expressed as ppm or mg/L calcium carbonate. Most drinking water supplies average about 250ppm, and levels greater than 500ppm are undesirable
Hardness is an issue for water quality because calcium and magnesium ions react with soap to form an insoluble precipitate, which reduces the ability of soap to lather in hard water, and forms a grey scum that can stain fabrics
In addition, hard water creates scale deposits of CaCO3 and MgCO3 on sinks and bathtubsTESTS
Hardness can be tested qualitatively by shaking a test tube of a soapy water sample and observing for a grey scum
Hardness can be quantitatively tested by EDTA titration (see below) or AASTURBIDITY
Turbidity is a measure of the suspended solids in water, such as silt and clay, and is measured in NTU (nephelometric turbidity units)
Turbidity is caused by heavy rains, floods, land-clearing, and ploughing, all of which cause loose soil run-off into water systems
Turbid water gives an undesirable appearance to water, as well as an undesirable taste High levels of turbidity can affect the penetration of light through the water, which then
reduces the rate of photosynthesis and dissolved oxygenTESTS
Turbidity can be quantitatively measured by using a turbidity tube, which consists of a long measuring cylinder with marks on the bottom. Water is poured into the tube until the mark is no longer visible, and the height of water at which this occurs is the turbidity measure of the water sample
Turbidity can also be quantitatively measured using a spectrometer, which measures the extent to which suspended solids block the transmission of light through a water sampleACIDITY
The acidity of a water system can greatly affect the health of marine ecosystems, and highly acidic/alkaline water supplies are not potable
A pH outside the range of 6.5-8.5 indicates a source of pollution, such as fertiliser run-off, industrial waste, acidic run-off from a mining site, or sulfide contaminationTESTS
The acidity of water can be quantitatively measured using indicators, pH strips, or pH meters
DISSOLVED OXYGEN Dissolved oxygen (DO) refers to the levels of molecular oxygen (O2) that are dissolved in a
water sample at 25°C High levels of DO are required for high water quality, as aquatic life require it for respiration.
Low oxygen levels (below 5ppm) will cause many aquatic species to die
Quality Healthy Moderately polluted Severely polluted DeadDO (ppm), 25°C 6-8 4-6 2-4 <1
DO is affected by temperature, pressure, plants, animates, and salts, amongst other factors Aquatic plants increase dissolved oxygen by photosynthesis, thus turbidity also affects the
levels of DOTESTS
Dissolved oxygen can be measured using a chemical titration known as the Winkler methodo The first step involves the quantitative reaction between dissolved oxygen and Mn2+
ions in solutiono In the second step, acidified KI and molecular iodine is generatedo The amount of iodine generated is determined in the final step by iodometric
titration against standard sodium thiosulfate with starch indicatoro The Winkler method must be conducted at 25°C, with a water sample free of
sediments and air bubblesBIOCHEMICAL OXYGEN DEMAND
The biochemical oxygen demand (BOD) is a measure of the concentration of dissolved oxygen that by organic matter (particularly the complete breakdown of organic matter) in a water sample => it is measured in ppm
High levels of BOD indicate large amounts of organic matter in the water, which severely depletes DO due to the action of aerobic bacteria => the drop in DO can significantly affect aquatic life
Water system BOD (ppm)Unpolluted water 1-3Polluted water >5Domestic sewage (untreated) 350Abattoir effluent 2600Effluent from paper pulp factory 25 000 TESTS
Chemists measure BOD by the five day BOD test A sample’s BOD is measured at the beginning and end of a 5-day test period, where the
water sample is sealed in a darkened air-free container (to prevent photosynthesis) BOD=DO(initial)-DO(final)
o 5 days is usually sufficient for natural organic waste to be decomposed in non-polluted waterways

Identify factors that affect the concentrations of a range of ions in solution in natural bodies of water such as rivers and oceans
The concentration of a range of ions in natural bodies of water (such as rivers and oceans) is affected by a number of natural and artificial factors
The concentration of ions is of concern due to salinity, which can greatly affect both aquatic and land-based organisms
Factor EffectAgriculture Fertiliser run-off can increase the number of phosphate and nitrate
ions in bodies of water. BOD and turbidity also increase. Fertiliser run-off is typically acidic, which also increases TDS
Raw sewage Sewage discharge can increase the TDS of water of over 200 times, especially phosphate and nitrate ions
Land clearing The removal of vegetation can increase the number of dissolved solids and ions in water due to the high levels of mineral ions in soils (such as K+, Na+). Sulfide rocks can also be exposed to air due to land clearing, which oxidises in air to form sulfuric acid
Stormwater Run-off from urban areas can increase the concentration of a variety of ions
Industrial effluent Much of the waste from industry leads to increases in ion levels, particularly heavy metal ions (e.g. Hg+ and Cd2+)
Frequency of rainfall More frequent rainfall increases the run-off into streams and rivers, such as Ca2+ and Mg2+ ions
Soil type/minerals The composition of soil can affect the concentration of ions in waterways. Sulfate and chloride minerals are soluble in water. Limestone rocks are readily leached, leading to increases in Ca2+ ions
Water temperature Most minerals are more soluble in higher temperature waterRate of evaporation A higher rate of evaporation increases the concentration of ions.
For example, the Dead Sea has a very high TDS due to evaporationLocation of test site The concentration of ions is more likely to be lower further
downstream from a site near a source of pollution
Describe and assess the effectiveness of methods used to purify and sanitise mass water supplies
The four primary steps in purifying and sanitising mass water supplies are flocculation, sedimentation, filtration, and chlorination, though other steps are generally taken to purify waterMONITORING CATCHMENT
The catchment area is the area water flows from, and is monitored as a preventative measure to reduce the contamination of water supplies
This involves banning any land-clearing, industry or agriculture in the entire catchment area to prevent sediment, animal waste or bacteria to build up in water supplies
This is a very cheap and effective way of increasing the purity of water supplies by removing sources of contaminationSCREENING
Before the water from catchment areas enters the treatment plants, it is passed through a large filter screen to remove large debris such as fish, sticks, leaves, and trash, which may interfere with subsequent purification stepsAERATION
The water is sprayed into the air to increase the concentration of dissolved oxygen, and to oxidise iron and manganese salts to remove colour and odour, as they form insoluble oxides which are later removedFLOCCULATION
The pH of the water is increased to encourage the formation of precipitates => lime (Ca(OH)2) is commonly added to increase the pH
An electrolyte, such as alum (Al2(SO4)3) or iron(III) chloride (Fecl3) is then added as a coagulating agent. It forms a gelatinous precipitate of aluminium hydroxide or iron(III) hydroxide, which causes fine suspended solids to stick to the precipitateEffectiveness
Flocculation removes most of the suspended particles, as well as bacteria, which are caught up in the particle aggregates. It is very cost-effective, and relatively fastSEDIMENTATION
Water that has been flocculated is then allowed to settle in large tanks, which causes the dirt and other particles to fall to the bottom of the tank as a sludge, where it is removed
The clear water is then pumped to the filtration systemsEffectiveness
By using the natural force of gravity, sedimentation is a cheap, physical process to separate the sludge from clean water, but the slow speed of sedimentation reduces its effectiveness
Flocculation and sedimentation together are very effective, as they remove up to 99.9% of bacteria and 99% of viruses from water suppliesFILTRATION
After sedimentation, water is passed through a filter bed of sand, gravel, and anthracite coal, which have an effective pore size of around 100μm
o Anthracite coal absorbs organic matter and removes odours This removes nearly the rest of the particulate matter, as well as the material that did not
settle to the bottom of the sedimentation tankEffectiveness
Sand filtration removes a high proportion of the particulate matter that aggregated during flocculation, but extremely small particles are not removed (such as some bacteria and viruses)
Filtration is suitable for providing safe drinking water to urbanised areasCHLORINATION
The filtered water is then disinfected with chlorine gas to produce hypochlorite ions (OCl -) with a concentration of 1-2ppm
Hypochlorite ions are able to kill pathogens, such as bacteria and some virusesEffectiveness
Chlorination is an effective way of removing most pathogenic organisms, but is not as effective at killing viruses
Chlorine may also impart an unpleasant odourFLUORIDATION
Compounds containing fluoride ions, such as CaF2, NaF and Na2SiF6, are added to water in very small amounts (around 1ppm) to reduce tooth decay by hardening tooth enamelpH ADJUSTMENT
The pH of water is adjusted to achieve a pH of around 7 using hydrated lime, Na2CO3, or even HCl for very alkaline water
This prevents scaling and corrosion of pipes during distribution NOTE: When answering questions on purifying and sanitising mass water supplies, use
diagrams and flow charts where possible
Describe the design and composition of microscopic membrane filters and explain how they purify contaminated water
A microscopic membrane filter consists of a thin film of a synthetic polymer (such as polypropylene, polytetrafluoroethylene and polysulphone) throughout which there are small pores of uniform size.
Their primary purpose is to purify contaminated water by removing harmful micro-organisms as an alternative to large-scale chemical treatment of water, with the added advantage of being able to remove molecules of carbon compounds
Membrane filters can be used as screen filtering, though more commonly are wound into a cylindrical structure (as shown below)
The filters can be classified as microfiltration, ultra-filtration, or nano-filtration depending on the size of the pore. The smaller the pores, the more particles and impurities are removed, and the more expensive the filter is
Whilst microscopic membrane filters are used in some water treatment plants to purify water for industrial and domestic use, they are not used for Sydney’s water supply as they are too expensiveHOW THEY WORKCARTRIDGE FILTER
The diagram below shows the operation of a simple cartridge filter
The porous polymer sheets are folded or wound around a central rigid core to form a cartridge, and are held in place by the surrounding mesh
Gravity, vacuum, pressure pumps or centrifugal force is used to force the water across the membrane and the clean water is collected from inside the tube
The microscopic holes in the membrane are large enough to allow water molecules to pass through, but are too small for contaminants
Water under pressure is designed to flow across rather than through the microscopic membrane filters, which reduces blockage factorCAPILLARY MEMBRANE FILTER
The diagram below shows the operation of a capillary membrane filter
The porous membrane is made into hollow capillaries, with an outside diameter of about 200μm, and an inside diameter of 100μm
For each capillary, dirty water flows from the outside through the wall of the capillary, and clean water comes out of the inside
Large numbers of hollow capillaries are bundled together to make a filtering unit with a very large surface area, which enables the filtration of smaller particles at a faster rate
Capillary membrane filters can be easily cleaned by blowing air from the clean inside to dislodge trapped particles, which are then washed away by dirty water on the outsideADVANTAGES OF MEMBRANE FILTERS
Membrane filters out much smaller particles than paper or sand filters, as they filter out virtually all particles larger than their pore size
Microfiltration is able to remove larger pathogenic organisms (such as Giardia and Cryptospondium), some of which cannot be killed by chlorination, without the need to chemically treat water
Membrane filters are quite thin but reasonably strong, so liquids flow through them quite rapidly
Membrane filters can be easily cleaned by blowing air up the clean water tube, so they can be reused
Gather, process and present information on the range and chemistry of tests used to:
identify heavy metal pollution of water monitor possible eutrophication of waterways
HEAVY METAL IDENTIFICATION Heavy metals are elements with relatively high atomic mass, such as Hg, Cd, Cu, Pb, Zn, and
As. Heavy metal pollution needs to be monitored as these elements are generally poisonous to humans and other organismsPRECIPITATION TESTSSulfide precipitation test
Heavy metal pollution can be generally identified by a precipitation test with Na2S solution A water sample is acidified and a few drops of Na2S solution are added. The formation of a
precipitate indicates the presence of lead, silver, mercury, copper, cadmium and/or arsenic ions
The water sample is the made alkaline. If this produces a precipitate, then chromium, zinc, iron, nickel, cobalt, manganese and/or aluminium ions are presentSpecific precipitation tests
Whilst adding Na2S under various conditions can identify the presence of heavy metal ions, other precipitation tests are required to distinguish between ions
The flowchart below outlines the precipitation tests for common heavy metal ions
Flame test
The presence of heavy metal ions in a sample of water can be detected by dissolving the sample in methanol, igniting it , and observing the colour of the flameOther quantitative tests
AAS Gravimetric analysis Volumetric analysis (titration) Chromatography Colorimetry NOTE: AAS is the most appropriate method of detecting heavy metal ions, but discuss
precipitation methods if the concentration of ions is highMONITORING POSSIBLE EUTROPHICATION
Eutrophication is the enrichment of waterways with excessive nutrients, especially nitrate (NO3
-) and phosphate (PO43-) ions. This can lead to algal blooms and degradation of
waterways.o Eutrophication and algal blooms are not equivalent terms => eutrophication can lead
to algal blooms Eutrophication is most commonly caused by runoff from farms and sewage treatment
plants, both of which contain excessive concentrations of nitrogen and phosphorus nutrients Algal blooms can cause water to become unsuitable for normal uses
Detrimental effects of eutrophication and algal blooms Algal blooms can lead to a thick layer of algae and other organisms on the surface of the
water, which prevents sunlight from reaching marine plants. This deprives them of the UV light necessary for photosynthesis, which can damage marine ecosystems and lead to a decrease in DO
DO is also depleted by aerobic bacteria during the decay of algal blooms, which can suffocate marine life
The decaying algae also produces an unpleasant odour, which reduces its viability as a water source
The waste products of decaying algae are acidic, which reduces the pH of the water Cyanobacteria, if present, produce certain poisons that can kill livestock and cause serious
illness in humansManagement of eutrophication
The EPA recommends the following N:P ratio and nutrient levels in waterwayso N:P ratio > 10:1o Nitrogen level = 0.1-1ppmo Phosphorous level = 0.01-0.1ppm
These levels are closely monitored to prevent the eutrophication of waterways Management of the N:P ratio involves controlling natural sources, such as water run-off and
animal wastes, and human sources, such as sewage, fertiliser, detergents, and land clearingo For example, the introduction of legislation limiting the levels of phosphates in
detergents and fertilisers has been successful at reducing eutrophication Eutrophication can also be controlled by treating input water at sewage treatment plants
with aluminium sulfate, as phosphates are precipitated out as aluminium phosphateChemical tests
As phosphorous is generally the limiting nutrient in the growth of algal blooms, monitoring eutrophication generally involves measuring the concentration of phosphate ions in a water sample
Phosphorous levels can be measured by using a colorimetric methodo Oxidise all phosphorous compounds to phosphate ions, and add molybdate ions
(MoO42-) and ascorbic acid.
o Phosphate ions form a blue complex with molybdate ions, so the concentration of phosphate ions by measuring the intensity of light passing through the solution relative to standard solutions (the intensity of the blue complex is proportional to the concentration of phosphate)
Nitrate levels can be monitored with the following testso Brown ring test: Add a few drops of FeSO4 and concentrated H2SO4 to a test tube
containing the water sample. The formation of a brown ring at the junction indicates the presence of nitrate ions
o Kjeldahl method: Convert the organic nitrogen in the sample to aqueous ammonia, then perform a titration with H2SO4 to calculate the concentration of nitrates in the original sample
Eutrophication can also be monitored by measuring the level of DO using the Winkler method (see above)
Gather, process and present information on the features of the local town water supply in terms of:
catchment area possible sources of contamination in this catchment chemical tests available to determine levels and types of contaminants physical and chemical processes used to purify water chemical additives in the water and the reasons for the presence of these
additivesCATCHMENT AREA
A catchment area is an area from which water is drained by the natural landscape towards a common body
Sydney’s catchment area includes the Warragamba, Upper Nepean, Woronora, Shoalhaven, and Blue Mountains catchment, comprising 16 000km2
o Sydney’s main storage dam is Warragamba, which provides up to 80% of Sydney’s water needs from a catchment area of 9 050km2
POSSIBLE SOURCES OF CONTAMINATION
Source ContaminationLand clearing Logging an land-clearing activities can lead to increased turbidity and
TDS in the water flowing to the damAgriculture Crop growing and livestock grazing along creeks and rivers in the
catchment area can lead to run-off containing high levels of phosphates and nitrates, which can lead to eutrophication. Animal faeces can lead to increased growth in bacteria, such as E. Coli, Giardia, and Cryptosporidium, as well has a high BOD and increased acidity.

Pesticides can also contaminate the catchment areaMining Active or abandoned mines, such as copper and zinc mines, can leach
out heavy metal pollutants, as well as sulfides from metal ores, which can increase the acidity of water
Treated/untreated effluent
Sewage treatment plants located along the rivers of catchment areas can increase BOD and levels of nitrates and phosphates. Raw sewage discharge can also lead to the contamination of the water with bacteria
Natural soil Rain water can leach out various minerals, such as Fe3+ and Mn2+ ions, which can cause water to have a coloured tinge and a metallic taste
Local wildlife Native and feral animals may lead to serious contamination of the water with pathogens with their faeces or by dying and decaying in the water
NOTE: If these sources of contamination are located far enough upstream, the contamination of the water at the dam is significantly lessTESTING FOR CONTAMINANTS
Water is tested for contaminants to ensure optimal colour, taste, odour, pH, conductivity, turbidity, hardness, dissolved oxygen, and TDS
Most chemical tests are used to detect the levels of common ions (particularly nutrient ions), and ensure that they remain below safe thresholds
Tests are conducted at a range of sites as contaminations may be localised
Issue TestHeavy metal ions
Sulfide precipitation, AAS, chromatography
PO43-/NO3
- Precipitation, molybdenum colorimetry, Kjeldahl method, brown ring testTurbidity Turbidity tube, secchi diskMicrobe levels A sample is placed on a nutrient bed and incubated 12-24 hours. The
number of colonies is counted and expressed as CFU/100mLColour, taste, odour (physical)
Physical testing, colorimetry
Hardness Titration, AASAcidity Universal indicator, pH probeTDS Comparing conductivity of water sample to distilled water, evaporation
followed by weighingDO/BOD Winkler method, titration, electrolysis method (oxygen probe)Pathogens Tested twice a week, particularly for Giardia and Cryptosporidium
PURIFICATION OF WATERPhysical processes
Screening out large debris Flocculation to increase particle size Sedimentation to remove larger suspended particles Filtration to remove finer suspended particles
Chemical processes
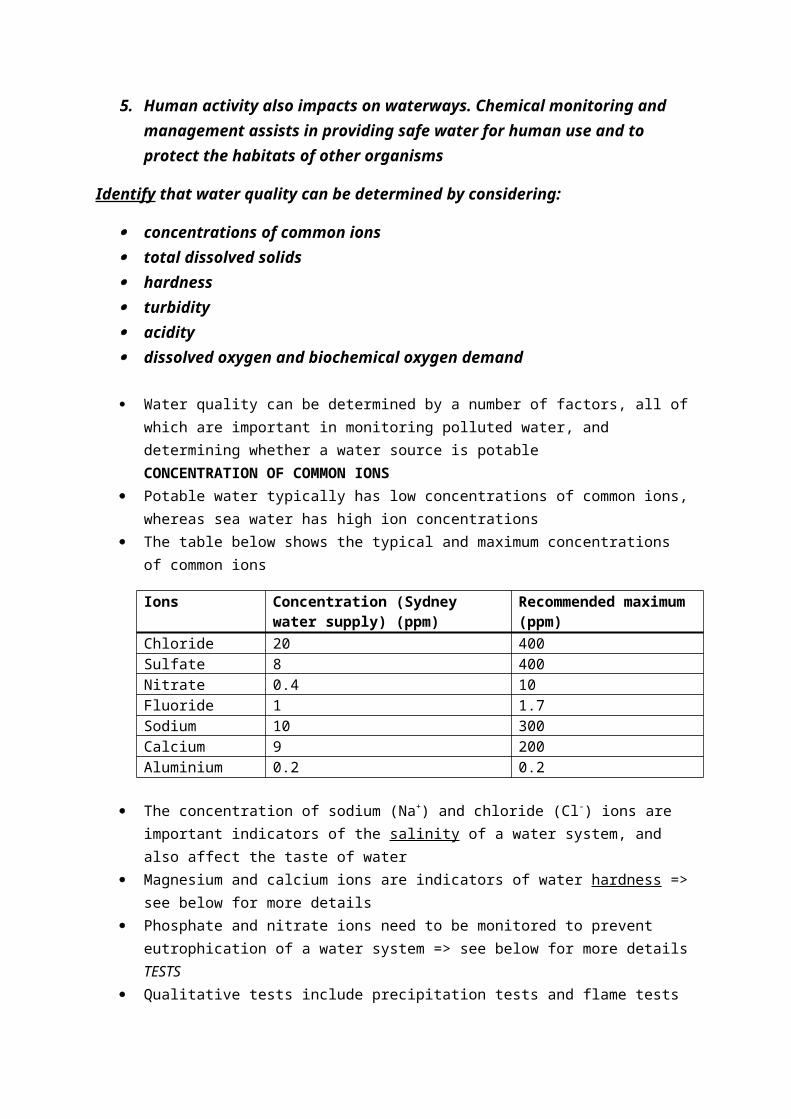
Aeration to oxidise soluble iron and manganese salts to insoluble compounds
Lime softening to precipitate out high levels of calcium and magnesium ions
Addition of FeCl3 to precipitate out phosphate ions in the coagulation tank
pH adjustment post-treatment Addition of chlorine and ammonia to kill microbes Addition of fluorine to assist in tooth decay prevention
CHEMICAL ADDITIVESChlorine
Chlorine is added to sanitise and disinfect the water by killing pathogens and coliforms, and preventing their regrowth in the pipelines
Chlorine is added as either liquid sodium hypochlorite (NaOCl) or chlorine gas (Cl2) bubbled through
Hypochlorite ions (OCl-) are formed, which sanitise the water by killing bacteria and viruses Ammonia is sometimes added to form chloramine ions, which last longer in the pipe
network as they are less reactive than hypochlorite ionsFluorine
Fluorine is added in the form of NaF in small amounts (around 1ppm) Fluoride ions are added to help reduce tooth decay by hardening tooth enamel
Calcium hydroxide (lime) Calcium hydroxide or limewater (Ca(OH)2) is added to improve the quality of water by raising
the pH to 7.5 to 8 Limewater also increases the water’s buffering capacity, resisting changes in pH Carbon dioxide can also be added to react with the lime to form Ca(HCO3)2, which buffers
the water, increases hardness, and reduces the overall corrosive nature of waterPre-oxidant (KMnO4)
Pre-oxidants, such as KMnO4, are sometimes added in small amounts, as they oxidise dissolved metals, such as iron, manganese and aluminium. These metals then precipitate out of the water, which allows them to be easily removed by the filtration processOther additives
Sulfuric acid is added to break down any colour caused by organic matter, and to lower the pH to aid coagulation
Chlorine dioxide may be used to decompose suspended organic matter Calcium chloride removes excess fluorides
Perform first-hand investigations to use qualitative and quantitative tests to analyse and compare the quality of water samples
Water samples were taken from the local Macquarie Creek, and using a ‘StreamWatch’ kit many of the water quality tests were performed onsite. Small water samples were taken for further testing in the laboratory
All tests were tested against distilled water, which acted as a controlQUALITATIVE TESTS

POLLUTANTS (qualitative) The water sample was checked for any sort of colouration => any colour indicated the
presence of a form of pollution, whilst any rainbow streaks indicted the presence of hydrocarbons
The water was smelt to detect any odours A bottle was half-filled with the sample, and another bottle was half-filled with distilled
water. Both bottles were shaken for equal periods of time, and the relative length of time it took for the bubbles to disappear was observed => if the bubbles remained longer on the sample, this indicated the presence of detergentsHEAVY METALS
1mL of sodium sulfide (Na2S) was added in a 5mL sample of water => any precipitate indicated the presence of a heavy metalQUANTITATIVE TESTSTEMPERATURE
A thermometer was placed directly into the stream, and the temperature of the water was recordedACIDITY
The pH of the water sample was measured with a pH probe, and was compared to the pH of distilled water => the sample had a pH of 7.5, whilst the distilled water had a pH of 7.0TURBIDITY
The sample water was poured into a turbidity tube until the markings at the bottom of the tube disappeared. This was compared to a sample of distilled water, which had a turbidity of <10NTUTDS
The total dissolved solids was measured using an electrical conductivity meter => the sample water had only slightly more ions than the distilled waterDO/BOD
The levels of DO was measured by using the Winkler method (see above), which involved a titration. The DO value was compared to the reading from a oxygen sensing meter, which also measured the DO of the distilled water sample
BOD was measured by using the oxygen sensing meter to determine the DO of the water sample initially, and then the water sample was placed in a blackend container. After five days, the DO was measured again, and BOD=DO(initial)-DO(final)HARDNESS
To test for water hardness, a titration was conducted A 25mL of a water sample was titrated against a solution of EDTA (Na2EDTA), which is a
polydentate (six bonding locations) ligand that reacts with calcium ions in a 1:1 ratio
The water sample was then diluted by adding 75mL of deionised water 15mL of an ammonia-ammonium chloride buffer (pH=10) was added to the water sample, as
stable EDTA complexes are only produced at a high pH The indicator used was Eriochrome Black T, which changes from a red-violet colour (due to
bonding with Ca2+ and Mg2+ ions) to a permanent blue colour when the endpoint has been reached, as all the Ca2+ and Mg2+ ions have reacted

The value obtained by titration may be inaccurate due to the presence of other metal ions in the solution, particularly Mg2+ ions => use AAS for a more accurate concentration of Ca2+
See notes on titration for the proper method of conducting titrationsCHLORIDE IONS
The test for chloride ions involves a titration of the water sample with AgNO3
The pH of the water sample was adjusted either by adding 0.1M Na2CO3 or 0.1M ethanoic acid so that the sample had a pH of 8.0-8.2
5mL of potassium chromate solution (K2CrO4) was added to a 25mL water sample in a conical flask, whilst AgNO3 was poured into a burette
A titration was conducted, and the endpoint was reached when the first reddish-brown colour appeared