eprints.lincoln.ac.ukeprints.lincoln.ac.uk/25226/1/flashpaperreviewed3.docx · web viewdata were...
TRANSCRIPT

Visual Discomfort from Flash Afterimages of Riloid Patterns
Louise O'Hare
In preparation for Perception
Abstract
Op-art-based stimuli have been shown to be uncomfortable, possibly due to a combination
of fixational eye movements (microsaccades) and excessive cortical responses. Efforts have
been made to measure illusory phenomena arising from these stimuli in the absence of
microsaccades, but there has been no attempt thus far to decouple the effects of the
cortical response from the effect of fixational eye movements. This study uses flash
afterimages to stablise the image on the retina and thus reduce the systematic effect of
eye movements, in order to investigate the role of the brain in discomfort from op-art-
based stimuli. There was a relationship between spatial frequency and the magnitude of the
P300 response, showing a similar pattern to that of discomfort judgements, which suggests
there might be a role of discomfort and excessive neural responses independently from the
effects of microsaccades.
1. Introduction
Op-art is a genre of art that includes works that produce illusory effects of motion,
shimmering, and discomfort in the observer (Fernandez and Wilkins, 2008), for example,
Bridget Riley’s “Fall”, which typically uses geometric patterns such as gratings to achieve

these somatic effects in the observer. Illusory motion and shimmering are included amongst
other sensations, such as headache, eyestrain and diplopia, under the more general term
visual discomfort (Wilkins et al., 1984; Wilkins and Evans, 2001). Visual discomfort is not
specific to op-art, but can be elicited by gratings (Wilkins et al., 1984; Wilkins and Evans,
2001), filtered noise images (Fernandez and Wilkins, 2008; Juricevic et al., 2010; O'Hare and
Hibbard, 2011) and blurred stimuli (O'Hare and Hibbard, 2013).
Work by Zanker (Zanker et al., 2003; Zanker et al., 2004; Zanker et al., 2010) and
colleagues used wavy striped patterns based on Bridget Riley's artwork "Fall" to
investigate illusions of motion. Fixational eye movements called microsaccades have been
reported to have a role in causing visual distortions such as illusory motion from op-art-
based experimental stimuli (e.g. Zanker et al., 2003; Zanker et al., 2004; Zanker et al., 2010).
The influence of microsaccades on reported illusions of motion has been demonstrated in
geometric patterns such as MacKay lines (MacKay, 1957), the Enigma illusion (Kumar and
Glaser, 2006; Troncoso et al., 2008) and other artworks and illusions (Wade, 2003; Gori and
Hamburger, 2006; Gori and Yazdanbakhsh, 2008; Gori et al., 2011). However, fixational eye
movements are not the only possible cause of discomfort from geometric patterns. It has
also been argued that there is a role of neural responses in discomfort judgements (Juricevic
et al., 2010; Hibbard and O'Hare, 2015; Pennachio et al., 2015). Theoretical models have
shown that discomfort might arise as the statistical properties of uncomfortable images do
not allow them to be processed as efficiently as natural images, with uncomfortable stimuli
resulting in greater responses compared to comfortable stimuli (Hibbard and O'Hare, 2015;
Pennachio et al., 2015). Model results have also shown similar (n-shaped) spatial frequency
tuning for spatial frequency (Hibbard and O'Hare, 2015; Pennachio et al., 2015) as tends to

be found for discomfort judgements (Wilkins et al., 1984): a peak at mid-range spatial
frequencies compared to higher and lower spatial frequencies.
There is some experimental evidence showing greater responses for uncomfortable grating
stimuli using methods such as fMRI (Huang et al., 2011), near-infrared spectroscopy (NIRS)
(Haigh et al., 2013; Haigh et al., 2015) and EEG (O’Hare et al., 2015). Huang et al., (2011)
demonstrated the size of the fMRI BOLD response to black and white gratings was
dependent on spatial frequency of gratings, with the maximum BOLD response to midrange
(1.2cpd) spatial frequency stimuli. Additionally, Huang et al., (2011) showed that compared
to control groups, those with migraine showed increased BOLD fMRI responses to black and
white gratings. This is important as migraine groups report increased discomfort from
gratings compared to controls (Marcus and Soso, 1989). O'Hare et al., (2015) demonstrated
a possible contribution of brain responses to visual discomfort from op-art-based stimuli,
again showing an effect of spatial frequency on both discomfort judgements and also
magnitude of the visual evoked potentials (VEP): Those stimuli judged more comfortable
were also those with decreased VEP responses. In the study by O’Hare et al., (2015) the VEP
component of interest was the P100 response, a positive wave around 100ms after stimulus
onset, which was recorded over the early visual cortex. This P100 component occurs
during the time interval when microsaccades are suppressed - microsaccades are
suppressed during the 100-150ms time after stimulus onset (Dimigen et al., 2009). However,
this is a weak argument to separate the effects of microsaccades and VEP responses:
microsaccades and discomfort judgements are difficult to separate, as any microsaccades
made during the presentation of the stimuli would have had an effect on its appearance,
and therefore potentially contributed to the discomfort judgements. A more convincing
argument could be made by using viewing conditions that reduce the effect of eye
movements, in order to separate the effects of microsaccades and neural responses: By
using flash afterimages to stabilise the image on the retina, the effects of microsaccades
on discomfort judgements should be reduced, as any microsaccades made will not change
the appearance of the stimuli.
Zanker et al., (2003) used “riloid” stimuli based on Bridget Riley's work "Fall" to study the
role of eye movements on illusions of motion. These are black and white wavy, striped
patterns. There are conditions which reduce the systematic effect of eye movements on
the retinal image. Wade (1977) noted several techniques for attempting this, e.g. contact
lenses, apertures and afterimages. Using very brief stimulation to create an afterimage
will have the effect of stabilising the image on the retina for a brief time, called a flash
afterimage. It is important to note that this technique will not eliminate eye movements,
but the observer's retinal image will no longer change systematically with the eye
movements. Zanker et al., (2003) used both flash afterimages and viewing through a
pinhole aperture to reduce the effect of eye movements and accommodation on the
perception of motion. Zanker et al., (2003) noted that although motion illusion strength
was diminished on viewing the patterns under either of these conditions, illusions of
shimmering were still reported by observers under these viewing conditions. This suggests
that illusions arising from these stimuli are not completely accounted for by eye
movements. Illusory distortions in afterimages of gratings have been reported, thought to
be due to inhibitory processes within and between cortical columns specific for spatial
frequency and orientation (Georgeson, 1976). In this study, observers viewed a stimulus for
around a minute, in order to create an afterimage, and recorded the duration and type of

illusory effects. The type and duration of the illusory effects were found to be dependent on
spatial frequency, with afterimages from 10cpd stimuli lasting longest compared to lower
and higher spatial frequencies. Overall, this suggests that illusory motion persists under
conditions that reduce the effect of eye movements, and this might therefore have a
cortical origin.
By using flash afterimages it should be possible to demonstrate effects of op-art based
stimuli that are unrelated to microsaccades, and originate in the visual cortex. If the
illusions from these stabilised images are indeed a cortical level phenomenon then it should
be possible to see this in the relative magnitude of the VEP responses to the flash
afterimage of the different riloid stimuli. The quality of the afterimages themselves are
not the main focus of the study, but represent a method to stabilise the image on the
retina. It is expected that the midrange spatial frequency stimuli will show the greatest VEP
response from flash afterimages of riloid stimuli as the midrange spatial frequencies of
gratings tend to be judged as most uncomfortable (Wilkins et al., 1984). Following the work
of Zanker et al., (2003), line waviness effects on discomfort are thought to be due to the
influence of microsaccades (Patzwahl and Zanker, 2000), therefore this manipulation is
not expected to heavily influence discomfort judgements in the current experiment.
Components of interest are P100 and P300. P100 is of interest because it is one of the
earliest responses to visual stimuli (di Russo et al., 2001), and this was the component of
interest in previous research (O’Hare et al., 2015). In addition, P300 is of interest as it is
associated with evaluative judgements. For example, there are differences in the ERP
response around 300ms after stimulus presentation for stimuli considered aesthetically
pleasing compared to those considered less aesthetically pleasing, including Chinese

characters (Li et al., 2015), abstract patterns (Höfel and Jacobsen, 2007) and geometric
patterns and artwork (de Tommaso et al., 2008). As P300 response is implicated in
judgements of beauty and aesthetics, it might be of interest in the current experiment, as
although aesthetics and discomfort are not simply opposite effects (Juricevic et al., 2010),
aesthetics might be related to discomfort.
Another limitation of previous work (O’Hare et al., 2015) was that recording sites were
restricted to those located over early visual areas only. Although EEG does not have good
spatial resolution, there might be some difference between responses from electrodes
recording over different parts of the visual system. Of interest in the current experiment are
the early cortical responses, such as primary visual cortex (V1). This might be inferred from
the response from electrodes O1 and O2, which are located approximately over this area
(e.g. Wijeakumar et al., 2012). Of interest also are the later visual areas, such as the
extrastriate areas, whose activity might be inferred from later electrodes such as PO3 and
PO4 (Brooks, 2005). Finally, the lateral occipital complex (LOC), inferred from the response
of electrodes PO7 and PO8 (Bertamini and Makin, 2014) is of potential interest.
2. Method
2.1 Observers
25 young, naïve observers with normal or corrected-to-normal vision took part in the
experiment. Specific age was not recorded but observers were all over 18 but under 35
years of age. None of the observers suffered from photosensitive epilepsy or from migraine.
All experiments were in accordance with the Declaration of Helsinki (2008). Participants
were reimbursed for their time.
2.2 Apparatus
EEG recordings were taken using a 64-channel Biosemi Active two system. A 10/20 cap
labelling system was used to place the electrodes. An electrode gel was used to keep
impedance to a minimum. There were eight additional facial electrodes: Two on the outer
canthi, two superorbital, two infraorbital, and two on the mastoids. Channels were
referenced during recording to a common-mode-sense electrode. Data were filtered 0.16Hz
as the low cut-off frequency, and 100Hz for the high cut-off filters. Data were initially
recorded at a sampling rate of 2048Hz, but resampled offline to a rate of 256Hz.
Stimuli were presented using an MSI computer, model MS-7788 with an i7-3990CPU Intel
processor and a dedicated NVida GeForce GTX 650 graphics card, running 64-bit Windows 7
operating system. A 22-inch CRT display was used (Illyama HM204DTA Vision Master Pro
514 Diamondtron U3-CRT), which was calibrated with a LS100 Minolta photometer. Screen
resolution was 1024 x 786 pixels, with a 60Hz refresh rate. Minimum luminance of the
display was 0.93cd/m2, and maximum luminance was 100.69cd/m2. All stimuli were
generated and presented using MATLAB and the Psychtoolbox (Brainard, 1997, Pelli, 1997,
Kleiner, 2007).
2.3 Stimuli
There were nine riloid stimuli, with three levels of line waviness (μ) and three levels of
spatial frequency (λ), see equation 1:

I ( x , y )=0.5(1+sin2 π x−ϕ ( y )λ )
Where: I(x,y) is the luminance of position x and y, λ is the spatial frequency of the grating.
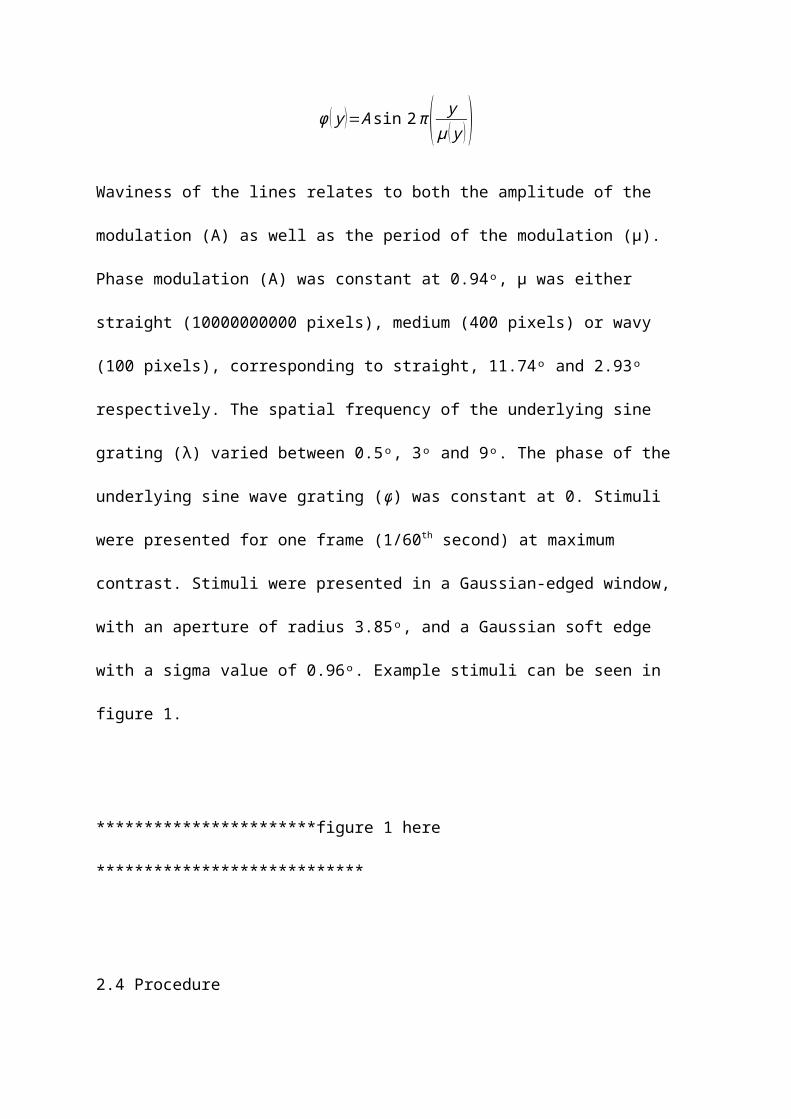
ϕ ( y )=A sin 2 π ( yμ ( y ) )
Waviness of the lines relates to both the amplitude of the modulation (A) as well as the
period of the modulation (μ). Phase modulation (A) was constant at 0.94ᵒ, μ was either
straight (10000000000 pixels), medium (400 pixels) or wavy (100 pixels), corresponding to
straight, 11.74ᵒ and 2.93ᵒ respectively. The spatial frequency of the underlying sine grating
(λ) varied between 0.5ᵒ, 3ᵒ and 9ᵒ. The phase of the underlying sine wave grating (ϕ) was
constant at 0. Stimuli were presented for one frame (1/60th second) at maximum contrast.
Stimuli were presented in a Gaussian-edged window, with an aperture of radius 3.85ᵒ, and a
Gaussian soft edge with a sigma value of 0.96ᵒ. Example stimuli can be seen in figure 1.
***********************figure 1 here ****************************
2.4 Procedure
Observers were seated in a dimly lit, electrically insulated, sound attenuated room, at a
distance 50cm from the display. There was a chinrest to stabilise head movements.
Observers were asked to keep their head and eye movements to as minimum, and to stare
at the fixation cross and to avoid blinking if possible. The fixation cross was mid-grey and
0.38ᵒ in diameter. There was a randomly varying onset time of 1-2 seconds before stimulus
presentation to prevent observers orienting to stimulus onset (Parker et al., 1982). Stimuli
were presented for one frame only (1/60th second), at maximum contrast of the display, in
random order. The order was randomised for each observer. Pilot testing during software
development was used to check that these display conditions were sufficient to evoke a
flash afterimage. After 1 second, the observer was prompted to press the space bar to
advance, and then text was displayed to prompt the observer to judge the image for
discomfort. The observer was asked to rate the stimulus for discomfort, using as much of
the 0-99 scale as they felt they needed. There was no time limit to make this judgement.
There were 50 repetitions of each of the nine stimuli, resulting in 450 trials in total.
2.5 Analysis
Data were analysed using Brain Vision Analyser. Data were analysed first by filtering using a
Butterworth filter 12dB/octave, with a time constant of 1.5915 seconds, band-pass between
0.1 and 70Hz, with a notch filter at 50Hz to remove line noise. Signals were re-referenced to
the average of all channels, with the exclusion of the facial electrodes. Signals were then
divided into epochs of 1 second after stimulus onset, with a 200ms prestimulus baseline
removed from each epoch. A Gratton-Coles (1983) procedure was used for eye movement
correction. The Gratton-Coles (1983) procedure calculates the variability related to the
stimulus (event related potential) in the EOG and EEG channels for each trial individually.
The variability related to the stimulus is then removed from all channels (including the
EOG). The relationship between the EOG and EEG channels is described using a
"propagation factor", and this process is completed for saccades and blinks separately.
The technique is claimed to enable researchers to include trials that are corrected for eye
movement artefacts in subsequent analysis, rather than excluding them (Gratton et al.,
1983). The horizontal electro-oculogram (HEOG) channel was calculated by taking the
signals from the facial electrode recording at the left outer canthus (EXG3), referenced to
channel FP1. The vertical electro-oculogram (VEOG) channel was defined by referencing the
signal from the left infraorbital channel (EXG5) to channel FP1. Artefacts were then rejected
using an automatic threshold procedure: epochs with signals exceeding the range -/+ 100μV
were rejected from analysis. Finally, signals were exported to MATLAB for further analysis
and plotting. Statistical analysis was using SPSS, and corrections for violations of Mauchly’s
test of sphericity were using Greenhouse-Geissler adjustment to the degrees of freedom. P-
values were adjusted to reflect multiple comparisons for post-hoc paired comparisons.
Further statistical analysis was conducted using the LME4 function (Bates et al., 2015) in the
package R.
3. Results
3.1 Average discomfort judgements
Discomfort judgements are shown in figure 2. There is significant effect of spatial frequency
(F(1.21, 27.72) = 7.655, p < 0.05), and of line waviness (F(1.15,26.49) = 8.622, p < 0.05). There was a
significant interaction effect (F(2.15,49.42) = 3.784, p < 0.05). Averaged over spatial frequency,
Bonferroni-corrected post-hoc repeated-measures t-tests showed waviest lines were
judged to be more uncomfortable than both medium wavy lines (t(23) = 2.902, p < 0.0167),
and straight lines (t(23) = 3.098, p < 0.0167). There was no difference in discomfort between
medium wavy and straight lines (t(23) = 0.803, p = 0.430). Post-hoc comparisons averaged
over line waviness showed 0.5cpd stimuli to be more uncomfortable than both 3cpd (t(23) =

2.609, p < 0.0167), and 9cpd (t(23) = 2.913, p < 0.0167). There was no significant difference
between 3 and 9cpd (t(23) = 2.397, p = 0.025), when corrected for multiple comparisons.
****************************figure 2 here **************************
3.2 Event-Related Potentials
3.21 Medial Occipital Areas – Channels O1 and O2
Channels O1 and O2 were pooled by averaging. It is thought that these electrodes form the
basis of the response from the early visual areas, in particular the striate cortex
(Wijeakumar et al., 2012). The waveform of the average signal from the pooled electrodes
O1 and O2 is plotted in figure 3. This shows the response from 200ms before stimulus onset
(at time 0) to 1000ms afterwards. From this it can be seen that there is a peak around
100ms after stimulus onset. There is a second peak after 200ms, seen most clearly for the
low spatial frequency stripes. The timecourses for each trial were averaged together for a
stimulus, to obtain an average response for each observer over all trials for that stimulus.
The P100 response is defined as the peak amplitude in the 90-110ms post-stimulus time
period, and the P300 response as the peak amplitude in the time period 250-350ms after
stimulus onset.
****************figure 3 here **********************
The P100 response is plotted on the left hand side of figure 4. There is no significant effect
of line waviness (F(2,46) = 3.192, p = 0.050), although this is a trend approaching significance.
There is no interaction between line waviness and spatial frequency (F(1.58,36.24) = 0.732, p =
0.573). There was a main effect of spatial frequency (F(2,46) = 4.227, p < 0.05). Bonferroni-
corrected repeated-measures post-hoc t-tests showed there to be a significant difference
between low and high spatial frequencies only (t(23) = -2.695, p < 0.0167), with higher spatial
frequencies showing a greater response compared to low spatial frequencies. There was no
significant difference between low and midrange spatial frequencies (t(23) = -1.887, p =
0.072), and no significant difference between midrange and high spatial frequencies (t(23) = -
1.133, p = 0.269).
*********************figure 4 here ***********************
The P300 response is shown on the right hand side of figure 4. There is a main effect of line
waviness (F(1.26,29.06) = 4.234, p < 0.05) and also of spatial frequency (F(2,46) = 6.383, p < 0.05).
There was no interaction between line waviness and spatial frequency (F(1.48, 33.99) = 2.281, p =
0.130). Averaged over spatial frequency, none of the repeated measures post-hoc t-tests
survived correction for multiple comparisons: between waviest and medium wavy stripes
(t(23) = 2.214, p = 0.037), between waviest and straight lines (t(23) = 2.049, p = 0.052), between
medium wavy and straight lines (t(23) = -0.644, p = 0.526). Averaged over line waviness,
Bonferroni-corrected repeated-measures post-hoc t-tests showed there was a significant
difference between midrange and high spatial frequencies only (t(23) = 3.597, p < 0.0167),
showing that the high spatial frequencies had lower VEP response amplitude compared to
midrange spatial frequencies. Comparisons between low and midrange (t(23) = -1.867, p =
0.075) and between low and high spatial frequencies (t(23) = 1.732, p = 0.097) were not
statistically significant.
3.22 Parieto-Occipital Visual Areas – Channels PO3 and PO4
Figure 5 shows the average timecourse for pooled PO3 and PO4 responses, which are
thought to be located approximately over the extrastriate cortex (Brooks, 2005). This shows
again a peak around 100ms, and also a second peak between 200-400ms, which is
pronounced for the low spatial frequency stimuli. The left hand side of figure 5 shows the
average response of the P100 component against spatial frequency for three levels of line
waviness. There is a significant main effect of line waviness only (F(2,46) = 5.487, p < 0.05).
There was no effect of spatial frequency (F(2,46) = 0.263, p = 0.770) and no interaction effect
(F(1.33,30.63) = 0.118, p = 0.976). Averaged over spatial frequency, Bonferroni-corrected post-
hoc t-tests showed waviest lines had higher response amplitude compared to medium
wavy lines (t(23) = 2.791, p < 0.0167), but there was no significant difference between
waviest and straight lines (t(23) = 2.269, p = 0.033) and no significant difference between
medium wavy and straight lines (t(23) = -1.254, p = 0.223) when corrected for multiple
comparisons.
***********************figure 5 here *********
The right hand side of figure 6 shows the average P300 response plotted against spatial
frequency for three levels of line waviness. There is a significant main effect of spatial
frequency (F(2,46) = 12.262, p < 0.05). There is no effect of line waviness (F(1.11,25.53) = 3.247, p =
0.080), and no interaction effect (F(1.42,32.68) = 1.891, p = 0.176). Averaged over line waviness,
repeated-measures Bonferroni-corrected post-hoc t-tests showed there was a significant
difference between low and high spatial frequencies (t(23) = 4.741, p < 0.0167), and also
between midrange and high spatial frequencies (t(23) = 3.717, p < 0.0167), showing that the
response to high spatial frequency stimuli was lower than the response to other spatial
frequencies. The difference between low and midrange spatial frequencies was not
significant (t(23) = 0.893, p = 0.381).
*******************figure 6 here *******************
3.23 Lateral Parietal-Occipital Areas – Channels PO7 and PO8
Figure 7 shows the time-series for the pooled PO7 and PO8 responses, thought to represent
the response from the lateral occipital complex (LOC) (e.g. Bertamini and Makin, 2014).
Again, this shows a peak around 100ms and also a peak after 200ms from stimulus onset,
which is more pronounced for the low spatial frequency stimuli. The average response of
the P100 is shown on the left hand side of figure 8. There is a significant main effect of line
waviness (F(2,46) = 5.956, p < 0.05), but not of spatial frequency (F(2,46) = 1.130, p = 0.332), and
there was no interaction effect (F(1.39,32.03) = 0.126, p = 0.973). Averaged over spatial
frequency there was a significant difference between waviest and medium wavy lines (t(23) =
2.995, p < 0.0167), where the waviest showed greater amplitude than medium wavy lines.
There was no significant difference between the waviest and straight lines (t(23) = 2.463, p
= 0.022), and no significant difference between medium wavy and straight lines (t(23) = -
0.969, p = 0.342).
***************figure 7 here ******************
The right hand side of figure 8 shows average P300 response against spatial frequency for
three levels of line waviness. There is a significant main effect of spatial frequency (F(2,46) =
5.132, p < 0.05), but not of line waviness (F(1.30,29.89) = 1.434, 0.248) and no interaction effect
(F(1.39,32.16) = 0.927, p = 0.452). Averaged over line waviness, there is a significant difference
between low and high spatial frequencies (t(23) = 2.774, p < 0.0167), and between midrange
and high spatial frequencies (t(23) = 2.883, p < 0.0167), showing that there is a lower
response amplitude to high spatial frequencies compared to the other stimuli. There was
no significant difference between low and midrange spatial frequencies (t(23) = 0.439, p =
0.665).
***********************figure 8 here **************************

3.24 Summary of ERP data
There is a significant effect of spatial frequency for the early visual areas in the P100
response with the highest spatial frequencies showing the greatest response amplitude.
For the more medial visual areas (electrodes PO3 and PO4) and for recording sites over
the lateral occipital cortex (electrodes PO7 and PO8) the P100 responses shows an effect
of line waviness only, with the waviest lines showing a greater response compared to the
other two conditions.
There is a significant effect of line waviness in the P300 response over early visual areas,
with the waviest lines showing the greatest response amplitude. For the P300 response,
all three electrode sites (early, O1 and O2; medial, PO3 and PO4; and lateral PO7 and PO8)
show a spatial frequency tuning effect, with the smallest response amplitude from the
high spatial frequency stimuli.
3.3 Relationship to VEP response
If the cortex contributes to discomfort judgements then there should be a relationship
between peak VEP response and discomfort judgements. Discomfort is plotted against
P100 on the left hand side of figure 9, discomfort against P300 on the right hand side of
figure 9. Each stimulus type is represented by a different colour. In order to investigate
whether there is any relationship, a mixed effects linear model was used to see if this was
the case. Both the P100 and P300 VEP responses were averaged over all recording sites. A
mixed effects linear model was defined with spatial frequency, line waviness and P100
amplitude as fixed effects, and observer as a random variable. This was compared to a null
model without the P100 response. There was a significant relationship between
discomfort judgements and P100 response (χ2 (1) = 5.740, p< 0.05), with P100 decreasing
discomfort by 1.021, ± 0.424 standard error. To investigate P300, a mixed effects linear
model was defined with spatial frequency, line waviness and P300 amplitude as fixed
effects, and observer as a random variable, and this was again compared to a null model
without the P300 response. There was a significant relationship between discomfort
judgements and P300 response (χ2 (1) = 7.853, p< 0.05). P300 increased discomfort
judgements by 0.947, ± 0.328 standard error.
4. Discussion
The aim of the study was to investigate the effects of uncomfortable stimuli on ERP
responses without the confounding variable of microsaccades; although it is not possible to
eliminate eye movements, using a flash afterimage should decouple ERP responses from
microsaccades, as the image is fixed on the retina for a brief time. To do this, flash
afterimages were used as a methods of stabilising the image on the retina. The technique
of using stabilised retinal images to measure the cortical response using EEG has been
attempted previously (e.g. Jasper and Cruikshank, 1937; Creighton et al., 1972; Barry and
Beh, 1976). Responses at 90-100ms (representing P100) and at 250-350ms (representing
P300) were measured. It was found that P100 response over the early visual areas
(electrode sites O1 and O2) showed effects of spatial frequency, specifically, greater
responses from higher spatial frequencies compared to low spatial frequencies. However,
the P100 response measured over the more parietal areas responded mostly to changes in
line waviness, with the greatest VEP amplitude from the waviest stimuli. The later P300
component showed effects of both spatial frequency and line waviness over early visual
areas, with highest spatial frequencies showing significantly lower VEP amplitude
compared to midrange spatial frequencies. The occipital-parietal and parietal areas
showed only effects of spatial frequency: both the PO3 and PO4 electrode sites, and PO7
and PO8 electrode sites, showed high spatial frequencies to elicit significantly lower VEP
amplitude compared to low and midrange spatial frequencies.
The P300 response amplitude over the later visual areas appeared to show a similar
pattern of results compared to the discomfort judgements, with the highest spatial
frequency stimuli showing both the lowest discomfort judgements, as well as the lowest
VEP amplitude over these more parietal visual areas. There was a significant relationship
between discomfort judgements and VEP amplitude for the P300 component averaged
over recording sites. If the major contributor to an individual's discomfort judgements is
excessive responses in the visual cortex, then there should be a relationship between
cortical responses and discomfort judgements, and in the case of the P300 responses, this
is what was found. There was a negative relationship between discomfort and VEP
amplitude for the P100 response. This is expected as there is on the whole an effect of line
waviness for this early visual component, not spatial frequency, and spatial frequency
content is expected to be the main contributor to discomfort arising from excessive
cortical responses (Juriceivc et al., 2010; O'Hare and Hibbard, 2015).
4.1 The effect of contrast
In order to induce an afterimage, stimuli were presented very briefly at the maximum
contrast possible using this display, thus all images were presented at the same physical
contrast (maximum, in order to obtain a reliable afterimage). It is known that there are
differences in sensitivity to contrast depending on spatial frequency (Campbell and Robson,

1968), therefore there are potentially differences in perceived contrast that were not
controlled for in the current experiment. However, the differences between the perceived
contrasts of different spatial frequencies are reduced at suprathreshold contrast levels
(Georgeson and Sullivan, 1975). If differences in perceived contrast were the cause of the
effects, the maximum perceived contrast should be for the midrange spatial frequency
gratings (Campbell and Robson, 1968), However, the midrange spatial frequencies were
neither judged to be most uncomfortable, nor showed a clear maximum in the P100
response, which is the VEP component thought to respond primarily to contrast (e.g. Plant,
1987; Tomoda et al., 1991; Török et al., 1992; Parry et al, 1999). Plant (1987) investigated
the P100 responses and showed a peak between 2-4cpd; Tomoda et al., (1991) used square-
wave, pattern-reversal stimuli, and showed a peak in the steady-state response for 3cpd
stimuli. Török et al., (1992) showed spatial frequency tuning for the pattern offset, and
reversing stimuli, but not for pattern onset stimuli, with a peak around 3cpd. From previous
work effects of perceived discomfort remain when stimuli are matched for effective contrast
(O'Hare and Hibbard, 2011). With specific reference to afterimages, it has been shown that
there is the same persistence effect when stimuli are matched for both apparent and
physical contrast (Bowling et al., 1979). The combined evidence makes it difficult for either
the effects of discomfort, or the increased VEP responses, to be explained purely by effects
of perceived contrast.
4.2 Effects of line waviness
There was a small effect of line waviness on discomfort judgements, waviest lines were
judged as most uncomfortable. There was an effect of line waviness on P100 response in
channels recording over the occipito-parietal cortex. Waviest lines elicited the greatest
P100 response compared to medium wavy and straight lines. Increased line waviness
affects the motion signals of a stimulus (Patzwahl and Zanker, 2000), however, this
increased P100 response to the waviest lines is unlikely to be due to eye movements as
the P100 response is during a period of microsaccade suppression (Rolfs et al., 2005;
Dimigen et al., 2009). It might be the case that the wavier lines show greater responses as
they are less homogenous compared to the straight lines due to the curve, and so a
greater response might be expected in terms of release from surround suppression
(Zhaoping et al., 2000). This greater response might contribute to discomfort judgements,
which are also greatest for the waviest lines compared to the others.
There was an effect of line waviness in the P300 response over early visual areas, which is
during the time of microsaccade rebound (Rolfs, et al., 2005; Dimigen, et al., 2009).
However, Hermens et al., (2012) found no direct evidence of a systematic effect of
microsaccades on illusory motion from riloid stimuli. In the current study, the purpose of
using flash afterimages was to remove the relationship between the stimulus and the eye
movements. The onset of the stimulus is likely to evoke a change in eye movements,
however, the subsequent percept of the afterimage should be unrelated to any subsequent
eye movements after this initial brief presentation.
4.3 Effects of spatial frequency
Natural images have been argued to be efficiently processed by early visual areas, resulting
in a sparse response which is dependent on spatial frequency (Field, 1987; Field, 1994; Field,
1999). It has been suggested that images without the statistical properties of natural scenes,
in particular spatial frequency content, are not able to be efficiently processed by the visual
system and are therefore judged as uncomfortable (e.g. Juricevic et al., 2010; Hibbard and
O’Hare, 2015). There is also evidence to suggest that discomfort of images is dependent on
their spatial frequency content (Fernandez and Wilkins, 2008; O’Hare and Hibbard, 2011).
Previous work into visual discomfort has suggested that 3cpd is the most uncomfortable
stimulus (e.g. Wilkins et al., 1984; Fernandez and Wilkins, 2008; Juricevic et al., 2010).
However, other studies have reported slightly lower spatial frequencies to be more
uncomfortable, for example 0.75 and 1.5cpd (O'Hare and Hibbard, 2011), and 1.2cpd
(Huang et al., 2011). In this study the maximally uncomfortable stimulus was the lowest
spatial frequency out of the three levels tested, at 0.5cpd, which is lower than in previous
literature. It is possible that the term discomfort was not understood by observers, and so
they just responded to image manipulation. However, if that was the case, why they should
choose one image manipulation over another is difficult to account for - it would be
expected that some observers would chose to use line waviness as the image manipulation,
others spatial frequency, if their decisions were arbitrary.
The perceived discomfort reported by an individual is a subjective phenomenon, comprising
of both optical and neural factors (Sheedy et al., 2003), as well as individual differences in
criterion and the understanding of the task. Therefore, it might be the case that for some
observers there is a contribution to discomfort from optical difficulties, for example
accommodation control. Discomfort from low spatial frequency stimuli might be explained
by stimulus blurring, which contributes to perceived discomfort from images (O’Hare and
Hibbard, 2013). It could be that the stimuli are perceived as blurred by the visual system,
creating an open feedback loop for the accommodation (focussing) response (Charman and
Tucker, 1977). Futile attempts at focussing might be the cause of discomfort, an argument
that has been raised in the context of the Enigma illusion (Mon-Williams and Wann, 1996)
and other geometric patterns (Gregory, 1993). However, when individual differences are
taken into account in the mixed effect linear model, there is a relationship between VEP
responses and discomfort, which would be suggested by previous research and modelling
(Penacchio et al., 2015; Hibbard and O’Hare, 2015).
Previous work involving VEPs has shown there to be a peak in the P100 component
around midrange spatial frequencies in both gratings (e.g. Plant, 1987) and chequerboard
patterns (e.g. Tomoda et al., 1991). In the current study, the early visual cortical areas
showed a P100 response to spatial frequency, however this was a monotonic increase
with spatial frequency, rather than a tuning function with a peak in the midrange. This
result does not follow the same pattern as previous studies, nor does it follow discomfort
judgements. By contrast, there were effects of spatial frequency seen in the later P300
component of the EEG response across all three electrode sites, and this followed a similar
pattern to that of discomfort judgements. Additionally, there was a relationship between
discomfort judgements and P300 response amplitude. There is evidence to suggest P300
component is involved in evaluative judgements: for example, de Tommaso et al., (2008)
showed that images considered beautiful had a greater response 300-600ms after stimulus
onset for both geometrical images and artwork. Therefore it might be that P300 is also the
location for discomfort judgements as well as aesthetic judgements.
In the current study, the high spatial frequencies evoked the lowest response in P300, this
was the case for all three areas included in the analysis: early visual areas, as well, as later
occipito-parietal areas. The spatial frequency tuning effect was greatest over the occipito-
parietal areas measured by the PO3 and PO4 electrodes, which might be suggestive that the
effects of discomfort manifest slightly later than the early visual responses, which may be

contaminated with the effects of contrast. However, the number of spatial frequencies
tested will need to be expanded before such a conclusion can be drawn, to get a better
representation of the shape of the overall tuning function.
4.4 Electrode sites
In the current study, multiple electrode sites were analysed to see the effect of the
stimulus on the ERP response over different areas of the visual cortex. The electrode sites
O1 and O2 are thought to be recording over the areas involved in early processing of
visual stimuli. There is an effect of spatial frequency found in both the P100 and P300
components over these areas, but no effect of line waviness. There was a different pattern
of results found for the later recording sites compared to electrodes O1 and O2.
Electrodes PO3 and PO4 are thought to be located over the extrastriate visual areas
(Brooks, 2005), and the electrodes PO7 and PO8 are thought to be located over the lateral
occipital cortex (Bertamini and Makin, 2014). In contrast to the early recording sites, a
similar pattern of responses was shown for recordings made from electrodes PO3 and
PO4, and PO7 and PO8: an effect of line waviness on the P100 component, and an effect
of spatial frequency on the P300 component. It is possible that the effects of line waviness
are due to effects of contrast: greater curvature resulted in lines that are not of constant
width, and this will affect the luminance profile at different points in the curve (Gheorghiu
and Kingdom, 2006). This differing luminance profile could affect perceived contrast and
therefore might explain why the line waviness will have had an effect over these sites.
As EEG is does not have good spatial resolution, it is beyond the scope of the current study
to speculate about the regions involved, however it is important to note that the early
visual areas show a different pattern of results compared to the later visual areas.
5. Conclusion
There were limited effects of line waviness on the ERP response to flash afterimages and
discomfort judgements: waviest lines tended to show greater response amplitude in the
early visual response and be judged most uncomfortable. ERP responses from flash
afterimages showed an effect of spatial frequency on the P100 response recorded over the
early visual areas, possibly related to contrast. Also there was an effect of spatial
frequency on the P300 response, showing lowest amplitude for high spatial frequency
stimuli from early recording sites through to later recording sites. The discomfort
judgements are maximal on average for the lowest spatial frequency stimuli, which
follows a similar pattern to the P300 responses. There is a relationship between
discomfort and the P300 response amplitude, suggesting that there is a cortical basis for
perceived discomfort.
Acknowledgements
This work was supported by a BA/Leverhume Small Research Grant, reference number
SG131233. Thanks to Ferenc Igali and Heather Shaw for help in collecting the data.

References
Barry, R. J., and Beh, H. C., (1976). EEG correlates of the afterimage of visual stimulation.
Psychophysiology, 13(1), 75-80.
Bates, D., Mächler, M., Bolker, B., and Walker, S., (2015). Fitting linear mixed-effects models
using LME4. Journal of Statistical Software, 67(1), 1-48.
Bertamini, M., and Makin, A. D. J., (2014). Brain activity in response to visual symmetry.
Symmetry, 6(4), 975-996
Bowling, A., Lovegrove, W., and Mapperson, B., (1979). The effect of spatial frequency and
contrast on visual persistence. Perception, 8, 529-539.
Brainard, D. H., (1997). The psychophysics toolbox, Spatial Vision, 10(4), 433-436.
Brooks, J. L., (2005). Visual search task - feature search surrounded by either illusory
contours to group the display or a control condition with no illusory contours. Journal of
Neurobehavioral Experiments and Stimuli: 127.
Campbell, F. W., and Robson, J. G., (1968). Application of Fourier analysis to the visibility of
gratings. Journal of Physiology, 197, 551-566.
Charman, W. N., and Tucker, J., (1977). Dependence of accommodation response in the
spatial frequency spectrum of the observed object. Vision Research, 17(1), 129-139.
Creighton, T. D., Tees, R. C., and Creighton, D. E., (1972). Occipital EEG activation during
fluctuations of perception under stabilized image and simplified stimulus conditions. Canad.
J. Psychol., 26(2), 127-139.

De Tommaso, M., Pecoraro, C., Sardaro, M., Serpino, C., Lancioni, G., Livrea, P., (2008).
Influence of aesthetic perception on visual event-related potentials. Consciousness and
Cognition, 17, 933-945.
Dimigen, O., Valsecch, M., Sommer, W., and Kliegl, R., (2009). Human microsaccade-related
visual brain responses. The Journal of Neuroscience, 29(39), 12321-12331.
Fernandez, D., and Wilkins, A. J., (2008). Uncomfortable images in art and nature.
Perception, 37(7), 1098-1013.
Field, D. J., (1994). What is the goal of sensory coding? Neural Computation, 6, 559-601.
Field, D., J., (1999). Wavelets, vision and the statistics of natural scenes. Phil. Trans. R. Soc.
Lond. A., 357, 2527-2542.
Field, D. J., (1987). Relations between the statistics of natural images and the response
properties of cortical cells. Journal of the Optical Society of America, A., 4(12), 2379-2394.
Georgeson, M. A., (1976). Psychphysical hallucinations of orientation and spatial frequency.
Perception, 5, 99-111.
Georgeson, M. A., and Sullivan, G. D., (1975). Contrast constancy: deblurring in human vision
by spatial frequency channels. J. Physiol., 252(3), 627-656.
Gheorgiu, E., and Kingdom, F. A. A., (2006). Luminance-contrast properties of contour-shape
processing revealed through the shape-frequency after-effect. Vision Research, 46(21),
3603-3615.
Gori, S., and Hamburger K., (2006). A new motion illusion: The Rotating-Tilted-Lines illusion.
Perception, 35, 853–857.

Gori, S., and Yazdanbakhsh, A., (2008). The riddle of the Rotating-Tilted-Lines illusion.
Perception; 37, 631–635.
Gori, S., Giora, E., Yazdanbakhsh, A., and Mingolla, E., (2011). A new motion illusion based
on competition between two kinds of motion processing units: The Accordion Grating.
Neural Networks, 24, 1082–1092.
Gratton, G., Coles, M. G. H., and Donchin, E., (1983). A new method for off-line removal of
ocular artifact. Electrophysiology and Clinical Neurophysiology, 55, 468-484.
Gregory, R. L., (1993). A comment: Mackay Rays shimmer due to accommodation changes.
Proceedings of the Royal Society, B, 253, 1336.
Haigh, S. M., Barningham, L., Berntsen, M., Coutts, L. V., Hobbs, E. S., Irabor, J., Lever, E. M.,
Tang, P., Wilkins, A. J., (2013). Discomfort and the cortical haemodynamic response to
coloured gratings. Vision Research, 89, 47-53.
Haigh, S. M., Cooper, N. R., Wilkins, A. J., (2015). Cortical excitability and the shape of the
haemodynamic response. NeuroImage, 111, 379-384.
Höfel, L., and Jacobsen, T., (2007). Electrophysiological indices of processing aesthetics:
Spontaneous or intentional processes? International Journal of Psychophysiology, 65, 20-31.
Hibbard, P. B., and O’Hare, L., (2015). Uncomfortable images produce non-sparse responses
in a model of primary visual cortex. Royal Society Open Science, 2: 140535.
Huang, J., Zong, X., Wilkins, A. Jenkins, B., Bozoki, A., Cao, Y., (2011). fMRI evidence that
precision ophthalmic tints reduce cortical hyperactivation in migraine. Cephalalgia, 31(8),
925-936.
Jasper, H. H., and Cruikshank, R. M., (1937). Electroencephalography II: Visual stimulation
and the afterimage as affecting the occipital alpha rhythm. Journal of General Psychology,
17, 29-48.
Juricevic, I., Land, L., Wilkins, A., and Webster, M. A., (2010). Visual discomfort and natural
image statistics. Perception, 39(7), 884-899.
Kleiner, M., Brainard, D., and Pelli, D., (2007). What’s new in psychtoolbox-3? Perception,
365(ECVP Supplement): S14.
Kumar, T., and Glaser, D. A., (2006). Illusory motion in Enigma: A psychophysical
investigation. PNAS, 13(6), 1947-1952.
Li, R., Qin, R., Zhang, J., Wu, J., Zhou, C., (2015). The esthetic preference of Chinese
typefaces – An event-related potential study. Brain Research, 1958, 57-65.
MacKay, D. M., (1957). Visual images produced by regular stationary patterns. Nature,
180(4591), 849-850.
Marcus, D. A., and Soso, M. J., (1989). Migraine and stripe-induced visual discomfort.
Archives of Neurology, 46(10), 1129-32.
Mon-Williams, M., and Wann, J. P., (1996). An illusion that avoids focus. Proceedings:
Biological Sciences, 263(1370), 537-578.
O'Hare, L., and Hibbard, P. B., (2011). Spatial frequency and visual discomfort. Vision
Research, 51, 1767-1777.
O’Hare, L., and Hibbard, P. B., (2013). Visual discomfort and blur. Journal of Vision, 13(7),
doi:10.1167/13.5.7

O'Hare, L., Clarke, A. D. F., and Pollux, P., (2015). VEP responses to Op-Art stimuli. PLoS ONE,
10(9), e0139400.
Parker, D. M., Salzen, E. A., and Lishman, J. R., (1982). Visual-evoked responses elicited by
the onset and offset of sinusoidal gratings: latency, waveform, and topograhic
characteristics. Investigative Ophthalmology and Vision Science, 22, 675–680.
Parry, N. R. A., Murray, I. J., and Hadjizenonos, C., (1999). Spatio-temporal tuning of VEPs:
Effect of mode of stimulation. Vision Research, 39, 3491-3497.
Patzwahl, D. R., and Zanker, J. M., (2000). Mechanisms of human motion perception:
combining evidence from evoked potentials, behavioural performance, and computational
modelling. European Journal of Neuroscience, 12, 275-282.
Pelli, D. G., (1997). The videotoolbox software for visual psychophysics: Transforming
numbers into movies. Spatial Vision, 10(4), 437-442.
Pennachio, O., Otazu, X., Wilkins, A., and Harris, J., (2015). Uncomfortable images prevent
lateral interactions in the cortex from providing a sparse code. ECVP Abstract Supplement,
Perception.
Plant, G. T. (1987). Transient visually evoked potentials to sinusoidal gratings in optic
neuritis. Journal of Neurology, Neurosurgery and Psychiatry. 46, 1125-1133.
Rolfs, M., Engbert, R., and Kliegel R., (2005). Crossmodal coupling of oculomotor control and
spatial attention in vision and audition. Experimental Brain Research, 166, 427–439.
Sheedy, J. E., Hayes, J., and Engle, J., (2003). Is all aesthenopia the same? Optometry and
Vision Science, 80(11), 732-739.
Tomoda, H., Celesia, G. G., and Toleikis, S. C., (1991). Effect of spatial frequency on
simultaneous recroded steady-state pattern electroretinograms and visual evoked
potentials. Electroencephalography and Clinical Neurophysiology, 80, 81-88.
Török, B., Meyer, M., and Wildberger, H., (1992). The influence of pattern size on amplitude,
latency and wave form of retinal and cortical potentials elicited by checkerboard pattern
reversal and stimulus onset-offset. Electroencephalography and Clinical Neurophysiology,
84, 13-19.
Troncoso, X. G., Macknik, S. L., Otero-Millan, J., and Martinez-Conde, S., (2008).
Microsaccades drive illusory motion in the Enigma illusion. PNAS, 105(41), 16033-16038.
Wade, N., (1977). Distortions and disappearances of geometrical patterns. Perception, 6,
407-433.
Wade, N., (2003). Movements in art: From Rosso to Riley, Perception, 32, 1029-1036.
Wijeakumar, S., Shahani, U., Simpson, W. A., and McCulloch, D. L., (2012). Localization of
haemodynamic responses to simple visual stimulation: An fNIRS study. Investigative
Ophthalmology and Visual Science, 53(4), 2266-2273.
Wilkins, A. J., Nimmo-Smith, I., Tait, A., McManus, C., Della Sala, S., Tilley, A., Arnold, K.,
Barrie, M., and Scott, S., (1984). A neurological basis for visual discomfort. Brain, 107(4):989-
1017.
Wilkins, A.J. and Evans, B.J.W. (2001). Pattern Glare Test. IOO Marketing Ltd., London.
Zanker, J. M., Doyle, M., and Walker R., (2003). Gaze stability of observers watching Op Art
pictures. Perception, 32, 1037-1049.
Zanker, J. M., (2004). Looking at Op-art from a computational viewpoint. Spatial Vision,
17(1-2), 75-94.
Zanker, J. M., Hermens, F., and Walker, R., (2010). Quantifying and modelling the strength of
motion illusions perceived in static patterns. Journal of Vision, 10(13), 1-4.
Zhaoping, L., (2000). Pre-attentive segmentation in the primary visual cortex. Spatial Vision,
13(1), 25-50.