jenningsplanet.files.wordpress.com · web viewcreated earlier and then configuring the web map...
TRANSCRIPT

Project Summary
An ArcGIS Story Map was created for the purpose of displaying a water quality report in in a visually rich medium. The Story Map was designed to show outlines of study areas and land cover layers paired with text descriptions of the spatial features. Point and polygon features were assembled in ArcMap and minimally formatted before sharing to ArcGIS Online. The uploaded layers were then styled and filtered as a final step before adding the features to the ESRI Story Map. A Story Map template was selected and the features were inserted into the template along with markers designed to aid navigation through the Story Map. Challenges included browser interoperability issues, data management using ArcGIS Online, displaying land cover (raster) data, limited customization options, and user experience issues.
Purpose
The goal of this project is to create an online water quality report that provides a more valuable user experience than the standard PDF hosted on a website method for releasing reports. An ESRI Story Map will allow for the display of large, manipulatable maps along with standard text report sections paired with the maps.
Process
Data AcquisitionThe water quality report needs to show the locations of the water sampling points (five
point features), an outline of the legal San Joaquin-Sacramento Delta (one polygon feature), five watershed boundaries associated with the five sampling sites (five polygon features), and a land cover layer. The land cover and the legal San Joaquin-Sacramento Delta layers were downloaded from ArcGIS Online. All other features were obtained from my place of work (U.S. Geological Survey).
ArcMap PreparationThe sample site and watershed boundaries were added to ArcMap and left as is. All
layers were shared as a service to the American River College ArcGIS Online organization.
ArcGIS Online Filtering and Symbology Sample sites: adjusted symbology for point feature to make symbols more visible. Watershed boundaries: Created five filters to isolate each watershed boundary and then
saved each of the five filtered selections as its own watershed layer for each site. Configured popups for the sites and the watershed areas to include photos and pesticide
detection summaries(Figure 1). All desired layers were added to two work space web maps to be used in the Story Map.
(Figure 2)

Figure 1. Pop up configuration for one of the watershed boundary layers
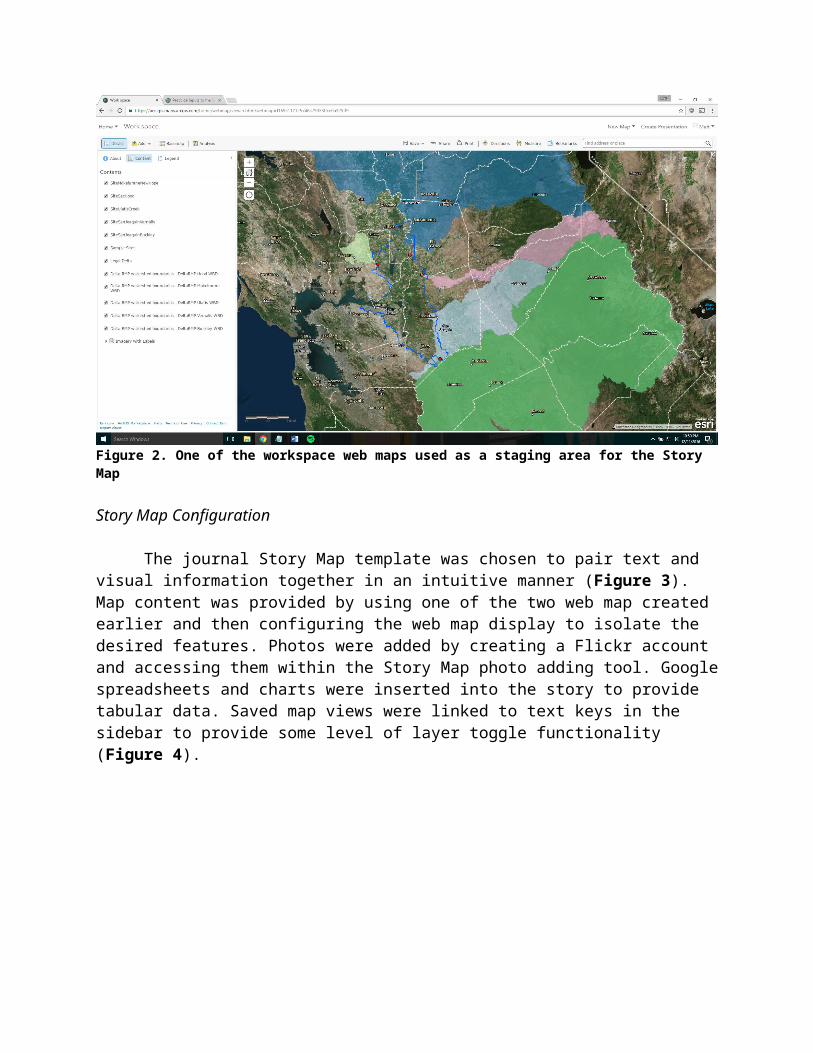
Figure 2. One of the workspace web maps used as a staging area for the Story Map
Story Map Configuration
The journal Story Map template was chosen to pair text and visual information together in an intuitive manner (Figure 3). Map content was provided by using one of the two web map
created earlier and then configuring the web map display to isolate the desired features. Photos were added by creating a Flickr account and accessing them within the Story Map photo adding tool. Google spreadsheets and charts were inserted into the story to provide tabular data. Saved map views were linked to text keys in the sidebar to provide some level of layer toggle functionality (Figure 4).
Figure 3. Example of sidebar text content and main stage map content
Figure 4. Clicking on the underlined text in the sidebar toggles the associated layer and pop-up

Challenges
Limited customization was a recurring challenge and the most frustrating aspect of using a Story Map as opposed to a simple web map or web map app. I needed some way to toggle layers on or off without switching to an entirely new and the only way that I could figure out how to do that was to add map view links to text in the sidebar. It works, but it isn’t the most intuitive option for end users. The addition of widgets to the Story Map would have been extremely useful. The other major challenge that I faced was that changes that I made within the map configuration pop ups wouldn’t always persist and I never figured out what the root cause was. I suspect that it has something to do with the browser (possibly the cache).
Discussion
The Story Map is a useful tool for creating a carefully guided presentation that contains text paired with maps or images. I was able to create a product that I can see using professionally with some extra tweaking. The limited customization offered by the Story Map was a major problem and I am not sure if I would use a Story Map again. The best option for my type of project might be a custom web page with several embedded web map apps.