contentsagriculture.vic.gov.au/__data/assets/word_doc/0010/... · web view$17 million on an...
TRANSCRIPT
Victorian Food and Fibre Export Performance Report 2017-18
1
Published byDepartment of Economic Development, Jobs, Transport and Resources 1 Spring Street Melbourne, Victoria 3000 Telephone +61 (0) 3 9651 9999 December 2018
© Copyright State Government of Victoria 2018
This publication is copyright. No part may be reproduced by any process except in accordance with provisions of the Copyright Act 1968.
Authorised by the Victorian Government, Melbourne.
ISSN 1832-2905 (print) ISSN 2202-931 (pdf/online)
Disclaimer The information contained in this report is provided for general guidance and assistance only and is not intended as advice. You should make your own inquiries as to the appropriateness and suitability of the information provided. While every effort has been made to ensure the currency, accuracy or completeness of the content we endeavour to keep the content relevant and up to date and reserve the right to make changes as required. The Victorian Government, authors and presenters do not accept any liability to any person for the information (or the use of the information) which is provided or referred to in the report.
Except for any logos, emblems, trademarks, artwork and photography this document is made available under the terms of the Creative Commons Attribution 3.0 Australia licence.
2

Contents
Contents..............................................................................................................................3Minister’s foreword...............................................................................................................5Summary..............................................................................................................................6Export Performance by Industry..........................................................................................10Case study: Market access to China.....................................................................................10Meat..................................................................................................................................12Animal Fibre.......................................................................................................................14Dairy..................................................................................................................................16Prepared foods...................................................................................................................18Grain..................................................................................................................................20Horticulture........................................................................................................................22Forest products..................................................................................................................24Skins and hides..................................................................................................................26Wine..................................................................................................................................27Textile, clothing and footwear.............................................................................................29Animal feed........................................................................................................................31Seafood..............................................................................................................................32Export Performance by Region and Key Destinations............................................................34Case study: Re-opening cherries access to Vietnam..............................................................34North Asia..........................................................................................................................35South East Asia...................................................................................................................36North America....................................................................................................................37The Middle East and North Africa (MENA).............................................................................38South Asia..........................................................................................................................40China.................................................................................................................................41Japan..................................................................................................................................43USA....................................................................................................................................45New Zealand.......................................................................................................................47Indonesia...........................................................................................................................49Hong Kong..........................................................................................................................51Malaysia.............................................................................................................................53India..................................................................................................................................55South Korea.......................................................................................................................56Singapore...........................................................................................................................58United Arab Emirates..........................................................................................................60Vietnam.............................................................................................................................62Thailand.............................................................................................................................64Taiwan...............................................................................................................................66Philippines.........................................................................................................................68Definitions and Data...........................................................................................................70
3

Minister’s forewordOn behalf of the Victorian Government, I am proud to present Victoria’s latest food and fibre export performance report.
I am greatly encouraged by the outstanding double-digit growth in exports this sector has achieved in the last 12 months.
The food and fibre sector is an important economic driver for Victoria. It contributes an estimated 4.8 per cent to Victoria’s Gross State Product (GSP) and employs 5.3 per cent of the workforce.
The sector generates over 207,000 jobs. Eighty-seven per cent of agricultural employment is concentrated in regional Victoria.
Victorian food and fibre accounts for over 27 per cent of Australian food and fibre exports. A key strength of the sector is its diversity, with several industries doing very well in 2017-18.
In 2017-18, Victoria’s total food and fibre exports were valued at $14.1 billion, up 11 per cent on the $12.8 billion achieved in the previous financial year.
The report details both the quantities and value of Victorian and Australian exports across the range of food and fibre industries.
Victoria continues to contribute strongly to the national dairy sector, maintaining its leading role. Victoria accounts for 79 per cent of the value of Australia‘s dairy exports. Victoria also contributed 45 per cent of Australia’s horticulture exports.
The meat industry had a particularly strong year with exports increasing in value by 37 per cent to a total $3.3 billion, making meat our most valuable food and fibre export for 2017-18.
Our fresh fruit exporters were also significant contributors capitalising on new market access arrangements with China. Food and fibre exports have also grown strongly in North Asia and the Middle East.
The Victorian Government has committed to building the capability of Victorian exporters by:
strengthening our global profile through promotions, major events and partnerships with industry expanding inbound and outbound trade missions to assist businesses gain new export skills, and supporting businesses with an expanded network of international Victorian Government Trade and Investment Offices.
While 2017-18 was a strong year for exports, 2018-19 export performance may be affected by the drought and dry seasonal conditions in some parts of the state. The Victorian Government is providing $30 million in support to address the potentially challenging conditions ahead, including infrastructure grants to support drought response and preparedness, financial relief for farm households, health and wellbeing support, small business services and resources for wildlife management.
We have also invested to build resilience in our food and fibre sector, and to deliver high quality products into international markets including:
a continued commitment to invest in agricultural research, development and extension partnerships across animal and plant production to ensure we remain productive and globally competitive
investments in irrigation, road and rail infrastructure along the agriculture supply chain to boost Victoria’s productivity and international competitiveness
$27 million to help farmers capitalise on the opportunities provided by new digital technologies and to deliver on the government’s commitment to make Victoria the AgTech hub of Australia, and
$17 million on an industry and farmer support package for the electronic National Livestock Identification System for sheep and goats to improve productivity and provide trading partners with increased confidence in the safety and origin of Victorian products.
The Victorian Government recently announced the $15 million Taste Victoria initiative to grow the international profile, competitiveness and export opportunities for Victoria’s agri-food sector. This includes Australia’s biggest business food event Global Table, which will promote Victoria as the centre of high quality food production to an international audience. This will be complemented by a new program, Growing Food and Fibre Markets to deliver targeted market access activities and strategically place Victoria to better capture market opportunities.
Collectively these initiatives will position the Victorian Government to achieve its target to grow Victoria’s food and fibre exports to $20 billion by 2030 and build Victoria’s international reputation as the food centre of Australia.
I congratulate all our food and fibre producers, manufacturers and exporters for their hard work, resilience, innovative spirit and significant contribution to the State of Victoria. I look forward to working with the sector to build on this success.
The Hon. Jaclyn Symes MPMinister for AgricultureMinister for Regional DevelopmentMinister for Resources
4
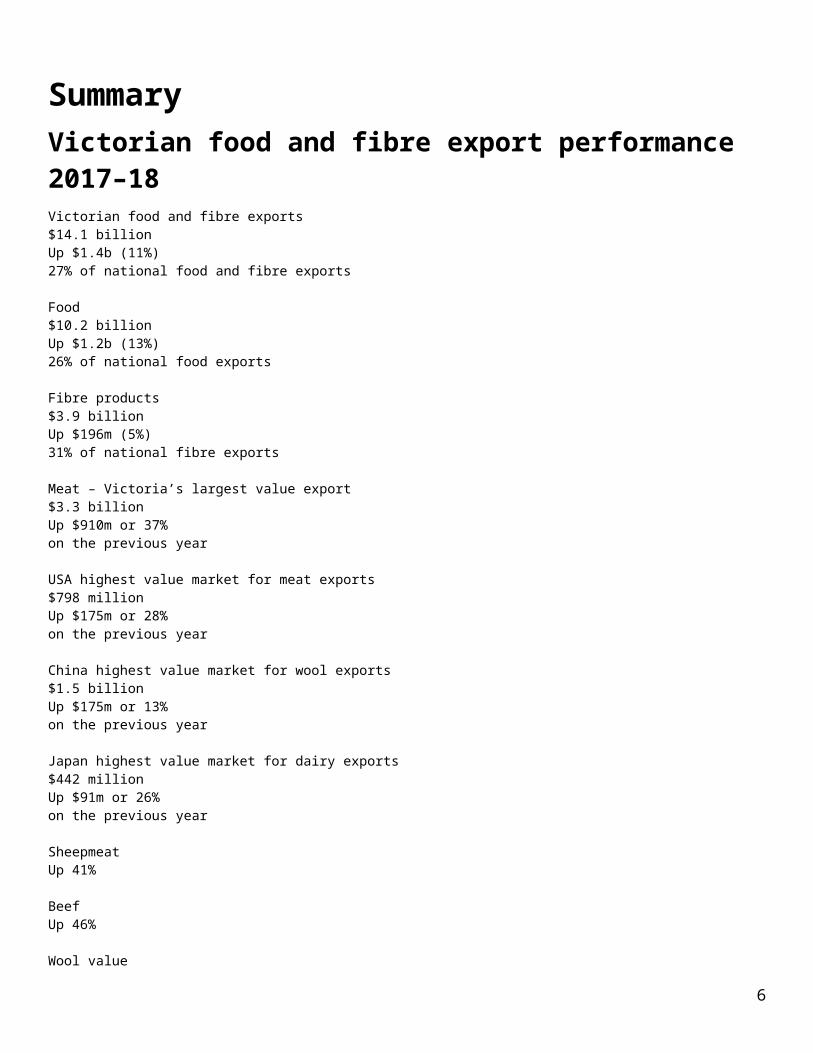
SummaryVictorian food and fibre export performance 2017–18Victorian food and fibre exports $14.1 billion Up $1.4b (11%) 27% of national food and fibre exports
Food $10.2 billionUp $1.2b (13%)26% of national food exports
Fibre products $3.9 billionUp $196m (5%) 31% of national fibre exports
Meat – Victoria’s largest value export$3.3 billion Up $910m or 37%on the previous year
USA highest value market for meat exports $798 million Up $175m or 28%on the previous year
China highest value market for wool exports $1.5 billionUp $175m or 13% on the previous year
Japan highest value market for dairy exports$442 millionUp $91m or 26%on the previous year
Sheepmeat Up 41%
Beef Up 46%
Wool value$2.1bUp 18%
Dairy$1.9bUp 9%
Wine exports to China increasedUp 39%
exports to the UK increased5
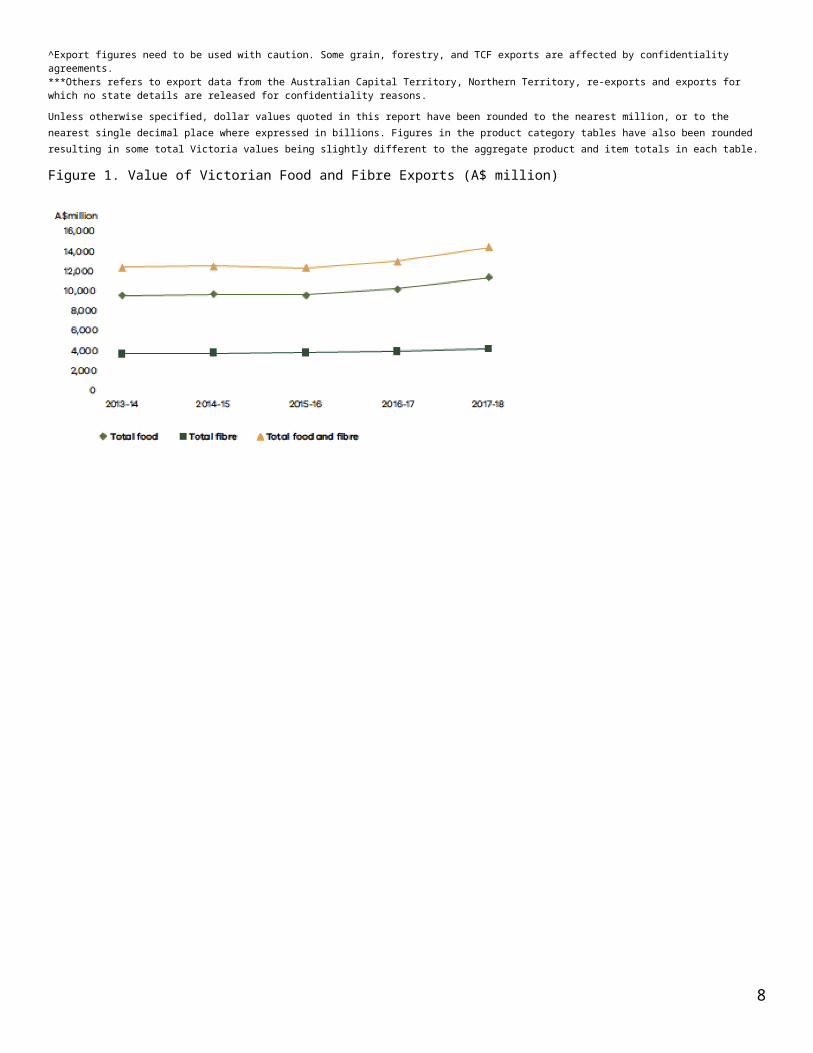
Up 36%Victorian food and fibre exports were valued at $14.1 billion in 2017-18, an increase of $1.4 billion on 2016-17. The value of food exports alone, was $10.2 billion, an increase of $1.2 billion on the previous year. The value of fibre products increased by $196 million on the previous year to $3.9 billion.
The value of Victorian food and fibre exports in 2017-18 increased by 11 per cent compared to the previous year. This was accompanied by a one per cent decline in volume, consistent with an increase in high value exports especially meat, animal fibre and dairy which collectively accounted for 53 per cent of the total value of the state’s food and fibre exports.
This report focuses on the export performance of key agricultural commodities (including food manufacturing) and export markets from 2013-14 through to 2017-18.
The data is presented and aggregated by state of origin as opposed to state of loading. State of origin is based on statistics, compiled by the Australian Bureau of Statistics (ABS), to identify the Australian state of origin of goods. State of origin is defined by the ABS as the Australian State in which the final stage of production or manufacture occurs (ABS 5489.0 - International Merchandise Trade,
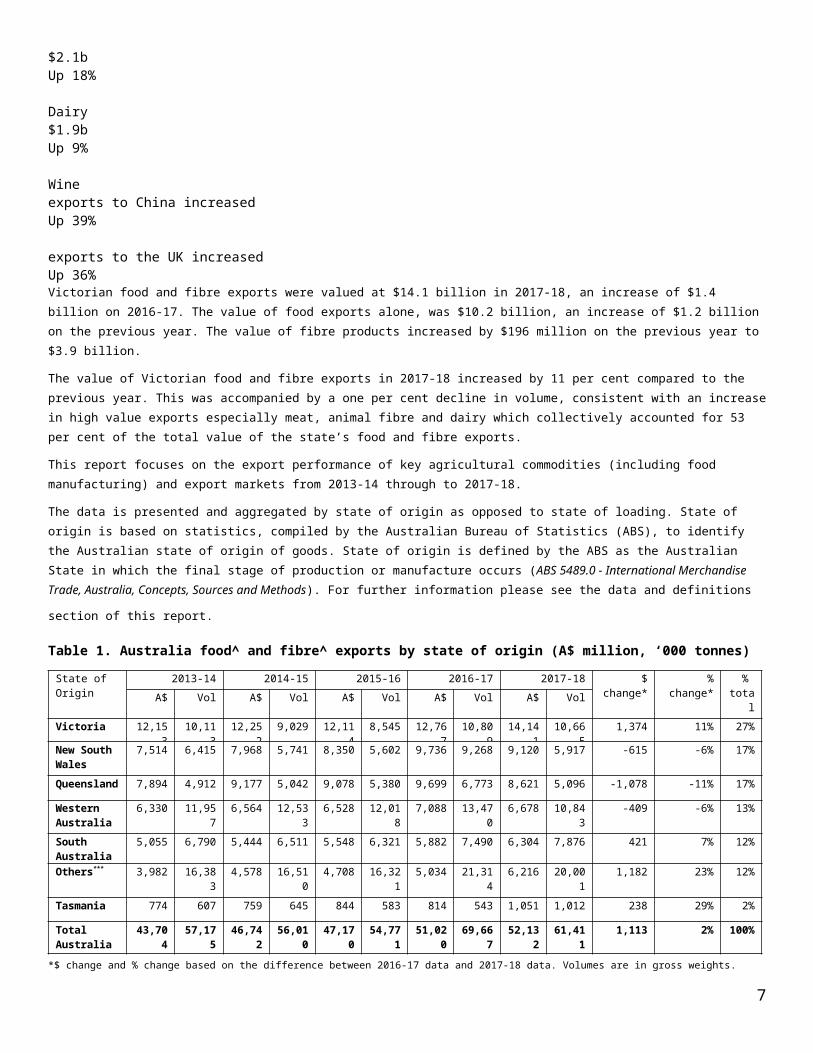
Australia, Concepts, Sources and Methods). For further information please see the data and definitions section of this report. Table 1. Australia food^ and fibre^ exports by state of origin (A$ million, ‘000 tonnes)
State of Origin
2013-14 2014-15 2015-16 2016-17 2017-18 $ change*
% change* % total A$ Vol A$ Vol A$ Vol A$ Vol A$ Vol
Victoria 12,153 10,113 12,252
9,029 12,114
8,545 12,767
10,809
14,141
10,665
1,374 11% 27%
New South Wales
7,514 6,415 7,968 5,741 8,350 5,602 9,736 9,268 9,120 5,917 -615 -6% 17%
Queensland 7,894 4,912 9,177 5,042 9,078 5,380 9,699 6,773 8,621 5,096 -1,078 -11% 17%
Western Australia
6,330 11,957 6,564 12,533
6,528 12,018
7,088 13,470
6,678 10,843
-409 -6% 13%
South Australia
5,055 6,790 5,444 6,511 5,548 6,321 5,882 7,490 6,304 7,876 421 7% 12%
Others*** 3,982 16,383 4,578 16,510
4,708 16,321
5,034 21,314
6,216 20,001
1,182 23% 12%
Tasmania 774 607 759 645 844 583 814 543 1,051 1,012 238 29% 2%
Total Australia
43,704 57,175 46,742
56,010
47,170
54,771
51,020
69,667
52,132
61,411
1,113 2% 100%
*$ change and % change based on the difference between 2016-17 data and 2017-18 data. Volumes are in gross weights.^Export figures need to be used with caution. Some grain, forestry, and TCF exports are affected by confidentiality agreements. ***Others refers to export data from the Australian Capital Territory, Northern Territory, re-exports and exports for which no state details are released for confidentiality reasons.
Unless otherwise specified, dollar values quoted in this report have been rounded to the nearest million, or to the nearest single decimal place where expressed in billions. Figures in the product category tables have also been rounded resulting in some total Victoria values being slightly different to the aggregate product and item totals in each table.
Figure 1. Value of Victorian Food and Fibre Exports (A$ million)
6
7
Food and Fibre Exports Table 2. Victorian food and fibre exports by commodity group (A$ million, ‘000 tonnes)
Commodity Group
2013-14 2014-15 2015-16 2016-17 2017-18 $ change*
% change*
% total A$ Vol A$ Vol A$ Vol A$ Vol A$ Vol
Meat 2,338 540 3,113 608 2,756 521 2,440 436 3,351 578 910 37% 24%
Animal fibre 1,426 278 1,641 335 1,649 217 1,835 225 2,177 267 342 19% 15%
Dairy 2,293 525 2,028 565 1,868 591 1,751 554 1,910 570 160 9% 14%
Prepared foods** 907 242 957 228 1,322 265 1,483 269 1,713 311 229 15% 12%
Grain^ 1,972 4,595 1,365 3,011
967 2,178
1,795 4,510 1,518 4,322 -277 -15% 11%
Horticulture 871 301 908 294 1,188 351 1,100 373 1,147 386 47 4% 8%
Forest products^
688 2,798 696 3,173
720 3,538
793 3,593 726 3,352 -67 -8% 5%
Skins and hides 532 190 551 211 512 187 409 168 463 195 54 13% 3%
Wine 182 78 200 88 251 122 290 132 363 154 73 25% 3%
TCF^ 543 225 355 138 418 146 432 166 270 96 -161 -37% 2%
Animal feed^ 229 339 256 373 267 413 235 370 263 428 28 12% 2%
Seafood 170 4 181 4 197 17 204 12 240 5 36 18% 2%
Total Victoria 12,153
10,113
12,252
9,029
12,114
8,545
12,767
10,809
14,141
10,665
1,374 11% 100%
Food ExportsTable 3. Victorian food exports by commodity group (A$ million, ‘000 tonnes)
Commodity Group
2013-14 2014-15 2015-16 2016-17 2017-18 $ change*
% change* % total A$ Vol A$ Vol A$ Vol A$ Vol A$ Vol
Meat 2,338 540 3,113
608 2,756
521 2,440
436 3,351 578 910 37% 33%
Dairy 2,293 525 2,028
565 1,868
591 1,751
554 1,910 570 160 9% 19%
Prepared foods** 907 242 957 228 1,322
265 1,483
269 1,713 311 229 15% 17%
Grain^ 1,972 4,595 1,365
3,011 967 2,178 1,795
4,510 1,518 4,322 -277 -15% 15%
Horticulture 871 301 908 294 1,188
351 1,100
373 1,147 386 47 4% 11%
Wine 182 78 200 88 251 122 290 132 363 154 73 25% 4%
Seafood 170 4 181 4 197 17 204 12 240 5 36 18% 2%
Total Victoria 8,735 6,284 8,752
4,799 8,549
4,044 9,063
6,286 10,241
6,327 1,178 13% 100%
Fibre exportsTable 4. Victorian fibre exports by commodity group (A$ million, ‘000 tonnes)
Commodity Group 2013-14 2014-15 2015-16 2016-17 2017-18 $ change* % change*
% total A$ Vol A$ Vol A$ Vol A$ Vol A$ Vol
Animal fibre 1,426
278 1,641 335 1,649 217 1,835 225 2,177 267 342 19% 56%
Forest products^ 688 2,798 696 3,173 720 3,538 793 3,593 726 3,352 -67 -8% 19%
Skins and hides 532 190 551 211 512 187 409 168 463 195 54 13% 12%
TCF^ 543 225 355 138 418 146 432 166 270 96 -161 -37% 7%
Animal feed^ 229 339 256 373 267 413 235 370 263 428 28 12% 7%
Total Victoria 3,418
3,830 3,499 4,230 3,565 4,501 3,704 4,523 3,899 4,338 196 5% 100%
^Export figures need to be used with caution. Some grain, forestry, TCF and animal feed exports are affected by confidentiality agreements*$ change and % change based on the difference between 2016-17 and 2017-18 data. Volumes are shown in gross weights.
8

**Prepared foods are classified as those which have been substantially transformed from their raw product basis and may have input from more than one food production industry.
DestinationsTable 5. Top 20 destinations for food and fibre exports by destination (A$ million, ‘000 tonnes)
2013-14 2014-15 2015-16 2016-17 2017-18 $ change* % change*
% total Destination A$ Vol A$ Vol A$ Vol A$ Vol A$ Vol
China 2,947 3,169 2,932
3,075 3,218
3,291 3,613
3,858 4,582
4,142 969 27% 32%
Japan 831 348 966 762 990 746 918 385 1,088
390 170 18% 8%
United States 646 218 1,139
279 961 198 826 204 973 166 148 18% 7%
New Zealand 677 414 677 380 736 318 708 452 758 563 50 7% 5%
Indonesia 632 685 573 419 556 484 560 548 597 800 37 7% 4%
Hong Kong 390 130 420 124 498 122 502 117 513 101 11 2% 4%
Malaysia 489 276 468 289 404 292 419 386 498 503 79 19% 4%
India 312 184 353 183 308 92 629 666 380 152 -250 -40% 3%
South Korea 369 405 402 388 400 337 385 332 366 188 -18 -5% 3%
Singapore 468 195 438 211 348 129 354 152 345 142 -9 -2% 2%
United Arab Emirates
383 230 348 128 316 110 317 145 333 136 16 5% 2%
Vietnam 335 339 326 314 351 262 394 524 310 463 -84 -21% 2%
Thailand 369 274 317 220 245 179 269 303 289 320 19 7% 2%
Taiwan 248 268 234 216 233 213 242 213 238 225 -4 -2% 2%
Philippines 154 145 171 143 145 113 187 348 209 292 22 11% 1%
Italy 154 29 126 27 148 37 127 26 193 54 66 52% 1%
Papua New Guinea 127 148 142 134 125 116 130 113 160 225 30 23% 1%
Saudi Arabia 213 106 200 94 145 74 115 69 133 73 18 15% 1%
Bangladesh 111 69 86 42 77 51 154 150 116 98 -38 -25% 1%
Egypt 148 229 132 174 93 86 96 119 115 112 19 20% 1%
*$ change and % change based on the difference between 2016-17 data and 2017-18 data. Volumes are in gross weights.
Figure 2. Top 5 markets for food^ and fibre^ exports (A$ million)
9

Export Performance by Industry
Case study: Market access to ChinaDuring 2017-18, China approved a range of new and improved market access conditions for Australian meat, dairy and horticulture produce. Under the China–Australia Free Trade Agreement (ChAFTA) and subsequent tariff cuts, Australia’s agricultural exports will be more competitive. The value of food and fibre exports to China is expected to increase significantly as a result. The agreement supports long-held ambitions for Australian producers and will enable access for horticulture exports in a faster and more cost-effective manner.
Horticulture – new market access The Australian summerfruit industry has recorded its best export season in over a decade as exports soared under the new market access arrangements to China. In November 2017, China approved market access for apricots, peaches and plums, following a successful nectarine season in 2016-17. Summerfruit Australia Limited (SAL) has attributed this success to the combined efforts of industry and government over many years of negotiations.
Since 2016, Agriculture Victoria has worked with the Australian Government and industry to support nectarine growers and packers to be export-ready. The support ensured a high level of compliance with biosecurity and food safety requirements on arrival in China, contributing to market access for additional summerfruit varieties in 2017.
In results released by SAL for the 2017-18 season, summerfruit exports of Australian nectarines, peaches and plums to China increased by 167 per cent in volume to 4,985 tonnes (worth $19.6 million) compared to 1,868 tonnes (worth $7 million) in 2016-17. Victoria contributed to about 75 per cent of Australia’s summerfruit exports in 2017-18 valued at $14.8 million (4,087 tonnes), an increase of 116 per cent from $6.9 million (1,788 tonnes) in 2016-17. This increase was supported by improved access for apricots, peaches and plums as well as a boost of 85 per cent in nectarine exports as more exporters gained confidence in the protocols and participated in the second year of trade.
SAL has indicated that there is a 65 per cent increase in the number of orchards registered for exports in the 2018-19 season, therefore summerfruit exports in 2018-19 are expected to grow an additional five to 15 per cent from the 27 per cent increase in 2017-18. The implementation of ChAFTA from 1 January 2018 has reduced tariffs for Australian summerfruit to China to two per cent, which will further reduce to zero by 1 January 2019, encouraging more exports. However, the future of summerfruit exports to China relies on strict adherence to good biosecurity (phytosanitary) and food safety (sanitary) practices to maintain market access.
Horticulture – leveraging success of summerfruit and improved market access protocolsIn November 2017, China amended the protocols for cherries, citrus and table grapes to include improved and more commercially viable pre-export treatments such as post-harvest fumigation and cold treatment.
Our good record in the trade of summerfruit to China contributed to China’s acceptance of favourable phytosanitary treatments for Australian cherries, citrus and table grapes.
In the 2017-18 season, about 678 tonnes of cherries were exported to China, worth $12 million. The changes to import requirements mean airfreight of cherries from mainland Australia is possible, with fruit being on Chinese supermarket shelves within 48 to 72 hours of harvest providing access to premium fruit pricing. The new protocols allow cherries to be fumigated with methyl bromide and air-freighted to mainland China. Cherry Growers Australia has projected exports to China and Hong Kong in 2018-19 to grow an additional ten per cent on the previous year.
In 2017, the Australian citrus industry exported 263,626 tonnes of citrus worth $432.1 million, which exceeded the previous record set in 2016. China was the leading destination for Australian citrus with 70,429 tonnes worth $137 million, followed by Japan and Hong Kong. Victoria contributed approximately 38 per cent of total citrus exports from Australia that year.
In 2017-18, about 40,000 tonnes of table grapes, worth $143.8 million, were exported to China. Industry believes the revised protocols will have significant impact on the accessibility of table grapes into the Chinese market, with reduced cold treatment requirements allowing greater flexibility in transport options for exporters. Industry estimates that 45,000 – 50,000 tonnes of table grapes worth $200 million will be exported to China in the 2018-19 season.
10

Exports of cherries, citrus and table grapes to China were worth over $230 million in 2016-17. The improvements in protocols for these products will allow Australian producers to increase exports of premium fruit to China in the coming season.
With the implementation of ChAFTA, the tariff on all horticulture (except citrus) exports to China will be eliminated by 1 January 2019, with the tariff on citrus exports to be eliminated by 1 January 2023. This is expected to further boost horticulture exports and improve the competitiveness of Victorian produce in the Chinese marketplace. However, this depends on strict adherence to good biosecurity and food safety practices to maintain market access for these commodities.
DairyChina approved market access protocols for five new Australian infant formula companies in November 2017, all of which were from Victoria, demonstrating China’s ongoing interest in accessing Victoria’s high quality dairy products. Infant formula is a high-value product that has shown strong growth recently, both in Australian supermarket sales (in part due to the demand from the informal export trade), as well as through direct Australian exports. The value of food preparations for infant use directly exported from Victoria to China doubled in 2017-18 to $137 million.
Full cream milk powders to China, which includes ’growing up milk’ preparations, also saw a significant increase in export value, rising 63.9 per cent to $112 million in 2017-18. Overall Victorian dairy exports to China, not including milk preparations for infant use, have increased by 27 per cent to $413 million. The decline in export volumes of cheese, butter, yogurt and whey was largely offset by strong growth in milk powder export volumes which increased by 25,000 tonnes.
11

MeatStrong export demand has driven Victorian sheepmeat and beef exports in 2017-18. A strengthening of the US economy, which is Victoria’s largest market for red meat products, has contributed to this result along with increased demand from China.
The Australian lamb industry’s major competitor in global markets is New Zealand, which is experiencing a decline in ewe and lamb numbers, largely driven by changes in land use from traditional sheep production to dairying. This ongoing trend will place Victoria’s lamb industry in a position of strength to meet global demand.
There are potentially significant gains to be made for the red meat industries in relation to market access arrangements, including an Australian / EU Free Trade Agreement on which negotiations will soon commence.
Meat exports from Victoria were valued at $3.3 billion in 2017-18, an increase of $910 million (37 per cent) on 2016-17.
Sheepmeat worth $1.4 billion and beef ($1.3 billion) were the most valuable meat categories, comprising 83 per cent of Victorian meat exports.
The USA was the largest destination for Victorian meat exports valued at $798 million. Meat exports to China were valued at $474 million, an increase of $248 million (110 per cent) on 2016-17. Meat exports to Japan were valued at $280 million.
Table 6. Value of Victorian meat exports by product category and item (A$ million, ‘000 tonnes)2013-14 2014-15 2015-16 2016-17 2017-18 $
change*%
change*%
total Product and item A$ Vol A$ Vol A$ Vol A$ Vol A$ Vol
Sheepmeat Total 896 184 1,061 201 954 186 1,040 171 1,468 222 428 41% 44%Lamb fresh or frozen 633 111 741 125 675 116 761 114 1,060 146 299 39% 32%
Sheepmeat fresh or frozen 253 68 302 74 270 67 274 56 402 75 128 47% 12%Live animals 11 5 18 3 10 3 5 <0.5 5 1 <0.5 0% 0%
Beef Total 1,022 227 1,554 278 1,314 218 905 147 1,319 221 415 46% 39%Beef fresh or frozen 1,007 224 1,498 265 1,214 196 887 143 1,239 201 352 40% 37%
Live animals 15 3 55 13 100 22 17 5 80 20 63 369% 2%Offal Total 174 61 198 65 183 53 167 49 220 65 53 31% 7%Other prepared meat products Total
63 10 112 12 100 13 88 13 120 14 32 36% 4%
Alternative meat Total 97 20 105 19 97 15 133 17 98 14 -35 -26% 3%Fresh or frozen 96 20 104 19 95 15 133 17 97 13 -36 -27% 3%Live animals <0.5 <0.5 1 <0.5 2 1 <0.5 <0.5 1 <0.5 <0.5 0% 0%
Animal fats Total 48 13 43 11 60 18 65 19 80 21 15 24% 2%Oils and by-products 48 13 43 11 60 18 65 19 80 21 15 24% 2%
Poultry Total 23 18 21 16 16 11 18 14 23 14 4 23% 1%Fresh or frozen 21 18 20 16 15 11 16 14 20 14 3 22% 1%
Eggs 2 0 1 0 1 0 1 0 2 0 1 91% 0%Live animals <0.5 <0.5 <0.5 <0.5 1 <0.
51 <0.5 1 <0.5 0 -12% 0%
Pig meat Total 16 6 20 6 32 7 24 6 23 7 -1 -4% 1%Fresh or frozen 14 5 17 5 29 6 21 5 19 5 -2 -11% 1%
Prepared or preserved 2 1 2 1 3 1 2 1 3 1 1 64% 0%Total Victoria 2,338 540 3,113 608 2,756 521 2,440 436 3,351 578 910 37% 100%
*$ change and % change based on the difference between 2016-17 and 2017-18 data. Volumes are shown in gross weights.
12
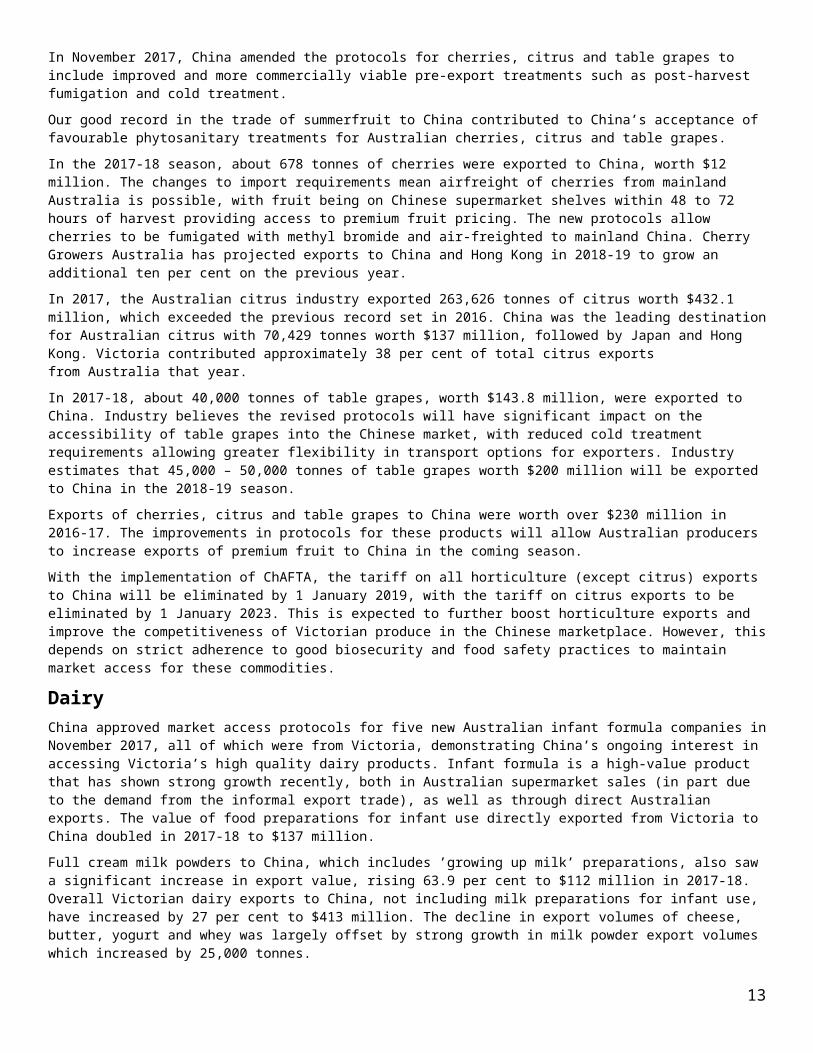
Figure 3. Top 10 countries for Victorian meat exports by value (A$ million)
Figure 4. Value (%) Australian meat exports by state of origin 2017-18
*others refers to ACT, NT, re-exports,and exports for which no state detailsare released for confidentiality reasons
13

Animal FibreContinued increase in the value of wool exports across all micron categories was largely due to a favourable exchange rate and strong international demand, particularly from China where international wool processors compete for raw wool.
Seasonal conditions were very good to excellent in the western half of Victoria in Autumn and Spring 2017. The north-east of the state was dry for much of Spring before rain in early summer brought some relief.
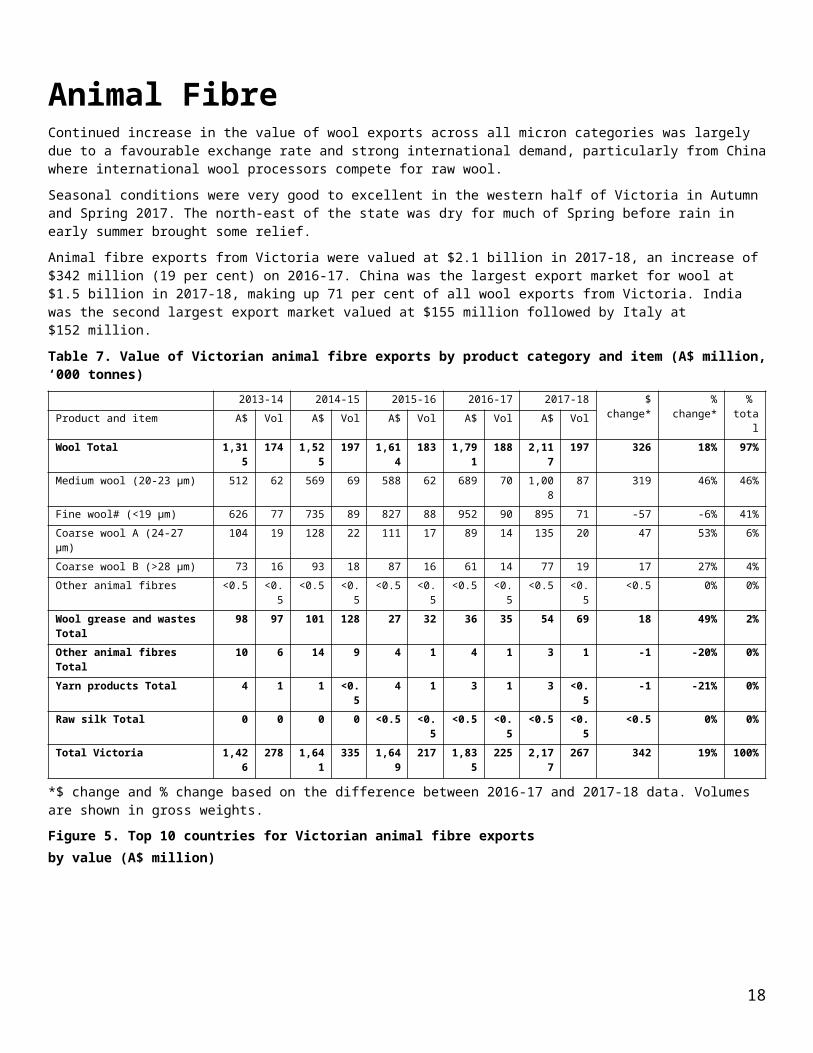
Animal fibre exports from Victoria were valued at $2.1 billion in 2017-18, an increase of $342 million (19 per cent) on 2016-17. China was the largest export market for wool at $1.5 billion in 2017-18, making up 71 per cent of all wool exports from Victoria. India was the second largest export market valued at $155 million followed by Italy at $152 million.
Table 7. Value of Victorian animal fibre exports by product category and item (A$ million, ‘000 tonnes)2013-14 2014-15 2015-16 2016-17 2017-18 $
change*%
change*%
total Product and item A$ Vol A$ Vol A$ Vol A$ Vol A$ Vol
Wool Total 1,315 174 1,525 197 1,614 183 1,791 188 2,117 197 326 18% 97%Medium wool (20-23 μm) 512 62 569 69 588 62 689 70 1,008 87 319 46% 46%Fine wool# (<19 μm) 626 77 735 89 827 88 952 90 895 71 -57 -6% 41%
Coarse wool A (24-27 μm) 104 19 128 22 111 17 89 14 135 20 47 53% 6%Coarse wool B (>28 μm) 73 16 93 18 87 16 61 14 77 19 17 27% 4%
Other animal fibres <0.5 <0.5 <0.5 <0.5 <0.5 <0.5
<0.5 <0.5 <0.5 <0.5 <0.5 0% 0%
Wool grease and wastes Total
98 97 101 128 27 32 36 35 54 69 18 49% 2%
Other animal fibres Total 10 6 14 9 4 1 4 1 3 1 -1 -20% 0%Yarn products Total 4 1 1 <0.5 4 1 3 1 3 <0.5 -1 -21% 0%Raw silk Total 0 0 0 0 <0.5 <0.
5<0.5 <0.5 <0.5 <0.5 <0.5 0% 0%
Total Victoria 1,426 278 1,641 335 1,649 217 1,835 225 2,177 267 342 19% 100%
*$ change and % change based on the difference between 2016-17 and 2017-18 data. Volumes are shown in gross weights.
Figure 5. Top 10 countries for Victorian animal fibre exports by value (A$ million)
14

Figure 6. Value (%) Australiananimal fibre exports by state of origin 2017-18
*others refers to ACT, NT, re-exports,and exports for which no state detailsare released for confidentiality reasons
15
DairyAll Victorian dairying regions had challenging conditions in 2017-18. Reduced rainfall compared to the previous year resulted in decreased home-grown feed as a percentage of metabolisable energy consumed. Some farmers fed additional imported fodder, at generally higher prices, and used their feed reserves to manage over summer.
While the season was challenging, the average milk price increased by 15 per cent.
The trend in the industry has been for increased processing of higher value dairy products to meet rising domestic and international demand. Butter prices are expected to remain high, and forecast world prices for cheese remain positive. Whole milk powder and infant formula demand continues to grow strongly in the key China market.
Dairy exports from Victoria were valued at $1.9 billion in 2017-18, an increase of $160 million (nine per cent on 2016-17). Victoria accounted for 79 per cent of national dairy exports. Milk and cream products (worth $933 million) and cheese and whey product (worth $832 million) were the most valuable dairy categories making up 93 per cent of Victorian dairy exports. Japan remained the largest export market for dairy products in 2017-18, valued at $442 million. Dairy exports to China were valued at $415 million, an increase of $89 million (27 per cent) on the previous year.
Table 8. Value of Victorian dairy exports by product category and item (A$ million, ‘000 tonnes)2013-14 2014-15 2015-16 2016-17 2017-18 $ change* %
change*%
total Product and item A$ Vol A$ Vol A$ Vol A$ Vol A$ Vol
Other food preparations Total
168 42 286
49 594 65 687 73 735 71 48 7% 43%
Cereal based Total 452 102 383
83 430 92 497 98 643 115 146 21% 38%
Confectionery Total 147 28 139
27 145 29 152 30 159 31 7 1% 9%
Cocoa and cocoa products 120 22 115
21 120 23 128 24 133 25 5 1% 8%
Sugar confectionery 27 7 24 6 25 6 24 6 26 6 2 0% 2%
Condiments Total 70 18 83 20 78 19 78 19 99 25 21 3% 6%Sugars Total 39 26 35 23 43 28 40 26 40 40 0 0% 2%Sugar 36 25 31 22 38 27 36 26 35 40 -1 0% 2%Honey 4 <0.5 4 <0.5 5 <0.5 4 <0.5 6 <0.5 1 0% 0%
Beverages Total 31 26 32 27 31 33 30 25 37 28 7 1% 2%Spirits 19 13 17 11 13 7 13 8 17 11 4 1% 1%
Non-alcoholic 11 12 13 15 13 23 13 14 10 12 -3 0% 1%Cider 0 0 3 1 5 3 2 1 6 3 4 1% 0%
Total Victoria 907 242 957
228 1,322
265 1,483
269 1,713
311 229 15% 100%
*$ change and % change based on the difference between 2016-17 and 2017-18 data. Volumes are shown in gross weights.**Prepared foods are classified as those which have been substantially transformed from their raw product basis and may have input from more than one food production industry.
16
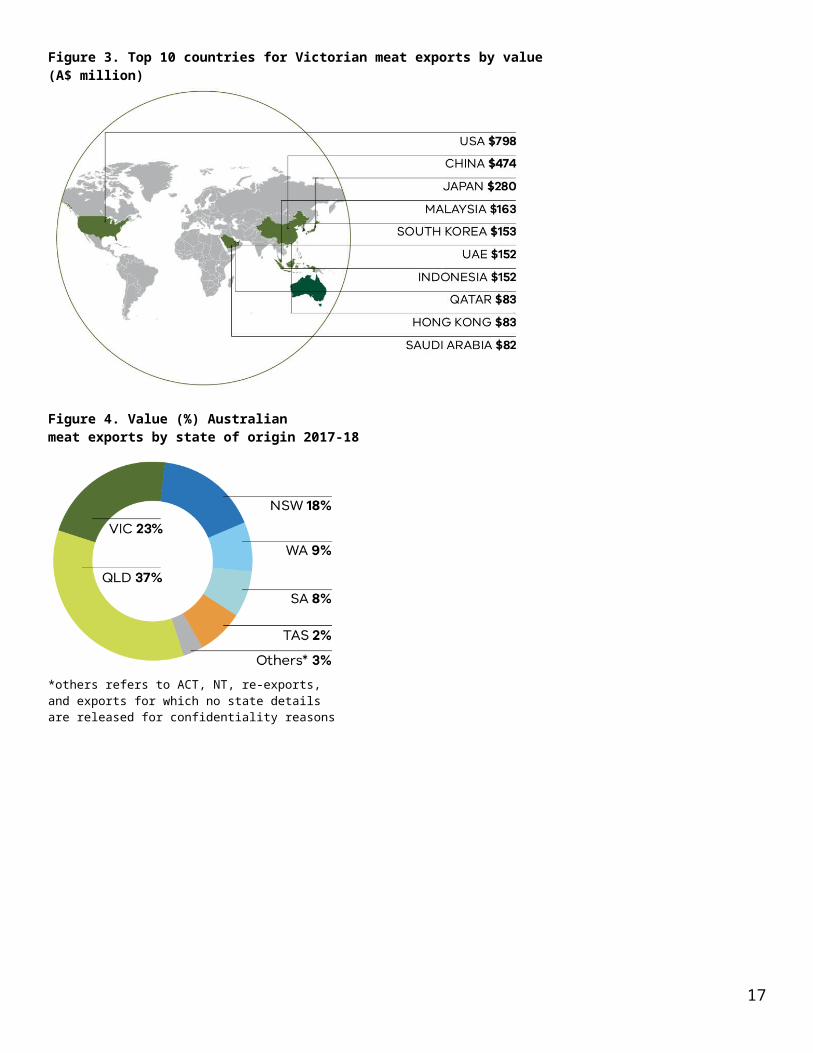
Figure 7. Top 10 countries for Victorian dairy exports by value(A$ million)A map showing the top ten countries for animal fibre exports by value.
Figure 8. Value (%) Australiandairy exports by state of origin2017-18
*others refers to ACT, NT, re-exports, and exports for which no state details are released for confidentiality reasons
17
Prepared foodsVictoria is Australia’s major food processor, producing around 30 per cent of Australia’s prepared foods. High food safety and biosecurity standards and diverse regions contribute to our strong international reputation for safe, premium quality foods.
Victoria is also a global leader and innovator in research and development – a key driver for Victoria’s continued dominance in the Australian prepared food sector.
Opportunities exist in new sales channels, including e-commerce platforms in China and other markets, and businesses developing new innovative products and packaging to help differentiate themselves in global markets.
The opportunities lie in air freighted export of fresh, readymade meals to Asian markets where demand for fresh Australian produce is coupled with a fast-paced lifestyle.
The increasing number and wealth of the world’s middle class – and changing lifestyles – means consumers are increasingly seeking prepared meals. The quality and respect for Victoria’s raw materials means the state is ideally placed for investment in high-value food processing.
In 2017-18, prepared foods were valued at $1.7 billion, an increase of $229 million (15 per cent) on 2016-17. China was the highest value market for prepared foods, valued at $662 million, followed by New Zealand ($254 million) and Hong Kong ($204 million).
Table 9. Value of Victorian prepared foods** exports by product category and item (A$ million, ‘000 tonnes)2013-14 2014-15 2015-16 2016-17 2017-18 $ change* %
change*%
total Product and item A$ Vol A$ Vol A$ Vol A$ Vol A$ Vol
Other food preparations Total
168 42 286
49 594 65 687 73 735 71 48 7% 43%
Cereal based Total 452 102 383
83 430 92 497 98 643 115 146 21% 38%
Confectionery Total 147 28 139
27 145 29 152 30 159 31 7 1% 9%
Cocoa and cocoa products 120 22 115
21 120 23 128 24 133 25 5 1% 8%
Sugar confectionery 27 7 24 6 25 6 24 6 26 6 2 0% 2%
Condiments Total 70 18 83 20 78 19 78 19 99 25 21 3% 6%Sugars Total 39 26 35 23 43 28 40 26 40 40 0 0% 2%Sugar 36 25 31 22 38 27 36 26 35 40 -1 0% 2%Honey 4 <0.5 4 <0.5 5 <0.5 4 <0.5 6 <0.5 1 0% 0%
Beverages Total 31 26 32 27 31 33 30 25 37 28 7 1% 2%Spirits 19 13 17 11 13 7 13 8 17 11 4 1% 1%
Non-alcoholic 11 12 13 15 13 23 13 14 10 12 -3 0% 1%Cider 0 0 3 1 5 3 2 1 6 3 4 1% 0%
Total Victoria 907 242 957
228 1,322
265 1,483
269 1,713
311 229 15% 100%
*$ change and % change based on the difference between 2016-17 and 2017-18 data. Volumes are shown in gross weights.**Prepared foods are classified as those which have been substantially transformed from their raw product basis and may have input from more than one food production industry.
18
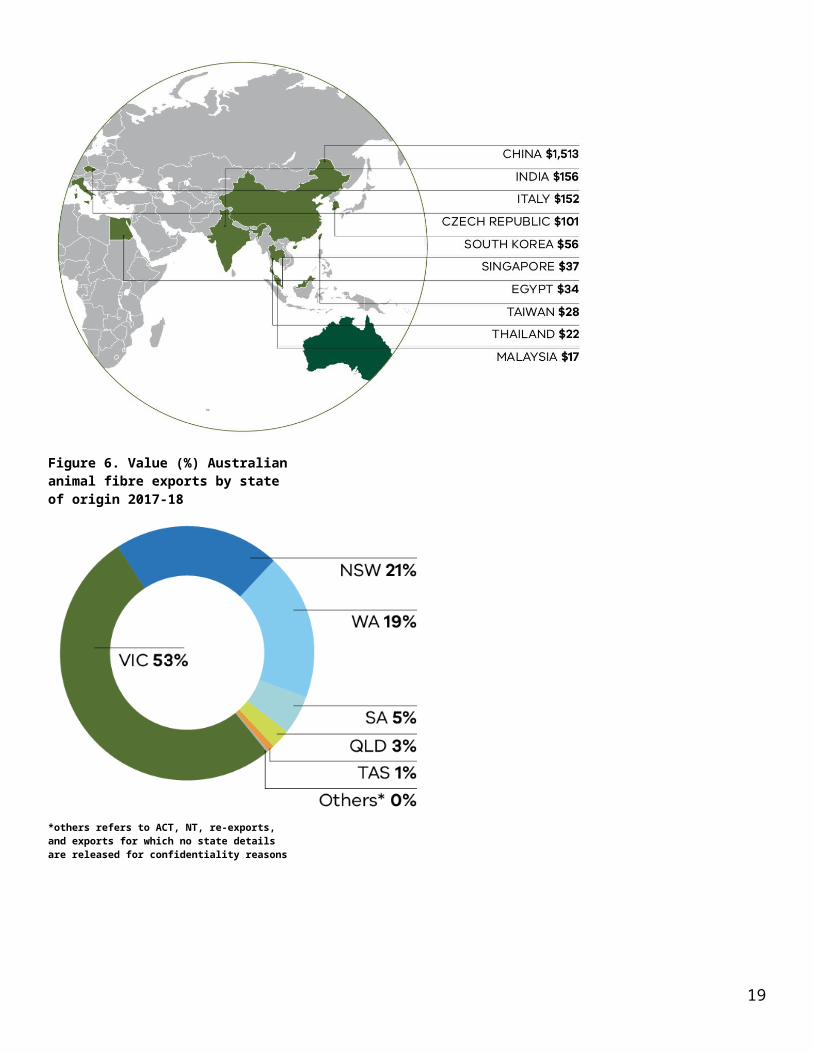
Figure 9. Top 10 countries for Victorian prepared foods exports by value (A$ million)
Figure 10. Value (%) Australian prepared foods exports by state of origin 2017-18
*others refers to ACT, NT, re-exports, and exports for which no state details are released for confidentiality reasons
19

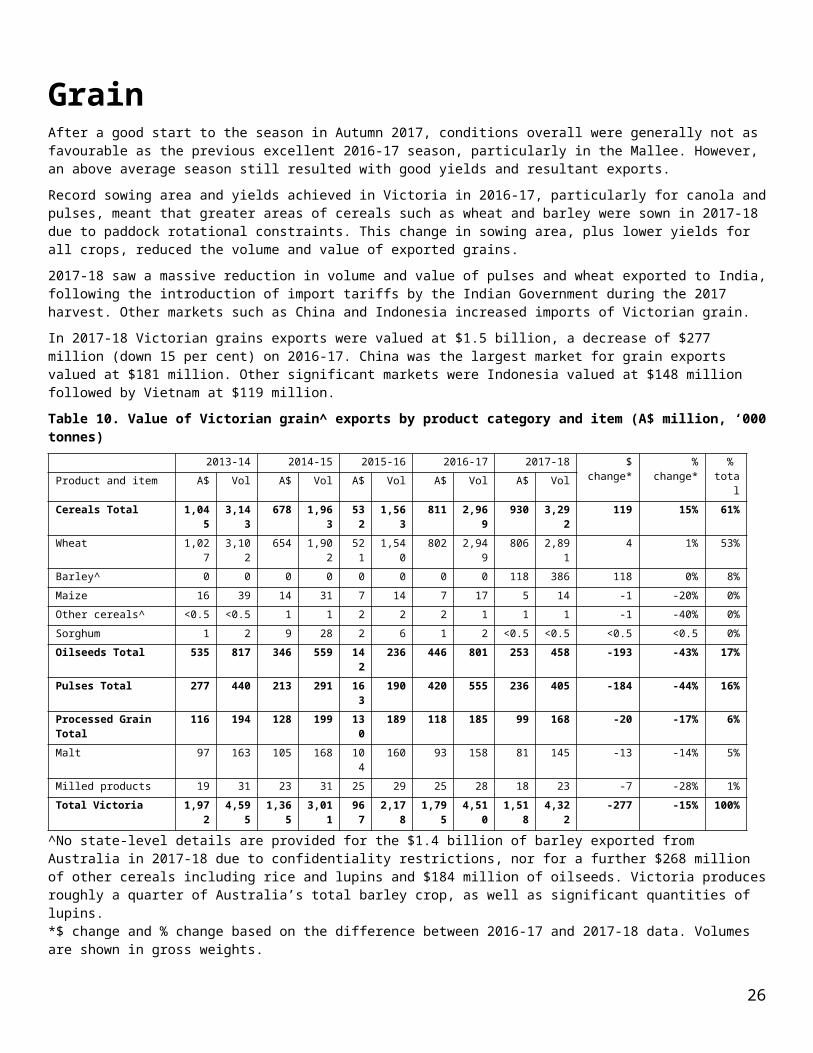
GrainAfter a good start to the season in Autumn 2017, conditions overall were generally not as favourable as the previous excellent 2016-17 season, particularly in the Mallee. However, an above average season still resulted with good yields and resultant exports.
Record sowing area and yields achieved in Victoria in 2016-17, particularly for canola and pulses, meant that greater areas of cereals such as wheat and barley were sown in 2017-18 due to paddock rotational constraints. This change in sowing area, plus lower yields for all crops, reduced the volume and value of exported grains.
2017-18 saw a massive reduction in volume and value of pulses and wheat exported to India, following the introduction of import tariffs by the Indian Government during the 2017 harvest. Other markets such as China and Indonesia increased imports of Victorian grain.
In 2017-18 Victorian grains exports were valued at $1.5 billion, a decrease of $277 million (down 15 per cent) on 2016-17. China was the largest market for grain exports valued at $181 million. Other significant markets were Indonesia valued at $148 million followed by Vietnam at $119 million.
Table 10. Value of Victorian grain^ exports by product category and item (A$ million, ‘000 tonnes)2013-14 2014-15 2015-16 2016-17 2017-18 $ change* %
change*%
total Product and item A$ Vol A$ Vol A$ Vol A$ Vol A$ Vol
Cereals Total 1,045 3,143 678 1,963 532 1,563 811 2,969 930 3,292 119 15% 61%Wheat 1,027 3,102 654 1,902 521 1,540 802 2,949 806 2,891 4 1% 53%Barley^ 0 0 0 0 0 0 0 0 118 386 118 0% 8%
Maize 16 39 14 31 7 14 7 17 5 14 -1 -20% 0%Other cereals^ <0.5 <0.5 1 1 2 2 2 1 1 1 -1 -40% 0%
Sorghum 1 2 9 28 2 6 1 2 <0.5 <0.5 <0.5 <0.5 0%Oilseeds Total 535 817 346 559 142 236 446 801 253 458 -193 -43% 17%Pulses Total 277 440 213 291 163 190 420 555 236 405 -184 -44% 16%Processed Grain Total
116 194 128 199 130 189 118 185 99 168 -20 -17% 6%
Malt 97 163 105 168 104 160 93 158 81 145 -13 -14% 5%Milled products 19 31 23 31 25 29 25 28 18 23 -7 -28% 1%
Total Victoria 1,972 4,595 1,365
3,011 967 2,178 1,795
4,510 1,518
4,322 -277 -15% 100%
^No state-level details are provided for the $1.4 billion of barley exported from Australia in 2017-18 due to confidentiality restrictions, nor for a further $268 million of other cereals including rice and lupins and $184 million of oilseeds. Victoria produces roughly a quarter of Australia’s total barley crop, as well as significant quantities of lupins. *$ change and % change based on the difference between 2016-17 and 2017-18 data. Volumes are shown in gross weights.
20

Figure 11. Top 10 countries for Victorian grain by value (A$ million)
Figure 12. Value (%) Australian grain exports by state of origin 2017-18
*others refers to ACT, NT, re-exports, and exports for which no state details are released for confidentiality reasons
21
HorticultureThe 2017-18 season started with isolated late frosts in North-Western Victoria and hail in parts of Southern Victoria. However, mild conditions and little rain through late summer, resulted in a good season for horticulture, especially in Sunraysia.
Citrus exports increased by 23 per cent in 2017-18 due to strong demand for high quality produce. China was the largest export market for citrus for the second successive year, with exports soaring 59 per cent to a record $62 million.
Table grape exports into Japan and South Korea increased and revised market access protocols allowed for exports directly into China.
Despite challenging seasonal conditions, almond export tonnages were maintained, however prices were slightly lower than the previous season. Stonefruit exports increased by 48 per cent mainly due to market access to China.
Horticulture exports from Victoria were valued at $1.1 billion in 2017-18, an increase of $47 million (four per cent) on 2016-17. Fruit (fresh or dried) was the highest value category, making up 54 per cent of Victorian horticulture exports. Nuts (fresh or dried) was the second most valuable horticulture category, making up 28 per cent of horticulture exports. China was the highest value export market for horticulture exports, valued at $243 million in 2017-18. Table grapes comprised the majority of horticulture exports to China (59 per cent). India was the second largest horticulture export market valued at $142 million. Almonds were the major horticulture export to India (96 per cent). Japan was the third largest horticulture export market valued at $88 million. The majority of horticulture exports to Japan were table grapes (46 per cent).
Table 11. Value of Victorian horticulture exports by product category and item (A$ million, ‘000 tonnes)2013-14 2014-15 2015-16 2016-17 2017-18 $
change*%
change*%
total Product and item A$ Vol A$ Vol A$ Vol A$ Vol A$ Vol
Fruit (fresh or dried) Total 352 176 368 179 545 231 555 226 617 254 62 11% 54%Grapes 227 86 232 87 356 115 365 113 370 115 5 1% 32%Citrus 80 73 77 69 104 84 120 89 147 104 28 23% 13%
Stone fruit 32 9 42 12 53 14 46 12 68 17 22 48% 6%Pome fruit 10 7 12 8 24 14 15 9 24 16 9 60% 2%
Other fruit 3 2 5 2 8 3 9 3 7 3 -1 -15% 1%Berry fruit <0.5 <0.5 <0.5 <0.5 <0.5 <0.5 <0.5 <0.5 <0.5 <0.5 0 0% 0%
Nuts (fresh or dried) Total 364 54 386 45 462 47 340 51 325 50 -15 -4% 28%Almonds 361 53 381 45 451 46 330 50 314 49 -16 -5% 27%
Other nuts 3 1 5 0 11 1 10 1 11 1 1 7% 1%Oils and extracts Total 45 18 50 24 54 20 65 38 70 41 5 7% 6%Processed horticulture Total 62 36 53 31 56 32 63 38 56 23 -6 -10% 5%Vegetables 31 21 32 19 38 25 43 28 35 16 -9 -20% 3%
Fruit and vegetable juices 21 11 19 11 14 7 15 8 12 6 -3 -22% 1%Fruit 11 4 2 1 4 1 4 1 10 2 6 133% 1%
Vegetables (fresh or dried) Total 31 14 35 13 48 17 57 19 51 15 -5 -10% 4%Perennial vegetables 16 3 20 4 25 5 31 6 28 4 -3 -11% 2%
Leaf vegetables and brassicas 9 4 11 5 18 10 21 10 18 7 -2 -11% 2%Roots, tubers and bulbs 5 7 3 4 4 2 4 2 4 3 <0.5 0% 0%
Other vegetables <0.5 <0.5 1 <0.5 1 <0.5 1 1 1 1 <0.5 0% 0%Coffee, tea, herbs and spices Total
17 2 17 2 23 2 20 2 27 3 7 33% 2%
Extracts and oils Total 0 0 0 0 0 0 <0.5 <0.5 <0.5 0 <0.5 0% 0%Total Victoria 871 301 908 294 1,188 351 1,100 373 1,14
7386 47 4% 100%
*$ change and % change based on the difference between 2016-17 and 2017-18 data. Volumes are shown in gross weights.
22
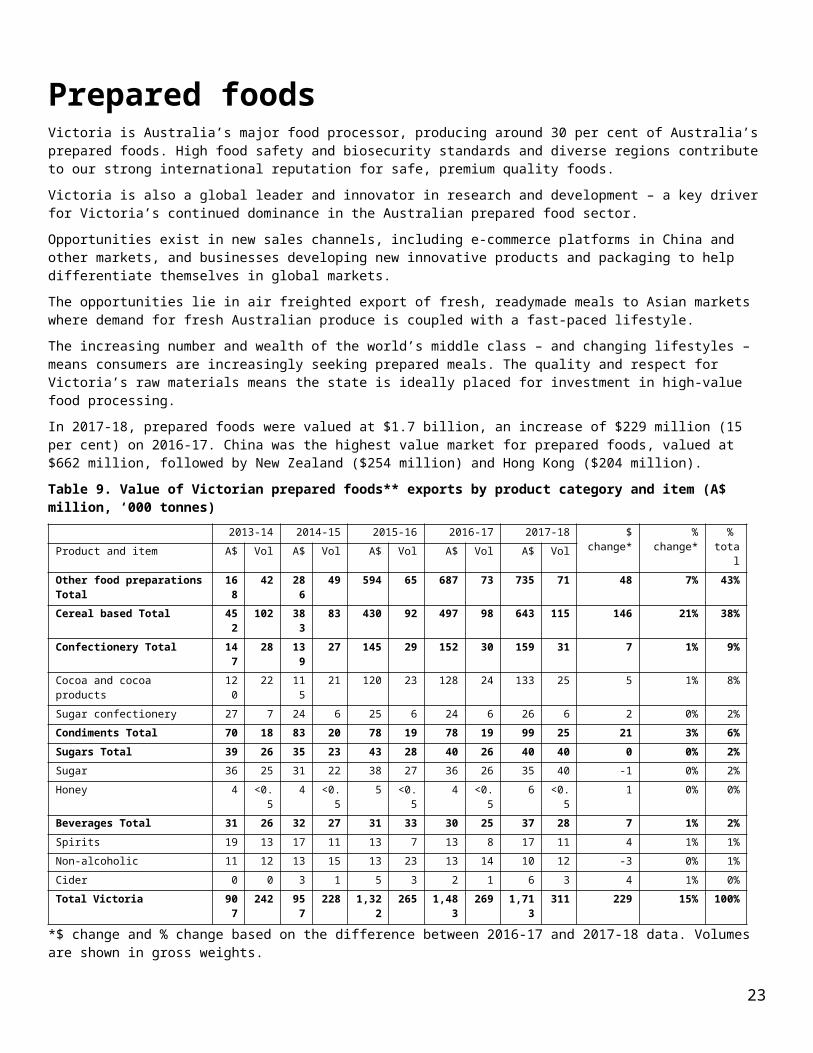
Figure 13. Top 10 countries for Victorian horticulture exports by value (A$ million)
Figure 14. Value (%) Australian horticulture exports by state of origin 2017-18
*others refers to ACT, NT, re-exports, and exports for which no state details are released for confidentiality reasons
23

Forest productsThe forest and wood products industry in Victoria is widespread and diverse. Production occurs from Central, West and East Gippsland, the Central Highlands to the North-East, and Western Victoria.
Across Victoria, the industry directly employs more than 15,000 people including secondary processing. In addition, the forest industry indirectly supports over 13,000 jobs. Many additional indirect jobs are generated from secondary processing. There has been an overall decline in forestry employment over time, including a 25 per cent decline between 2011 and 2016 (Census data).
Victoria’s forest products are predominantly exported to the Asia-Pacific Region. China is the largest destination (47 per cent).
In 2017-18, reportable Victorian forest products exports were valued at $726 million, a decrease of $67 million (down 8 per cent) on 2016-17. China was the highest value export market for Victorian forest products valued at $341 million. The majority of forest products to China were roundwood (77 per cent) followed by waste paper which decreased by 32 per cent in 2017-18 on 2016-17. New Zealand was the second largest export market for forest products exports valued at $141 million. The majority of forest products export to New Zealand were paper and paperboard (93 per cent).
Table 12. Value of Victorian forest products^ exports by product category and item (A$ million, ‘000 tonnes)2013-14 2014-15 2015-16 2016-17 2017-18 $ change* % change* %
total Product and item A$ Vol A$ Vol A$ Vol A$ Vol A$ Vol
Paper and paperboard Total
384 462 368 406 338 365 376 469 317 298 -59 -16% 44%
Packaging and industrial 168 256 162 231 157 216 172 235 168 192 -4 -2% 23%Printing and writing 135 151 142 145 126 132 139 205 87 81 -52 -38% 12%
Paper manufactures 56 45 47 22 42 14 55 26 61 24 6 10% 8%Household and sanitary 25 10 18 8 12 3 9 3 2 1 -8 -83% 0%
Packaging and industrial <0.5 <0.5 <0.5 <0.5 <0.5 <0.5 <0.5 <0.5 <0.5 <0.5 0 0% 0%Roundwood^ Total 177 1,646 171 1,683 208 2,000 273 2,273 266 2,255 -7 -3% 37%Wastepaper Total 94 626 94 653 106 720 101 660 104 636 3 3% 14%Sawnwood Total 30 61 28 55 25 50 38 189 32 159 -6 -15% 4%Softwood-roughsawn 22 53 21 50 19 45 29 180 25 153 -4 -14% 3%Hardwood-roughsawn 7 6 6 5 5 4 7 7 7 5 -1 -11% 1%
Hardwood-dressed 1 1 1 1 2 2 2 1 1 1 -1 -38% 0%Softwood-dressed <0.5 1 <0.5 <0.5 <0.5 <0.5 <0.5 <0.5 <0.5 <0.5 <0.5 0% 0%
Wood-based panels Total 2 1 2 2 4 3 4 2 5 3 1 35% 1%Other forest products Total 1 2 1 1 1 1 1 1 1 1 0 -34% 0%Pulp Total <0.5 <0.5 <0.5 <0.5 <0.5 <0.5 <0.5 <0.5 1 <0.5 <0.5 0% 0%Wood pulp 0 0 <0.5 0 0 <0.5 0 0 1 <0.5 1 0% 0%
Paper pulp <0.5 <0.5 <0.5 <0.5 <0.5 <0.5 <0.5 <0.5 <0.5 <0.5 <0.5 0% 0%Woodchips^ Total 0 0 33 373 37 398 0 0 0 0 0 0% 0%Total Victoria 688 2,798 696 3,173 720 3,538 793 3,593 726 3,352 -67 -8% 100%
^Export figures need to be used with caution. Some forestry exports are affected by confidentiality agreements.*$ change and % change based on the difference between 2016-17 and 2017-18 data. Volumes are shown in gross weights. 1. The Australian Bureau of Statistics did not publish state-level detail for woodchip exports from 2013–14 to 2017-18 due to confidentiality restrictions. Total Australian hardwood woodchip data exports in 2017-18 were valued at $1.308 billion. Further, there was no state detail published for $6 million of roundwood. The exclusion of woodchip leads to significantly lower Victorian export values and volumes. The last complete state-level woodchip data from 2012–13, reported a Victorian export value of $187 million. 2. Note that Japan is traditionally the largest export market for Victorian forest products and is under-represented in the data provided, due to the ABS confidentiality restrictions applied to state-level woodchip trade. Japan received over $145 million of reported Victorian forest product exports woodchips in 2012–13, with over 98 per cent of this woodchip exports. Accordingly if woodchip data was available, Japan is likely to be either the largest or second-largest export market by value, potentially changing the rankings of other export destinations.
24

Figure 15. Top 10 countries for Victorian forests products exports by value (A$ million)
Figure 16. Value (%) Australian forest products exports by state of origin 2017-18
*others refers to ACT, NT, re-exports, and exports for which no state details are released for confidentiality reasons
25
Skins and hidesVictorian skins and hides products exports were valued at $463 million in 2017-18, an increase of $54 million (up 13 per cent) on 2016-17. Victoria accounted for 46 per cent of Australia’s total skins and hides products exports. China was by far the largest export market for Victorian skins and hides in 2017-18 worth $387 million in total, up 14 per cent on the previous year.
Table 13. Value of Victorian skins and hides products exports by product category and item (A$ million, ‘000 tonnes)
2013-14 2014-15 2015-16 2016-17 2017-18 $ change* % change*
% total Product and item A$ Vol A$ Vol A$ Vol A$ Vol A$ Vol
Sheepskin Total 273 123
259 132
267 116 240
109 281 128
42 17% 61%
Cattle hides Total 253 65 285 76 238 69 164
57 176 65 11 7% 38%
Other skins and hides total 6 2 6 2 6 2 5 2 6 2 1 20% 1%Total Victoria 532 19
0551 21
1512 187 40
9168 463 19
554 13% 100%
*$ change and % change based on the difference between 2016-17 and 2017-18 data. Volumes are shown in gross weights.
Figure 17. Top 10 countries for Victorian skin and hides by value (A$ million)
26

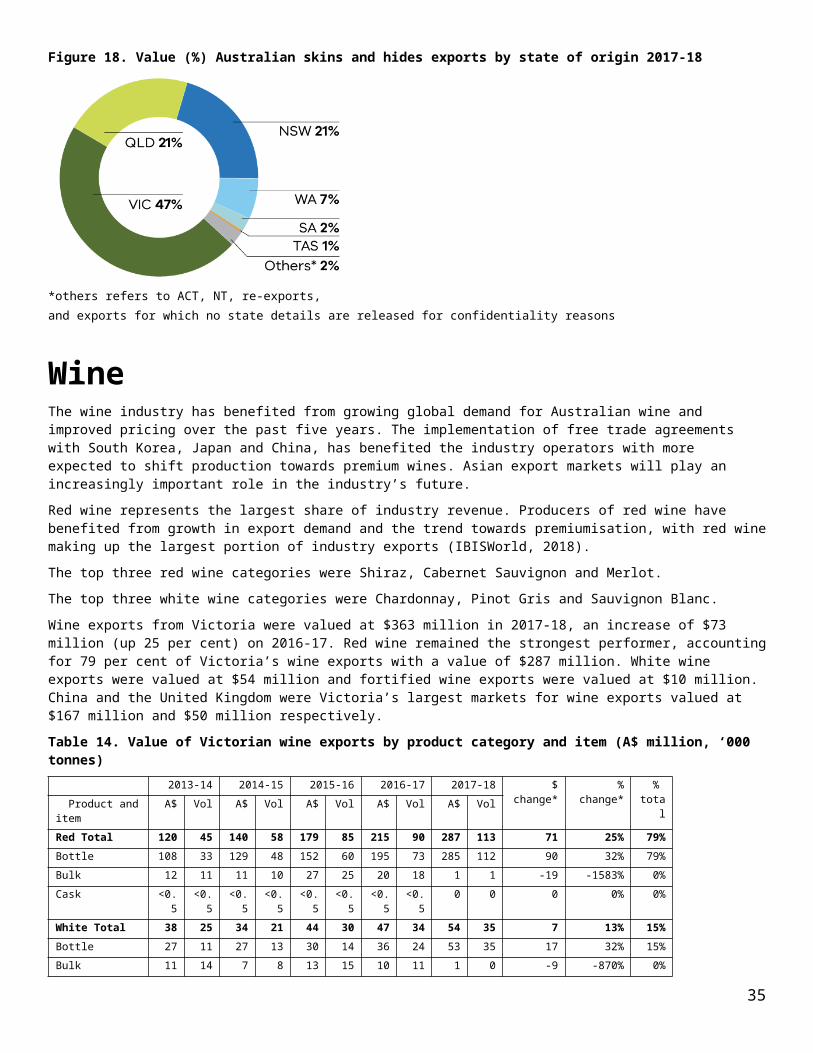
Figure 18. Value (%) Australian skins and hides exports by state of origin 2017-18
*others refers to ACT, NT, re-exports, and exports for which no state details are released for confidentiality reasons
WineThe wine industry has benefited from growing global demand for Australian wine and improved pricing over the past five years. The implementation of free trade agreements with South Korea, Japan and China, has benefited the industry operators with more expected to shift production towards premium wines. Asian export markets will play an increasingly important role in the industry’s future.
Red wine represents the largest share of industry revenue. Producers of red wine have benefited from growth in export demand and the trend towards premiumisation, with red wine making up the largest portion of industry exports (IBISWorld, 2018).
The top three red wine categories were Shiraz, Cabernet Sauvignon and Merlot.
The top three white wine categories were Chardonnay, Pinot Gris and Sauvignon Blanc.
Wine exports from Victoria were valued at $363 million in 2017-18, an increase of $73 million (up 25 per cent) on 2016-17. Red wine remained the strongest performer, accounting for 79 per cent of Victoria’s wine exports with a value of $287 million. White wine exports were valued at $54 million and fortified wine exports were valued at $10 million. China and the United Kingdom were Victoria’s largest markets for wine exports valued at $167 million and $50 million respectively.
Table 14. Value of Victorian wine exports by product category and item (A$ million, ‘000 tonnes)2013-14 2014-15 2015-16 2016-17 2017-18 $ change* %
change*%
total Product and item A$ Vol A$ Vol A$ Vol A$ Vol A$ Vol
Red Total 120 45 140 58 179 85 215 90 287 113 71 25% 79%Bottle 108 33 129 48 152 60 195 73 285 112 90 32% 79%Bulk 12 11 11 10 27 25 20 18 1 1 -19 -1583% 0%
Cask <0.5
<0.5 <0.5 <0.5
<0.5 <0.5 <0.5 <0.5
0 0 0 0% 0%
White Total 38 25 34 21 44 30 47 34 54 35 7 13% 15%Bottle 27 11 27 13 30 14 36 24 53 35 17 32% 15%Bulk 11 14 7 8 13 15 10 11 1 0 -9 -870% 0%
Cask 0 0 0 0 0 0 0 0 0 0 0 0% 0%Sparkling Total 19 7 17 6 18 6 14 2 12 3 -8 0% 0%Fortified Total 4 1 9 2 9 1 13 3 10 3 -3 -33% 3%Bottle 3 1 7 1 8 1 12 3 9 2 -3 -35% 2%
Bulk 1 <0.5 1 1 1 <0.5 2 <0.5
1 <0.5 -1 -71% 0%
Cask 0 0 <0.5 <0.5
<0.5 <0.5 <0.5 <0.5
<0.5 <0.5 <0.5 0% 0%
Total Victoria 182 78 200 88 251 122 290 132 363 154 73 25% 100%
27

*$ change and % change based on the difference between 2016-17 and 2017-18 data. Volumes are shown in gross weights.Figure 19. Top 10 countries for Victorian wine by value (A$ million)
Figure 20. Value (%) Australian wine exports by state of origin 2017-18
*others refers to ACT, NT, re-exports, and exports for which no state details are released for confidentiality reasons
28

Textile, clothing and footwearThe Victorian textile, clothing and footwear (TCF) manufacturing industry is the largest in Australia, employing around 13,200 people in 2018. The industry covers the processing of natural and synthetic materials, and the production of clothing, textile, footwear, leather goods and technical textiles.
In 2017-18, TCF exports from Victoria were valued at $270 million, a decrease of $161 million (down 37 per cent) on 2016-17 reflecting broader industry trends in the manufacturing sector. Textiles, including yarn products and fabrics, were the largest export category, making up 77 per cent of Victoria’s TCF exports.
New Zealand was the largest market for Victorian TCF valued at $72 million, followed by the USA at $24 million and the UAE at $20 million.
Table 15. Value of Victorian TCF^ exports by product category and item (A$ million, ‘000 tonnes)2013-14 2014-15 2015-16 2016-17 2017-18 $ change* % change* %
total Product and item A$ Vol A$ Vol A$ Vol A$ Vol A$ Vol
Textiles Total+ 503 223 304
135 343 143 366
164 207 94 -159 -43% 77%
Yarn products 432 164 235
75 276 89 299
107 130 33 -169 -57% 48%
Fabrics 68 59 51 55 58 53 62 57 72 60 9 15% 26%
Manchester 3 <0.5 18 5 9 2 4 <0.5 6 <0.5 1 24% 2%Clothing Total 22 1 31 1 49 1 41 1 36 1 -6 -14% 13%Footwear Total 13 1 13 1 14 1 13 1 17 1 4 28% 6%Leather articles Total 5 1 6 <0.5 11 <0.5 10 <0.5 10 <0.5 0 -1% 4%Leather articles 2 <0.5 2 <0.5 7 <0.5 8 <0.5 7 <0.5 -1 -15% 3%Leather apparel 2 <0.5 4 <0.5 4 <0.5 2 <0.5 3 <0.5 1 59% 1%
Woven fabrics Total <0.5 <0.5 1 <0.5 1 <0.5 1 <0.5 <0.5 <0.5 <0.5 0% 0%Total Victoria 543 225 35
5138 418 146 43
2166 270 96 -161 -37% 100%
*$ change and % change based on the difference between 2016-17 and 2017-18 data. Volumes are shown in gross weights. ^Export figures need to be used with caution. Some TCF exports are affected by confidentiality agreements.+The Australian Bureau of Statistics (ABS) did not publish state-level detail for cotton in 2017-18 due to confidentiality restrictions.
29

Figure 21. Top 10 countries for Victorian TCF by value (A$ million) double check the maps and donut charts to make sure I’ve matched the correct commodities?
30

Figure 22. Value (%) Australian TCF exports by state of origin 2017-18
*others refers to ACT, NT, re-exports, and exports for which no state details are released for confidentiality reasons
31

Animal feedAnimal feed exports from Victoria were valued at $263 million in 2017-18, an increase of 28 million (up 12 per cent) on 2016-17. Japan remained the highest value market at $70 million, followed by China ($32 million) and the USA ($31 million).
Table 16. Value of Victorian animal feed^ exports by product category and item (A$ million, ‘000 tonnes)2013-14 2014-15 2015-16 2016-17 2017-18 $ change* %
change*%
total Product category A$ Vol A$ Vol A$ Vol A$ Vol A$ Vol
Stock feed Total
153 306 182 340
190 379 164
339 192 396
28 17% 73%
Pet food Total 76 33 75 34 77 34 72 31 71 31 0 0% 27%Total Victoria 229 339 256 37
3267 413 23
5370 263 42
828 12% 100%
^Export figures need to be used with caution. Some animal feed exports are affected by confidentiality agreements. *$ change and % change based on the difference between 2016-17 and 2017-18 data. Volumes are shown in gross weights.
Figure 23. Top 10 countries for Victorian animal feed by value (A$ million)
Figure 24. Value (%) Australian animal feed exports by state of origin 2017-18
*others refers to ACT, NT, re-exports, and exports for which no state details are released for confidentiality reasons
32

SeafoodVictoria’s seafood is sourced from a combination of wild capture and aquaculture. Victorian fisheries exports are dominated by high value products such as rock lobster, abalone, giant crab and scallop wild-catch, which are quota managed. Farmed abalone, mussel and barramundi exports are expected to continue to grow with the expansion of aquaculture farms.
The wild abalone and rock lobster fishery is one of Victoria’s most valuable professional fisheries, with almost all the catch exported to international markets, predominately in Asia.
Seafood exports from Victoria were valued at $240 million in 2017-18, (up 18 per cent) on 2016-17. Crustaceans were the highest value export from Victoria valued at $160 million followed by molluscs at $68 million. China and Hong Kong were Victoria’s major seafood markets in 2017-18 at $150 million and $38 million respectively.
Table 17. Value of Victorian seafood exports by product category and item (A$ million, ‘000 tonnes)
2013-14 2014-15 2015-16 2016-17 2017-18 $ change* % change*
% total Product and item A$ Vol A$ Vol A$ Vol A$ Vol A$ Vol
Crustaceans Total 97 1 111 1 111 1 119 1 160 2 41 35% 67%Lobster 97 1 111 1 111 1 118 1 159 2 41 35% 66%Other crustaceans 0 0 0 0 0 0 <0.5 <0.5 <0.
5<0.5 <0.5 0% 0%
Prepared or preserved 1 <0.5
1 <0.5 1 <0.5
1 <0.5 <0.5
<0.5 <0.5 0% 0%
Molluscs Total 65 1 59 1 60 1 69 1 68 1 0 0% 29%Abalone 36 1 34 1 32 1 44 1 38 1 -5 -13% 16%Prepared or preserved 22 <0.
517 <0.5 18 <0.
517 <0.5 21 <0.5 4 21% 9%
Other Molluscs 7 <0.5
8 <0.5 10 <0.5
8 <0.5 9 <0.5 2 21% 4%
Fish Total 5 1 7 1 21 14 15 9 9 1 -6 -39% 4%Live or fresh 2 <0.
52 <0.5 4 1 5 1 5 <0.5 0 5% 2%
Prepared or preserved 2 1 3 1 6 4 4 2 3 <0.5 -1 -36% 1%
Frozen 1 <0.5
1 1 12 9 6 5 2 1 -5 -75% 1%
Seafood extracts and oils Total
3 <0.5
4 <0.5 4 <0.5
2 <0.5 2 <0.5 1 57% 1%
Seaweed Total <0.5 <0.5
<0.5 <0.5 1 <0.5
<0.5 <0.5 <0.5
<0.5 <0.5 0% 0%
Total Victoria 170 4 181 4 197 17 204 12 240 5 36 18% 100%
*$ change and % change based on the difference between 2016-17 and 2017-18 data. Volumes are shown in gross weights.
33
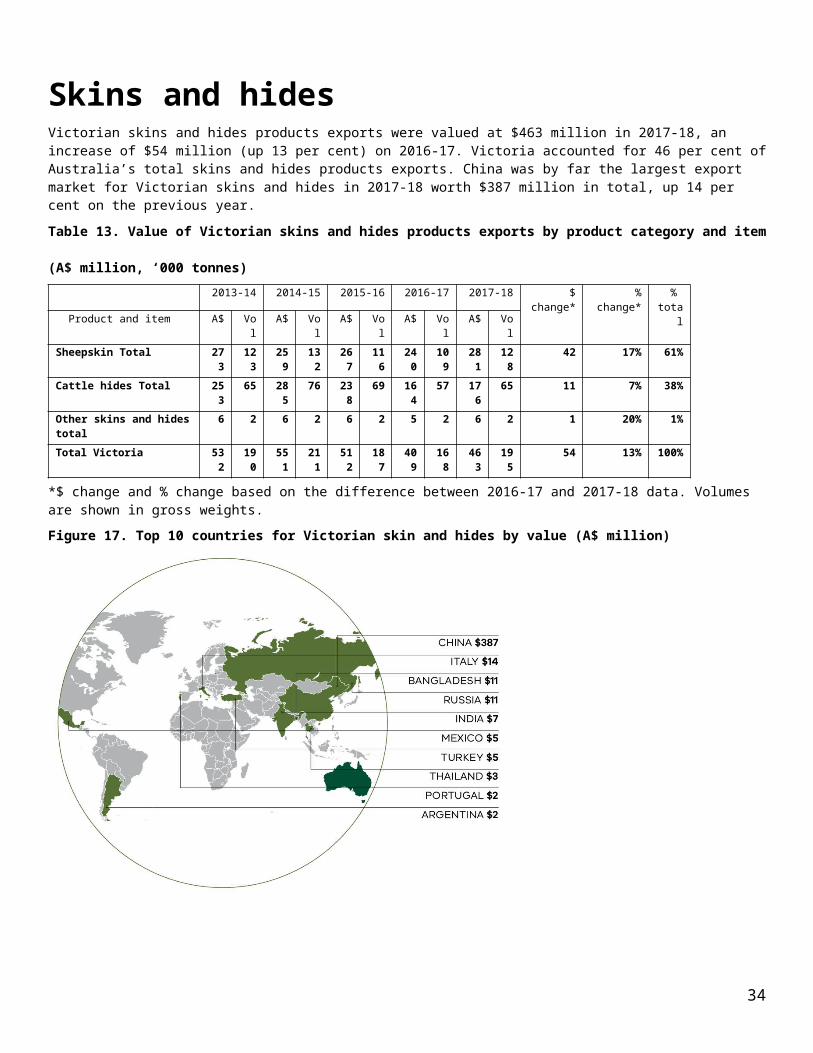
Figure 25. Top 10 countries for Victorian seafood by value (A$ million)
Figure 26. Value (%) Australian seafood exports by state of origin 2017-18
*others refers to ACT, NT, re-exports, and exports for which no state details are released for confidentiality reasons
34
Export Performance by Region and Key Destinations
Case study: Re-opening cherries access to VietnamIn August 2017, Victorian cherries returned to Vietnam after the re-opening of trade under new market access conditions.
In 2014, Vietnam was a promising emerging market for Victorian cherries with 115 tonnes, valued at $1.6 million exported from Victoria. In January 2015 market access was suspended for Australian cherry exports to Vietnam due to concerns over fruit fly. The loss of this key market had a significant impact on Victoria’s horticultural sector.
In August 2017, Australian cherries regained access to Vietnam under a new protocol that enabled Victoria to use irradiation or cold disinfestation to treat for fruit fly prior to export. This was a huge step forward in regaining access to this important market, particularly as irradiation was included in the protocol. This treatment is highly effective against fruit fly and offers many more benefits to soft fruits such as cherries because it doesn’t have the same negative impacts on fruit quality and shelf life as other treatments.
The new market access conditions will allow for the irradiation and air-freight of fruit, ensuring that produce entering the Vietnamese market meets the highest quality and freshness standards within efficient timeframes to access premium fruit pricing. This will in turn provide the best returns for Victorian producers and rural communities.
The new conditions were announced in time for the 2017-18 cherry season and Australia exported 392 tonnes of cherries, worth about $7 million to Vietnam. This market access achievement has the potential to boost Victorian horticulture exports into the future. The Cherry Growers Association has predicted an increase of 50 per cent in exports to Vietnam in 2018-19.
A ‘Taste Australia’ promotional campaign was undertaken jointly by the Victorian Government, Austrade, Horticulture Innovation Australia Limited and the New South Wales Government to promote Australian cherries in Vietnam. The campaign included a series of events and promotional activities held across major retail chains from December 2017 to February 2018 to coincide with the first season of new access.
The positive reception of Australian cherries in Vietnam and seasonal success highlights the importance of these markets to Victorian producers and the need to protect market access through awareness and adherence to international phytosanitary protocols.
35

North AsiaNorth Asia is both the largest and fastest growing of Victoria’s food and fibre export regions. China is Victoria’s strongest market for export growth and home to the world’s largest population. A booming middle-class and an increasing demand for premium goods, services, ideas and knowledge have opened key opportunities for Victorian businesses to establish valuable trade partnerships with China.
Since the China-Australia Free Trade Agreement (ChAFTA) began in 2015, significant export barriers have been removed, and Victoria’s agribusinesses are well placed to boost sales to China by exporting their premium food products and beverages.
Victoria shares a long and mutually beneficial economic partnership with Japan, the world’s third largest economy. Since the Japan-Australia Economic Partnership Agreement (JAEPA) began in 2015, Victorian businesses have been given preferential access to export their premium goods and services to Japan. Victorian agribusinesses are well placed to supply premium meat and dairy products, citrus, table grapes and nuts, food ingredients and unique premium food.
South Korea is the fourth largest economy in Asia with a population of over 50 million. Increasing demand for high-quality goods and services has provided key export opportunities across a range of Victoria’s market sectors. Since the Korea-Australia Free Trade Agreement (KAFTA) began in 2014, significant trade and export barriers have been removed improving access to the Korean marketplace. There are substantial export opportunities for Victorian agribusinesses to meet increasing demand for high-quality beef, dairy, horticulture and healthy functional foods.
Table 18. Victorian food and fibre exports^ to North Asia by Destination (A$ million, ‘000 tonnes)2013-14 2014-15 2015-16 2016-17 2017-18 $
change*%
change*%
totalDestination A$ Vol A$ Vol A$ Vol A$ Vol A$ Vol
China 2,947 3,169 2,932 3,075 3,218 3,291 3,613 3,858 4,582 4,142 969 27% 67%
Japan 831 348 966 762 990 746 918 385 1,088 390 170 18% 16%
Hong Kong 390 130 420 124 498 122 502 117 513 101 11 2% 8%
South Korea 369 405 402 388 400 337 385 332 366 188 -18 -5% 5%
Taiwan 248 268 234 216 233 213 242 213 238 225 -4 -2% 4%
Macau 2 1 1 1 1 1 2 1 2 1 1 32% 0%
Mongolia <0.5 <0.5 <0.5 <0.5 <0.5 9 <0.5 <0.5 <0.5 <0.5 0 0% 0%
Total Victoria 4,786 4,320 4,955 4,566 5,340 4,719 5,661 4,905 6,789 5,046 1,128 20% 100%
Table 19. Victorian food and fibre exports^ to North Asia by Industry (A$ million, ‘000 tonnes)Commodity group
2013-14 2014-15 2015-16 2016-17 2017-18 $ change*
% change*
% totalA$ Vol A$ Vol A$ Vol A$ Vol A$ Vol
Animal fibre 955 153 1,158 189 1,224 155 1,426 166 1,612 177 186 13% 24%Dairy 918 216 818 236 905 264 899 266 1,061 287 161 18% 16%Prepared foods** 264 67 366 76 674 100 858 98 1,045 115 187 22% 15%Meat 771 175 921 184 777 138 675 122 1,026 186 352 52% 15%Horticulture 211 95 241 105 357 136 388 148 432 159 44 11% 6%Skins and hides 412 164 428 183 406 165 344 147 389 171 45 13% 6%Forest products^ 281 2,148 303 2,574 358 2,987 405 3,014 373 2,770 -32 -8% 5%Grain^ 465 971 336 708 186 419 211 610 275 813 64 31% 4%Wine 76 23 96 32 118 38 153 45 201 61 48 32% 3%Seafood 56 1 47 1 51 1 101 2 201 3 99 98% 3%Animal feed^ 114 200 141 240 159 273 142 268 147 301 5 3% 2%TCF^ 262 107 101 38 124 43 59 20 27 6 -31 -54% 0%Total Victoria 4,786 4,320 4,955 4,566 5,340 4,719 5,661 4,905 6,789 5,046 1,128 20% 100%
^Export figures need to be used with caution. Some grain, forestry, TCF and animal feed exports are affected by confidentiality agreements.*$ change and % change based on the difference between 2016-17 and 2017-18 data. Volumes are shown in gross weights.
36

**Prepared foods are classified as those which have been substantially transformed from their raw product basis and may have input from more than one food production industry.
37

South East AsiaThe growing number of urban dwellers in South East Asia is a key feature driving a range of export opportunities for Victoria’s agribusinesses. Globally recognised as suppliers of high quality, clean, and safe food products, Victoria’s food and fibre sector is strongly placed to meet South East Asia’s growing demand for premium quality meat and dairy products, fruit and nuts, and wheat. Key markets include Indonesia, Malaysia, Singapore and Vietnam.
Victorian food and fibre exports to the South East Asia region were valued at $2.3 billion in 2017-18, an increase of three per cent on 2016-17. Wheat exports to the region grew in value with exports to Indonesia and Malaysia the most significant increasing by $37 million and $19 million respectively. Cheese exports to the region grew by 18 per cent during this period.
Table 20. Victorian food and fibre exports^ to South East Asia by Destination (A$ million, ‘000 tonnes)2013-14 2014-15 2015-16 2016-17 2017-18 $
change*%
change*%
totalDestination A$ Vol A$ Vol A$ Vol A$ Vol A$ Vol
Indonesia 632 685 573 419 556 484 560 548 597 800 37 7% 26%
Malaysia 489 276 468 289 404 292 419 386 498 503 79 19% 21%
Singapore 468 195 438 211 348 129 354 152 345 142 -9 -2% 15%
Vietnam 335 339 326 314 351 262 394 524 310 463 -84 -21% 13%
Thailand 369 274 317 220 245 179 269 303 289 320 19 7% 12%
Philippines 154 145 171 143 145 113 187 348 209 292 22 11% 9%
Myanmar 42 112 48 125 82 226 60 189 70 213 10 16% 3%
Brunei Darussalam 10 3 12 3 13 3 11 3 14 3 3 28% 1%
Cambodia 5 6 5 7 9 13 10 13 7 8 -2 -23% 0%
East Timor <0.5 <0.5 1 <0.5 1 1 1 <0.5 1 <0.5 0 2% 0%
Laos 2 2 1 <0.5 <0.5 <0.5 1 <0.5 <0.5 <0.5 0 0% 0%
Total Victoria 2,507 2,036 2,360 1,731 2,154 1,700 2,268 2,467 2,342 2,746 74 3% 100%
Table 21. Victorian food and fibre exports^ to South East Asia by Industry (A$ million, ‘000 tonnes)Commodity group
2013-14 2014-15 2015-16 2016-17 2017-18 $ change*
% change*
% totalA$ Vol A$ Vol A$ Vol A$ Vol A$ Vol
Dairy 759 173 719 199 585 208 573 205 566 198 -7 -1% 24%
Grain^ 484 1,241 364 865 355 912 519 1,727 537 1,834 18 3% 23%
Meat 379 96 417 98 400 89 408 91 498 105 90 22% 21%
Horticulture 158 71 155 68 252 94 241 95 265 89 23 10% 11%
Prepared foods** 216 59 191 47 153 41 178 46 183 58 5 3% 8%
Animal fibre 155 79 147 87 55 21 41 21 76 48 36 88% 3%
Forest products^ 58 191 70 241 58 212 61 173 76 315 15 25% 3%
Animal feed^ 57 66 71 76 58 71 48 52 56 64 8 17% 2%
TCF^ 107 50 75 37 93 42 93 48 39 27 -54 -58% 2%
Seafood 110 2 126 2 121 2 84 1 26 1 -58 -69% 1%
Wine 16 4 16 7 18 5 19 5 16 4 -2 -12% 1%
Skins and hides 8 3 8 3 6 3 3 2 3 2 1 26% 0%
Total Victoria 2,507 2,036 2,360 1,731 2,154 1,700 2,268 2,467 2,342 2,746 74 3% 100%
^Export figures need to be used with caution. Some grain, forestry, TCF and animal feed exports are affected by confidentiality agreements.*$ change and % change based on the difference between 2016-17 and 2017-18 data. Volumes are shown in gross weights.**Prepared foods are classified as those which have been substantially transformed from their raw product basis and may have input from more than one food production industry.
38

39

North AmericaVictoria’s trade relationship with North America is dominated by the United States of America (USA), which will continue to provide significant opportunities for Victorian exporters. Underpinning Victoria’s and the USA’s dynamic trade and investment relationship is the Australia-United States Free Trade Agreement (AUSFTA) which came into effect in 2005. Canada is also an important market with two-way direct investment between Canada and Australia at $39.3 billion in 2017.
Victoria’s highest value food and fibre exports to the USA are beef and sheepmeat respectively. The size of the USA market presents significant opportunities for agricultural producers as well as exporters of processed and health foods. Victoria’s innovations in agricultural technology are also highly relevant to the USA market.
Victorian food and fibre exports to North America were valued at $1 billion in 2017-18 (up 17 per cent). Meat exports made up the majority of exports to the region (79 per cent), consisting mainly of red meat to the USA, Victoria’s largest market for red meat products.
Table 22. Victorian food and fibre exports^ to North America by Destination (A$ million, ‘000 tonnes)2013-14 2014-15 2015-16 2016-17 2017-18 $
change*%
change*%
totalDestination A$ Vol A$ Vol A$ Vol A$ Vol A$ Vol
United States 646 218 1,139 279 961 198 826 204 973 166 148 18% 91%
Canada 60 21 65 16 72 19 65 20 75 19 10 1% 7%
Mexico 20 8 40 18 40 11 25 9 24 6 -2 0% 2%
Total Victoria 726 247 1,244 313 1,072 228 916 233 1,072 190 156 17% 100%
Table 23. Victorian food and fibre exports^ to North America by Industry (A$ million, ‘000 tonnes)Commodity group
2013-14 2014-15 2015-16 2016-17 2017-18 $ change*
% change*
% totalA$ Vol A$ Vol A$ Vol A$ Vol A$ Vol
Meat 489 95 949 144 799 122 666 90 850 111 183 28% 79%
Wine 25 12 25 10 29 13 39 20 46 23 6 16% 4%
Prepared foods** 26 10 25 8 29 9 34 9 36 9 2 5% 3%
Animal feed^ 20 19 13 13 21 22 21 20 31 18 10 48% 3%
Horticulture 43 14 42 10 68 12 39 13 30 11 -9 -23% 3%
TCF^ 17 2 21 3 32 3 28 3 28 3 0 0% 3%
Dairy 19 5 51 11 53 12 40 8 20 3 -20 -49% 2%
Forest products^ 73 83 91 100 24 29 18 24 12 8 -6 -32% 1%
Animal fibre 10 6 13 7 9 1 5 1 6 1 1 20% 1%
Skins and hides 1 <0.5 1 <0.5 1 <0.5 1 <0.5 6 1 5 682% 1%
Seafood 2 <0.5 4 <0.5 4 <0.5 4 <0.5 6 <0.5 1 24% 1%
Grain^ 1 1 8 7 3 5 21 44 3 2 -18 -87% 0%
Total Victoria 726 247 1,244 313 1,072 228 916 233 1,072 190 156 17% 100%
^Export figures need to be used with caution. Some grain, forestry, TCF and animal feed exports are affected by confidentiality agreements. *$ change and % change based on the difference between 2016-17 and 2017-18 data. Volumes are shown in gross weights.**Prepared foods are classified as those which have been substantially transformed from their raw product basis and may have input from more than one food production industry.
40

The Middle East and North Africa (MENA)Covering a vast and diverse region, the Middle East and North Africa are important economic partners for Victoria. With strong economic and population growth, the region’s engagement with global markets has increased, providing key export destinations across a range of Victorian industry sectors. Iran offers substantial export opportunities as an emerging market.
Key factors such as land-use restrictions, the climate and regional security issues make food security a top priority for governments across the region, particularly in the Gulf which imports 90 per cent of its food requirements. With strong population growth projected to exceed 500 million by 2020, the demand for high-quality food and beverage products is predicted to soar providing key opportunities for Victoria’s agribusinesses – particularly in the dairy, meat, prepared and health food industries.
Victorian food and fibre exports to MENA were valued at $1.1 billion in 2017-18, an increase of $205 million (up 22 per cent) on 2016-17.
MENA continues to grow as an important destination for Victorian red meat with export volumes up 26 per cent and value up 36 per cent on 2016-17. Lamb exports to Iran grew by $69 million, and an 18 per cent increase in lamb exports to Qatar reflects continuing strong demand in the region.
The UAE and Saudi Arabia remained Victoria’s largest markets in the region accounting for 29 per cent and 12 per cent of the total value of exports respectively. Strong export growth was also seen in the Gulf States.
Table 24. Victorian food and fibre exports^ to MENA by Destination (A$ million, ‘000 tonnes)2013-14 2014-15 2015-16 2016-17 2017-18 $
change*%
change*%
totalDestination A$ Vol A$ Vol A$ Vol A$ Vol A$ Vol
UAE 383 230 348 128 316 110 317 145 333 136 16 5% 29%
Saudi Arabia 213 106 200 94 145 74 115 69 133 73 18 15% 12%
Egypt 148 229 132 174 93 86 96 119 115 112 19 20% 10%
Qatar 62 13 85 15 88 14 74 11 98 35 24 33% 9%
Kuwait 122 74 91 23 79 23 68 18 97 66 29 43% 9%
Iran 27 33 17 2 14 2 20 3 89 13 69 336% 8%
Yemen 178 409 65 97 36 59 61 154 53 150 -8 -12% 5%
Jordan 43 15 58 18 51 16 31 13 53 17 22 72% 5%
Oman 70 141 63 88 44 33 40 30 47 31 7 17% 4%
Bahrain 73 13 60 38 42 8 44 8 34 6 -10 -23% 3%
Turkey 24 9 23 8 24 9 36 24 28 11 -8 -22% 2%
Algeria 2 1 3 1 11 4 2 1 23 7 21 859% 2%
Israel 3 1 13 2 20 4 8 1 17 4 9 112% 1%
Iraq 37 104 29 54 7 2 8 2 9 2 1 17% 1%
Lebanon 13 24 14 23 5 2 5 3 4 3 -1 -24% 0%
Morocco 9 2 13 4 5 1 3 1 1 1 -2 -59% 0%
Tunisia 3 1 2 <0.5 2 <0.5 2 1 1 <0.5 -1 -70% 0%
Syria <0.5 <0.5 <0.5 <0.5 <0.5 <0.5 <0.5 <0.5 1 <0.5 0 0% 0%
Sudan 86 246 17 45 <0.5 <0.5 1 1 1 1 0 -18% 0%
Libya 9 2 3 1 <0.5 <0.5 <0.5 <0.5 <0.5 <0.5 0 0% 0%
South Sudan <0.5 <0.5 <0.5 <0.5 <0.5 <0.5 <0.5 <0.5 <0.5 <0.5 0 0% 0%
Total Victoria 1,505 1,654 1,235 815 982 447 932 604 1,137 667 205 22% 100%
41

42

Table 25. Victorian food and fibre exports^ to MENA by Industry (A$ million, ‘000 tonnes)Commodity group
2013-14 2014-15 2015-16 2016-17 2017-18 $ change*
% change*
% totalA$ Vol A$ Vol A$ Vol A$ Vol A$ Vol
Meat 434 97 528 107 474 94 432 77 590 99 158 36% 52%
Grain^ 513 1,351 224 526 97 191 170 382 146 415 -24 -14% 13%
Dairy 267 54 215 53 147 46 91 26 114 30 23 25% 10%
Prepared foods** 100 22 82 19 78 20 72 18 102 27 30 42% 9%
Horticulture 93 21 87 24 96 27 54 18 61 20 7 13% 5%
Animal fibre 32 4 32 3 33 3 41 3 44 3 3 8% 4%
Forest products^ 39 79 37 54 24 36 34 44 39 36 4 12% 3%
TCF^ 17 23 19 23 28 28 29 33 30 33 1 3% 3%
Skins and hides 7 2 8 4 3 1 5 2 6 3 1 24% 1%
Wine 3 1 2 1 2 0 2 <0.5 3 1 1 35% 0%
Seafood <0.5 <0.5 <0.5 <0.5 <0.5 <0.5 2 <0.5 2 0 1 32% 0%
Animal feed^ 1 0 1 1 1 1 <0.5 <0.5 1 0 0 0% 0%
Total Victoria 1,505 1,654 1,235 815 982 447 932 604 1,137 667 205 22% 100%
^Export figures need to be used with caution. Some grain, forestry, TCF and animal feed exports are affected by confidentiality agreements. *$ change and % change based on the difference between 2016-17 and 2017-18 data. Volumes are shown in gross weights.**Prepared foods are classified as those which have been substantially transformed from their raw product basis and may have input from more than one food production industry.
43

South AsiaSouth Asia is a region with one of the fastest economic growth rates in the world estimated at 6.5 per cent in 2017-18. India is dominant in the region, accounting for 75 per cent of the population and representing 82 per cent of the South Asia economy. India was Australia’s fifth largest export market in 2017-18. India’s increasing urbanisation and higher income levels are reshaping local consumer preferences and consumption patterns.
Food and fibre exports to India make up 59 per cent of exports to the region. Victoria’s exceptional reputation for wool drives the majority of these exports, supporting India’s textiles and high-end fashion industry. As demand for premium products increases in India, there are also growing opportunities for branded products including Victorian lamb, wine, beer and cheese. Additionally, Victoria supplies almonds, pulses and other horticulture products to India. E-commerce is rapidly emerging as an accessible way to do everyday shopping in India, and to access local and international products. There are opportunities for Victoria to partner with India in agriculture technology and science, particularly in dairy production, irrigation and smart water technologies.
Victorian food and fibre exports to South Asia decreased by 31 per cent to $639 million in 2017-18 compared to 2016-17. Pulse and wheat exports to India showed a significant decrease reflecting high tariffs imposed on lentils and chickpeas in December 2017, and a 20 per cent tariff imposed on wheat.
Table 26. Victorian food and fibre exports^ to South Asia by Destination (A$ million, ‘000 tonnes)2013-14 2014-15 2015-16 2016-17 2017-18 $
change*%
change*%
totalDestination A$ Vol A$ Vol A$ Vol A$ Vol A$ Vol
India 312 184 353 183 308 92 629 666 380 152 -250 -40% 59%
Bangladesh 111 69 86 42 77 51 154 150 116 98 -38 -25% 18%
Sri Lanka 99 93 97 88 61 56 70 69 75 103 5 7% 12%
Pakistan 117 159 98 140 43 46 57 61 49 48 -8 -14% 8%
Nepal 2 3 7 9 5 8 12 14 12 19 0 -4% 2%
Maldives 7 1 6 1 6 1 7 1 7 1 0 -1% 1%
Afghanistan 1 0 1 0 1 0 0 0 0 0 0 -29% 0%
Bhutan <0.5 <0.5 0 0 0 0 0 0 0 0 0 0% 0%
Total Victoria 649 509 647 462 502 254 931 960 639 422 -291 -31% 100%
Table 27. Victorian food and fibre exports^ to South Asia by Industry (A$ million, ‘000 tonnes)Commodity group
2013-14 2014-15 2015-16 2016-17 2017-18 $ change*
% change*
% totalA$ Vol A$ Vol A$ Vol A$ Vol A$ Vol
Grain^ 204 307 180 299 94 118 384 692 168 277 -216 -56% 26%
Animal fibre 114 18 122 27 146 17 150 15 159 17 9 6% 25%
Horticulture 132 29 164 27 114 19 137 27 152 31 15 11% 24%
Dairy 90 18 77 21 55 20 47 15 41 13 -6 -13% 6%
Forest products^ 29 95 29 51 28 52 68 153 39 61 -29 -43% 6%
TCF^ 48 29 26 20 21 13 100 46 22 11 -78 -78% 3%
Meat 7 2 9 2 10 2 11 2 20 3 9 85% 3%
Skins and hides 12 3 23 5 19 4 19 5 20 4 1 3% 3%
Prepared foods** 7 1 9 2 9 2 12 2 16 3 4 31% 3%
Animal feed^ 5 6 6 9 4 7 2 2 1 2 0 -24% 0%
Wine 1 <0.5 <0.5 <0.5 1 <0.5 1 <0.5 1 <0.5 0 44% 0%
Seafood <0.5 <0.5 <0.5 <0.5 <0.5 <0.5 <0.5 <0.5 <0.5 <0.5 0 0% 0%
Total Victoria 649 509 647 462 502 254 931 960 639 422 -291 -31% 100%
^Export figures need to be used with caution. Some grain, forestry, TCF and animal feed exports are affected by confidentiality agreements.*$ change and % change based on the difference between 2016-17 and 2017-18 data. Volumes are shown in gross weights.
44

**Prepared foods are classified as those which have been substantially transformed from their raw product basis and may have input from more than one food production industry.
ChinaTable 28. Victorian food and fibre exports to China by industry and product (A$ million, ‘000 tones)
Industry Product 2013-14 2014-15 2015-16 2016-17 2017-18 % totalA$ Vol A$ Vol A$ Vol A$ Vol A$ Vol
Animal fibre
Wool 875 125 1,061
147 1,115
133 1,324
144 1,499
148
Wool grease and wastes 17 19 17 25 6 10 10 12 11 18Other animal fibres 2 0 3 0 3 1 3 1 2 0Yarn products 0 0 0 0 <0.5 <0.5 <0.5 <0.5 <0.5 <0.5Animal fibre Total 893 144 1,08
1173 1,12
4143 1,33
8157 1,512 167 33%
Prepared foods**
Other food preparations 10 1 72 7 258 21 329 23 358 19Cereal based 73 14 53 10 79 8 144 11 287 25Sugars 12 7 9 5 10 6 7 4 7 4Condiments <0.5 <0.5 1 <0.5 1 <0.5 <0.5 <0.5 5 1Confectionery 1 <0.5 3 <0.5 3 1 5 1 5 1Beverages 2 <0.5 2 <0.5 1 <0.5 1 <0.5 1 <0.5Prepared foods Total 99 25 140 25 352 43 487 40 662 51 14%
Meat Beef 140 34 223 50 186 33 98 18 200 39Sheepmeat 133 30 134 29 72 17 76 17 184 37Other prepared meat products
40 5 52 6 39 7 34 7 58 7
Offal 37 7 35 6 22 5 15 4 27 6Animal fats 4 <0.5 3 <0.5 3 <0.5 3 <0.5 3 <0.5Other meat products 6 <0.5 1 <0.5 2 <0.5 0 <0.5 <0.5 <0.5Meat Total 360 77 448 91 324 62 226 46 474 89 10%
Dairy Milk and cream 276 70 140 74 221 91 210 94 309 120Cheese and whey products 84 20 81 19 85 24 103 27 94 23Butters, fats and oils 7 1 11 2 11 2 11 2 11 1Yoghurt and fermented milk products
1 <0.5 1 <0.5 1 <0.5 1 <0.5 1 <0.5
Milk extracts 1 <0.5 0 0 0 0 0 0 0 0
Dairy Total 368 92 233 95 318 117 326 123 415 145 9%Skins and hides
Sheep 239 109 228 117 246 106 220 99 256 116Cattle 162 52 194 64 155 57 121 46 131 53Other skins and hides 0 0 0 0 1 0 0 0 0 0Skins and hides Total 401 160 422 181 402 164 341 146 387 170 8%
Forest products^
Roundwood 149 1,420
154 1,517
189 1,842
251 2,118
263 2,235
Wastepaper 65 465 58 442 69 511 67 501 46 308Sawnwood 11 18 9 13 7 11 22 150 24 138
Paper and paperboard 6 8 6 8 8 7 8 9 8 8Other forest products <0.5 <0.5 <0.5 <0.5 5 <0.5 <0.5 <0.5 <0.5 <0.5Forest products Total 232 1,91
1228 1,98
1279 2,42
1349 2,77
8341 2,68
97%
Horticulture Fruit (fresh or dried) 14 9 32 16 128 48 191 70 223 86Nuts (fresh or dried) 1 <0.5 1 <0.5 3 <0.5 4 1 14 2Oils and extracts 3 1 2 1 4 1 3 1 3 1
45

Processed 2 1 2 1 2 1 4 2 3 1Other horticulture products 1 <0.5 1 <0.5 1 <0.5 1 <0.5 1 <0.5Horticulture Total 21 12 38 18 137 50 203 73 243 89 5%
Grain^ Cereals 109 338 67 210 49 153 84 333 153 517Oilseeds 179 273 113 197 10 13 12 30 23 58Pulses 0 0 0 0 <0.5 <0.5 <0.5 1 3 8Processed Grain 1 1 1 1 1 1 1 1 2 2Grain Total 289 612 181 408 60 168 97 364 181 585 4%
Wine Red 45 15 56 25 77 31 108 33 155 49Fortified 2 <0.5 3 1 4 1 8 2 6 2White 3 1 3 1 3 1 3 1 6 3Sparkling 1 <0.5 1 <0.5 2 <0.5 2 <0.5 1 <0.5Wine Total 52 17 64 27 87 33 121 37 167 54 4%
Seafood Crustaceans 1 <0.5 <0.5 <0.5 4 <0.5 46 1 142 2Molluscs 3 <0.5 2 <0.5 4 <0.5 6 <0.5 8 <0.5Seafood extracts and oils 0 <0.5 1 <0.5 1 <0.5 <0.5 <0.5 <0.5 <0.5Fish 0 <0.5 1 <0.5 0 <0.5 <0.5 <0.5 <0.5 <0.5Seafood Total 4 <0.5 4 <0.5 9 <0.5 52 1 150 2 3%
Animal feed^
Stock feed 8 25 18 45 21 50 25 74 32 96Pet food 3 1 3 2 4 2 2 1 0 0Animal feed Total 11 26 21 46 25 52 27 75 32 96 2%
TCF^ Textiles 215 91 71 29 96 37 46 18 15 4Clothing 1 <0.5 1 <0.5 5 <0.5 1 <0.5 1 <0.5Other TCF <0.5 <0.5 <0.5 <0.5 1 <0.5 1 <0.5 <0.5 <0.5TCF Total 217 91 72 29 102 38 48 18 17 5 1%Total Victoria 2,94
73,16
92,93
23,07
53,21
83,29
13,61
33,85
84,58
24,14
2100
%
**Prepared foods are classified as those which have been substantially transformed from their raw product basis and may have input from more than one food production industry.^Export figures need to be used with caution. Some grain, forestry, TCF and animal feed exports are affected by confidentiality agreements.
46

JapanTable 29. Victorian food and fibre exports to Japan by industry and product (A$ million, ‘000 tones)
Industry Product 2013-14 2014-15 2015-16 2016-17 2017-18 % totalA$ Vol A$ Vol A$ Vol A$ Vol A$ Vol
Dairy Cheese and whey products 311 70 355 79 367 86 331 77 405 81Milk and cream 25 5 37 10 12 3 15 4 32 10Milk extracts 20 1 5 <0.
55 <0.
53 <0.
53 <0.
5Butters, fats and oils 2 <0.
54 <0.
53 <0.
53 <0.
52 <0.
5Yoghurt and fermented milk products
<0.5
<0.5
<0.5
<0.5
<0.5
<0.5
<0.5
<0.5
<0.5 <0.5
Dairy Total 359 77 401 90 387 90 351 82 442 91 41%Meat Beef 122 30 151 29 133 22 133 23 186 32
Sheepmeat 25 4 31 5 28 4 34 5 34 5Offal 21 3 18 3 35 4 31 3 33 4Other prepared meat products 11 2 18 3 20 3 20 3 22 3Alternative meat 1 <0.
52 <0.
52 <0.
53 <0.
53 <0.
5Other meat products 2 0 3 0 3 0 3 0 2 0Meat Total 181 39 222 40 221 33 224 34 280 45 26%
Prepared foods**
Other food preparations 33 11 38 13 38 13 45 14 50 16Confectionery 34 6 33 7 33 8 36 8 44 10Condiments 19 4 26 6 26 6 26 6 34 10Cereal based products 3 <0.
55 <0.
55 <0.
55 <0.
55 1
Other prepared foods 0 0 2 0 1 0 0 0 0 0Prepared foods Total 90 23 104 29 102 31 112 30 134 38 12%
Horticulture Fruit (fresh or dried) 10 9 17 12 40 17 41 18 52 20Vegetables (fresh or dried) 14 3 16 3 20 4 24 5 21 3Processed 16 7 13 6 12 6 12 5 11 3Oils and extracts 1 <0.
51 <0.
51 <0.
52 <0.
53 <0.
5Other horticulture products 2 <0.
52 <0.
51 <0.
51 <0.
52 <0.
5Horticulture Total 42 19 50 21 73 27 80 29 88 28 8%
Animal feed^ Stock feed 34 89 44 109 53 125 39 100 42 111Pet food 27 12 26 12 28 11 27 11 29 12Animal feed Total 62 101 70 121 81 136 66 111 70 124 6%
Grain^ Processed Grain 24 42 28 44 38 51 38 51 25 39Oilseeds 22 35 14 19 10 18 7 13 9 18Cereals <0.
5<0.
56 16 <0.
5<0.
57 24 1 <0.
5Pulses 1 1 1 1 1 <0.
51 <0.
51 1
Grain Total 48 79 48 80 48 71 52 90 36 59 3%Animal fibre
Wool 9 <0.5
11 1 14 1 8 <0.5
14 <0.5
Wool grease and wastes 3 <0.5
3 <0.5
2 <0.5
2 <0.5
2 <0.5
Yarn products 0 0 <0. <0. <0. <0. <0. <0. <0.5 <0.
47

5 5 5 5 5 5 5Other animal fibres 0 0 0 0 0 0 <0.
5<0.
5<0.5 <0.
5Animal fibre Total 12 1 14 2 17 1 11 1 15 1 1%
Seafood Molluscs 15 <0.5
11 <0.5
10 <0.5
9 <0.5
8 <0.5
Fish <0.5
<0.5
<0.5
<0.5
<0.5
<0.5
<0.5
<0.5
<0.5 <0.5
Seafood extracts and oils 1 <0.5
1 <0.5
1 <0.5
<0.5
<0.5
<0.5 <0.5
Crustaceans <0.5
<0.5
0 0 <0.5
<0.5
0 0 0 0
Seafood Total 16 <0.5
12 <0.5
11 <0.5
9 <0.5
9 <0.5
1%
Wine Red 3 <0.5
2 <0.5
2 <0.5
2 <0.5
3 2
White 2 <0.5
2 <0.5
2 <0.5
2 4 3 1
Fortified <0.5
<0.5
<0.5
<0.5
<0.5
<0.5
1 <0.5
1 <0.5
Sparkling 3 0 1 0 1 0 1 0 1 0Wine Total 9 3 5 2 6 2 6 5 8 3 <0.5
TCF^ Textiles 9 4 4 2 6 3 4 2 3 <0.5
Clothing <0.5
<0.5
<0.5
<0.5
<0.5
<0.5
<0.5
<0.5
<0.5 <0.5
Footwear <0.5
<0.5
<0.5
<0.5
<0.5
<0.5
<0.5
<0.5
<0.5 <0.5
Other TCF products <0.5
<0.5
<0.5
<0.5
<0.5
<0.5
<0.5
<0.5
<0.5 <0.5
TCF Total 9 4 4 2 6 3 4 2 4 <0.5
<0.5%
Skins and hides Sheep 2 <0.5
2 <0.5
2 <0.5
1 <0.5
1 <0.5
Cattle <0.5
<0.5
<0.5
<0.5
<0.5
<0.5
<0.5
<0.5
<0.5 <0.5
Other skins and hides <0.5
<0.5
<0.5
<0.5
<0.5
<0.5
0 0 <0.5 <0.5
Skins and hides Total 2 <0.5
2 <0.5
2 <0.5
2 <0.5
2 <0.5
<0.5%
Forest products^
Paper and paperboard 1 <0.5
1 <0.5
1 <0.5
1 <0.5
<0.5 <0.5
Roundwood 0 0 <0.5
<0.5
0 0 0 0 <0.5 <0.5
Wood-based panels 1 <0.5
<0.5
<0.5
<0.5
<0.5
<0.5
<0.5
<0.5 <0.5
Sawnwood <0.5
<0.5
<0.5
<0.5
<0.5
<0.5
<0.5
<0.5
<0.5 <0.5
^Woodchips 0 0 33 373 33 350 0 0 0 0Other forest products <0.
5<0.
5<0.
5<0.
5<0.
5<0.
5<0.
5<0.
50 0
Forest products Total 2 2 34 375 35 351 1 <0.5
<0.5 <0.5
<0.5%
Total Victoria 831 348 966 762 990 746 918 385 1,088 390 100%
48
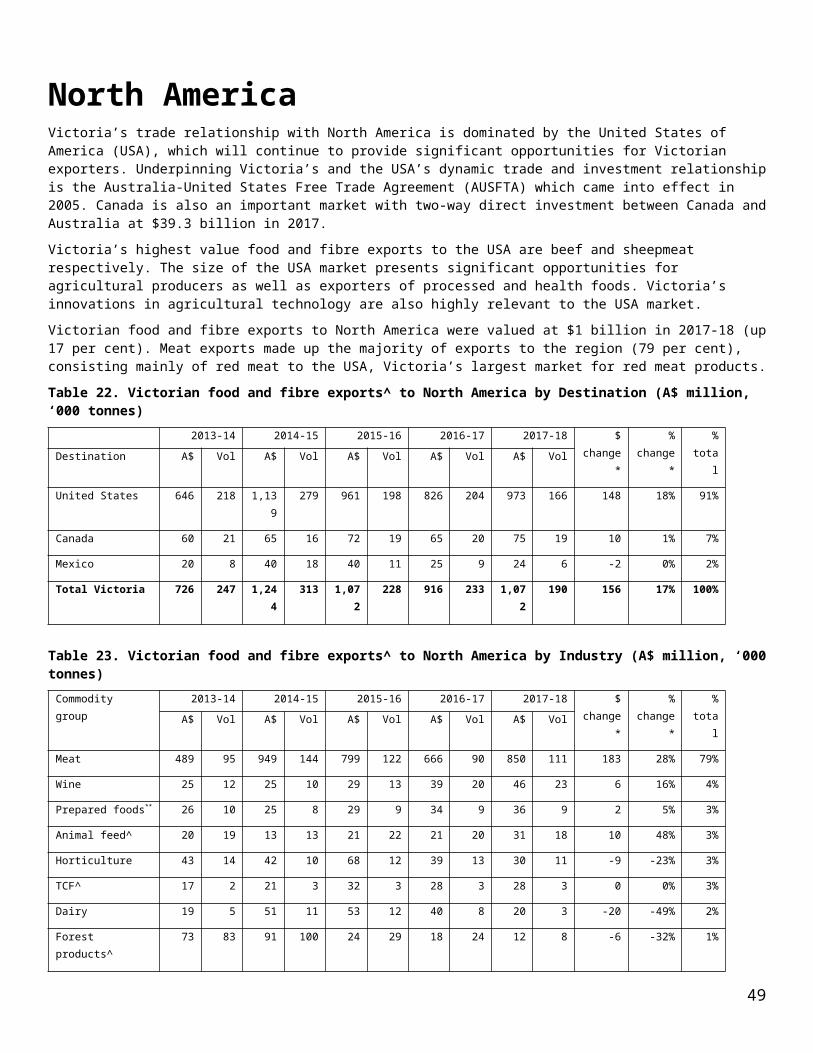
^Export figures need to be used with caution. Some grain, forestry, TCF and animal feed exports are affected by confidentiality agreements. **Prepared foods are classified as those which have been substantially transformed from their raw product basis and may have input from more than one food production industry.
49

USATable 30. Victorian food and fibre exports to the USA by industry and product (A$ million, ‘000 tones)
Industry Product 2013-14 2014-15 2015-16 2016-17 2017-18 % totalA$ Vol A$ Vol A$ Vol A$ Vol A$ Vol
Meat Beef 266 55 618 93 451 67 303 44 451 63Sheepmeat 136 19 178 27 185 30 204 25 254 29Alternative meat 40 9 55 10 64 9 94 11 63 8Other prepared meat products <0.
5<0.
529 <0.
526 <0.
517 <0.
522 1
Offal 3 3 3 2 3 <0.5
3 <0.5
5 1
Other meat products 2 0 2 0 1 0 2 0 2 0Meat Total 447 86 887 133 729 108 622 82 798 103 82%
Wine Red 6 2 8 3 9 5 18 10 28 16White 5 3 4 2 5 3 9 5 5 3Fortified <0.
5<0.
51 <0.
5<0.
5<0.
5<0.
5<0.
5<0.
5<0.
5Sparkling 11 0 13 0 15 0 27 0 33 0Wine Total 13 6 13 6 15 8 27 15 33 19 3%
Animal feed^ Stock feed 19 19 13 13 19 22 20 20 29 18Pet food <0.
5<0.
51 <0.
51 <0.
51 <0.
51 <0.
5Animal feed Total 20 19 13 13 20 22 21 20 31 18 3%
Prepared foods**
Other food preparations 7 <0.5
10 1 11 1 14 2 11 1
Sugars 9 6 8 6 8 6 7 5 6 4Cereal based 3 <0.
52 <0.
51 <0.
53 <0.
54 <0.
5Beverages <0.
5<0.
5<0.5 <0.
5<0.
5<0.
5<0.
5<0.
52 <0.
5Other prepared foods 1 0 1 0 3 0 3 0 3 0Prepared foods Total 21 8 21 7 24 8 27 8 27 7 3%
TCF^ Textiles 12 2 11 3 13 3 12 2 15 2Clothing 3 <0.
57 <0.
514 <0.
512 <0.
57 <0.
5Footwear <0.
5<0.
51 <0.
51 <0.
51 <0.
52 <0.
5Other TCF products <0.
5<0.
5<0.5 <0.
5<0.
5<0.
5<0.
5<0.
5<0.
5<0.
5Horticulture TCF Total 15 2 19 3 29 3 25 2 24 2 2%
Fruit (fresh or dried) 5 4 4 2 6 3 7 3 7 3Nuts (fresh or dried) 24 4 27 4 46 4 14 2 6 1Oils and extracts 4 1 3 1 3 <0.
55 <0.
55 <0.
5Other horticulture products 2 0 5 0 7 0 3 0 4 0Horticulture Total 36 10 37 7 62 9 29 7 22 6 2%
Dairy Cheese and whey products 8 2 24 4 28 5 25 5 10 2Milk extracts 4 <0.
51 <0.
51 <0.
53 <0.
53 <0.
5Butters, fats and oils 1 <0. 13 3 10 2 1 <0. 2 <0.
50

5 5 5Milk and cream <0.
5<0.
52 <0.
55 1 2 <0.
51 <0.
5Yoghurt and fermented milk products
0 0 0 0 <0.5
<0.5
0 0 0 0
Dairy Total 13 3 40 8 44 9 32 6 16 2 2%Forest products^
Paper and paperboard 68 78 84 89 22 26 14 19 10 6Sawnwood <0.
5<0.
5<0.5 <0.
5<0.
5<0.
5<0.
5<0.
5<0.
5<0.
5Wastepaper 0 0 0 0 <0.
5<0.
50 0 <0.
5<0.
5Other forest products 0 0 0 0 0 0 0 0 0 0Forest products Total 69 78 84 89 22 26 15 20 10 6 1%
Animal fibre Wool 6 <0.5
8 1 8 <0.5
2 <0.5
4 <0.5
Yarn products <0.5
<0.5
<0.5 <0.5
1 <0.5
2 <0.5
1 <0.5
Wool grease and wastes <0.5
<0.5
<0.5 <0.5
<0.5
<0.5
<0.5
<0.5
<0.5
<0.5
Other animal fibres 3 4 3 5 <0.5
<0.5
<0.5
<0.5
<0.5
<0.5
Animal fibre Total 10 5 12 6 9 <0.5
4 <0.5
6 <0.5
1%
Seafood Molluscs 1 <0.5
3 <0.5
2 <0.5
2 <0.5
4 <0.5
Fish <0.5
<0.5
<0.5 <0.5
1 <0.5
1 <0.5
1 <0.5
Crustaceans <0.5
<0.5
<0.5 <0.5
1 <0.5
<0.5
<0.5
<0.5
<0.5
Other seafood products <0.5
<0.5
<0.5 <0.5
<0.5
<0.5
<0.5
<0.5
0 0
Seafood Total 2 <0.5
3 <0.5
3 <0.5
3 <0.5
5 <0.5
<0.5%
Grain^ Pulses <0.5
<0.5
<0.5 <0.5
<0.5
<0.5
<0.5
<0.5
1 <0.5
Cereals 0 0 0 0 0 0 0 0 <0.5
<0.5
Oilseeds <0.5
<0.5
7 6 3 5 20 44 <0.5
<0.5
Processed Grain <0.5
<0.5
<0.5 <0.5
0 0 <0.5
<0.5
<0.5
<0.5
Grain Total 1 <0.5
8 7 3 5 21 44 1 <0.5
<0.5%
Skins and hides
Other skins and hides 1 <0.5
1 <0.5
1 <0.5
<0.5
<0.5
1 <0.5
Cattle <0.5
<0.5
<0.5 <0.5
<0.5
<0.5
<0.5
<0.5
<0.5
<0.5
Sheep 0 0 <0.5 <0.5
<0.5
<0.5
<0.5
<0.5
<0.5
<0.5
Skins and hides Total 1 <0.5
1 <0.5
1 <0.5
1 <0.5
1 <0.5
0%
Total Victoria 646 218 1,139
279 961 198 826 204 973 166 100%
^Export figures need to be used with caution. Some grain, forestry, TCF and animal feed exports are affected by confidentiality agreements. **Prepared foods are classified as those which have been substantially transformed from their raw product basis and may have input from more than one food production industry.
51

52
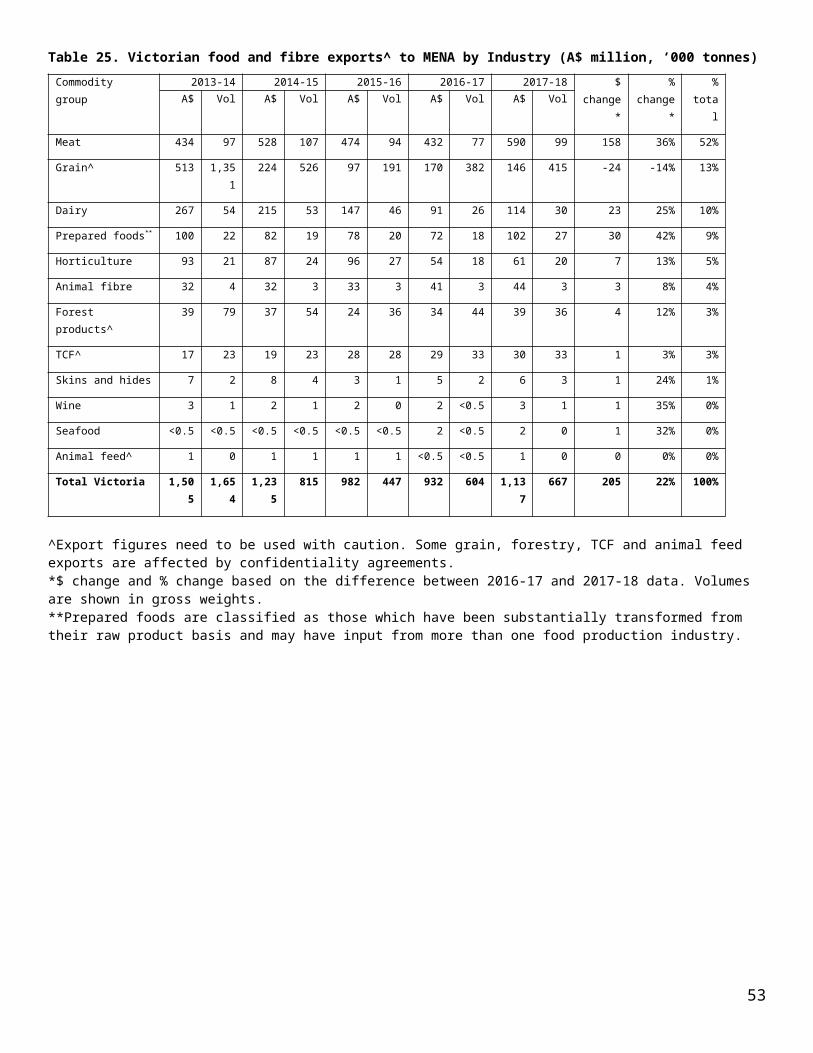
New ZealandTable 31. Victorian food and fibre exports to New Zealand by industry and product (A$ million, ‘000 tonnes)
Industry Product 2013-14 2014-15 2015-16 2016-17 2017-18 % totalA$ Vol A$ Vol A$ Vol A$ Vol A$ Vol
Prepared foods**
Confectionery 85 17 74 14 77 15 78 15 78 15Cereal based 75 17 70 16 101 23 74 18 67 16Other food preparations 48 17 54 13 89 9 51 10 54 10Condiments 33 9 34 9 33 9 30 8 31 9Sugars 3 2 4 2 7 5 9 6 13 9Beverages 11 9 12 9 14 11 12 11 10 9Non-alcholic beverages 0 0 0 0 0 0 2 1 3 2Prepared foods Total 255 70 248 64 320 72 255 69 254 71 34%
Forest products^
Paper and paperboard 119 80 100 74 113 94 139 111 132 112Wastepaper <0.5 <0.5 <0.5 <0.5 2 <0.5 3 2 4 2Wood-based panels 1 <0.5 <0.5 <0.5 1 <0.5 2 <0.5 2 <0.5Sawnwood 2 <0.5 2 <0.5 2 <0.5 2 1 1 <0.5Other forest products <0.5 <0.5 <0.5 <0.5 <0.5 <0.5 <0.5 <0.5 1 <0.5Forest products Total 122 81 102 75 117 96 145 115 141 119 19%
Grain^ Cereals 56 162 48 134 21 57 51 185 74 270Oilseeds 7 8 14 15 7 7 7 9 7 11Processed Grain 3 5 2 2 2 2 3 4 5 5Pulses <0.5 <0.5 <0.5 <0.5 <0.5 <0.5 <0.5 <0.5 <0.5 <0.5Grain Total 66 175 64 152 31 66 62 198 86 287 11%
TCF^ Textiles 42 7 53 10 51 9 51 9 48 10Clothing 10 <0.5 12 <0.5 14 <0.5 15 <0.5 13 <0.5Leather articles 2 <0.5 3 <0.5 5 <0.5 6 <0.5 6 <0.5Footwear 6 <0.5 7 <0.5 9 <0.5 6 <0.5 5 <0.5Woven fabrics <0.5 <0.5 <0.5 <0.5 <0.5 <0.5 <0.5 <0.5 <0.5 <0.5TCF Total 60 8 76 11 79 10 78 10 72 11 9%
Horticulture Processed 27 17 19 13 18 11 18 11 20 10Oils and extracts 13 5 14 6 15 6 15 6 14 5Fruit (fresh or dried) 20 12 17 9 14 8 13 7 13 8Coffee, tea, herbs and spices 6 1 5 <0.5 10 1 9 1 12 2Nuts (fresh or dried) 2 <0.5 4 <0.5 8 <0.5 5 <0.5 6 <0.5Other horticulture exports <0.5 <0.5 <0.5 <0.5 <0.5 <0.5 <0.5 <0.5 <0.5 <0.5Horticulture Total 68 35 60 29 64 27 60 26 65 25 9%
Meat Animal fats 7 1 12 1 22 1 23 1 34 2Sheepmeat 5 2 6 2 5 2 7 2 13 2Beef 8 1 17 3 6 1 2 <0.5 5 1Pig meat 3 1 3 1 1 <0.5 2 <0.5 4 2Other prepared meat products
6 1 5 1 4 <0.5 4 <0.5 4 <0.5
Other meat products 1 0 1 0 0 0 0 0 1 0Meat Total 31 7 44 8 40 5 38 5 61 7 8%
Dairy Milk and cream 24 7 36 10 38 11 22 7 28 10Cheese and whey products 10 2 10 2 12 2 10 2 15 3Butters, fats and oils 3 <0.5 2 <0.5 4 <0.5 5 <0.5 1 <0.5Other dairy products <0.5 <0.5 <0.5 <0.5 <0.5 <0.5 <0.5 <0.5 <0.5 <0.5
53
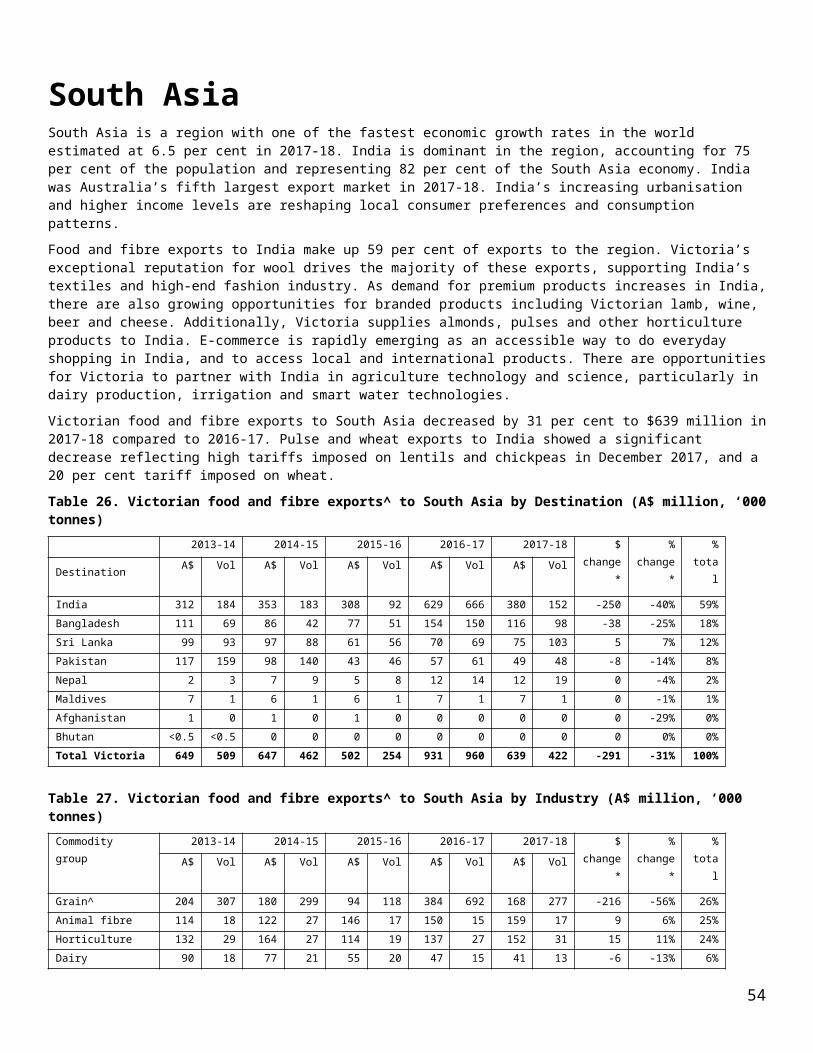
Dairy Total 37 9 49 13 55 14 38 9 44 12 6%Animal feed^ Stock feed 8 17 7 16 5 17 7 12 8 21
Pet food 9 4 7 4 7 4 8 4 8 4Animal feed Total 17 21 14 19 12 21 14 15 16 24 2%
Wine Red 7 3 7 3 7 3 7 3 7 3White 2 1 1 <0.5 1 <0.5 2 <0.5 3 1Sparkling 1 0 1 0 2 0 1 0 2 0Fortified <0.5 <0.5 <0.5 <0.5 1 <0.5 1 <0.5 1 <0.5Wine Total 10 5 10 4 11 5 11 4 13 5 2%
Seafood Fish 2 <0.5 2 <0.5 2 <0.5 2 <0.5 3 <0.5Seafood extracts and oils <0.5 <0.5 <0.5 <0.5 1 <0.5 <0.5 <0.5 <0.5 <0.5Seaweed 0 0 0 0 <0.5 <0.5 <0.5 <0.5 <0.5 <0.5Molluscs <0.5 <0.5 <0.5 <0.5 <0.5 <0.5 1 <0.5 <0.5 <0.5Crustaceans 0 0 <0.5 <0.5 <0.5 <0.5 <0.5 <0.5 <0.5 <0.5Seafood Total 2 <0.5 3 <0.5 3 <0.5 3 <0.5 3 <0.5 0%
Animal fibre Wool 1 <0.5 1 <0.5 1 <0.5 1 <0.5 1 <0.5Yarn products 4 <0.5 1 <0.5 1 <0.5 <0.5 <0.5 <0.5 <0.5Wool grease and wastes <0.5 <0.5 <0.5 <0.5 <0.5 <0.5 <0.5 <0.5 <0.5 <0.5Other animal fibres <0.5 <0.5 <0.5 <0.5 <0.5 <0.5 <0.5 <0.5 <0.5 <0.5Animal fibre Total 5 <0.5 2 <0.5 2 <0.5 1 <0.5 1 <0.5 0%
Skins and hides
Other skins and hides 2 <0.5 1 <0.5 1 <0.5 <0.5 <0.5 1 <0.5Cattle <0.5 <0.5 <0.5 <0.5 <0.5 <0.5 0 0 <0.5 <0.5Sheep 1 <0.5 3 2 1 <0.5 0 0 <0.5 <0.5Skins and hides Total 3 1 4 2 2 <0.5 <0.5 <0.5 1 <0.5 0%Total Victoria 677 414 677 380 736 318 708 452 758 563 100
%
^Export figures need to be used with caution. Some grain, forestry, TCF and animal feed exports are affected by confidentiality agreements. **Prepared foods are classified as those which have been substantially transformed from their raw product basis and may have input from more than one food production industry.
54
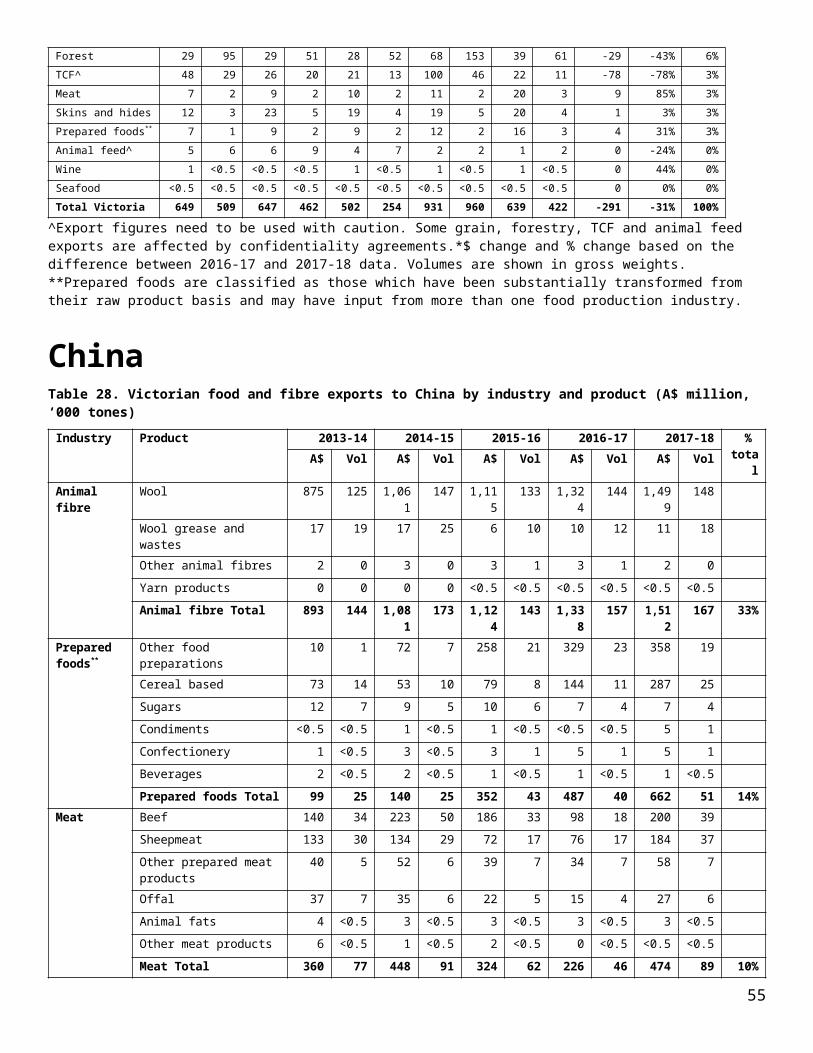
IndonesiaTable 32. Victorian food and fibre exports to Indonesia by industry and product (A$ million, ‘000 tonnes)
Industry Product 2013-14 2014-15 2015-16 2016-17 2017-18 % totalA$ Vol A$ Vol A$ Vol A$ Vol A$ Vol
Meat Beef 109 25 123 24 122 22 107 21 111 23Offal 10 5 12 4 8 2 15 6 22 8Sheepmeat 4 <0.5 7 1 8 1 10 2 13 2Animal fats 7 <0.5 5 <0.
56 <0.5 6 <0.
55 <0.5
Other meat products 3 <0.5 2 <0.5
0 <0.5 0 <0.5
<0.5 <0.5
Meat Total 133 31 148 30 145 27 138 30 152 33 25%Grain^ Cereals 129 396 33 94 51 160 86 326 143 533
Pulses 10 14 10 11 9 10 9 11 4 7Oilseeds 6 4 8 7 1 1 <0.5 <0.
51 <0.5
Processed Grain 1 1 1 1 2 2 <0.5 <0.5
<0.5 <0.5
Grain Total 145 415 52 114 63 174 96 337 148 542 25%Dairy Milk and cream 149 30 168 41 121 41 107 37 97 35
Cheese and whey products
28 7 24 6 24 8 34 11 39 11
Butters, fats and oils 5 1 3 <0.5
1 <0.5 1 <0.5
2 <0.5
Yoghurt and fermented milk products
1 <0.5 2 <0.5
1 <0.5 2 <0.5
1 <0.5
Milk extracts 10 <0.5 0 0 0 0 <0.5 <0.5
0 0
Dairy Total 193 39 197 48 148 50 144 49 138 47 23%Horticulture Fruit (fresh or dried) 35 16 42 19 70 26 56 21 53 20
Oils and extracts 1 <0.5 4 3 4 3 5 3 4 2Nuts (fresh or dried) <0.5 <0.5 <0.5 <0.
53 <0.5 2 <0.
51 <0.5
Vegetables (fresh or dried)
3 4 1 <0.5
2 1 1 <0.5
1 <0.5
Processed <0.5 <0.5 <0.5 <0.5
2 1 2 1 <0.5 <0.5
Coffee, tea, herbs and spices
1 <0.5 <0.5 <0.5
<0.5 <0.5 <0.5 <0.5
<0.5 <0.5
Horticulture Total 41 22 47 22 80 32 65 26 58 22 10%Prepared foods**
Cereal based 19 4 38 7 35 7 42 9 27 6Other food preparations 9 1 9 <0.
59 <0.5 7 <0.
510 <0.5
Condiments 3 <0.5 4 <0.5
3 <0.5 5 <0.5
5 <0.5
Sugars 2 2 2 1 2 2 2 2 2 2Other prepared foods <0.5 <0.5 <0.5 <0.
5<0.5 <0.5 <0.5 <0.
5<0.5 <0.5
55

Prepared foods Total 33 7 53 10 49 10 56 13 45 9 7%Forest products^
Wastepaper 21 115 22 139 19 141 12 55 20 108Paper and paperboard 2 3 3 4 5 5 5 6 5 5Wood-based panels <0.5 <0.5 <0.5 <0.
51 <0.5 <0.5 <0.
51 1
Sawnwood <0.5 <0.5 <0.5 <0.5
<0.5 <0.5 0 0 <0.5 <0.5
Forest products Total 23 119 25 144 25 146 17 61 27 115 4%Animal feed^ Stock feed 24 36 29 42 23 35 15 20 23 29
Pet food 1 <0.5 1 <0.5
2 1 1 <0.5
1 <0.5
Animal feed Total 25 36 30 43 24 36 16 20 24 30 4%TCF^ Textiles 35 15 17 7 19 7 26 11 3 <0.5
Footwear <0.5 <0.5 <0.5 <0.5
<0.5 <0.5 1 <0.5
<0.5 <0.5
Clothing <0.5 <0.5 <0.5 <0.5
<0.5 <0.5 <0.5 <0.5
<0.5 <0.5
Other TCF products <0.5 <0.5 <0.5 <0.5
<0.5 <0.5 <0.5 <0.5
<0.5 <0.5
TCF Total 36 15 18 7 20 7 27 11 4 <0.5 1%Seafood Seafood extracts and
oils1 <0.5 <0.5 <0.
5<0.5 <0.5 <0.5 <0.
51 <0.5
Fish <0.5 <0.5 0 0 0 0 <0.5 <0.5
<0.5 <0.5
Crustaceans 0 0 <0.5 <0.5
0 0 0 0 0 0
Molluscs <0.5 <0.5 <0.5 <0.5
0 0 0 0 0 0
Seafood Total 1 <0.5 <0.5 <0.5
<0.5 <0.5 <0.5 <0.5
1 <0.5 <0.5%
Skins and hides
Sheep <0.5 <0.5 <0.5 <0.5
<0.5 <0.5 <0.5 <0.5
<0.5 <0.5
Cattle <0.5 <0.5 <0.5 <0.5
<0.5 <0.5 <0.5 1 <0.5 <0.5
Other skins and hides <0.5 <0.5 0 0 0 0 0 0 0 0Skins and hides Total 1 <0.5 <0.5 <0.
5<0.5 <0.5 1 2 <0.5 <0.5 <0.5%
Animal fibre Other animal fibres <0.5 <0.5 <0.5 <0.5
<0.5 <0.5 <0.5 <0.5
<0.5 <0.5
Wool grease and wastes
0 0 0 0 <0.5 <0.5 0 0 0 0
Yarn products <0.5 <0.5 0 0 0 0 0 0 0 0Wool <0.5 <0.5 <0.5 <0.
50 0 0 0 0 0
Animal fibre Total 1 <0.5 <0.5 <0.5
<0.5 <0.5 <0.5 <0.5
<0.5 <0.5 0%
Wine Red <0.5 <0.5 <0.5 <0.5
1 <0.5 <0.5 <0.5
<0.5 <0.5
White <0.5 <0.5 <0.5 <0.5
<0.5 <0.5 <0.5 <0.5
<0.5 <0.5
Other wine products <0.5 <0.5 <0.5 <0.5
<0.5 <0.5 <0.5 <0.5
0 0
56
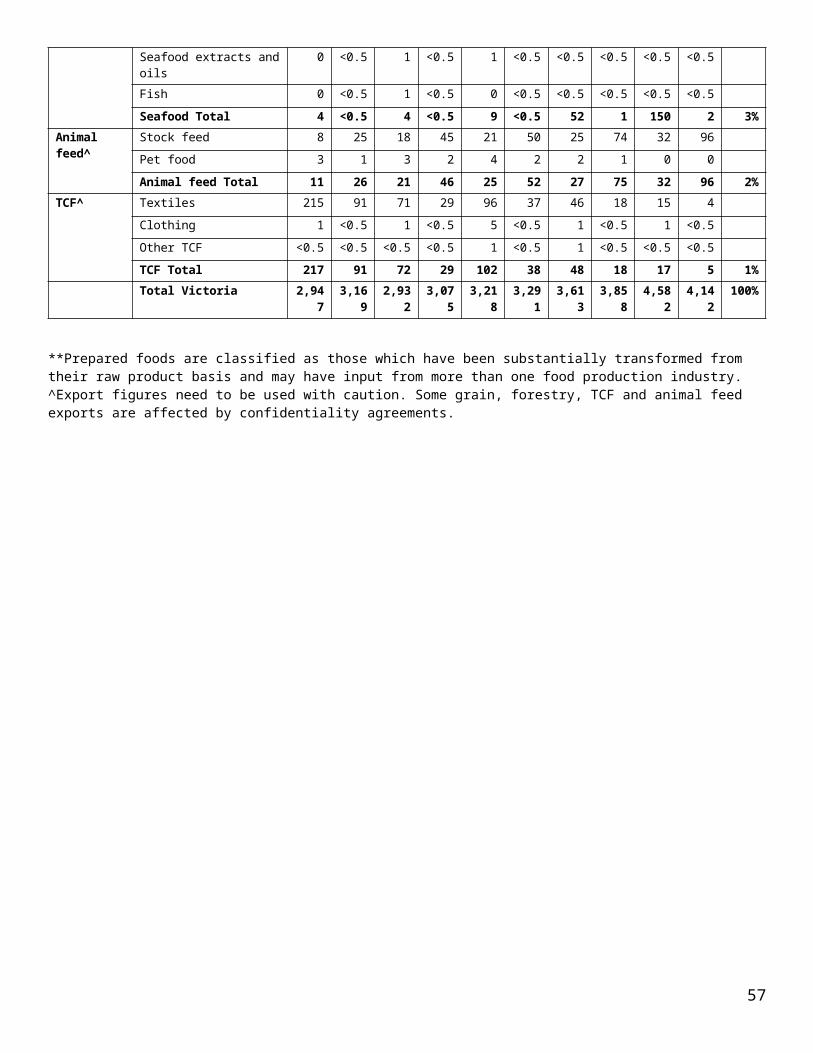
Wine Total <0.5 <0.5 1 <0.5
1 <0.5 <0.5 <0.5
<0.5 <0.5 0%
Total Victoria 632 685 573 419 556 484 560 548 597 800 100%
^Export figures need to be used with caution. Some grain, forestry, TCF and animal feed exports are affected by confidentiality agreements. **Prepared foods are classified as those which have been substantially transformed from their raw product basis and may have input from more than one food production industry.
57

Hong KongTable 33. Victorian food and fibre exports to Hong Kong by industry and product (A$ million, ‘000 tonnes)
Industry Product 2013-14 2014-15 2015-16 2016-17 2017-18 % totalA$ Vol A$ Vol A$ Vol A$ Vol A$ Vol
Prepared foods**
Other food preparations
13 3 55 6 140 9 183 12 169 10
Cereal based 6 <0.5 6 <0.5
25 2 22 2 22 2
Confectionery 7 1 9 2 9 2 10 2 10 1Condiments 1 <0.5 2 <0.
52 <0.5 2 <0.
52 <0.5
Other prepared foods 1 0 1 0 2 0 1 0 2 0Prepared foods Total 29 7 74 10 177 16 217 17 204 15 40%
Horticulture Fruit (fresh or dried) 122 57 127 57 97 48 66 31 69 32Vegetables (fresh or dried)
2 <0.5 2 <0.5
4 <0.5 6 1 6 1
Nuts (fresh or dried) 14 2 8 <0.5
23 2 9 2 4 <0.5
Other horticulture products
3 <0.5 3 <0.5
4 <0.5 5 <0.5
5 <0.5
Horticulture Total 141 61 140 59 128 52 85 35 84 35 16%Meat Offal 30 8 34 9 33 8 29 7 44 11
Sheepmeat 39 10 27 6 9 1 10 2 21 4Beef 8 1 6 <0.
510 1 8 <0.
511 1
Poultry 3 3 3 2 2 1 2 <0.5
3 2
Other meat products 5 2 4 1 6 1 3 1 4 1Meat Total 86 24 75 18 60 13 53 11 83 19 16%
Dairy Milk and cream 35 16 34 16 37 16 43 16 39 12Cheese and whey products
19 3 14 3 13 2 13 3 14 3
Butters, fats and oils 11 2 13 3 11 2 6 1 9 1Yoghurt and fermented milk products
3 <0.5 2 <0.5
2 <0.5 3 <0.5
3 <0.5
Dairy Total 67 23 63 22 63 21 65 20 65 17 13%Seafood Molluscs 25 <0.5 22 <0.
522 <0.5 30 <0.
530 <0.5
Crustaceans 7 <0.5 5 <0.5
5 <0.5 8 <0.5
9 <0.5
Fish 1 <0.5 1 <0.5
1 <0.5 <0.5 <0.5
<0.5 <0.5
Seafood extracts and oils
<0.5 <0.5 <0.5 <0.5
<0.5 <0.5 <0.5 <0.5
<0.5 <0.5
Seaweed 0 0 0 0 0 0 0 0 <0.5 <0.5Seafood Total 33 <0.5 28 <0.
528 <0.5 38 <0.
538 <0.5 8%
Wine Red 12 2 21 2 18 2 21 2 21 2
58
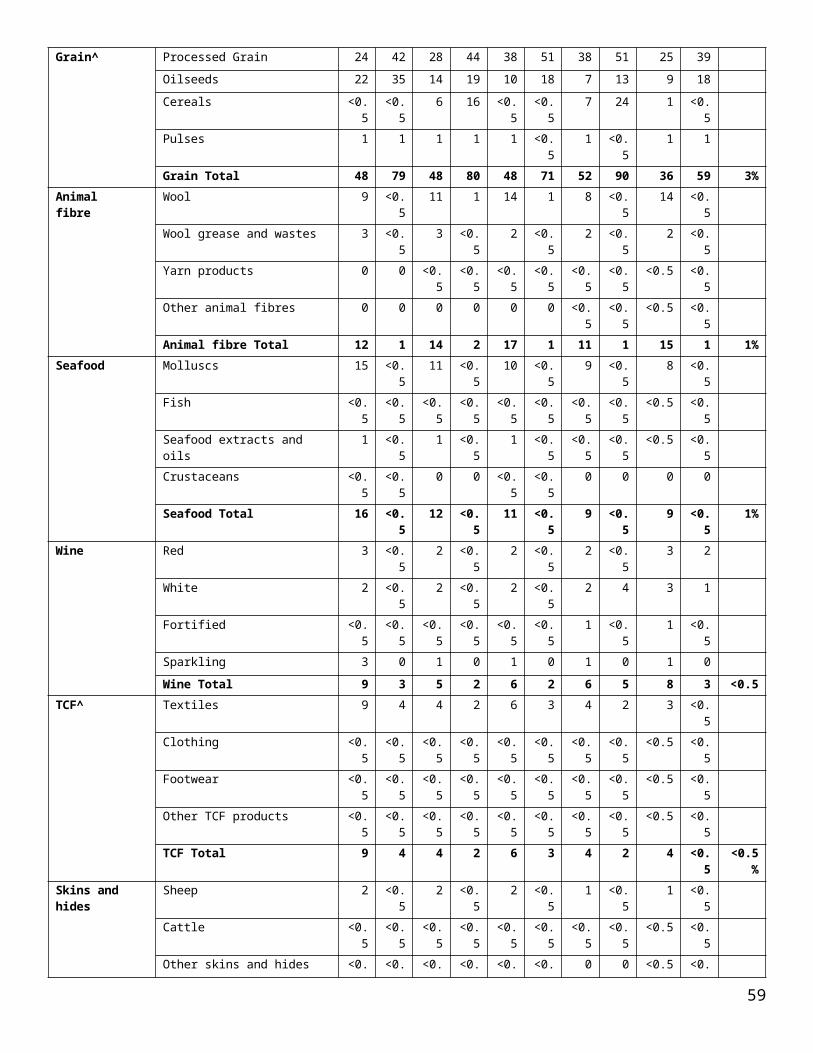
White 1 <0.5 1 <0.5
1 <0.5 1 <0.5
1 <0.5
Fortified <0.5 <0.5 2 <0.5
2 <0.5 1 <0.5
1 <0.5
Sparkling <0.5 <0.5 <0.5 <0.5
<0.5 <0.5 <0.5 <0.5
<0.5 <0.5
Wine Total 14 2 25 3 22 2 23 2 22 2 4%Forest products^
Paper and paperboard 2 3 2 2 3 3 9 10 7 6Wastepaper <0.5 2 1 8 2 12 3 19 1 4Roundwood <0.5 <0.5 0 0 <0.5 <0.5 0 0 <0.5 <0.5Wood-based panels <0.5 <0.5 <0.5 <0.
50 0 <0.5 <0.
5<0.5 <0.5
Sawnwood <0.5 <0.5 0 0 0 0 0 0 <0.5 <0.5Other forest products <0.5 <0.5 0 0 <0.5 <0.5 0 0 0 0Forest products Total 3 5 3 9 5 15 11 29 8 10 2%
TCF^ Textiles 7 <0.5 7 <0.5
6 <0.5 3 <0.5
2 <0.5
Clothing <0.5 <0.5 <0.5 <0.5
1 <0.5 1 <0.5
1 <0.5
Footwear <0.5 <0.5 <0.5 <0.5
<0.5 <0.5 <0.5 <0.5
1 <0.5
Other TCF products <0.5 <0.5 <0.5 <0.5
<0.5 <0.5 <0.5 <0.5
<0.5 <0.5
TCF Total 7 <0.5 8 <0.5
8 <0.5 5 <0.5
4 <0.5 <0.5%
Animal feed^ Pet food 3 1 2 <0.5
2 <0.5 2 <0.5
2 <0.5
Stock feed <0.5 3 1 <0.5
1 <0.5 1 <0.5
1 <0.5
Animal feed Total 3 5 3 2 3 1 3 1 3 1 <0.5%
Grain^ Cereals <0.5 <0.5 <0.5 <0.5
<0.5 <0.5 <0.5 <0.5
<0.5 <0.5
Processed Grain <0.5 <0.5 <0.5 <0.5
1 <0.5 <0.5 <0.5
<0.5 <0.5
Oilseeds <0.5 <0.5 <0.5 <0.5
<0.5 <0.5 <0.5 <0.5
<0.5 <0.5
Pulses <0.5 <0.5 0 0 <0.5 <0.5 0 0 <0.5 <0.5Grain Total <0.5 <0.5 <0.5 <0.
51 <0.5 1 <0.
5<0.5 <0.5 0%
Skins and hides
Other skins and hides <0.5 <0.5 <0.5 <0.5
<0.5 <0.5 <0.5 <0.5
<0.5 <0.5
Cattle 5 2 1 <0.5
1 <0.5 1 <0.5
<0.5 <0.5
Sheep 1 <0.5 <0.5 <0.5
0 0 0 0 0 0
Skins and hides Total 6 2 1 <0.5
2 <0.5 1 <0.5
<0.5 <0.5 0%
Animal fibre Wool grease and wastes
0 0 0 0 <0.5 <0.5 <0.5 <0.5
<0.5 <0.5
Yarn products <0.5 <0.5 0 0 <0.5 <0.5 0 0 <0.5 <0.5Other animal fibre <0.5 <0.5 <0.5 <0. 0 0 0 0 0 0
59
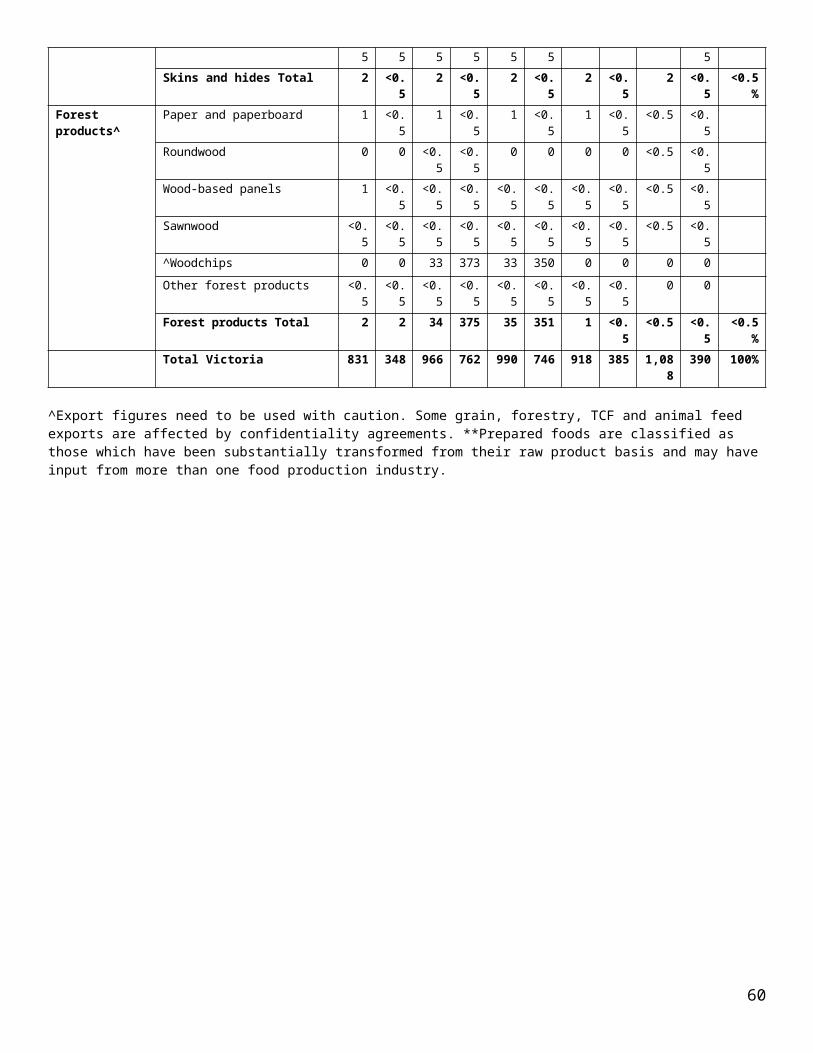
products 5Animal fibre Total <0.5 <0.5 <0.5 <0.
5<0.5 <0.5 <0.5 <0.
5<0.5 <0.5 0%
Total Victoria 390 130 420 124 498 122 502 117 513 101 100%
^Export figures need to be used with caution. Some grain, forestry, TCF and animal feed exports are affected by confidentiality agreements.**Prepared foods are classified as those which have been substantially transformed from their raw product basis and may have input from more than one food production industry.
60

MalaysiaTable 34. Victorian food and fibre exports to Malaysia by industry and product (A$ million, ‘000 tones)
Industry Product 2013-14 2014-15 2015-16 2016-17 2017-18 % totalA$ Vol A$ Vol A$ Vol A$ Vol A$ Vol
Meat Sheepmeat 55 13 66 14 60 15 66 13 108 18Beef 43 10 30 6 30 6 27 5 41 8Offal 11 4 6 2 5 2 7 3 11 4Alternative meat 3 <0.
52 <0.
52 <0.
51 <0.
52 <0.
5Poultry <0.
5<0.
50 0 <0.
5<0.
50 0 <0.5 <0.
5Other meat 1 <0.
5<0.
5<0.
5<0.
5<0.
5<0.
5<0.
5<0.
5<0.
5Meat Total 112 28 105 24 97 24 101 21 163 31 33%
Dairy Milk and cream 78 22 74 23 68 31 72 34 60 33Cheese and whey products
40 10 36 9 33 8 37 8 38 8
Butters, fats and oils 13 3 14 3 14 3 11 2 16 2Yoghurt and fermented milk products
3 <0.5
3 <0.5
2 <0.5
3 1 4 <0.5
Milk extracts 1 <0.5
0 0 0 0 0 0 0 0
Dairy Total 135 35 127 36 117 42 123 45 117 44 23%Grain^ Cereals 31 89 44 128 42 123 49 184 64 251
Oilseeds 15 16 8 10 10 17 17 33 8 16Pulses 5 7 4 6 3 4 5 8 3 6Processed Grain 1 <0.
5<0.
5<0.
51 <0.
51 2 1 1
Grain Total 52 113 57 145 56 146 73 228 75 274 15%Prepared foods**
Cereal based 52 11 38 7 25 6 26 7 33 9Other food preparations 3 <0.
55 <0.
53 <0.
54 <0.
56 <0.
5Confectionery 4 <0.
53 <0.
54 <0.
54 <0.
53 <0.
5Condiments 1 <0.
52 <0.
52 <0.
51 <0.
52 <0.
5Beverages <0.
5<0.
5<0.
5<0.
5<0.
5<0.
51 <0.
51 <0.
5Sugars 1 <0.
5<0.
5<0.
5<0.
5<0.
5<0.
5<0.
5<0.
513
Non-alcholic beverages 0 0 0 0 0 0 0 0 <0.5
<0.5
Prepared foods Total 61 14 49 9 34 8 36 9 45 25 9%Horticulture Fruit (fresh or dried) 17 10 18 10 20 9 20 9 22 11
Vegetables (fresh or dried)
1 <0.5
1 <0.5
3 2 3 2 2 1
Oils and extracts 1 <0.5
1 <0.5
2 <0.5
2 <0.5
2 <0.5
61

Coffee, tea, herbs and spices
2 <0.5
1 <0.5
2 <0.5
2 <0.5
2 <0.5
Processed 2 2 2 <0.5
2 2 4 3 2 <0.5
Nuts (fresh or dried) 1 <0.5
2 <0.5
1 <0.5
<0.5
<0.5
1 <0.5
Horticulture Total 22 13 25 13 30 14 31 14 32 13 6%Forest products^
Paper and paperboard 18 31 16 19 12 15 17 21 16 14Wastepaper 1 6 1 4 1 7 2 16 8 68Sawnwood 1 1 1 2 1 1 1 2 1 <0.
5Other forest products <0.
5<0.
5<0.
5<0.
51 <0.
5<0.
5<0.
5<0.
5<0.
5Forest products Total 19 38 17 26 15 24 20 38 25 83 5%
Animal fibre Wool 59 5 59 6 28 3 11 1 17 2Other animal fibres <0.
5<0.
5<0.
5<0.
5<0.
5<0.
5<0.
5<0.
5<0.
5<0.
5Animal fibre Total 59 5 59 6 28 3 11 1 17 2 3%
TCF^ Textiles 17 20 14 19 12 16 12 20 12 21Other TCF <0.
5<0.
5<0.
5<0.
5<0.
5<0.
5<0.
5<0.
5<0.
5<0.
5TCF Total 17 20 15 19 12 16 13 20 13 21 3%
Animal feed^ Stock feed 6 8 9 11 8 11 5 7 5 7Pet food 3 2 3 2 2 2 3 2 3 2Animal feed Total 9 9 12 13 10 13 7 9 8 9 2%
Wine Red 1 <0.5
1 <0.5
2 1 1 <0.5
1 <0.5
Other wine 1 <0.5
<0.5
<0.5
1 <0.5
1 <0.5
1 <0.5
Wine Total 1 <0.5
2 <0.5
3 1 2 <0.5
2 <0.5
<0.5%
Seafood Seafood Total 2 <0.5
1 <0.5
2 <0.5
1 <0.5
1 <0.5
<0.5%
Skins and hides
Skins and hides Total <0.5
<0.5
0 0 <0.5
<0.5
<0.5
<0.5
0 0 0%
Total Victoria 489 276 468 289 404 292 419 386 498 503 100%
**Prepared foods are classified as those which have been substantially transformed from their raw product basis and may have input from more than one food production industry.^Export figures need to be used with caution. Some grain, forestry, TCF and animal feed exports are affected by confidentiality agreements.
62

IndiaTable 35. Victorian food and fibre exports to India by industry and product (A$ million, ‘000 tonnes)
Industry Product 2013-14 2014-15 2015-16 2016-17 2017-18 % totalA$ Vol A$ Vol A$ Vol A$ Vol A$ Vol
Animal fibre Wool 111 15 111 14 144 15 149 15 155 13Other animal fibres <0.5 <0.
51 <0.5 <0.5 <0.
5<0.5 <0.5 <0.
5<0.5
Animal fibre Total 111 15 111 14 144 16 149 15 156 13 41%Horticulture Nuts (fresh or dried) 123 22 154 19 105 15 127 22 137 23
Fruit (fresh or dried) 2 2 2 1 1 <0.5
1 <0.5 5 3
Processed 1 1 <0.5 <0.5 <0.5 <0.5
<0.5 <0.5 <0.5
<0.5
Other horticulture <0.5 <0.5
<0.5 <0.5 <0.5 <0.5
<0.5 <0.5 <0.5
<0.5
Horticulture Total 126 24 157 21 107 16 129 23 142 26 37%Grain^ Pulses 44 67 27 41 16 19 123 159 48 70
Processed Grain 6 8 6 9 5 7 5 7 5 8Cereals <0.5 <0.
522 70 <0.5 1 83 300 0 0
Oilseeds 0 0 <0.5 <0.5 <0.5 <0.5
0 0 0 0
Grain Total 50 76 56 119 22 27 211 465 53 78 14%Forest products^
Wastepaper 3 13 3 14 6 21 5 19 6 25Paper and paperboard
<0.5 <0.5
5 8 4 6 44 106 4 4
Other forest products 6 51 <0.5 <0.5 <0.5 <0.5
<0.5 <0.5 <0.5
<0.5
Forest products Total
9 64 9 22 10 27 48 125 10 29 3%
TCF^ Textiles 7 2 7 3 8 3 74 33 8 3Other TCF <0.5 <0.
5<0.5 <0.5 <0.5 <0.
51 <0.5 <0.
5<0.5
TCF Total 7 2 7 3 8 3 75 33 9 3 2%Skins and hides Cattle 6 1 9 2 12 2 12 2 7 1
Other skins and hides <0.5 <0.5
1 <0.5 2 <0.5
1 <0.5 1 <0.5
Skins and hides Total
6 1 10 2 13 2 14 3 7 2 2%
Sugars <0.5 <0.5
<0.5 <0.5 <0.5 <0.5
<0.5 <0.5 <0.5
<0.5
Prepared foods
Prepared foods Total
1 <0.5
1 <0.5 2 <0.5
1 <0.5 2 <0.5 1%
Dairy** Dairy Total <0.5 <0.5
<0.5 <0.5 1 <0.5
1 <0.5 1 <0.5 0%
Wine Wine Total <0.5 <0.5
<0.5 <0.5 <0.5 <0.5
<0.5 <0.5 1 <0.5 0%
Animal feed^ Animal feed Total 1 <0.5
1 <0.5 <0.5 <0.5
<0.5 <0.5 <0.5
<0.5 0%
63

Meat Meat Total <0.5 <0.5
<0.5 <0.5 <0.5 <0.5
<0.5 <0.5 <0.5
<0.5 0%
Seafood Seafood Total <0.5 <0.5
0 0 <0.5 <0.5
<0.5 <0.5 0 0 0%
Total Victoria 312 184 353 183 308 92 629 666 380 152 100%
^Export figures need to be used with caution. Some grain, forestry, TCF and animal feed exports are affected by confidentiality agreements.**Prepared foods are classified as those which have been substantially transformed from their raw product basis and may have input from more than one food production industry.
64

South KoreaTable 36. Victorian food and fibre exports to South Korea by industry and product (A$ million, ‘000 tonnes)
Industry Product 2013-14 2014-15 2015-16 2016-17 2017-18 % totalA$ Vol A$ Vol A$ Vol A$ Vol A$ Vol
Meat Beef 66 14 94 16 97 15 62 11 70 12Sheepmeat 9 1 9 1 15 2 40 6 53 7Offal 12 3 21 4 15 3 15 3 17 3Alternative meat 3 <0.5 4 <0.
55 <0.5 9 1 8 <0.5
Other prepared meat products
2 <0.5 2 <0.5
3 <0.5 3 <0.5
2 <0.5
Animal fats 4 3 2 3 1 1 2 2 2 2Poultry 0 0 <0.5 <0.
50 0 <0.5 <0.
52 1
Pig meat <0.5 <0.5 <0.5 <0.5
0 0 <0.5 <0.5
<0.5 <0.5
Meat Total 96 23 133 26 136 23 131 23 153 26 42%Dairy Cheese and whey
products24 5 25 5 34 7 46 10 41 8
Milk and cream 41 8 38 10 27 8 35 10 34 9Butters, fats and oils 3 <0.5 5 1 12 3 7 1 4 <0.5Other dairy 1 <0.5 <0.5 <0.
5<0.5 <0.5 <0.5 <0.
5<0.5 <0.5
Dairy Total 69 14 69 16 73 18 87 20 79 18 22%Animal fibre Wool 37 4 46 4 67 5 57 4 55 4
Wool grease and wastes
<0.5 <0.5 4 6 1 4 1 2 1 2
Other animal fibres <0.5 <0.5 <0.5 <0.5
<0.5 <0.5 <0.5 <0.5
<0.5 <0.5
Animal fibre Total 38 4 50 10 69 9 58 6 56 6 15%Animal feed^ Stock feed 14 41 10 27 16 40 19 52 19 59
Pet food 6 2 6 2 7 2 7 2 6 2Animal feed Total 20 43 17 30 23 42 26 54 25 61 7%
Prepared foods
Cereal based 8 <0.5 9 1 9 1 8 <0.5
6 <0.5
Other food preparations
1 <0.5 2 <0.5
2 <0.5 2 <0.5
4 <0.5
Beverages 7 5 9 6 7 4 3 2 4 3Sugars 1 <0.5 1 <0.
52 <0.5 2 <0.
51 <0.5
Condiments and confecftionery
<0.5 <0.5 <0.5 <0.5
<0.5 <0.5 1 <0.5
1 <0.5
Prepared foods Total 18 7 21 8 20 6 15 3 15 4 4%Grain^ Processed Grain 13 26 15 26 14 21 10 17 7 13
Oilseeds 37 41 24 35 15 26 11 16 4 8Cereals 17 45 16 37 7 17 6 17 4 13Pulses <0.5 <0.5 5 5 <0.5 <0.5 <0.5 <0. <0.5 <0.5
65

5Grain Total 68 111 59 103 36 64 28 51 15 33 4%
Forest products^
Paper and paperboard 5 8 4 6 3 4 3 6 4 6Sawnwood 4 10 5 10 3 6 4 11 3 6Roundwood 21 169 17 165 18 157 21 150 2 14Wastepaper 1 3 1 4 1 3 1 2 2 10Other forest products <0.5 <0.5 <0.5 <0.
50 0 <0.5 <0.
50 0
Forest products Total
31 191 27 185 25 171 29 168 10 36 3%
Horticulture Fruit (fresh or dried) 1 <0.5 3 <0.5
2 <0.5 2 <0.5
3 1
Processed <0.5 <0.5 <0.5 <0.5
1 <0.5 1 <0.5
2 <0.5
Vegetables (fresh or dried)
<0.5 <0.5 2 3 1 <0.5 1 <0.5
1 <0.5
Oils and extracts <0.5 <0.5 1 <0.5
1 1 1 3 1 1
Coffee, tea, herbs and spices
<0.5 <0.5 <0.5 <0.5
<0.5 <0.5 <0.5 <0.5
1 <0.5
Nuts (fresh or dried) 0 0 2 <0.5
6 <0.5 2 <0.5
<0.5 <0.5
Horticulture Total 2 <0.5 9 5 10 3 8 5 8 3 2%TCF^ Textiles 27 11 16 6 7 2 1 <0.
51 <0.5
Other TCF <0.5 <0.5 <0.5 <0.5
<0.5 <0.5 <0.5 <0.5
<0.5 <0.5
TCF Total 27 11 16 6 7 2 1 <0.5
2 <0.5 <0.5%
Wine Wine Total 1 <0.5 1 <0.5
1 <0.5 1 <0.5
1 <0.5 <0.5%
Seafood Seafood Total 1 <0.5 <0.5 <0.5
<0.5 <0.5 <0.5 <0.5
1 <0.5 0%
Skins and hides
Skins and hides Total
1 <0.5 <0.5 <0.5
0 0 <0.5 <0.5
<0.5 <0.5 0%
Total Victoria 369 405 402 388 400 337 385 332 366 188 100%
^Export figures need to be used with caution. Some grain, forestry, TCF and animal feed exports are affected by confidentiality agreements. **Prepared foods are classified as those which have been substantially transformed from their raw product basis and may have input from more than one food production industry.
66
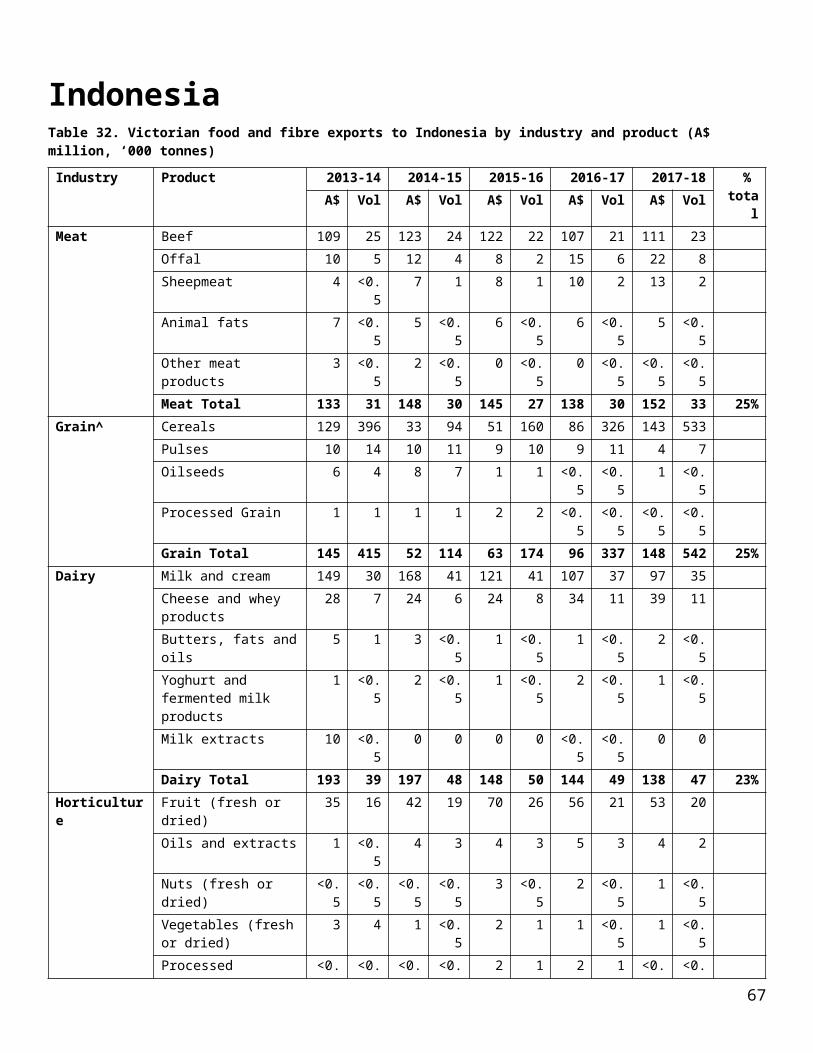
SingaporeTable 37. Victorian food and fibre exports to Singapore by industry and product (A$ million, ‘000 tonnes)
Industry Product 2013-14 2014-15 2015-16 2016-17 2017-18 % totalA$ Vol A$ Vol A$ Vol A$ Vol A$ Vol
Dairy Milk and cream 147 35 110 35 71 30 71 33 59 28Cheese and whey products
33 6 37 10 33 13 33 9 31 9
Yoghurt and fermented milk products
9 2 11 3 15 4 17 4 19 4
Butters, fats and oils 30 6 28 5 19 4 15 3 15 2Milk extracts 1 <0.5 0 0 0 0 0 0 0 0Dairy Total 220 49 187 53 137 50 136 48 124 43 36%
Meat Sheepmeat 20 4 27 6 29 6 36 6 36 6Beef 29 5 20 3 18 3 19 2 19 2Offal 3 2 7 3 8 4 5 2 5 2Animal fats <0.5 <0.5 <0.5 <0.
54 5 7 7 5 5
Pig meat 3 1 7 2 19 3 8 2 4 <0.5Other meat <0.5 <0.5 1 <0.
51 <0.5 <0.5 <0.
51 <0.5
Meat Total 56 13 61 14 78 20 75 19 69 15 20%Horticulture Fruit (fresh or dried) 25 12 27 14 30 13 24 10 30 11
Vegetables (fresh or dried)
5 2 6 2 10 4 11 4 11 4
Processed 2 <0.5 3 1 4 1 4 1 5 2Oils and extracts 1 <0.5 1 <0.
51 <0.5 8 6 2 <0.5
Coffee, tea, herbs and spices
<0.5 <0.5 <0.5 <0.5
<0.5 <0.5 1 <0.5
1 <0.5
Nuts (fresh or dried) 1 <0.5 2 <0.5
3 <0.5 1 <0.5
1 <0.5
Horticulture Total 34 14 40 18 48 18 48 21 49 17 14%Animal fibre Wool grease and
wastes70 71 60 77 13 16 20 19 36 44
Other animal fibres 1 <0.5 <0.5 <0.5
1 <0.5 <0.5 <0.5
<0.5 <0.5
Animal fibre Total 71 71 60 77 14 16 20 19 37 44 11%Prepared foods**
Cereal based 11 3 11 3 8 1 11 2 10 2Other food preparations
5 2 7 2 8 3 9 3 8 2
Condiments 3 <0.5 3 <0.5
3 <0.5 3 <0.5
4 <0.5
Confectionery 3 <0.5 4 <0.5
3 <0.5 3 <0.5
3 <0.5
Beverages 1 3 2 3 1 3 1 3 1 2Sugars 2 1 3 2 2 1 2 1 1 <0.5Non-alcholic beverages 0 0 0 0 0 0 <0.5 <0. <0.5 <0.5
67
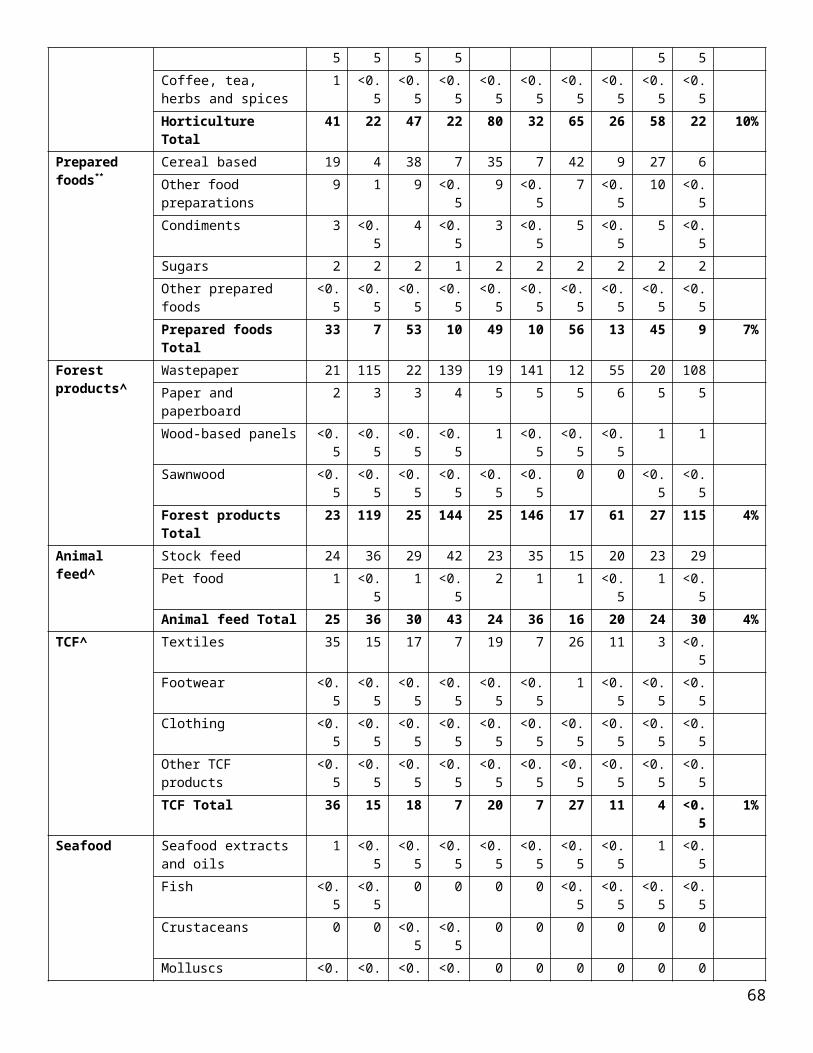
5Prepared foods Total 26 10 30 13 25 9 29 10 28 8 8%
Seafood Molluscs 13 <0.5 12 <0.5
11 <0.5 13 <0.5
14 <0.5
Crustaceans 1 <0.5 1 <0.5
1 <0.5 1 <0.5
1 <0.5
Other seafood <0.5 <0.5 <0.5 <0.5
1 <0.5 <0.5 <0.5
<0.5 <0.5
Seafood Total 14 <0.5 13 <0.5
13 <0.5 14 <0.5
15 <0.5 4%
Wine Red 4 <0.5 3 3 3 <0.5 3 1 3 <0.5White 2 <0.5 1 <0.
52 <0.5 1 <0.
51 <0.5
Fortified <0.5 <0.5 <0.5 <0.5
<0.5 <0.5 <0.5 <0.5
<0.5 <0.5
Sparkling 5 1 5 1 5 1 7 1 5 1Wine Total 11 3 9 5 10 2 11 3 10 2 3%
TCF^ Textiles 15 1 16 2 7 <0.5 3 <0.5
3 <0.5
Footwear 1 <0.5 1 <0.5
1 <0.5 <0.5 <0.5
1 <0.5
Leather articles <0.5 <0.5 <0.5 <0.5
2 <0.5 1 <0.5
1 <0.5
Clothing 1 <0.5 1 <0.5
<0.5 <0.5 1 <0.5
1 <0.5
Woven fabrics <0.5 <0.5 0 0 <0.5 <0.5 <0.5 <0.5
0 0
TCF Total 17 1 17 2 11 <0.5 5 <0.5
5 <0.5 1%
Animal feed^ Stock feed 2 2 2 2 2 2 2 2 2 2Pet food 3 <0.5 2 <0.
52 <0.5 2 <0.
52 <0.5
Animal feed Total 4 3 4 3 4 3 3 3 4 3 1%Grain^ Cereals 7 20 3 11 <0.5 <0.5 4 14 2 6
Oilseeds 6 5 9 8 3 1 1 <0.5
1 <0.5
Processed Grain <0.5 <0.5 <0.5 <0.5
1 <0.5 1 <0.5
1 <0.5
Pulses <0.5 <0.5 <0.5 <0.5
1 <0.5 <0.5 <0.5
<0.5 <0.5
Grain Total 14 26 14 20 4 3 6 16 4 7 1%Forest products^
Paper and paperboard 2 3 2 3 4 4 6 10 1 <0.5Wastepaper <0.5 <0.5 1 3 <0.5 1 <0.5 3 <0.5 <0.5Wood-based panels <0.5 <0.5 <0.5 <0.
5<0.5 <0.5 <0.5 <0.
5<0.5 <0.5
Sawnwood <0.5 <0.5 <0.5 <0.5
0 0 <0.5 <0.5
0 0
Other forest products 0 0 0 0 0 0 <0.5 <0.5
0 0
Roundwood <0.5 <0.5 0 0 0 0 0 0 0 0Forest products Total 3 4 3 6 4 5 6 13 1 1 <0.5%
68
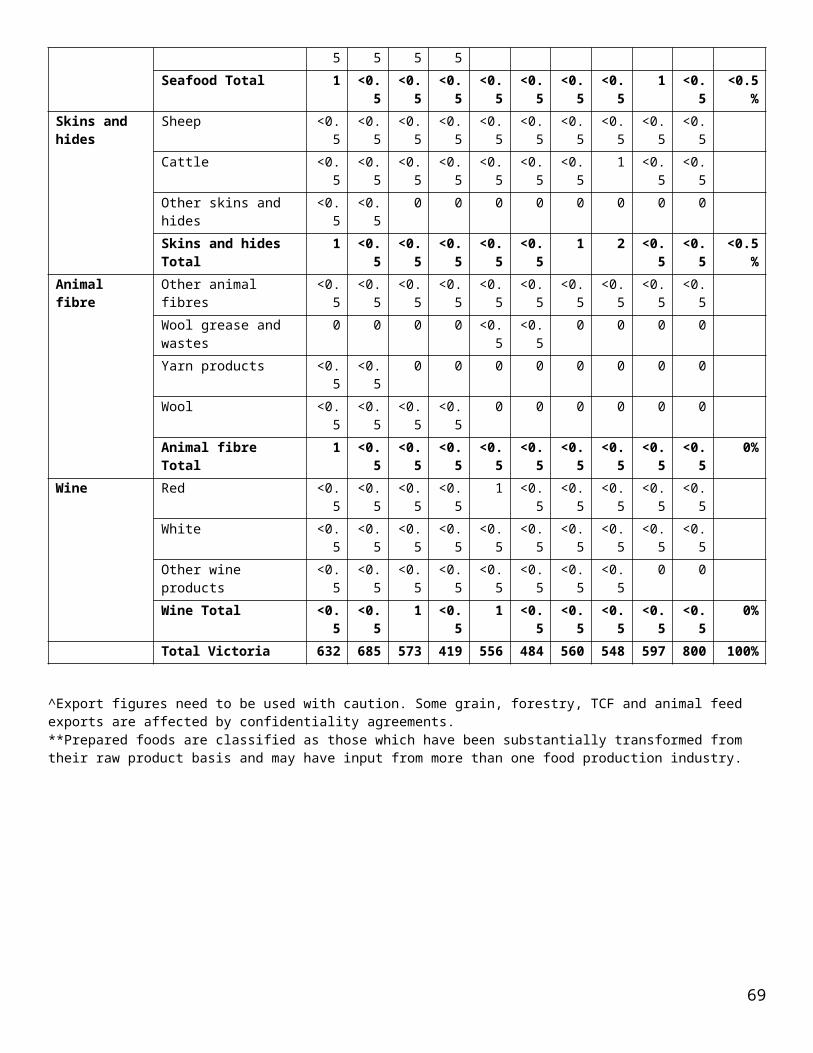
Skins and hides
Cattle <0.5 <0.5 0 0 <0.5 <0.5 0 0 <0.5 <0.5Other skins and hides <0.5 <0.5 <0.5 <0.
5<0.5 <0.5 0 0 <0.5 <0.5
Sheep <0.5 <0.5 0 0 0 0 0 0 0 0Skins and hides Total <0.5 <0.5 <0.5 <0.
5<0.5 <0.5 0 0 <0.5 <0.5 <0.5%
Total Victoria 468 195 438 211 348 129 354 152 345 142 100%^Export figures need to be used with caution. Some grain, forestry, TCF and animal feed exports are affected by confidentiality agreements.**Prepared foods are classified as those which have been substantially transformed from their raw product basis and may have input from more than one food production industry.
69

United Arab EmiratesTable 38. Victorian food and fibre exports to UAE by industry and product (A$ million, ‘000 tonnes)
Industry Product 2013-14 2014-15 2015-16 2016-17 2017-18 % totalA$ Vol A$ Vol A$ Vol A$ Vol A$ Vol
Meat Sheepmeat 69 13 91 16 95 17 113 17 127 18Beef 15 3 23 3 18 3 13 2 17 3Offal 5 2 5 2 6 2 7 3 8 3Animal fats 0 0 0 0 0 0 <0.5 <0.
5<0.5 <0.5
Alternative meat 4 <0.5 6 <0.5
1 <0.5 <0.5 <0.5
<0.5 <0.5
Other meat products 4 1 6 1 1 <0.5 <0.5 <0.5
<0.5 <0.5
Meat Total 93 18 125 22 121 22 133 22 152 24 46%Prepared foods**
Cereal based 86 19 72 17 60 16 57 15 80 21Other food preparations
8 1 3 <0.5
4 <0.5 3 <0.5
6 <0.5
Confectionery <0.5 <0.5 <0.5 <0.5
1 <0.5 1 <0.5
1 <0.5
Condiments <0.5 <0.5 <0.5 <0.5
<0.5 <0.5 <0.5 <0.5
<0.5 <0.5
Other prepared foods 8 1 3 <0.5
4 1 3 <0.5
6 1
Prepared foods Total 94 20 76 18 65 17 62 15 88 23 26%Horticulture Fruit (fresh or dried) 15 8 21 10 34 14 21 9 12 6
Nuts (fresh or dried) 52 6 39 4 31 2 9 1 12 1Vegetables (fresh or dried)
2 1 2 1 3 2 2 1 2 <0.5
Processed 1 <0.5 1 <0.5
1 <0.5 2 <0.5
2 <0.5
Other horticulture products
<0.5 <0.5 <0.5 <0.5
<0.5 <0.5 <0.5 <0.5
<0.5 <0.5
Horticulture Total 70 16 64 16 69 19 35 12 29 9 9%TCF^ Textiles 16 23 15 22 20 25 19 29 19 30
Clothing <0.5 <0.5 1 <0.5
<0.5 <0.5 1 <0.5
1 <0.5
Footwear <0.5 <0.5 <0.5 <0.5
<0.5 <0.5 <0.5 <0.5
<0.5 <0.5
Leather articles <0.5 <0.5 <0.5 <0.5
<0.5 <0.5 0 0 <0.5 <0.5
Woven fabrics 0 0 <0.5 <0.5
<0.5 <0.5 0 0 0 0
TCF Total 17 23 17 22 21 25 20 29 20 30 6%Grain^ Pulses 19 32 11 14 10 12 32 44 13 23
Cereals 6 18 1 2 <0.5 <0.5 <0.5 <0.5
5 16
Processed Grain <0.5 <0.5 <0.5 <0.5
0 0 <0.5 <0.5
<0.5 <0.5
70
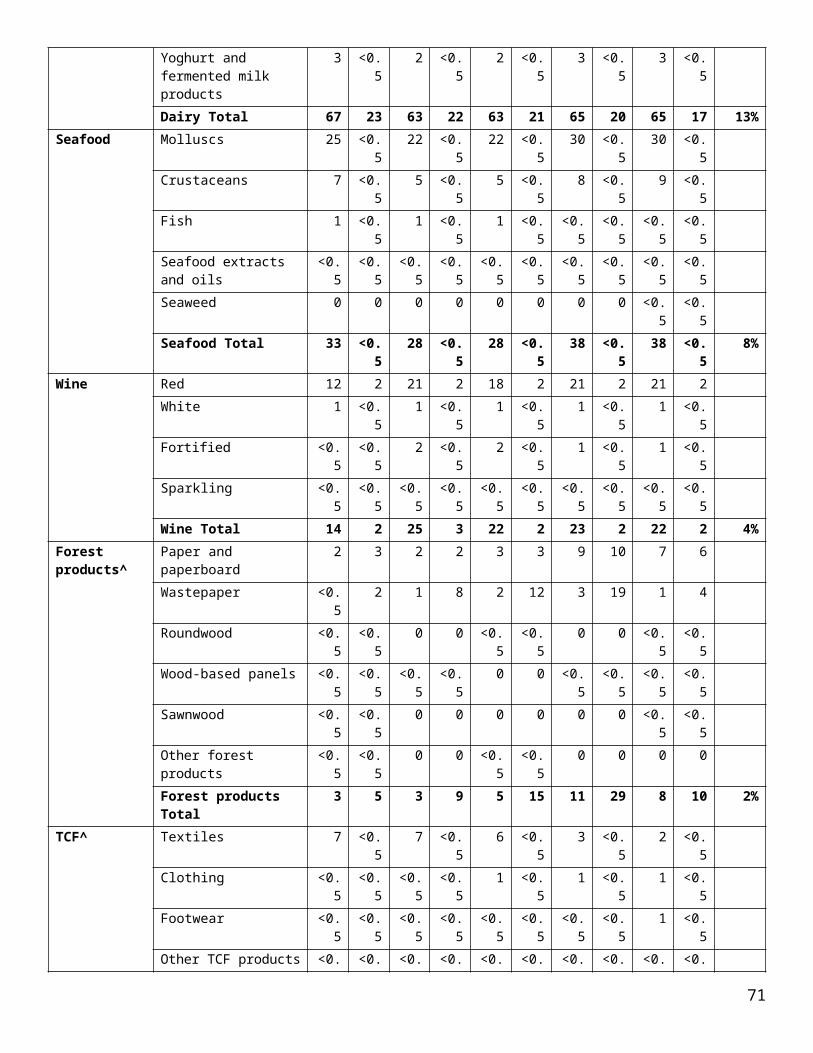
Oilseeds 41 74 9 18 0 0 <0.5 <0.5
0 0
Grain Total 66 124 21 33 11 13 33 45 17 39 5%Dairy Milk and cream 17 3 12 3 10 4 15 6 9 3
Cheese and whey products
3 <0.5 4 <0.5
4 <0.5 3 <0.5
5 <0.5
Butters, fats and oils 4 <0.5 20 5 8 2 1 <0.5
1 <0.5
Yoghurt and fermented milk products
<0.5 <0.5 <0.5 <0.5
0 0 <0.5 <0.5
<0.5 <0.5
Dairy Total 25 5 36 9 21 7 20 7 14 4 4%Forest products^
Paper and paperboard 5 23 5 6 6 7 13 14 8 7Sawnwood 0 0 0 0 0 0 0 0 <0.5 <0.5Wood-based panels <0.5 <0.5 0 0 0 0 <0.5 <0.
50 0
Other forest products <0.5 <0.5 <0.5 <0.5
<0.5 <0.5 <0.5 <0.5
0 0
Forest products Total 5 23 5 7 6 7 13 14 8 7 2%Wine Red 2 <0.5 1 <0.
51 <0.5 1 <0.
52 <0.5
White <0.5 <0.5 <0.5 <0.5
<0.5 <0.5 <0.5 <0.5
1 <0.5
Fortified <0.5 <0.5 <0.5 <0.5
<0.5 <0.5 <0.5 <0.5
<0.5 <0.5
Sparkling <0.5 <0.5 <0.5 <0.5
<0.5 <0.5 <0.5 <0.5
<0.5 <0.5
Wine Total 3 <0.5 2 <0.5
2 <0.5 2 <0.5
3 <0.5 1%
Animal feed^ Pet food <0.5 <0.5 <0.5 <0.5
<0.5 <0.5 <0.5 <0.5
<0.5 <0.5
Stock feed <0.5 <0.5 <0.5 <0.5
<0.5 <0.5 <0.5 <0.5
<0.5 <0.5
Animal feed Total <0.5 <0.5 1 <0.5
1 <0.5 <0.5 <0.5
<0.5 <0.5 <0.5%
Seafood Fish <0.5 <0.5 0 0 0 0 <0.5 <0.5
<0.5 <0.5
Molluscs 0 0 <0.5 <0.5
0 0 <0.5 <0.5
<0.5 <0.5
Crustaceans 0 0 <0.5 <0.5
0 0 0 0 0 0
Seafood Total <0.5 <0.5 <0.5 <0.5
0 0 <0.5 <0.5
<0.5 <0.5 <0.5%
Skins and hides
Other skins and hides 0 0 0 0 0 0 0 0 <0.5 <0.5Cattle 0 0 0 0 <0.5 <0.5 <0.5 <0.
5<0.5 <0.5
Skins and hides Total 0 0 0 0 <0.5 <0.5 <0.5 <0.5
<0.5 <0.5 0%
Animal fibre Other animal fibres 0 0 <0.5 <0.5
0 0 0 0 0 0
Wool grease and wastes
0 0 0 0 <0.5 <0.5 0 0 0 0
Wool 11 <0.5 1 <0. 0 0 0 0 0 0
71

5Animal fibre Total 11 <0.5 1 <0.
5<0.5 <0.5 0 0 0 0 0%
Total Victoria 383 230 348 128 316 110 317 145 333 136 100%
^Export figures need to be used with caution. Some grain, forestry, TCF and animal feed exports are affected by confidentiality agreements.**Prepared foods are classified as those which have been substantially transformed from their raw product basis and may have input from more than one food production industry.
72

VietnamTable 39. Victorian food and fibre exports to Vietnam by industry and product (A$ million, ‘000 tonnes)
Industry Product 2013-14 2014-15 2015-16 2016-17 2017-18 % totalA$ Vol A$ Vol A$ Vol A$ Vol A$ Vol
Grain^ Cereals 64 188 63 185 52 158 112 390 88 310Processed Grain 21 35 18 29 20 29 23 41 27 48Pulses <0.5 <0.5 <0.5 <0.
5<0.5 <0.5 <0.5 <0.
52 5
Oilseeds 32 53 19 33 <0.5 <0.5 4 8 2 4Grain Total 118 276 101 247 73 187 139 441 119 367 38%
Horticulture Nuts (fresh or dried) <0.5 <0.5 1 <0.5
20 3 18 3 43 8
Fruit (fresh or dried) 33 12 2 <0.5
17 5 27 7 28 7
Processed <0.5 <0.5 <0.5 <0.5
1 <0.5 1 1 2 1
Oils and extracts <0.5 <0.5 <0.5 <0.5
<0.5 <0.5 <0.5 <0.5
<0.5 <0.5
Coffee, tea, herbs and spices
<0.5 <0.5 <0.5 <0.5
<0.5 <0.5 <0.5 <0.5
<0.5 <0.5
Vegetables (fresh or dried)
<0.5 <0.5 <0.5 <0.5
<0.5 <0.5 <0.5 <0.5
<0.5 <0.5
Horticulture Total 34 12 4 <0.5
39 9 47 11 74 16 24%
Meat Beef 9 2 19 5 13 1 28 5 21 3Sheepmeat 9 2 8 2 2 <0.5 3 <0.
55 <0.5
Offal 2 2 5 4 5 2 5 2 4 1Animal fats 1 <0.5 1 <0.
52 <0.5 2 <0.
53 1
Poultry <0.5 <0.5 <0.5 <0.5
<0.5 <0.5 2 2 2 2
Alternative meat 6 <0.5 6 <0.5
4 <0.5 1 <0.5
1 <0.5
Pig meat <0.5 <0.5 <0.5 <0.5
<0.5 <0.5 1 <0.5
<0.5 <0.5
Other prepared meat products
<0.5 <0.5 <0.5 <0.5
<0.5 <0.5 <0.5 <0.5
<0.5 <0.5
Meat Total 27 7 40 11 26 5 41 10 35 8 11%Dairy Milk and cream 22 6 30 11 41 19 43 21 24 13
Cheese and whey products
1 <0.5 2 <0.5
2 <0.5 3 <0.5
4 <0.5
Butters, fats and oils <0.5 <0.5 <0.5 <0.5
<0.5 <0.5 <0.5 <0.5
3 <0.5
Yoghurt and fermented milk products
<0.5 <0.5 1 <0.5
1 <0.5 1 <0.5
1 <0.5
Dairy Total 24 7 33 12 44 19 47 21 32 15 10%
73
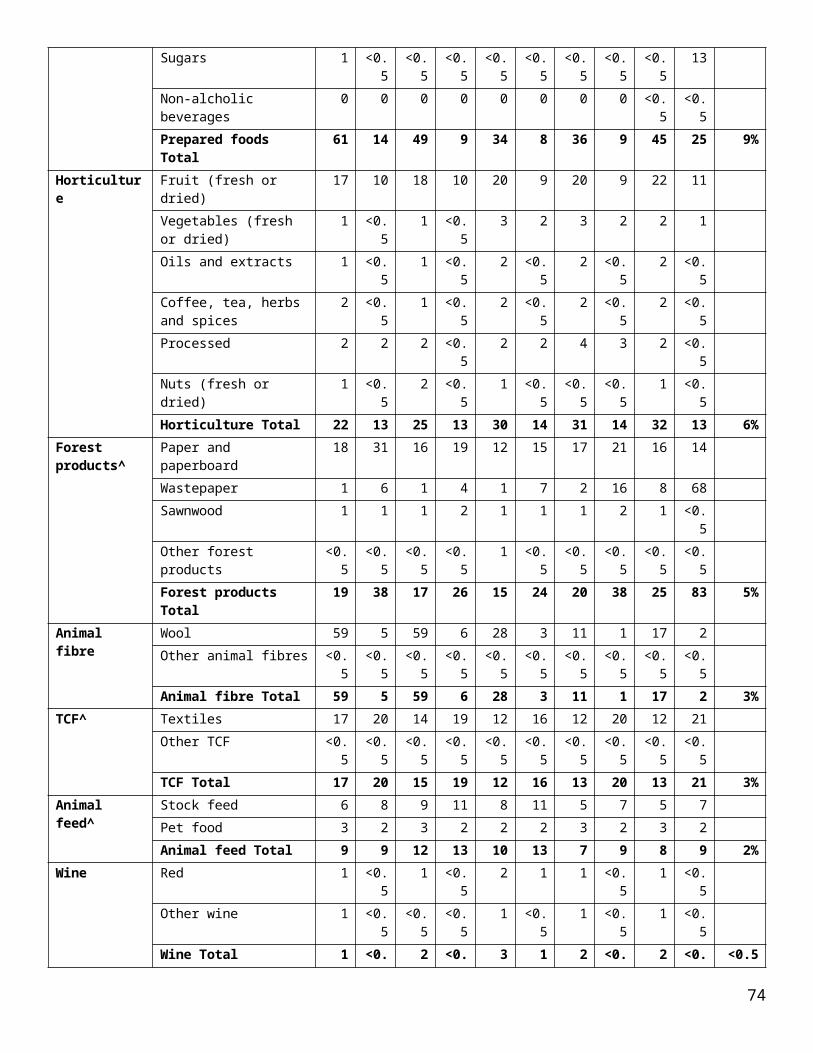
Prepared foods**
Other food preparations
1 <0.5 2 <0.5
3 <0.5 3 <0.5
9 <0.5
Cereal based 1 <0.5 2 <0.5
2 <0.5 5 <0.5
3 <0.5
Condiments <0.5 <0.5 <0.5 <0.5
<0.5 <0.5 <0.5 <0.5
1 <0.5
Confectionery <0.5 <0.5 <0.5 <0.5
<0.5 <0.5 <0.5 <0.5
<0.5 <0.5
Other prepared foods <0.5 <0.5 <0.5 <0.5
<0.5 <0.5 <0.5 <0.5
<0.5 <0.5
Prepared foods Total 3 <0.5 4 <0.5
5 <0.5 8 <0.5
14 <0.5 4%
TCF^ Textiles 17 7 16 6 45 17 34 12 12 3Footwear <0.5 <0.5 <0.5 <0.
5<0.5 <0.5 <0.5 <0.
5<0.5 <0.5
Clothing <0.5 <0.5 <0.5 <0.5
<0.5 <0.5 <0.5 <0.5
<0.5 <0.5
Leather articles <0.5 <0.5 <0.5 <0.5
<0.5 <0.5 <0.5 <0.5
<0.5 <0.5
Woven fabrics 0 0 <0.5 <0.5
1 <0.5 <0.5 <0.5
<0.5 <0.5
TCF Total 17 7 16 6 46 17 34 12 12 3 4%Seafood Crustaceans 88 1 105 1 100 1 63 <0.
58 <0.5
Molluscs 5 <0.5 7 <0.5
5 <0.5 5 <0.5
1 <0.5
Fish <0.5 <0.5 <0.5 <0.5
0 0 0 0 1 <0.5
Seafood Total 93 1 111 1 106 1 68 <0.5
10 <0.5 3%
Forest products^
Wastepaper 2 12 2 14 2 9 1 7 4 29Paper and paperboard 1 2 4 10 2 4 3 7 3 7Sawnwood 1 3 1 2 1 2 <0.5 1 <0.5 1Roundwood <0.5 <0.5 0 0 <0.5 <0.5 <0.5 4 <0.5 3Wood-based panels <0.5 <0.5 0 0 <0.5 <0.5 0 0 <0.5 <0.5Forest products Total 5 17 7 26 5 15 5 20 8 41 2%
Animal feed^ Stock feed 7 9 6 6 6 8 4 6 6 12Pet food <0.5 <0.5 <0.5 <0.
5<0.5 <0.5 <0.5 <0.
5<0.5 <0.5
Animal feed Total 8 9 6 6 6 8 4 6 6 12 2%Wine Red <0.5 <0.5 <0.5 <0.
51 <0.5 1 <0.
5<0.5 <0.5
White <0.5 <0.5 <0.5 <0.5
<0.5 <0.5 <0.5 <0.5
<0.5 <0.5
Fortified <0.5 <0.5 1 <0.5
<0.5 <0.5 <0.5 <0.5
<0.5 <0.5
Sparkling <0.5 <0.5 <0.5 <0.5
<0.5 <0.5 <0.5 <0.5
<0.5 <0.5
Wine Total 1 <0.5 1 <0.5
1 <0.5 1 <0.5
1 <0.5 <0.5%
Skins and hides
Cattle 5 1 <0.5 <0.5
<0.5 <0.5 1 <0.5
<0.5 <0.5
74
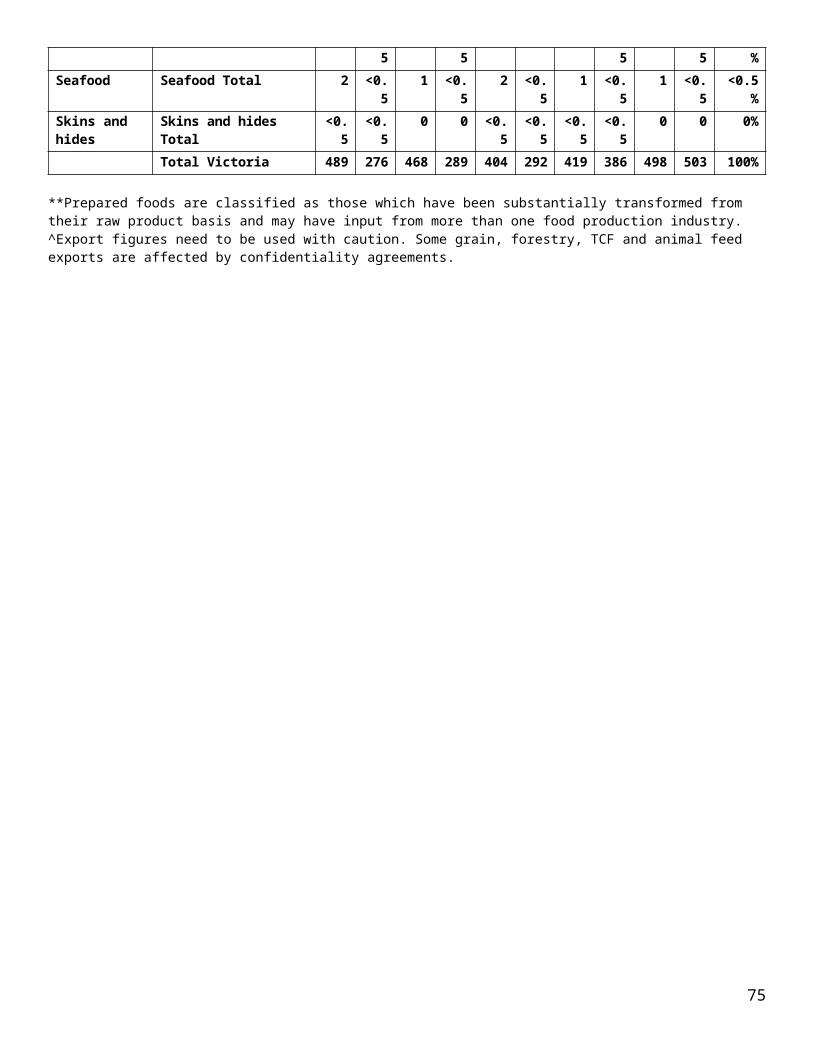
Sheep <0.5 <0.5 1 <0.5
<0.5 <0.5 0 0 0 0
Skins and hides Total 5 1 1 <0.5
<0.5 <0.5 1 <0.5
<0.5 <0.5 <0.5%
Animal fibre Other animal fibres 1 <0.5 1 2 0 0 <0.5 <0.5
<0.5 <0.5
Wool grease and wastes
0 0 0 0 0 0 <0.5 <0.5
0 0
Yarn products 0 0 0 0 <0.5 <0.5 <0.5 <0.5
0 0
Wool 0 0 <0.5 <0.5
0 0 <0.5 <0.5
0 0
Animal fibre Total 1 <0.5 1 2 <0.5 <0.5 <0.5 <0.5
<0.5 <0.5 <0.5%
Total Victoria 335 339 326 314 351 262 394 524 310 463 100%^Export figures need to be used with caution. Some grain, forestry, TCF and animal feed exports are affected by confidentiality agreements.**Prepared foods are classified as those which have been substantially transformed from their raw product basis and may have input from more than one food production industry.
75

ThailandTable 40. Victorian food and fibre exports to Thailand by industry and product (A$ million, ‘000 tonnes)
Industry Product 2013-14 2014-15 2015-16 2016-17 2017-18 % totalA$ Vol A$ Vol A$ Vol A$ Vol A$ Vol
Dairy Milk and cream 56 11 45 13 32 11 24 7 37 12Cheese and whey products
23 5 18 4 15 4 18 5 23 5
Butters, fats and oils 17 3 13 3 14 3 14 3 17 3Yoghurt and fermented milk products
6 1 6 2 3 1 5 2 4 1
Milk extracts 1 <0.5 <0.5 <0.5
<0.5 <0.5 <0.5 <0.5
<0.5 <0.5
Dairy Total 102 20 83 21 64 20 61 17 81 22 28%Grain^ Cereals 45 133 25 65 20 56 46 173 51 173
Processed Grain 35 59 34 54 30 46 18 31 10 19Pulses 1 1 1 <0.
52 1 2 1 1 <0.5
Oilseeds <0.5 <0.5 1 <0.5
1 <0.5 <0.5 <0.5
<0.5 <0.5
Grain Total 81 194 61 121 53 104 66 205 63 193 22%Prepared foods**
Cereal based 71 20 34 8 19 7 25 8 17 5Other food preparations
6 1 5 <0.5
5 <0.5 4 <0.5
8 <0.5
Condiments 1 <0.5 2 <0.5
2 <0.5 3 <0.5
4 <0.5
Beverages <0.5 <0.5 1 <0.5
1 <0.5 1 1 3 3
Confectionery 1 <0.5 2 <0.5
2 <0.5 2 <0.5
3 <0.5
Sugars 1 <0.5 1 <0.5
1 <0.5 1 <0.5
1 <0.5
Prepared foods Total 82 23 44 11 29 9 37 11 36 11 12%Meat Beef 10 1 12 1 7 <0.5 7 <0.
511 1
Sheepmeat 4 <0.5 5 <0.5
5 <0.5 7 <0.5
8 <0.5
Animal fats 5 <0.5 6 <0.5
7 <0.5 7 <0.5
6 <0.5
Offal 5 2 7 3 5 3 4 2 4 2Other meat <0.5 <0.5 1 <0.
5<0.5 <0.5 1 <0.
5<0.5 <0.5
Meat Total 24 5 30 6 24 4 25 4 29 4 10%Horticulture Fruit (fresh or dried) 13 4 15 5 21 6 18 5 20 6
Nuts (fresh or dried) 3 <0.5 8 <0.5
9 <0.5 8 <0.5
4 <0.5
Vegetables (fresh or dried)
2 2 1 <0.5
1 <0.5 1 <0.5
2 3
Processed 1 <0.5 3 2 6 6 4 5 1 <0.5
76

Oils and extracts 1 <0.5 1 <0.5
1 <0.5 1 <0.5
1 <0.5
Other horticulture <0.5 <0.5 <0.5 <0.5
<0.5 <0.5 <0.5 <0.5
<0.5 <0.5
Horticulture Total 21 8 27 8 38 14 32 12 29 10 10%Animal fibre Wool 24 2 26 2 12 <0.5 10 <0.
522 1
Other animal fibres <0.5 <0.5 0 0 <0.5 <0.5 <0.5 <0.5
0 0
Animal fibre Total 24 2 26 2 12 <0.5 10 <0.5
22 1 8%
Forest products^
Wastepaper <0.5 3 3 21 2 9 7 31 10 69Paper and paperboard 4 4 9 11 1 1 1 <0.
51 <0.5
Other forest products <0.5 <0.5 1 4 2 6 2 6 <0.5 <0.5Forest products Total 4 8 14 36 5 16 10 37 12 70 4%
Animal feed^ Pet food 6 2 6 2 5 2 5 2 4 2Stock feed 2 3 8 7 4 6 7 8 4 4Animal feed Total 8 5 15 9 9 8 13 10 8 7 3%
TCF^ Textiles 18 7 8 3 3 <0.5 11 4 3 <0.5Other TCF <0.5 <0.5 <0.5 <0.
5<0.5 <0.5 <0.5 <0.
5<0.5 <0.5
TCF Total 18 7 8 3 3 <0.5 11 4 3 <0.5 1%Skins and hides
Cattle 2 <0.5 6 2 4 2 1 <0.5
2 2
Other skins and hides <0.5 <0.5 <0.5 <0.5
<0.5 <0.5 <0.5 <0.5
<0.5 <0.5
Skins and hides Total 2 <0.5 6 2 5 2 1 <0.5
3 2 1%
Wine Red 1 <0.5 1 <0.5
1 <0.5 1 <0.5
1 <0.5
Other wine 1 <0.5 1 <0.5
1 <0.5 1 <0.5
1 <0.5
Wine Total 2 <0.5 3 <0.5
3 <0.5 2 <0.5
2 <0.5 <0.5%
Seafood Seafood Total <0.5 <0.5 <0.5 <0.5
<0.5 <0.5 1 <0.5
1 <0.5 <0.5%
Total Victoria 369 274 317 220 245 179 269 303 289 320 100%
^Export figures need to be used with caution. Some grain, forestry, TCF and animal feed exports are affected by confidentiality agreements.**Prepared foods are classified as those which have been substantially transformed from their raw product basis and may have input from more than one food production industry.
77
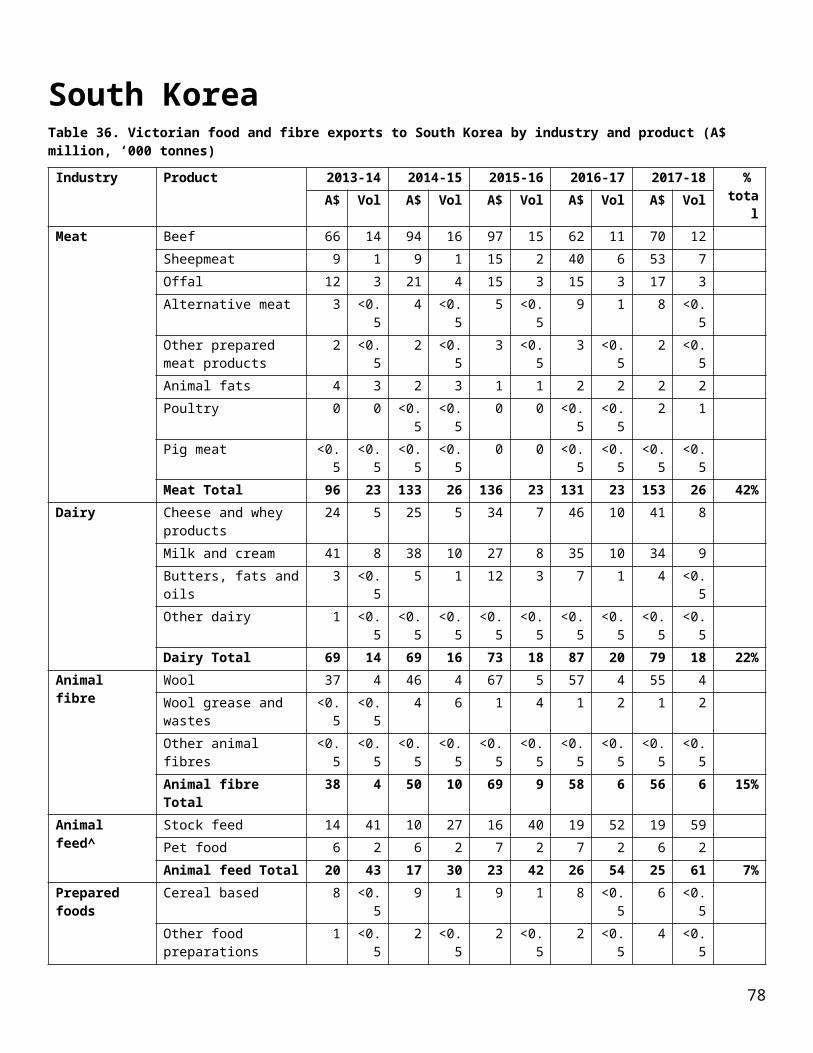
TaiwanTable 41. Victorian food and fibre exports to Taiwan by industry and product (A$ million, ‘000 tonnes)
Industry Product 2013-14 2014-15 2015-16 2016-17 2017-18 % totalA$ Vol A$ Vol A$ Vol A$ Vol A$ Vol
Dairy Milk and cream 36 7 30 8 42 13 50 16 39 12Cheese and whey products
12 3 12 3 13 3 14 3 13 3
Butters, fats and oils 7 1 9 2 8 2 6 1 7 <0.5Yoghurt and fermented milk products
<0.5 <0.5
<0.5 <0.5 <0.5 <0.5
<0.5 <0.5 <0.5
<0.5
Dairy Total 55 11 52 13 64 18 70 20 59 16 25%Grain^ Cereals 52 157 36 101 33 98 29 101 37 129
Processed Grain 6 9 8 12 6 8 2 3 3 4Pulses 1 2 2 2 1 1 1 1 2 2Oilseeds <0.5 <0.
52 2 <0.5 <0.
50 0 0 0
Grain Total 60 168 48 118 40 107 33 105 42 135 18%Meat Beef 32 6 25 4 24 3 23 3 18 3
Sheepmeat 11 4 11 3 6 2 6 1 11 3Alternative meat 3 1 3 1 3 1 8 2 4 1Offal 2 <0.
52 <0.5 3 <0.
53 <0.5 2 <0.5
Other meat <0.5 <0.5
1 <0.5 <0.5 <0.5
1 <0.5 1 <0.5
Meat Total 48 12 43 9 36 7 41 7 36 7 15%Prepared foods**
Other food preparations 5 1 7 <0.5 6 2 10 3 14 4Cereal based 21 3 17 3 13 2 13 2 11 2Confectionery 1 <0.
51 <0.5 1 <0.
52 <0.5 2 <0.5
Other prepared foods 1 <0.5
<0.5 <0.5 2 <0.5
2 2 1 <0.5
Prepared foods Total 29 5 26 4 22 5 26 7 29 6 12%Animal fibre Wool 11 1 12 1 15 2 20 2 27 2
Other animal fibres 1 1 2 3 <0.5 <0.5
0 0 <0.5
<0.5
Animal fibre Total 12 3 13 4 15 2 20 2 28 3 12%Animal feed^ Pet food 10 4 10 4 9 4 9 4 8 3
Stock feed 10 21 20 37 18 36 11 22 8 15Animal feed Total 19 25 30 42 27 40 20 26 16 19 7%
Forest products^
Paper and paperboard 11 26 7 17 11 24 12 27 11 20Sawnwood 1 3 3 6 4 7 3 7 2 10Wastepaper 1 4 <0.5 <0.5 <0.5 <0.
5<0.5 3 1 5
Other forest products 1 7 <0.5 <0.5 0 0 0 0 0 0Forest products Total 14 40 10 24 15 31 15 38 14 34 6%
Horticulture Fruit (fresh or dried) 3 1 3 1 6 2 6 3 6 3Vegetables (fresh or 1 <0. 1 <0.5 2 <0. 5 3 2 <0.5
78

dried) 5 5
Other horticulture 1 <0.5
1 <0.5 1 <0.5
1 <0.5 <0.5
<0.5
Horticulture Total 4 2 5 2 8 3 12 6 9 3 4%Seafood Seafood Total 2 <0.
52 <0.5 2 <0.
52 <0.5 2 <0.5 1%
Wine Wine Total 1 <0.5
1 <0.5 2 <0.5
2 <0.5 2 <0.5 0%
TCF^ TCF Total 2 <0.5
1 <0.5 <0.5 <0.5
1 <0.5 <0.5
<0.5 0%
Skins and hides
Skins and hides Total 2 <0.5
3 <0.5 1 <0.5
1 <0.5 <0.5
<0.5 0%
Total Victoria 248 268 234 216 233 213 242 213 238 225 100%^Export figures need to be used with caution. Some grain, forestry, TCF and animal feed exports are affected by confidentiality agreements.**Prepared foods are classified as those which have been substantially transformed from their raw product basis and may have input from more than one food production industry.
79

PhilippinesTable 42. Victorian food and fibre exports to Philippines by industry and product (A$ million, ‘000 tonnes)
Industry Product 2013-14 2014-15 2015-16 2016-17 2017-18 % totalA$ Vol A$ Vol A$ Vol A$ Vol A$ Vol
Dairy Cheese and whey products
15 4 19 4 27 6 25 6 35 8
Milk and cream 40 11 48 16 32 13 24 13 24 15Yoghurt and fermented milk products
21 4 13 4 6 2 3 1 4 1
Butters, fats and oils 1 <0.5
1 <0.5 1 <0.5
1 <0.5 1 <0.5
Milk extracts 0 0 <0.5 <0.5 0 0 0 0 0 0Dairy Total 77 19 82 24 66 22 53 21 64 24 31%
Grain^ Cereals 31 98 29 87 20 61 74 296 63 233Pulses 1 1 1 1 1 <0.
51 <0.5 1 1
Processed Grain 1 <0.5
1 <0.5 1 <0.5
3 4 <0.5
<0.5
Oilseeds 2 1 2 2 2 1 2 <0.5 <0.5
<0.5
Grain Total 35 101 33 91 23 64 79 301 64 235 31%Meat Beef 11 4 13 3 13 3 10 2 25 6
Sheepmeat 2 <0.5
4 <0.5 4 <0.5
4 <0.5 4 <0.5
Animal fats 2 <0.5
3 2 3 1 2 <0.5 3 1
Offal 3 2 3 2 2 2 1 <0.5 2 2Pig meat 1 <0.
5<0.5 <0.5 1 <0.
5<0.5 <0.5 2 <0.5
Other meat 2 3 3 4 1 1 1 2 1 <0.5Meat Total 22 11 27 12 23 8 19 6 38 11 18%
Horticulture Fruit (fresh or dried) 3 2 10 6 14 7 15 8 19 10Processed <0.5 <0.
5<0.5 <0.5 <0.5 <0.
51 1 1 <0.5
Other horticulture <0.5 <0.5
<0.5 <0.5 <0.5 <0.5
1 <0.5 <0.5
<0.5
Horticulture Total 4 2 10 6 15 7 17 9 20 10 10%Prepared foods**
Other food preparations 2 <0.5
2 <0.5 3 <0.5
3 <0.5 5 <0.5
Condiments <0.5 <0.5
<0.5 <0.5 <0.5 <0.5
1 <0.5 3 <0.5
Cereal based 3 2 4 3 3 3 2 2 3 2Confectionery 1 <0.
51 <0.5 1 <0.
52 <0.5 2 <0.5
Other prepared foods 1 <0.5
1 <0.5 1 <0.5
1 <0.5 1 <0.5
Prepared foods Total 9 3 9 4 8 4 8 3 13 3 6%Animal feed^ Pet food 2 1 2 1 3 2 3 2 3 2
80

Stock feed 2 2 2 <0.5 1 <0.5
2 1 2 1
Animal feed Total 4 3 5 2 4 3 5 4 6 4 3%Forest products^
Paper and paperboard 3 4 2 3 4 4 3 4 2 3Wastepaper <0.5 <0.
5<0.5 <0.5 <0.5 1 0 0 1 2
Other forest products 0 0 0 0 <0.5 <0.5
0 0 0 0
Forest products Total 3 4 2 3 4 5 3 4 3 6 1%TCF^ TCF Total 1 <0.
51 <0.5 1 <0.
51 <0.5 1 <0.5 0%
Wine Wine Total <0.5 <0.5
<0.5 <0.5 <0.5 <0.5
1 <0.5 1 <0.5 0%
Animal fibre Animal fibre Total <0.5 <0.5
<0.5 <0.5 <0.5 <0.5
<0.5 <0.5 <0.5
<0.5 0%
Seafood Seafood Total <0.5 <0.5
<0.5 <0.5 <0.5 <0.5
<0.5 <0.5 <0.5
<0.5 0%
Skin and hides
Skins and hides Total <0.5 <0.5
<0.5 <0.5 <0.5 <0.5
<0.5 <0.5 <0.5
<0.5 0%
Total Victoria 154 145 171 143 145 113 187 348 209 292 100%
^Export figures need to be used with caution. Some grain, forestry, TCF and animal feed exports are affected by confidentiality agreements.**Prepared foods are classified as those which have been substantially transformed from their raw product basis and may have input from more than one food production industry.
81

Definitions and DataDefinitions This report refers to ‘food exports’ as those products considered suitable for consumption by humans. This classification is made by the Department of Economic Development, Jobs, Transport and Resources (DEDJTR) based on the Australian Harmonized Export Commodity Classification (AHECC) code descriptions.
DEDJTR refers to ‘fibre exports’ as those of wool and other animal fibre products, including skins and hides, forestry products and textiles, clothing and footwear (TCF).
The DEDJTR classification excludes items such as: live animals for breeding purposes; grains and horticultural products for cultivation; live ornamental plants; and bovine semen.
The DEDJTR classification includes items such as: live animals for purposes other than breeding; fresh, chilled, frozen and preserved meats and seafood; dairy and horticultural items for human consumption; unprocessed grains and pulses; edible animal by-products; wine and related products; wool and other fibres in various forms; skins and hides from agricultural livestock; and prepared foods derived from agricultural commodities.
State of Origin defines the Australian state in which the final stage of production or manufacture occurs (ABS 5489.0 - International Merchandise Trade, Australia, Concepts, Sources and Methods).
State of Loading is the Australian state in which the goods are loaded onto an international carrier for export. Subject to any confidentiality restrictions, this can be further disaggregated to provide information about particular air or sea ports in the relevant state (i.e. Port of Loading).
Classification of forest products is based on those used by ABARES in the Australian Forest and Wood Products Statistics publication.
Classification of wool products is based on the AWEX Sheep Breed Compendium, 2010.
The regional classification of North Asia comprises China, Hong Kong, Japan, Macau, Mongolia, South Korea and Taiwan.
The regional classification of South East Asia comprises Brunei Darussalam, Cambodia, East Timor, Indonesia, Laos, Malaysia, Myanmar, Philippines, Singapore, Thailand and Vietnam.
The regional classification of MENA comprises Algeria, Bahrain, Egypt, Iraq, Iran, Israel, Jordan, Kuwait, Lebanon, Libya, Morocco, Oman, Qatar, Saudi Arabia, South Sudan, Sudan, Syria, Tunisia, Turkey, UAE and Yemen.
The regional classification of North America comprises the USA, Canada and Mexico.
The regional classification of South Asia comprises Afghanistan, Bangladesh, Bhutan, India, Maldives, Nepal, Pakistan and Sri Lanka.
Data The information in this document is based on statistics compiled by the Australian Bureau of Statistics (ABS) from information submitted by exporters and their agents to the Department of Home Affairs (Home Affairs). The data has been sourced from IHS Markit, Global Trade Information Services (GTIS), which compiled the information for DEDJTR.
Valuation of exports is based on the free on-board transaction value of the goods, expressed in Australian dollars. Values within this publication have been aggregated on a financial year basis. State aggregations are by State of Origin rather than by State of Loading.
Gross weight refers to the shipping weight of goods (measured in tonnes) in the packaged state, excluding the weight of containers. For exports, details of gross weight are available for each commodity.
Restrictions are placed on the release of statistics for some products for reasons of confidentiality. These restrictions may impact on the total aggregated value of exports from Victoria. Alternatively, they may only affect country and commodity details for that export category. Of relevance to Victoria’s food and fibre exports are confidentiality restrictions on specific grain, forestry, Textile, clothing and footwear (TCF) and animal feed product exports including some barley, oats, lupins, canola, beer, pasta and woodchips, products for which no state of origin or export destination details are available.
82

DEDJTR uses the AHECC codes for export and import analysis (www.abs.gov.au, Classification 1233.0). These codes concur with international commodity codes, allowing direct import and competitor analysis. Commodity classification also provides greater detail and allows analysis of products from different sectors of the supply chain. These codes enable DEDJTR to focus on specific fresh and processed export products within industry sectors.
Customer Service Centre 136 186economicdevelopment.vic.gov.au
83