stuart2124.files.wordpress.com€¦ · web viewstuart hentschke - step 7. invent. ories
TRANSCRIPT

Stuart Hentschke - Step 7
Inventories
I understand inventories to be goods which businesses purchase, with either the aim to resell at a
higher price or modify in a way which adds value, to then sell a finished good at a higher price. Only
businesses that resell (either retail or wholesale) or manufacture goods will have inventories,
whereas businesses that provide services will not. If there isn’t a physical product being sold, then
there will not be any inventory. Inventory is also known as stock or stock on hand and can be called a
variety of different names. I located the GKN 2017 annual report and used the search function to
quickly find inventories as a current asset on the balance sheet. The 2017 total is £1,431m which
represents 38.67% of the company’s current assets.
GKN PLC (2017, p. 143)
GKN displays their inventories in their 2017 Annual Report in Note 15 and outline the composition of
different types of inventories on hand. Raw materials 38%, Work in progress 37% and Finished goods
26%.
Raw materials
Raw materials listed in inventories are those materials that
have not yet been consumed to create products that are
considered a work in progress or a finished good. A good
example of a raw material for GKN would be in their
Powder Metallurgy division where they use High
Performance ANCORBOND Alloys to create bearings.
These fine powders would make up some of the £538m of raw materials in GKN inventories.
(Screenshot, GKN Website, https://www.gknpm.com/en/our-businesses/gkn-hoeganaes/materials-
for-powder-metallurgy/ancorsteel-metal-powders/)

Work in progress
Inventory considered to be a work in progress would be
those that have been started but not yet finished or ready
for sale. An example of GKN’s work in progress inventory
would be this shell of an aeroplane.
(Screenshot, GKN Website,
https://www.gknaerospace.com/en/our-solutions/aftermarket-services-mro/aerostructure-
services/)
Finished goods
Finished goods are those that are ready for sale but not
yet sold to customers. In GKN’s automotive business
division this could be the steering components that are
waiting on the shelf to sell. GKN may have used various
parts including raw materials and parts from other
businesses to complete the finished goods.
(Screenshot, GKN Website,
https://www.gknautomotive.com/en/AftermarketMotorsport/aftermarket/our-products/steering-
components/)
I can relate the concept of raw materials back to when I was a wheat farmer. At the start of the
season we would have truckloads of fertiliser in the shed and silos full of grain, waiting for opening
rain to begin seeding. The grain and fertiliser would be considered raw materials as they hadn’t been
used to create a finished good (being the tonnes of wheat at harvest time). I can relate work in
progress to my time working as a cellar hand when the wine was being aged in barrels. While the
wine isn’t ready for sale a lot of work has gone into getting the wine to its current status. It will have
a higher value than the raw material alone to make the wine but not as high as a finished good. This
wine would then become a finished good once it had been bottled and was listed as available for
sale.
Fair value
Note 15 states that “Inventories of £149 million (2016: £58 million) are carried at fair value less costs
of disposal” (GKN PLC, 2017). I don’t understand where the £149 million figure fits in and I couldn’t

find that it related to anything specific in the annual report. After reading the study guide, I realise
that Inventories in Australia are valued at the cost they were purchased for unless the market value
decreases, then the lower market value figure is used for valuation purposes. This valuation method
is set out in AASB 102. Maybe only £149 of GKN’s £1,431m Inventories are carried at fair value less
costs of disposal and the remaining amount are valued at cost?
Net realisable value
“Net realisable value is the estimated selling price in the ordinary course of business less the
estimated costs of completion and the estimated costs necessary to make the sale” (Australian
Accounting Standards Board, 2019, p. 6). I believe that this means those products considered to be
work in progress would have the expenses to complete the items deducted and the costs of selling
deducted in order to reflect the items worth as inventory on the balance sheet. How would this
apply to raw materials? Would these just be valued at lower of cost or market value (as in today’s
price of the same raw material)? Can net realisable value be applied to raw materials when the
goods haven’t been produced, I would have thought not.
Fair value
“Fair value is the price that would be received to sell an asset or paid to transfer a liability in an
orderly transaction between market participants at the measurement date” (Australian Accounting
Standards Board, 2019, p. 6). It appears the definition for fair value could be considered the price a
competitor is willing to pay. GKN has approximately 10% of its inventory valued this way minus the
costs of disposal. I will be interested to see if other students have come across the same thing.
Writing down inventory
Note 15 also states that “The amount of any write-down of inventory recognised as an expense in
the year was £79 million (2016: £2 million)” (GKN PLC, 2017). I understand a write-down of inventory
to be the process of reducing the amount of inventory. This may occur due to theft (by staff or
customers), wastage or products being spoiled. An example of this that I can related to is the small
amount of fertiliser that becomes hard in the shed if it gets wet. This amount of fertiliser was once a
current asset, but it is no longer going to provide future economic benefit and therefore it must be
removed to a wastage expense.
Periodic or perpetual system

To locate the cost of goods sold on the consolidated income statement I noticed trading profit listed
at the top and further details on operating profit could be found in Note 4 (shown below).
(GKN PLC, 2017, p. 127)
I could see that there was a category of “Inventories recognised as an expense” which represents
GKN’s cost of goods sold, a total of (4,365) in 2017. This is the amount of money from Inventories
that is moved from the current assets on the balance sheet to the income statement when goods are
sold as they are recognised as an expense in that period.
GKN does not disclose if they use the periodic or perpetual system to record inventories. I will
assume that because there is only one line of “Inventories recognised as an expense” that GKN are
using the perpetual inventory system. This is because when the periodic system is used the cost of
goods sold must be calculated through the formula of “Cost of Goods Sold (COGS) = Opening balance
+ Purchases – Ending Balance” and these extra details would appear on the Income Statement
(which they do not). I would also assume that because GKN is a large company, they would use the
more popular method of accounting for their inventories which allows for COGS to be recorded as
the sales occur in real time. I understand both the periodic and perpetual system of recording
inventories require a stocktake usually a minimum of once a year. The perpetual system will show an
ending inventory amount (prior to stocktake – which is later adjusted if necessary) whereas the
periodic method uses the stocktake to determine the closing inventory balance and the COGS.

Has GKN changed inventory practices over the years?
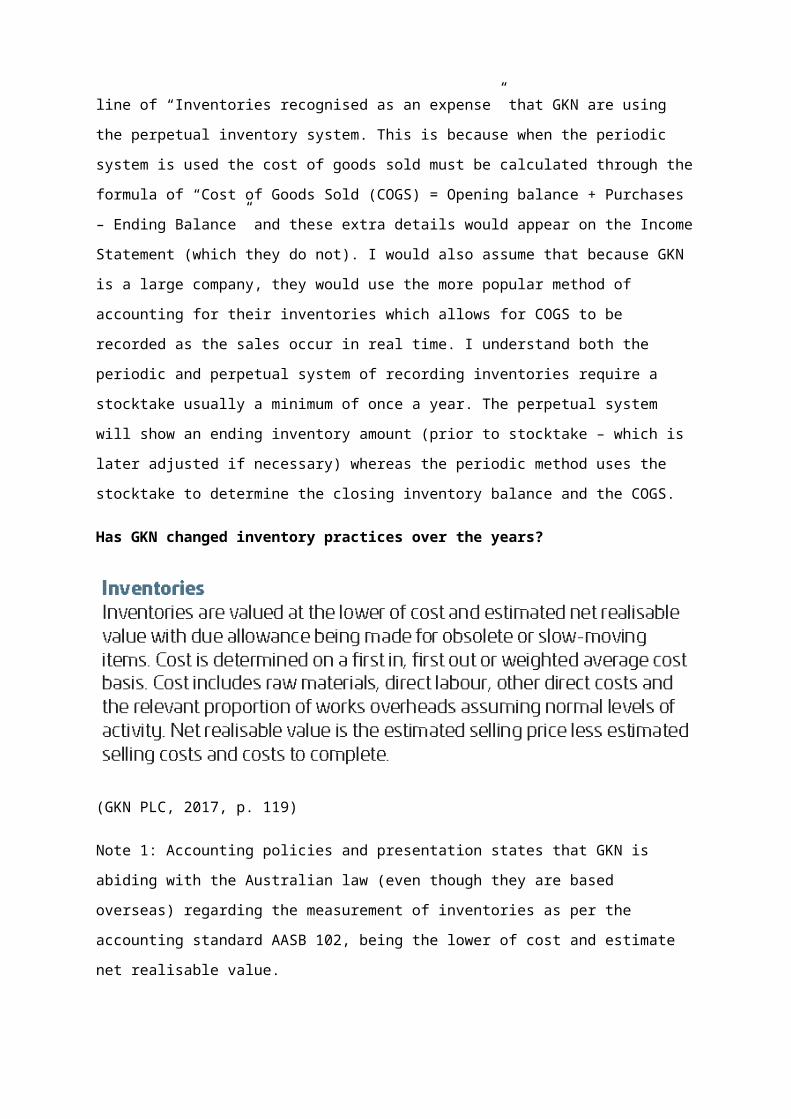
(GKN PLC, 2017, p. 119)
Note 1: Accounting policies and presentation states that GKN is abiding with the Australian law (even
though they are based overseas) regarding the measurement of inventories as per the accounting
standard AASB 102, being the lower of cost and estimate net realisable value.
This exact statement is also found in the annual reports of 2016 and 2015 suggesting no major
changes in the way in which GKN has accounted for their Inventories.
Method of inventory used
I found it interesting that cost is determine on a first in, first out (FIFO) or a weighted average cost
basis. Why might this be? I would guess that it depends on the type of inventory, the frequency of
changes and the costs involved in the determining of costs.
I understand the FIFO method of valuing inventories to be that the first items into your inventories
are the first that are sold. This means that you would always have the freshest stock in your
inventories (the most recently purchased).
I understand the weighted average method to be a method where the inventory is all mixed
together and when sold the costs are averaged out. Some further research showed that weight
average costing methods are simpler, better when companies purchase inventory on a regular basis
and are commonly used when items are identical and blended together (Unleashed, 2019). It is the
preferred method for manufacturing companies, as products often cannot be individually identified
and are stored together, whereas if batches can be identified tracking costs using the FIFO method
would improve accuracy (Unleashed, 2019). This now makes sense that GKN would use the FIFO
method for their items that can be identified and the weighted average method for their raw
materials that cannot be identified as they are stored together. This would combine the benefits of
both systems and reduce the complexity surrounding inventory management.
Which financial statement do inventories relate to?
I found that inventories relate to the following financial statements.
Consolidated Balance Sheet: Current asset – Inventories
Consolidated Income Statement: Trading Profit – Operating Costs - which separates out the “Change
in stocks of finished goods and work in progress” the “Raw materials and consumables” to give the
total of “Inventories recognised as an expense”.
Consolidated Cash Flow Statement: Cash generated from operations – Change in inventories.
GKN’s inventory figures
GKN’s inventory over the last five years can be summarised in the Group Financial Record below
(GKN PLC, 2017, p. 173)
I found it strange that inventories were the same number in 2016 as in 2017, is this just a
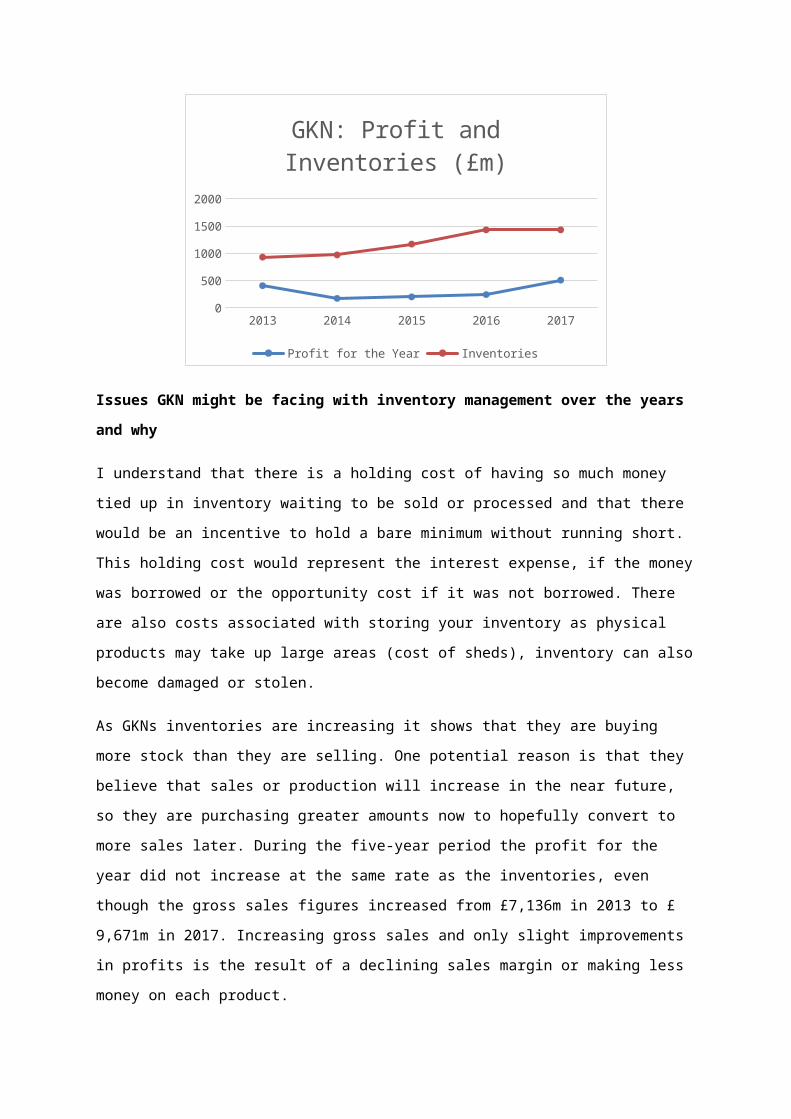
coincidence? Over time the company’s inventories have been increasing from £931m in 2013 to
£1431m in 2017.

2013 2014 2015 2016 20170
200
400
600
800
1000
1200
1400
1600
GKN: Profit and Inventories (£m)
Profit for the Year Inventories
Issues GKN might be facing with inventory management over the years and why
I understand that there is a holding cost of having so much money tied up in inventory waiting to be
sold or processed and that there would be an incentive to hold a bare minimum without running
short. This holding cost would represent the interest expense, if the money was borrowed or the
opportunity cost if it was not borrowed. There are also costs associated with storing your inventory
as physical products may take up large areas (cost of sheds), inventory can also become damaged or
stolen.
As GKNs inventories are increasing it shows that they are buying more stock than they are selling.
One potential reason is that they believe that sales or production will increase in the near future, so
they are purchasing greater amounts now to hopefully convert to more sales later. During the five-
year period the profit for the year did not increase at the same rate as the inventories, even though
the gross sales figures increased from £7,136m in 2013 to £ 9,671m in 2017. Increasing gross sales
and only slight improvements in profits is the result of a declining sales margin or making less money
on each product.
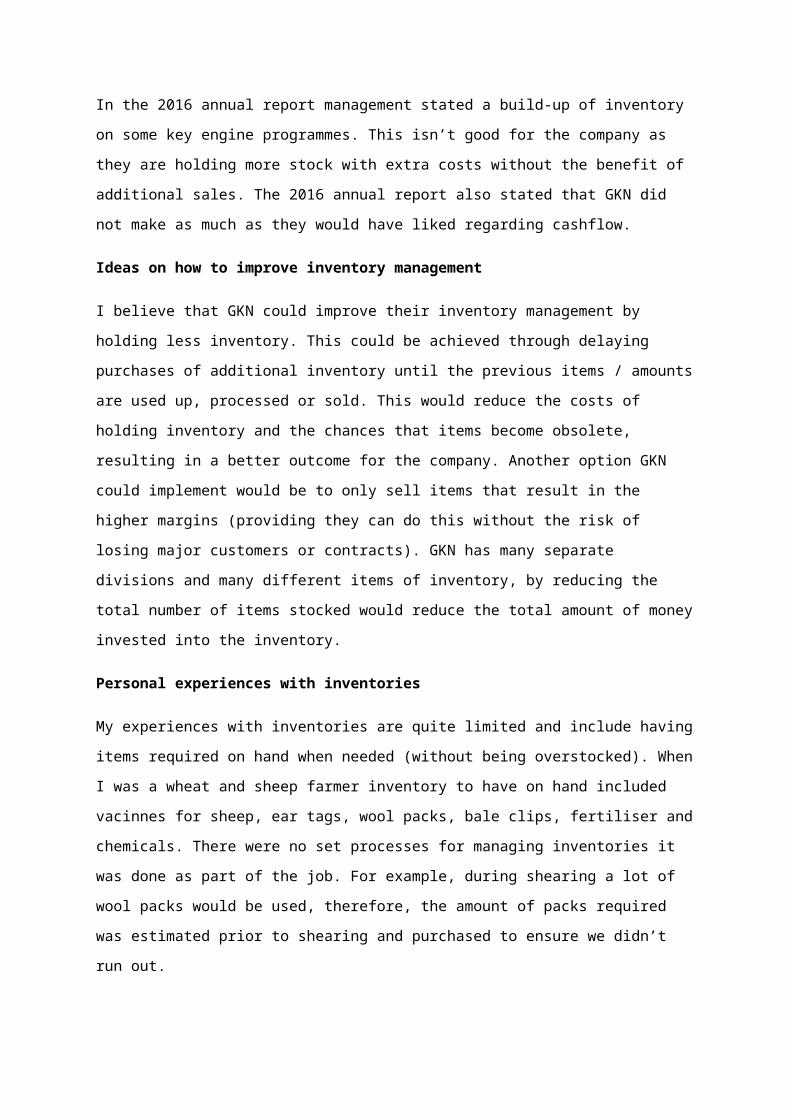
In the 2016 annual report management stated a build-up of inventory on some key engine
programmes. This isn’t good for the company as they are holding more stock with extra costs
without the benefit of additional sales. The 2016 annual report also stated that GKN did not make as
much as they would have liked regarding cashflow.
Ideas on how to improve inventory management
I believe that GKN could improve their inventory management by holding less inventory. This could
be achieved through delaying purchases of additional inventory until the previous items / amounts

are used up, processed or sold. This would reduce the costs of holding inventory and the chances
that items become obsolete, resulting in a better outcome for the company. Another option GKN
could implement would be to only sell items that result in the higher margins (providing they can do
this without the risk of losing major customers or contracts). GKN has many separate divisions and
many different items of inventory, by reducing the total number of items stocked would reduce the
total amount of money invested into the inventory.
Personal experiences with inventories
My experiences with inventories are quite limited and include having items required on hand when
needed (without being overstocked). When I was a wheat and sheep farmer inventory to have on
hand included vacinnes for sheep, ear tags, wool packs, bale clips, fertiliser and chemicals. There
were no set processes for managing inventories it was done as part of the job. For example, during
shearing a lot of wool packs would be used, therefore, the amount of packs required was estimated
prior to shearing and purchased to ensure we didn’t run out.
Step 8
https://help.myob.com.au/teachme/
Starting out with AccountRight Screenshots (Setup) – I created a mock file
Accounts list
Managing contacts
Opening balances
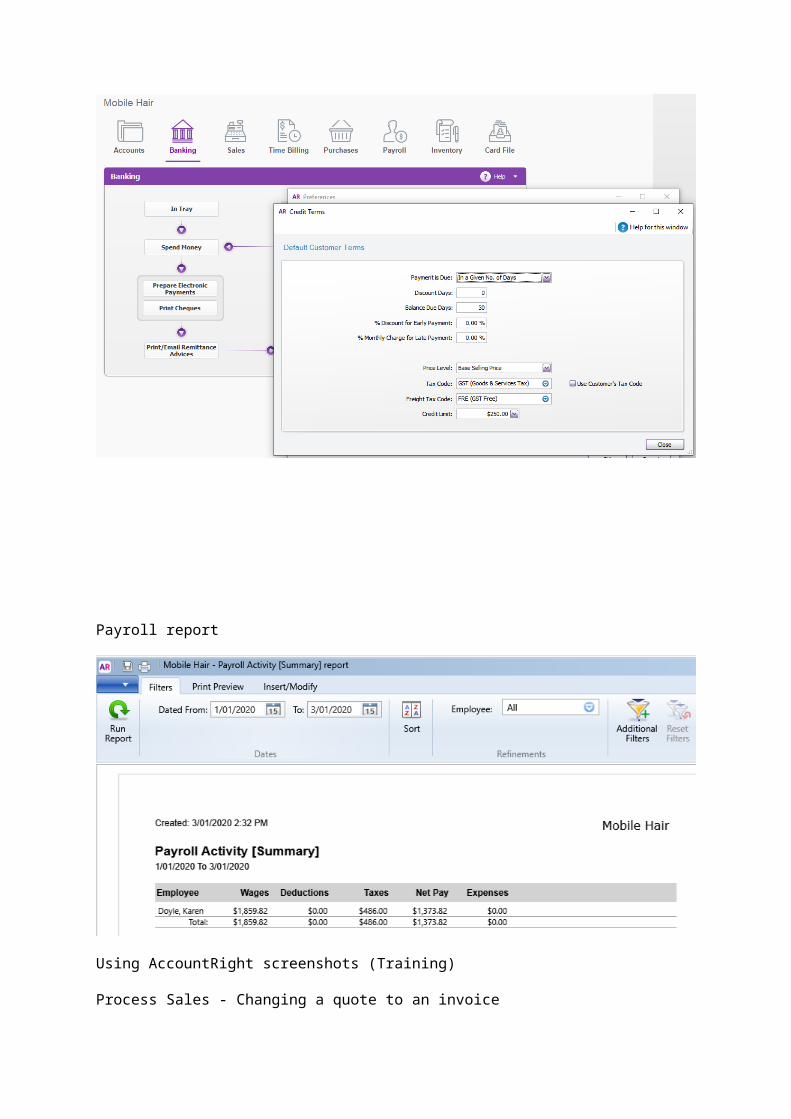
Preferences

Payroll report
Using AccountRight screenshots (Training)
Process Sales - Changing a quote to an invoice

Recording partial payment
Clearwater File – Preparing electronic payments

Clearwater File – Added equity account and recorded capital injection
Looking into business insights

Step 9
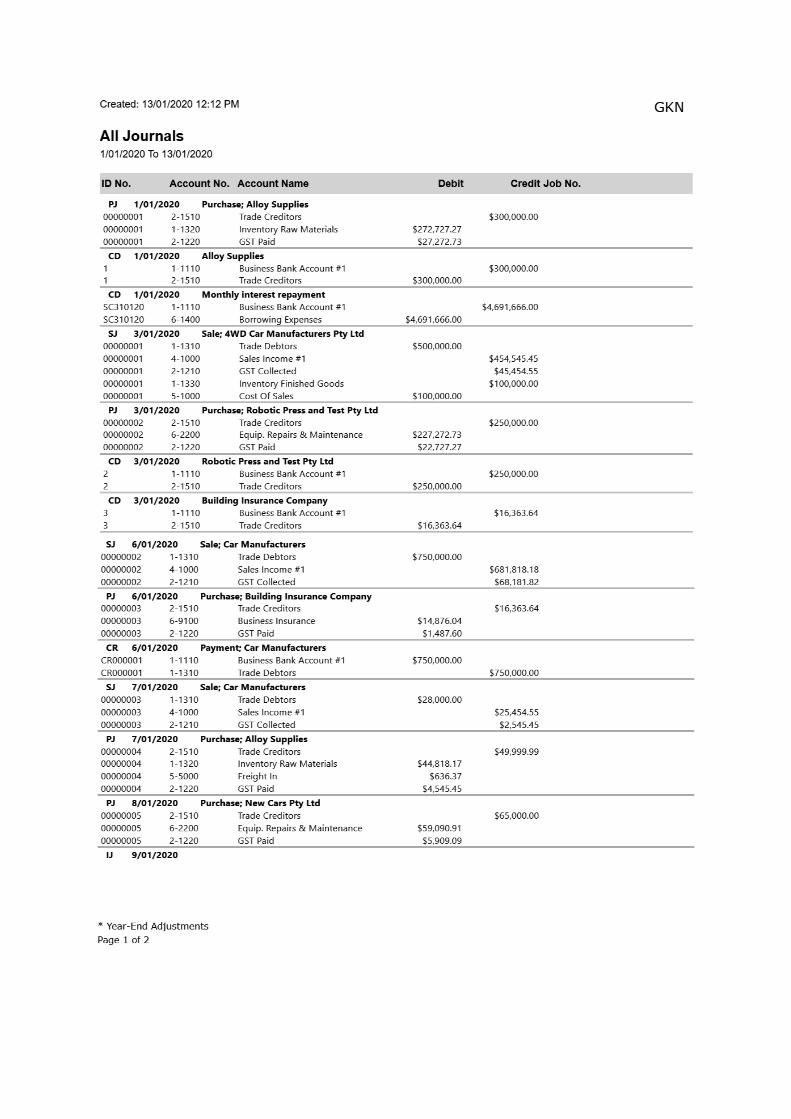
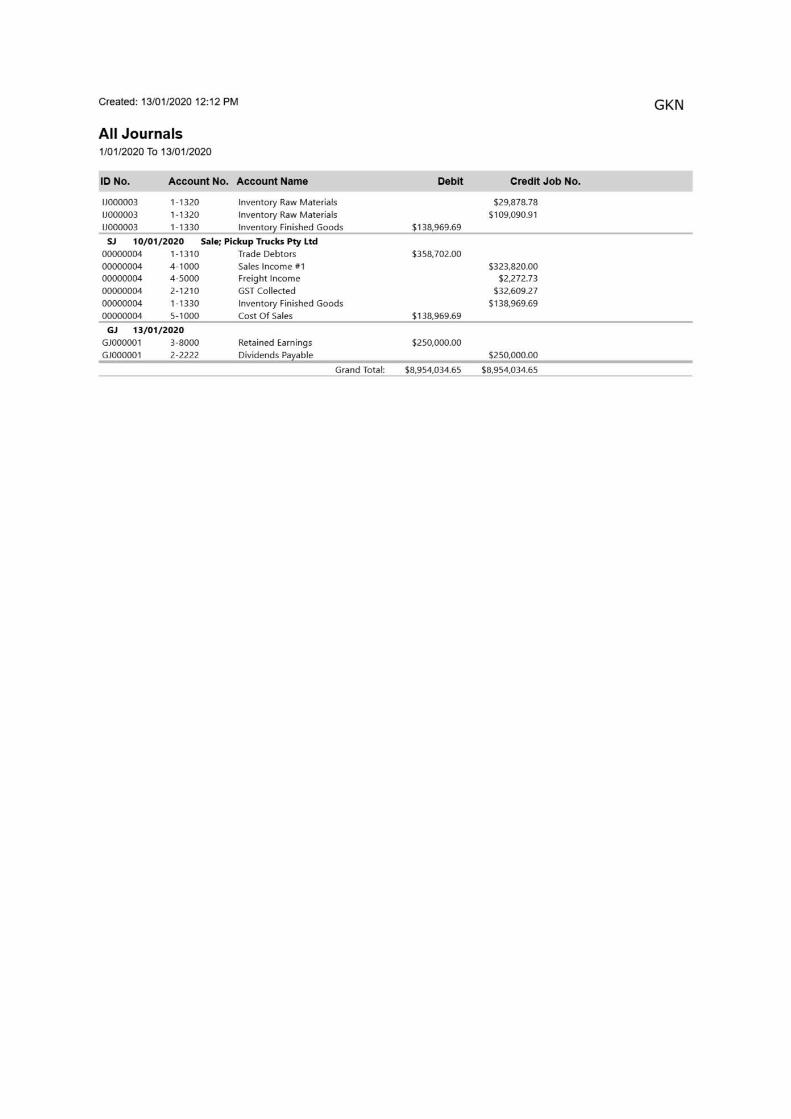
GKN has a global presence and is considered an engineering and manufacturing company. The business divisions are split between aerospace, automotive, powder metallurgy and wheels. GKN records their financial information in £m but using MYOB I will record transactions in $AUD. GKN operate in more than 30 countries across the world and would be subjected to various value added taxes and regulations. I will record these transactions as if they occurred in Australia using our goods and services tax (GST).
Journal Date Details Debit Credit
Purchases - Bill 1/1/2020 Inventory Raw Materials
GST Paid
Trade Creditors (Accounts Payable)
(Purchased high performance metal from Alloy
Supplies 30 tonnes @ $10,000 per tonne inc GST.)
272,727.27
27,272.73
300,000.00
Cash
Disbursements
1/1/2020 Trade Creditors (Accounts Payable)
Business Bank Account #1
(Paid Alloy Supplies Bill.)
300,000.00
300,000.00
Reconcile
Accounts
1/1/2020 Borrowing Expenses
Business Bank Account #1
(Monthly interest repayment on non-current
borrowings of $1,126,000,000.00 @ 5% p.a.)
4,691,666.00
4,691,666.00
Sales - Invoice 3/1/2020 Trade Debtors (Accounts Receivable)
Cost of Sales
Sales Income #1
GST Collected
Inventory Finished Goods
(Sale of 2,500 steering components to 4WD Car
Manufacturers Pty Ltd on a 30-day account.)
500,000.00
100,000.00
454,545.45
45,454.55
100,000.00
Purchases –
Bill
3/1/2020 Equip. Repairs & Maintenance
GST Paid
Trade Creditors (Accounts Payable)
227,272.73
22,727.27
250,000.00

(Serviced robotic press to test chassis systems and
off-highway wheels from Robotic Press and Test Pty
Ltd.)
Cash
Disbursements
3/1/2020 Trade Creditors (Accounts Payable)
Business Bank Account #1
(Paid Robotic Press and Test Pty Ltd for the service
on the robotic press.)
250,000.00
250,000.00
Sales - Invoice 6/1/2020 Trade Debtors (Accounts Receivable)
Sales Income #1
GST Collected
(Tested 10,000 chassis at $75 per test for Car
Manufacturers. Customer does not have an
account.)
750,000.00
681818.18
68181.82
Sales -
Received
Payment
6/1/2020 Business Bank Account # 1
Trade Debtors (Accounts Receivable)
(Received Payment from Car Manufacturers.)
750,000.00
750,000.00
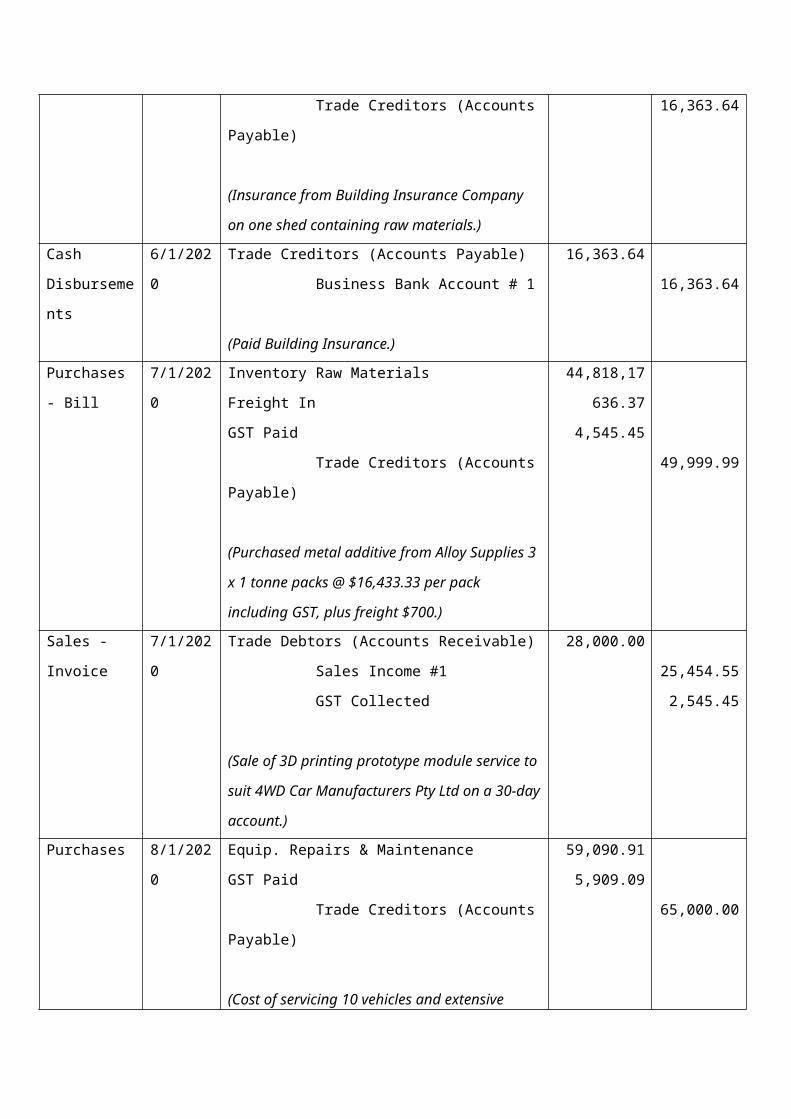
Purchases - Bill 6/1/2020 Business Insurance
GST Paid
Trade Creditors (Accounts Payable)
(Insurance from Building Insurance Company on one
shed containing raw materials.)
14876.04
1487.60
16,363.64
Cash
Disbursements
6/1/2020 Trade Creditors (Accounts Payable)
Business Bank Account # 1
(Paid Building Insurance.)
16,363.64
16,363.64
Purchases - Bill 7/1/2020 Inventory Raw Materials
Freight In
GST Paid
Trade Creditors (Accounts Payable)
44,818,17
636.37
4,545.45
49,999.99

(Purchased metal additive from Alloy Supplies 3 x 1
tonne packs @ $16,433.33 per pack including GST,
plus freight $700.)
Sales - Invoice 7/1/2020 Trade Debtors (Accounts Receivable)
Sales Income #1
GST Collected
(Sale of 3D printing prototype module service to suit
4WD Car Manufacturers Pty Ltd on a 30-day
account.)
28,000.00
25,454.55
2,545.45
Purchases 8/1/2020 Equip. Repairs & Maintenance
GST Paid
Trade Creditors (Accounts Payable)
(Cost of servicing 10 vehicles and extensive repairs to
2 vehicles from New Cars Pty Ltd.)
59,090.91
5,909.09
65,000.00
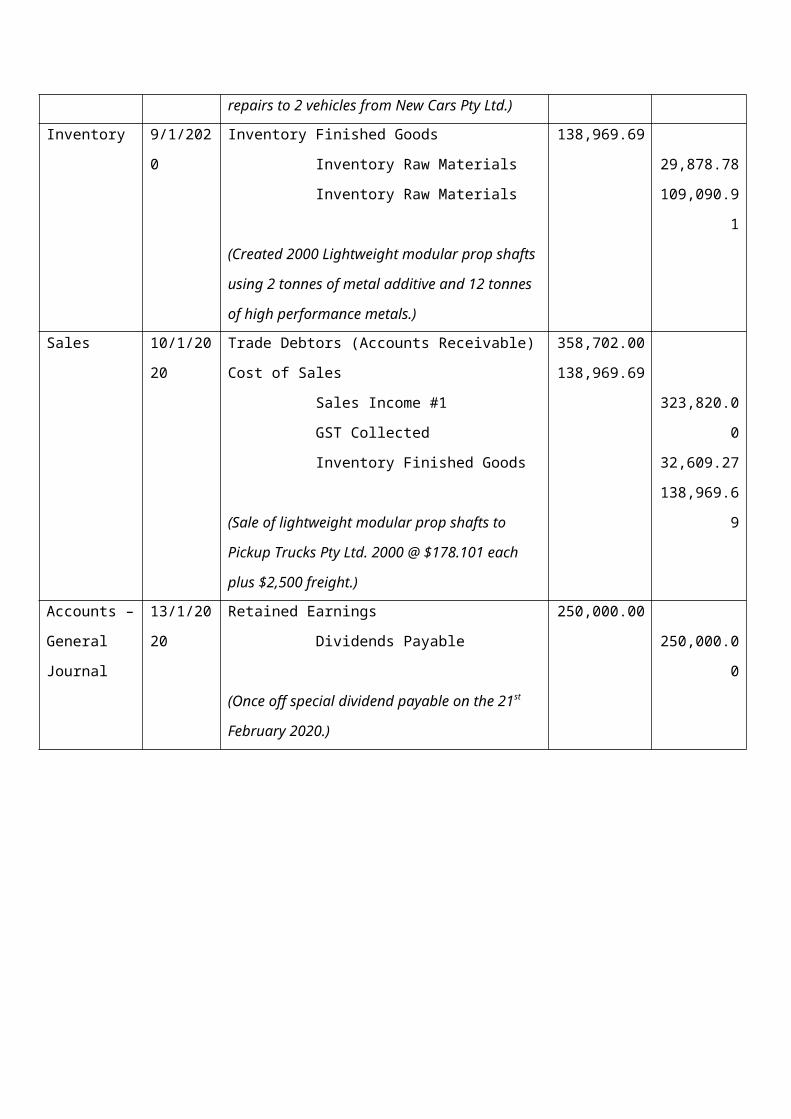
Inventory 9/1/2020 Inventory Finished Goods
Inventory Raw Materials
Inventory Raw Materials
(Created 2000 Lightweight modular prop shafts
using 2 tonnes of metal additive and 12 tonnes of
high performance metals.)
138,969.69
29,878.78
109,090.91
Sales 10/1/2020 Trade Debtors (Accounts Receivable)
Cost of Sales
Sales Income #1
GST Collected
Inventory Finished Goods
(Sale of lightweight modular prop shafts to Pickup
Trucks Pty Ltd. 2000 @ $178.101 each plus $2,500
freight.)
358,702.00
138,969.69
323,820.00
32,609.27
138,969.69
Accounts – 13/1/2020 Retained Earnings 250,000.00

General
Journal
Dividends Payable
(Once off special dividend payable on the 21st
February 2020.)
250,000.00


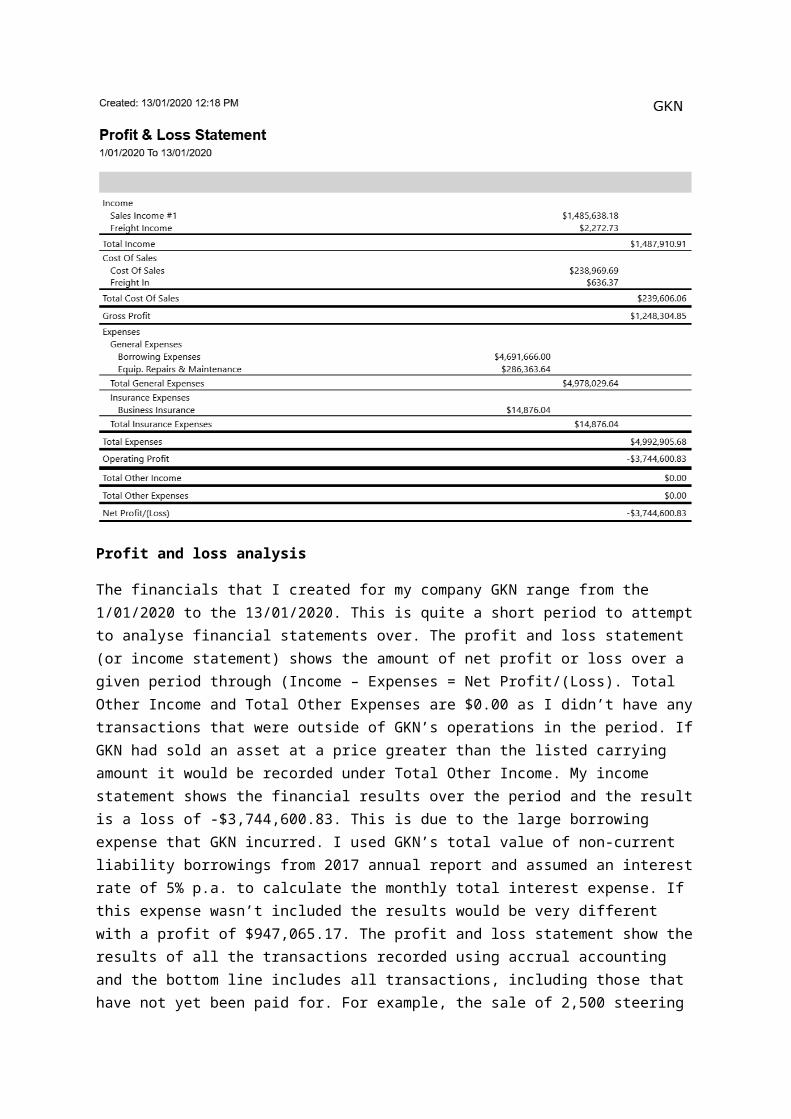
Profit and loss analysis
The financials that I created for my company GKN range from the 1/01/2020 to the 13/01/2020. This is quite a short period to attempt to analyse financial statements over. The profit and loss statement (or income statement) shows the amount of net profit or loss over a given period through (Income – Expenses = Net Profit/(Loss). Total Other Income and Total Other Expenses are $0.00 as I didn’t have any transactions that were outside of GKN’s operations in the period. If GKN had sold an asset at a price greater than the listed carrying amount it would be recorded under Total Other Income. My income statement shows the financial results over the period and the result is a loss of -$3,744,600.83. This is due to the large borrowing expense that GKN incurred. I used GKN’s total value of non-current liability borrowings from 2017 annual report and assumed an interest rate of 5% p.a. to calculate the monthly total interest expense. If this expense wasn’t included the results would be very different with a profit of $947,065.17. The profit and loss statement show the results of all the transactions recorded using accrual accounting and the bottom line includes all transactions, including those that have not yet been paid for. For example, the sale of 2,500 steering components to 4WD Car Manufacturers Pty Ltd on a 30-day account has been recorded in the Sales Income #1 account even though GKN has not received any payment.
Ratios can be used to assess a company’s financial statements and businesses in similar industries can compare results. The gross profit margin returns a ratio that shows the amount as a % that can be used to pay overhead expenses for the business with any excess amount being retained as profit.
Gross profit margin = (Gross profit / Sales) * 100
= ($1,248,304.85 / $1,485,638.18) * 100
= 84.0 %
The result shows that GKN is making 84 cents of gross profit for every $1.00 of sales. This is an outstanding result!
Net profit margin = (Net profit after tax / Sales) * 100
= (-$3,744,600.83 / $1,485,638.18) * 100
= -252.05 %
The net profit margin shows a more realistic overview of GKN financials as it includes the impact of the large borrowing expenses. This is a terrible result and it shows that for every dollar generated during the period in sales, GKN lost $2.52.
The screenshot of business insights from MYOB shown below highlights
- the size of GKN’s expenses relative to their income, - income, expenses and profit graphs and, - which accounts have the largest expenses, (clearly borrowing expenses).
Balance sheet analysis
The balance sheet displays the company’s information on a given date. It is used to display the company’s total assets, liability and equity at a point in time and always balances using, Assets = Equity + Liability. The balance sheet would normally display total equity as a positive figure but in GKN’s case it shows negative equity of -$3,894,600.83. The debt to equity ratio can be used to compare the amount of debt relative to the amount of equity. A company that has a high debt/equity ratio can be higher risk than a company that has a lower debt/equity ratio, as the company is using more debt and less funds supplied by the shareholders. This is because debt borrowed requires interest repayments at given intervals whereas the option to pay shareholders dividends is optional.
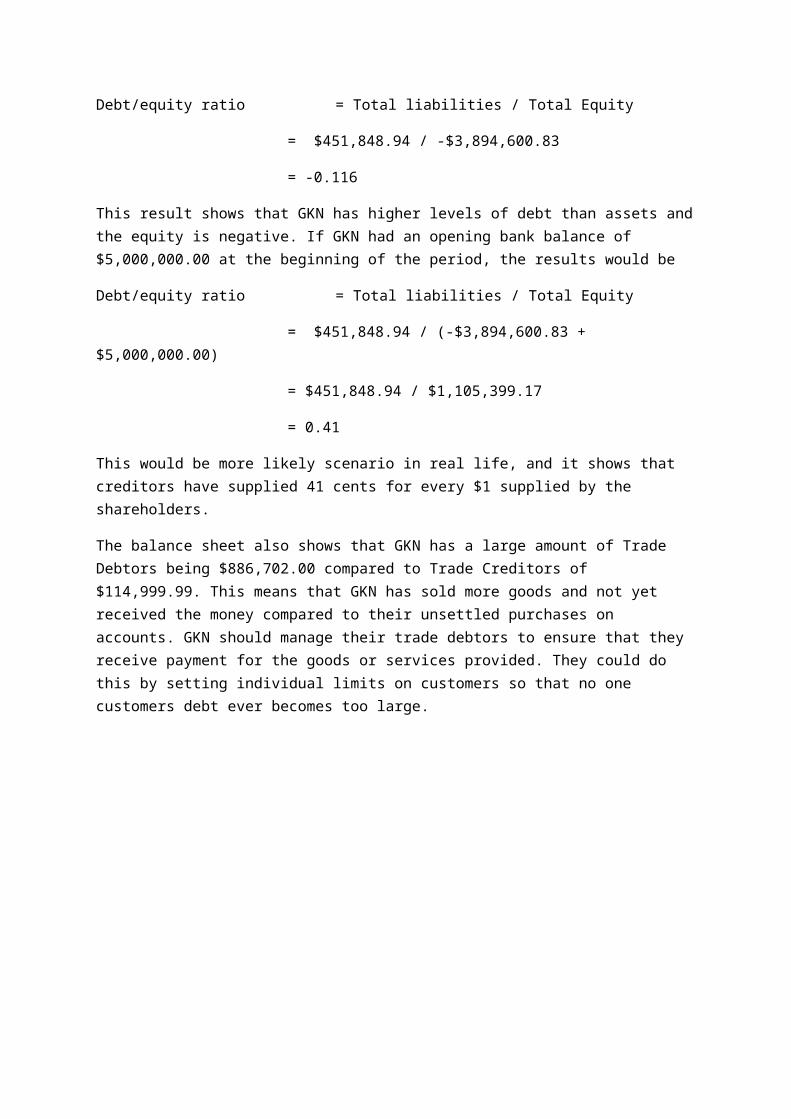
Debt/equity ratio = Total liabilities / Total Equity
= $451,848.94 / -$3,894,600.83
= -0.116
This result shows that GKN has higher levels of debt than assets and the equity is negative. If GKN had an opening bank balance of $5,000,000.00 at the beginning of the period, the results would be
Debt/equity ratio = Total liabilities / Total Equity
= $451,848.94 / (-$3,894,600.83 +$5,000,000.00)
= $451,848.94 / $1,105,399.17
= 0.41
This would be more likely scenario in real life, and it shows that creditors have supplied 41 cents for every $1 supplied by the shareholders.
The balance sheet also shows that GKN has a large amount of Trade Debtors being $886,702.00 compared to Trade Creditors of $114,999.99. This means that GKN has sold more goods and not yet received the money compared to their unsettled purchases on accounts. GKN should manage their trade debtors to ensure that they receive payment for the goods or services provided. They could do this by setting individual limits on customers so that no one customers debt ever becomes too large.
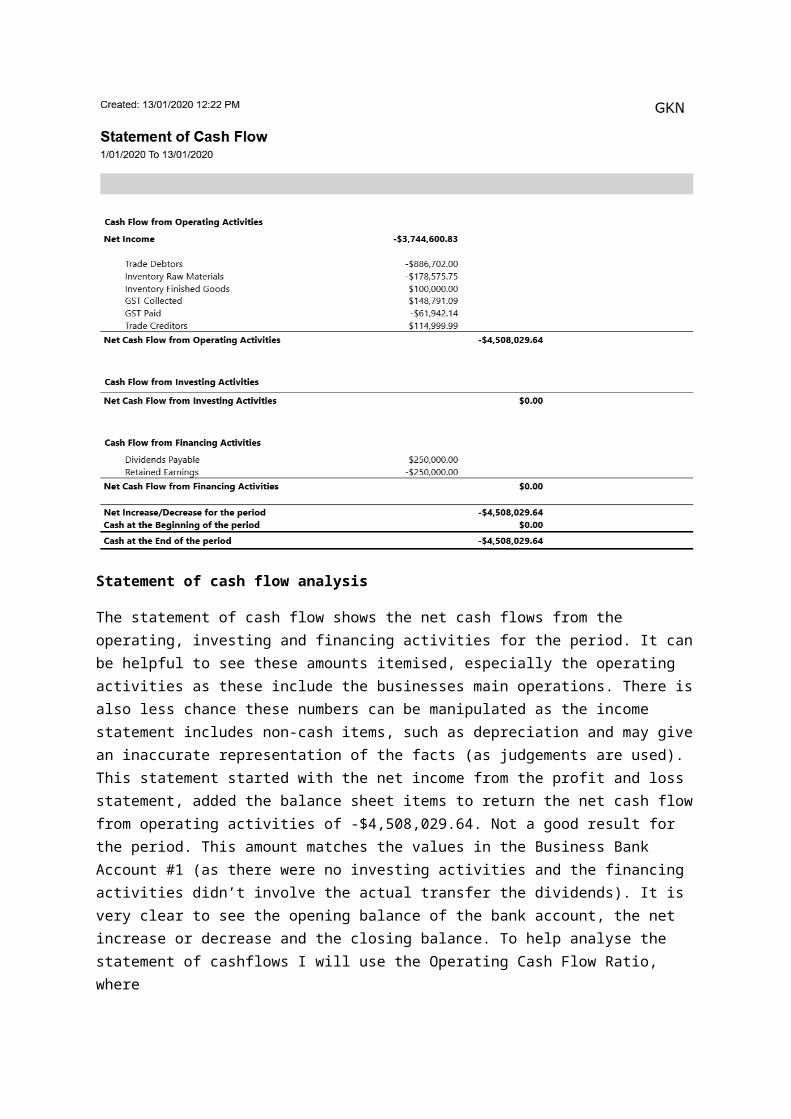
Statement of cash flow analysis
The statement of cash flow shows the net cash flows from the operating, investing and financing activities for the period. It can be helpful to see these amounts itemised, especially the operating
activities as these include the businesses main operations. There is also less chance these numbers can be manipulated as the income statement includes non-cash items, such as depreciation and may give an inaccurate representation of the facts (as judgements are used). This statement started with the net income from the profit and loss statement, added the balance sheet items to return the net cash flow from operating activities of -$4,508,029.64. Not a good result for the period. This amount matches the values in the Business Bank Account #1 (as there were no investing activities and the financing activities didn’t involve the actual transfer the dividends). It is very clear to see the opening balance of the bank account, the net increase or decrease and the closing balance. To help analyse the statement of cashflows I will use the Operating Cash Flow Ratio, where
Operating Cash Flow Ratio = Cash Flow from Operations / Current Liabilities (CFI Education, 2020)
= -$4,508,029.64 / $114,999.99
= -$39.20
This ratio shows how much money GKN earn from operations per dollar compared to their current liabilities on the balance sheet. It is a short term liquidity ratio which is more likely to be accurate since the inputs don’t involve earnings (CFI Education, 2020). GKN earns -$39.20 from operating activities per dollar of current liabilities. This number would usually be positive and the result means that GKN aren’t earning money from operations and over the period and if things don’t change GKN will soon be out of business. They are also not generating any money from investing or financing to help offset the deficit. This is another terrible result.
Over the period GKN have returned a terrible looking set of financial statements. The problem relates to the large borrowing expense. If I was to do this exercise again, I would have ensured my company was slightly profitable in order to make the ratio analysis more realistic.
What happens when you receive payment
I was interested in seeing how the effect of receiving a payment from a customer would impact upon my financials. I when into MYOB and received payment from a sale made to 4WD Car Manufacturers Pty Ltd on the 3/1/2020 for an amount of $500,000.
Profit and Loss statement:
- Remained completely unchanged, as this amount has already been included in net profit and loss.
Balance Sheet:
- Business Bank Account #1 increased by the amount received.- Trade Debtors decreased by the amount received.
Statement of Cash Flow
- Trade Debtors decreased by the amount received. - Cash at the end of the period increased by the amount received.

- Cash at the end of the period matched Business Bank Account #1 in Balance Sheet.
This was a great example of how the profit and loss didn’t change after receiving payment for the sale. This is because only the trade debtors and business bank account amounts were affected, and they are both asset accounts (not revenue or expense accounts).
Discuss how to generate the report with others
Discuss how to generate the reports of the set of financial statements

Step 10
Property, plant and equipment
Property, plant and equipment is a non-current asset. This means that it will bring in a future benefit to a company over a period of more than twelve months. Most firms have property, plant and equipment and it can range from land to an industrial plant (where goods are manufactured) to equipment used by the business to make revenue. They are physical goods and can be seen and touched. As eventually all asset except for land eventually wear out they can be depreciated. The depreciation process involves converting an asset to an expense. This involves a journal entry where money is moved from the non-current assets on the balance sheet and transferred to an expense on the income statement. I understand that initially all property, plant and equipment is recorded at cost and the company can then choose between the cost model or the revaluation model to depreciate their assets. If the revaluation model is used the company must revalue the entire asset class when they decide to revalue to avoid only choosing favourable assets to revalue. The revaluation model can also only be used where fair value can be measured. The concept doesn’t raise any further questions and I feel that it is relatively easy to understand. I can relate property , plant and equipment back to when I was wheat farming. Property, plant and equipment would include the land used for farming, tractors, and seeding equipment. Opening the 2017 annual report for GKN a search from depreciation quickly took me to the notes to the consolidated financial statements and GKN states that “Property, plant and equipment is stated at cost less accumulated depreciation and impairment charges”(GKN PLC, 2017, p. 117). I believe that this indicates that GKN are using the cost model. The cost includes the purchase price and costs associated with bringing the assets into use (which was stated in AASB116 para 16) but it also included the borrowing costs on qualifying assets which I found interesting. I’m guessing that the borrowing costs here relate to the cost associated with setting up the loans only and don’t include the ongoing cost of interest but I’m not sure. GKN states that they do not deprecated freehold land or capital work in progress. This was as expected as land isn’t depreciated due to it being one of the few things that don’t wear out. In all other cases depreciation is provided on a straight-line basis over the period that the assets were available to use. Each class is depreciated to reduce them to their residual values, all are reviewed annually, and the range of depreciation lives is set out below.
(GKN PLC, 2017, p. 117)

Methods of depreciation
There are three main methods of depreciation. These are the straight line or prime cost method, the diminishing or reducing balance method and the units of production method. Each method has advantages and disadvantages but over the lifetime of the assets each method will eventually result in the same amount of depreciation charged. The timing of the charges does change between the various methods and the method used should match the consumption of the benefits. GKN use the straight-line method and it is the simplest method shown by the following formula
(Cost – Residual Value) / Useful life = $ Annual Depreciation
The diminishing balance method assumes that the assets being depreciated will be more beneficial in terms of earning revenue in the earlier years. This method applies a greater amount of depreciation in the earlier years and the balance diminishes as the years progress.
The units of production method uses a unit (for example hours, kilometres, items produced) to determine the life of an asset. For example, a grader may have a depreciable amount of $300,000 and a useful life of 8000 hours. This would result in $37.5 of depreciation for every hour the grader was used. If it was used for 1000 hours in one year the depreciable amount for that year would be $37,500. I believe that GKN use the straight-line method as it is the easiest method to apply as it doesn’t require checking assets units of production.
Revaluation and impairment
As time goes by assets change in value and property, plant and equipment must be revalued. I understand that when an item of property, plant and equipment is carried at a value higher than its fair value less costs to sell or its value in use the item is impaired. This means that it is carried on the company’s financial statements at an inflated price to its real value and this must be adjusted through the firm recognising an impairment loss. Once this has been completed the asset will be carried at the correct value and the loss can be recognised as an expense. There is an exception to this when previously the asset has had it value increased, then only the extra decreased amount (prior to the amount being revalued up) can be class an an expense. I can relate this concept to simply updating the farm records of the number of sheep in each mob at shearing time. If your records are wrong and outdated, they need to be updated to reflect reality as best as possible. GKN’s property, plant and equipment is reviewed annually for impairment and if the charge arises in the normal course of business, it is recorded as a trading profit (I’m assuming that it is recorded here as an expense). If an impairment charge arises in a wider review of a cash generating unit it is itemised within the operating profit.
Goodwill and amortisation
I understand goodwill to be an asset with no physical presence that cannot be separated from the rest of the business. It occurs when a business purchases another business and it can be viewed as the amount paid which is greater than the value of net assets. This puts a precise dollar value on the amount of goodwill, and it can then be used to increase the assets on a balance sheet to balance the accounting equation Assets = Equity + Liabilities. Goodwill can include customer relations, favourable locations, quality management and many other reasons why a company may pay want to buy another company at a price of more than their net assets. GKN states that they do not amortise
goodwill, but it is tested at least annually for impairment. Other intangible assets are valued at cost less impairment and accumulated amortisations charges. Amortisation is charged on non-operating intangible assets in a straight-line basis over the expected useful lives. I understand amortisation to be like depreciation where an asset is turned into an expense except the term amortisation is used when referring to intangible assets and goodwill. The table is given below
(GKN PLC, 2017, p. 119)
These intangible assets have either been purchased, acquired through business combinations, other contractual or legal rights and are not transferable or separable.
Previous reports and list any changes made
I viewed the 2016 and 2015 annual reports for GKN also and noticed that there haven’t been any changes to any of the methods of depreciation or other non-current assets. The same text appeared in every annual report. I believe that GKN must be happy with the way they are currently depreciating their assets and have chosen not to adjust their methods. As no adjustments have been made, this allows reports over the periods to be accurately compared. It is also easiest to leave the current methods in plan and this may have been a reason why no changes have been made.
GKN’s goodwill figures
Opening the balance sheet and looking to the Asset: Goodwill in 2017 stated a figure of £492m, note 11 provide further detail and showed how the figure was determined. Opening balance (goodwill at cost) + businesses acquired – businesses disposed – currency valuations. Then this figure was used, and accumulated impairment change for the year was added and currency valuations subtracted to return the Netbook amount at 31 December which matched the Balance sheet. GKN also provided details on how the carrying value of goodwill of £492m was split between the reportable segments of the business. As I looked back through the different reports, I could see how the accumulated impairment was constantly increasing. GKN’s goodwill as a percentage of total assets was 7.5%, 7.9%, 6.6%, 5.6% in the years between 2014 and 2017. I would estimate that this is a moderate amount of goodwill and I will be interested to compare these figures to other companies.
GKN’s other intangible assets figures
The other intangible assets were set out in much the same way in an additional note although they were segregated between various categories. These were Development Costs, Participation Fees, Computer Software and the assets arising on business combinations included Marketing Related, Customer related, and Technology based. GKN’s other intangible assets as a percentage of total assets was 14.1%, 16.8%, 14.7%, 13.3% in the years between 2014 and 2017. I estimate these figures would change dramatically depending upon the type of business the company was involved in. As more money is spend on computer programs and intellectual property, I would imagine these percentages to increase. Therefore, I don’t feel that they can be easier compared across industries.
GKN’s balance sheet showed the additional information for property, plant and equipment in note 12. Categories were split between Land and buildings, Plant and machinery, Other tangible assets and Capital work in progress. The cost amounts were calculated in the same manner as the goodwill and other intangible assets. Accumulated depreciation and impairment is listed as at the beginning of the period and charges for depreciation and impairment were itemised making it very clear to see the Netbook amount as at 31st December 2017.
Depreciation journal entries for GKN
Date Debit (£m) Credit (£m)31/12/2017 Depreciation Expense
Accumulated Depreciation: Plant and Machinery
(Depreciation expense for the year 2017)
260260
31/12/2015 Depreciation Expense Accumulated Depreciation: Land and Buildings
(Depreciation expense for the year 2015)
2121
31/12/2016 Depreciation Expense Accumulated Depreciation: Other tangible assets
(Depreciation expense for the year 2016)
1111
These journal entries have the effect of increasing the expenses for the period (as an increase in an expense is a debit). The journals entries also credit the accumulated depreciation for each of the specific categories. This is because the accumulated depreciation account is a contra asset account meaning that it has a credit balance when normally an asset account has a debit balance. The accumulated depreciation account works as a running total of all the depreciation for each category that has been incurred.
GKN’s depreciation
Looking to GKNs income statement note 4 refers to the extra information regarding the operating profit. From here GKN list depreciation of property, plant and equipment. I notice that in this title they also include other tangible assets and the total for 2017 is £302m. GKN’s depreciation as a percentage of total expenses was 3.3%, 3.2%, 3.3%, 3.4% in the years between 2014 and 2017.
These figures were very stable indicating that while there were only minimal changes, depreciation increased at the same rate as the total expenses over these years. Depreciation is not a large expense for GKN this is mainly because they have a large amount of raw materials and consumable expenses along with large staff costs. These other larger expenses make the amount of depreciation proportionally smaller than if those other costs were smaller.
Possibility to manipulate depreciation entries
As depreciation involves estimates and judgements it is possible for a company to manipulate these entries. An example of this would be when director’s remuneration is linked to the company’s profit and loss figures. The directors would be biased towards increasing profits and this could be achieved through capitalising expenses. This means instead of classing repairs as an expense (decreasing profits and maybe their pay in the current period) they may class the repair as an asset allowing it to be depreciated over a longer duration claiming that it extends the useful life of the asset. Another way manipulation could occur is through inaccurately estimating assets values. This could occur when using the valuation method of deprecation or also when revaluing assets for impairment. If management wanted to reduce taxable income, they may be bias would be towards increasing assets values (or not revaluation them down) to allow for larger amounts of depreciation, to lower profits and taxes. As values are subjective a company could also shop for the best valuations from valuers. They could then choose the value which suited them the best to display results skewed in a direction that they considered favourable.
Step 11
PEER FEEDBACK SHEET: Assignment Steps 7-10
Feedback From:
Feedback To: .
My Comments
Step 7Inventories
Step 8MYOB set up
MYOB training
MYOB quiz
Step 9Business transactions All Journals reportFinancials and discussion
Step 10Depreciation
Overall
Note: Please use this sheet as a guide. There is no need to provide feedback on each step of the Assignment. For example, someone may have little or no draft work completed for one or more of the steps prior to asking for your feedback.

References
Australian Accounting Standards Board. (2019). Inventories. Retrieved from https://www.aasb.gov.au/admin/file/content105/c9/AASB102_07-15_COMPdec16_01-19.pdf
CFI Education. (2020). Operating Cash Flow Ratio. Retrieved from https://corporatefinanceinstitute.com/resources/knowledge/finance/operating-cash-flow-ratio/
GKN PLC. (2017). Annual Report and Accounts 2017. Retrieved from http://www.annualreports.com/Company/gkn-plc
Unleashed. (2019). Inventory Accounting: When Should You Use the Weighted Average Cost? Retrieved from https://www.unleashedsoftware.com/blog/inventory-accounting-use-weighted-average-cost