˘ˇ - usp thesesdigilib.library.usp.ac.fj/gsdl/collect/usplibr1/index/assoc/hash28... ·...
TRANSCRIPT


������������ �������������������������������������
����������������������������������� ���������!�
��
"������#������$$$$%&'(�
����
)�����������������"������
�������
*������������
�������*���������+�����������,�����������������
"�����������������������"�������
-����������������������������

i
Statement of Originality
To the best of my knowledge, the following material has not been published or written by
another person except where due credit is given. This thesis has not been previously submitted
for a degree or diploma in another academic institution.
__________________________
Tamara Osborne
I, as supervisor of the above student, declare this thesis to be the original production of the
aforementioned student. I hereby note my assistance in the preparation of this thesis through
editorial comments.
__________________________
Dr. C. G. Morley
Principle Supervisor
Biology Division

ii
Acknowledgements
This thesis has only come about due to the invaluable assistance of many people. Firstly, to my
sponsors in the initial years – NZAID and USP, I am truly grateful for the opportunity to
undertake this project. To the administrative staff of the Biology division, the staff of the
Personnel and Finance section, and the staff of the Bursary, I extend my apologies for the
constant requests. To my peers who generously volunteered their free time to help out in the
field: Nunia Thomas, Joape Kuruyawa, Isaac Rounds, Jone Nuikula, Taina Mulo, Patrick
Pikacha and Vitali Wocjick – you are all true friends to have waded through mud and stream for
as long as you all did. Also, to Sunil Prasad for his company in the Biology post-graduate
computer lab and his ever-useful tips. I am incredibly grateful to my co-supervisors, Dr. Craig
Morley and Dr. Clare Morrison, for their advice on sampling design and logistics. Dr. Morrison
and Dr. Tim Markwell read through and provided helpful comments on draft manuscripts. Many
thanks to Dr. Linton Winder for taking time out of his busy schedule to look at my data and
statistical analysis. I am also deeply indebted to Conway Pene, GIS Lecturer in the School of
Geography, without whom I would not have been able to map my transect. To the staff of the
Colo-i-Suva forestry station, the PWD gate-keepers to the Savura Valley road, and to the staff of
the Fiji Meteorological Station at Laucala Bay, my gratitude for granting me access to the
reserves and rainfall data respectively. A heartfelt ‘vinaka vaka levu’ to the wonderfully stoic
members of my sampling team that stayed with me through so many late, often wet, and
occasionally cold nights; to Timoci Koliyavu and Alivereti Naikatini, especially to Qase for
being the person you are. Finally, this thesis is dedicated to my family, for their emotional
support, words of encouragement, and, due to the realities of being a fiscally challenged student,
for the occasional monetary aid.

Contents
iii
Statement of Originality i
Acknowledgements ii
Contents iii
List of Figures vi
List of Tables viii
List of Appendices ix
Abstract x
Chapter 1 General Introduction 1
1.1 INTRODUCTION 1
1.2 THE ANURANS OF FIJI 3
1.2.1 Platymantis in the Pacific 3 1.2.2 The Fiji Ground Frog, Platymantis vitianus 4 1.2.3 The Fiji Tree Frog, Platymantis vitiensis 6
1.3 FROG SURVEYS IN THE FIJI ISLANDS 10
1.3.1 Environmental Factors that Influence Frog Distribution 10
1.4 SUMMARY OF STUDY 13
1.4.1 Aims and Objectives 13
Chapter 2 Major habitat preferences of the Fiji tree frog in the Savura area 15
2.1 INTRODUCTION 15
2.2 METHODS 17
2.2.1 Study site 17 2.2.2 Habitat Surveys 17 2.2.3 Data Analysis 18
2.3 RESULTS 19
2.3.1 Results of the Habitat Surveys 19 2.3.2 Weather Data and Analysis 24

Contents continued
iv
2.4 DISCUSSION 28
2.4.1 Habitat Selection 28 2.4.2 Influence of Weather on Survey Results 29
2.5 SUMMARY 30
Chapter 3 Microhabitat selection of Platymantis vitiensis within the Savura area 31
3.1 INTRODUCTION 31
3.2 METHODS 32
3.2.1 Data Collection: Permanent Transect Surveys 32 3.2.2 Microhabitats Occupied in Different Habitats 33 3.2.3 Data Collation 34 3.2.4 Data Analysis 34
3.3 RESULTS 34
3.3.1 Microhabitat Selection along the Transects 343.3.2 Microhabitat Selection within the Three Major Habitats 40 3.3.3 Comparison between Frog Activity along the Stream and Land Transects 40
3.4 DISCUSSION 46
3.5 SUMMARY 48
Chapter 4 Phenology of Platymantis vitiensis along Vago Creek over a one-year period 50
4.1 INTRODUCTION 50
4.2 METHODS 51
4.2.1 Study Site 51 4.2.2 Data from Site and Captured Individuals 52 4.2.3 Data Analysis 55
4.3 RESULTS 56
4.3.1 Phenology of the Fiji tree frog population along Vago Creek 56 4.3.2 Influence of Weather Factors: Rainfall and Temperature 57 4.3.3 Phenology of Fiji Tree Frogs from the Habitat Surveys 58
4.4 DISCUSSION 68

Contents continued
v
4.5 SUMMARY 69
Chapter 5 Conclusions and Recommendations for Future Research 70
5.1 THE SAVURA TREE FROG POPULATION 70
5.1.1 Major Habitat Preferences 70 5.1.2 Microhabitat Selection 71 5.1.3 Phenological Information 72
5.2 RECCOMENDATIONS FOR FUTURE SURVEYS 72
5.2.1 Temporal Variables 73 5.2.2 Spatial Variables 74 5.2.3 Other Factors to Consider 76
5.3 IMPLICATIONS FOR CONSERVATION OF FROGS IN FIJI 77
5.4 SUMMARY 79 Chapter 1
Bibliography 80
Appendices 92
Appendix 1: Original Data from Habitat Surveys 92
Appendix 2: Plant Substrate List 94
Appendix 3: Rainfall Variabilitity in Suva from 2000-2005 96

List of Figures
vi
Figure Legend Page
Figure 1.1 The distribution of the Fiji tree frog (Platymantis vitiensis) throughout the Fiji
archipelago. 2
Figure 1.2 Distribution of Platymantids in South-east Asia and across the Pacific Ocean. 5
Figure 1.3 An adult female Fiji tree frog, Platymantis vitiensis, perched on branches of
riparian shrub, Syzygium seemannii. 8
Figure 1.4 Male Fiji tree frog with uniform pale yellow-green colour, yellow groin flash
and pimply dorsal surface. 9
Figure 1.5 Map of the study site showing general features such as roads, drainage, reserve
boundaries, and pylon lines. 14
Figure 2.1 Map of the study site showing the locations of habitat sites surveyed between June
2004 and May 2005. 20
Figure 2.2 Frog abundance at twelve sites within the three different habitat types and mean
number per habitat type. 22
Figure 2.3 Temporal variation of tree frog abundance in each of the three habitat types from
June 2004 to May 2005. 23
Figure 2.4 The strong relationship relationship between air and stream temperatures recorded
during the habitat surveys. 26
Figure 2.5 The relationship between rainfall and the log-transformed frog abundance in the
three habitats. 27
Figure 3.1 Substrate of perch sites occupied by tree frogs along the two transects on Vago
Creek, Savura. 36
Figure 3.2 Number of tree frogs encountered at different perch heights along both fixed
transects, Vago Creek, Savura. 37
Figure 3.3 The distances of captured tree frogs from the stream transect along Vago Creek. 38
Figure 3.4 Vegetation utilised by tree frogs as perch sites along streams in the three major
habitats. 41
Figure 3.5 Total numbers of tree frogs encountered at different perch heights in three different
habitats types in the Savura area. 42
List of Figures
vii
Figure 3.6 Estimated distances of tree frogs (to nearby streams) captured in three different
habitats in the Savura area. 43
Figure 3.7 Abundance of Fiji tree frogs encountered along the land compared to the stream
transect. 45
Figure 4.1 Schematic diagram depicting the layout of the permanent parallel land and stream
transect along a mid-highland section of Vago Creek, Savura. 53
Figure 4.2 The abundances of the age classes from the fixed transects over the 12-month
period, graphed against average rainfall and air temperatures on the sampling
nights. 59
Figure 4.3 Abundance of gravid females captured along the both land and stream transects
over the 12-month survey period, graphed against average rainfall. 60
Figure 4.4 The significant correlation between log-transformed abundances of adult
P. vitiensis graphed against average rainfall of sampling nights in each month. 61
Figure 4.5 The significant correlation between log-transformed average rainfall and log-
transformed abundances of metamorph Fiji tree frogs. 62
Figure 4.6 The significant correlation between average temperatures and log-transformed
abundances of gravid female tree frogs. 63
Figure 4.7 The significant correlation between log-transformed average rainfall and log-
transformed abundances of adult Fiji tree frogs from the habitat study. 64
Figure 4.8 Abundance of adult Fiji tree frogs captured in the habitat study over the 12-month
survey period, graphed against average rainfall of the sampling days. 65

List of Tables
viii
Table Legend Page
Table 2.1 Descriptive statistics for habitat surveys: standard deviation, variance and standard
error of the mean. 21
Table 2.2 Weather data recorded per month for the habitat surveys in Savura. 25
Table 3.1 Results of univariate ANOVAs on microhabitat data from transects. 39
Table 3.2 Results of two-way ANOVAs on microhabitat data from the habitat surveys. 44
Table 4.1 Field classification system for identifying age/size of captured frogs. 54
Table 4.2 Toe-clipping codes for identifying recaptured frogs. 54

List of Tables
ix
Appendix Legend Page
Appendix 1.1 Map co-ordinates for sampling sites in habitat surveys. 94
Appendix 2.1 Plant species used as substrates by captured frogs. 96
Appendix 3.1 Monthly rainfall variability in Suva over the last five years. 98

Abstract
x
Macro-habitat and microhabitat preferences of the Fiji tree frog, Platymantis vitiensis, were
investigated in the Savura population near Suva, Viti Levu, Fiji. Twelve sites in three habitat
types (primary lowland rainforest, disturbed secondary lowland rainforest, and mahogany
plantations) were surveyed over a twelve-month period. In addition, phenology of the tree frog
was investigated along two permanent transects along Vago Creek, Savura.
Fiji tree frogs were more common in primary lowland rainforest sites than mahogany plantations
and disturbed secondary lowland rainforest sites. The frogs are found more often along stream
sides with Pandanus present, in relatively undisturbed rainforest. Frogs were more common
along streams in the Colo-i-Suva mahogany reserve than the secondary forests and shrub land of
the Vago and Savura reserves. The difference in frog abundance in these habitats is possibly due
to human disturbance, although this was not examined.
Tree frogs selected perch sites based on their height above ground, proximity within open
riparian habitat strips, and the plant substrate’s features. Individuals were commonly found on
Pandanus leaves and fern fronds, as well as the broad-leaved Dilenia. They were often captured
close to the stream on riparian vegetation. The tree frogs were generally found one to two metres
above the ground, and cohorts were observed in different microhabitats.
The phenology of the Vago Creek frog population may be complicated by the inter-annual
fluctuations in rainfall, and other factors such as migration and recruitment. The activity of adult
frogs was significantly negatively influenced by rainfall; however gravid female abundance was
significantly more correlated with changes in air temperature over the year than rainfall. Gravid
females were more active during the wet season and egg-laying primarily occurred during the
months of November to February. Juvenile tree frog phenology contrasts with metamorph

Abstract
xi
activity, as metamorphs were captured more often during the dry season, whereas juvenile
activity peaked early in the wet season. Rainfall was the most important weather variable
influencing Fiji tree frog activity during the 12-month survey period, as indicated by independent
tests of the broad-scale survey data.
Although, Platymantis vitiensis populations in Savura were more abundant in primary lowland
rainforest future surveys should also include secondary vegetation. Time-restricted surveys may
be more effective by sub-sampling along riparian strips in primary forested areas, as tree frogs
showed a strong affinity for stream-side perch sites. Future inventorying and monitoring of Fiji
tree frog populations should be carried out when abundance is highest between late wet season,
to early dry season (March to July).
1
Chapter 1 General Introduction
1.1 INTRODUCTION
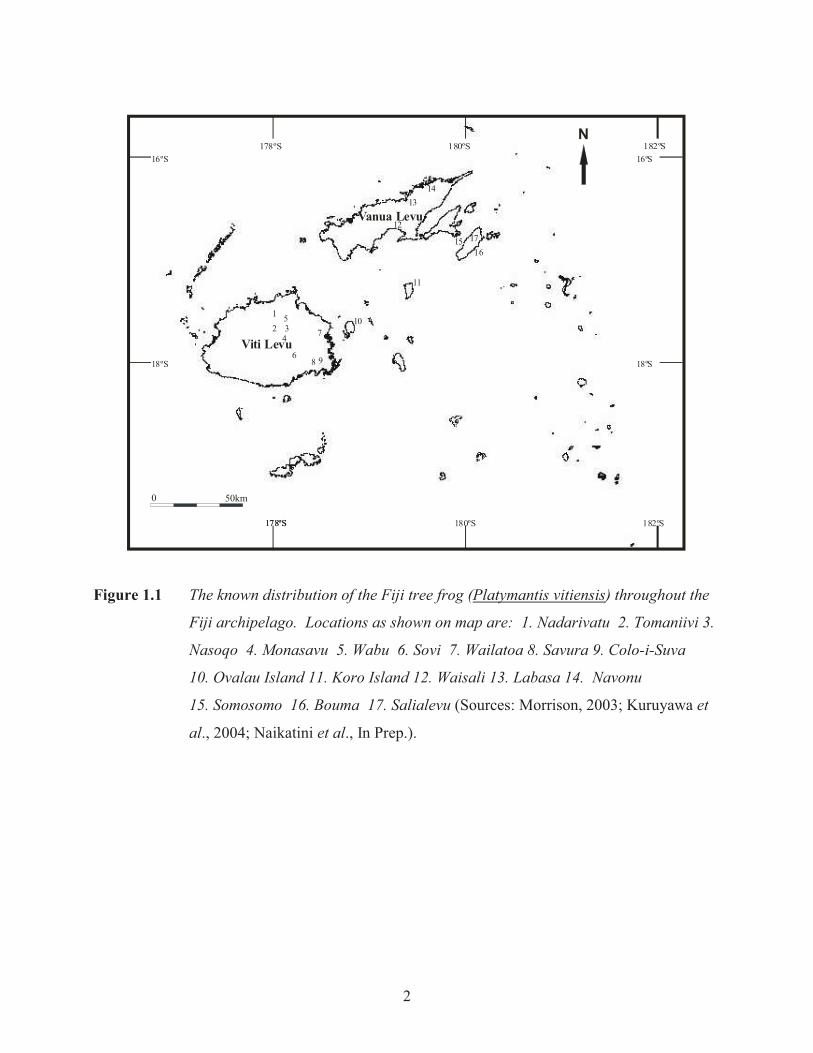
The Fiji tree frog, Platymantis vitiensis, is one of two endemic ranid species found in the Fiji
Island archipelago, the other being the Fiji Ground Frog, Platymantis vitianus (Ryan, 2000). The
tree frog’s range is thought to have been more extensive throughout the western and central parts
of the Fiji group before human arrival (Watson, 1960; Gorham, 1968; Pernetta and Goldman,
1977), but its distribution is now restricted to the four of the largest islands (Morrison, 2003):
Viti Levu, Vanua Levu, Taveuni, and Ovalau (Figure 1.1).
Although the Fiji tree frog is not considered endangered, further destruction of its forest habitat
due to increasing urban expansion may cause the small isolated populations on Viti Levu to
decline into extinction vortices. Ryan (1984) previously voiced this concern saying, that if
rainforest continues to be logged and secondary rainforest is continually disturbed by human
activity, the tree frog should be considered at risk. Therefore, it is important that the ecology and
population dynamics of the Fiji tree frog are better understood in order to predict how further
habitat degradation and fragmentation will affect this species.
Many anurans show habitat preferences based on forest canopy cover (Gregory, 1983; Brown
and Rose, 1988; Ovaska, 1991). To date it is believed that Fiji tree frogs are strongly associated
with riparian strips in good rainforest (Gorham, 1971; Pernetta and Watling, 1978; Watling and
Zug, 1998; Morrison, 2003). Within the rainforest habitat, frogs tend to exhibit microhabitat
preferences (Stewart and Pough, 1983; Stewart, 1985; Townsend, 1989). Previous work on Fiji
tree frogs has indicated an affinity for certain plant species as diurnal retreat sites (Gorham,
1971; Morrison, 2003), in particular the riparian pandanus (Pandanus sp.).
2
N
Viti Levu
Vanua Levu
4 7
6
10
11
1413
16 15
12
16 Sº
18 Sº
178 Sº 180 Sº 182 Sº
182 Sº
180 Sº
178 Sº
16 Sº
18 Sº
178 Sº
0 50km
1 2 3
5
9 8
17
Figure 1.1 The known distribution of the Fiji tree frog (Platymantis vitiensis) throughout the
Fiji archipelago. Locations as shown on map are: 1. Nadarivatu 2. Tomaniivi 3.
Nasoqo 4. Monasavu 5. Wabu 6. Sovi 7. Wailatoa 8. Savura 9. Colo-i-Suva
10. Ovalau Island 11. Koro Island 12. Waisali 13. Labasa 14. Navonu
15. Somosomo 16. Bouma 17. Salialevu (Sources: Morrison, 2003; Kuruyawa et
al., 2004; Naikatini et al., In Prep.).

3
One of the most important aspects of the population dynamics of anurans is their phenology or
activity pattern over a year. There has been much work on the phenology of amphibians around
the world (Church, 1961; Caetano and Leclair, 1999), mostly on anurans (Aichinger, 1987;
Crump and Pounds, 1989; Ritke and Gabb, 1991), especially the effect of environmental
variables on anuran phenology (Brown and Rose, 1988; Bridges and Dorgas, 2000; O’Reilly and
Hines, 2002; Oseen and Wassersug, 2002). Although the Fiji tree frog’s ecology is often
described as being correlated with the wet and dry season of the Fiji group (Gorham, 1968;
Ryan, 1984; Morrison, 2003), there has never been a long term survey that investigates changes
in frog activity and the influence of environmental factors such as rainfall and temperature on
either of Fiji’s native frog species.
1.2 THE ANURANS OF FIJI
1.2.1 Platymantis in the Pacific
The genus Platymantis currently consists of 53 described species ranging from the Philippines in
the west, Palau in the north and Fiji to the east. Although the diversity of Philippine species
suggests a Southeast Asian source for Platymantis, there is a possibility that northern and eastern
congeners may have dispersed from the Bismarck Archipelago (Ota and Matsui, 1995). There
are 26 species in Southeast Asia, one in Palau, and 24 in the Papua New Guinea and Solomon
Islands (Kuramoto, 1997; Allison and Kraus, 2001). The two Fiji platymantids represent the
eastern-most limit of the genus’ range (Figure 1.2).
Recent genetic analysis points to a common ancestor for the Fiji frogs, which may have
originated from the Solomon Islands (Brown pers. comm., 2005). Little is known about how this
ancestor got to the Fiji group, although several theories have been suggested (Gorham, 1971;

4
Pernetta and Goldman, 1977; Pernetta and Watling, 1978; Ryan, 1984; Allison, 1996). The two
most pervasive hypotheses are that the founding population of this ancestor either rafted to Fiji
on floating vegetation, or was brought to Fiji as a food item for humans. It may be possible that
the extinct giant ranid fossil found by archaeologists (Worthy, 2001) was the ancestral form of
the extant Fiji platymantids, as several features of its skeleton are similar to features of one or the
other extant forms.
1.2.2 The Fiji Ground Frog, Platymantis vitianus
The Fiji ground frog is listed as endangered under the IUCN classification system (IUCN, 2003),
based on the extent of the loss of its primary forest habitat. The museum record suggests that the
ground frog was once present on the largest island in the Fiji group, Viti Levu (Gorham, 1968).
The species is now reported from the islands of Vanua Levu, Taveuni, Gau, Ovalau, and Viwa
(Morrison, 2003). Viwa Island is the smallest of the ground frog’s island refugia, being only 60
ha in size (Ryan, 1985). The ground frog is thought to have been extirpated from Viti Levu by
introduced predators (small Indian mongoose Herpestes javanicus and rats Rattus spp.),
competitors (cane toads Bufo marinus) and the human-induced modification of its forest habitat.
It is thought that ground frogs lay eggs year-round (Morrison pers. comm., 2003) like other
tropical species (Beebee, 1996), with increased breeding activity occurring during the wetter
months of the year (November-April). Both sexes call and it is has been suggested that the
female advertises for the male frog (Ryan, 2000), however advertisement by the male is still a
possibility (Bishop, pers. comm., 2005). The ground frog is a terrestrial breeder with direct
development in the large yolky eggs, which are laid in low-lying locations (Ryan, 2000).

5
Figu
re 1
.2D
istr
ibut
ion
of P
laty
man
tids i
n So
uthe
ast A
sia
and
acro
ss th
e Pa
cific
Oce
an.
The
num
bers
repr
esen
t
the
num
ber o
f spe
cies
foun
d in
eac
h is
land
gro
up.
6
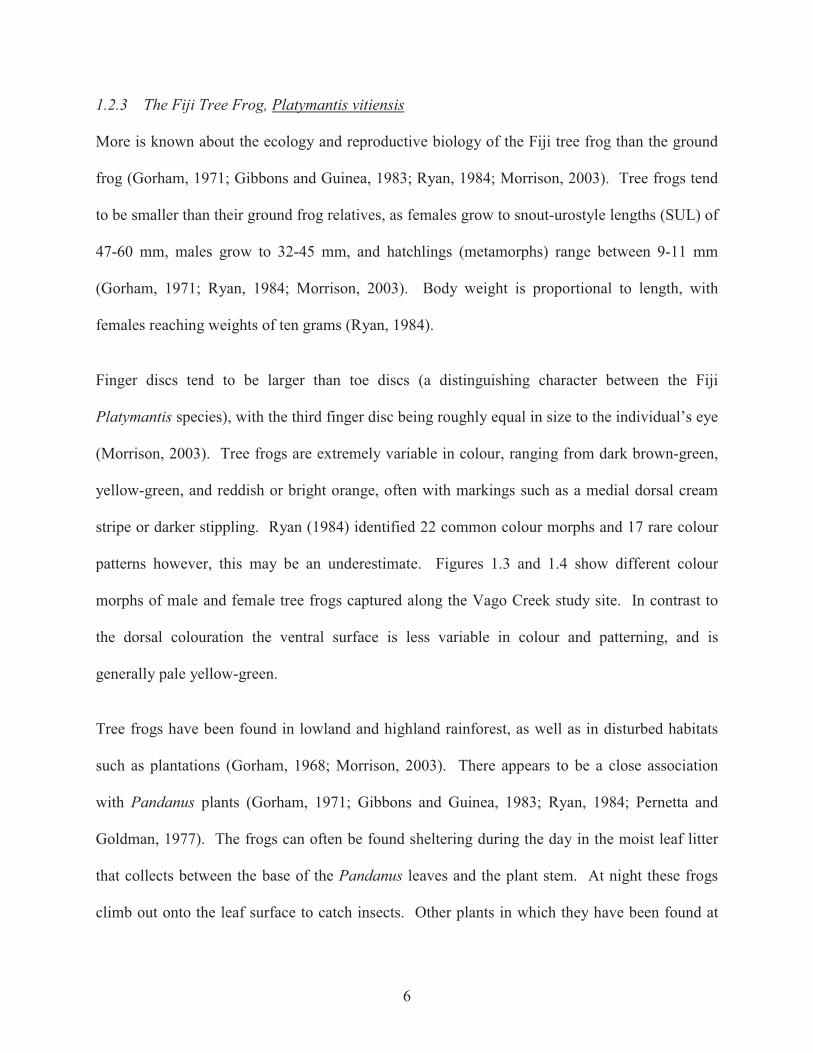
1.2.3 The Fiji Tree Frog, Platymantis vitiensis
More is known about the ecology and reproductive biology of the Fiji tree frog than the ground
frog (Gorham, 1971; Gibbons and Guinea, 1983; Ryan, 1984; Morrison, 2003). Tree frogs tend
to be smaller than their ground frog relatives, as females grow to snout-urostyle lengths (SUL) of
47-60 mm, males grow to 32-45 mm, and hatchlings (metamorphs) range between 9-11 mm
(Gorham, 1971; Ryan, 1984; Morrison, 2003). Body weight is proportional to length, with
females reaching weights of ten grams (Ryan, 1984).
Finger discs tend to be larger than toe discs (a distinguishing character between the Fiji
Platymantis species), with the third finger disc being roughly equal in size to the individual’s eye
(Morrison, 2003). Tree frogs are extremely variable in colour, ranging from dark brown-green,
yellow-green, and reddish or bright orange, often with markings such as a medial dorsal cream
stripe or darker stippling. Ryan (1984) identified 22 common colour morphs and 17 rare colour
patterns however, this may be an underestimate. Figures 1.3 and 1.4 show different colour
morphs of male and female tree frogs captured along the Vago Creek study site. In contrast to
the dorsal colouration the ventral surface is less variable in colour and patterning, and is
generally pale yellow-green.
Tree frogs have been found in lowland and highland rainforest, as well as in disturbed habitats
such as plantations (Gorham, 1968; Morrison, 2003). There appears to be a close association
with Pandanus plants (Gorham, 1971; Gibbons and Guinea, 1983; Ryan, 1984; Pernetta and
Goldman, 1977). The frogs can often be found sheltering during the day in the moist leaf litter
that collects between the base of the Pandanus leaves and the plant stem. At night these frogs
climb out onto the leaf surface to catch insects. Other plants in which they have been found at
7
night are on banana (Musa spp.) leaves, on Syzygium saplings, in birds’ nest ferns (Asplenium
nidus), epiphytic ferns, and on streamside vegetation such as ground ferns and Acalypha
rivularis (Gorham, 1968; Ryan, 1984; Morrison, 2003).
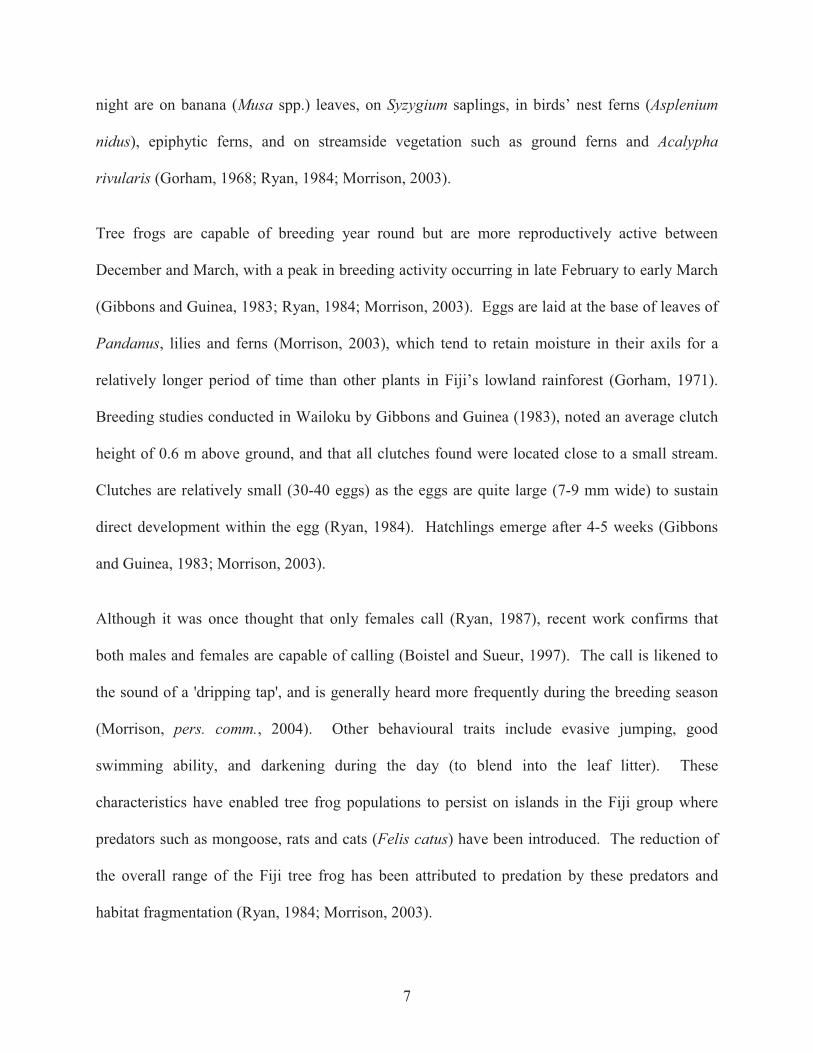
Tree frogs are capable of breeding year round but are more reproductively active between
December and March, with a peak in breeding activity occurring in late February to early March
(Gibbons and Guinea, 1983; Ryan, 1984; Morrison, 2003). Eggs are laid at the base of leaves of
Pandanus, lilies and ferns (Morrison, 2003), which tend to retain moisture in their axils for a
relatively longer period of time than other plants in Fiji’s lowland rainforest (Gorham, 1971).
Breeding studies conducted in Wailoku by Gibbons and Guinea (1983), noted an average clutch
height of 0.6 m above ground, and that all clutches found were located close to a small stream.
Clutches are relatively small (30-40 eggs) as the eggs are quite large (7-9 mm wide) to sustain
direct development within the egg (Ryan, 1984). Hatchlings emerge after 4-5 weeks (Gibbons
and Guinea, 1983; Morrison, 2003).
Although it was once thought that only females call (Ryan, 1987), recent work confirms that
both males and females are capable of calling (Boistel and Sueur, 1997). The call is likened to
the sound of a 'dripping tap', and is generally heard more frequently during the breeding season
(Morrison, pers. comm., 2004). Other behavioural traits include evasive jumping, good
swimming ability, and darkening during the day (to blend into the leaf litter). These
characteristics have enabled tree frog populations to persist on islands in the Fiji group where
predators such as mongoose, rats and cats (Felis catus) have been introduced. The reduction of
the overall range of the Fiji tree frog has been attributed to predation by these predators and
habitat fragmentation (Ryan, 1984; Morrison, 2003).

8
Figure 1.3 An adult female Fiji tree frog, Platymantis vitiensis, perched on branches of
riparian shrub, Syzygium seemannii.

9
Figure 1.4 Male Fiji tree frog with uniform pale yellow-green colour, yellow groin flash and
pimply dorsal surface.
10
1.3 FROG SURVEYS IN THE FIJI ISLANDS
The literature concerning tree frog ecology and reproductive phenology is generally anecdotal
with only Gorham's (1968) fieldwork providing some baseline data. No published studies have
systematically recorded abundance and activity patterns in any of the extant Fiji tree frog
populations.
Therefore, an objective of my research is to identify more effective sampling techniques when
surveying tree frogs (as well as the ground frog), particularly when limited by time and finances.
By comparing tree frog populations in three types of habitats, more can be learnt about the types
of microhabitats (retreat sites and forage sites) tree frogs inhabit. This information, in
combination with data on the influence of environmental variables, is essential for the design of
effective surveying and monitoring protocols for anurans (Koch, 2000).
The tree frog’s persistence on mainland Viti Levu has been attributed to its arboreal niche and
evasive behaviour (Ryan, 1984). Previous surveys of tree frogs on Viti Levu have reported
populations in the Wailoku area, Colo-i-Suva, Nasoqo, Tomaniivi, Nadarivatu, Monasavu, Sovi
(Gorham, 1971; Ryan, 1984; Morrison, 2003). More recently, fieldwork in the eastern district of
Viti Levu has reported a small population near Wailotua in the Tailevu province of Viti Levu
Island (Naikatini, Osborne and Morley, In prep.), and a good-sized population in the Waisali
Reserve on Vanua Levu (Morrison et al., 2004).
1.3.1 Environmental Factors that Influence Frog Distribution
It has been shown by several studies (Church, 1961; Heatwole, 1962; Blankenhorn, 1972;
Aichinger, 1987; Brown and Rose, 1988; Fukuyama and Kusano, 1992; Lizana, Marquez and
11
Martin-Sanchez, 1994; Beebee, 1995; Marsh, 2000; Parris, 2004) that environmental conditions
affect amphibian activity. Environmental effects are significant parameters in sampling designs
and need to be better understood when surveying tree frogs with the most important
environmental factors being rainfall/precipitation, air temperature, water temperature, relative
humidity, and the percentage of cloud cover.
Most anurans are active when there is a sufficient amount of moisture in their habitat (Cree,
1989; Marsh, 2000). Rainfall history prior to a survey and the intensity of rainfall events
immediately before and during a survey tend to have differing effects on the activity of an anuran
community. Rainfall is a highly influential variable on breeding activity, particularly in
temperate countries (Gascon, 1991; Marsh, 2000). Fiji is a tropical country however rainfall
varies in distribution and abundance over the year. It has been suggested that the breeding
activity of Fiji’s frogs is correlated with rainfall variability over the year (Kuruyawa et al., 2004).
Air temperature is another factor determining anuran nightly activity, especially when
temperatures are quite low or high (Brattstrom, 1963; Sinsch, 1984). The influence of
temperature on breeding activity has mostly been demonstrated for temperate (Fukuyama and
Kusano, 1992; Reading, 1998) and subtropical anurans (Kam and Chen, 2000), as annual
temperatures vary markedly in these regions. Temperature is likely to have an effect on the
direct development of the Fiji tree frog. The length of the embryonic development period of
Eleutherodactylus coqui, a south-American terrestrial leptodactylid, is retarded by slight
increases (as little as 1�C) in air temperature (Townsend and Stewart, 1986).
12
Environmental factors such as temperature and rainfall are even more important when looking at
long-term patterns. With the global warming trends predicted, there is a concern that future
climatic trends will affect anuran breeding (Beebee, 1995). Several studies have documented
changes in anuran ecology in response to climate change (Laurance, 1996; Pounds, Fogden, and
Campbell, 1999; Beebee, 2002). Responses to past climate change is a field that has only begun
to be investigated by amphibian biologists (Alexander and Eischeid, 2002; Kiesecker et al.,
2001; Pounds, 2001). This is an area of research that is difficult to provide evidence for, as in
most cases past climate change trends are still being debated (Thuiller, 2004; Midgley and
Thuiller, 2005). However, it is a field that requires further investigation as this information
could be used to predict anuran responses to future climate change, a useful tool for the
monitoring and management of anuran populations in the wild (Pounds, 2001).

13
1.4 SUMMARY OF STUDY
This is the first systematic study of the abundance, distribution and phenology of the Fiji tree
frog in a defined area. It will contribute to the knowledge base, especially data concerning
habitat preferences and activity patterns of the tree frog over temporal and spatial scales. This
information will assist future researchers to develop more efficient and effective
surveying/monitoring procedures.
1.4.1 Aims and Objectives
The aim of this study is to record the abundance, distribution, and activity patterns of the Fiji tree
frog over a one-year period in the Savura Forestry Reserve (Figure 1.5), and to determine the
factors that influence these variables. The specific objectives of this study are to: (a) to identify
the habitats in which tree frogs are most prevalent in Savura, (b) to identify microhabitats
occupied by individuals and determine microhabitat preferences, and (c) to identify changes in
activity patterns over a one-year sampling period. Recommendations for the design of effective
surveying of tree frog populations in Fiji, with a focus on environmental conditions and habitat
preferences, will be summarised for any future research on the species.

14
Colo-i-Suva
Colo-i-Suva Mahogany Forest Reserve
PRIN
CESS
ROAD
N
Colo-i-Suva Mahogany Forest Reserve
Forestry Station
Savura Forest Reserve
Vago Forest Reserve
Figure 1.5 Map of the study site showing general features such as roads, hydrology,
reserves, and pylon lines (adapted from Fiji Map Series 31 - Government of Fiji,
1989 and 1992). Note that the tributaries of the Savura Creek are not shown in
the map due to spatial limitations.
0 1km
KEYStream
Main road
Unsealed road
Dirt road
Pylons & cable
Lake
Building
Water tank
15
Chapter 2 Major habitat preferences of the Fiji tree frog in the Savura area.
2.1 INTRODUCTION
Many anuran species display habitat preferences based on forest canopy cover (Gregory, 1983;
Brown and Rose, 1988; Ovaska, 1991; Parris, 2004). Other elements of the vegetation may also
influence anuran activity, such as species composition and structure (Stewart and Pough, 1983).
Although there have been numerous studies investigating anuran habitat preferences, few have
focussed on tropical species (Retallick, Hero, and Alford, 1997; Gillespie et al., 2004). The lack
of such studies is slowly being addressed with more tropical amphibian research being conducted
over the last two decades. The increased interest in this aspect of anuran ecology can be partly
attributed to the growing concern over global amphibian declines.
The issue of global amphibian declines was first highlighted in 1989 after scientists noted
declining trends in several amphibian populations (Alford and Richards, 1999). Blaustein and
Wake (1990) reviewed the wide range of causative agents implicated in the case studies
presented at this initial conference on amphibian declines. Loss of habitat and various forms of
habitat modification were implicated in many species declines (Sih et al., 2000; Young et al.,
2001; Collins and Storfer, 2003; Hero and Morrison, 2004). An area of concern highlighted by
these reviews is the lack of research being conducted on declining tropical species (Young et al.,
2001; Storfer, 2003; Hero and Morrison, 2004). This is alarming considering that tropical
regions are generally amphibian hotspots of biodiversity (Duellman, 1999; Houlahan et al.,
2000; Carey et al., 2001).
Tropical habitats, in particular tropical rainforests, are intricately complex ecosystems that are
home to a large diversity of anurans, such as the platymantids of Fiji. Structural features like the
16
availability of retreat sites and type of canopy cover are important limiting factors within habitats
occupied by herpetofauna (Gregory, 1983; Parris and McCarthy, 1999). Stewart and Pough
(1983) showed that the availability of retreat sites and nest sites act as regulatory factors for
population size and density. The quality and quantity of microhabitats will obviously differ
between habitat types due to differences in structural features. As a result, frog species in
different habitats may have strikingly contrasting life history characteristics (Ovaska, 1991).
The Fiji tree frog (Platymantis vitiensis) is an endemic anuran that has been recorded in areas of
lowland and highland rainforest of the Fiji Islands (Morrison, 2003). Tree frogs are also present
in disturbed habitats such as mahogany plantations (Swietenia macrophylla) and edible root
crops, such as dalo (taro), Collocasia esculenta. The tree frog is thought to exhibit a preference
for riparian strips within intact rainforest (Gorham, 1971; Pernetta and Watling, 1978; Watling
and Zug, 1998). The other endemic anuran, the Fiji ground frog (Platymantis vitianus) shares
many ecological characteristics with its arboreal relative.
Ground frogs are listed as endangered because of habitat loss and the impact of introduced
predators (IUCN, 2004). Recently the tree frog was categorised as near threatened, on the IUCN
Red List due to increasing habitat alteration and loss (IUCN, Conservation International, and
NatureServe, 2004). In order to estimate the threat of habitat loss to extant tree frog populations,
we need to understand the relationship between P. vitiensis and their habitats. This study
investigates the habitat preferences of tree frogs in a forest reserve in Fiji. The aims of this
chapter are to (a) determine the relative abundance of tree frogs in three habitat types within the
Savura area (which includes the Vago, Savura and Colo-i-Suva Forest Reserves), and (b) to
investigate the effect of rainfall and temperature on the abundance of tree frogs at each site.

17
2.2 METHODS
2.2.1 Study site
The Savura and Vago Forestry Reserves are located approximately 10km north of central Suva,
Fiji (Gibbons and Guinea, 1983). Access to the reserves is restricted and the area has never been
logged prior to the establishment of Vago Reserve in 1959, and Savura Reserve in 1963 (Keppel
et al., 2005). The Savura area is a good representative of primary rainforest in the southeast of
Viti Levu Island. The relatively pristine state of the area has allowed a population of Fiji tree
frogs to persist despite close proximity to humans.
The major habitats within Savura are lowland and highland rainforest, with patches of grassland
and mahogany plantations on the periphery of the forest area (Keppel et al., 2005). An unsealed
road runs northeast through the reserve, and several smaller tracks provide access into the forest
and to the streams (Figure 1.5). The climate of Savura is generally warm and wet during the
months of November to April, and cool and dry from May to October. The study area has
undulating ridges (an altitudinal range of 20-400 m), with steep slopes and narrow stream
valleys, in which there are several small fast-flowing streams that drain the catchments into a
tributary of the Rewa River.
2.2.2 Habitat Surveys
Three habitat types were selected for this study based on percent cover in the Savura area. One
site from each habitat type was surveyed once a month, a total of 12 sites per habitat type (Figure
2.1; refer to Appendix 1.1 for the map co-ordinates for each site). Each sampling night was
randomly allocated each month to prevent any possible bias that may occur due to the order in
which the habitats were surveyed. Surveys were conducted along accessible lowland streams
18
within the Vago and Savura Forest Reserves, for two hours each night by three searchers, similar
to the Visual Encounter Survey (VES) method (Heyer et al., 1994). Captured frogs were placed
in plastic click seal bags for processing by the principal researcher.
All individuals encountered were weighed with a 60g Pesola scale (1g accuracy). The SUL of
each frog was measured using a Vernier calliper (0.1mm accuracy). Individuals were sexed
where possible using indicators like weight and SUL, the presence/absence of a yellow groin
flash, and presence/absence of egg masses (observed through slightly transparent abdominal
skin). Adult males were identified as individuals weighing more than 1.5g and displaying the
yellow groin flash. Adult females are reproductively mature at larger sizes and therefore do not
display the yellow groin flash at smaller sizes like male frogs.
Air and stream temperatures were recorded at the beginning and end of each two hour survey
using a standard alcohol thermometer. Rainfall data was obtained from the Fiji Meteorological
station in Laucala Bay. Rainfall for the 24 hour period was measured at the station at
approximately 2100 hours each night.
2.2.3 Data Analyses
The survey data was analysed using a single factor ANOVA with twelve sites (replicates) per
habitat type. The hypothesis was that there is no difference between the total numbers of tree
frogs captured at riparian sites within the three different habitats in the Savura area. This
hypothesis was tested because we predicted that tree frogs are more likely to be found in primary
rainforest than in more disturbed habitats. This is because certain aspects of habitat structure
(e.g. canopy cover) and other factors, such as plant species composition, are thought to play an
important role in site selectivity of amphibians (Stewart-Koster et al., 2003). Canopy cover can
19
limit the amount of sunlight filtering through to sub-canopy and forest floor vegetation,
therefore, influencing air temperature within the rainforest and in retreat sites.
The influence of habitat type had on frog abundance at the 36 sites was determined using a single
factor ANOVA. A Pearson’s correlation between air and stream temperature was used to
confirm the hypothesis that air and stream temperatures are highly correlated. The effect of
rainfall and air temperatures on frog abundance was determined using multiple regressions. The
interaction between the significant weather variables and habitat was analysed in an analysis of
covariance (ANCOVA).
2.3 RESULTS
2.3.1 Results of the Habitat Surveys
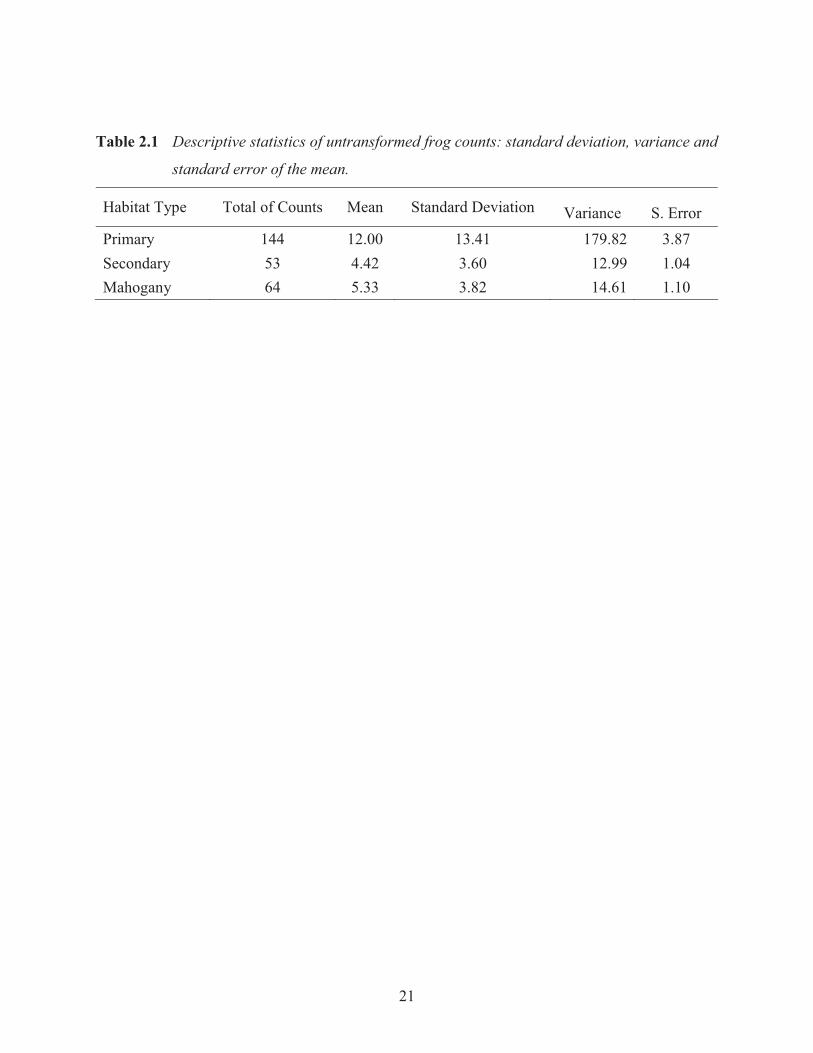
A total of 144 frogs were captured in primary lowland rainforest (PlRf) sites, 53 in disturbed
secondary lowland rainforest (DSlRf) sites, and 64 from mahogany plantations (Mhgy) over the
year (a total of 24 hours of survey time per habitat type). The relatively high variance in the total
abundances of frogs found in primary lowland rainforest sites (Table 2.1) is due to an outlier
population at site P12. Tree frog abundance at P12 constitutes 36.1% of the total abundance of
frogs recorded from all primary rainforest sites (Figure 2.2).
The abundances were log transformed to account for the effect of the outlier, and a non-
significant Levene’s test (Levene’s statistic= 0.25, p = 0.78) indicated the variances of the log
data were homogenous between habitats. Habitat type had a weak significant effect on frog
abundance at the 36 sites (F2, 33= 3.43, p = 0.04).

20
VagoCk
Savura
Ck
D1
P10
D9
P2
P8D6
P7
D8
D10
P6
D3
D7
D2D5
D4
P3
P1
P5P4
P7
P9
M1
M5
M7
M4 M6
M3
M9
M8M10
M2
M11
P11
P12
D11
D12
M12
Figure 2.1 Map of the study site showing the locations of habitat sites surveyed between June
2004 and May 2005. Green squares - Primary lowland rainforest sites (P1–P12),
Yellow squares - disturbed secondary lowland rainforest site (D1–D12), and Maroon
squares – mahogany plantation sites (M1–M12).
0 1km
KEYStream
Main road
Unsealed road
Dirt road
Lake
21
Table 2.1 Descriptive statistics of untransformed frog counts: standard deviation, variance and
standard error of the mean.
Habitat Type Total of Counts Mean Standard Deviation Variance S. Error Primary 144 12.00 13.41 179.82 3.87 Secondary 53 4.42 3.60 12.99 1.04 Mahogany 64 5.33 3.82 14.61 1.10

22
8.36
4.75 5.38
0
10
20
30
40
50
60
Primary Secondary Mahogany
Habitat types
Tota
l no.
of f
rogs
cap
ture
d
Figure 2.2 Frog abundance at twelve sites within the three different habitat types and mean
number of frogs per habitat type. Several data points for sites within the same
habitat were coincident and are darker than single data points.
n=12 n=12 n=12

23
05101520
Jun-
04Ju
l-04
Aug
-04
Sep-
04O
ct-0
4N
ov-0
4D
ec-0
4Ja
n-05
Feb-
05M
ar-0
5A
pr-0
5
Mon
th/y
ear
Total No. of Frogs Captured per 2h Survey
Prim
ary
low
land
rain
fore
st
Seco
ndar
y di
stur
bed
low
land
rain
fore
st
Mah
ogan
y pl
anta
tions
Figu
re 2
.3
Tem
pora
l var
iatio
n in
tree
frog
abu
ndan
ce in
eac
h of
the
thre
e ha
bita
t typ
es fr
om J
une
2004
to M
ay 2
005.
The
out
lier
poin
t P12
is re
mov
ed to
redu
ce sk
ew d
ue to
this
poi
nt. C
oinc
iden
t poi
nts a
re d
istin
guis
hed
as u
n-fil
led
sym
bols
.

24
There was no graphical trend in the numbers of tree frogs recorded each month in the different
habitats, to indicate an influence of tree frog phenology on the survey results (Figure 2.3).
2.3.2 Weather Data and Analysis
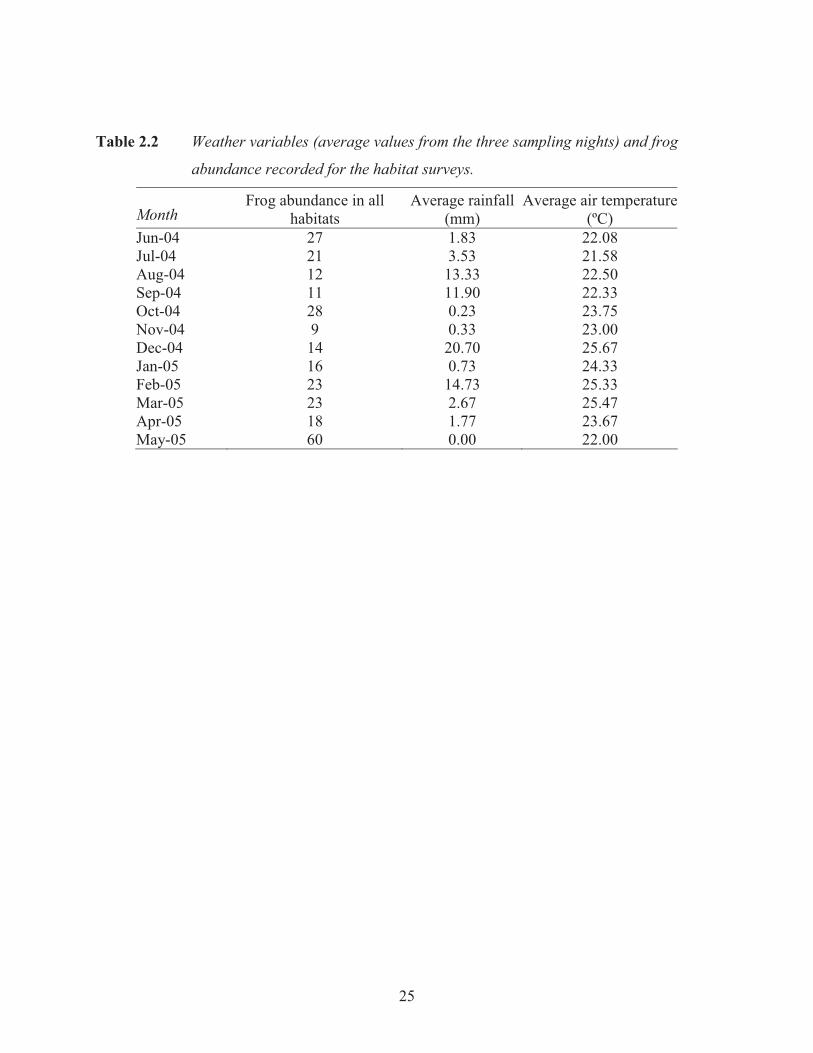
The average air and water temperatures recorded at each site and the average rainfall of the
sample days in a month are shown in Table 2.2. The result of the Pearson’s correlation between
air temperature and stream temperature was very significant (P.C. = 0.839, p< 0.001, n= 36). As
water temperature was so highly correlated to air temperature (77% of the variation in water
temperature was explained by air temperature; Figure 2.4), water temperature was removed from
further analyses. Log transformed frog abundances were not significantly affected by air
temperature in any habitat (t2, 33= 0.12, p= 0.90). However, rainfall in the 24 hour period prior to
and during sampling exerted a significantly negative effect on the transformed frog abundances
(t2, 33= -3.13, p= 0.004; Figure 2.5).
The analysis of covariance of the log transformed frog abundances in the different habitats with
rainfall as a covariate, suggests that rainfall exerted a greater influence (F1, 32= 8.46, p= 0.007) on
survey results than the habitat (F2, 32=2.70, p= 0.08) at each site. It was observed that on weeks
when it rained every day leading up to the sampling night, fewer tree frogs were found. On
several occasions when diurnal showers were heavy, very few frogs were captured that night.
To investigate the effect high rainfall in the 24-hour period prior to sampling had on frog counts,
results from nights when the 24-hour rainfall exceeded 11 mm were removed from the
ANCOVA. The relationship between rainfall and the log-transformed frog abundances in the
different habitats was non-significant in this analysis (F1, 28= 1.69, p= 0.21). The influence of
habitat type on frog abundance was also non-significant in this analysis (F2, 26= 2.61, p= 0.09).
25
Table 2.2 Weather variables (average values from the three sampling nights) and frog
abundance recorded for the habitat surveys.
Month Frog abundance in all
habitats Average rainfall
(mm) Average air temperature
(ºC) Jun-04 27 1.83 22.08 Jul-04 21 3.53 21.58 Aug-04 12 13.33 22.50 Sep-04 11 11.90 22.33 Oct-04 28 0.23 23.75 Nov-04 9 0.33 23.00 Dec-04 14 20.70 25.67 Jan-05 16 0.73 24.33 Feb-05 23 14.73 25.33 Mar-05 23 2.67 25.47 Apr-05 18 1.77 23.67 May-05 60 0.00 22.00

26
y = 0.99x + 0.33R2 = 0.77
20.00
21.00
22.00
23.00
24.00
25.00
26.00
27.00
21.00 21.50 22.00 22.50 23.00 23.50 24.00 24.50 25.00 25.50 26.00
Air temperature (oC)
Wat
er/s
tream
tem
pera
ture
(o C)
Figure 2.4 The strong relationship between air and stream temperatures recorded during the
habitat surveys.

27
Figure 2.5 The relationship between rainfall and the log-transformed frog abundance in the
three habitats. The equation of the regression line and the regression coefficient
are shown for the significant (F1, 10= 5.42, p=0.04) relationship between rainfall
and frog abundance in secondary habitat.
00.5
11.5
22.5
33.5
44.5
0 2 4 6 8 10 12 14
Rainfall (mm)
Log
of fr
og a
bund
ance
y = -0.03x + 1.77R2 = 0.59
0
0.5
1
1.5
2
2.5
3
0 10 20 30 40 50 60 70
Rainfall (mm)
Log
of fr
og a
bund
ance
0
0.5
1
1.5
2
2.5
3
0 5 10 15 20 25
Rainfall (mm)
Log
of fr
og a
bund
ance
Primary forest
Secondary forest
Mahogany plantations
28
2.4 DISCUSSION
2.4.1 Habitat Selection
Frog abundance was slightly greater in primary lowland rainforest habitat, than in the secondary
lowland rainforest and mahogany forest habitat. This suggests Fiji tree frogs can persist even in
disturbed habitat patches. Low frog abundances have been recorded in secondary vegetation in
other studies (Galindo-Leal et al., 2003), which is linked to loss of suitable microhabitat. The
influence of microhabitat variables on frog abundance is discussed in the Chapter 3.
Fiji tree frogs may not be restricted to primary habitat like many threatened species found in the
New World tropics (Streatfield, 1999); however, their distribution may be limited by structural
components of primary rainforest and possibly secondary formations. Canopy cover, species
composition, the density of under-storey vegetation, and food availability, may affect tree frog
distribution patterns, and, as these factors were not investigated in this study, future research
examining these variables is recommended. The large number of tree frogs recorded at P12 is
likely to be due to site-specific habitat features that were not examined in this study.
Additionally, slightly higher numbers of captures are recorded in mahogany forest than in
secondary sites. Forestry staff at Colo-i-Suva rarely enter these mahogany forests/ plantations at
night and little logging has taken place in the reserve over the last few years. The riparian
vegetation that grows along the narrow streams in the mahogany reserve is very similar in
species composition to the primary sites in the Vago and Savura catchments. The absence or
presence of tree frogs along riparian strips may be linked to the presence of certain plant species
(e.g. Pandanus), as indicated for other anurans (Gregory, 1983; Parris, 2004).

29
2.4.2 Influence of Weather on Survey Results
The significantly negative relationship between rainfall and frog abundance at the sites indicates
that rainfall plays an important role when surveying frogs. As we surveyed the 12 sites in each
habitat over twelve months, we reduced the temporal bias that may occur when sampling
intensively within a year. Although the study site is located within the wetter region of Viti Levu
Island, there were marked changes in the amount of rainfall over the sampling period.
It is notable that only a few frogs were ever recorded in the secondary disturbed rainforest sites,
during or after a day of heavy rainfall. Low numbers of frogs observed at such sites are probably
due to heavy rainfall affecting frog activity and detectability, rather than there being an absence
of tree frogs. As the sampling programme was designed with surveys at set times, surveys were
conducted in a range of weather conditions. The effect of rainfall on detectability of the tree
frogs at night and on the activity of tree frogs clearly influences surveys. Sampling should be
conducted on nights when rainfall in the 24-hours prior to a survey is lower than 10mm.
Air temperature at the habitats varied very little throughout the year, and did not have a
significant influence on abundances of tree frogs in any of the habitat types. However, this
weather variable is still important as the effect of altitudinal variation in air temperature on tree
frog activity was not investigated in this study. Altitudinal variation in anuran activity patterns
has been recently demonstrated for many anurans including tropical species (Morrison and Hero,
2003). Therefore, it is recommended that in future, research on Fiji tree frogs should factor in
the effect of weather variability in different habitats at different altitudes to clearly elucidate
patterns in habitat occupation.

30
2.5 SUMMARY
Fiji tree frogs in the Savura area were slightly more abundant in primary lowland rainforest sites
than mahogany plantations and disturbed secondary lowland rainforest sites. Human disturbance
might be a factor influencing the abundance of tree frogs, as they were more common along
streams in the less disturbed mahogany plantations, than the secondary forest sites. Rainfall had a
significantly negative effect on frog numbers recorded in each habitat site, and future research on
tree frogs should be conducted when rainfall during the 24-hour period prior to the survey is
lower than ten millimetres.

31
Chapter 3 Microhabitat selection of Platymantis vitiensis within the Savura area
3.1 INTRODUCTION
Amphibians tend to inhabit only ‘subsets’ of the range of situations within a habitat, to suit their
biological needs (Parris and McCarthy, 1999). These subsets within the total area available are
termed ‘microhabitats’ and are simply the specific locations where individuals may be found.
Understanding microhabitat selection by amphibians allows researchers to have a greater
understanding of how amphibians may respond to habitat modification (Fischer, Lindenmayer
and Cowling, 2003). This is a key concern in the conservation of amphibians as habitat
modification is one of the major threats to global amphibian populations (Zimmerman and
Bierregaard, 1986; Sih et al., 2000; Hero and Morrison, 2004).
Several studies indicate shelter or retreat site selection by anurans is largely influenced by the
quality of the microhabitat (Townsend, 1989; Ovaska, 1991). One of the main factors selected
for is the amount of moisture in the microhabitat (Stewart, 1985; Townsend, 1989; Schwarzkopf
and Alford, 1996; Smith et al., 2003). The microclimate of retreat sites is in turn affected by
structural complexity of the habitat, in particular density of the canopy and the under-storey
vegetation (Gregory, 1983; Parris, 2004). Favourable habitat and microhabitat selection allows
anurans to thermoregulate within optimal temperature ranges (Beebee, 1996).
Microhabitat selection may differ between age/size classes and sexes (Stewart, 1985; Townsend,
1989; Inger, 1994a; Beard et al., 2003). Adult frogs may select microhabitats based on different
prerequisite features to juveniles and metamorphs/hatchlings (Stewart, 1985; Beard,
McCullough, and Eschtruth, 2003). Females tend to be the larger sex among frog species, and
because of their larger size, they may require different microhabitats. Microhabitat selection will

32
also differ between nocturnal activity and diurnal retreat sites (Stewart, 1985). A study of anuran
microhabitat selection must take into account the type of activity being conducted by the species
during surveys (Gillespie et al., 2004). Foraging, reproduction, and retreat for thermoregulatory
and defence purposes are the main reasons for microhabitat selection by amphibians.
Microhabitat studies generally tend to be descriptive in nature (Beard et al., 2003), but more
researchers are attempting to quantify selection by measuring variables such as the height of a
perch above ground, the distance from a water body, and the angle of the perch site (Retallick,
Hero and Alford, 1997). Environmental characteristics such as the features of the stream or
water body (e.g. velocity, depth, and width), riparian vegetation present, leaf litter, and substrate
should also be recorded (Retallick et al., 1997; Gillespie et al., 2004). Since the publication of
Heyer et al. (1994), there has been a standard set of variables used in the description of
microhabitats. Vegetation, horizontal position, vertical position, and substrate are the main
characteristics used for amphibian studies (Inger in Heyer et al., 1994).
This chapter looks at the microhabitat selection of Fiji tree frogs along two permanent transects
on Vago Creek in the Savura area near Suva, Viti Levu, over a 12-month period. I investigated
whether characteristics of the perch site (substrate and height above ground) and proximity to
streams affected perch site selection of tree frogs.
3.2 METHODS
3.2.1 Data collection: permanent transect surveys
A 200m permanent transect line was set up and marked out using rope and flagging tape, along a
major stream where tree frog activity had been previously observed (Morrison, pers. comm.,
2004). A second parallel transect line of the same length was marked out in the rainforest
33
adjacent to the stream using flagging tape and nylon rope, with a 10m buffer zone between the
two transects. The buffer zone was not too wide so that confounding environmental variables
might prevent comparisons between results from the two transects, but was wide enough to
prevent the mixing of individuals sampled on either transect. The research team surveyed both
sides of the 200m transects within a 5m strip along the transect line. The transect surveys were
conducted twice monthly, at the beginning and end of each sampling week.
Frogs were located and processed as described in the Chapter 2. The microhabitat information
recorded for each captured frog included: vegetation/substrate (plant species where possible),
horizontal position (distance from nearest stream), vertical position (position and height above
ground on flora) (Inger in Heyer et al., 1994). Logistical difficulties prevented the samplers
from measuring the actual perch height of each captured frog and its distance from the stream.
3.2.2 Microhabitats occupied in different habitats
Twelve sites in each of the three different habitat types were surveyed over a twelve-month
period (one site per habitat each month). Two-hour nocturnal surveys were conducted along a
stream at each site, as described in Chapter 2. Captured frogs were placed in plastic bags for
processing. All captured individuals were weighed, and their SUL and TL measured.
Individuals were sexed, where possible, using indicators like weight and SUL, the
presence/absence of a yellow groin flash, and the presence/absence of egg masses (Chapter 2).
The microhabitat variables investigated were the same as in Section 3.2.1.
34
3.2.3 Data collation
Microhabitat data from the habitat surveys and the permanent transects was collated separately,
because the methods differed slightly between the habitat surveys and transect surveys. Perch
height, substrate, and distance from the nearby stream for each frog captured in the habitat
surveys were recorded. Perch height, substrate, and distance from stream was also recorded in
the transect surveys, along with the numbers of frogs found along the two transects.
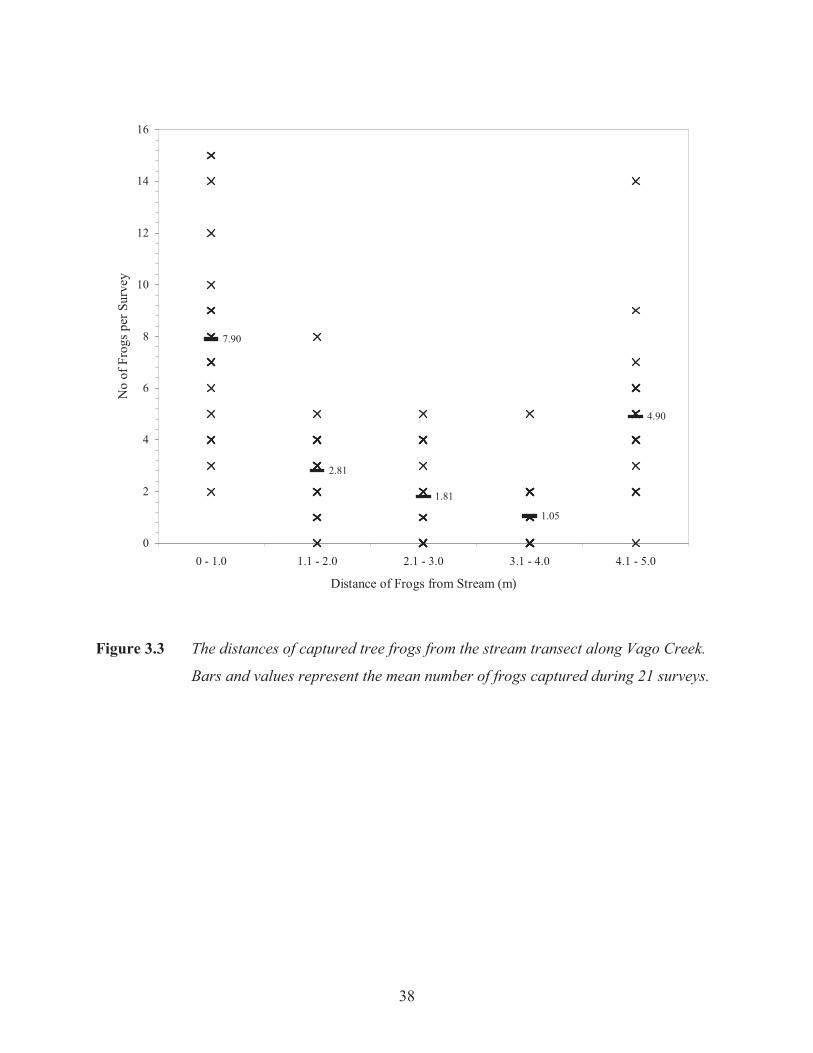
3.2.4 Data analysis
The microhabitats of frogs captured along the two permanent transects were analysed separately
from the habitat survey data. The following variables from the transect data were analysed using
single-factor ANOVAs: the estimated heights above ground (perch heights), the estimated
distances from the stream (only for frog records from the stream transect), and the nature of the
substrate of the perch site. Two-way ANOVAs were used to determine the significance of
habitat type with the three variables above. The abundance of frogs along the stream and land
transect were compared using a paired t-test to determine selectivity for streamside
microhabitats.
3.3 RESULTS
3.3.1 Microhabitat selection along the permanent transects
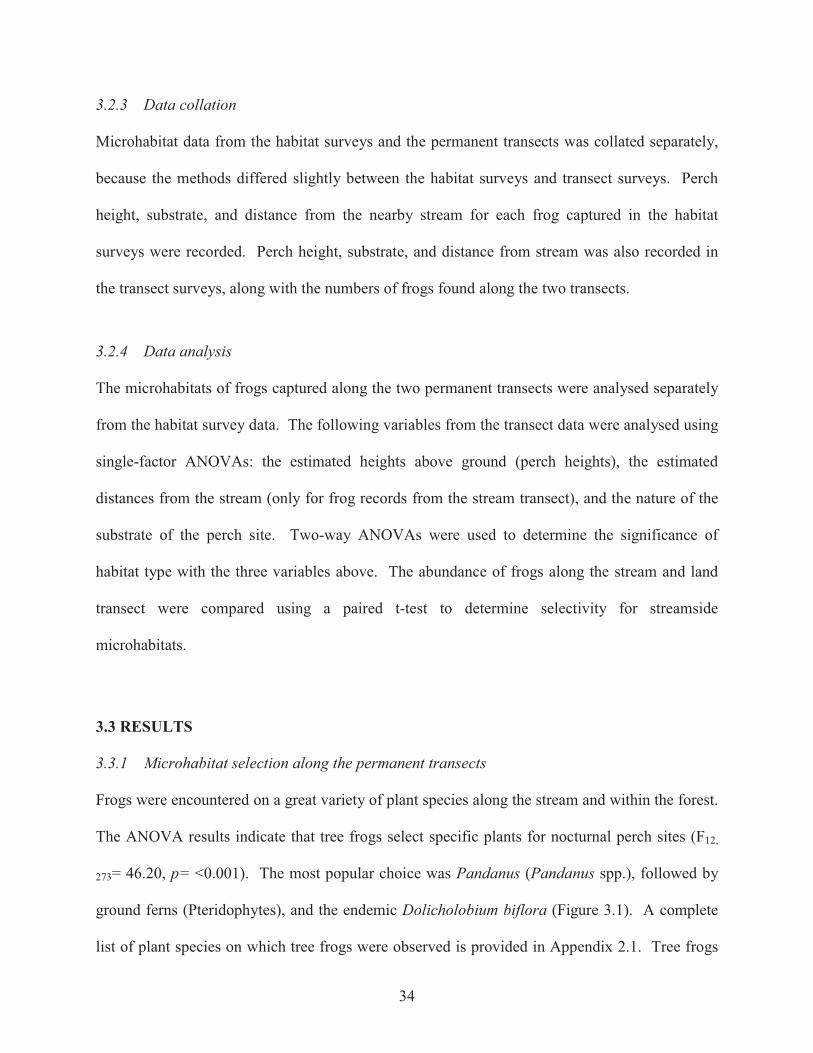
Frogs were encountered on a great variety of plant species along the stream and within the forest.
The ANOVA results indicate that tree frogs select specific plants for nocturnal perch sites (F12,
273= 46.20, p= <0.001). The most popular choice was Pandanus (Pandanus spp.), followed by
ground ferns (Pteridophytes), and the endemic Dolicholobium biflora (Figure 3.1). A complete
list of plant species on which tree frogs were observed is provided in Appendix 2.1. Tree frogs

35
were commonly found on the leaves of the vegetation, but on Syzygium seemannii and Ficus
bambusifolia, they were always perched on the branches.
S. seemannii and F. bambusifolia were adjacent to the stream and larger frogs were often
observed in these plants, as their dense tangle of branches was ideal foraging sites for the frogs.
Most tree frogs along the Vago transects inhabited perch sites from 0-150 cm above the ground
(F9, 210= 36.493, p= >0.001; Figure 3.2). The significant result of perch heights may also be due
to the significant effect of the plant substrate. As Pandanus plants were the most common
substrate choice for frog perches, tree frogs were more likely to be perched at heights of 1-150
cm above the ground on these shrubs.
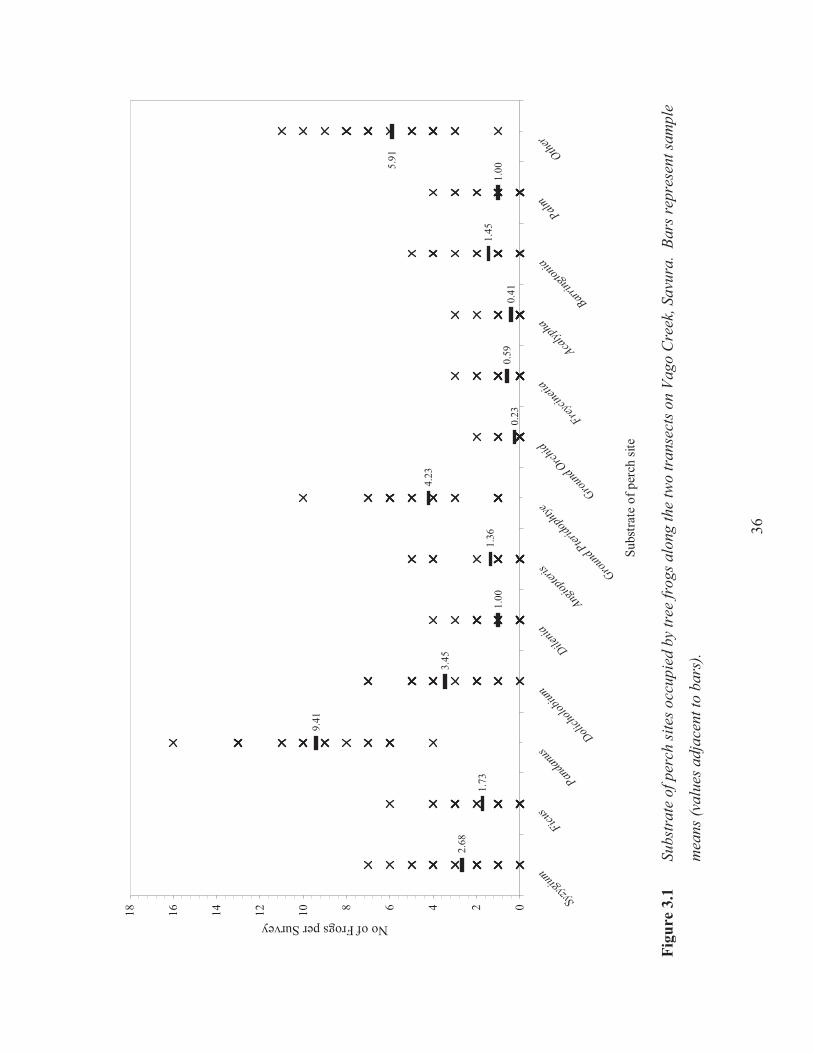
Most frogs were found within two metres of the stream (F4, 100= 26.23, p= >0.001). However,
many frogs were captured between four and five metres from the stream (Figure 3.3). The
results of the individual ANOVAs (Table 3.1) for all three microhabitat variables indicate that
tree frogs select perches on certain plant species, close to the ground, and within a few metres
from a stream.
36
2.68
1.73
9.41
3.45
1.00
1.36
4.23
0.23
0.59
0.41
1.45
1.005.
91
024681012141618
Syzyg
ium
Ficus
Panda
nus
Dolich
olobiu
m
Dilenia
Angiop
teris Grou
nd Pter
idoph
tyeGrou
nd O
rchid
Freycin
etia
Acalyp
ha
Barring
tonia
Palm
Other
Subs
trate
of p
erch
site
No of Frogs per Survey
Figu
re 3
.1
Subs
trat
e of
per
ch si
tes o
ccup
ied
by tr
ee fr
ogs a
long
the
two
tran
sect
s on
Vago
Cre
ek, S
avur
a. B
ars r
epre
sent
sam
ple
mea
ns (v
alue
s adj
acen
t to
bars
).

37
6.05
9.36
10.86
3.73
2.05
0.50 0.59 0.05 0.09 0.090
2
4
6
8
10
12
14
16
18
20
22
0-50 50-100 100-150 150-200 200-250 250-300 300-350 350-400 400-450 450+
Perch Heights of Frogs (cm)
No
of F
rogs
per
Sur
vey
Figure 3.2 Number of tree frogs encountered at different perch heights along both fixed
transects, Vago Creek, Savura. Bars and values represent mean number of frogs
at each height.
38
7.90
2.81
1.81
1.05
4.90
0
2
4
6
8
10
12
14
16
0 - 1.0 1.1 - 2.0 2.1 - 3.0 3.1 - 4.0 4.1 - 5.0
Distance of Frogs from Stream (m)
No
of F
rogs
per
Sur
vey
Figure 3.3 The distances of captured tree frogs from the stream transect along Vago Creek.
Bars and values represent the mean number of frogs captured during 21 surveys.
39
Table 3.1 Results of Univariate ANOVAs on Microhabitat Data from the Transects.
ANOVA Source of Variation SS df MS F P-value F crit Substrate of microhabitat Between Groups 1845.322 12 153.777 46.202 <0.001 1.788 Within Groups 908.636 273 3.328 Total 2753.958 285
Estimated Perch Heights Between Groups 669.109 9 74.345 36.493 <0.001 1.925 Within Groups 427.818 210 2.037 Total 1096.927 219
Estimated Distances to the stream Between Groups 641.200 4 160.300 26.234 <0.001 2.463 Within Groups 611.048 100 6.110 Total 1252.248 104

40
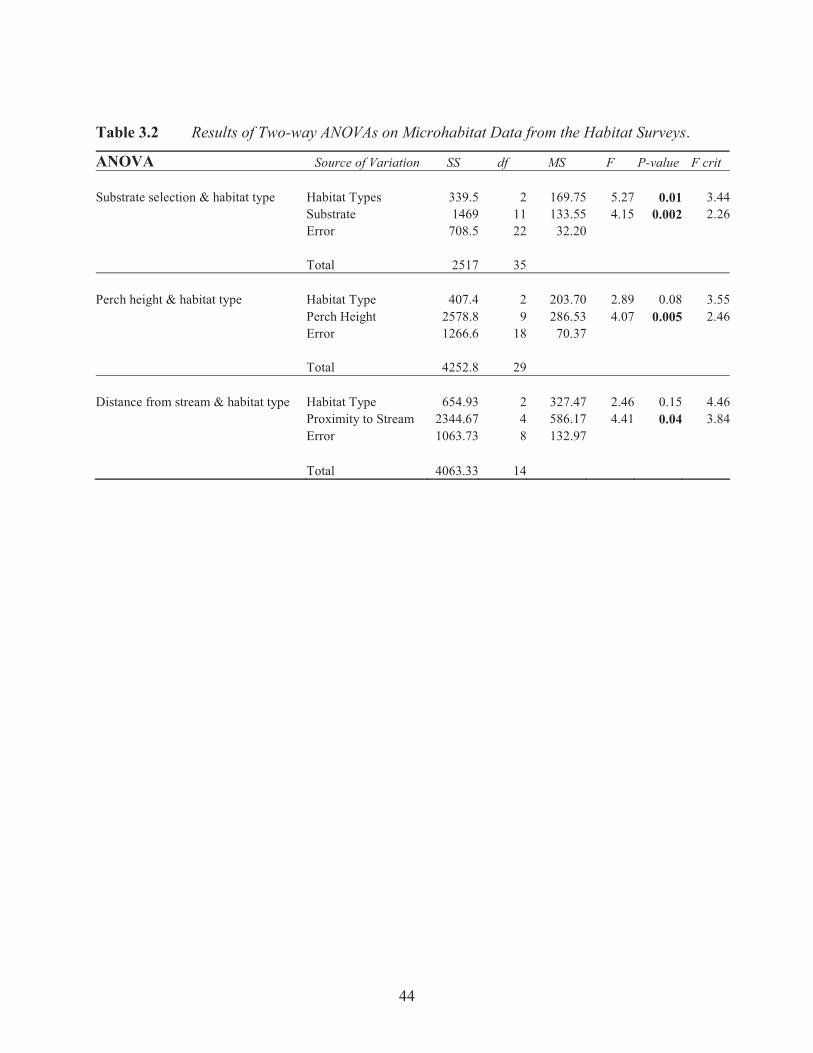
3.3.2 Microhabitat selection within the three major habitats
In the three different habitats surveyed, Pandanus and Dolicholobium were the main plant
species on which tree frogs were found, followed closely by the ground ferns (Figure 3.4). Tree
frogs in the three habitats significantly selected plant species as perch sites (F2, 11= 4.15, p=
0.002). Plant substrate appears to be a significant microhabitat variable within the three habitat
types investigated (F2, 11= 5.27, p= 0.01). Pandanus are a common species in the lowland
rainforests in Fiji, however these plants tend to form patchy distributions and are not dominant
shrubs in the Savura and Vago Reserves (Keppel et al., 2005).
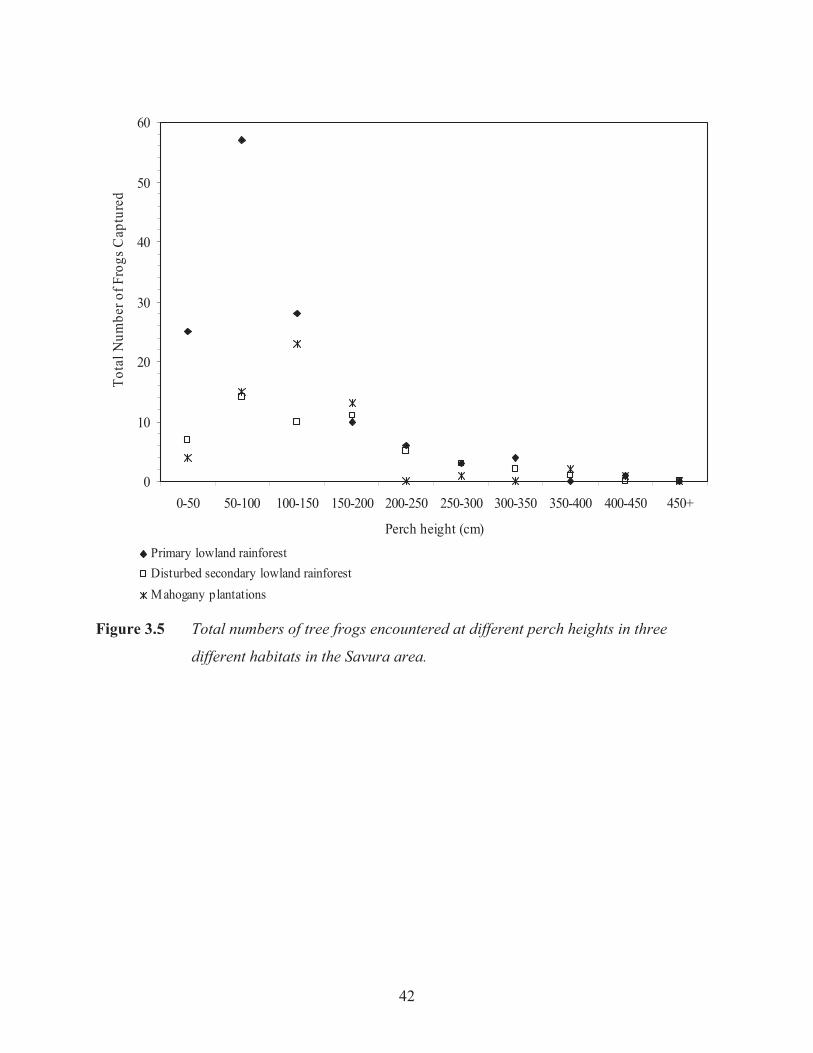
Tree frogs in the habitat surveys were predominantly perched above the ground between 0-150
cm (F2, 9= 4.07, p= 0.005; Figure 3.5). The majority of tree frogs were encountered less than
two metres from a stream (F2, 4= 4.41, p= 0.04; Figure 3.6). There was no relationship between
perch heights and proximity of the perch site to a stream, and habitat type (Table 3.2).
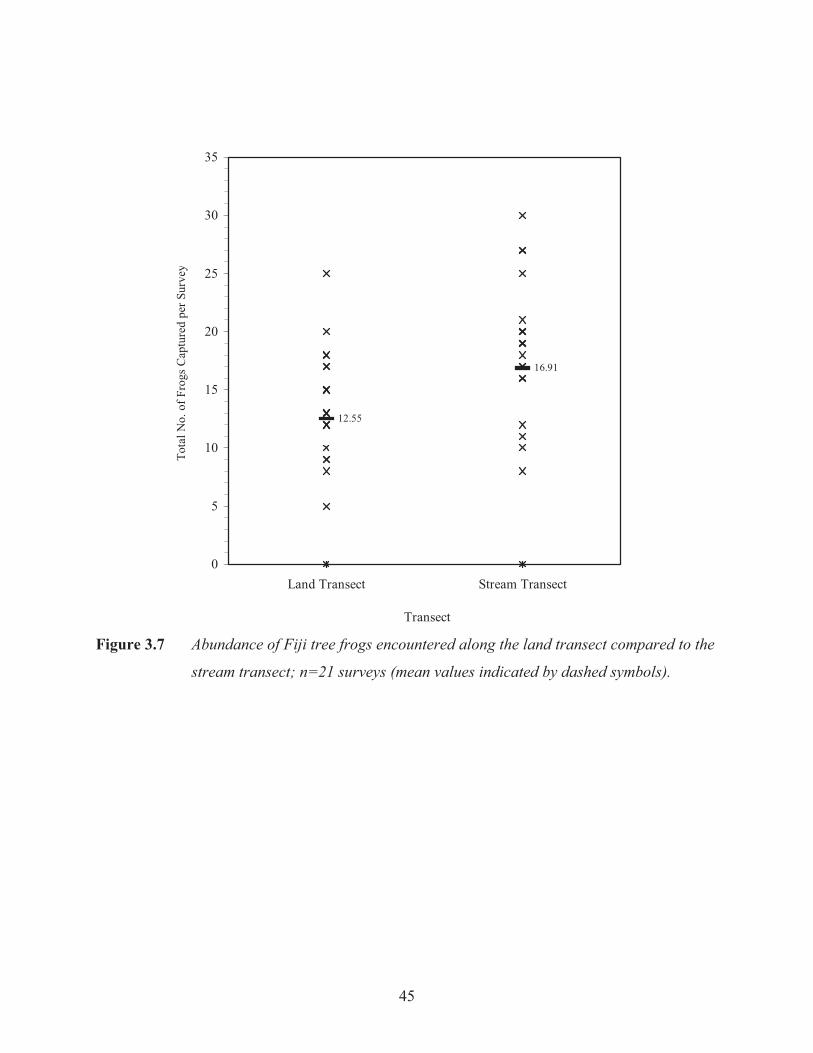
3.3.3 Comparison between frog activity along the stream and land transects
The number of frogs encountered along the stream each night were significantly greater than the
number of frogs encountered along the land transect with a total of 372 frogs captured (excluding
recaptured individuals) along the stream compared to 276 along the land transect (t21= 3.15, p=
0.002; Figure 3.7).

41
0
5
10
15
20
25
30
35
40
45
50
55
60
Syzygi
um Ficus
Panda
nus
Dolich
olobiu
mDile
nia
Angiop
teris
Ground
Pterido
phtye
Ground
Orch
id
Common
Lily
Chamiss
onis
Freycin
etia
Other
Microhabitat vegetation
Tota
l Num
ber o
f Fro
gs E
ncou
nter
ed in
Mic
roha
bita
t
Mahogany plantations
Disturbed secondary lowland rainforest
Primary lowland rainforest
Figure 3.4 Vegetation utilised by tree frogs as perch sites along streams in the three major
habitats. A total of eight plant species that were uncommonly used as perch sites
are lumped in the “other” category.
42
0
10
20
30
40
50
60
0-50 50-100 100-150 150-200 200-250 250-300 300-350 350-400 400-450 450+
Perch height (cm)
Tota
l Num
ber o
f Fro
gs C
aptu
red
Primary lowland rainforestDisturbed secondary lowland rainforestMahogany plantations
Figure 3.5 Total numbers of tree frogs encountered at different perch heights in three
different habitats in the Savura area.

43
0
10
20
30
40
50
60
70
80
0 - 1.0 1.1 - 2.0 2.1 - 3.0 3.1 - 4.0 4.1 - 5.0
Estimated distance from stream (m)
Tota
l Num
ber o
f Fro
gs C
aptu
red
Primary lowland rainforest
Disturbed secondary lowland rainforest
Mahogany plantations
Figure 3.6 Estimated distances of tree frogs (to nearby streams) captured in three different
habitats in the Savura area.
44
Table 3.2 Results of Two-way ANOVAs on Microhabitat Data from the Habitat Surveys.
ANOVA Source of Variation SS df MS F P-value F crit
Substrate selection & habitat type Habitat Types 339.5 2 169.75 5.27 0.01 3.44 Substrate 1469 11 133.55 4.15 0.002 2.26 Error 708.5 22 32.20 Total 2517 35
Perch height & habitat type Habitat Type 407.4 2 203.70 2.89 0.08 3.55 Perch Height 2578.8 9 286.53 4.07 0.005 2.46 Error 1266.6 18 70.37 Total 4252.8 29
Distance from stream & habitat type Habitat Type 654.93 2 327.47 2.46 0.15 4.46 Proximity to Stream 2344.67 4 586.17 4.41 0.04 3.84 Error 1063.73 8 132.97 Total 4063.33 14
45
12.55
16.91
0
5
10
15
20
25
30
35
Land Transect Stream Transect
Transect
Tota
l No.
of F
rogs
Cap
ture
d pe
r Sur
vey
Figure 3.7 Abundance of Fiji tree frogs encountered along the land transect compared to the
stream transect; n=21 surveys (mean values indicated by dashed symbols).

46
3.4 DISCUSSION
The rainforests and secondary forests of the Savura area are very biodiverse habitats and tree
frogs have a wide range of plants to select from for perch sites. However, the tree frogs surveyed
in the three habitats and along the transects were often found on certain vegetation. Tree frogs
appear to be mostly found on Pandanus spp. along streams and in flat marshy areas. Similar
results were previously reported by Gorham (1968), Pernetta and Goldman (1977), and Ryan
(1984). Most of the frogs in this and previous studies were found in the base of the Pandanus
leaf axil, which collects leaf litter and rainwater. Besides Pandanus spp. these included low-
lying ferns and aroids (Alocasia indica), and shrubs (Dilenia biflora, Ficus bambusifolia and
Syzygium seemanii).
In several cases, we found tree frogs on the leaves of creeping epiphytes wound around the
trunks of larger trees (e.g. Derris elliptica). A similar association with specific plant species has
also been indicated for coqui frogs, Eleutherodactylus coqui (Beard et al., 2003). Ficus and
Syzygium flower between December and January, attracting many flying insects during this time,
which we observed attracted many tree frogs.
Individual frogs were generally found between 0–150 cm above the ground during our surveys.
This may be due to sampling bias, i.e.: the sampling team was more likely to see and capture tree
frogs from perch sites between 0-150 cm (body level). Frogs were found perched on vegetation,
except on one occasion where a frog was perched on a rock beside the stream transect.
Generally only one individual was found on each plant, however, on occasion several frogs were
observed on the same plant. These were commonly metamorphs and hatchlings on Pandanus.
Frogs of different age/gender classes may select different plant species and perch heights (Beard
47
et al., 2003). On one occasion a large female and smaller male were captured from the same
plant but at different locations.
Tree frogs showed a strong affinity for streamside sites as most frogs were found within two
metres of the stream in all habitats and along the stream transect. This may be due to the greater
abundance of flying insects in the open space of the riparian strip (Olson, pers. comm., 2002),
where there would be a higher rate of feeding success during nocturnal foraging. As more frogs
on average were recorded along the stream transect than the land transect, Fiji tree frogs appear
to select nocturnal perch sites along forest streams for foraging.
The result that most tree frogs were captured near the stream may also be due to the experimental
design, as the principal researcher and another member of the team searched on either side of the
stream, while a third member searched between three to five metres from the stream.
The possible effect of the sampler bias can be seen in Figure 3.3. However, sampling was
limited by the steep terrain along the stream transect. The left bank (downstream direction) was
steeper with a narrower terrace (mostly bedrock with vegetation growing on the rock). The right
bank was mostly flat with a wider river terrace on which we set up the parallel land transect.
During periods of heavy rainfall, tree frogs may abandon nocturnal streamside activity in favour
of safer perch sites underneath the canopy of the forest (Chapter 4). The influence of weather on
perch and retreat sites of anurans has been reported previously (Ritke and Babb, 1991). Rainfall
was the most significant variable in determining tree frog activity along the transects (refer to
Chapter 4). Rainfall patterns have been found to influence the microclimates of diurnal retreats
and nocturnal perch sites of tree frogs by affecting the moisture levels in leaf litter and the
moisture present on vegetation surfaces (Kam and Chen, 2000). As moisture levels in their
48
environment affect skin-surface respiration (Zug, 1993; Beebee, 1996), it is likely that tree frogs
select arboreal sites that retain some tree-flow (rainfall that is intercepted by vegetation).
Pandanus, Dilenia, and Dolicholobium are good examples of plants that retain tree-flow in leaf
litter, axils, sheathed petioles, and on their leaves.
Feeding in more exposed perch sites increases the likelihood of predation, but no large predators
were observed at the study site with the exception of three rats (Rattus spp.). Only one cane toad
was observed in the first three months of the survey, but no toads were ever observed thereafter.
The only forms of predation observed firsthand were smaller frogs being eaten by larger females,
and the lone record of a spider (Heteropoda sp.) on top of a metamorph-sized tree frog, which
was wound up tightly in web silk. It appeared to be injecting digestive fluids or ingesting
already pre-digested fluids from the dead frog. Ryan (1984) mentions spiders as possible
predators of small P. vitiensis but did not provide any evidence of predation events.
Aichinger (1987) observed that the abundance of large spiders increased with greater anuran
activity during the breeding season. We also noted an increase in the number of spiders over the
last few months of the study (May to August), however, this occurred during the dry season in
contrast with Aichinger’s study.
3.5 SUMMARY
Fiji tree frogs, like other arboreal anurans, were found in microhabitats with specific structural
and ecological features, particularly height above ground and substrate of the perch site. Another
important spatial variable that appears to influence Fiji tree frog activity is proximity to a stream
channel. These features affect the microclimate of the perch site, in particular temperature and

49
moisture, which are factors that directly affect frog activity. Fiji tree frogs were most commonly
found on Pandanus leaves and ferns, as well as the broad-leaved D. biflora. The frogs were
often found on riparian vegetation, and may prefer perch sites near the stream for foraging. It is
speculated that increased risk of desiccation on windy nights with low humidity and cool
temperatures, or increased risk of mortality on nights with heavy rainfall and high stream levels
may result in the frogs abandoning these perch sites.

50
Chapter 4 Phenology of Platymantis vitiensis along Vago Creek over a one-year period.
4.1 INTRODUCTION
The long-term conservation and monitoring of amphibians is dependant on various resources
available to project managers. Arguably the most important information necessary for an
effective monitoring programme is the population dynamics of the species of concern (Biek et
al., 2002). Although, it is thought that Fiji tree frogs breed year round with the majority of
breeding activity between December and March (Gibbons and Guinea, 1983; Ryan, 1984;
Morrison, 2003), the literature to date has largely been based on short-term non-systematic
survey data. Globally, the current understanding of amphibian population dynamics is a result of
long-term phenological studies with a minimum of a twelve-month survey period (Gill, 1985;
Crump and Pounds, 1989; Caetano and Leclair, 1999).
Tree frog reproduction is thought to peak between late February and early March as with the
ground frog but this has yet to be confirmed (Morrison, 2003). Clutches of 13-30 eggs (about 7-
9mm in diameter) have been commonly recorded in the axils of Pandanus plants, where
rainwater and dew collects (Ryan, 1984). Hatchlings leave their egg cases approximately 30
days later following development nourished by large yolk sacs (Gibbons and Guinea, 1983). The
metamorphs usually remain dark brown in colour over the first few weeks (Ryan, 2000) and then
their skin colour begins to lighten and show distinctive skin patterns and colouration. Once
sufficiently developed, metamorphs are active and often found in the safety of Pandanus axils.
Laboratory work with captive individuals and audio-spectrographic analysis confirmed that both
sexes call, a rare phenomenon in anurans (Boistel and Sueur, 1997). The male call is more
vocally complex than the female call, which is thought to be a courtship or ‘advertisement’ call.
51
The frequency of calling behaviour may increase during the breeding season (Morrison, pers.
comm., 2004), with female tree frogs calling in the three months prior to breeding (Boistel and
Sueur, 1997). Calling activity varies in different habitats due to the structure and composition of
the biotic environment (Morton, 1975; Duellman and Pyles, 1983; Brown and Rose, 1988), as
tropical rainforest species have to contend with dense vegetation when calling.
The majority of studies have demonstrated that peaks in amphibian breeding activity occur
during the wetter part of the year in the tropics (Aichinger, 1987; Crump and Pounds, 1989;
Gottsberger and Gruber, 2004). Periodic changes in rainfall appear to be the main weather
variable correlated with reproductive phenology (Church, 1961). However, weather variables
are not always the most influential factors determining anuran breeding. Frog phenology in
Central and South America has recently been linked to episodic fluctuations in the availability of
insect prey (Watling and Donnelly, 2002).
This chapter investigates the phenology of a sub-population of P. vitiensis in the primary
rainforest of Vago Reserve, Savura. Monthly survey data along two permanent transects (a
stream and a parallel land transect) were analysed to identify changes in the abundance of tree
frogs over twelve months. The influence of major weather variables on the phenology of this
sub-population was also determined to account for differences in activity during the study period.
4.2 METHODS
4.2.1 Study Site
Two 200 m parallel transects were set up along Vago Creek, within a narrow stream valley with
steep slopes incised by the stream into the volcanic bedrock (Figure 4.1). The site was between

52
20-60 m in elevation. The riparian vegetation grades into primary lowland slope rainforest.
Vago Creek is a fast flowing stream about five metres wide in its mid-section, and ten metres
wide near the confluence with Savura Creek. The levee is narrow, widening out near the
confluence. The transects were located in one habitat type only to prevent the bias of differential
calling activity that occurs in different habitat types.
4.2.2 Data from Site and Captured Individuals
The transects were surveyed twice a month in alternating order to reduce sampling bias. Surveys
were conducted between 1930 and 0100 hours, with an average transect duration of 1 hour and
41 minutes. Air and stream temperatures were measured on site each night with a pocket alcohol
thermometer. Rainfall data was obtained from the Fiji Meteorological Service’s Laucala Bay
station, which is recorded at 2100 hours daily. The capture and processing of Fiji tree frogs
included weighing captured frogs, measuring SUL and TL, sexing/aging individuals (based on
criteria in Table 4.1), and noting microhabitat. Captured frogs were toe-clipped using monthly
codes to identify recaptured individuals (Table 4.2).
53
Figure 4.1 Schematic diagram depicting the layout of the permanent parallel land and
stream transects along a mid-highland section of Vago Creek, Savura.

54
Table 4.1 Field Classification System for Identifying Age/Size of Captured Frogs.
Category Weight (g) Snout-Urostyle Length (mm)
Hatchlings 0 – 0.3 9.0 – 13.9 Metamorphs 0.5 – 0.9 14.0 – 19.9 Juveniles 1.0 – 1.5 20.0 – 29.9 Adults 1.6 – 3.9 30.0 – 60.0 Gravid females Identified by white egg mass visible through abdominal skin
Table 4.2 Toe-clipping Codes for Identifying Recaptured Frogs.
Month Toe Code Description September L3 Third toe on left foot October L4 Fourth toe on left foot November L5 Fifth toe on left foot December R1 First toe on right foot January R2 Second toe on right foot February R3 Third toe on right foot March R4 Fourth toe on right foot April R5 Fifth toe on right foot May L1 First toe on left foot June L2 First toe on left foot July L3R1 Third toe on left foot, first toe on right foot August L3R2 Third toe on left foot, second toe on right foot

55
4.2.3 Data Analysis
Changes in the abundance of adults, juveniles and metamorphs/hatchlings over the 12-month
study period were graphed and described. Due to the difficulty of clearly separating larger adult
males and younger adult females in the field, adult male and female (non-gravid and gravid)
abundances are combined, as were hatchlings and metamorphs. The influence of air temperature
(�C) and 24-hour rainfall (mm) on the abundances of the three age categories (adults, juveniles
and metamorphs/hatchlings) and gravid females were investigated using separate regression
analyses for each age/sex class. Frog abundances and average rainfall values were log-
transformed (log n + 1 for gravid females and rainfall, log n for adults, juveniles and
metamorphs/hatchlings) for the regressions. ANCOVA analyses were used to determine the
relationship between log-transformed abundances of the four age/sex classes along the two
transects (stream/land), with significant weather variables (from the regressions) as covariates.
To provide an independent test of the relationship between significant weather variables and frog
abundances in the different age classes, the phenology of the broad scale data (Chapter 2) was
examined using similar analyses as above. Regressions of weather data on the log-transformed
abundances of the four age/sex classes from all the habitats were performed. ANCOVA analyses
were used to determine the relationship between log-transformed abundances of the four age/sex
classes in the three habitats, with significant weather variables (to each age/sex class) as
covariate measures.
56
4.3 RESULTS
4.3.1 Phenology of the Fiji tree frog population along Vago Creek
The abundance of adults captured along the transects peaked from September to November 2004,
then decreased from December 2004 to February 2005 (Figure 4.2). Between February and
April 2005 abundance of adults fluctuated, having a noticeable relationship with high rainfall on
the sampling days in February (104 mm) and April (16.8 mm). From May to August 2005, the
abundance of captured adults declined, a period during which rainfall on the sampling days was
low (0-2 mm).
Gravid female abundance increased at the onset of the wet season and peaked in December,
followed by a decline throughout the rest of the wet season till March. There were no gravid
frogs recorded for the last four months of the survey period, from April to July of 2005,
coinciding with the beginning and first three months of the dry season (Figure 4.3).
The abundance of metamorph/hatchling tree frogs was greatest during the dry season months of
May to August 2005 (Figure 4.2). Hatchlings and metamorphs declined in abundance from
October 2004 to February 2005. The lowest number of metamorphs/hatchlings (four
individuals) was recorded in April 2005.
In contrast to metamorph activity, juvenile P. vitiensis abundance peaked during November 2004
and January 2005 (Figure 4.2). This may indicate a period of juvenile recruitment over these
months, as the abundances of juvenile frogs generally remained constant throughout the twelve-
month survey.

57
Only two egg clutches were recorded in the twelve months of surveying in this study. The first
clutch of 18 eggs was recorded in September 2004, in a Pandanus axil at a height of 0.6 metres
above the ground. The second clutch (about 10 eggs) was recorded in January 2005 at a height
of about 1.5 m in the leaf litter at the base of branches of a Crossostylus seemannii sapling. The
lack of clutch data made it impossible to use this information in the phenological analysis.
However, it is notable that one egg clutch was recorded towards the end of the dry season and
the other was recorded mid-wet season. These observations support previous work, which
suggests that Fiji tree frogs breed year round (Ryan, 1984).
4.3.2 Influence of Weather Factors: Rainfall and Temperature
Rainfall had a significantly negative effect (t2, 21= -3.39, p= 0.003) on transformed adult
abundance (Figure 4.4). Two peaks in the amount of rainfall occurred, in February and April
2005. These two peaks coincided with low frog abundance along the stream and land transects
in those months, 25 and 27 frogs respectively (Figure 4.2). April was the wettest month over the
12-month survey period, with a total of 470.1 mm. The wettest period was from October 2004 to
May 2005. It should be noted that the rainfall data was recorded at a meteorological station
about 10km from the survey site, and microhabitat variations in rainfall may affect the analysis.
The lowest number of adult frogs and metamorphs/hatchlings observed, coincided with the
heaviest 24-hour rainfall events (Figure 4.2). In contrast, juvenile frog abundance peaked during
the wetter months of November to January. Metamorphs/hatchlings were most abundant during
the dry season (May to September), which is probably due to the recent hatching of eggs in the
latter months of the wet season. Metamorphs/hatchlings were also significantly correlated with
rainfall (t2, 21= -2.06, p= 0.05) over the twelve months (Figure 4.5).
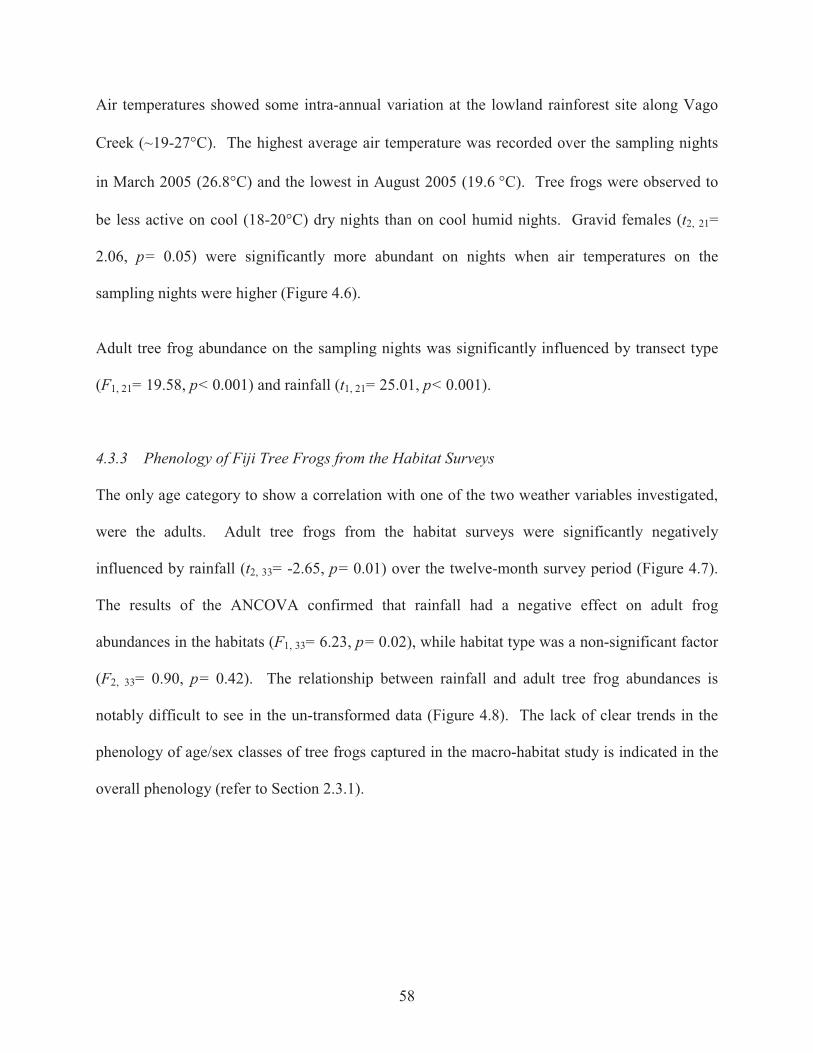
58
Air temperatures showed some intra-annual variation at the lowland rainforest site along Vago
Creek (~19-27°C). The highest average air temperature was recorded over the sampling nights
in March 2005 (26.8°C) and the lowest in August 2005 (19.6 °C). Tree frogs were observed to
be less active on cool (18-20°C) dry nights than on cool humid nights. Gravid females (t2, 21=
2.06, p= 0.05) were significantly more abundant on nights when air temperatures on the
sampling nights were higher (Figure 4.6).
Adult tree frog abundance on the sampling nights was significantly influenced by transect type
(F1, 21= 19.58, p< 0.001) and rainfall (t1, 21= 25.01, p< 0.001).
4.3.3 Phenology of Fiji Tree Frogs from the Habitat Surveys
The only age category to show a correlation with one of the two weather variables investigated,
were the adults. Adult tree frogs from the habitat surveys were significantly negatively
influenced by rainfall (t2, 33= -2.65, p= 0.01) over the twelve-month survey period (Figure 4.7).
The results of the ANCOVA confirmed that rainfall had a negative effect on adult frog
abundances in the habitats (F1, 33= 6.23, p= 0.02), while habitat type was a non-significant factor
(F2, 33= 0.90, p= 0.42). The relationship between rainfall and adult tree frog abundances is
notably difficult to see in the un-transformed data (Figure 4.8). The lack of clear trends in the
phenology of age/sex classes of tree frogs captured in the macro-habitat study is indicated in the
overall phenology (refer to Section 2.3.1).

59
Figure 4.2 The abundances of the age classes from the fixed transects over the 12-month
period, graphed against average rainfall (mm) and air temperatures (�C) on the
sampling nights.
0
10
20
30
Tota
l num
ber o
f fro
gs
0
10
20
30
40
50
Tota
l num
ber o
f fro
gs
0
10
20
30
40
50
60
Tota
l num
ber o
f fro
gs
0
20
40
60
80
100
120
Sep-04
Oct-04
Nov-04
Dec-04
Jan-05
Feb-05
Mar-05
Apr-05
May-05
Jun-05
Jul-05 Aug-05
Month
Ave
rage
rain
fall
(mm
)
0
5
10
15
20
25
30 Average air tem
perature (C)
RainfallAir temp
Adults
Juveniles
Metamorphs

60
Figure 4.3 Abundance of gravid females captured along the both land and stream transects
over the 12-month survey period, graphed against average rainfall (mm) of the
sampling days.
0.0
20.0
40.0
60.0
80.0
100.0
120.0A
vera
ge ra
infa
ll (m
m)
0
2
4
6
8
Sep-04 Oct-04 Nov-04 Dec-04 Jan-05 Feb-05 Mar-05 Apr-05 May-05 Jun-05 Jul-05 Aug-05
Month
Num
ber o
f gra
vid
fem
ales
cap
ture
d
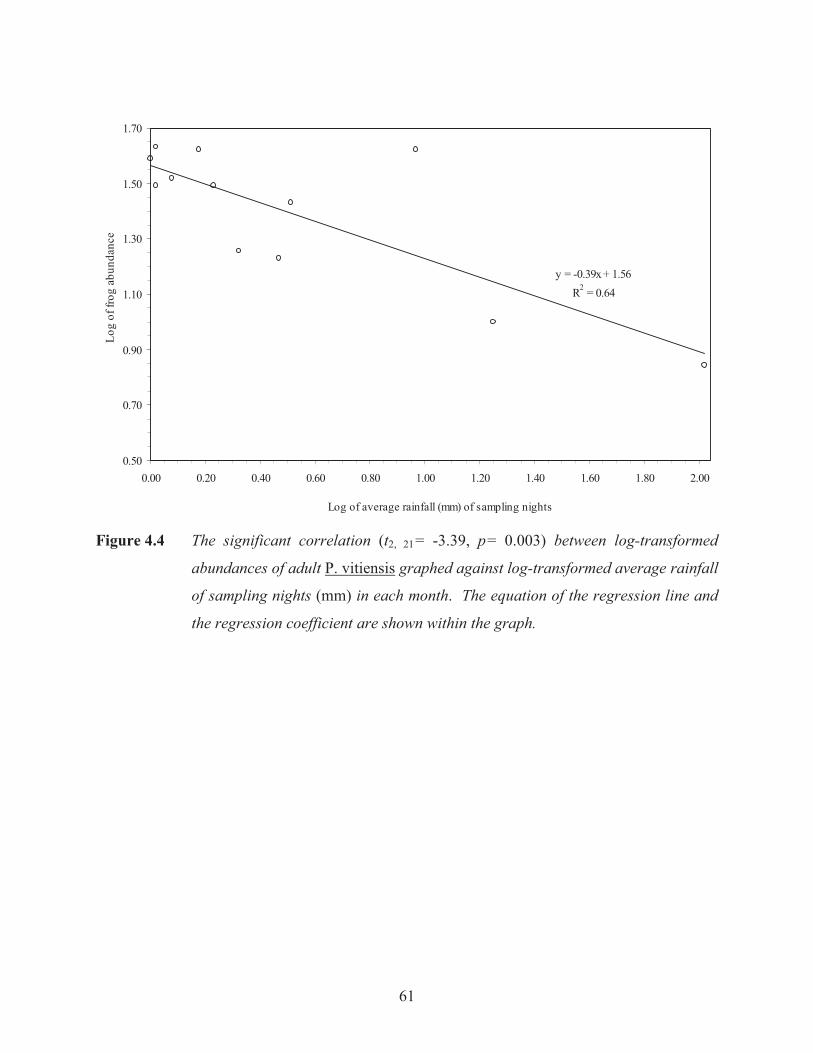
61
y = -0.39x + 1.56R2 = 0.64
0.50
0.70
0.90
1.10
1.30
1.50
1.70
0.00 0.20 0.40 0.60 0.80 1.00 1.20 1.40 1.60 1.80 2.00
Log of average rainfall (mm) of sampling nights
Log
of fr
og a
bund
ance
Figure 4.4 The significant correlation (t2, 21= -3.39, p= 0.003) between log-transformed
abundances of adult P. vitiensis graphed against log-transformed average rainfall
of sampling nights (mm) in each month. The equation of the regression line and
the regression coefficient are shown within the graph.
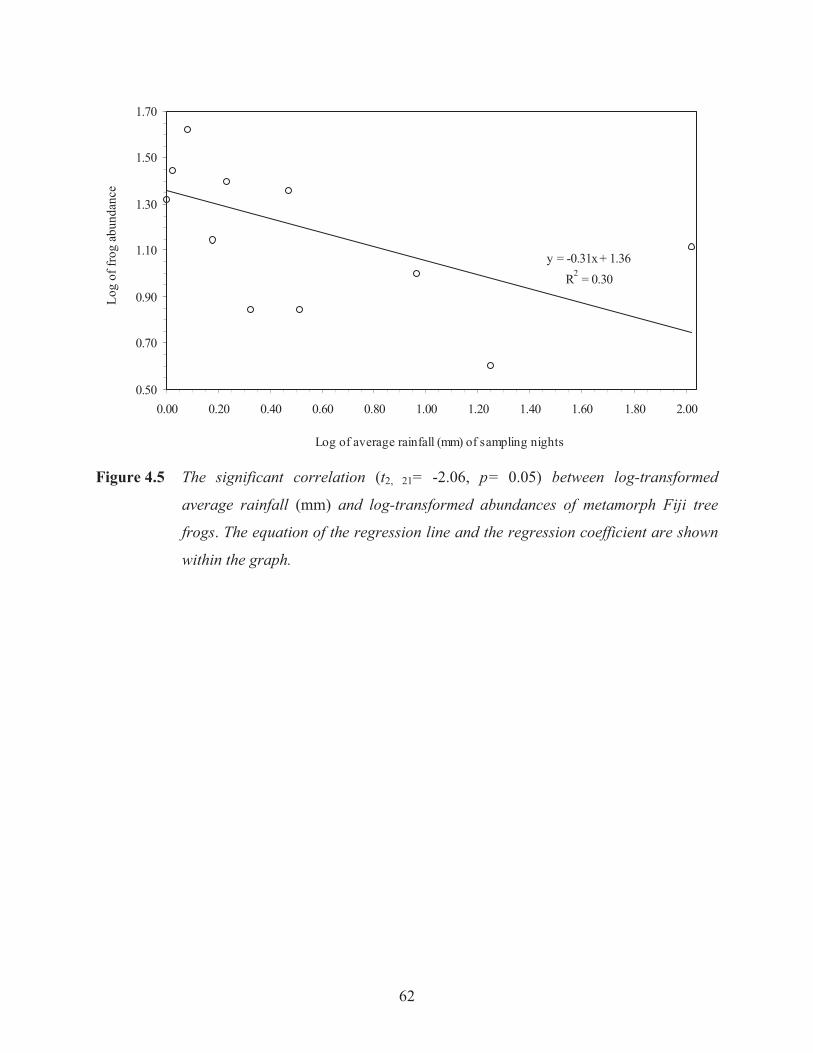
62
y = -0.31x + 1.36R2 = 0.30
0.50
0.70
0.90
1.10
1.30
1.50
1.70
0.00 0.20 0.40 0.60 0.80 1.00 1.20 1.40 1.60 1.80 2.00
Log of average rainfall (mm) of sampling nights
Log
of fr
og a
bund
ance
Figure 4.5 The significant correlation (t2, 21= -2.06, p= 0.05) between log-transformed
average rainfall (mm) and log-transformed abundances of metamorph Fiji tree
frogs. The equation of the regression line and the regression coefficient are shown
within the graph.

63
y = 0.07x - 1.18R2 = 0.37
0.00
0.10
0.20
0.30
0.40
0.50
0.60
0.70
0.80
0.90
19 20 21 22 23 24 25 26 27
Log of average air temperatures (°C) of sampling nights
Log
of fr
og a
bund
ance
Figure 4.6 The significant correlation (t2, 21= 2.06, p= 0.05) between average temperatures
(�C) and log-transformed abundances of gravid female tree frogs. The equation of
the regression line and the regression coefficient are shown within the graph.

64
y = -0.26x + 0.63R2 = 0.15
0.00
0.20
0.40
0.60
0.80
1.00
1.20
0.00 0.20 0.40 0.60 0.80 1.00 1.20 1.40 1.60 1.80 2.00
Log-transformed average rainfall (mm) of the sampling nights
Log
abun
danc
e of
frog
s
Figure 4.7 The significant correlation (t2, 33= -2.65, p= 0.01) between log-transformed
average rainfall (mm) and log-transformed abundances of adult Fiji tree frogs
from the habitat study. The equation of the regression line and the regression
coefficient are shown within the graph.
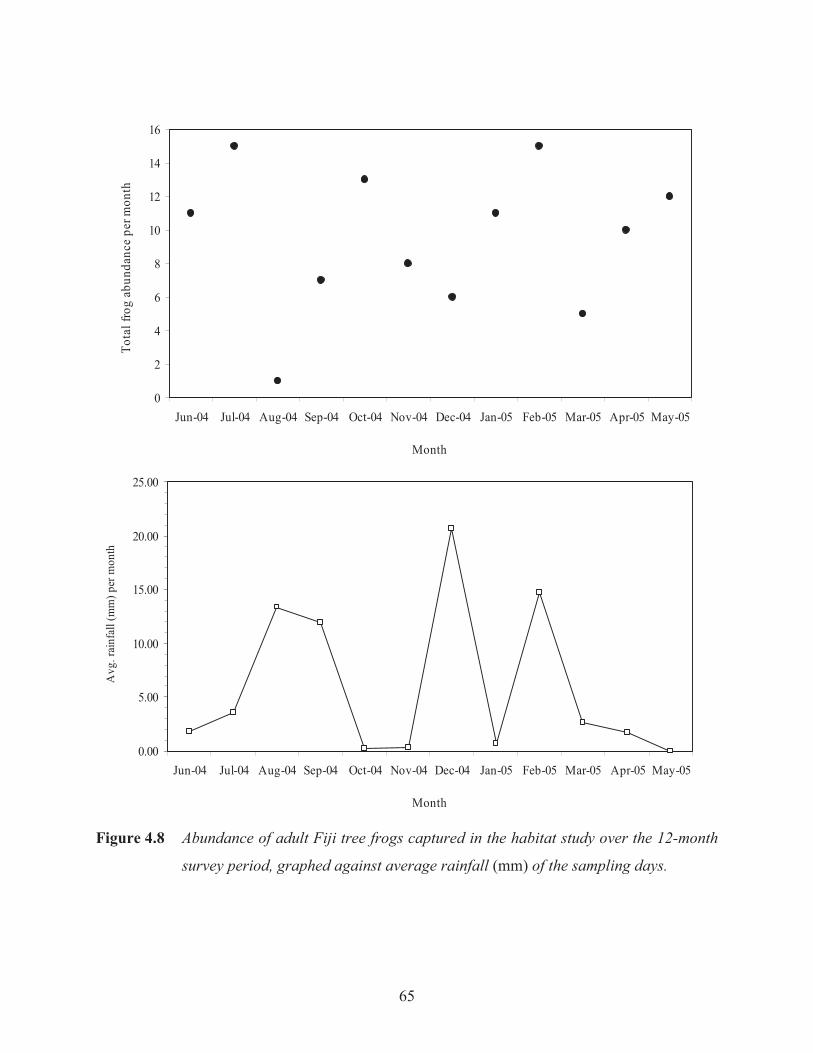
65
Figure 4.8 Abundance of adult Fiji tree frogs captured in the habitat study over the 12-month
survey period, graphed against average rainfall (mm) of the sampling days.
0
2
4
6
8
10
12
14
16
Jun-04 Jul-04 Aug-04 Sep-04 Oct-04 Nov-04 Dec-04 Jan-05 Feb-05 Mar-05 Apr-05 May-05
Month
Tota
l fro
g ab
unda
nce
per m
onth
0.00
5.00
10.00
15.00
20.00
25.00
Jun-04 Jul-04 Aug-04 Sep-04 Oct-04 Nov-04 Dec-04 Jan-05 Feb-05 Mar-05 Apr-05 May-05
Month
Avg
. rai
nfal
l (m
m) p
er m
onth
66
4.4 DISCUSSION
Air temperature did not influence the annual activity patterns of all adult frogs, a pattern
indicated by previous studies on tropical rainforest anurans (Magnusson et al., 1999). Air
temperature influences calling activity as temperature can affect the vocal capabilities of
anurans, and is thought to indirectly influence streamside abundance (Zweifel, 1959; Giacoma et
al., 1997; Luddecke and Sanchez, 2002). However, gravid female Fiji tree frogs were positively
correlated to air temperature on the sampling night, indicating increased breeding activity during
the early wet season months as nocturnal air temperatures rise (November to January).
Smith (1996) demonstrated that the effect of air temperatures on reproductive activity is weaker
than the influence of annual rainfall patterns on a tropical rainforest frog, Littorea xanthomera, in
Australia. Much of the literature suggests that rainfall is the most important meteorological
variable determining intra-annual fluctuations in adult male and female frog activity (Heyer,
1973; Ryan, 1983; Aichinger, 1987; Donnelly and Guyer, 1994; Magnusson et al., 1999). Adult
tree frog activity is significantly negatively correlated with higher rainfall, and more adult frogs
were captured during the dry season months (May – October). The increase in adult activity
during the dry season might be a result of an increase in food availability during this time, which
has been shown in other tropical studies (Moreira and Lima, 1991; Watling and Donnelly, 2002).
The abundance of metamorphs/hatchlings also fluctuated with rainfall, a trend that may represent
decreased activity during short-term high rainfall. The survey team observed fewer
metamorphs/hatchlings on sampling nights when rainfall during the 24-hour period was higher
than on other nights. The correlation between metamorph/hatchling abundance and rainfall may
also be a function of decreased detectability of Fiji tree frogs due to poor visibility in the rain.

67
The abundance of gravid females was observed to have increased during the wet season. Similar
results were found in a study on coqui frogs (Eleutherodactylus spp.) in South America, where
gravid females were mainly found during the wet season (Aichinger, 1987). Reproductive
activity in P. vitiensis along Vago Creek appeared to drop in the drier months, as no gravid
females were captured during April to July.
Juvenile recruitment of the Vago population peaked during the wet season (November to
January), a trend that contrasts with the results from tropical anuran populations in the upper
Amazon where juvenile numbers peaked during the dry season (Aichinger, 1987). The increase
in juvenile tree frog numbers during the wet season may possibly be due to upstream or
downstream immigration of juveniles into the transect site. Increased juvenile recruitment in the
wet season occurs in several anuran species in the Amazon (Moreira and Lima, 1991). The
increased abundance of juveniles during the early dry season (November-January) may reflect
seasonal reproduction in the Fiji tree frog, which ensures new recruits enter populations in the
early wet season when there may be a secondary peak in food items (Galatti, 1992; Hodgkison
and Hero, 2003).
There were no clear indications of phenology in the broad-scale survey data, as suggested
previously in Chapter 2. The significantly negative effect of rainfall on sampling was again
confirmed, and it is suggested that changes in adult numbers over the year in the habitat study
were due to the influence of this meteorological variable on detectability and/or frog activity.
Other environmental factors like relative humidity, moon phase, and wind/ air desiccation were
noted but not tested during this study. These factors have been shown to be influential on

68
amphibian reproductive activity (Cree, 1989; Oseen and Wassersug, 2002). Testing the effect of
these weather variables would enable us to better understand the reproductive phenology of the
Fiji tree frog. However, any further studies on the influence of environmental variables will
need to take into account that both sexes call, and should compare differences between responses
to changes in meteorological variables by male and female frogs (Stewart and Rand, 1991).
Fiji tree frogs are thought to be year-round breeders (Morrison, 2003). Breeding occurs during
both the dry season months of May to October, as well as the wet season months of April to
November, although at lower rate during the dry season. However, the onset and duration of
seasons may differ between years (Alexander and Eischeid, 2001). Consequently, the phenology
patterns of anurans in tropical wet-dry climes will vary from year to year. In addition, not all
the females of reproductive age in any given population may breed every year (Gill, 1985).
Thus, the results of short-term studies of phenological activity of amphibians are ‘snap-shots’ of
a much broader picture.
To gain a better understanding of P. vitiensis’s breeding, further monitoring of the Vago Creek
population would be required over many years to provide a more comprehensive outline of
cyclical changes in annual breeding patterns. The results of this study are the first systematically
collated and analysed population data for P. vitiensis, from a fixed site that was surveyed
monthly for 12 months. The patterns shown by the Vago Creek population are likely to be
representative of tree frog populations in Savura, and possibly elsewhere in their range.
Research into tree frog populations in other sites in the Fiji group is necessary to determine just
how representative is the phenology of the study population.
69
4.5 SUMMARY
The phenology of the Vago Creek population showed complex patterns that may be due to inter-
annual fluctuations in weather, as well as other factors, such as migration and recruitment, which
were not investigated in this study. The abundance of all adult frogs was greatest during the dry
season months (May-June), possibly due to a significantly negative relationship with rainfall.
Greater activity of gravid females during the wet season indicates that egg-laying occurs during
November to February. Juvenile tree frog phenology contrasted with that of metamorphs, as
metamorphs were captured more often during the dry season whereas juvenile abundances were
higher in the wet season. The phenology of tree frogs in the macro-habitat survey was indistinct,
and fluctuations in recorded adult abundances over the sampling period were associated strongly
with changes in rainfall rather than an indication of frog phenology.

70
Chapter 5 Conclusions and Recommendations for Future Research
5.1 THE SAVURA TREE FROG POPULATION
Fiji tree frogs in Savura are distributed throughout the area, in both primary and secondary
lowland rainforest of the Vago and Savura forestry reserves, as well as in the mahogany
plantations of Colo-i-Suva. Although sub-populations are more common and larger (Section
2.3) in primary rainforest sites, P. vitiensis is quite capable of inhabiting scrub vegetation, in
addition to secondary disturbed and cultivated forests. The structure and composition of suitable
habitat sites are key factors in determining the presence or absence of tree frogs. However,
unknown past distribution patterns may also affect current patterns. In addition to habitat
preferences, tree frogs appear to select specific microhabitats for foraging and perch sites, as
frogs were more active along the riparian strip than within the adjacent forest (Section 3.3.3).
These factors are essential information when designing sampling programmes for future
monitoring of the species.
5.1.1 Major Habitat Preferences
Tree frogs were slightly significantly more abundant in primary lowland rainforest sites than in
secondary disturbed lowland rainforest or cultivated mahogany forests. This confirms that P.
vitiensis populations are more common in well-forested and generally undisturbed sites (Ryan,
1984; Morrison, 2004). However, when taking into account the connectivity of the habitats
surveyed and the low human disturbance levels throughout much of the Savura area, relative to
adjacent areas, this pattern is not as unlikely as it first seemed. Disturbance due to human
activity is limited to areas accessible by the dirt road and tracks leading off it.

71
The largest populations of frogs were found in sites with very low levels of human and natural
disturbance, dense forest canopies, and an abundance of microhabitats where tree frogs were
encountered during the study (i.e. riparian Pandanus spp. stands). In addition, rainfall variability
greatly influenced the frog counts in the different habitats. These confounding variables need to
be examined more thoroughly to determine their significance in assessing habitat suitability for
P. vitiensis.
5.1.2 Microhabitat Selection
Platymantids have been a part of Fiji’s biota for at least five millennia (Worthy, 2001) and may
have been historically more diverse. It is possible that Fiji’s frogs have evolved associations
with certain plant taxa during this period of co-habitation in the lowland rainforests of the main
islands, as they were more often found on riparian species present in primary and secondary
rainforest, then in mahogany plantations. The long leaves of Pandanus vitiensis were the most
common perch and foraging sites of individuals captured. Other species used as nocturnal
microhabitats were Dolicholobium sp., Dilenia biflora, Syzygium seemannii, and Ficus
bambusifolia.
The majority of captured individuals were found between one and three metres above the ground
on shrubs and tree saplings. Perch sites at these heights render individuals vulnerable to
predation by the introduced mongoose (Herpestes javanicus) and rats (Rattus spp.). Although
there must exist a trade-off between increased visibility to predators and greater feeding
opportunities along streams, P. vitiensis were more abundant along Vago Creek than in the
adjacent rainforest strip, which may be due to a greater abundance of flying insects in open
riparian zones than under the closed canopies of primary rainforest (Olson, pers. comm., 2002).

72
As microhabitats occupied within the major habitat surveys were also significant with respect to
the vegetation of the perch site, proximity to stream, and height above ground, P. vitiensis
displays selectivity for nocturnal foraging and perch sites.
5.1.3 Phenological Information
The phenology of the Vago Creek population showed complex patterns that may not be
representative of annual trends. Records of egg clutches found suggest that P. vitiensis females
lay eggs primarily between November and February, supporting the findings from previous non-
systematic studies. Adult tree frogs were generally more abundant during the dry season
months; however gravid females are more abundant in the wet season. Juvenile recruitment
peaked during the early months of the wet season and metamorphs/hatchlings were more
abundant during the dry season, which may reflect increased breeding activity during the latter
part of the wet season. Temporal variation in abundance during the 12-month period is likely
due to relationships between age classes and meteorological variables, particularly short-term
rainfall events.
5.2 RECCOMENDATIONS FOR FUTURE SURVEYS
From the results of the habitat, microhabitat and phenological analysis, several recommendations
can be made for future surveys of P. vitiensis populations on Viti Levu. These recommendations
may also be applicable for other populations of tree frogs on the islands of Vanua Levu, Tavueni,
Gau, and Ovalau. Several of the recommendations may be extended to the tree frog’s
endangered congener, P. vitianus. Recommendations are subdivided into temporal and spatial
categories.

73
5.2.1 Temporal Variables
As rainfall was the most influential weather variable determining the abundances of tree frogs,
surveys should take into account inter-annual fluctuation in rainfall in Fiji. The distribution of
rainfall over the last five years (September 2000-August 2005) was homogenous (Levene's
statistic= 0.18, p= 0.95; d.f= 4, 55), and rainfall during the study period did not vary
significantly from patterns shown for the last four years (F4, 55= 0.68, p= 0.61; Appendix 3.1b).
The abundance of tree frogs captured showed a bi-modal distribution throughout the 12-month
survey. The first peak occurred between October to December, and the second between May to
July. The first peak in abundance was attributed to greater abundances of juveniles and adult
females. The latter peak occurred during the dry season and is due to an increase in metamorph
abundance. The results of this study suggest that the age and size classes of tree frogs display
differences in temporal patterns of activity. Accordingly, future surveys should clearly separate
the data for these size classes. Overall, Fiji tree frogs were most abundant during the late wet
season to mid-dry season (March-July).
In order to get an estimate of total population size in time-constrained surveys, the best period
during the year to survey the frog population would be between the late wet season and early dry
season. As the onset of these seasons can fluctuate between years, long-term climatic patterns
should be considered when selecting dates to survey Fiji tree frogs. However, if a specific subset
of the population is the focus of surveys, then the temporal pattern in activity will need to be
considered. Adult and juvenile tree frogs are best surveyed during the early wet season, whereas
metamorph activity is best surveyed during the dry season. Likewise, inter-annual fluctuations
74
in the onset and duration of the two seasons in Fiji need to be accounted for in the sampling
design.
Short-term fluctuations in weather may further influence results of sampling. Heavy rainfall in
the 24-hour period prior to sampling may result in a low number of captures, as the smaller sized
individuals are less likely to venture out to forage. Heavy rainfall on the sampling night can
affect visibility as well as deter tree frogs from occupying more exposed microhabitats. The
intensity of short-term rainfall events may be more important than the total amount of rainfall in
the period leading up to sampling. Inter-annual fluctuation in temperature in the tropical
rainforests of Fiji did not influence the survey results as much as rainfall variability. However,
juvenile and gravid female frogs were more active during the warmer months. It is suggested
that sampling will not be as efficient when low nocturnal temperatures coincide with long
periods of dry weather.
5.2.2 Spatial Variables
As the results of this study do not suggest tree frogs exhibit site selectivity determined by general
vegetation formation characteristics, surveys of Fiji’s platymantids may not necessarily be
restricted to good rainforest. Cultivated forestry reserves, such as the Colo-i-Suva mahogany
forests, that have low levels of human disturbance and riparian strips are potential sites for tree
frog surveys. Tree frogs were found in Colo-i-Suva along narrow streams, under mahogany
canopies as close as 30 m to Forestry staff quarters. Several individuals were discovered in quite
exposed perch sites on grass and shrubbery in disturbed vegetation. However, the bulk of
captured individuals were reported from primary lowland rainforests sites, and therefore, primary

75
rainforest is the most suitable habitat for long-term monitoring of demographic variables in P.
vitiensis populations.
The protected status of the sites surveyed is another important variable to consider in the habitat
selectivity of tree frogs. All the sites surveyed were within the boundaries of forest reserves, and
are subjected to lower levels of human disturbance. As a consequence tree frog populations may
be more likely to occur in less primary habitat, within these reserves, than non-protected
secondary habitats elsewhere in Fiji.
Since tree frogs used specific microhabitat selection throughout the Savura area, it is likely that
the species does this elsewhere in its distributional range. The Savura tree frogs were mostly
found on endemic Pandanus and Dolicholobium species, and ground ferns of various species
along streams and in adjacent forests. The leaves and sheathed petioles may protect P. vitiensis
from being dislodged into streams during heavy rainfall. During drier weather, dew and rainfall
is retained in the axils of Pandanus leaves and sheathed petioles of Dolicholobium leaves. Tree
frogs may also select these plants as substrates for foraging and calling activity to reduce the
possibility of desiccation during the dry season.
From these findings, it is recommended that researchers focus sampling efforts on these
microhabitats when projects are restricted by time. Intensive short-term surveys are often “hit-
and-miss” sampling efforts when the area being searched is extensive and heterogeneous (such
as the distributional range of platymantids in the Fiji archipelago). Knowing where to look cuts
down time spent at sites, and factors such as vegetation present can be used as selection criteria
when choosing sites for sampling.

76
5.2.3 Other Factors to Consider
One the major problems encountered in the field was the sexing of individuals greater than three
grams in body weight. The literature suggests that adult males and females are distinguishable
based on several criteria (Gorham, 1971; Pernetta and Goldman, 1977; Ryan, 1984; Morrison,
2003). These include:
1. Adult males are reproductively mature at smaller sizes (between 1.5-
2.0g) than females and exhibit a yellow groin flash that extends from
the groin along the inner thigh to the knee joint.
2. Adult females generally grow much larger than adult males (up to
60mm in SUL, and will, therefore, reproductively mature at a larger
size than males and will not display the yellow groin flash seen at such
small SUL’s as adult males.
3. Adult females over 35mm in SUL are capable of developing ova and
becoming gravid, a condition that is clearly visible through the
transparent skin of the abdomen.
However, it became quite clear during sampling that these criteria do not guarantee accurate
identification in the field. Individuals over 1.5g in body weight and greater than 30mm in SUL
were easier to classify as adult males, as these frogs displayed yellow groin flashes. The sexing
of individuals weighing 3-5g and measuring 35-45mm in SUL was confounded by the fact that
all tree frogs captured greater than 1.5g and 30mm in SUL, displayed the yellow groin flash. In
addition males of Fiji congeners do not have nuptial pads, which many other anurans possess
(Zug, 1993; Beebee, 1996; Morrison, 2003; Kuruyawa et al., 2004). Furthermore, both sexes

77
have similar sounding calls and could not be identified by their calls in the field. This meant that
immature females below 4g and 32mm in SUL could not be same sized males in the field.
5.3 IMPLICATIONS FOR CONSERVATION OF FROGS IN FIJI
Fiji’s tree frogs are generally classified as rainforest frogs even though they are also found in
secondary vegetation. A close association with riparian and rainforest plant species, such as
Pandanus and Dolicholobium has been noted elsewhere throughout their range (Gorham, 1968
and 1971; Ryan, 1984; Morrison, 2003; Naikatini, Osborne, and Morley, In prep.). Degradation
of primary lowland rainforest and pristine watersheds in time may result in the loss of available
habitat with suitable microhabitats for the tree frog. P. vitiensis could therefore, be used as an
umbrella species to help protect areas of primary lowland rainforest where tree frogs are extant
throughout its range.
P. vitiensis is considered ‘near threatened’ and is currently on the IUCN Red List (IUCN,
Conservation International, NatureServe, 2004). However, there have been no recent censuses
throughout the tree frog’s range to determine its actual status. Thus, there is a need to conduct
surveys on the islands where the frog has been reported, to determine the affects of changes to
the extent of primary rainforest on these populations. The arboreal habit of the tree frog is
presumed to be one of the main reasons that the P. vitiensis has persisted on the main islands of
Fiji whereas the ground frog appears to have been extirpated from mainland Viti Levu (Watling
and Zug, 1998). The apparent extirpation of the ground frog on Viti Levu has been linked to the
introduction of the small Indian mongoose, Herpestes javanicus (ibid.).
78
It is assumed that the ground dwelling nature of the ground frog rendered it more vulnerable to
predation by mongoose on Viti Levu and Vanua Levu (Pernetta and Watling, 1978; Watling and
Zug, 1998; Morrison et al., 2004). However, mongoose predation may not be the only factor
that contributed to the extirpation of the ground frog on Viti Levu (Pernetta and Watling, 1987).
Climate change over the last 10,000 years may have reduced primary lowland rainforest
coverage in Viti Levu (Nunn, 1997). The loss of suitable habitat (Gorham, 1968) in addition to
human predation (Worthy, 2001) is likely to have caused extirpations of platymantid populations
in what is now termed the ‘dry zone’ of Viti Levu. Several populations may have become so
small that demographic and stochastic events wiped these relict populations out.
Although ground frogs were recorded in parts of Viti Levu (Nasoqo, near Suva) there may have
only been a few relict populations that persisted at the time of European exploration (Gorham,
1968). Gorham’s (1968) revision of museum specimens suggests that the majority of specimens
labelled as taken from Viti Levu, were probably from Ovalau Island.
Future research into pre-historic vegetation patterns on Viti Levu Island, taking into account both
climatic-induced changes and the affects of early human settlement, may help to understand the
pre-history of Fiji’s platymantids. Geographical Information Systems’ (GIS) software (Carey et
al., 2001) and genetic analysis (Faith et al., 2004) are likely to be the best tools to apply to
elucidating pre-historic changes in distribution and abundance of the tree frog. By determining
probable causes of decline in populations of Fiji’s frogs before the introduction of the mongoose,
we may understand current distributional patterns more clearly.
Understanding the distribution of Fiji’s platymantids is essential to the development of efficient
conservation programmes. Long-term and short-term changes to population size are vital factors

79
to consider when designing conservation projects (Biek et al., 2002). Conservation of both
Platymantis species is needed as they are endemic to Fiji and represent an important branch of
the genus and the generic genome.
5.4 SUMMARY
As Platymantis vitiensis populations in Savura show slight habitat preferences, it is
recommended that future surveys should not be constricted to primary lowland rainforest but
should encompass secondary vegetation with moderate levels of human disturbance. Surveys
that are time constricted may increase efficiency by sub-sampling along riparian strips in
forested areas, focusing on species such as Pandanus and Dolicholobium and ground ferns. In
order to obtain more accurate estimates of adult population size, it is recommended that sampling
be carried out between the late wet season to early dry season (approximately March to July).
Future research on Viti Levu to map extant tree frog populations and to clarify the agents causing
the extirpation of tree and ground frogs is necessary for conservation purposes. In addition, it is
suggested that past distributional patterns and the probable causes for the reduction in range of
both species be investigated to allow for greater understanding of the extirpation events and
enable development of more efficient conservation programmes for Fiji’s Platymantis.
Bibliography
80
Bibliography
Aichinger, M. 1987. Annual activity patterns of anurans in a seasonal Neotropical environment.
Oecologia, 71: 583-592.
Alexander, M. A. and Eischeid, J. K. 2001. Climate variability in regions of amphibian
declines. Conservation Biology, 15(4): 930-942.
Alford, R. A. and Richards, S. J. 1999. Global amphibian declines: a problem in applied
ecology. Annual Review of Ecological Systems, 30: 133-165.
Allison, A. 1996. Zoogeography of amphibians and reptiles of New Guinea and the Pacific
region. In: Keast, A. and Miller, S. E. (Eds.). The Origin and Evolution of Pacific Island
Biotas, New Guinea to Eastern Polynesia. SPB Academic Publishing, Amsterdam.
Allison, A. and Kraus, F. 2001. New species of Platymantis (Anura: Ranidae) from New
Ireland. Copeia, 2001(1): 194-202.
Beard, K. H., McCullough, S., and Eschtruth, A. K. 2003. Quantitative assessment of habitat
preferences for the Puerto Rican terrestrial frog, Eleutherodactylus coqui. Journal of
Herpetology, 37(1): 10-17.
Beebee, T. J. C. 1995. Amphibian breeding and climate. Nature, 374: 219-220.
Beebee, T. J. C. 1996. Ecology and Conservation of Amphibians. Chapman and Hall, London.
Beebee, T. J. C. 2002. Amphibian phenology and climate change. Conservation biology,
16(6):1454-1455.
Biek, R., Funk, C., Maxell, B. A., and Mills, L. S. 2002. What is missing in amphibian decline
research: insights from ecological sensitivity analysis. Conservation Biology, 16(3): 728-
734.
Bibliography
81
Blaustein, A. R. and Wake, D. B. 1990. Declining amphibian populations: a global
phenomenon? Trends in Ecology and Evolution, 5(7): 203-204.
Blankenhorn, H. J. 1972. Meteorological variables affecting the onset and duration of calling in
Hyla arborea L. and Bufo calamita Laur. Oecologia, 9: 223-234.
Boistel, R. and Sueur, J. 1997. Comportment sonore de la femelle de Platymantis vitiensis
(Amphibia, Anura) en l’absence du male. C. R. Academy Sciences, Paris, Sciences de la
vie, 320: 933-941.
Brattstrom, B. H. 1963. A preliminary review of the thermal requirements of amphibians.
Ecology, 44(2): 238-255.
Bridges, A. S. and Dorgas, M. E. 2000. Temporal variation in anuran calling behaviour:
implications for surveys and monitoring programs. Copeia, 2000(2): 587-592.
Brown, L. E. and Rose, G. B. 1988. Distribution, habitat and calling season of the Illinois
Chorus frog (Pseudacris streckeri illinoensis) along the Lower Illinois River. Illinois
Natural History Survey Biological Notes, 132: 1-13.
Caetano, M. H. and Leclair, R. 1999. Comparative phenology and demography of Triturus
boscai from Portugal. Journal of Herpetology, 33(2): 192-202.
Carey, C., Heyer, W. R., Wilkinson, J., Alford, R. A., Arntzen, J. W., Halliday, T., Hungerford,
L., Lips, K. R., Middleton, E. M., Orchard, S. A., and Rand, S. R. 2001. Amphibian
declines and environmental change: use of remote sensing data to identify environmental
correlates. Conservation Biology, 15(4): 903-913.
Church, G. 1961. Seasonal and lunar variation in the numbers of mating toads in Bandung
(Java). Herpetologica, 17(2): 122-126.
Bibliography
82
Collins, J. P. and Storfer, A. 2003. Global amphibian declines: sorting the hypotheses.
Diversity and Distributions, 9: 89-98.
Cree, A. 1989. Relationship between environmental conditions and nocturnal activity of the
terrestrial frog, Leiopelma archeyi. Journal of Herpetology, 23(1): 61-68.
Crump, M. L. and Pounds, J. A. 1989. Temporal variation in the dispersion of a tropical anuran.
Copeia, 1989(1): 209-211.
Donnelly, M. A. and Guyer, L. 1994. Patterns of reproduction and habitat use in an assemblage
of Neotropical Hylid frogs. Copeia, 98: 291-302.
Duellman, W. E. 1999. Patterns of the Distribution of Amphibians: a Global Perspective. John
Hopkins University Press, Baltimore.
Duellman, W. E. and Pyles, R. A. 1983. Acoustic resource partitioning in anuran communities.
Copeia, 1983(3): 639-549.
Duellman, W. E. and Trueb, L. 1986. Biology of Amphibians. McGraw-Hill, New York. Pp.
670.
Faith, D. P., Reid, C. A. M., and Hunter, J. 2004. Integrating phylogenetic diversity,
complementarity, and endemism. Conservation Biology, 18(1): 255-261.
Fischer, J., Lindenmayer, D., and Cowling, A. 2003. Habitat models for the four-fingered skink
(Carlia tetradactyla) at the microhabitat and landscape scale. Wildlife Research, 30: 495-
504.
Fukuyama, K. and Kusano, T. 1992. Factors affecting breeding activity in a stream-breeding
frog, Buergaria buergeri. Journal of Herpetology, 26(1): 88-91.

Bibliography
83
Galindo-Leal, C., Cedeno-Vazquez, J. R., Calderon, R., and Augus, J. 2003. Arboreal frogs,
tank bromeliads, disturbed seasonal tropical forest. Contemporary Herpetology, 2003(1):
1-8.
Gascon, C. 1991. Breeding of Leptodactylus knudseni: responses to rainfall variability. Copeia,
1991(1): 248-251.
Galatti, U. 1992. Population biology of the frog Leptodactylus pentadactylus in a Central
Amazonian rainforest. Journal of Herpetology, 26(1): 23-31.
Giacoma, C., Zugolaro, C., and Beani, L. 1997. The advertisement calls of the Green toad (Bufo
viridis): variability and role in mate choice. Herpetologica, 53(4): 454-464.
Gibbons, J. R. H. and Guinea, M. L. 1983. Observations on the development of the Fijian tree
frog, Platymantis vitiensis. Herpetofauna, 14(2): 83-86.
Gill, D. E. 1985. Interpreting breeding patterns from census data: a solution to the Husting
dilemma. Ecology, 66(2): 344-354.
Gillespie, G. R., Lockie, D., Scroggie, M. P., and Iskander, D. T. 2004. Habitat use by stream-
breeding frogs in south-east Sulawesi, with some preliminary observations on community
organization. Journal of Tropical Ecology, 20:439-448.
Gorham, S. W. 1968. Fiji's frogs; life history and data from field work. Zoologische Beitrage, 14:
427-446.
Gorham, S. W. 1971. Field identification of Fiji's frogs. Fiji Agricultural Journal, 33: 31-33.
Gottsberger, B. and Gruber, E. 2004. Temporal partitioning of reproductive activity in a
Neotropical anuran community. Journal of Tropical Ecology, 20: 217-280.
Government of Fiji. 1989. Fiji Map Series 31 Topographic Map Sheet 029 Suva Edition 1.
Government Printers, Suva.
Bibliography
84
- 1992. Fiji Map Series 31 Topographic Map Sheet 028 Nausori Edition 2. Government
Printers, Suva.
Gregory, P. T. 1983. Habitat structure affects diel activity pattern in the Neotropical frog
Leptodactylus melanonotus. Journal of Herpetology, 17(2): 179-181.
Heatwole, H. 1962. Environmental factors influencing local distribution and activity of the
salamander, Plethodon cinareus. Ecology, 43(3): 460-472.
Hero, J-M., and Morrison, C. 2004. Frog declines in Australia: global implications. The
Herpetological Journal, 14: 175-186.
Heyer, W. R. 1973. Ecological interactions of frog larvae at a seasonal tropical location in
Thailand. Journal of Herpetology, 7(4): 337-361.
Heyer, W. R., Donnelly, M. A., McDiarmid, R. W., Hayek, L.-A. C., and Foster, J. J. 1994.
Measuring and Monitoring Biological Diversity – Standard Methods for Amphibians.
Smithsonian Institution Press, Washington.
Hodgkison, S. and Hero, J-M. 2003. Seasonal, sexual and ontogenetic differences in the diet of
‘declining’ frogs Litoria nannotis, Litoria rheocola and Nyctimystes dayi. Wildlife
Research, 30: 345-354.
Houlahan, J. E., Findlay, C. S., Schmidt, B. R., Meyer, A. H., and Kuzmin, S. L. 2000.
Quantitative evidence for global amphibian population declines. Nature, 404: 752-755.
Inger, R. F. 1994a. Organization of communities of frogs along small rainforest streams in
Sarawak. Journal of Animal Ecology, 38: 123-148.
- 1994b. Microhabitat description. In: Heyer, W. R., Donnelly, M. A., McDiarmid, R.
W., Hayek, L.-A. C., and Foster, J. J. (Eds.). Measuring and Monitoring Biological

Bibliography
85
Diversity – Standard Methods for Amphibians. Smithsonian Institution Press,
Washington. Pp. 60-66.
IUCN. 2003. 2003 IUCN Red List of Threatened Species. <www.redlist.org>. Accessed on 10
January, 2004.
IUCN, Conservation International, NatureServe. 2004. Global Amphibian Assessment.
<www.globalamphibians.org>. Accessed on 25 November, 2005.
Kam, Y. -C. and Chen, T. -C. 2000. Abundance and movement of the riparian frog (Rana
swinhoana) in a subtropical forest of Guandau Stream, Taiwan. Zoological Studies,
39(1): 67-76.
Keppel, G., Navuso, J. C., Naikatini, A., Thomas, N. T., Rounds, I. A., Osborne, T. A.,
Batinamu, N., and Senivasa, E. 2005. Botanical diversity at Savura, a lowland rainforest
site along the PABITRA gateway transect, Viti Levu, Fiji. Pacific Science, 59(2): 175-
191.
Kiesecker, J. M., Blaustein, A. R., and Belden, L. K. 2001. Complex causes of amphibian
population declines. Nature, 410: 681-684.
Koch, A. J. 2000. Designing effective and efficient monitoring techniques for the endangered
frog species Mixophyes iteratus. B.Sc. (Hons.) thesis. Griffith University, Gold Coast.
Kuramoto, M. 1997. Relationships of the Palau frog, Platymantis pelewensis (Anura: Ranidae):
morphological, karyological and acoustic evidence. Copeia, 1997(1): 183-187.
Kuruyawa, J., Osborne, T., Thomas, N., Rounds, I., Morrison, C. and Morley, C. 2004.
Distribution, abundance and conservation status of the Fijian Ground Frog (Platymantis
vitianus). Unpublished report for the BP Conservation Programme.
Bibliography
86
Laurance, W. F. 1996. Catastrophic declines of Australian rainforest frogs: is unusual weather
responsible? Biological Conservation, 77: 203-212.
Lizana, M., Marquez, R., and Martin-Sanchez, R. 1994. Reproductive biology of Pelobates
cultripes (Anura: Pelobatidae) in Central Spain. Journal of Herpetology, 28(1): 19-27.
Lüddecke, H. and Sanchez, O. R. 2002. Are tropical highland frog calls cold-adapted? The
case of the Andean frog Hyla labialis. Biotropica, 34(2): 281-288.
Magnusson, W. E, Lima, A. P., Hero, J-M., and de Araujo, M. C. 1999. The rise and fall of a
population of Hyla boans: reproduction in a Neotropical gladiator frog. Journal of
Herpetology, 33(4): 647-656.
Marsh, D. M. 2000. Variable responses to rainfall by breeding Tungara frogs. Copeia, 2000(4):
1104-1108.
Midgley, G. F. and Thuiller, W. 2005. Global environmental change and the uncertain fate of
biodiversity. New Phytologist, 137: 638-641.
Morrison, C. 2003. A Field guide to the Herpetofauna of Fiji. Institute of Applied Sciences,
University of the South Pacific, Suva.
Morrison, C. and Hero, J-M. 2003. Geographic variation in life-history characteristics: a
review. Journal of Animal Ecology, 72:270-279.
Morrison, C., Naikatini, A., Thomas, N., Rounds, I., Thaman, B. and Niukula, J. 2004.
Rediscovery of an endangered frog (Platymantis vitianus) on mainland Fiji: implications
for conservation and management. Pacific Conservation Biology, 10: 237-240.
Morton, E. S. 1975. Ecological sources of selection on avian sounds. American Naturalist, 109:
17-34.

Bibliography
87
Naikatini, A., Osborne, T., and Morley, C. In Prep. The avifauna and herpetofauna of Wailotua,
Tailevu province, south-east Viti Levu, Fiji. Unpublished manuscript.
Nunn, P. D. 1997. Keimami sa Vakila na Liga ni Kalou (Feeling the Hand of God): Human and
Nonhuman impacts on Pacific Island Environments (3rd Ed.). School of Social and
Economic Development, the University of the South Pacific, Suva.
Parris, K. M. and McCarthy, M. A. 1999. What influences the structure of frog assemblages at
forest streams? Australian Journal of Ecology, 24: 495-502.
Oseen, K. L. and Wassersug, R. J. 2002. Environmental factors influencing calling in sympatric
anurans. Oecologia, 133: 616-625.
Ota, H. and Matsui, M. 1995. Karyotype of a ranid frog, Platymantis pelewensis, from Belau,
Micronesia with comments on its systematic implications. Pacific Science, 49(3): 296-
300.
Ovaska, K. 1991. Reproductive phenology, population structure, and habitat use of the frog,
Eleutherodactylus johnstonei in Barbados, West Indies. Journal of Herpetology, 25(4):
424-430.
Parris, K. M. 2004. Environmental and spatial variables influence the composition of frog
assemblages in sub-tropical eastern Australia. Ecography, 27: 392-400.
Pernetta, J. C. and Goldman, B. 1977. Botaniviti: the elusive Fijian frogs. Australian Natural
History, 18(12): 434-437.
Pernetta, J. C. and Watling, D. 1978. The introduced and native terrestrial vertebrates of Fiji.
Pacific Science, 32(3): 223-244.
Pounds, A., Fogden, M. P. L., and Campbell, J. H. 1999. Biological response to climate change
on a tropical mountain. Nature, 398: 611-615.

Bibliography
88
Pounds, J. A. 2001. Climate and amphibian declines. Nature, 410: 639-640.
Reading, C. J. 1998. The effect of winter temperature on the timing of breeding activity in the
common toad, Bufo bufo. Oecologia, 117: 469-475.
Retallick, R. W. R., Hero, J. -M., and Alford, R. A. 1991. Adult population monitoring and
larval ecology of the stream-dwelling frogs at Eungella National Park. Unpublished
report to ANCA/QDOE.
Ritke, M. E. and Babb, J. G. 1991. Behaviour of the Gray treefrog (Hyla chrysoscleis) during
the non-breeding season. Herpetological Review, 22(1): 5-8.
Ryan, M. J. 1983. Sexual selection and communication in a Neotropical frog, Physalaemus
pustulosus. Evolution, 37(2): 261-272.
Ryan, P. A. 1984. Fiji amphibia. Domodomo 2(2): 87-98.
- 1985. A coastal habitat for Fiji’s ground frog and a first record from Gau.
Herpetological Review, 16(3): 72.
- 1987. Frogs of Fiji. Islands, 11-15.
- 2000. Fiji’s Natural Heritage. Exisle Publishing Limited, Auckland.
Schwarzkopf, L. and Alford, R. A. 1996. Desiccation and shelter-site use in a tropical
amphibian: comparing toads with physical models. Functional Ecology, 10:193-200.
Sih, A., Jonsson, B. G., and Luikart, G. 2000. Habitat loss: ecological, evolutionary and genetic
consequences. Trends in Ecology and Evolution, 15(4): 132-134.
Sinsch, U. 1984. Thermal influences on the habitat preference and diurnal activity in three
European Rana species. Oecologia, 64: 125-131.

Bibliography
89
Smith, G. R., Todd, A., Rettig, J. E., and Nelson, F. 2003. Microhabitat selection by Northern
Cricket frogs (Acris crepitans) along a West-Central Missouri creek: field and
experimental observations. Journal of Herpetology, 37(2): 383-385.
Smith, W. P. 1996. Acoustic signalling and sexual selection in the mating system of Litoria
xanthomera. B.Sc. (Hons.) thesis. James Cook University, North Queensland.
Stewart, M. M. 1985. Arboreal habitat use and parachuting by a subtropical forest frog.
Journal of Herpetology, 19(3): 391-401.
Stewart, M. M. and Pough, F. H. 1983. Population density of tropical forest frogs: relation to
retreat sites. Science, 221: 570-572.
Stewart, M. M. and Rand, A. S. 1991. Vocalizations and the defence of retreat sites by male and
female frogs, Eleutherodactylus coqui. Copeia, 1991(4): 1013-1024.
Stewart-Koster, B., Dobbie, M, Harch, B., and Corell, R. 2003. Community Collected Data for
the Assessment of Ecosystem Health: Statistical Analysis of the South Australian Frog
Census Data, 1994 – 2001. CSIRO Mathematical and Information Sciences,
Queensland.
Streatfield, C. 1999. Spatial movements of Mixophyes iteratus and M. fasciolatus in southeast
Queensland. B.Sc. (Hons.) thesis. Griffith University, Gold Coast.
Storfer, A. 2003. Amphibian declines: future directions. Diversity and Distributions, 9: 151-
163.
Thuiller, W. 2004. Patterns and uncertainties of species’ range shifts under climate change.
Global Change Biology, 10: 2020–2027.
Townsend, D. S. 1989. The consequences of microhabitat choice for male reproductive success
in a tropical frog, (Eleutherodactylus coqui). Herpetologica, 45(4): 451-458.

Bibliography
90
Townsend, D. S. and Stewart, M. M. 1986. The effect of temperature on direct development in
a terrestrial-breeding, Neotropical frog. Copeia, 1986(2): 520-523.
Watling, J. I. and Donnelly, M. A. 2002. Seasonal patterns of reproduction and abundance of
leaf litter frogs in a Central American rainforest. Journal of the Zoological Society of
London, 258: 269-276.
Watling, D. and Zug, G. R. 1998. Annotated list and conservation status of Fijian terrestrial
reptiles and amphibians. Report of Technical Group 2, Fiji Biodiversity Strategy and
Action Plan. Government of Fiji, Suva.
Watson, J. M. 1960. Some aspects of wildlife in Fiji with special reference to its conservation.
Transactions and Proceedings of the Fiji Society 1960-1961, 8: 1-12.
Woolbright, L. L. 1985. Patterns of nocturnal movement and calling the tropical frog
Eleutherodactylus coqui. Herpetologica, 41(1): 1-9.
Worthy, T. H. 2001. A new species of Platymantis (Anura: Ranidae) from quaternary deposits
on Viti Levu, Fiji. Palaentology, 44(4): 665-680.
Young, B. E., Lips, K. R., Reaser, J. K., Ibanez, R., Salas, A. W., Cedeno, J. R., Coloma, L. A.,
Ron, S., la Marca, E., Meyer, J. R., Munoz, A., Bolanos, F., Chaves, G., and Romo, D.
2001. Population declines and priorities for amphibian conservation in Latin America.
Conservation Biology, 15(5): 1213-1223.
Zimmerman, B. L. and Bierregaard, R. O. 1986. Relevance of the equilibrium theory of island
biogeography and species-area relations to conservation with a case from Amazonia.
Journal of Biogeography, 13(2): 133-143.
Zug, G. R. 1993. Herpetology: An Introductory Biology of Amphibians and Reptiles. Academic
Press, San Diego.

Bibliography
91
Zweifel, R. G. 1959. Effect of temperature on call of the frog, Bombina variegata. Copeia,
1959(4): 322-327.

Appendices
92
Appendices
APPENDIX I
Appendix 1.1 Map Co-ordinates for Sampling Sites in Habitat Surveys.
GPS co-ordinates for each site surveyed for the macro-habitat study. Map co-ordinates are
based on the WGS82 Global Positioning System.
Habitat Type Site Longitude Latitude Primary lowland rainforest P1 18º 04’ 39.45” S 178º 26’ 20.58” E P2 18º 04’ 53.29” S 178º 26’ 41.95” E P3 18º 04’ 47.54” S 178º 26’ 41.50” E P4 18º 05’ 01.20” S 178º 26’ 33.72” E P5 18º 05’ 01.72” S 178º 26’ 44.59” E P6 18º 05’ 10.29” S 178º 26’ 32.66” E P7 18º 03’ 56.96” S 178º 26’ 48.32” E P8 18º 02’54.89” S 178º 26’ 37.74” E P9 18º 03’ 39.72” S 178º 26’ 49.36” E P10 18º 04’ 23.99” S 178º 26’ 54.52” E P11 18º 04’ 19.66” S 178º 26’ 58.63” E P12 18º 04’ 37.75” S 178º 26’ 24.01” E Disturbed secondary D1 18º 03’01.17” S 178º 26’ 30.87” E lowland rainforest D2 18º 03’ 02.15” S 178º 26’ 24.02” E D3 18º 03’ 56.96” S 178º 26’ 48.32” E D4 18º 04’ 58. 32” S 178º 26’ 36.02” E D5 18º 03’ 01. 03” S 178º 26’ 39.45” E D6 18º 02’ 58. 32” S 178º 26’ 30.87” E D7 18º 03’ 00. 34” S 178º 26’ 01.72” E D8 18º 04’ 04.15” S 178º 26’ 49.91” E D9 18º 04’ 56.53” S 178º 26’ 34.32” E D10 18º 04’ 01.92” S 178º 26’ 48.25” E D11 18º 03’ 06. 72” S 178º 26’ 36.06” E D12 18º 05’ 02.54” S 178º 26’ 31.41” E Mahogany plantation M1 18º 03’ 49.74” S 178º 27’ 19.73” E M2 18º 03’ 47.17” S 178º 27’ 20.24” E M3 18º 03’ 51.45” S 178º 27’ 2058” E M4 18º 03’ 02.57” S 178º 27’ 22.29” E M5 18º 03’ 13.72” S 178º 27’ 24. 01” E M6 18º 03’ 03.43” S 178º 27’ 0.87” E M7 18º 03’ 45.45” S 178º 27’ 02.58” E M8 18º 03’ 33.02” S 178º 27’ 16.10” E M9 18º 03’ 37.29” S 178º 27’ 25.56” E

Appendices
93
Appendix 1.1 Continued
Habitat Type Site Longitude Latitude Mahogany plantation M10 18º 03’ 35.58” S 178º 27’ 15.70” E M11 18º 03’ 31.51” S 178º 27’ 23.02” E M12 18º 03’ 56.60” S 178º 27’ 10.29” E

Appendices
94
APPENDIX II
Appendix 2.1 Plant Species used as Substrates by Captured Frogs.
List of plant species used by captured frogs as substrates for perch sites or microhabitats.
Scientific Name Common Name Local Name Acalypha rivularis --- Kadakada Acrostichum aureum --- Vativati Agathis macrophylla --- Dakua Aglaia elegans --- Kaunitoa Alatostema spp. --- Beta Alocasia indica Swamp aroid Via gaga Alyxia spp. --- Vono Angiopteris erecta --- --- Asplenium amboinense Terrestrial fern --- Asplenium nidus Birds nest fern Beluve Astronidium spp. --- Dava Balaka spp. Balaka palm Balaka Barringtonia edulis --- Vutu Blechnum sp. Terrestrial fern --- Callophylum vitiense --- Damanu Canarium sp. --- Kaunigai Clidemia hirta Koster's curse Drau ni siga Collospermum montanum --- Misimisi Cordyline terminalia --- Vasili Culcitta straminea Terrestrial fern Ai vuti Cyathea spp. Tree fern Balabala Cynometra insularis --- Moivi, cibicibi Derris elliptica Derris Duva ni niukini Dilenia biflora --- Kuluva Dolicholobium sp. --- Soso ni ura Dysoxylum richii --- Tarawau kei rakakaEndiandra sp. --- Dirinui Epipremnum pinnatum Tonga plant Yalu Ficus bambusifolia --- Loselose ni wai Ficus spp. Fig trees Baka Freycinetia spp. --- Wa me Garcinia myritifolia --- Laubu Geniostoma vitiense --- Boiboida levu
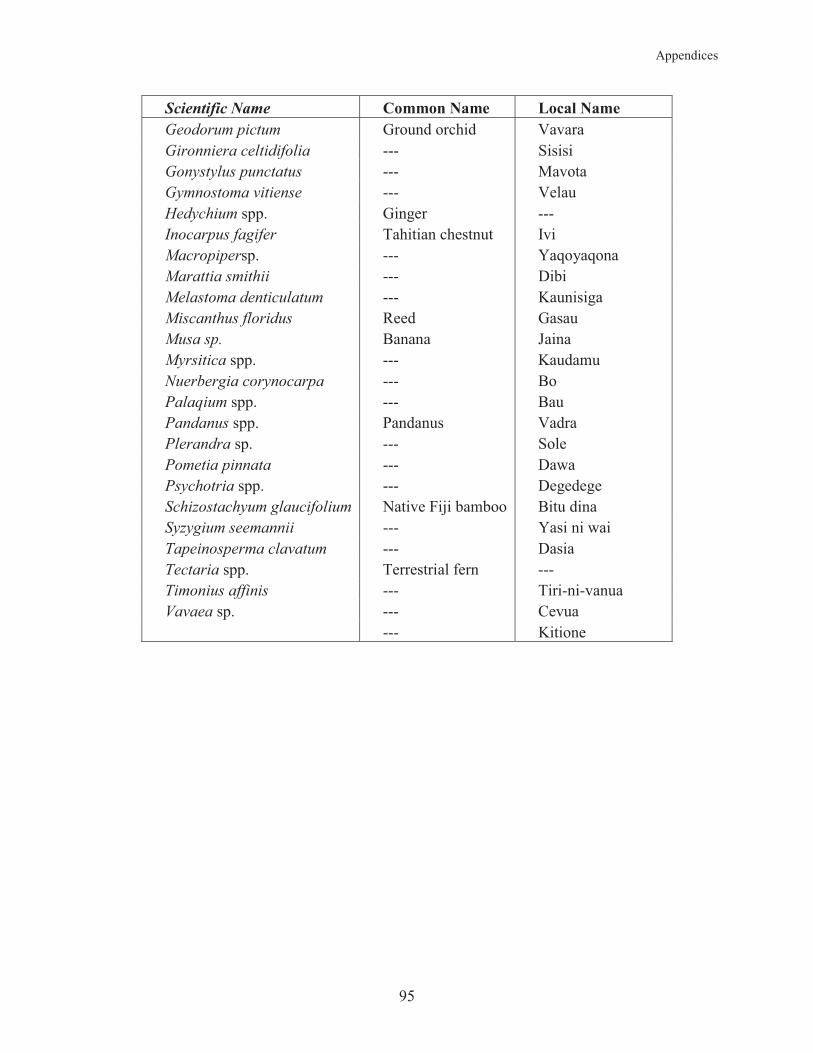
Appendices
95
Scientific Name Common Name Local Name Geodorum pictum Ground orchid Vavara Gironniera celtidifolia --- Sisisi Gonystylus punctatus --- Mavota Gymnostoma vitiense --- Velau Hedychium spp. Ginger --- Inocarpus fagifer Tahitian chestnut Ivi Macropipersp. --- Yaqoyaqona Marattia smithii --- Dibi Melastoma denticulatum --- Kaunisiga Miscanthus floridus Reed Gasau Musa sp. Banana Jaina Myrsitica spp. --- Kaudamu Nuerbergia corynocarpa --- Bo Palaqium spp. --- Bau Pandanus spp. Pandanus Vadra Plerandra sp. --- Sole Pometia pinnata --- Dawa Psychotria spp. --- Degedege Schizostachyum glaucifolium Native Fiji bamboo Bitu dina Syzygium seemannii --- Yasi ni wai Tapeinosperma clavatum --- Dasia Tectaria spp. Terrestrial fern --- Timonius affinis --- Tiri-ni-vanua Vavaea sp. --- Cevua --- Kitione

Appendices
96
APPENDIX III
Appendix 3.1 Monthly rainfall variability over the last five years.
a) Monthly rainfall recorded at the Fiji Meteorological Services Laucala Bay station from
September 2000 – August 2005
0
500
1000
1500
2000
2500
3000
3500
4000
4500
5000
SeptemberOctoberNovemberDecemberJanuary February March April May June July August
Month2004-2005Mean (2000-2004)
Rai
nfal
l per
mon
th (m
m)
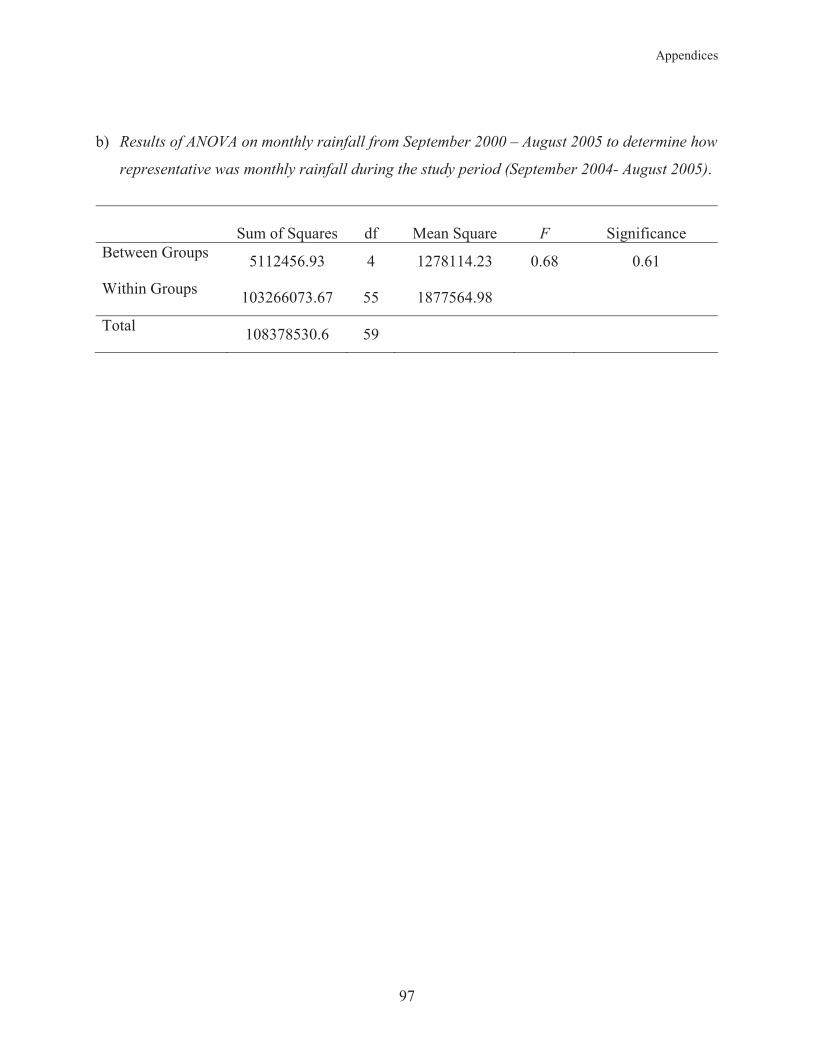
Appendices
97
b) Results of ANOVA on monthly rainfall from September 2000 – August 2005 to determine how
representative was monthly rainfall during the study period (September 2004- August 2005).
Sum of Squares df Mean Square F Significance Between Groups 5112456.93 4 1278114.23 0.68 0.61
Within Groups 103266073.67 55 1877564.98
Total 108378530.6 59