Σπειροειδείς γαλαξίες. spiral galaxies compared to ellipticals, the spirals...
TRANSCRIPT
Σπειροειδείς γαλαξίεςΣπειροειδείς γαλαξίες

Spiral Galaxies• Compared to ellipticals, the spirals cover a distinctlysmaller range in absolute magnitude (and mass). Theyare limited to −16 > MB > −23 and 109Mּס < M < 1012Mּס
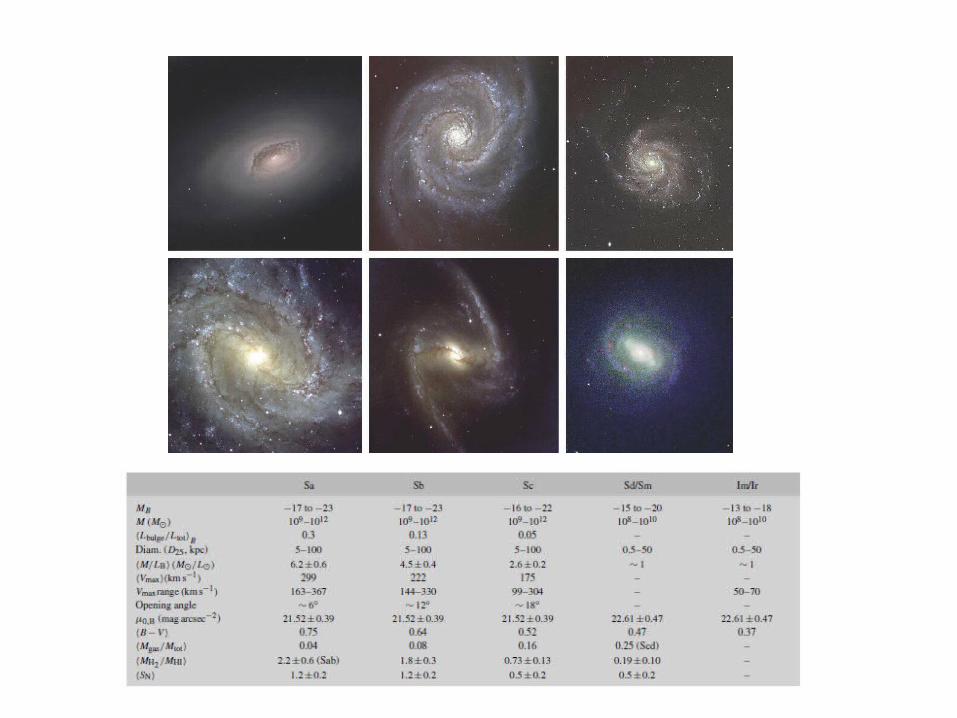
• Looking at the sequence of early-type spirals (i.e., Sa’sor SBa’s) to late-type spirals, we find a number of differencesthat can be used for classification
• a decreasing luminosity ratio of bulge and disk, withLbulge/Ldisk ~ 0.3 for Sa’s and ~ 0.05 for Sc’s
• an increasing opening angle of the spiral arms, from~ 6◦ for Sa’s to ~18◦ for Sc’s;
• an increasing brightness structure along the spiralarms: Sa’s have a “smooth” distribution of stars alongthe spiral arms, whereas the light distribution in thespiral arms of Sc’s is resolved into bright knots ofstars and HII regions.

Spiral galaxies Brightness Profiles
• The light profile of the bulge of spirals is described by a de Vaucouleurs profile to a good approximation
• the disk follows an exponential brightness profile, as is the case for our Milky Way
• μe is the surface brightness at the effective radius Re
• The central surface brightness and the scale-length of the disk are denoted by μ0 and hr , respectively.
• μ0 is not directly measurable since μ0 is not the central surface brightness of the galaxy, only that of its disk component. To determineμ0, the exponentialis extrapolated from large R inwards to R = 0.

The brightness profile of the haloes of spirals
• Difficult to study due to low surface brightness
• A stellar halo of red giant branch stars was detected n M31
– It extends out to more than 150 kpc from its center.
– The brightness profile of this stellar distribution indicates that for radii r <20 kpc it follows the extrapolation from the brightness profile of the bulge,
i.e., a de Vaucouleurs profile.
– for larger radii it exceeds this extrapolation, showing a power-law profile which corresponds to a radial density profile of approximately
ρ ~ r−3, not unlike that observed in our Milky Way.
Low surface brightness spirals (LSB)
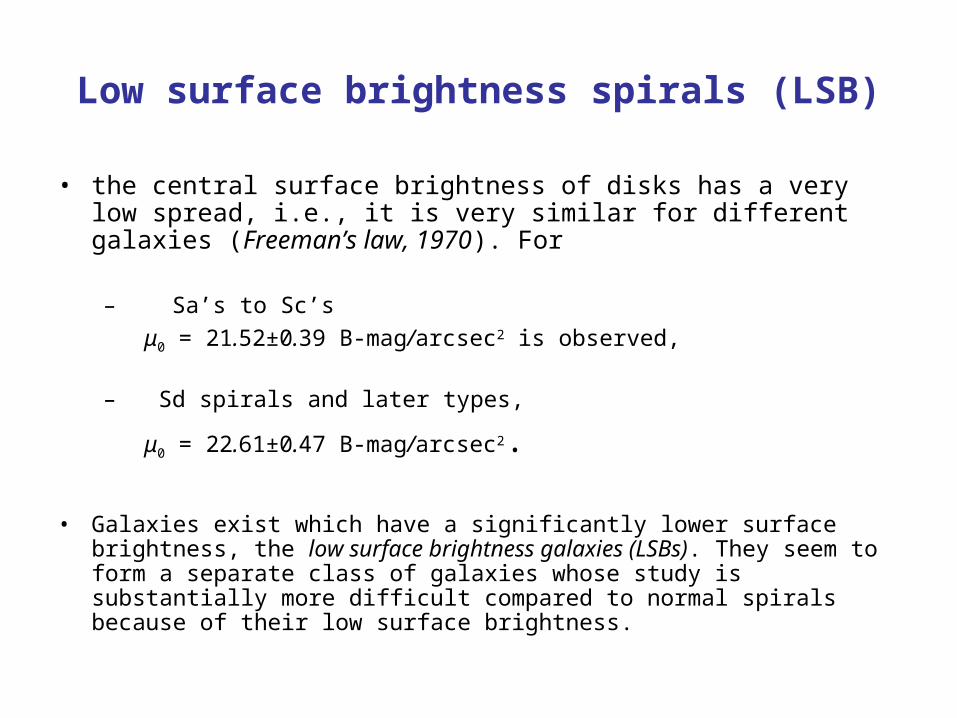
• the central surface brightness of disks has a very low spread, i.e., it is very similar for different galaxies (Freeman’s law, 1970). For
– Sa’s to Sc’s
μ0 = 21.52±0.39 B-mag/arcsec2 is observed,
– Sd spirals and later types,
μ0 = 22.61±0.47 B-mag/arcsec2.
• Galaxies exist which have a significantly lower surface brightness, the low surface brightness galaxies (LSBs). They seem to form a separate class of galaxies whose study is substantially more difficult compared to normal spirals because of their low surface brightness.
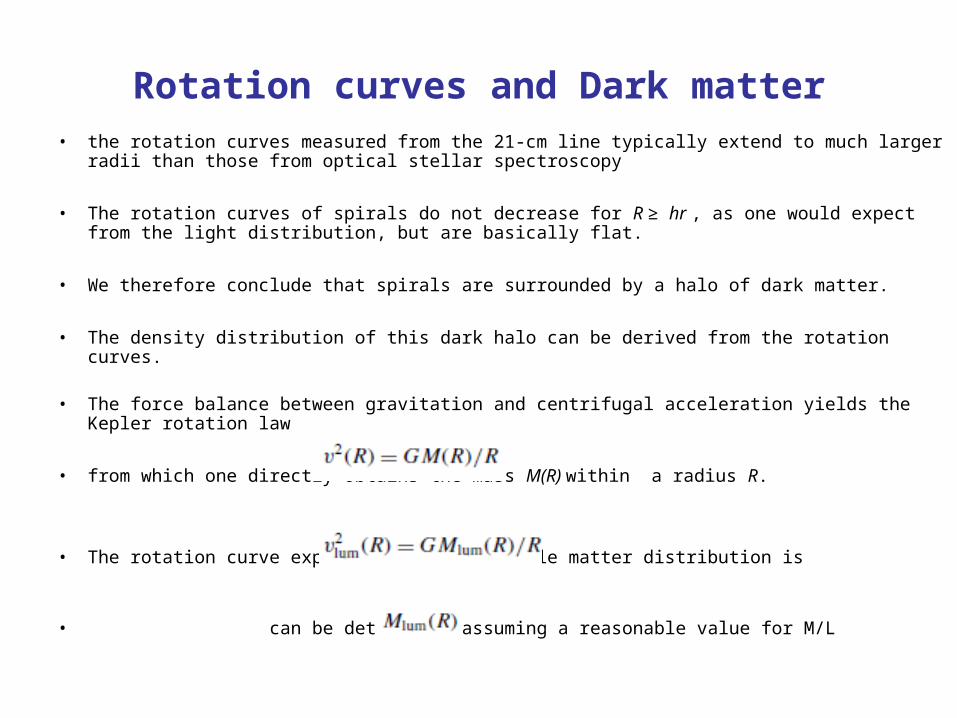
Rotation curves and Dark matter• the rotation curves measured from the 21-cm line typically extend to much larger radii than
those from optical stellar spectroscopy
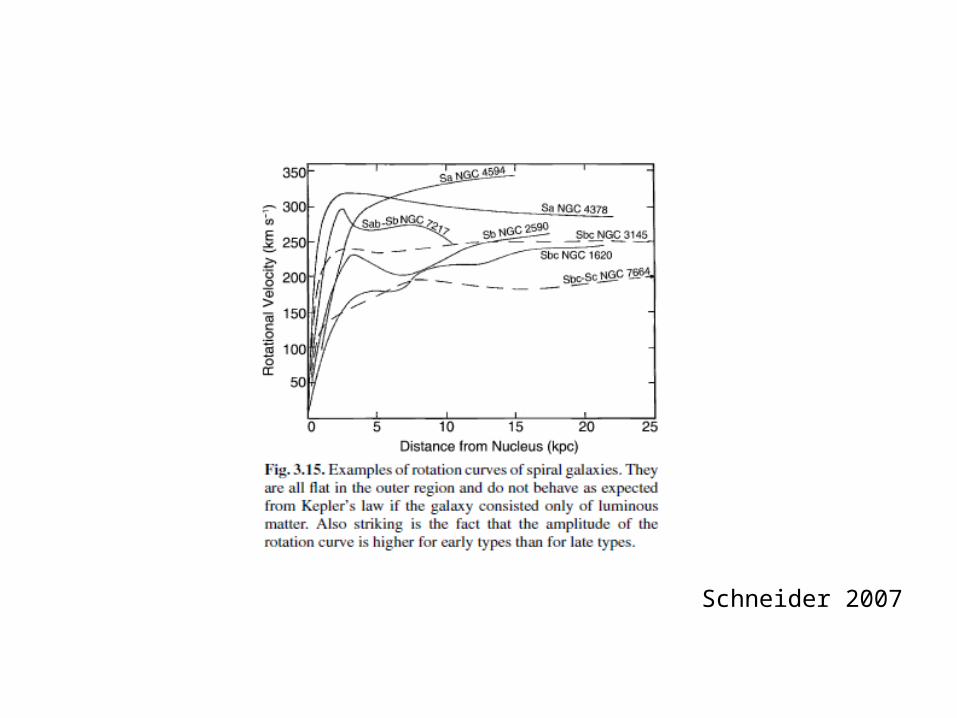
• The rotation curves of spirals do not decrease for R ≥ hr , as one would expect from the light distribution, but are basically flat.
• We therefore conclude that spirals are surrounded by a halo of dark matter.
• The density distribution of this dark halo can be derived from the rotation curves.
• The force balance between gravitation and centrifugal acceleration yields the Kepler rotation law
• from which one directly obtains the mass M(R) within a radius R.
• The rotation curve expected from the visible matter distribution is
• can be determined assuming a reasonable value for M/L

• M/L can be obtained – The spectral light distribution of the stars, together with knowledge of
the properties of stellar populations,
– or by fitting the innermost part of the rotation curve (where the mass contribution of dark matter can presumably be neglected) assuming that M/L is independent of radius for the stellar population.
• From this estimate of the mass-to-light ratio, the discrepancy between υ2lum and υ2 yields the distribution of the dark matter,
Schneider 2007
Correlations of Rotation Curves with Galaxy Properties
• The form and amplitude of the rotation curves of spirals are correlated with their luminosity and their Hubble type.
• The larger the luminosity of a spiral, the steeper the rise of v(R) in the central region, and the larger the maximum rotation velocity vmax.
• For the characteristic values of the various Hubble types, one finds– vmax ~300 km/s for Sa’s– vmax ~175 km/s for Sc’s, – vmax < 70 km/s for Irr’s.
• For equal luminosity, vmax is higher for earlier types of spirals.
• The shape (not the amplitude) of the rotation curvesof different Hubble types is similar, despite the fact that they have a different brightness profile as seen, for instance, from the varying bulge-to-disk ratio.
• This point is another indicator that the rotation curves cannot be explained by visible matter alone.
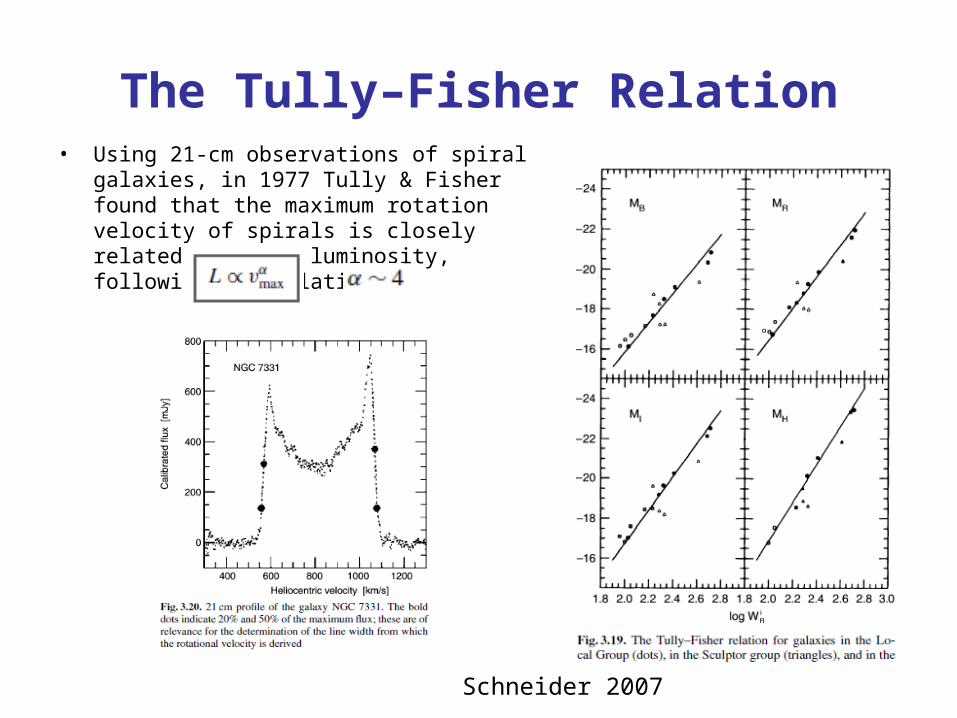
The Tully–Fisher Relation• Using 21-cm observations of spiral galaxies, in
1977 Tully & Fisher found that the maximum rotation velocity of spirals is closely related to their luminosity, following the relation
Schneider 2007