sources of government income taxes why must government tax? what is a fair tax? who should pay?
Post on 20-Dec-2015
215 views
TRANSCRIPT

TAXES

SOURCES OF GOVERNMENT INCOME TAXES Why must government tax? What is a fair tax? Who should pay?

All levels of government in our country account for more than l/3 of our GDP and employ close to one out of every six workers. Increased as of 2008…
Governments represent buyers in market for G & S and factors of production.
Governments take workers from private sector and produce something (services) that society decided it needed rather than something the market might provide. *remember.. “mix of output?”
Why Should We Care?

Virtually all of the recent growth in federal expenditure has come from increased income transfers, not purchases of goods and services.
*Exception….. Congress and Administration have been busy trying to bail out our sick economy. The lag time for seeing effects is obvious@ TARP just ended 10/3/10

The primary function of taxes is to transfer command over resources (purchasing power) from the private sector to the public sector.

The Sixteenth Amendment to the U.S. Constitution (1915) granted the federal government authority to collect income taxes.
It is now the largest single source of government revenue.
Income Taxes

GOVERNMENT INCOME
Personal Income50%
Social
Corporate10%
Security32%
Other taxes-3%
ExciseCustomsEstate and GiftMiscellaneous

GOVERNMENT OUTLAY
$.54 Social securityMedicare,other Retirement,MedicaidFood stamps,assistanceFor needy,SupplementalSecurity income, healthResearch,health programs,Unemployment, assistedHousing, social services
$.08-agriculture,transportationNatural resources,education,Environment,college loans,Job training,space,energy,
$.02 law enforcement,general govt.
$.14 Net interest onThe debt
$.18 national defense,veterans,foreignaffairs
$.04 Surplus to pay downThe debt.

Very few people think a fair tax? of taxes as payment for certain services rendered.
When we purchase a new coat, we have chosen an item in the market system…pay for it… use it.
We don’t think of that when we call the fire department or the police department…even if we are delinquent on our taxes, they still show up.
What if the fire department or police left a bill? Ambulance services do…. Should they?
How should taxes be assessed?---benefits received----ability to pay!
What Determines a Fair Tax?

Benefit Received
Ability to Pay
Two ways to determine fair tax

Benefits Received:Tax the user- gas tax for drivers- fishing license-
ramp fees for boats- toll roads-bus and train tickets-
Pay the government for benefits received- can’t pay for welfare received!

Ability to Pay Should those who
have the greatest wealth pay the most in taxes regardless of the benefits they receive??
Should income and family size be assessed?
Determining fairest principle for a just tax is matter of values rather than economics and is determined by our political process.

Total Revenue yielded Effect on Production (destroy incentive?) Bracket Creep (AMT) Moral consequences (sin taxes) Reflection of values shown in taxes imposed Convenience (withholding, quarterly,
penalties) Shifting the burden (seller to consumer) Ability to pay (relation of tax base to tax
rate)Tax rate= percentage that is taxedTax base = subject on which the tax is
levied.
Other Factors in Evaluating Taxes

Types of Taxes Progressive = tax rate increases as the
tax base increases Proportional = tax rate remains the
same regardless of the base Regressive= tax rate decreases as the
base increases. (often cited as unfair because it places heaviest burden on the least able to pay ---sales tax--- social security tax.)

Federal government gets most of its revenue from individual and corporate income taxes.
Very small portion of revenue from estate and gift taxes.
Larger share from excise taxes (gasoline, jewelry, alcohol, cigarettes, motor vehicles, admission to entertainment events,tires)
Small portion from tariffs. Transfer of estates collected since 1916 has
been phased out for estates worth $0 to$1,500,000. Was to phase back in in 2010.
Federal Government Tax System

What’s your preference? Tax the wealthy more? More revenue?
Of the three types of taxes stated earlier…. Which do you, personally, prefer?
ProgressiveRegressiveProportional
WHY………………
Tax Structure Revisited

1% $410,096
10% $113,018
25% $66,532
50% $32,879
Kiplinger report 2009Income earners (family 4)
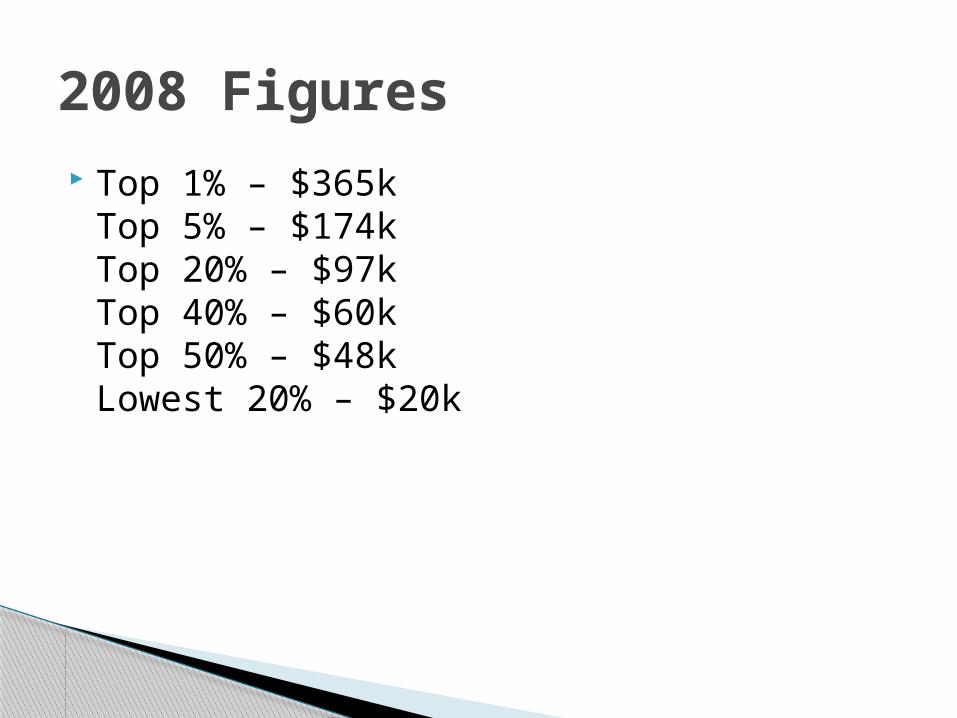
Top 1% – $365kTop 5% – $174kTop 20% – $97kTop 40% – $60kTop 50% – $48kLowest 20% – $20k
2008 Figures

Who really pays taxes?

For 2008, the poverty threshold for a single person under age 65 was an income of $11,201, or less than $1,000 a month.
For a family of four, the threshold was $21,834.
For a family of six, $28,769.
Recession just completed finds 40 million in U.S. living in poverty.
Poverty 2008 statistics

Greenspan said 3/3/05 “taxing consumption instead of income would help promote economic growth,” But warned that a “switch” raises a challenging set of transitional issues.
*What is a consumption tax?*Where is it levied?*Who would this hurt the most?
Has been discussed in this Congress also.
Consumption Tax

PROS:1. Growth of economy because it promotes
and encourages savings…. Hence capital formation!
CONS:1.Hurts people with low incomes2. Hurts business production3. Effect on GDP? Unsure?4. Probably others
Pros and Cons of Consumption Tax

PERSONAL INCOME TAXProgressive with marginal tax rates
Marginal tax rates = those assessed on additional income ranging from 10 to 35%
Individuals may deduct: Interest on Home mortgages and
Property Taxes Interest on State and local bonds This year in TX still state sales tax (2009)But,,,,,Average tax rate does rise with
income
Types of Taxes We Pay

At first glance… sales tax would appear to be proportional…. Why is it not?
Sales Tax is regressive? Larger portion of a low-income person’s
income is exposed to the tax than is a person with higher income.
Rich pay no tax on the part of their income that is saved when they can shelter it… poor are unable to save.
It is a % of income that allows it to become regressive… poor person spends all his income at 5% and the higher income person spends only 80% of his income at 5% for sales.
Sales Tax

Now in Texas…. We deducted from our gross income the amount of sales tax that we paid in the tax year reporting. (was extended to 2009) (2010 not yet announced.)
Can keep all receipts and add up or use the IRS tax table.
Note in Tax Law effective 2005

MEDICARE AND SOCIAL SECURITYRegressive
Medicare Tax…. 1.45 on all wage income Average payroll tax falls (percentage
wise) as income rises.Government does not collect payroll taxes
on nonwage income (such as interest, dividends, or rents) If both nonwage and wage incomes were added… and the total paid into SS divided by both these… the % would be even lower.
Payroll Taxes

HISTORY OF SOCIAL SECURITYBegan in 1937 as OASDHIProgram of compulsory savings financed from
compulsory payroll taxes levied on employees and employers.
Social Security is a regressive tax

1937-50 -$3,000 1990 - $51,300 2001 - $80,400
1951-54 - $3,600 1991 - $53,400 2002 - $84,900
1955-58 - $4,200 1992 - $55,500 2003 - $87,000
1959-65 - $4,800 1993 - $ 57,600 *1972 - $9,0001974 - $13,2000 1994 - $60,600 1
1995 - $61,2001976 - $15,300 1996 - $62,7001980 - $25,900 1997 - $65,4001985 - $39,600 1998 - $68,400
1999 - $72,6002000 - $76,200
Since 1981- amounts determined under automatic adjustment provisions of the SS Act
History of OASDHI Contributions

2004 - $87,9002005 - $90,000
2006 - $94,2002007 - $97,500
2008 - $102,0002009 - $106,8002010 - $106,800
Wage Base continued.

The wage base is increased every January as long as the fund is deficient… which is probably forever now because:
People live longer, retire earlier, more drawing on fund (disabled, single parents, etc.)
Ratio of retirees/workers will be significantly reduced by year 2010.
Eighteen year olds today (2002) will pay over a million and a half dollars into SS. Benefits received????
SS payroll tax today is 7.65 (FICA= 6.2% SS + l.45% Medicare) 6.2% of your wages are withheld. Your employer matches that amount for the required contribution to the SS Fund up to the wage base amount for that year.
Social Security

The employer also matches the Medicare contribution of 1.45% of your monthly earnings and there is no ceiling on this amount. Hence, this is a continual tax deduction from your earnings.
if self-employed 15.3 (12.4 SS + 2.9 Medicare) Wage base applies to SS but no limits on Medicare.
As a self-employed person, you get to take a special deduction from your income when it comes time to pay your federal income tax.(l/2 of SS paid goes under deduction for adjusted gross income)
Social Security Continued

Redistribution through public sector will reduce the size of the economic pie:
Weakens the link between productive activity and reward (taxes increased reduce individual reward for hard work-less productive.
As public policy redistributes large share of income,more resources flow into increasing it
Economics of Transfer Payments

Higher taxes to finance redistribution will induce taxpayers to focus less on income producing activities and more on income shelters *higher incomes have greater opportunity here
When leakages flow in taxes rather than in savings (money is unproductive)
Money that is productive generates more capital
More capital generates more jobs. More jobs generates more income.
Economics of Transfer

The government is called upon to distribute merit goods when the market does not provide enough.
A merit good is a good or service society deems everyone is entitled to some minimal quantity . Public goods have two particular characteristics. They are:
1. Non-excludable - once the goods are provided, it is not possible to exclude people from using them even if they haven't paid. This allows 'free-riders' to consume the good without paying.
2. Non-rival - this means that consumption of the goods by one person does not diminish the amount available for the next
Merit Goods

SS made possible by tax dollars Out of every dollar paid in SS taxes ($.69
goes into fund to pay retirement and survivors benefits) ($.19 goes to fund that pays Medicare benefits)($.12 goes to fund that pays disability benefits)
How is Social Security Funded?www.sss_enews
0
10
20
30
40
50
60
70
EastWestNorth
East = $.69 - retirementWest = $.19 - medicareNorth = $.12 - disability

Taxes paid today go to pay benefits for people drawing today.
Do you think there is a “special fund” where the SS dollars go???

Today 3+ workers for every person drawing. (extra money in fund invested in U.S. Treasury bonds)
Number of retirees is increasing and number of workers/retiree is decreasing. In 30 years 2+ workers for every person drawing.
By 2016 - U.S. paying out more in retirement benefits than collecting
By 2038- the fund is projected to be empty –(spring,2004, released data that said 2052)
Re-design of system is imperative.
Continued SS Funding

70% of SS goes to retirees - avg monthly benefit of $898.20
15% to disabled workers and familiesMay, 2003- avg benefit for disabled
workers was $837.7015% goes to widows, widowers, and
families – avg check of $850.80By 2030-twice as many older
Americans 35 million to 70 million. Now there are 3.4 workers for every beneficiary… by 2030 there will be just 2.1 workers for each beneficiary.
More Grim Statistics Concerning SS

EXPLAIN
“Nobody gets any if their ain’t none!”Incredible Bread Machine, script, 1970

Government Growth50
45
40
35
30
25
20
15
10
5
01930 1935 1940 1945 1950 1955 1960 1965 1970 1975 1980 1985 1990 2000
Perc
enta
ge o
f Nat
iona
l Out
put
State and local purchases
Federal purchases
Total government purchases

So… realizing how many poor people there are in the U.S…………Which of the three types of taxes would you prefer the federal government to use?Which tax for state government to use?Which tax for local government to use?
How would you fund schools if you had a vote?
What is considered “poor?”
Back to Tax Structure!

POVERTY LEVEL
Poverty Guideline level : family of four
1999= $16,000 2000 =$17,050 2001 = $18,100
(Alaska $22,630) 2002 = $18,392 2003 = $18,725 2006 = $22,000
(roughly) Paid no taxes Budget Problems $1,818 a month. Food,clothing,insuran
ce,transportation, sales taxes,shelter,etc.
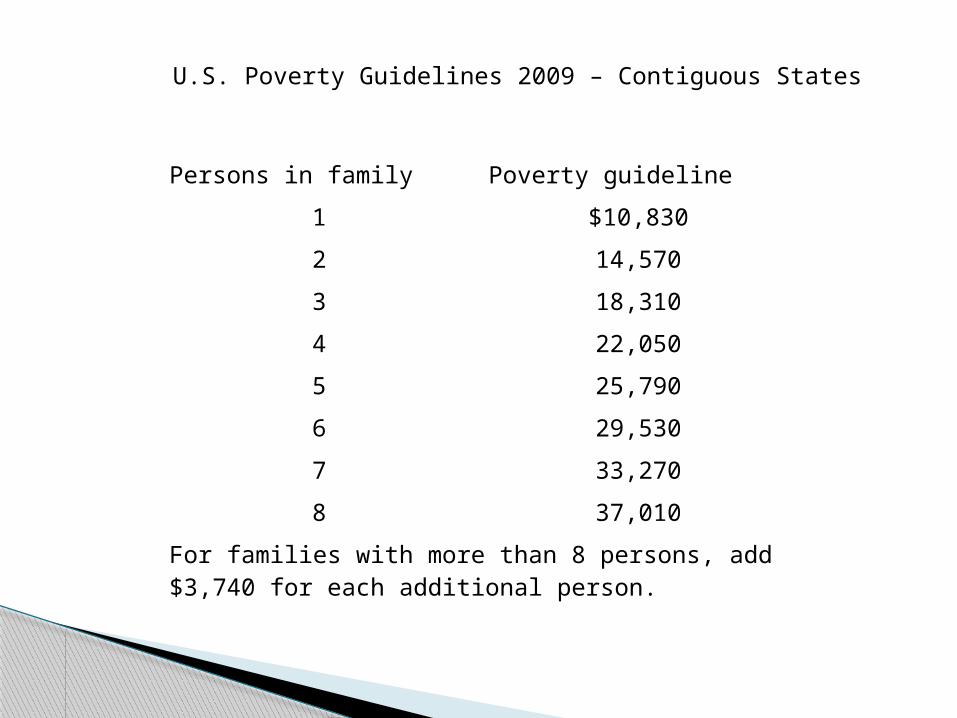
Persons in family Poverty guideline
1 $10,830
2 14,570
3 18,310
4 22,050
5 25,790
6 29,530
7 33,270
8 37,010
For families with more than 8 persons, add $3,740 for each additional person.
he 48 Contiguous States and DC
U.S. Poverty Guidelines 2009 – Contiguous States

Unemployment compensation, Workers’ compensation, Social Security, Supplemental Security Income, public assistance, Veterans’ payments survivor benefits, Pension or retirement income, Interest,dividends, rents, royalties, income
from estates, trusts, Educational assistance, Alimony Child support Assistance from outside the household Miscellaneous ?
Money Income Guidelines for Poverty

The EITC (Earned Income Tax Credit) is aimed at low-income workers.
It is a tax credit that is direct dollar-for-dollar reduction in your tax bill (or boost to your refund)
Married couples filing joint returns with 2+ children, can get a credit of more than $4,000. (up to a certain income threshold)
Earned Income Credit

In 1999, if taxpayers earned less than $30,580 and had more than one
qualifying child living with them,Less than $26,928 with one qualifying childLess than $10,200 if they didn’t have
children
The IRS has “tests” your child has to meet before being considered a qualifying child.
Who Qualifies for EITC?

1974 = $14,747 According to a separate1978 = $20,428 report from the Census1982 = $27,619 Bureau (last week of Sept1986 = $34,716 2002), American 1990 = $41,451 households had taken a1993 = $45,161 beating during last year’s1997 = $53,350 recession &
unemployment2000 = $62,228 Median household
incomes
Trail of tears or smilesMedian Income history

MEDIAN INCOMES in U.S.
in 2001 …. Fell to $42,228 2002…$43,381… (unemployment,
economic downturn) “Rising Tide Lifts All Boats.
”2003…$43,318…(reflects economic sluggishness)
2005…$46,3262007… $50,233 2008 … $44,3892009 …..$48,500

Highest, 2003
New Jersey $55,221Maryland $55, 213New Hampshire $55,16
Lowest 2003
Mississippi $31,887
West Virginia $31,210
Arkansas $33,210
Highest and Lowest Median Income States

Income Distribution in Fifths
0
20,000
40,000
60,000
80,000
100,000
120,000
140,000
160,000
180,000
Lowest Second Third Fourth Top 5%
Income l/5s in 2001Income l/5 in 2002
The first fourth are$ figures at the upperLimit of each 5th $Figure… The top 5% Is not…

Highest Percentage
Arkansas 18.5Mississippi 17.9District of Columbia
17.3
Lowest Percentage
New Hampshire 6.0
Minnesota 7.1
Delaware, Maryland 7.7
States/areas with highest percentage of people below poverty line, 2003

Virtually all of the recent growth in federal expenditure has come from increased income transfers, not purchases of goods and services.
Why is the U.S. Economy owing billions of dollars?“If you subsidize something you get more of it.”
Dr. Milton Friedman, Free to Choose

Question is:What kind of an economy do we Joe Q’s want?
The primary function of taxes is to transfer command over resources (purchasing power) from the private sector to the public sector.
Why from private to public? Why not the other way around?
So, it all gets back to Joe Q Citizen… Taxes paid to government.

Government failure occurs when government intervention fails to improve economic outcomes.

Government waste implies that the public sector isn’t producing as many services as it could with the sources at its disposal.
With such inefficiency, we are producing inside our production-possibilities curve.
Opportunity costThe issue of government waste
encompasses questions of efficiency and opportunity cost.
Perceptions of Waste

Additional public-sector activity is desirable only if the benefits from that activity exceed its opportunity costs.
*Will new mandates for cleaning a smoke stack benefit (LR/SR) or just increase cost of generating electricity…
*Will easing the mandates for cleaner fuel in CA really help lower the cost of gasoline at the pumps?
*Will prescription drug program really help those who need it?
Will Health Care Bill be beneficial or not?OR DOES THE COST OVERWEIGH THE BENEFIT?
Since McDonalds is not going to cover over 30,000 of their employees on the new Health Care… what kind of cost does that have for our society?
Cost-Benefit Analysis


Income Taxes The Sixteenth Amendment to the U.S.
Constitution (1915) granted the federal government authority to collect income taxes.
It is now the largest single source of government revenue.
Where does the Congress get its authority to tax us personally?

State and Local Tax Sources
STATE TAX SOURCES
Corporate 6%Property 2%
Other9%
Income35%
Sales48%
LOCAL TAX SOURCES
Other 6%
Sales 15%
Income 6%
Property73%
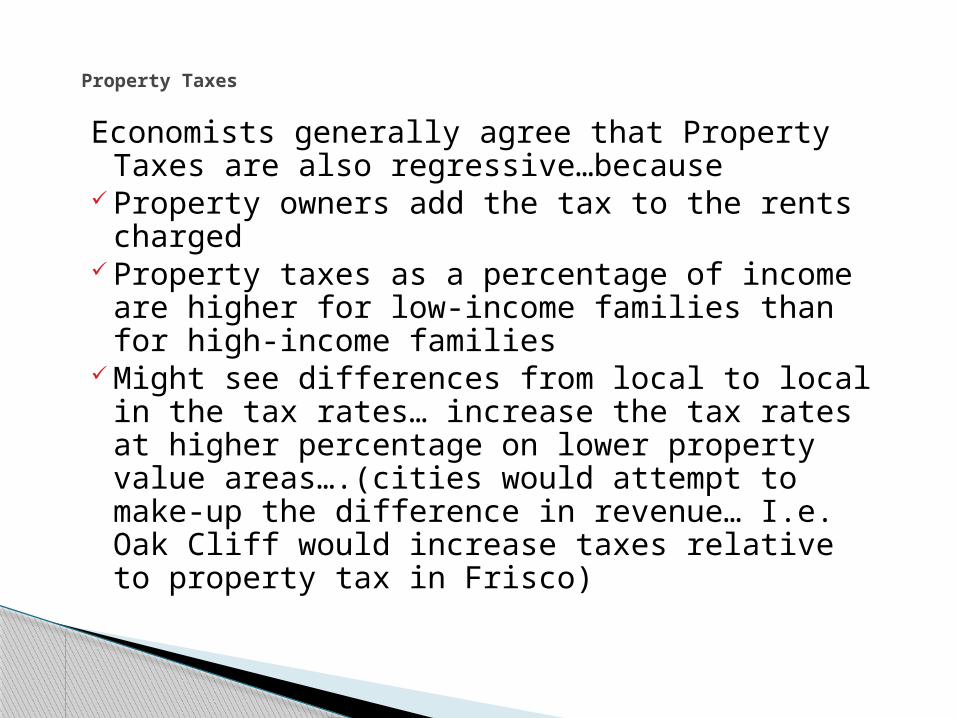
Economists generally agree that Property Taxes are also regressive…because
Property owners add the tax to the rents charged
Property taxes as a percentage of income are higher for low-income families than for high-income families
Might see differences from local to local in the tax rates… increase the tax rates at higher percentage on lower property value areas….(cities would attempt to make-up the difference in revenue… I.e. Oak Cliff would increase taxes relative to property tax in Frisco)
Property Taxes

TEXASSales TaxesState Sales Tax: 6.25% (food, prescription and non-prescription drugs exempt); local option taxes can raise the rate to 8.25%.Gasoline Tax: 20 cents/gallonDiesel Fuel Tax: 20 cents/gallonGasohol Tax: 20 cents/gallon
Personal Income Taxes No state personal income taxCongress just passed/waiting for signature, the authority for TX to deduct sales tax from Federal Income Declarations.
Retirement Income: Not taxed. Taxes by State

Subject 2010 2011
Top income tax rate 35% 39.6%
Top dividend – tax rate
15% 39.6%
Top Capital –Gains rate
15% 20%
Top Estate-Tax rate 0% 55%
Tax Question – before 12/31/10

“POWER CORRUPTS AND ABSOLUTE POWER CORRUPTS ABSOLUTELY!”
Lord Acton
“POWER TO TAX IS POWER TO DESTROY”
Chief Justice John Marshall…. McCullough vs Maryland

