bioinf.org.uk - prof. andrew c.r. martin's group at ucl
TRANSCRIPT

The University of Reading
Thesis submitted for the degree of Doctor of Philosophy
Automation of Protein Annotation toScan for Potential Drug Targets — a
Case Study of MEP Pathway andApicoplast Proteins
Sri Vishnu Vardhan
Deevi
School of Biological
Sciences
November 2007
Abstract
The basic aim was to automate the process of protein annotation in order to
evaluate protein sequences of the Methyl Erythritol Phosphate (MEP) pathway
and the apicoplast for purposes of Structure Based Drug Design (SBDD). Two
novel tools were developed: APAT and TAPAS.
APAT is an extensible system to execute many serially independent annota-
tion and prediction tools. XML formats were designed to capture the required
input and output of a wide variety of annotation tools. Wrappers were writ-
ten for tools running both locally and remotely and a display tool was written
to generate HTML output. TAPAS is a specialized pipeline for ranking targets
based on their suitability for SBDD (at basic level devoid of detailed structural
studies). A ranking is provided based on the presence or absence of human hits,
enzyme hits, structure hits, ligand hits, and transmembrane regions.
In an effort to improve transmembrane predictions, a combined neural net-
work predictor was developed using the output from three of the best transmem-
brane predictors: TMHMM, MEMSAT and DAS-TMfilter. Performance of the
individual programs and the combined predictor was evaluated amd the effect of
masking signal peptide residues was assessed. At the residue level, the combined
predictor performed only marginally better than TMHMM and signal peptide
i

masking reduced performance. At the whole protein level, TMHMM used alone
with signal peptide masking provided the best performance.
In the analysis of the MEP pathway and apicoplast proteins, 58% of the
544 apicoplast proteins were given a high SBDD target score. However, out of
the 544 sequences, only 36 (6.6%) were given the highest rank (6 out of 6) and
further 36 (6.6%) were given the second highest rank (5 out of 6) because of the
distribution of 58% of targets as a result of ranking. 12 out of the 13 (reviewed)
top-ranked sequences are already being exploited as drug targets thus supporting
the ranking scheme. The remaining protein is a hypothetical protein for which
there is no known drug or inhibitor although there is a known ligand to which a
number of drugs have over 80% 2D similarity. 8 sequences are ranked second and
have known structures making them eminently suitable for SBDD. Another 28
sequences have no known structure, but otherwise rank highly and are therefore
sensible choices to be solved by x-ray crystallography or NMR.
ii

Declaration
I hereby declare that this is my own work and the use of all material from other
sources has been properly and fully acknowledged to the best of my knowledge.
(Sri V. V. Deevi)
iii

Abbreviations
The following abbreviations are used in this thesis:
Nucleic Acids
cDNA complementary DNADNA Deoxyribo Nucleic AcidmRNA messenger RNARNA Ribo Nucleaic AcidrRNA ribosomal RNAtRNA transfer RNA
Amino Acids
A Ala Alanine M Met MethionineC Cys Cysteine N Asn AsparagineD Asp Aspartic acid P Pro ProlineE Glu Glutamic acid Q Gln GlutamineF Phe Phenylalanine R Arg ArginineG Gly Glycine S Ser SerineH His Histidine T Thr ThreonineI Ile Isoleucine V Val ValineK Lys Lysine W Trp TrytophanL Leu Leucine Y Tyr Tyrosine
iv

Miscellaneous
A AngstromAC Accession CodeAIDS Acquired Immuno Deficiency SyndromeANN Artificial neural networksAPAT Automated Protein Annotation ToolAPI Application Program InterfaceATP Adinosine TriPhosphateBLAST Basic Local Alignment Search ToolCDP Cytosine DiPhosphateCGI Common Gateway InterfaceCTP Cytosine TriPhosphateDAG Directed Acyclic GraphDTD Document Type DefinitionEC Enzyme CommissionE-value Expectation valueGPCR G-Protein Coupled ReceptorHIV Human Immunodeficiency VirusHMM Hidden Markov ModelHTML Hyper Text Markup LanguageHTTP Hyper Text Transfer ProtocolID IdentifierKEGG Kyoto Encyclopedia of Genes and GenomesMCC Matthews’ Correlation CoefficientMEP Methyl Erythritol PhosphateNADPH Reduced form of Nicotinamide Adinine Dinucleotide PhosphateNMR Nuclear magnetic resonancePDB Protein DatabankPIR Protein Information ResourcePsi-BLAST Position specific iterative BLASTRDBMS Relational DataBase Management SystemRMSD Root mean square deviationRprop Resilient back-propagationSBDD Structure Based Drug DesignSNNS Stuttgart Neural Network SimulatorSOAP Simple Object Access ProtocolSQL Structured Query LanguageSVM Support Vector MachineTAPAS Target Annotation Pipeline and Automated SelectionUniprotkB Universal Protein Resource KnowledgebaseXML eXtensible Markup Language
v

Acknowledgement
If there is one person whom I owe an enormous amount of gratitude for makingthis possible, it is my supervisor Dr. Andrew C. R. Martin, for showing tremen-dous levels of patience in motivating me and being a huge support through out.He has been and will continue to be a source of inspiration and I am blessed tohave worked under the best supervisor one could possibly have.
I am very grateful and indebted to Felix trust for providing me with a schol-arship and thus a wonderful oppurtunity to do my Ph.D.
I thank Dr. Mike Fry and Dr. Gail Hutchinson for being my Reading basedsupervisors and extending their help and advice when needed. My thanks arealso due to my labmates and staff at the University of Reading and UniversityCollege London, who have helped me in one way or the other.
I thank my parents and brother for their perennial love and faith. I also thankmy friends across the globe for being my well-wishers.
Last but not least, my sincere thanks are due to Dhami for being my bestfriend and supporting me all the time.
vi

Contents
Abstract i
Declaration iii
Abbreviations iv
Acknowledgement vi
Contents vii
1 Introduction 1
1.1 Isoprenoids . . . . . . . . . . . . . . . . . . . . . . . . . . . . . . 2
1.1.1 MEP pathway . . . . . . . . . . . . . . . . . . . . . . . . . 6
1.2 The Apicoplast . . . . . . . . . . . . . . . . . . . . . . . . . . . . 14
1.3 Structure Based Drug Design . . . . . . . . . . . . . . . . . . . . 17
1.4 Druggability . . . . . . . . . . . . . . . . . . . . . . . . . . . . . . 18
2 Introduction to Bioinformatics Tools - Mass Sequence Analysis 27
2.1 Workflows . . . . . . . . . . . . . . . . . . . . . . . . . . . . . . . 27
2.1.1 Taverna . . . . . . . . . . . . . . . . . . . . . . . . . . . . 29
2.1.2 ToolBus . . . . . . . . . . . . . . . . . . . . . . . . . . . . 30
vii

CONTENTS CONTENTS
2.1.3 Other tools . . . . . . . . . . . . . . . . . . . . . . . . . . 31
2.2 Machine Learning Methods . . . . . . . . . . . . . . . . . . . . . . 39
2.2.1 Bayesian Methods . . . . . . . . . . . . . . . . . . . . . . . 40
2.2.2 Hidden Markov Models . . . . . . . . . . . . . . . . . . . . 43
2.2.3 Decision Trees . . . . . . . . . . . . . . . . . . . . . . . . . 44
2.2.4 Support Vector Machines . . . . . . . . . . . . . . . . . . . 46
2.2.5 Artificial Neural Networks . . . . . . . . . . . . . . . . . . 48
3 An Extensible Automated Protein Annotation Tool — APAT 55
3.1 Introduction . . . . . . . . . . . . . . . . . . . . . . . . . . . . . . 56
3.1.1 Workflows and pipelines . . . . . . . . . . . . . . . . . . . 60
3.2 Software requirements . . . . . . . . . . . . . . . . . . . . . . . . 61
3.3 Approach and methods . . . . . . . . . . . . . . . . . . . . . . . . 63
3.3.1 Analysis of input and output of various annotation and
prediction tools . . . . . . . . . . . . . . . . . . . . . . . . 63
3.3.2 Input data . . . . . . . . . . . . . . . . . . . . . . . . . . . 63
3.3.3 Output data . . . . . . . . . . . . . . . . . . . . . . . . . . 64
3.3.4 System architecture . . . . . . . . . . . . . . . . . . . . . . 74
3.3.5 Web interface . . . . . . . . . . . . . . . . . . . . . . . . . 80
3.4 Summary and Discussion . . . . . . . . . . . . . . . . . . . . . . . 80
4 Target Annotation Pipeline and Automated Selection — TAPAS 84
4.1 Introduction . . . . . . . . . . . . . . . . . . . . . . . . . . . . . . 85
4.2 Specific software requirements . . . . . . . . . . . . . . . . . . . . 91
4.3 Approach and methods . . . . . . . . . . . . . . . . . . . . . . . . 92
4.3.1 Workflow and overall architecture . . . . . . . . . . . . . . 92
viii

CONTENTS CONTENTS
4.3.2 Applying annotations in a stepwise manner . . . . . . . . . 96
4.3.3 Integrating APAT into the pipeline . . . . . . . . . . . . . 100
4.3.4 Cross-linking and tabulating data . . . . . . . . . . . . . . 101
4.3.5 Making a drug target selection table . . . . . . . . . . . . 102
4.4 Summary and Discussion . . . . . . . . . . . . . . . . . . . . . . . 103
5 Improving Prediction of Transmembrane Proteins 106
5.1 Introduction . . . . . . . . . . . . . . . . . . . . . . . . . . . . . . 106
5.1.1 Membrane Proteins . . . . . . . . . . . . . . . . . . . . . . 107
5.1.2 Transmembrane Prediction . . . . . . . . . . . . . . . . . . 113
5.2 Methods . . . . . . . . . . . . . . . . . . . . . . . . . . . . . . . . 118
5.2.1 Tools and methods used in this analysis . . . . . . . . . . 118
5.2.2 Datasets . . . . . . . . . . . . . . . . . . . . . . . . . . . . 121
5.2.3 Using APAT and implementation of the neural network . . 124
5.3 Results and Discussion . . . . . . . . . . . . . . . . . . . . . . . . 127
5.3.1 Single residue prediction . . . . . . . . . . . . . . . . . . . 127
5.3.2 Whole protein prediction . . . . . . . . . . . . . . . . . . . 135
5.4 Summary . . . . . . . . . . . . . . . . . . . . . . . . . . . . . . . 138
6 Analysis of the MEP Pathway and Apicoplast Proteins Using
TAPAS 141
6.1 Approach and Methods . . . . . . . . . . . . . . . . . . . . . . . . 143
6.1.1 Labelling sequence origin . . . . . . . . . . . . . . . . . . . 143
6.1.2 Predicting whether a protein is a transmembrane protein . 146
6.1.3 Analysis of apicoplast proteins . . . . . . . . . . . . . . . . 147
6.1.4 Execution of MEP proteins . . . . . . . . . . . . . . . . . 147
ix

CONTENTS CONTENTS
6.1.5 Analysis of the output . . . . . . . . . . . . . . . . . . . . 148
6.2 Results and Discussion . . . . . . . . . . . . . . . . . . . . . . . . 153
6.2.1 Analysis of the output . . . . . . . . . . . . . . . . . . . . 153
6.3 Summary . . . . . . . . . . . . . . . . . . . . . . . . . . . . . . . 162
6.3.1 Evaluation of performance of TAPAS ranking scheme . . . 164
7 Conclusions 166
7.1 Automation of annotation . . . . . . . . . . . . . . . . . . . . . . 167
7.1.1 Development of APAT . . . . . . . . . . . . . . . . . . . . 167
7.1.2 Development of TAPAS . . . . . . . . . . . . . . . . . . . 169
7.1.3 Improving prediction of transmembrane proteins . . . . . . 170
7.1.4 Analysis of the MEP pathway and apicoplast proteins using
TAPAS . . . . . . . . . . . . . . . . . . . . . . . . . . . . 172
7.2 Summary . . . . . . . . . . . . . . . . . . . . . . . . . . . . . . . 174
Bibliography . . . . . . . . . . . . . . . . . . . . . . . . . . . . . . . . 176
x

List of Figures
1.1 Growth of GenBank . . . . . . . . . . . . . . . . . . . . . . . . . 3
1.2 Growth of PDB . . . . . . . . . . . . . . . . . . . . . . . . . . . . 4
1.3 Mevalonate versus MEP Pathway . . . . . . . . . . . . . . . . . . 7
1.4 The MEP pathway in detail. . . . . . . . . . . . . . . . . . . . . . 9
1.5 Chemical structures of Fosmidomycin and FR-900098 . . . . . . . 14
1.6 Origin of Apicoplasts through secondary endosymbiosis . . . . . . 15
1.7 Cytotoxic pathway for cisplatin . . . . . . . . . . . . . . . . . . . 21
1.8 Number of drug targets in human genome . . . . . . . . . . . . . 22
1.9 Drug target gene families in human genome . . . . . . . . . . . . 23
2.1 A taxonomy of scientific workflow systems for Grid computing
(Figure reproduced from (Yu and Buyya, 2005a)). . . . . . . . . 35
2.2 Bayesian network . . . . . . . . . . . . . . . . . . . . . . . . . . . 42
2.3 Hidden Markov Model . . . . . . . . . . . . . . . . . . . . . . . . 43
2.4 Decision Tree . . . . . . . . . . . . . . . . . . . . . . . . . . . . . 45
2.5 Support Vector Machines . . . . . . . . . . . . . . . . . . . . . . . 47
2.6 Pattern recognition example . . . . . . . . . . . . . . . . . . . . . 50
2.7 The process of handling data by a node — simple input, data
processing and output generation. . . . . . . . . . . . . . . . . . . 50
xi

LIST OF FIGURES LIST OF FIGURES
2.8 Architecture of a simple feed-forward neural network . . . . . . . 51
3.1 Simple depiction of a workflow/pipeline. . . . . . . . . . . . . . . 61
3.2 Simple depiction of a tool with minimal flow of data from one
process to another — annotation fan (e.g. APAT). . . . . . . . . . 62
3.3 An example of the XML format used for input to the APAT system. 65
3.4 APATINML DTD. . . . . . . . . . . . . . . . . . . . . . . . . . . 65
3.5 Summary of the key aspects of an APATML output file for per-
residue annotations. . . . . . . . . . . . . . . . . . . . . . . . . . . 66
3.6 Summary of the key aspects of an APATML output file for per-
domain annotations. . . . . . . . . . . . . . . . . . . . . . . . . . 68
3.7 Summary of the key aspects of an APATML output file for per-
sequence annotations. . . . . . . . . . . . . . . . . . . . . . . . . . 69
3.8 APATML DTD. . . . . . . . . . . . . . . . . . . . . . . . . . . . . 75
3.9 Sample HTML output from the APAT system . . . . . . . . . . . 76
3.10 Overall architecture of the APAT system. . . . . . . . . . . . . . . 78
4.1 Workflow of TAPAS. . . . . . . . . . . . . . . . . . . . . . . . . . 93
4.2 Overall architecture of TAPAS. . . . . . . . . . . . . . . . . . . . 95
4.3 Sample extract from the intermediate output file having GenBank
style IDs cross-linked to their corresponding SwissProt ACs. . . . 97
4.4 Sample extract from the intermediate output file having SwissProt
ACs mapped to their species name. . . . . . . . . . . . . . . . . . 98
4.5 Sample extract from the intermediate output file having SwissProt
ACs matched with their EC numbers. . . . . . . . . . . . . . . . . 99
xii

LIST OF FIGURES LIST OF FIGURES
4.6 Sample extract from the intermediate output file having EC num-
bers matched with their KEGG pathway maps. . . . . . . . . . . 100
4.7 Sample extract from the intermediate output file from the cross-
linked data table. . . . . . . . . . . . . . . . . . . . . . . . . . . . 102
4.8 Sample extract from the final output file from the drug target
selection table. . . . . . . . . . . . . . . . . . . . . . . . . . . . . 103
4.9 Sample extract from the ligand page obtained by clicking ‘All ligs’
link from the final output page of drug target selection table. . . . 104
5.1 Membrane protein architecture. . . . . . . . . . . . . . . . . . . . 108
5.2 Alpha helical bundles and beta barrels . . . . . . . . . . . . . . . 111
5.3 Signal peptide masking . . . . . . . . . . . . . . . . . . . . . . . . 119
5.4 Dataset preparation for analysis at the protein level. . . . . . . . . 123
5.5 Systematic removal of sequences from the transmembrane dataset
to improve the quality of dataset. . . . . . . . . . . . . . . . . . . 125
5.6 Histogram of output values from the neural network . . . . . . . . 129
6.1 Sample extract of output from origin-finder script which includes
specific details required by different tools. . . . . . . . . . . . . . . 144
6.2 Output from the script that masks signal peptide residues among
TMHMM predictions to improve transmembrane prediction. . . . 146
6.3 Rating Scheme . . . . . . . . . . . . . . . . . . . . . . . . . . . . 152
6.4 Quantitative analysis - apicoplast . . . . . . . . . . . . . . . . . . 154
6.5 Signal anchor protein . . . . . . . . . . . . . . . . . . . . . . . . . 155
6.6 Quantitative analysis - cordip . . . . . . . . . . . . . . . . . . . . 157
6.7 Target score - apicoplast . . . . . . . . . . . . . . . . . . . . . . . 158
xiii

LIST OF FIGURES LIST OF FIGURES
6.8 High and low scoring zones . . . . . . . . . . . . . . . . . . . . . . 159
6.9 Target scores - scoring zones . . . . . . . . . . . . . . . . . . . . . 160
xiv

List of Tables
1.1 Some DNA binding drugs . . . . . . . . . . . . . . . . . . . . . . 20
2.1 Taxonomy mapping to Grid workflow systems . . . . . . . . . . . 34
3.1 Annotation types returned by a number of example tools. . . . . . 64
3.2 A detailed list of XML tags included in APATML. . . . . . . . . . 72
3.3 Wrappers are made available for the tools listed here along with
their web addresses. . . . . . . . . . . . . . . . . . . . . . . . . . . 79
5.1 MCC scores for the un-masked and un-normalized combined pre-
dictor . . . . . . . . . . . . . . . . . . . . . . . . . . . . . . . . . 128
5.2 MCC scores for the un-masked and normalized combined predictor 131
5.3 MCC scores for the un-masked and un-normalized combined pre-
dictor using only TMHMM and MEMSAT . . . . . . . . . . . . . 132
5.4 MCC scores for the masked and un-normalized combined predictor 133
5.5 MCC scores for the un-masked and un-normalized combined pre-
dictor while using lower hidden layer size and input window size
of 5 . . . . . . . . . . . . . . . . . . . . . . . . . . . . . . . . . . . 134
xv

LIST OF TABLES LIST OF TABLES
5.6 MCC scores for the un-masked and un-normalized combined pre-
dictor while using lower hidden layer size and input window size
of 7 . . . . . . . . . . . . . . . . . . . . . . . . . . . . . . . . . . . 135
5.7 MCC scores for the un-masked and un-normalized combined pre-
dictor while using lower hidden layer size and input window size
of 9 . . . . . . . . . . . . . . . . . . . . . . . . . . . . . . . . . . . 136
5.8 MCC scores from the best residue-level predictor (un-masked, un-
normalized) in whole protein level predictions . . . . . . . . . . . 137
5.9 MCC score for TMHMM in whole protein level predictions. . . . . 139
6.1 Diseases - pathogens having MEP . . . . . . . . . . . . . . . . . . 142
6.2 Gram-Positive and Gram-Negative . . . . . . . . . . . . . . . . . 145
6.3 Pathogens chosen for analysis . . . . . . . . . . . . . . . . . . . . 149
6.4 Target scores - Apicoplast sequences . . . . . . . . . . . . . . . . 156
6.5 Target score 5 . . . . . . . . . . . . . . . . . . . . . . . . . . . . . 163
6.6 Target score, criterion and number of apicoplast sequences . . . . 163
xvi

Chapter 1
Introduction
There has been a tremendous rise in the number of protein sequences in public
sequence databases as a result of an increase in genome sequencing projects —
82,853,685 entries were found in GenBank (Benson et al., 2007) in the February
2008 release (Figure 1.1). While the number of entries in the PDB (Berman et al.,
2000) is also on the rise, it is relatively slow — the PDB had 49,295 structures in
March 2008 (Figure 1.2). The widening gap between the number of proteins with
known 3D structures and the number of proteins with known amino acid sequence
is because of the experimental difficulties associated with obtaining protein crys-
tals capable of diffracting at good resolution which is even more difficult in the
case of transmembrane proteins whereas numerous genome sequencing projects
are employing high throughput sequencing techniques to obtain sequence infor-
mation (Cantor and Little, 1998). Despite recent advances in the field of X-ray
crystallography and multidimensional nuclear magnetic resonance (NMR) spec-
troscopy, the gap is widening at an unprecedented pace. The completion of the
Human Genome Project (HGP) in 2003 (Collins et al., 2003) has set off a series of
genome sequencing projects, but the revolutionary advances in the field of DNA
1

1.1. ISOPRENOIDS CHAPTER 1. INTRODUCTION
sequencing has marked the end of yesteryear’s state-of-the-art sequencing tech-
nology (Sanger et al., 1977) and the beginning of ultra-cheap DNA sequencing
techniques (Metzker, 2005). The production of enormous amounts of sequence
data also stresses the need for bioinformatics — automated annotation (genome
annotation) and analysis of the hidden meaning in “A”, “T”, “G”, and “C” to
make any sense of the data.
Similarly, to derive biological meaning out of the 20 amino acid sequences,
protein annotation is invaluable. Annotation can be defined as any piece of infor-
mation associated with an amino acid sequence. Annotating protein sequences
to assign them a function through homology, cross-linking them to various other
databases, obtaining annotations from different prediction and annotation tools,
and obtaining structural details is a tedious and error prone task to do manually.
My project mainly deals with automating the process of protein annotation, de-
signing a pipeline for automated drug target selection for Structure Based Drug
Design (SBDD) and annotating the protein sequences of the apicoplast and the
Methyl Erythritol Phosphate (MEP) pathway.
1.1 Isoprenoids
Isoprenoids (also called as terpenoids) are one of the oldest known biomolecules,
recovered from sediments that are 2.5 billion years old (Lange et al., 2000; Brocks
et al., 1999; Summons, 1999). They constitute the largest group of naturally oc-
curring compounds with over 35,000 known compounds (Hunter, 2007; Dubey et
al., 2003; Dewick, 2002; Lange et al., 2000; Sacchettini and Poulter, 1997). Isopen-
tenyl pyrophosphate/Isopentenyl diphosphate (IPP) and its dimer, dimethylallyl
pyrophosphate/dimethylallyl diphosphate (DMAPP) are basic C5 isoprene units
2

1.1. ISOPRENOIDS CHAPTER 1. INTRODUCTION
Figure 1.1: Growth of GenBank from 1982 to 2005 — reproduced from http:
//www.ncbi.nlm.nih.gov/Genbank/genbankstats.html.
3

1.1. ISOPRENOIDS CHAPTER 1. INTRODUCTION
Figure 1.2: Growth of PDB from 1972 to 2008 — reproduced fromhttp://www.rcsb.org/pdb/statistics/contentGrowthChart.do?content=
total&seqid=100.
4

1.1. ISOPRENOIDS CHAPTER 1. INTRODUCTION
which act as precursors of natural products called isoprenoids.
Isoprenoids are the building blocks of various essential components of the cell
and perform a wide variety of biochemical functions (Hunter, 2007; Dubey et al.,
2003; Mahmoud and Croteau, 2002; Wanke et al., 2001; Lange et al., 2000; Bach
et al., 1999; Sacchettini and Poulter, 1997). These include:
• respiration (electron transport) — ubiquinone,
• photosynthesis (pigments) — carotenoids, chlorophylls, and plastoquinones,
• structural components of biological membranes — prenyllipids (archaebac-
teria) and sterols (eubacteria and eukaryotes),
• hormones (growth and regulation) — in plants (gibberellins, brassinos-
teroids, abscisic acid, cytokinins, prenylated proteins) and in animals
(steroid hormones and pheremones),
• defense system — in plants (monoterpenes, sesquiterpenes, diterpenes —
essential oils which are also used as flavouring and fragrance agents in foods,
beverages, cosmetics, perfumes, soaps) and in animals (apoptosis, protein
cleavage and degradation),
• intracellular signal transduction and vesicular transport or subcellular
transport — Ras proteins and Rab proteins (prenylated proteins),
• coenzymes — dolichols,
• regulation of transcription and post-translational processes, lipid biosyn-
thesis, meiosis, and glycoprotein biosynthesis.
5

1.1. ISOPRENOIDS CHAPTER 1. INTRODUCTION
Isoprenoids are ubiquitous in all living organisms and were previously assumed
to be synthesized only through the mevalonate (MVA) pathway (Buhaescu and
Izzedine, 2007; Kobayashi et al., 2007; Boucher and Doolittle, 2000; Bach et al.,
1999; Eisenreich et al., 1998; Goldstein and Brown, 1990; Spurgeon and Porter,
1981; Beytıa and Porter, 1976) until the recent discovery of an alternate methyl
erythritol phosphate (MEP) pathway (Hunter, 2007; Xiang et al., 2007; Seemann
et al., 2006; Eisenreich et al., 2004; Rohdich et al., 2004; Dubey et al., 2003;
Meyer et al., 2003; Kemp et al., 2002; Rodrıguez-Concepcion and Boronat, 2002;
Lange et al., 2000; Rohmer, 1999). Among these two different metabolic routes
that lead to biosynthesis of IPP and DMAPP, the mevalonate pathway occurs in
some eukaryotes (animals including all mammals), fungi, plant cytosol and mi-
tochondria, archaebacteria, some eubacteria, and Trypanasoma and Leshmania
(Hunter, 2007). The MEP pathway occurs in algae, cyanobacteria, most eubac-
teria, plant plastids (including chloroplast), apicomplexan parasites’ apicoplast
and Mycoplasma penetrans (unlike most other mycoplasmas) (Eberl et al., 2004).
The Mevalonate pathway starts with condensation of acetyl-CoA molecules
and uses seven enzymes during the biosynthesis of IPP and DMAPP whereas
to synthesize the same compounds, the MEP pathway starts with condensation
of pyruvate and d-glyceraldehyde 3-phosphate and uses nine enzymes (including
two types of non-homologous IPP isomerases — IDI-I and IDI-II) to carry out
eight reactions. (Figure 1.3).
1.1.1 MEP pathway
The following names of the pathway are all synonymous:
• MEP pathway — 2-C-methyl-d-erythritol 4-phosphate pathway
6

1.1. ISOPRENOIDS CHAPTER 1. INTRODUCTION
Figure 1.3: Isoprenoid biosynthesis in L. monocytogenes via the classical meval-onate pathway (left) and the alternative MEP pathway (right). CDP-ME,4-diphosphocytidyl-2-C-methyl-D-erythritol; CDP-MEP, 4-diphosphocytidyl-2-C-methyl-D-erythritol 2-phosphate; DMAPP, dimethylallyl pyrophosphate ;DOXP, 1-deoxy-D-xylulose 5-phosphate; MEcPP, 2-C-methyl-D-erythritol 2,4-cyclopyrophosphate; P, phosphate (figure and legend reproduced from (Begleyet al., 2004)).
7

1.1. ISOPRENOIDS CHAPTER 1. INTRODUCTION
• DXP/DOXP pathway — 1-deoxy-d-xylulose 5-phosphate pathway
• Non-mevalonate pathway
While the first two names originate from the intermediate compounds of the
pathway, the last one is to distinguish it from the conventional mevalonate path-
way.
The MEP biosynthetic pathway (shown in Figure 1.3 and in Figure 1.4 in more
detail) is unique to, and important for, the survival of many pathogenic organ-
isms that cause major diseases such as malaria, tuberculosis, leprosy, meningitis,
bubonic plague, cholera, and typhoid. In addition, the pathway is also present
in the unusual protozoan organelle, the apicoplast, which is present in many
important pathogens such as Plasmodium falciparum, Toxoplasma gondii, and
Eimeria. Since the isopernoids are synthesized through a totally different meval-
onate pathway in humans and other higher animals, the MEP pathway enzymes
and apicoplast proteins are of great pharmaceutical significance. Chances of drug
cross-reaction will be minimal while targeting these proteins.
1. The MEP pathway commences with condensation of pyruvate and
d-glyceraldehyde-3-phosphate (GAP) to form 1-deoxy-d-xylulose-5-
phosphate (DXP) in the presence of 1-deoxy-d-xylulose-5-phosphate
synthase (DXP Synthase). DXP is also a metabolite in biosynthesis of
thiamine (vitamin B1) and pyridoxin (vitamin B6) (Xiang et al., 2007;
Sauret-Gueto et al., 2006; Dubey et al., 2003; Finkelstein and Rock, 2002;
Richard et al., 2002, 2001). Very recently a crystal structure of DXP
synthase has been published by Xiang et al. (2007).
2. DXP is then converted to 2C-methyl-d-erythritol-4-Phosphate (MEP) in
8

1.1. ISOPRENOIDS CHAPTER 1. INTRODUCTION
Figure 1.4: The MEP pathway in detail.
9

1.1. ISOPRENOIDS CHAPTER 1. INTRODUCTION
the presence of 1-deoxy-d-xylulose-5-phosphate reductoisomerase (DXPRI),
NADPH and a divalent cation such as Mg2+, Mn2+ or Co2+. DXPRI is
the most extensively studied enzyme of the MEP pathway because it is a
target for the herbicide fosmidomycin (Cassera et al., 2007; Na-Bangchang
et al., 2007; Lell et al., 2003; Steinbacher et al., 2003a; Wiesner et al., 2003;
Missinou et al., 2002; Wiesner et al., 2002; Shigi, 1989; Okuhara et al.,
1980). Crystal structures of DXPRI have been published by Ricagno et al.
(2004), Henriksson et al. (2007), Steinbacher et al. (2003a), Yajima et al.
(2007; 2002).
3. In the presence of CTP, 4-diphosphocytidyl-2C-methyl-d-erythritol cytidyl-
transferase (CDP-ME synthase) converts MEP to 4-diphosphocytidyl-2C-
methyl-d-erythritol (CDP-ME). Crystal structures have been published by
Gabrielsen et al. (2006), and Richard et al. (2001).
4. CDP-ME is then converted to 4-diphosphocytidyl-2C-methyl-d-erythritol-
2-phosphate (CDP-MEP) in the presence of ATP and 4-diphosphocytidyl-
2C-methyl-d-erythritol kinase (CDP-ME kinase). Crystal structures have
been published by Miallau et al. (2003), and Wada et al. (2003).
5. CDP-MEP is then converted to 2C-methyl-d-erythritol-2,4-
cyclodiphosphate (MECDP) in the presence of CTP and 2C-methyl-d-
erythritol-2,4-cyclodiphosphate synthase (MECDP synthase). Crystal
structures have been published by Crane et al. (2006), Sgraja et al.
(2005), Ni et al. (2004), Gabrielsen et al. (2004), Kishida et al. (2003),
Steinbacher et al. (2002), Richard et al. (2002), and Kemp et al. (2002).
6. MECDP undergoes a reduction reaction releasing a water molecule in
10

1.1. ISOPRENOIDS CHAPTER 1. INTRODUCTION
the presence of (E)-4-hydroxy-3-methylbut-2-enyl diphosphate synthase
(HMBPP synthase) (Seemann et al., 2005; Altincicek et al., 2002; Kollas et
al., 2002; Seemann et al., 2002) to form (E)-4-hydroxy-3-methylbut-2-enyl
diphosphate (HMBPP). No crystal structures have been published to date
and the mechanism of action is not clearly understood.
7. HMBPP undergoes a reduction reaction releasing a water molecule in
the presence of (E)-4-hydroxy-3-methylbut-2-enyl diphosphate reductase
(HMBPP reductase) (Lu et al., 2007; Grawert et al., 2004; Wolff et
al., 2003) to form isopentenyl diphosphate (IPP) and dimethylallyl
diphosphate (DMAPP) in a ratio ranging from 3:1 to 6:1 (Hsieh and
Goodman, 2006; Sauret-Gueto et al., 2006; Wolff et al., 2003; Adam et
al., 2002). No crystal structures have been published to date and the
mechanism of action is not clearly understood.
8. In the final step, isomerization between IPP and DMAPP is carried
out in the presence of isopentenyl diphosphate isomerase (IPP
isomerase)/isopentenyl diphosphate isomerase:dimethylallyl diphosphate
isomerase (IDI) (Anderson et al., 1989). Until recently, only one type of
IDI was known, but recently two non-homologous protein families were
identified (Kaneda et al., 2001).
(a) Type I IDI (IDI-I) has been known for a long time (Agranoff et al.,
1960, 1959) and is the conventional IDI that is found in many organ-
isms (Rohdich et al., 2004) (eukaryotes and most eubacteria) which
include Arabidopsis thaliana (Campbell et al., 1998), Saccharomyces
cerevesiae (Anderson et al., 1989), Escherichia coli (Hahn et al., 1999),
11
1.1. ISOPRENOIDS CHAPTER 1. INTRODUCTION
and humans (Hahn et al., 1996). IDI-I requires only a divalent metal
ion for its activity. IDI-I displays a compact α/β architecture. Crystal
structures have been published by Durbecq et al. (2001), Wouters et
al. (2005; 2004; 2003; 2003), Zhang et al. (2007), Zheng et al. (2007),
de Ruyck et al. (2006), Oudjama et al. (2001), and Bonanno et al.
(2001).
(b) Type II IDI (IDI-II) was recently discovered in Streptomyces
sp. strain CL190 (Kaneda et al., 2001) and is present in Archaea
and some eubacteria. In addition to a divalent metal ion, it requires
flavin mononucleotide (FMN) and NADPH for its activity. It is
an octamer with a cage-like structure with each subunit displaying
a triosephosphate isomerase (TIM) barrel fold (α8β8). Crystal
structures of Bacillus subtilis (Steinbacher et al., 2003b) and Thermus
thermophilus (de Ruyck et al., 2005) have been published.
In the MEP pathway, both IPP and DMAPP are produced (in varied pro-
portions) during the final step whereas in the mevalonate pathway, only IPP
is produced which must be converted to DMAPP by an IPP isomerase/IDI. Al-
though both the pathways use IDI for isomerization there is no simple correlation
between the type of IDI (IDI-I or IDI-II) that occurs and the type of pathway an
organism uses (Zheng et al., 2007; Steinbacher et al., 2003b). This can be best
seen through a few example organisms (Steinbacher et al., 2003b) as shown here:
Mevalonate pathway and IDI-I: Humans, Saccharomyces cerevisiae, and the
cytosol of Arabidopsis thaliana,
Mevalonate pathway and IDI-II: Archaea, Streptomyces sp. CL190 or
12

1.1. ISOPRENOIDS CHAPTER 1. INTRODUCTION
Gram-positive pathogens such as Staphylococcus aureus, Streptococci,
Enterococci,
MEP pathway and IDI-I Escherichia coli,
MEP pathway and IDI-II Bacillus subtilis, Synechocystis sp. PCC 6803 or
Deinococcus radiodurans.
IDIs are critical for the survival of the organisms that use the mevalonate
pathway for isoprenoid biosynthesis (essential — S. cerevisiae (mevalonate), non-
essential — E. coli (MEP) (Steinbacher et al., 2003b)). The variety in occurrence
of a type of IDI and the metabolic route taken by the organism for isoprenoid
biosynthesis coupled with the essentiality of IDI to the survival of an organism
makes these enzymes an attractive drug target. For example, Humans and some
Gram-positive multi-drug resistant bacterial strains of S. aureus, Streptococci, and
Enterococci use the mevalonate pathway which makes IDI an essential enzyme,
but the occurrence of IDI-I in humans in contrast to IDI-II in these pathogens is an
interesting aspect for designing novel drugs against these pathogens (Steinbacher
et al., 2003b).
Fosmidomycin (FR-31564 — 3-(N-formyl-N-hydroxy) aminopropylphos-
phonic acid; Figure 1.5) is a phosphonic acid herbicide/antibiotic discovered
in Fujisawa Research Laboratories in the fermentation broths of Streptomyces
lavendulae (Shigi, 1989; Okuhara et al., 1980). Fosmidomycin is the most
extensively studied inhibitor of the MEP pathway and inhibits the second
enzyme of the pathway, DXPRI. Crystal structures of DXPRI complexed with
fosmidomycin (Henriksson et al., 2007; Yajima et al., 2007; Mac Sweeney
et al., 2005; Steinbacher et al., 2003a) and its derivative FR-900098
13

1.2. THE APICOPLAST CHAPTER 1. INTRODUCTION
Figure 1.5: Chemical structures of Fosmidomycin (3-(N-formyl-N-hydroxy)aminopropylphosphonic acid) and FR-900098 (3-(N-acetyl-N-hydroxy)aminopropylphosphonic acid).
(3-(N-acetyl-N-hydroxy)aminopropylphosphonic acid; Figure 1.5) are available
(Mac Sweeney et al., 2005; Steinbacher et al., 2003a). Fosmidomycin was proven
to be effective against malaria (especially uncomplicated malaria (Missinou et
al., 2002)) but nevertheless it has shown an unacceptable disease reoccurence
(Wiesner et al., 2002) which lead to identifying a potential combination partner
in clindamycin (Lell et al., 2003). The combined therapy is very effective, and in
the case of multidrug resistant Plasmodium falciparum, produced a 100% cure
(Na-Bangchang et al., 2007).
1.2 The Apicoplast
The apicoplast is a unique semi-autonomous organelle (plastid) thought to be
reminiscent of the chloroplast and is found in apicomplexan group of protists
(which mostly are obligate parasites). Although the origin (Waller et al., 2003)
of the apicoplast is still not very clear, it is best explained by endosymbiotic
theory (Margulis and Bermudes, 1985; Cavalier-Smith, 1982; Margulis, 1981). It
14

1.2. THE APICOPLAST CHAPTER 1. INTRODUCTION
Figure 1.6: Plastid origins and protein targeting. (A) Primary endosymbiosisdescribes the uptake of a prokaryote by a eukaryote. Plastids derived by pri-mary endosymbiosis are surrounded by two membranes and targeting of nucleus-encoded gene products to the endosymbiont is affected by an N-terminal transitpeptide (T). (B) Secondary endosymbiotic plastid origin involves a heterotrophiceukaryote phagocytosing a photosynthetic eukaryote possessing a primary en-dosymbiont. The secondary endosymbiont’s cytoplasm and nucleus (N1) aretypically lost and the resulting plastid is surrounded by four membranes. Some-times one of the two outer membranes is lost at this point, resulting in a totalof three. Targeting of nucleus-encoded (N2) gene products to secondary plastidsrequires a signal peptide (S) to mediate protein passage across the outer mem-brane followed by a transit peptide (T) for import across the inner membranes.(figure and legend reproduced from (Waller and McFadden, 2005)).
15

1.2. THE APICOPLAST CHAPTER 1. INTRODUCTION
is thought to have originated through secondary endosymbiosis (McFadden, 2001;
Vellai et al., 1998) (which would also explain the presence of four membranes
(Kohler et al., 1997) around the apicoplast) where the endosymbionts could be
either green algae or red algae (contradictory evidence exists) (Palmer, 2003;
Waller et al., 2003; Funes et al., 2002; McFadden, 1999; Kohler et al., 1997).
During the process of endosymbiosis, which would have happened two times
in the case of the apicoplast, a huge amount of genetic material was lost be-
cause of disintegration, leaving behind just 35kb of circular DNA (Wilson and
Williamson, 1997; Wilson et al., 1996, 1991). As a result of disintegration, the
apicoplast has lost many functions including the ability to perform phostosynthe-
sis, but it has acquired many new functions which clearly cannot be carried out
by 35kb of DNA which has rRNA and tRNA genes and 28 open reading frames
(Dahl et al., 2006; Harb et al., 2004; Wilson et al., 1996). All of these take part
in self-replication (unlike eukaryotic nuclear replication, it is prokaryotic DNA
replication, transcription, translation) of the organelle (i.e., house keeping) (He
et al., 2001; Ralph et al., 2001; Kohler et al., 1997). Most of the apicoplast pro-
teins are nuclear encoded and are later targetted to the apicoplast (Harb et al.,
2004; Ralph et al., 2004a; van Dooren et al., 2002; He et al., 2001; Zuegge et
al., 2001; Waller et al., 2000, 1998). Although the exact role of the apicoplast is
not clear, it is essential for the survival of the organism and is the site for many
biosynthetic pathways which include the MEP pathway for isoprenoid biosynthe-
sis, type II fatty acid synthesis, Shikimate pathway for biosynthesis of aromatic
amino acids and heme biosynthesis (Dahl et al., 2006; Wilson, 2005; Ralph et al.,
2004b, 2001).
Pathogens having an apicoplast include:
16

1.3. STRUCTURE BASED DRUG DESIGNCHAPTER 1. INTRODUCTION
• Toxoplasma species. These cause toxoplasmosis and congenital birth disor-
ders in humans and livestock (Waller and McFadden, 2005; Wilson, 2005;
Jenkins, 2001; Roizen et al., 1995; Dubey and Welcome, 1988) and cause an
opportunistic infection related to AIDS (He et al., 2001; Luft et al., 1993)
• Plasmodium species (Waller and McFadden, 2005; Wilson, 2005; He et
al., 2001; Wilson et al., 1996). These cause malaria, annually infecting
approximately 300 million people leading to the death of 1 million people
out of which a large proportion are caused by the most virulent and multi
drug-resistant Plasmodium falciparum (van Dooren et al., 2002; W.H.O.,
1999)
• Eimeria species. These cause coccidiosis in poultry and farm animals
(Waller and McFadden, 2005; Wilson, 2005; Harb et al., 2004; He et al.,
2001; Jenkins, 2001).
• Babesia (He et al., 2001; Jenkins, 2001) and Theilaria (Waller and McFad-
den, 2005; Wilson, 2005; He et al., 2001; Jenkins, 2001) are other apicoplast-
bearing pathogens of livestock.
1.3 Structure Based Drug Design
Both ‘receptor based drug design’ and ‘ligand based drug design’ fall into ‘struc-
ture based drug design’ (SBDD) (Tintelnot-Blomley and Lewis, 2006; Acharya
et al., 2003; Anderson, 2003; Jones and Mongin-Bulewski, 2002; Saphire, 2002).
Finding a new drug molecule that alters the activity of a protein, given its struc-
ture and/or its binding site is receptor based drug design, whereas finding a new
17

1.4. DRUGGABILITY CHAPTER 1. INTRODUCTION
drug molecule that alters the activity of a protein, given an active ligand is ligand
based drug design.
SBDD was earlier used for lead optimization, but now covers and supports
virtually all steps in the drug discovery pipeline (Tintelnot-Blomley and Lewis,
2006). Building 3D computer models of proteins for SBDD is being commonly
practiced (Karkola et al., 2007; Volarath et al., 2007; Singh et al., 2006b). SBDD
is being effectively used in combination with virtual screening (Li et al., 2007),
quantum mechanics (Raha et al., 2007; Peters et al., 2006), docking (Kroemer,
2007), and X-ray crystallographic studies (Kinoshita, 2007; Yan et al., 2007)
for understanding various catalytic mechanisms of enzymes (such as the MEP
pathway enzymes (de Ruyck and Wouters, 2008)), finding new molecular drug
targets (Singh et al., 2006b; Swindells and Overington, 2002; Swindells and Fagan,
2001; Fagan et al., 2001) and small molecule drugs many of which are in clinical
trials or on the market (Fox et al., 2007).
1.4 Druggability
The term “druggability” is often classified into two broad groups and is used in
three distinct ways in the field of drug discovery:
1. While referring to molecular targets — druggable genome and druggable
proteins. This can refer to:
(a) the biological suitability of a target (Sugiyama, 2005; Swindells and
Overington, 2002; Swindells and Fagan, 2001; Fagan and Swindells,
2000), or
(b) the protein’s physical suitability for binding a small molecule drug (Ha-
18

1.4. DRUGGABILITY CHAPTER 1. INTRODUCTION
jduk et al., 2005a,b; An et al., 2004; Campbell et al., 2003; Laskowski
et al., 1996)
2. While referring to druggable compounds — small molecule drugs (Cheng
et al., 2007; Sirois et al., 2005; Sugiyama, 2005; Brown and Superti-Furga,
2003; Lipinski et al., 2001).
Druggability in the former case can be defined as the ability of a portion of a
genome (i.e., specific groups of proteins), or a protein, to be targetted by a drug,
especially by a small molecule drug. In other words, the probability of regulating
a target with a small molecule drug which is essential in determining the success
of a hit along the drug discovery pipeline (Owens, 2007). While the biological
macromolecules which could be modulated by small molecule drugs include pro-
teins, polysaccharides, lipids and nucleic acids, macromolecules other than pro-
teins are largely unaffected because they lack suitable potent compounds (with
low toxicity and high specificity) that act against them (Hopkins and Groom,
2002). It has to be noted that a small, but nevertheless significant group of drug
molecules succeeded in acting against DNA (Shaikh et al., 2004; Gambari et al.,
2000; Kennard, 1993; Le Pecq et al., 1975) (see Table 1.1). One such revolution-
ary anticancer DNA drug is ‘cisplatin’ — cis-diamminedichloridoplatinum(II)
(Alderden et al., 2006) which binds to DNA by a covalent cross-link (see Fig-
ure 1.7). Cisplatin’s1 pharmacological significance was discovered by Barnett
Rosenberg (1965) when he noticed the inhibition of cell division in Escherichia
coli by electrolysis products from a platinum electrode.
1Cisplatin was first synthesized by Michael Peyrone (1845) whose structure and configu-ration (also distinguishing between cis and trans forms) was correctly predicted by AlfredWerner while establishing his theory of coordination chemistry (1893). Werner received a NobelPrize for Chemistry in 1913 (http://nobelprize.org/nobel_prizes/chemistry/laureates/1913/index.html).
19

1.4. DRUGGABILITY CHAPTER 1. INTRODUCTION
S.No. Drug Action Mode of Binding PDB code1 Hoechst 33258 Antitumor Minor groove binding 264D2 Netropsin Antitumor, Antiviral Minor groove binding 121D3 Pentamidine Active against P. carinii Minor groove binding 1D644 Berenil Antitrypanosomal Minor groove binding 1D635 Guanyl bisfuramidine Active against P. carinii Minor groove binding 227D6 Netropsin Antitumor, Antiviral Minor groove binding 121D7 Distamycin Antitumor, Antiviral Minor groove binding 2DND8 SN7167 Antitumor, Antiviral Minor groove binding 328D9 SN6999 Active against P. falciparum Minor groove binding 144D10 Nogalamycin Antitumor Intercalation 182D11 Menogaril Antitumor-Topoisomerase II poison Intercalation 202D12 Mithramycin Anticancer antibiotic Minor groove binding 146D13 Plicamycin Anticancer antibiotic Minor groove binding 1BP814 Chromomycin A3 Anticancer antibiotic Minor groove binding 1EKH15 cisPlatin Anticancer antibiotic Covalent cross-linking 1AU5
Table 1.1: Drug, action and mode of binding for some DNA binding drugs(Table and caption reproduced from http://www.scfbio-iitd.res.in/doc/
preddicta.pdf).
Recent advances in 3D structure determination of RNA along with studies
which revealed surprising intricacy in RNA structure opened up the possibility
of exploring RNA as a drug target for small molecule drugs (Klinck et al., 2000;
Ecker and Griffey, 1999) such as ‘Hoechst 33258’ which selectively inhibits group
I intron self-splicing by affecting RNA folding (Disney et al., 2004).
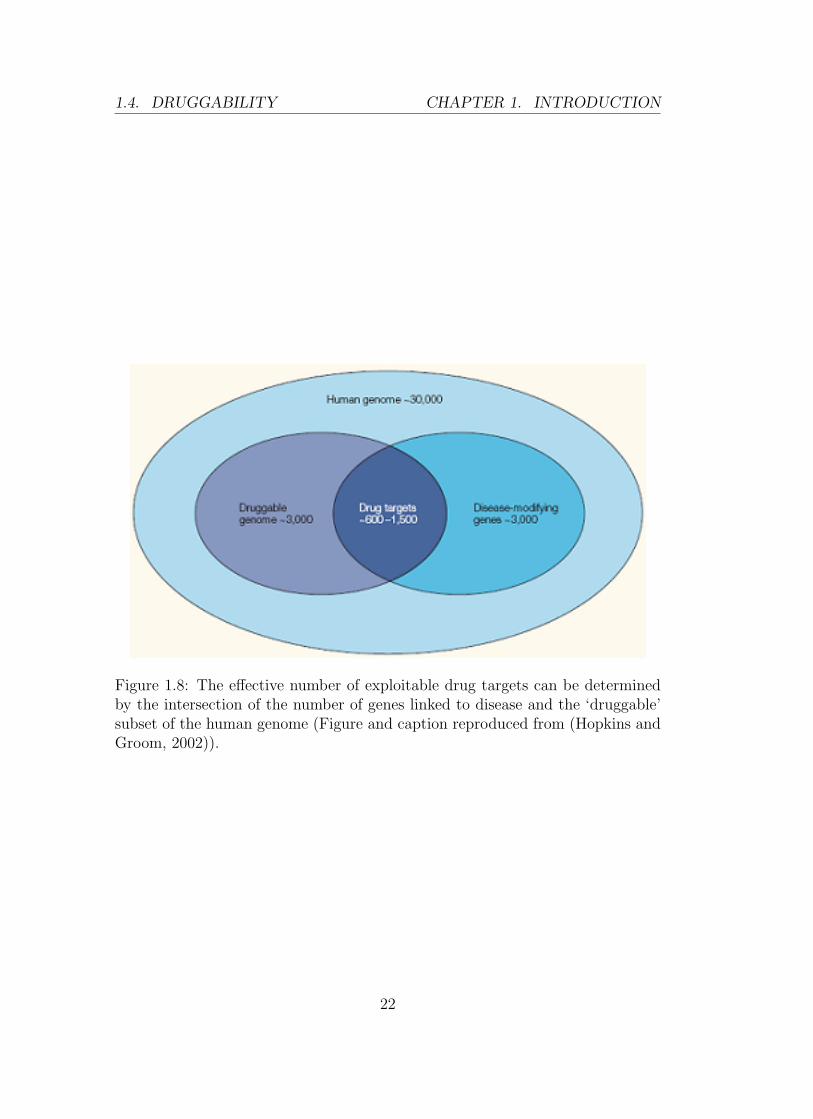
Among the ∼30,000 genes in the human genome only ∼3000 (10%) genes
code for druggable proteins and only ∼600–1,500 (5%) genes are drug targets
(i.e., both druggable and relevant to disease) (Hopkins and Groom, 2002) (See
Figure 1.8).
In spite of monumental advances in molecular biology, X-ray crystallography
and NMR techniques, completion of the human genome project, which should
have unravelled many clues about diseases, and a sharp rise in research and
development investments, clinical validation and marketing of drug targets is
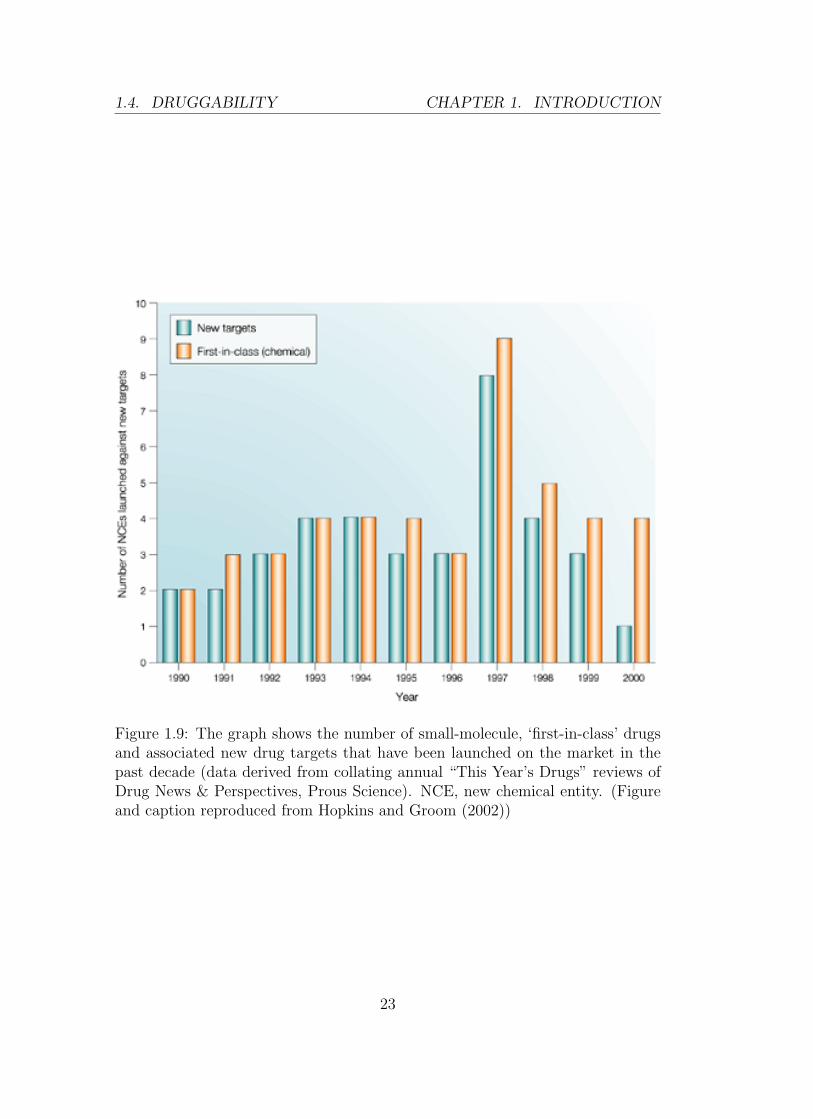
happening at a slower pace. Every year, on average, only four new drugs are being
launched against novel targets (Hopkins and Groom, 2002) (See Figure 1.9).
20

1.4. DRUGGABILITY CHAPTER 1. INTRODUCTION
Figure 1.7: Schematic showing the cytotoxic pathway for cisplatin. After enteringthe cell, cisplatin is aquated, then binds to cellular DNA. If the DNA lesion isnot repaired by the cell (path a), then cell death (apoptosis), can occur (Figureand caption reproduced from (Alderden et al., 2006).
21
1.4. DRUGGABILITY CHAPTER 1. INTRODUCTION
Figure 1.8: The effective number of exploitable drug targets can be determinedby the intersection of the number of genes linked to disease and the ‘druggable’subset of the human genome (Figure and caption reproduced from (Hopkins andGroom, 2002)).
22
1.4. DRUGGABILITY CHAPTER 1. INTRODUCTION
Figure 1.9: The graph shows the number of small-molecule, ‘first-in-class’ drugsand associated new drug targets that have been launched on the market in thepast decade (data derived from collating annual “This Year’s Drugs” reviews ofDrug News & Perspectives, Prous Science). NCE, new chemical entity. (Figureand caption reproduced from Hopkins and Groom (2002))
23

1.4. DRUGGABILITY CHAPTER 1. INTRODUCTION
Predicting protein druggability, ideally as early as possible in the drug discov-
ery pipeline is an important advantage because it reduces expenditure and time
loss. Various methods developed to achieve this include:
1. Classifying targets based on whether or not they belong to druggable gene
families (Cheng et al., 2007; Hopkins and Groom, 2002; Drews, 1996; Drews
and Ryser, 1997a). Almost 50% of the targets fall into just six gene fami-
lies — G-protein coupled receptors (GPCRs), serine/threonine and tyrosine
protein kinases, zinc metallopeptidases, serine proteases, nuclear hormone
receptors and phosphodiesterases (Hopkins and Groom, 2002). Neverthe-
less, other gene families have produced new targets and different proteins
of a gene family differ in druggability (Fauman et al., 2003).
2. Hajduk et al. (2005a) developed a method to predict the druggability of
protein targets using indices derived from NMR-based screening data.
3. Predicting protein druggability based solely on 3D structure. Hajduk et
al. (2005b) suggest potential utility of tools for characterizing protein tar-
gets (finding druggable protein pockets) and strategies for integrating data
of protein druggability with bioinformatics approaches to select druggable
targets.
4. Predicting the biological suitability (druggability) of a target by using com-
putational tools and databases (computational proteomics), mathematical
algorithms and chemical techniques to obtain as much relevant information
as possible in the shortest possible time are becoming increasingly popular
(Overington et al., 2006; Maggio, 2002; Swindells and Overington, 2002;
Chan and Weir, 2001; Fagan et al., 2001; Maggio and Ramnarayan, 2001;
24

1.4. DRUGGABILITY CHAPTER 1. INTRODUCTION
Drews and Ryser, 1997b).
The second definition of druggability is the ability of a compound to show
drug-like properties which are the physicochemical (solubility, stability, etc.)
and biological (absorption, distribution, metabolism, elimination and toxicity —
ADME-Tox) characteristics that are consistent with good clinical performance
(Sugiyama, 2005; Sirois et al., 2005). Approximately 60% of drug candidates
(Cheng et al., 2007; Brown and Superti-Furga, 2003) are dropped during the pas-
sage from hit-to-lead because they fail to show drug-like properties and many
pharmaceutical companies look out for these properties as early as possible. Lip-
inski et al. (2001) formulated a ‘rule of five’ (ROF) to look for physicochemical
properties that increase the probability of a drug candidate’s oral bioavailability.
The ROF predicts that poor absorption or permeation is more likely for molecules
having > 5 H-bond donors, 10 H-bond acceptors (sum of nitrogen and oxygen
atoms), a molecular weight (MW) > 500 Da, and high lipophilicity (ClogP >
5, or MlogP > 4.15. ClogP is a partition coefficient that indicates a molecule’s
hydrophobicity, and MlogP is an octanol-water partition coefficient). Pharma-
ceutical companies accept ROF as being a measure for good drug candidates.
High throughput screening (HTS) of chemical libraries is another commonly used
method for identifying hits (Sirois et al., 2005) and associating HTS with NMR
technology is even more powerful (Vogtherr and Fiebig, 2003). To minimize
expenditure and time loss further, purely structure-based methods have been de-
veloped such as the ‘structure based maximal affinity’ model (Cheng et al., 2007)
which predicts small molecule druggability based solely on the crystal structure
of the target binding site.
25

1.4. DRUGGABILITY CHAPTER 1. INTRODUCTION
In the context of this project, druggability is used to refer to the biological
suitability of targets with some incorporation of basic structural knowledge (i.e.,
known ligands suggest suitability for SBDD). This will be especially useful when
dealing with a set of unannotated hypothetical sequences most of which do not
have solved 3D structures. It does not address the suitability of the target protein
in terms of pockets able to bind a drug.
Druggable targets or drug targets?
When referring to the human genome, or to other non-pathogenic eukaryotic
organisms, proteins that are druggable are called ‘druggable targets’ whereas
proteins must be related to a disease, in addition to being druggable, to be called
‘drug targets’ (Hopkins and Groom, 2002). This project deals with pathogenic
bacteria and protists and thus all their druggable proteins may qualify as ‘drug
targets’ because these organisms are disease-related from a human perspective. In
addition to that they are regarded as essential for the survival of these pathogens.
Thus, the term ‘potential drug target’ is used in the rest of this thesis.
For the reasons mentioned earlier, annotating the proteins of the apicoplast and
the MEP pathway is of great significance. This led to the creation of the APAT
tool and the TAPAS pipeline. In the next chapter, I will review various tools for
mass sequence analysis.
26

Chapter 2
Introduction to Bioinformatics
Tools - Mass Sequence Analysis
In this chapter, I present a review of various high throughput sequence analysis
tools such as workflows/pipelines, highlighting their advantages and disadvan-
tages.
2.1 Workflows
Sequence analysis which involves annotation of a whole genome, proteins of a
particular pathway, or of an organelle, requires automatic execution of various
prediction and annotation tools residing locally, or remotely, in a parallel or
sequential manner followed by integration of results from these tools.
A workflow can be defined as a set of analyses to be performed on a single
sequence, or set of sequences (Shah et al., 2004). The characteristics of a workflow
include:
1. the analyses can be tied such that output from one analysis can be used as
27

2.1. WORKFLOWSCHAPTER 2. INTRODUCTION TO BIOINFORMATICS TOOLS - MASS
SEQUENCE ANALYSIS
input to subsequent analyses,
2. analyses can accept outputs from more than one analysis as input, and
3. analyses that need not be run serially can be executed in parallel.
“Workflow is concerned with the automation of procedures whereby
files and data are passed between participants according to a defined
set of rules to achieve an overall goal (Hollingsworth, 1995). A work-
flow management system defines, manages and executes workflows on
computing resources. Imposing the workflow paradigm for applica-
tion composition on Grids offers several advantages (Spooner et al.,
2004) such as:
• Ability to build dynamic applications which orchestrate
distributed resources.
• Utilization of resources that are located in a particular domain
to increase throughput or reduce execution costs.
• Execution spanning multiple administrative domains to obtain
specific processing capabilities.
• Integration of multiple teams involved in managing of differ-
ent parts of the experiment workflow — thus promoting inter-
organizational collaborations.” (Yu and Buyya, 2005b).
Shah et al. (2004) described three crucial aspects that are to be considered es-
sential for building pipelines and these are summarized here as the salient features
of a good pipeline:
28
2.1. WORKFLOWSCHAPTER 2. INTRODUCTION TO BIOINFORMATICS TOOLS - MASS
SEQUENCE ANALYSIS
1. a flexible architecture such that one system can analyse different datasets
that may require different analysis tools,
2. allowance for the inclusion of new tools in a modular fashion so that, on
the addition of new tools, the architecture does not require any alteration,
and
3. provision of a framework to facilitate data integration of analysis results
from different tools that were computed on the same input.
2.1.1 Taverna
One attempt to integrate diverse tools is Taverna (Oinn et al., 2004) which is
part of the myGrid project (http://www.mygrid.org.uk). This system provides
a graphical tool for creating and running arbitrarily complex bioinformatics work-
flows consisting of interlinked processing units each of which transforms a set of
input data into a set of output data. Workflows are created in a language called
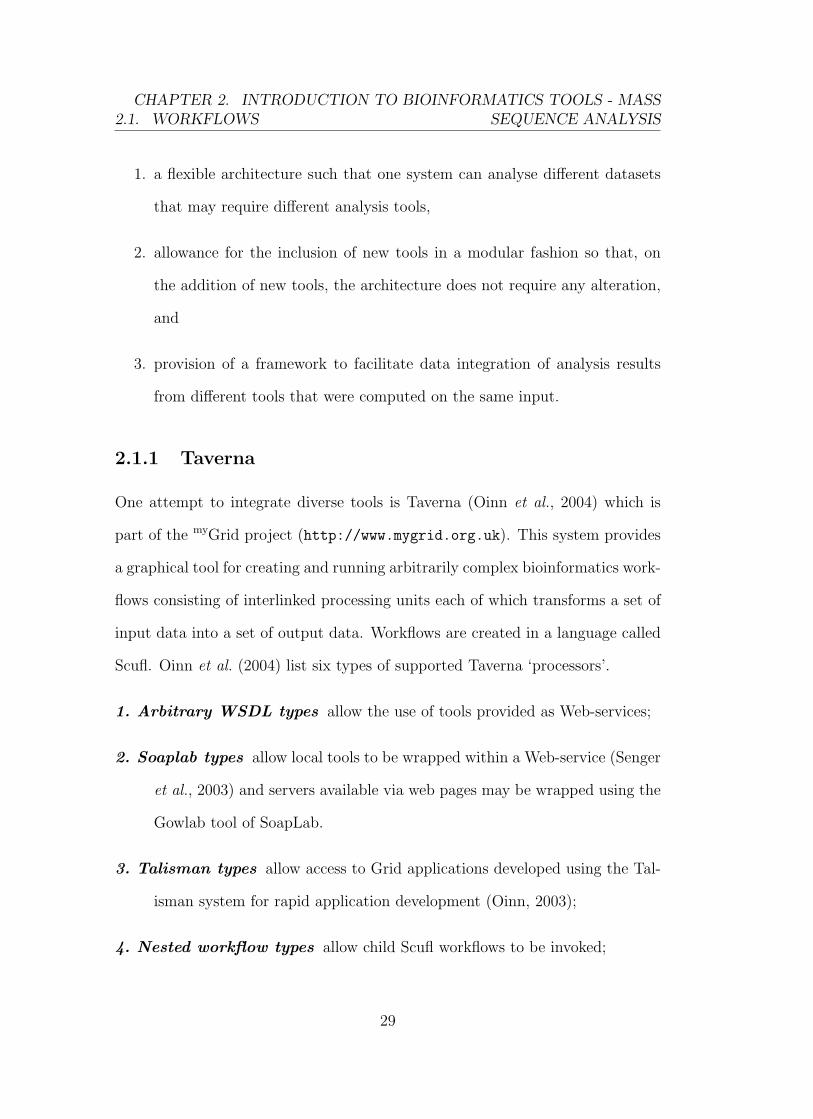
Scufl. Oinn et al. (2004) list six types of supported Taverna ‘processors’.
1. Arbitrary WSDL types allow the use of tools provided as Web-services;
2. Soaplab types allow local tools to be wrapped within a Web-service (Senger
et al., 2003) and servers available via web pages may be wrapped using the
Gowlab tool of SoapLab.
3. Talisman types allow access to Grid applications developed using the Tal-
isman system for rapid application development (Oinn, 2003);
4. Nested workflow types allow child Scufl workflows to be invoked;
29

2.1. WORKFLOWSCHAPTER 2. INTRODUCTION TO BIOINFORMATICS TOOLS - MASS
SEQUENCE ANALYSIS
5. String constant types allow a constant value to be fed into an established
workflow;
6. Local processor types allow new local functions to be used. These must
be coded as classes which comply with a simple Java interface.
Oinn et al. (2004) state that invocation mechanisms other than Web-services re-
quire “first, creating a plug-in for the Freefluo enactor to access the resource and,
second, implementing a corresponding Scufl processor type”. In this way, Tav-
erna provides support for a number of mechanisms, including access to BioMart
(Pruess et al., 2005; Durinck et al., 2005), an API consumer (which can cope
with a variety of Java APIs) and scripting support via the beanshell. The bean-
shell “is a small, free, embeddable Java source dynamic interpreter with object
scripting language features, written in Java”) (see http://www.beanshell.org/
intro.html).
2.1.2 ToolBus
The ToolBus architecture (Eckart and Sobral, 2003), is another system which
provides a generic, web-services based framework to deal with issues such as
data and tool interoperability. ToolBus is a client-side interconnect, written in
Java, which allows access to remote web-services as well as local programs and
files. This provides data and analysis services, and allows examination of results
using a wide variety of visualization tools. In addition, ToolBus enables users
to form groupings of related information and to perform comparative analysis
using these data groups in order to support the discovery of interesting inter-
data relationships. PathPort (Pathogen Portal) is a collection of web-services
30
2.1. WORKFLOWSCHAPTER 2. INTRODUCTION TO BIOINFORMATICS TOOLS - MASS
SEQUENCE ANALYSIS
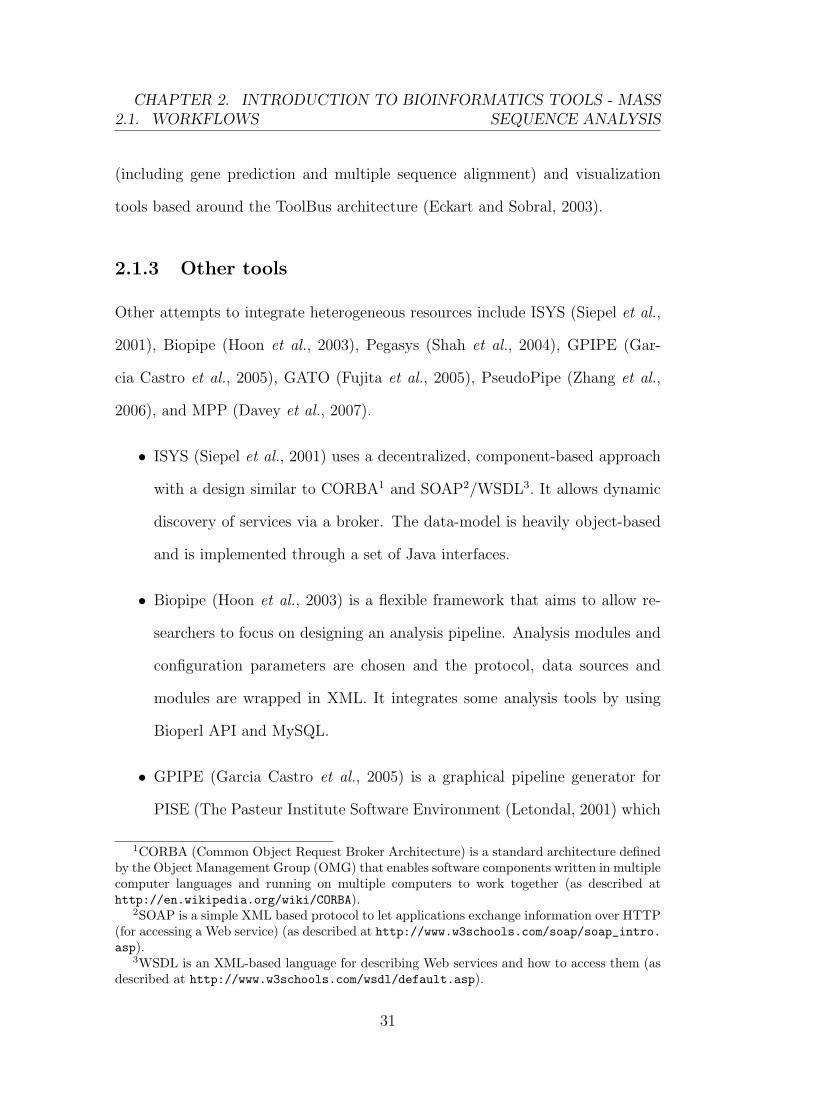
(including gene prediction and multiple sequence alignment) and visualization
tools based around the ToolBus architecture (Eckart and Sobral, 2003).
2.1.3 Other tools
Other attempts to integrate heterogeneous resources include ISYS (Siepel et al.,
2001), Biopipe (Hoon et al., 2003), Pegasys (Shah et al., 2004), GPIPE (Gar-
cia Castro et al., 2005), GATO (Fujita et al., 2005), PseudoPipe (Zhang et al.,
2006), and MPP (Davey et al., 2007).
• ISYS (Siepel et al., 2001) uses a decentralized, component-based approach
with a design similar to CORBA1 and SOAP2/WSDL3. It allows dynamic
discovery of services via a broker. The data-model is heavily object-based
and is implemented through a set of Java interfaces.
• Biopipe (Hoon et al., 2003) is a flexible framework that aims to allow re-
searchers to focus on designing an analysis pipeline. Analysis modules and
configuration parameters are chosen and the protocol, data sources and
modules are wrapped in XML. It integrates some analysis tools by using
Bioperl API and MySQL.
• GPIPE (Garcia Castro et al., 2005) is a graphical pipeline generator for
PISE (The Pasteur Institute Software Environment (Letondal, 2001) which
1CORBA (Common Object Request Broker Architecture) is a standard architecture definedby the Object Management Group (OMG) that enables software components written in multiplecomputer languages and running on multiple computers to work together (as described athttp://en.wikipedia.org/wiki/CORBA).
2SOAP is a simple XML based protocol to let applications exchange information over HTTP(for accessing a Web service) (as described at http://www.w3schools.com/soap/soap_intro.asp).
3WSDL is an XML-based language for describing Web services and how to access them (asdescribed at http://www.w3schools.com/wsdl/default.asp).
31

2.1. WORKFLOWSCHAPTER 2. INTRODUCTION TO BIOINFORMATICS TOOLS - MASS
SEQUENCE ANALYSIS
generates a web interface for molecular biology programs in unix) that
follows a task-flow4 model and facilitates storage of metadata in XML based
language.
• Pegasys (Shah et al., 2004) is a modular and customizable workflow system
for executing a variety of analysis tools and integration of results from them
using a backend relational database management system. Pegasys is imple-
mented in Java and uses a client/server model and a DAG5 data structure
for dynamically creating sequence analysis workflows via a graphical user
interface.
• Wildfire (Tang et al., 2005) is a graphical user interface for construction and
execution of workflows implemented in Java. It uses GEL (Grid Execution
Language (Lian et al., 2005)) which can execute the workflow over a cluster,
can run executables directly, or on a grid providing supercomputing power.
• ICENI (Imperial College e-Science Networked Infrastructure) (Furmento et
al., 2002) is service oriented/integrated Grid middleware6 implemented in
Java and Jini7 for constructing, defining and executing workflows that are
described in XML on a grid.
• ProGenGrid (Aloisio et al., 2005) (Proteomics and Genomics Grid) is an-
4A task-flow lets one create an application that facilitates the execution and parameterizationof a set of tasks.
5A Directed Acyclic Graph (DAG) is a directed graph with no cycles. For example, if thereis a route from node A to node B then there is no way back. The Root is a node with noincoming edges whereas a leaf is a node with no outgoing edges.
6Middleware (as described at http://www.s3.kth.se/~kallej/papers/runes_ejc07.pdf)is a software abstraction layer that mediates the interactions of a component with its environ-ment by providing a programming interface transparent to the operating systems and to thenetwork protocols underneath.
7Jini is a network architecture with a programming model that facilitates distributed com-puting which was developed by Sun but now being developed as Apache River.
32

2.1. WORKFLOWSCHAPTER 2. INTRODUCTION TO BIOINFORMATICS TOOLS - MASS
SEQUENCE ANALYSIS
other grid based workflow system for composing and executing tasks that
simulate biological experiments.
It should be noted that ‘Grid’ (Foster and Kesselman, 1999) and ‘application
technologies’ are increasingly being used to build many complex systems to han-
dle and run large-scale scientific experiments on distributed and heterogenous
resources (Yu and Buyya, 2005a,b). In these papers Yu and Buyya have pre-
sented a taxonomy of scientific workflow systems for Grid computing in which
they highlight the design and engineering similarities and differences of state-of-
the-art Grid workflow systems, along with the areas that need further research
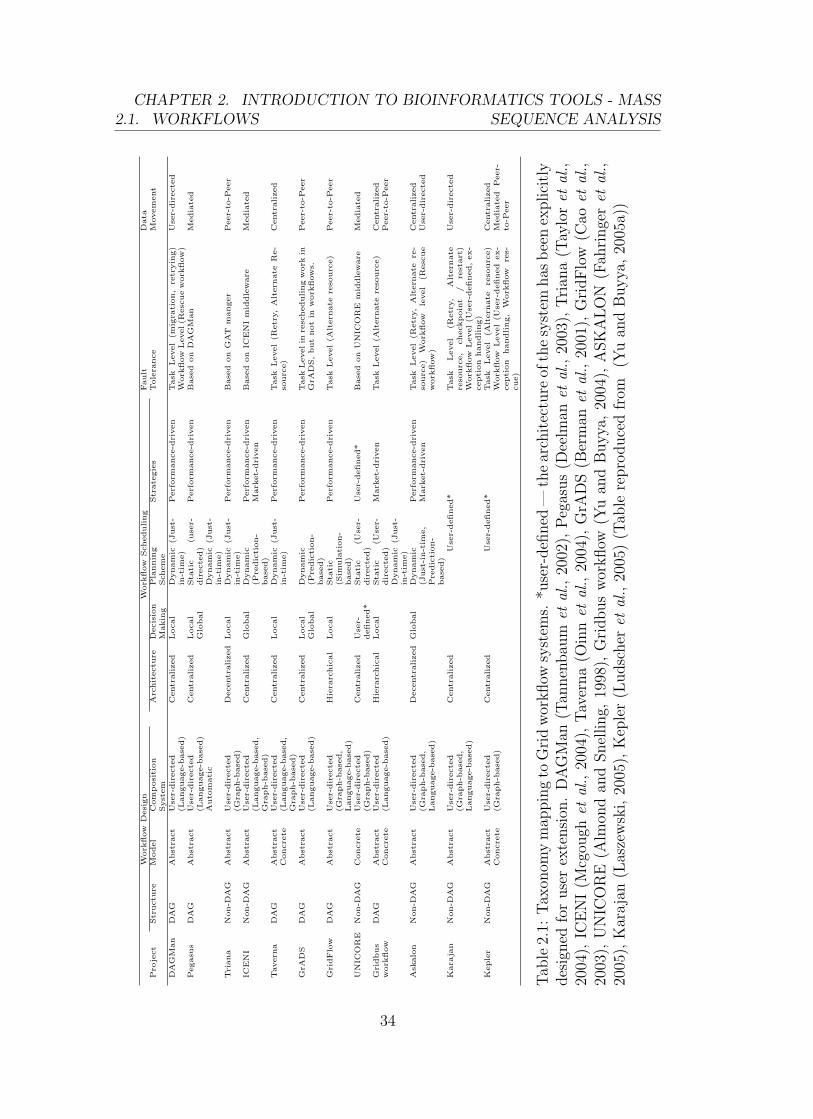
(Table 2.1).
The following text is an extract from Yu and Buyya’s (2005a) taxonomy of
scientific workflow systems for Grid computing:
“The taxonomy characterizes and classifies approaches of scientific
workflow systems in the context of Grid computing. It consists of four
elements of a Grid workflow management system: (a) workflow design,
(b) workflow scheduling, (c) fault tolerance and (d) data movement”
(Yu and Buyya, 2005a).
Their taxonomy is illustrated in Figure 2.1 which is reproduced from their paper.
The terminology used in their paper, Table 2.1 and Figure 2.1 is briefed in the
following paragraphs.
Workflow design encompasses the ‘structure’ and ‘model’ (or ‘specification’)
of the workflow and a ‘composition system’. The ‘structure’ indicates the time
dependency of the tasks and either can, or cannot, be represented by a DAG (Di-
rected Acyclic Graph). DAG-based workflow structures allow sequential, parallel
33
2.1. WORKFLOWSCHAPTER 2. INTRODUCTION TO BIOINFORMATICS TOOLS - MASS
SEQUENCE ANALYSIS
Work
flow
Desi
gn
Work
flow
Scheduling
Fault
Data
Pro
ject
Str
uctu
reM
odel
Com
posi
tion
Arc
hit
ectu
reD
ecis
ion
Pla
nnin
gStr
ate
gie
sTole
rance
Movem
ent
Syst
em
Makin
gSchem
eD
AG
Man
DA
GA
bst
ract
Use
r-dir
ecte
d(L
anguage-b
ase
d)
Centr
alized
Local
Dynam
ic(J
ust
-in
-tim
e)
Perf
orm
ance-d
riven
Task
Level
(mig
rati
on,
retr
yin
g)
Work
flow
Level(R
esc
ue
work
flow
)U
ser-
dir
ecte
d
Pegasu
sD
AG
Abst
ract
Use
r-dir
ecte
d(L
anguage-b
ase
d)
Auto
mati
c
Centr
alized
Local
Glo
bal
Sta
tic
(use
r-dir
ecte
d)
Dynam
ic(J
ust
-in
-tim
e)
Perf
orm
ance-d
riven
Base
don
DA
GM
an
Media
ted
Tri
ana
Non-D
AG
Abst
ract
Use
r-dir
ecte
d(G
raph-b
ase
d)
Decentr
alized
Local
Dynam
ic(J
ust
-in
-tim
e)
Perf
orm
ance-d
riven
Base
don
GAT
manger
Peer-
to-P
eer
ICEN
IN
on-D
AG
Abst
ract
Use
r-dir
ecte
d(L
anguage-b
ase
d,
Gra
ph-b
ase
d)
Centr
alized
Glo
bal
Dynam
ic(P
redic
tion-
base
d)
Perf
orm
ance-d
riven
Mark
et-
dri
ven
Base
don
ICEN
Im
iddle
ware
Media
ted
Tavern
aD
AG
Abst
ract
Concre
teU
ser-
dir
ecte
d(L
anguage-b
ase
d,
Gra
ph-b
ase
d)
Centr
alized
Local
Dynam
ic(J
ust
-in
-tim
e)
Perf
orm
ance-d
riven
Task
Level
(Retr
y,
Alt
ern
ate
Re-
sourc
e)
Centr
alized
GrA
DS
DA
GA
bst
ract
Use
r-dir
ecte
d(L
anguage-b
ase
d)
Centr
alized
Local
Glo
bal
Dynam
ic(P
redic
tion-
base
d)
Perf
orm
ance-d
riven
Task
Levelin
resc
heduling
work
inG
rAD
S,but
not
inw
ork
flow
s.Peer-
to-P
eer
Gri
dFlo
wD
AG
Abst
ract
Use
r-dir
ecte
d(G
raph-b
ase
d,
Language-b
ase
d)
Hie
rarc
hic
al
Local
Sta
tic
(Sim
ula
tion-
base
d)
Perf
orm
ance-d
riven
Task
Level(A
ltern
ate
reso
urc
e)
Peer-
to-P
eer
UN
ICO
RE
Non-D
AG
Concre
teU
ser-
dir
ecte
d(G
raph-b
ase
d)
Centr
alized
Use
r-defined*
Sta
tic
(Use
r-dir
ecte
d)
Use
r-defined*
Base
don
UN
ICO
RE
mid
dle
ware
Media
ted
Gri
dbus
work
flow
DA
GA
bst
ract
Concre
teU
ser-
dir
ecte
d(L
anguage-b
ase
d)
Hie
rarc
hic
al
Local
Sta
tic
(Use
r-dir
ecte
d)
Dynam
ic(J
ust
-in
-tim
e)
Mark
et-
dri
ven
Task
Level(A
ltern
ate
reso
urc
e)
Centr
alized
Peer-
to-P
eer
Ask
alo
nN
on-D
AG
Abst
ract
Use
r-dir
ecte
d(G
raph-b
ase
d,
Language-b
ase
d)
Decentr
alized
Glo
bal
Dynam
ic(J
ust
-in-t
ime,
Pre
dic
tion-
base
d)
Perf
orm
ance-d
riven
Mark
et-
dri
ven
Task
Level
(Retr
y,
Alt
ern
ate
re-
sourc
e)
Work
flow
level
(Resc
ue
work
flow
)
Centr
alized
Use
r-dir
ecte
d
Kara
jan
Non-D
AG
Abst
ract
Use
r-dir
ecte
d(G
raph-b
ase
d,
Language-b
ase
d)
Centr
alized
Use
r-defined*
Task
Level
(Retr
y,
Alt
ern
ate
reso
urc
e,
checkpoin
t/
rest
art
)W
ork
flow
Level(U
ser-
defined,ex-
cepti
on
handling)
Use
r-dir
ecte
d
Keple
rN
on-D
AG
Abst
ract
Concre
teU
ser-
dir
ecte
d(G
raph-b
ase
d)
Centr
alized
Use
r-defined*
Task
Level
(Alt
ern
ate
reso
urc
e)
Work
flow
Level
(Use
r-defined
ex-
cepti
on
handling,
Work
flow
res-
cue)
Centr
alized
Media
ted
Peer-
to-P
eer
Tab
le2.
1:Tax
onom
ym
appin
gto
Gri
dw
orkflow
syst
ems.
*use
r-defi
ned
—th
ear
chit
ectu
reof
the
syst
emhas
bee
nex
plici
tly
des
igned
for
use
rex
tensi
on.
DA
GM
an(T
annen
bau
met
al.,
2002
),Peg
asus
(Dee
lman
etal
.,20
03),
Tri
ana
(Tay
lor
etal
.,20
04),
ICE
NI
(Mcg
ough
etal
.,20
04),
Tav
erna
(Oin
net
al.,
2004
),G
rAD
S(B
erm
anet
al.,
2001
),G
ridFlo
w(C
aoet
al.,
2003
),U
NIC
OR
E(A
lmon
dan
dSnel
ling,
1998
),G
ridbus
wor
kflow
(Yu
and
Buyya
,20
04),
ASK
ALO
N(F
ahri
nge
ret
al.,
2005
),K
araja
n(L
asze
wsk
i,20
05),
Kep
ler
(Ludsc
her
etal
.,20
05)
(Tab
lere
pro
duce
dfr
om(Y
uan
dB
uyya
,20
05a)
)
34

2.1. WORKFLOWSCHAPTER 2. INTRODUCTION TO BIOINFORMATICS TOOLS - MASS
SEQUENCE ANALYSIS
Figure 2.1: A taxonomy of scientific workflow systems for Grid computing (Figurereproduced from (Yu and Buyya, 2005a)).
35

2.1. WORKFLOWSCHAPTER 2. INTRODUCTION TO BIOINFORMATICS TOOLS - MASS
SEQUENCE ANALYSIS
or conditional execution of tasks. Non-DAG workflows also allow iterations - i.e.
sections of the workflow can be repeated. The ‘model’ can either be ‘abstract’
or ‘concrete’. An abstract workflow defines tasks without referring to specific
resources, while a concrete model specifies the resources to be used for the tasks.
The ‘composition system’ refers to the way in which users assemble the work-
flow and can either be ‘user-directed’ or ‘automatic’. User-directed systems use
a workflow language, or a graphical tool such as Kepler (Ludscher et al., 2005).
Automatic systems create a workflow without user intervention, given only a very
high level view of the input and required output.
Workflow scheduling is the most complex element of workflow management
and covers the ‘architecture’, ‘decision making’, ‘planning scheme’ and ‘strategy’
of the workflow:
• The ‘architecture’ is important for the scalability, autonomy, quality and
performance of the system (Hamscher et al., 2000) and may be one of three
types: (i) ‘centralized’ in which one central scheduler makes scheduling
decisions for all tasks in the workflow, (ii) ‘hierarchical’ in which there is
one central manager and multiple lower-level sub-workflow schedulers, and
(iii) ‘decentralized’ where there are multiple schedulers without any central
controller.
• The ‘decision making’ process defines how workflows are mapped onto re-
sources and is one of two types — (i) ‘local’ where decisions are made
based on information of the current task, and (ii) ‘global’ where decisions
are based on information about the entire workflow (Deelman et al., 2004).
• The ‘planning scheme’ is the method by which abstract models are trans-
36

2.1. WORKFLOWSCHAPTER 2. INTRODUCTION TO BIOINFORMATICS TOOLS - MASS
SEQUENCE ANALYSIS
lated into concrete models and can be either ‘static’ in which concrete
models are generated before execution, or ‘dynamic’ in which static and
dynamic information about resources is used at run-time. Static schemes
may be either (i) ‘user-directed’ in which users make resource mapping deci-
sions according to their knowledge, preference and/or performance criteria,
or (ii) ‘simulation-based’ in which the best schedule is achieved by simu-
lating task execution on a given set of resources before the workflow starts
execution. Dynamic schemes can be classified as either ‘prediction-based’
using dynamic information together with some prediction-based results, or
‘just-in-time’ where decisions are made at the time of task execution.
• The ‘strategy’ takes users constraints such as deadlines and budget into
consideration when mapping tasks to resources. It can be (i) ‘performance-
driven’ where resources are selected that achieve optimal execution perfor-
mance, (ii) ‘market-driven’ in which market models are used to manage
resource allocation (Geppert et al., 1998) and (iii) ‘trust-driven’ in which
properties such as security policy are given priority (Song et al., 2005).
Fault tolerance considers techniques for handling failures in workflow ex-
ecution and may be classified as either (i) ‘task-level’ in which the effects of
execution failure of individual tasks are masked, or (ii) ‘workflow-level’ in which
the workflow structure is manipulated in order to deal with errors (Hwang and
Kesselman, 2003). Task-level techniques can be classified as ‘retry’ in which the
same task is re-executed on the same resource, ‘alternate resource’ in which the
task is re-executed on another resource, ‘checkpoint/restart’ in which failed tasks
are transparently moved to other resources, and ‘replication’ where the same task
runs simultaneously on different resources. Workflow-level techniques can be clas-
37

2.1. WORKFLOWSCHAPTER 2. INTRODUCTION TO BIOINFORMATICS TOOLS - MASS
SEQUENCE ANALYSIS
sified as ‘alternate task’ in which another implementation of a task is executed if
the first one failed, ‘redundancy’ in which multiple alternative tasks are executed
simultaneously, ‘user-defined exception handling’ where users specify how failures
should be treated, and ‘rescue workflow’ where information about failed tasks is
recorded during the first workflow execution.
Data movement deals with movement and availability of input and output
files and is classified as either (i) ‘user-directed’ where users have to manage in-
termediate data transfer in the workflow specification, or (ii) ‘automatic’ where
intermediate data are transferred automatically. The automatic approach is clas-
sified into ‘centralized’ where all intermediate data moves between resources via
a central point, ‘mediated’ in which a distributed data management system man-
ages the locations of the intermediate data, and ‘peer-to-peer’ where data are
transferred directly between processing resources.
In addition to these general purpose workflows/pipelining tools, a number of more
specialized workflows/pipelines have been developed. For example:
• The gene annotation tool (GATO) (Fujita et al., 2005) is a pipeline for
automatic annotation (preliminary DNA analysis) and access to annotated
genes. GATO is implemented in PHP and Perl and annotations are
obtained from web-accessible resources which are then stored in a local
MySQL database. It permits individual sequence annotation using the
GATO Web interface and large scale annotation using GATOALL.
• MPP (Davey et al., 2007) is a phylogeny pipeline (Java application) that
calculates the probability of existence of genes or markers within a genome
by processing the data obtained from microarray experiments.
38

2.2. MACHINE LEARNING METHODSCHAPTER 2. INTRODUCTION TO BIOINFORMATICS TOOLS - MASS
SEQUENCE ANALYSIS
• MicroGen (Burgarella et al., 2005) is a microarray specific web system for
managing workflow information in the pipeline of spotted cDNA microarray
experiments.
• PseudoPipe (Zhang et al., 2006) is a homology-based pipeline implemented
in Python for searching and identifying pseudogene8 sequences in a mam-
malian genome using a pseudogene identification algorithm (Zhang et al.,
2003, 2004).
• BIPASS (Lacroix et al., 2007) (Bioinformatics Pipeline Alternative Splicing
Services) is a specialized pipeline for alternate splicing analysis.
• PROSPECT-PSPP (Guo et al., 2004) is a specialized pipeline for protein
3D structure prediction implemented using SOAP (for sharing tools and
resources), Perl (pipeline manager), MySQL (database for storing and ac-
cessing input, parameters and output at various stages) and PHP (for web
interface). The pipeline is based on threading-based program, PROSPECT
(Xu and Xu, 2000; Kim et al., 2003) and it preprocesses sequences, predicts
secondary structure, performs fold recognition and models 3D structure
automatically.
2.2 Machine Learning Methods
“Machine learning is an area of artificial intelligence concerned with
the study of computer algorithms that improve automatically through
8pseudogenes (Zhang et al., 2006) are disabled copies (genomic fossils) of functional genesthat have been retained in the genome by gene duplication or retrotransposition events and areimportant resources in understanding the evolutionary history of genes and genomes.
39

2.2. MACHINE LEARNING METHODSCHAPTER 2. INTRODUCTION TO BIOINFORMATICS TOOLS - MASS
SEQUENCE ANALYSIS
experience. In practice, this involves creating programs that optimize
a performance criterion through the analysis of data”.
as described by Sewell at http://www.machinelearning.net/
machine-learning.pdf.
Machine learning has a broad range of applications which include pattern
recognition, search engines, natural language processing, medical diagnosis, bioin-
formatics, fraud detection, stock market analysis, speech and handwriting recog-
nition, object recognition in digital vision, computer games and robotics.
There are numerous machine learning methods and some of the most com-
monly used methods include:
• Bayesian Methods
• Hidden Markov Models
• Decision Trees
• Support Vector Machines
• Artificial Neural Networks
2.2.1 Bayesian Methods
Bayesian Methods are based on Thomas Bayes’ theorem (Bayes, 1763). Bayes’
theorem relates the conditional and marginal probabilities of stochastic events
A and B. Conditional probability is the probability of some event A, given the
occurrence of some other event B, whereas Marginal probability is the probability
of one event, regardless of the other event.
40

2.2. MACHINE LEARNING METHODSCHAPTER 2. INTRODUCTION TO BIOINFORMATICS TOOLS - MASS
SEQUENCE ANALYSIS
P (A|B) =P (B|A)P (A)
P (B)(2.1)
where:
• P(A) is the marginal probability of A. It does not take into account any
information about B.
• P(A|B) is the conditional probability of A, given B.
• P(B|A) is the conditional probability of B given A.
• P(B) is the marginal probability of B, and acts as a normalizing constant.
Judea Pearl coined the term Bayesian networks and presented the theory
(Pearl, 1985, 1988). Bayesian networks are probabilistic directed acyclic graphs
where each node represents a random variable. The Bayesian inference process
starts with a prior knowledge of the distribution and the distribution is altered
with each set of new presented data. Consequently, the reliability of the prior
knowledge is crucial for performance and final outcome.
Figure 2.2 (Pearl, 2000) illustrates a simple, yet typical, Bayesian network.
It describes the causal relationships among the season of the year (X1), whether
it’s raining (X2), whether the sprinkler is on (X3), whether the pavement is wet
(X4), and whether the pavement is slippery (X5). Here, the absence of a direct
link between X1 and X5, for example, captures our understanding that there is
no direct influence of season on slipperiness — the influence is mediated by the
wetness of the pavement. If freezing is a possibility, then a direct link could be
added.
Pros:
41

2.2. MACHINE LEARNING METHODSCHAPTER 2. INTRODUCTION TO BIOINFORMATICS TOOLS - MASS
SEQUENCE ANALYSIS
Figure 2.2: A Bayesian network representing casual influences among five vari-ables (reproduced from http://www.secondmoment.org/articles/bayesian.
php).
• It is straightforward to derive biological meaning.
• They can deal well with missing or partial data (http://www.bayesit.
com/docs/advantages.html).
Cons:
• They require prior knowledge of the distribution of probabilities to make
the initial assumption.
• They are associated with computational difficulties of exploring a previously
unknown network. Calculation of the probability of any single branch of
the network is not straightforward; all branches must be calculated (Nie-
dermayer, 1998).
Prior knowledge of the distribution of probabilities is crucial for accuracy
because any further predictions depend on these assumptions and it is generally
difficult to make correct assumptions.
42

2.2. MACHINE LEARNING METHODSCHAPTER 2. INTRODUCTION TO BIOINFORMATICS TOOLS - MASS
SEQUENCE ANALYSIS
Figure 2.3: Probabilistic parameters of an example hidden Markov model wherex - states, y - possible observations, a - state transition probabilities, and b - out-put probabilities (reproduced from http://en.wikipedia.org/wiki/Hidden_
Markov_model).
2.2.2 Hidden Markov Models
Hidden Markov Models (HMMs) are a probabilistic model mainly used for recog-
nition problems and has a Markov chain with hidden states (Rabiner, 1990).
They are good at recognizing patterns of indefinite length (Gough, 2002). Markov
models have a state which is directly visible to the observer, and the transition
probabilities of a state are the only parameters. Hidden Markov models have a
state that is not directly visible, but variables influenced by the state are visible.
Because each state has a probability distribution over the possible output tokens,
some information about the sequence of states is derived from the sequence of
tokens generated by an HMM (Figure 2.3).
Pros:
• They are very good at pattern recognition.
43

2.2. MACHINE LEARNING METHODSCHAPTER 2. INTRODUCTION TO BIOINFORMATICS TOOLS - MASS
SEQUENCE ANALYSIS
• They are well suited for recognition of distant relationships when other
methods fail to detect a very weak signal.
• They are modular - Smaller HMMs can be combined into larger HMMs.
• They are transparent - a good model increases understanding and one
can read the model to make sense of it (www.cs.ualberta.ca/~colinc/
cmput606/606FinalPres.ppt).
Cons:
• They are not ideal for cases of high similarity (i.e., where there is a strong
signal).
• They are rather slow to train (because they enumerate all
possible paths in a model) compared to other methods
(www.cs.ualberta.ca/~colinc/cmput606/606FinalPres.ppt,
www.cnel.ufl.edu/files/1102356403.ppt).
• Over-fitting can be a problem.
2.2.3 Decision Trees
Decision Trees accept an object or a situation associated with a set of properties
as an input and produce yes/no as an output (Russell et al., 1996; Russell and
Norvig, 2003; Hall et al., 1999). The inference process starts at the root node and
tests an example against various attributes until it reaches a leaf node where it is
finally segregated into a specific class. They are commonly used for data mining
and classification. For example, Figure 2.4 illustrates a decision making process
44
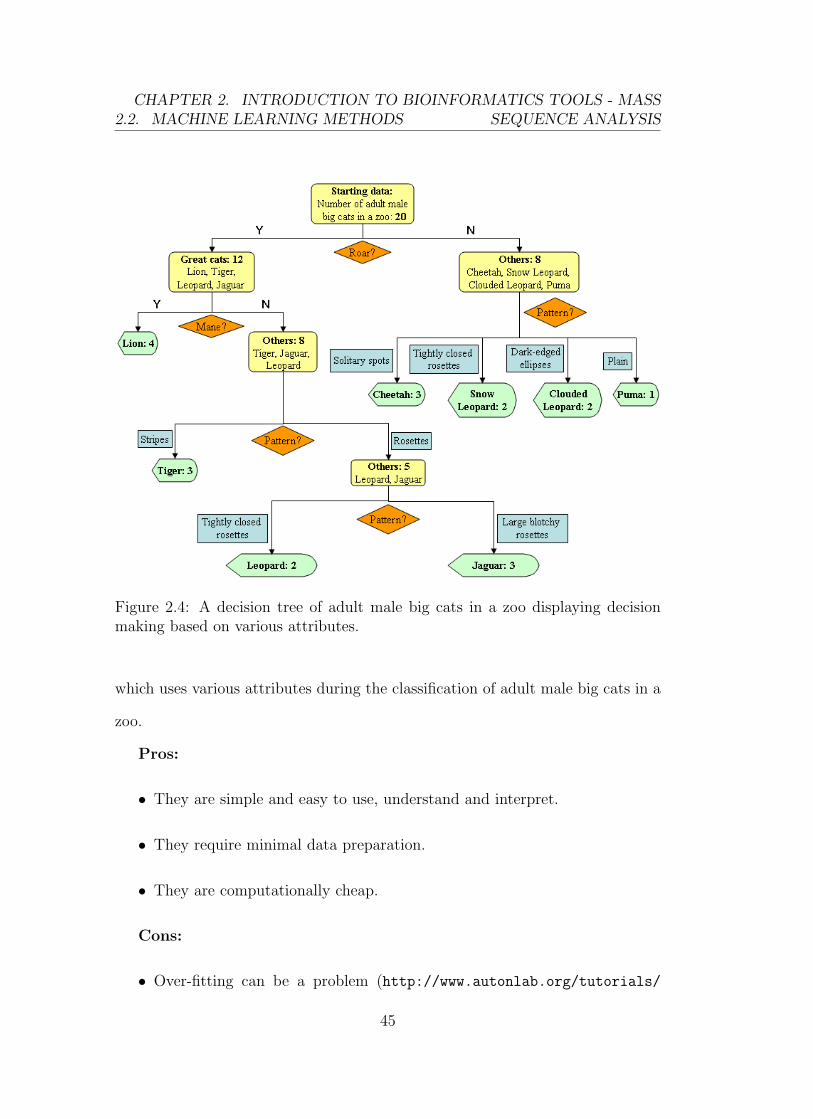
2.2. MACHINE LEARNING METHODSCHAPTER 2. INTRODUCTION TO BIOINFORMATICS TOOLS - MASS
SEQUENCE ANALYSIS
Figure 2.4: A decision tree of adult male big cats in a zoo displaying decisionmaking based on various attributes.
which uses various attributes during the classification of adult male big cats in a
zoo.
Pros:
• They are simple and easy to use, understand and interpret.
• They require minimal data preparation.
• They are computationally cheap.
Cons:
• Over-fitting can be a problem (http://www.autonlab.org/tutorials/
45
2.2. MACHINE LEARNING METHODSCHAPTER 2. INTRODUCTION TO BIOINFORMATICS TOOLS - MASS
SEQUENCE ANALYSIS
dtree18.pdf).
• They can perform poorly where data are difficult to segregate.
2.2.4 Support Vector Machines
Support Vector Machines(SVMs) are based on Vapnik’s Statistical Learning The-
ory (Vapnik, 1995). Data are projected into a higher dimensional space where
they are linearly separable. The points closest to the dividing line are the support
vectors. The technique tries to maximise the distance between the points and
the dividing hyperplane (see Figure 2.5).
Pros:
• They have good generalization accuracy (Spinosa and de Carvalho, 2005;
Hearst et al., 1998).
• Because of their good generalization, they are less susceptible to over-fitting
than other methods and they achieve better results when dealing with new
examples (Spinosa and de Carvalho, 2005).
• Their robustness in high dimensions makes them particularly interesting
for applications where the datasets consist of a small number of examples
and a high number of attributes (Spinosa and de Carvalho, 2005).
• They have a fast convergence rate (fast to learn) (Ding and Dubchak, 2001;
Hearst et al., 1998).
• They have a low false positive rate (Ding and Dubchak, 2001).
Cons:
46

2.2. MACHINE LEARNING METHODSCHAPTER 2. INTRODUCTION TO BIOINFORMATICS TOOLS - MASS
SEQUENCE ANALYSIS
Figure 2.5: Support Vector Machines project the data into a space where it islinearly separable and then maximises the distance between the support vectorsand the dividing hyperplane.
47

2.2. MACHINE LEARNING METHODSCHAPTER 2. INTRODUCTION TO BIOINFORMATICS TOOLS - MASS
SEQUENCE ANALYSIS
• Even though they have a low false positive rate, they also have a low true
positive rate (Ding and Dubchak, 2001).
• They are binary classifiers, which makes them unsuitable for problems deal-
ing with more than two outputs. However, some such problems can be split
into multiple binary classifiers.
• They require lots of memory.
2.2.5 Artificial Neural Networks
An artificial neural network (ANN), often simply called a neural network (NN)
is a computational method for information processing that is inspired by the
way biological nervous systems process information (http://www.doc.ic.ac.
uk/~nd/surprise_96/journal/vol4/cs11/report.html).
In general machine learning methods are capable of handling noisy data. Neu-
ral networks generally learn faulty examples later than others or reject them to-
tally (Brunak, 1993). Neural networks were first used for prediction of secondary
structure successfully, and better than other statistical methods, by (Qian and
Sejnowski, 1988)
Pros:
• Their accuracy increases when multiple parameter datasets are used be-
cause of significant reduction of noise as compared with other methods
(Ding and Dubchak, 2001).
• One can generally expect a network to train quite well when applied to prob-
lems with dynamic or non-linear relationships (http://pages.cs.wisc.
edu/~bolo/shipyard/neural/local.html).
48

2.2. MACHINE LEARNING METHODSCHAPTER 2. INTRODUCTION TO BIOINFORMATICS TOOLS - MASS
SEQUENCE ANALYSIS
• They provide an analytical alternative to conventional techniques which are
often limited by strict assumptions of normality, linearity, variable inde-
pendence, etc. (http://pages.cs.wisc.edu/~bolo/shipyard/neural/
local.html).
Cons:
• They can be slow to learn because of their slow convergence rate (Ding and
Dubchak, 2001).
• They have high false positive rate when fewer-parameter datasets are used
resulting in low accuracy.
• Generalization and over-fitting can be a problem.
Architecture
A neural network consists of a group of interconnected artificial neurons (‘neu-
rodes’, or ‘nodes’) and learns a set of weights from examples (a training set) to
predict an output for a given input (a test set) as shown in Figure 2.6.
Each node has n inputs. The inputs may be represented therefore
as x1, x2, x3, . . . , xn and the corresponding weights for the inputs as
w1, w2, w3, . . . , wn. The summation of the weights multiplied by the inputs can
be written as:
a =n∑
i=1
wixi (2.2)
where a is the activation value (see Figure 2.7). Typically, the output will be 1,
if the activation value > threshold, whereas it will be 0, if the activation value <
threshold (http://www.ai-junkie.com/ann/evolved/nnt3.html).
49

2.2. MACHINE LEARNING METHODSCHAPTER 2. INTRODUCTION TO BIOINFORMATICS TOOLS - MASS
SEQUENCE ANALYSIS
Figure 2.6: A simple pattern recognition example of what a neural networkcan do (Figure adapted from http://www.gc.ssr.upm.es/inves/neural/ann1/
concepts/app.htm).
Figure 2.7: The process of handling data by a node — simple input, data pro-cessing and output generation.
50

2.2. MACHINE LEARNING METHODSCHAPTER 2. INTRODUCTION TO BIOINFORMATICS TOOLS - MASS
SEQUENCE ANALYSIS
Figure 2.8: The architecture of a simple feed-forward neural network. Thecoloured boxes represent nodes where yellow corresponds to the input layer, redto the hidden layer and blue to the output layer. The black arrows represent theconnections and data flow between various nodes.
A typical neural network consists of a number of nodes segregated into three
types of layers: the input layer, the hidden layer, and the output layer (see
Figure 2.8).
A part of this project is carried out using a simple feed-forward neural network
(Rumelhart and McClelland, 1986) using supervised training with the Rprop
algorithm (Riedmiller and Braun, 1993).
Feed-forward networks
Feed-forward networks are the most popular and most widely
used neural networks. They have the following characteristics
51

2.2. MACHINE LEARNING METHODSCHAPTER 2. INTRODUCTION TO BIOINFORMATICS TOOLS - MASS
SEQUENCE ANALYSIS
(http://cse.stanford.edu/class/sophomore-college/projects-00/
neural-networks/Architecture/feedforward.html):
• Nodes are arranged in layers, with the first layer taking in inputs and the
last layer producing outputs. The middle layers have no connection with
the external world, and hence are called hidden layers.
• Each node in one layer is connected to every node on the next layer. Hence
information is constantly fed forward from one layer to the next.
• There is no connection among nodes in the same layer.
Resilient back-propagation
The training method used in this research was resilient back-propagation (Rprop)
(Riedmiller and Braun, 1993, 1992). In general, the resilient back-propagation
algorithm is faster than traditional back-propagation (Liu et al., 2002). It uses
individual dynamically tuned learning rates during the training of the neural
network. Shiffmann et al. (1993) reported that Rprop outperforms all other
learning algorithms in both speed and quality. In a study by Anastasiadis et
al. (2003), it is also found to be one of the best learning methods in terms of
accuracy and robustness with respect to its parameters. The basic principle of
Rprop is to eliminate the harmful influence of the size of the partial derivative on
the weight step (Anastasiadis et al., 2003; Zell et al., 1995). The weight-specific
∆(t)ij value that the size of the weight change is determined by:
∆(t)ij =
−∆
(t)ij if θE(t)
θwij> 0
∆(t)ij if θE(t)
θwij< 0
(2.3)
52

2.2. MACHINE LEARNING METHODSCHAPTER 2. INTRODUCTION TO BIOINFORMATICS TOOLS - MASS
SEQUENCE ANALYSIS
where θE(t)
θwijdenotes the summed gradient information over all patterns in the
pattern file (Zell et al., 1995).
The second step of the learning method is to determine the new update-values
∆(t)ij (Zell et al., 1995). This is calculated by:
∆(t)ij =
η+ ×∆(t−1)ij if θE(t−1)
θwij× θE(t)
θwij> 0
η− ×∆(t−1)ij if θE(t−1)
θwij× θE(t)
θwij< 0
∆(t−1)ij otherwise
(2.4)
where η− and η+ denote decrease and increase factors respectively whose stan-
dard values are 0.5 and 1.2 (Riedmiller and Braun, 1992).
Applications
In addition to computational biology and bioinformatics, ANNs are being used in
a variety of fields such as speech recognition, pattern recognition, image analysis,
gaming, fraud control, and spam filters. A few applications of neural networks in
bioinformatics include:
• secondary structure prediction of proteins (Guimaraes et al., 2003; McGuf-
fin et al., 2000; Cuff and Barton, 1999; Cuff et al., 1998; Chandonia and
Karplus, 1995; Qian and Sejnowski, 1988)
• transmembrane protein prediction (Rost, 1996; Lohmann et al., 1994; Ja-
coboni et al., 2001; Gromiha et al., 2004)
• prediction of post-translational modifications (Bendtsen et al., 2004; Nielsen
et al., 1997; Blom et al., 1999; Julenius et al., 2004)
53

2.2. MACHINE LEARNING METHODSCHAPTER 2. INTRODUCTION TO BIOINFORMATICS TOOLS - MASS
SEQUENCE ANALYSIS
• prediction of the drug resistance of HIV protease mutants (Draghici and
Potter, 2003)
In this chapter, I have reviewed available tools for high throughput protein
annotation as well as machine learning methods and highlighted their strengths
and weaknesses. In general, existing methods pose problems of significant time
investment, difficulties associated with learning, modifying and implementing
pipelining tools, or some methods are designed to perform only a specific task.
This led to the development of an “automated protein annotation tool” (APAT)
and “target annotation pipeline and automated selection” (TAPAS) which are
described in the following chapters. In addition to these, an effort was made
to improve prediction of transmembrane proteins by a combined neural network
predictor.
54

Chapter 3
An Extensible Automated
Protein Annotation Tool —
APAT
Some of the material in this chapter has been published elsewhere
(Deevi, S.V.V and Martin, A.C.R. (2006) An extensible automated
protein annotation tool: standardizing input and output using vali-
dated XML, Bioinformatics, 22:291–296).
In this chapter, I describe the development of the APAT (Automated Protein An-
notation Tool) system, which automates protein annotation by running various
prediction and annotation tools situated either locally or remotely. APAT stan-
dardizes input and output using validated XML and also provides uniform display
of the results. While biologists and bioinformaticians can use all the wrappers
or choose among the wrappers provided by APAT, bioiformaticians can easily
extend the number of tools that can be accessed by APAT by writing additional
55
3.1. INTRODUCTIONCHAPTER 3. AN EXTENSIBLE AUTOMATED PROTEIN ANNOTATION
TOOL — APAT
wrappers to other tools.
3.1 Introduction
In the analysis of sequence data, whether from genomics, transcriptomics, pro-
teomics, or a more specific interest in a small set of proteins from a single pathway
or those targeted to an organelle, there is a frequent need to apply a wide range
of prediction and annotation tools to one or more sequences. Using numerous
web-based or local tools, and collating and comparing their outputs is a laborious
and error-prone task.
Given a protein sequence, one generally starts by looking in SwissProt
(Bairoch and Apweiler, 2000) to see whether the sequence has already been
annotated by expert hand-curation (Boeckmann et al., 2003). Failing that, a
close homologue may be available from which annotations can be transferred.
However, if the sequence (or a close homologue) is not present in SwissProt, or
the specific type of required annotation is not included, then one may need to
run a selection of prediction tools, either across the web, or locally.
A number of web-based tools exist which provide integrated annota-
tion/prediction systems. However, all of these systems suffer restrictions of
one form or another. Very few are extensible: many provide pre-calculated
annotations (frequently at the genome or complete proteome level), or provide
only a fixed set of tools that can be run on a protein sequence. Where a
sequence can be submitted for predictions to be made, it is relatively unusual
that more than one sequence can be submitted at a time, especially where more
than one type of annotation is provided. For example, there are a few tools
such as the ‘DAS-TMfilter’ (Cserzo et al., 2004) and ‘NetPhos 2.0’ (Blom et al.,
56

3.1. INTRODUCTIONCHAPTER 3. AN EXTENSIBLE AUTOMATED PROTEIN ANNOTATION
TOOL — APAT
1999) which accept more than one sequence at a time, but they provide only one
type of annotation (i.e., prediction of transmembrane regions (DAS-TMfilter) or
phosphorylation sites (NetPhos)). There are only a few tools which accept one
sequence at a time and produce more than one type of annotation such as the
‘PredictProtein Server’ (Rost et al., 2004; Rost, 1996).
My project involves automating the process of protein annotation which in-
cludes execution of a variety of tools for protein annotation and prediction tools
on protein sequences of the MEP pathway and apicoplast which include many
hypothetical proteins and less annotated proteins. This requires using an as-
sortment of prediction or annotation tools such as post-translational modifica-
tion predictors, transmembrane predictors, secondary structure predictors, motif
predictors, or sub-cellular location predictors. I also aim to have all these re-
sults combined to be displayed in a uniform and visually well-presented manner.
Obtaining these various kinds of annotations for each of the protein sequences
manually is a tedious task. To accomplish this task one does not need a complex
pipeline/workflow where the output from one tool becomes the input for another,
but rather one needs a system capable of executing multiple tools on a single se-
quence. APAT was primarily designed to play an important role in providing
annotations and can be used by other research groups as an annotation “fan”.
While biologists can use all the wrappers or choose among the wrappers included
in APAT, bioinformaticians can additionally write simple wrappers (which mainly
take care of the XML output so that it fits into APAT specific DTD) to any tool
they wish to run or to webservices provided by Taverna (Oinn et al., 2004) or
the EBI (Labarga et al., 2007; Rice, 2007). Wrappers can be written in any pro-
gramming language and simply need to read and write XML that complies with
57

3.1. INTRODUCTIONCHAPTER 3. AN EXTENSIBLE AUTOMATED PROTEIN ANNOTATION
TOOL — APAT
the APAT DTD.
Precalculated annotations
There are many examples of pre-calculated annotations. For example, ENSEMBL
(Hubbard et al., 2002), the eukaryotic genome database project, provides annota-
tions of genome data including limited annotation of the translated proteins. DAS
(http://www.biodas.org/) is a distributed annotation system that allows pre-
calculated annotation of genomes (including the encoded proteins) to be decen-
tralized among multiple third-party annotators and integrated by client-side soft-
ware (Dowell et al., 2001). ENSEMBL also provides annotations served via DAS.
In principle, this allows anyone to add their own annotations, but this requires
pre-calculation to be performed in-house — there is no support for on-the-fly
annotations. PEDANT (Protein Extraction, Description and ANalysis Tool) (Fr-
ishman et al., 2001) also provides pre-calculated annotations for a wide range of
complete and incomplete genomes with integration of both functional and struc-
tural information. Another server, Integr8 (http://www.ebi.ac.uk/integr8/)
assigns annotations from various sources including InterPro (Apweiler et al., 2001)
and Gene Ontology (GO) (Ashburner et al., 2000) terms to gene products in com-
pleted genomes and proteomes.
Similarly there are tools that work at the protein level. For example PDBSUM
(Laskowski, 2001) is a pre-calculated set of annotations of structures from the
Protein Data Bank; GRASS (Nayal et al., 1999) provides graphical representation
and analysis of structures; SAS (Milburn et al., 1998) and STING-M (Neshich et
al., 2003) are web-based tools for integrating structural information with sequence
analysis and alignment.
58

3.1. INTRODUCTIONCHAPTER 3. AN EXTENSIBLE AUTOMATED PROTEIN ANNOTATION
TOOL — APAT
Web-based annotation servers
The ‘PredictProtein Server’ (Rost et al., 2004; Rost, 1996) can take a protein
sequence and perform predictions using a set of tools, but this toolset cannot be
extended and only one sequence can be processed at a time. In addition there
are large numbers of individual servers which allow a sequence to be submitted
over the web and predictions of properties such as secondary structure, post-
translational modification sites, solvent accessibility and transmembrane regions.
Representative lists are available at http://www.expasy.org/tools/ and http:
//www.up.univ-mrs.fr/~wabim/english/logligne.html. A few servers, such
as DAS-TM (Cserzo et al., 2004) and NetPhos 2.0 (Blom et al., 1999) allow a
batch of sequences to be submitted.
SEView (Junier and Bucher, 1998) is a Java applet that provides an attractive
graphical representation of annotation on a protein or nucleotide sequence, but
does not, itself, perform annotations.
Output from tools
Another aspect of the currently available tools is that the results are all presented
in different forms. It would be much easier for the biologist wanting to scan the
results if different tools provided results in a consistent format. Similarly for the
bioinformatician wishing to write code to integrate and analyze the results from
a number of different prediction tools, it would be advantageous if the results
were available in a consistent form.
A number of proposals have been made for XML formats in which to store se-
quence data and related annotation information. One example is the DAS XML
specification (http://www.biodas.org/). Others include the GAME XML spec-
59

3.1. INTRODUCTIONCHAPTER 3. AN EXTENSIBLE AUTOMATED PROTEIN ANNOTATION
TOOL — APAT
ification implemented by flybase (http://flybase.bio.indiana.edu/annot/)
and OmniGene (http://omnigene.sourceforge.net/). Another XML specifi-
cation for annotation of sequences has been used for PathPort/ToolBus (Eckart
and Sobral, 2003). While the DASGFF and DASSTYLE elements of the DAS
XML specification come close to the requirements of this project, they still do
not provide a simple, concise and consistent annotation format that can be used
for the output of a large range of protein sequence annotation tools where results
may need to be represented as numbers, text and graphs.
3.1.1 Workflows and pipelines
Various workflow based systems were described in Section 2.1. It is probable that
Taverna or ICENI could be used for most of my requirements. However these
are extremely powerful tool with aims which are much more wide-ranging and
complex than supporting the simple desire to scan one or more sequences against
a set of prediction servers. For most of my purposes, there is no requirement for
a true workflow: no data output by one tool becomes the input for another tool.
While Taverna could clearly be used in this way, extending the Taverna system to
access local and web-based (non Web-service) tools, either using SoapLab, or local
processor types are complex procedures and require a considerable investment of
time to develop the expertise required. Further, Taverna makes no attempt to
enforce a common presentation of predictions for a sequence allowing the scientist
to obtain a summary of all the predictions in a common format.
Figure 3.1 and Figure 3.2 show a generalized view of two important and
different themes. Figure 3.1 describes the theme where the input for a tool is
reliant on the output from the preceding tool — a workflow/pipeline. Figure 3.2
60

3.2. SOFTWARE REQUIREMENTSCHAPTER 3. AN EXTENSIBLE AUTOMATED PROTEIN ANNOTATION
TOOL — APAT
Figure 3.1: Simple depiction of a workflow/pipeline.
shows the theme employed by a software that runs multiple processes (potentially
in parallel) where the input of one tool is independent of the output from other
tools — an annotation “fan”.
As described above, my requirement was not to transform the output of one
tool into input for another tool (see Figure 3.1), but simply to feed the same
type of data (a protein sequence) into a number of separate analysis tools (see
Figure 3.2).
As there is a frequent need to apply a large range of local and/or remote
prediction and annotation tools to one or more sequences, a tool able to dispatch
sequences to assorted services by defining a consistent XML format for data and
annotations was created and made available for download by the user community.
3.2 Software requirements
The basic requirements for APAT were:
1. allowing one or more sequences to be analyzed in a single run,
61

3.2. SOFTWARE REQUIREMENTSCHAPTER 3. AN EXTENSIBLE AUTOMATED PROTEIN ANNOTATION
TOOL — APAT
Figure 3.2: Simple depiction of a tool with minimal flow of data from one processto another — annotation fan (e.g. APAT).
2. using multiple prediction/annotation tools residing locally or over the web
through normal CGI scripts or Web-services,
3. obtaining the results in a common format for further analysis,
4. providing consistent visual presentation of results and
5. making the implementation of wrappers to additional tools as straightfor-
ward and language-independent as possible.
A decision was taken to wrap the input and output of each tool in XML. The
system then submits one or more sequences to a set of prediction tools whose
output is converted to a standard XML format (APATML) which can be further
analyzed, or displayed as HTML via a display program.
62

3.3. APPROACH AND METHODSCHAPTER 3. AN EXTENSIBLE AUTOMATED PROTEIN ANNOTATION
TOOL — APAT
3.3 Approach and methods
3.3.1 Analysis of input and output of various annotation
and prediction tools
A number of web-based and local tools were analyzed to discover the types of
information required as input and returned as output. These tools were investi-
gated in order to determine the data types and not to evaluate their performance
(see Table 3.1).
The tools included NetPhos (Blom et al., 1999), NetOGlyc (Julenius et al.,
2004), DAS-TM Filter (Cserzo et al., 2004), TargetP (Emanuelsson et al., 2000),
PsiPred (McGuffin et al., 2000), InterProScan (Zdobnov and Apweiler, 2001),
LOCtree (Nair and Rost, 2004), Predotar (Small et al., 2004), BLAST (Altschul
et al., 1990, 1997), FingerPrintScan (Scordis et al., 1999), TMHMM (Krogh et
al., 2001), PATS (Zuegge et al., 2001), ScanProsite (Gattiker et al., 2002; Hulo
et al., 2004) and SMART (Schultz et al., 1998).
3.3.2 Input data
Many of the programs have different options, but supply defaults for the vast
majority of these. For purposes of bulk scanning of sequence data, using these
default values is considered as acceptable and is commonly practiced (Rost et
al., 2004). It is a trivial matter to modify the wrappers to use different values.
From the tools that were examined, in addition to the sequence, the only data
that must be supplied are: an identifier for the sequence, an email address and
an indication of whether or not a sequence is of plant origin.
A very simple DTD which is used to encode the input sequence and any
63

3.3. APPROACH AND METHODSCHAPTER 3. AN EXTENSIBLE AUTOMATED PROTEIN ANNOTATION
TOOL — APAT
Residue level Domain level Sequence levelTool number text number text number textNetPhos 2.0
√
NetOGlyc√
DAS-TM√ √ √ √
TargetP√ √
LOCtree√ √
PsiPred√ √
Predotar√ √
BLAST√ √
FingerPrintScan√ √
TMHMM√ √ √
PATS√ √
ScanProsite√ √
SMART√ √
InterProScan√ √
Table 3.1: Annotation types returned by a number of example tools.
parameters required by the annotation/prediction programs was designed. A
Perl script ‘mix.pl’ which converts a Fasta file into this format and accepts any
additional parameters on the command line or interactively was also created.
Some programs may have more extensive input requirements. By definition,
XML is extensible so the DTD for input data can easily be extended to allow
for additional input requirements of specific wrappers. These additional tags will
simply be ignored by wrapper scripts which don’t need them.
An example XML file is shown in Figure 3.3 (also on the web at http://www.
bioinf.org.uk/apat/) while the DTD is shown in Figure 3.4.
3.3.3 Output data
After careful analysis of various annotation tools, as described above, it was found
that the annotations provided by these programs could all be described by 6 data
types:
64

3.3. APPROACH AND METHODSCHAPTER 3. AN EXTENSIBLE AUTOMATED PROTEIN ANNOTATION
TOOL — APAT
<input>
<sequenceid>1 NULL 1-deoxy-D-xylulose 5-phosphate
reductoisomerase
</sequenceid>
<sequence>
MKKYIYIYFFFITITINDLVINNTSKCVSIERRKNNAYINYGIGYN
GPDNKITKSRRCKRIKLCKKDLIDIGAIKKPINVAIFGSTGSIGTN
ALNIIRECNKIENVFNVKALYVNKSVNELYEQAREFLPEYLCIHDK
SVYEELKELVKNIKDYKPIILCGDEGMKEICSSNSIDKIVIGIDSF
QGLYSTMYAIMNNKIVALANKESIVSAGFFLKKLLNIHKNAKIIPV
DSEHSAIFQCLDNNKVLKTKCLQDNFSKINNINKIFLCSSGGPFQN
LTMDELKNVTSENALKHPKWKMGKKITIDSATMMNKGLEVIETHFL
FDVDYNDIEVIVHKECIIHSCVEFIDKSVISQMYYPDMQIPILYSL
TWPDRIKTNLKPLDLAQVSTLTFHKPSLEHFPCIKLAYQAGIKGNF
YPTVLNASNEIANNLFLNNKIKYFDISSIISQVLESFNSQKVSENS
EDLMKQILQIHSWAKDKATDIYNKHNSS
</sequence>
<emailaddress>[email protected]</emailaddress>
<parameter server=’targetp’ param=’origin’ value=’non-plant’ />
<parameter server=’psort’ param=’origin’ value=’animal’ />
<parameter server=’subloc’ param=’origin’ value=’eukaryotic’ />
</input>
Figure 3.3: An example of the XML format used for input to the APAT system.
<!ELEMENT emailaddress ( #PCDATA ) >
<!ELEMENT input ( sequenceid, sequence, emailaddress, parameter+ ) >
<!ELEMENT parameter EMPTY >
<!ATTLIST parameter param CDATA #REQUIRED >
<!ATTLIST parameter server CDATA #REQUIRED >
<!ATTLIST parameter value CDATA #REQUIRED >
<!ELEMENT sequence ( #PCDATA ) >
<!ELEMENT sequenceid ( #PCDATA ) >
Figure 3.4: APATINML DTD.
65

3.3. APPROACH AND METHODSCHAPTER 3. AN EXTENSIBLE AUTOMATED PROTEIN ANNOTATION
TOOL — APAT
<result program=’NetPhos’ version=’2.0’>
<function>Protein Phosphorylation sites Prediction</function>
<run>
...Lists any parameters supplied to the program...
<date>Fri Nov 19 15:30:38 GMT 2004</date>
</run>
<predictions>
<perres-number name = ’P-score’ clrmin = ’0.0’ clrmax = ’1.0’
graph=’1’ graphtype=’bars’>
<value-perres residue=’1’>0.215567</value-perres>
...
</perres-number>
<threshold>
...<description> describes threshold...</description>
...<thr-res> tags list the positive prediction residues</thr-res>
</threshold>
</predictions>
</result>
Figure 3.5: Summary of the key aspects of an APATML output file for per-residueannotations.
66

3.3. APPROACH AND METHODSCHAPTER 3. AN EXTENSIBLE AUTOMATED PROTEIN ANNOTATION
TOOL — APAT
1. Residue level-Textual data
2. Residue level-Numeric data
3. Domain region level-Textual data
4. Domain region level-Numeric data
5. Whole sequence level-Textual data
6. Whole sequence level-Numeric data
Table 3.1 shows examples of the annotations returned by different tools. In the
case of residue-level annotations, a value is often provided for every residue in a
sequence. Typical examples are secondary structure prediction, transmembrane
prediction, glycosylation and phosphorylation site prediction. In some cases,
graphical display of such annotations in the form of both line-charts and bar-
charts can be useful and it is necessary that this requirement can be flagged.
Domain-level annotations can be viewed as an extension of residue-level an-
notations in which discrete continuous stretches of residues are given the same
label. However, the semantic meaning is somewhat different. While a residue-
level annotation applies to that residue in isolation, a domain-level annotation
is not meaningful in the context of a single residue. For example, domain-level
annotations are generally used for the results of pattern or profile searches such
as FingerPRINTScan (Scordis et al., 1999), ProSite (Gattiker et al., 2002; Hulo
et al., 2004), InterProScan (Zdobnov and Apweiler, 2001), and SMART (Schultz
et al., 1998). It would not be meaningful to say that a single residue matched
one of the patterns which these tools recognise. From a presentational viewpoint,
one generally wishes such annotations to be provided in a tabular form rather
67

3.3. APPROACH AND METHODSCHAPTER 3. AN EXTENSIBLE AUTOMATED PROTEIN ANNOTATION
TOOL — APAT
<result program=’InterProScan’ version=’1.0’>
<function>Protein domain Prediction</function>
<run>
...Lists any parameters supplied to the program...
<date>Fri Nov 19 15:50:04 GMT 2004</date>
</run>
<predictions>
<perdom class=’PRINTS’ name = ’SH2_DOMAIN’ highlight=’1’
rangemin=’23’ rangemax=’150’>
<value-perdom label=’e-value’>1.7e-17</value-perdom>
</perdom>
<perdom class=’PROSITE’ name = ’ASN_GLYCOSYLATION’ highlight=’0’
rangemin=’48’ rangemax=’51’>
<value-perdom label=’match’>NLTV</value-perdom>
</perdom>
<perdom-description class=’PROSITE’ name = ’ASN_GLYCOSYLATION’>
Potential N-linked glycosylation site identified by ProSite pattern.
</perdom-description>
</predictions>
</result>
Figure 3.6: Summary of the key aspects of an APATML output file for per-domainannotations.
68

3.3. APPROACH AND METHODSCHAPTER 3. AN EXTENSIBLE AUTOMATED PROTEIN ANNOTATION
TOOL — APAT
<result program=’TargetP’ version=’1.01’>
<function>Protein subcellular location Prediction</function>
<run>
...Lists any parameters supplied to the program...
<date>Fri Nov 19 15:47:04 GMT 2004</date>
</run>
<predictions>
<perseq name = ’mTP-pred’>
<description>Mitochondrial targeting peptide (mTP) prediction
score</description>
<value-perseq highlight=’0’>0.031</value-perseq>
<perseq>
<perseq name = ’Loc-pred’>
<description>SUBCELLULAR LOCATION PREDICTION</description>
<value-perseq highlight=’1’>SECRETORY PATHWAY, i.e. THE SEQUENCE
CONTAINS A SIGNAL PEPTIDE,SP.
</value-perseq>
</perseq>
...
</predictions>
</result>
Figure 3.7: Summary of the key aspects of an APATML output file for per-sequence annotations.
than indicated on the sequence itself. Taking FingerPRINTScan as an example,
for each fingerprint matched, the server at http://www.ebi.ac.uk/printsscan/
returns 7 numbers (the number of motifs matched; the number of motifs in the
fingerprint; SumID; AveID; ProfScore; P-value; E-value) and 2 strings (the fin-
gerprint name; an indication of which motifs within the fingerprint match). In
addition, one additional string is returned for each motif matched indicating the
matched residues. From this a residue range can be calculated.
Sequence-level annotations provide a value which is applicable to the whole
sequence. Examples are protein localization predictions such as TargetP
(Emanuelsson et al., 2000), Predotar (Small et al., 2004), LOCtree (Nair and
69

3.3. APPROACH AND METHODSCHAPTER 3. AN EXTENSIBLE AUTOMATED PROTEIN ANNOTATION
TOOL — APAT
Rost, 2004), PATS (Zuegge et al., 2001) and the results of BLAST (Altschul
et al., 1990, 1997) searches. Semantically this is similar to a domain-level
annotation, but the presentation requirements are rather different.
Some servers provide annotations at more than one level. For example,
TMHMM (Krogh et al., 2001) provides per-residue values indicating the prob-
ability that an individual residue is in a transmembrane region. In addition, it
summarizes ranges of residues predicted to form transmembrane helices indicating
their orientation together with an overall significance value. Finally it generates
a number of pieces of summary data such as the number of amino acids pre-
dicted to be in transmembrane helices and the number within the first 60 amino
acids. It therefore has annotations at all three levels: per-residue, per-domain
and per-sequence.
Since XML makes no distinction between numeric and character data (every-
thing is stored as plain text), a decision was taken to simplify this scheme further
by treating the numeric and text annotations for domains and for sequences as
single types. However, the distinction for per-residue annotations was retained
since one may wish to generate graphs of numeric data while there will be no
such requirement for character data.
Therefore APAT has just four data types which can be used to encapsulate
the annotations from all the tools likely to be encountered:
1. per-residue numbers
2. per-residue strings
3. per-domain values
4. per-sequence values
70

3.3. APPROACH AND METHODSCHAPTER 3. AN EXTENSIBLE AUTOMATED PROTEIN ANNOTATION
TOOL — APAT
As described above, the use of the DAS XML format (http://www.biodas.
org/documents/spec.html) for the annotation requirements was considered, but
decided against for a number of reasons.
• First, simplicity was a priority to allow additional service wrappers to be
written easily. Being designed primarily for DNA-level annotations, DAS is
unnecessarily complex for my purposes having many redundant fields. Also
DASGFF and DASSTYLE elements need to be combined to achieve the
simple task of indicating visual annotations.
• Second, there is no direct way within the DASSTYLE elements to specify a
requirement for a graph to be displayed. One would either have to extend
the DAS XML specification or co-opt existing glyph styles to have non-
standard meanings.
• Third, providing the semantics are easily transferable, conversion between
XML formats is straightforward using XSLT, so a specific format can be
chosen to ease the burden of implementing a particular system.
Consequently, a new XML format, APATML was designed as shown in the
DTD in Figure 3.8, with simplified examples of per-residue, per-domain and per-
sequence annotations in Figure 3.5, Figure 3.6 and Figure 3.7 respectively. Details
of the meaning of each XML tag are provided in Table 3.2.
The actual output of many web-based servers provides visual highlighting,
graphs and extensive text. Only the essential information from this is captured —
alternative presentation issues can be addressed in a display program. However, in
addition to the pure annotation data, the storage of limited meta-data about what
the annotations mean is allowed. For example, at the server level, the name and
71

3.3. APPROACH AND METHODSCHAPTER 3. AN EXTENSIBLE AUTOMATED PROTEIN ANNOTATION
TOOL — APAT
Tags
Descrip
tio
nsubtags
Attrib
utes
<results>
The
root
tag
that
wra
ps
vari
ous
kin
ds
ofannota
tions
pro
duced
by
dif-
fere
nt
serv
ers
<input>
<result>
Nil
<input>
Conta
ins
deta
ils
ofin
put
sequence
<seqid>
<seq>
<emailaddress>
<parameter>
Nil
<seqid>
Conta
ins
pro
tein
sequence
identi
ficati
on
deta
ils
Nil
Nil
<seq>
Conta
ins
am
ino
acid
softh
ein
put
pro
tein
(one
resi
due
per
tag)
Nil
Nil
<emailaddress>
Conta
ins
em
ail
addre
ssente
red
by
use
rsN
ilN
il<parameter>
This
isan
em
pty
tag
conta
inin
gth
ein
form
ati
on
about
para
mete
rsin
its
att
ribute
sN
ilserver:
nam
eofth
ese
rver,
param:
type
or
nam
eofth
epara
mete
r,value:
valu
est
ore
d<result>
Inclu
des
the
outp
ut
from
one
part
icula
rse
rver
<function>
<info>
<run>
<predictions>
program:
nam
eofth
eannota
tion
serv
er,
version:
(op-
tional)
vers
ion
ofth
eannota
tion
serv
er
<function>
Desc
ribes
the
functi
on
ofan
annota
tion
serv
er
Nil
Nil
<info>
Desc
ribes
the
toolbein
guse
dand
ishyperl
inked
toth
eactu
alse
rver
ifit
isa
web-b
ase
dto
olor
just
says
itis
alo
calse
rver
ifit
isone
Nil
Nil
<run>
Desc
ribes
run
para
mete
rsand
date
<params>
<date>
Nil
<params>
Conta
ins
tags
that
repre
sent
the
run
para
mete
rs<param>
Nil
<param>
Conta
ins
nam
eand
valu
eass
ocia
ted
wit
hth
epara
mete
ras
att
ribute
s(O
ne
or
more
tags)
Nil
name:
nam
eof
the
para
mete
r,value:
valu
eass
igned
for
the
para
mete
r<date>
Conta
ins
deta
ils
about
day,date
,ti
me
ofru
nN
ilN
il<predictions>
Conta
ins
pre
dic
tions
from
the
serv
er
<link>
<perres-number>
<perres-character>
<threshold>
<perdom>
<perseq>
(all
opti
onal)
Nil
<link>
Conta
ins
link
for
pre
dic
tion
from
the
actu
al
webse
rver
bein
guse
din
it’s
unpars
ed
form
Nil
href:
conta
insth
eU
RL
foroutp
utpage
from
the
web-
serv
er
<perres-number>
Desc
ribes
num
eri
cannota
tion
at
the
per-
resi
due
level
<value-perres>
name:
nam
eof
the
type
of
num
eri
cdata
store
din
the
arr
ay
(lik
e’p
-score
’),clrmin:
min
imum
valu
efo
rcolo
uri
ng
range,clrmax:
maxim
um
valu
efo
rcolo
uri
ng
range,graph:
(opti
onal)
wheth
er
agra
ph
isre
quir
ed
or
not
(1fo
ryes
and
0fo
rno),
graphtype:
(opti
onal,
requir
ed
ifgra
ph
=1)
type
ofgra
ph
tobe
use
d’b
ars
’or
’lin
es’
<value-perres>
These
tags
specify
avalu
eto
be
ass
igned
toeach
resi
due
Nil
residue:
sequenti
alnum
ber
ofth
ere
sidue
inth
epro
-te
inse
quence
<perres-character>
Desc
ribes
text
annota
tion
at
the
per-
resi
due
level
<value-perres>
name:
nam
eof
the
type
of
num
eri
cdata
store
din
an
arr
ay
(lik
e’p
-score
’)<threshold>
Use
dto
indic
ate
resi
dues
that
pass
som
epre
dic
tion
thre
shold
(those
that
are
consi
dere
d’p
osi
tive’pre
dic
tions
and
should
there
fore
be
hig
h-
lighte
d)
<description>
<thr-res>
Nil
<description>
Desc
ripti
on
ofw
hat
the
thre
shold
repre
sents
Nil
Nil
<thr-res>
Sto
res
resi
due
num
bers
(one
per
tag)
of
those
resi
dues
that
pass
the
thre
shold
valu
eN
ilN
il
<perdom>
Desc
ribes
annota
tions
(eit
her
num
eri
cor
chara
cte
r)th
at
apply
toa
conti
nuous
range
ofre
sidues
<value-perdom>
<perdom-description>
class:
(opti
onal)
conta
ins
nam
eof
the
serv
er;
use
dfo
rse
rvers
that
pro
duce
mult
iple
types
ofannota
tion,
name:
(opti
onal)
annota
tion
nam
eapplied
toth
edo-
main
,highlight:
wheth
erto
hig
hlightth
evalu
eornot
(1fo
ryes
and
0fo
rno),
rangemin:
min
imum
sequence
num
berofth
era
nge
ofth
eannota
ted
regio
n,rangemax:
maxim
um
sequence
num
ber
ofth
era
nge
ofth
eanno-
tate
dre
gio
n<value-perdom>
Inclu
des
eit
her
num
eri
cor
chara
cte
rdata
ofannota
tion;ty
pic
ally
use
dfo
rin
dic
ati
ng
confidence
or
matc
hre
gio
nN
illabel:
desc
ripti
on
of
what
the
valu
ere
fers
to(e
.g.
Confidence,e-v
alu
e,m
atc
hpatt
ern
)<perdom-description>
Pro
vid
es
an
exte
nded
genera
ldesc
ripti
on
of
the
kin
dof
dom
ain
pre
-dic
ted
Nil
class:
(opti
onal)
conta
ins
nam
eof
the
serv
er
and
isuse
dfo
rse
rvers
that
pro
duce
mult
iple
types
ofanno-
tati
on,name:
annota
tion
nam
eapplied
toth
edom
ain
<perseq>
Sequence
levelannota
tion
thatconta
inseit
hernum
berorchara
cte
rout-
put
from
the
serv
er
<value-perseq>
<description>
,name:
nam
eof
the
pre
dic
tion/ty
pe
ofoutp
ut
<value-perseq>
Conta
ins
the
actu
alvalu
e(o
utp
ut)
ofpre
dic
tion
Nil
highlight:
wheth
erto
hig
hlightth
evalu
eornot(1
for
yes
and
0fo
rno)
<description>
More
deta
iled
desc
ripti
on
ofth
epre
dic
tion/outp
ut
Nil
Nil
Tab
le3.
2:A
det
aile
dlist
ofX
ML
tags
incl
uded
inA
PAT
ML.
72

3.3. APPROACH AND METHODSCHAPTER 3. AN EXTENSIBLE AUTOMATED PROTEIN ANNOTATION
TOOL — APAT
version number of the program, the run-time parameters and a textual description
of the program’s function is stored. At the per-sequence annotation level, one
can store extensive text associated with annotations and at the per-domain level
a description may be stored associated with a prediction. This accounts for
servers such as InterProScan which potentially identify more than one region of
a protein using a number of underlying databases/algorithms. Simple storage
of the annotated residue range is allowed, together with a database name (e.g.
PRINTS) and annotation (e.g. SH2 DOMAIN) which is stored separately from
an explanation of what a ‘PRINTS SH2 DOMAIN’ actually is.
Although APAT provides an easy means of comparison between the output
from various tools (which itself is a summarized output from the actual tool)
through uniform output format, it makes no attempt to compare the results from
related prediction tools and does not generate any form of consensus prediction.
However, this could be achieved by a post analysis script. For example, results
from similar tools were combined using a post analysis script as described in
Chapter 5. APAT is a simple sequence annotation “fan” with standardized XML
input and output where the choice of tools is left for the user. Usage of the
display program to obtain HTML output is optional and could be replaced by
any type of post analysis script.
For example, APAT was used in TAPAS (shown in Chapter 4) and also in the
work of improving transmembrane prediction (shown in Chapter 5). The output
from APAT is handled differently in both cases. While the display program of
APAT was used to produce HTML output in TAPAS which is later used to obtain
the number of transmembrane proteins predicted (along with the link provided for
viewing output from other tools) the display program of APAT was excluded in
73

3.3. APPROACH AND METHODSCHAPTER 3. AN EXTENSIBLE AUTOMATED PROTEIN ANNOTATION
TOOL — APAT
the transmembrane work where the XML output from APAT was used by a post
analysis script to produce input files for neural networks having the prediction
values from various transmembrane predictors. The choice of tools used in both
cases is also different.
Handling complex schemes
In the case of numeric per-residue annotations, the DTD also allows one to in-
dicate whether a graph (either a line chart or a bar chart) should be provided
to display the data. In addition, a mechanism by which individual residues can
be highlighted as ‘positive’ predictions is provided. Initially the hope was simply
to provide some threshold value such that any per-residue numeric scores higher
than the threshold could be flagged by the display program. However, some of
the servers have much more complex threshold schemes. For example NetOGlyc
makes a positive prediction if one score (the ‘G-score’) is > 0.5 or, for threonines,
if the G-score is < 0.5, but the ‘I-score’ is > 0.5 and there are no other sites pre-
dicted within 10 residues. Therefore it was decided that the DTD should include
a list of the residues considered as positive predictions together with a description
of how such residues are identified. This moves the logic of indicating a positive
prediction back to the service wrapper rather than the display program.
3.3.4 System architecture
The overall architecture of the APAT system is shown in Figure 3.10. The system
is implemented in Perl using the XML::DOM module for parsing XML files. The
software consists of 3 major components:
1. a ‘master’ script which reads an XML input file containing the sequence
74

3.3. APPROACH AND METHODSCHAPTER 3. AN EXTENSIBLE AUTOMATED PROTEIN ANNOTATION
TOOL — APAT
<!ELEMENT date ( #PCDATA ) >
<!ELEMENT description ( #PCDATA ) >
<!ELEMENT emailaddress ( #PCDATA ) >
<!ELEMENT function ( #PCDATA ) >
<!ELEMENT info ( #PCDATA ) >
<!ATTLIST info href CDATA #IMPLIED >
<!ELEMENT input ( seqid, seq+, emailaddress, parameter+ ) >
<!ELEMENT link ( #PCDATA ) >
<!ATTLIST link href CDATA #REQUIRED >
<!ELEMENT param EMPTY >
<!ATTLIST param name CDATA #REQUIRED >
<!ATTLIST param value CDATA #REQUIRED >
<!ELEMENT parameter EMPTY >
<!ATTLIST parameter param CDATA #REQUIRED >
<!ATTLIST parameter server CDATA #REQUIRED >
<!ATTLIST parameter value CDATA #REQUIRED >
<!ELEMENT params ( param+ ) >
<!ELEMENT perdom ( value-perdom+ ) >
<!ATTLIST perdom class CDATA #IMPLIED >
<!ATTLIST perdom highlight CDATA #IMPLIED >
<!ATTLIST perdom name CDATA #IMPLIED >
<!ATTLIST perdom rangemax CDATA #REQUIRED >
<!ATTLIST perdom rangemin CDATA #REQUIRED >
<!ELEMENT perdom-description ( #PCDATA ) >
<!ATTLIST perdom-description class CDATA #IMPLIED >
<!ATTLIST perdom-description name CDATA #REQUIRED >
<!ELEMENT perres-character ( value-perres+ ) >
<!ATTLIST perres-character name CDATA #REQUIRED >
<!ELEMENT perres-number ( value-perres+ ) >
<!ATTLIST perres-number clrmax CDATA #REQUIRED >
<!ATTLIST perres-number clrmin CDATA #REQUIRED >
<!ATTLIST perres-number graph CDATA #IMPLIED >
<!ATTLIST perres-number graphtype CDATA #IMPLIED >
<!ATTLIST perres-number name CDATA #REQUIRED >
<!ELEMENT perseq ( description, value-perseq ) >
<!ATTLIST perseq name CDATA #REQUIRED >
<!ELEMENT predictions (link | perdom | perdom-description | perres-character | perres-number | perseq | threshold)* >
<!ELEMENT result ( function, info, run, predictions ) >
<!ATTLIST result program CDATA #REQUIRED >
<!ATTLIST result version CDATA #IMPLIED >
<!ELEMENT results ( input, result+ ) >
<!ELEMENT run ( params, date ) >
<!ELEMENT seq ( #PCDATA ) >
<!ELEMENT seqid ( #PCDATA ) >
<!ELEMENT thr-res ( #PCDATA ) >
<!ELEMENT threshold ( description, thr-res* ) >
<!ELEMENT value-perdom ( #PCDATA ) >
<!ATTLIST value-perdom label CDATA #REQUIRED >
<!ELEMENT value-perres ( #PCDATA ) >
<!ATTLIST value-perres residue CDATA #REQUIRED >
<!ELEMENT value-perseq ( #PCDATA) >
<!ATTLIST value-perseq highlight CDATA #REQUIRED >
Figure 3.8: APATML DTD.
75

3.3. APPROACH AND METHODSCHAPTER 3. AN EXTENSIBLE AUTOMATED PROTEIN ANNOTATION
TOOL — APAT
Figure 3.9: Sample HTML output from the APAT system showing per-residueand per-sequence annotations. The per-residue annotation has been edited totwo lines for brevity. A full example may be seen on the APAT web site.
76

3.3. APPROACH AND METHODSCHAPTER 3. AN EXTENSIBLE AUTOMATED PROTEIN ANNOTATION
TOOL — APAT
and dispatches it to each service wrapper,
2. wrappers for each annotation/prediction service,
3. a display program which converts the APATML output from the annota-
tion/prediction services to HTML for display.
This display program can be replaced by any number of post-analysis scripts.
In addition, to allow the system to be used to process a batch of sequences, a
short script was implemented which will run through all the input XML files in
a directory and process each in turn using the ‘master’ script. While the system
is not really designed for online use, a simple web interface was implemented pri-
marily for demonstration purposes, although this could prove useful for intranet
installations.
The Display Program
The most complex part of the system is the display program which provides a
uniform display for all the annotation services. The APATML file is read using
XML::DOM. Per-sequence annotations, which are applied to the whole sequence,
are simply displayed as text, while per-domain annotations are displayed as a sim-
ple table of results with associated descriptions following the table. Per-residue
annotations are presented in the form of a table in which numeric values are
coloured on a scale from blue through green to red. In addition, residues marked
in the APATML as ‘positive predictions’ are highlighted and, where indicated by
the APATML, the GD::Graph Perl module is used to provide graphical display
of per-residue annotations. A sample of HTML output from the display program
is shown in Figure 3.9).
77

3.3. APPROACH AND METHODSCHAPTER 3. AN EXTENSIBLE AUTOMATED PROTEIN ANNOTATION
TOOL — APAT
XML XML Display
APAT toolsStandaloneWrappersLocal
Software
WrappersWrappers Services(SOAP) WebServers
CGI Web
DataSupport
Sequence
HTML
Master program
Figure 3.10: Overall architecture of the APAT system.
Service Wrappers
Each of the service wrappers is implemented as a stand-alone ‘plug-in’. The
master program simply identifies all the plug-ins available and runs each in turn.
This design allows individual service wrappers to be implemented and debugged
as stand-alone code and simply placed in a standard directory for integration into
the system. Plug-ins can be implemented such that they provide a self-contained
annotation service, but in practice they are generally wrappers to some other tool.
Such tools may reside locally or remotely, either as Web-services or CGI-based
servers on the web. Remote services may be accessed via SOAP or by ‘screen-
scraping’ of web pages respectively. Since the only requirement of the plug-ins
is that they read and write XML, they can be implemented in any programming
language and integrated seamlessly into the APAT system. A number of plug-in
service wrappers are implemented in Perl for which the SOAP::Lite and LWP
packages make access to Web-services and CGI-based servers straightforward.
78

3.3. APPROACH AND METHODSCHAPTER 3. AN EXTENSIBLE AUTOMATED PROTEIN ANNOTATION
TOOL — APAT
Tool Web addressNetPhos http://www.cbs.dtu.dk/services/NetPhos/PsiPred http://bioinf.cs.ucl.ac.uk/psipred/ (running locally)TargetP http://www.cbs.dtu.dk/services/TargetP/TMHMM http://www.cbs.dtu.dk/services/TMHMM/ChloroP http://www.cbs.dtu.dk/services/ChloroP/NetOGlyc http://www.cbs.dtu.dk/services/NetOGlyc/DAS-TMfilter http://www.enzim.hu/DAS/DAS.htmlPrositeScan ftp://us.expasy.org/databases/prosite/tools/ps_scan/ (running locally)Plasmit http://gecco.org.chemie.uni-frankfurt.de/plasmit/PSORT http://psort.nibb.ac.jp/form.htmlSubLoc http://www.bioinfo.tsinghua.edu.cn/SubLoc/
Table 3.3: Wrappers are made available for the tools listed here along with theirweb addresses.
It is also possible to use wrappers on top of web services made available by
Taverna (Oinn et al., 2004), the EBI (Labarga et al., 2007), or other sources,
to obtain results from various tools. Writing simple wrappers to access these
services avoids the need to write a wrapper from scratch. All that is required is a
simple wrapper to take care of XML formatting of the output so that it fits into
the XML DTD of APAT.
Implementation of additional service wrappers is relatively straightforward
and validation against the APATML DTD ensures that the results can be con-
verted to HTML using the display program. The DTD was prepared with the
aid of the XML-to-DTD conversion utility from Hit Software available at http:
//www.hitsw.com/xml_utilites/ before careful manual checking and modifica-
tion. A guide to writing wrappers with explanation and examples is provided
on the CD-ROM and the APAT website. A list of wrappers written to date is
provided in Table 3.3.
79

3.4. SUMMARY AND DISCUSSIONCHAPTER 3. AN EXTENSIBLE AUTOMATED PROTEIN ANNOTATION
TOOL — APAT
3.3.5 Web interface
A simple web interface was created which allows a single sequence to be submit-
ted to a small number of prokaryotic and eukaryotic prediction tools and was
provided as a demonstration (accessible at http://www.bioinf.org.uk/apat/).
An example of HTML output from the tool was also provided on the web for
a quick overview. Users can run the tool, although it does not include all the
plugin wrappers provided in the downloadable version. A facility for submitting
additional wrappers written by users was also provided. An XML DTD for in-
put and output along with other documentation about writing wrappers and the
source code of APAT was also provided for download.
3.4 Summary and Discussion
APAT is designed to perform a very simple but repetitive task in a straightfor-
ward manner: it allows one or more sequences to be presented to a number of
different annotation/prediction servers, collating the results and presenting them
in a consistent format for automated or visual analysis. This approach contrasts
with Taverna (Oinn et al., 2004) and ToolBus (Eckart and Sobral, 2003). These
are hugely capable workflow-based systems which, while clearly capable of sim-
ilar things, come with an overhead of complexity requiring some considerable
investment in time to learn how they can be extended. In addition, Taverna, in
its current form, is not designed to highlight the key information needed by a
Biologist in a simple and consistent format.
The output produced by a wide range of protein sequence and annotation tools
was analyzed and it was determined that all annotations can be expressed in one
80

3.4. SUMMARY AND DISCUSSIONCHAPTER 3. AN EXTENSIBLE AUTOMATED PROTEIN ANNOTATION
TOOL — APAT
of four ways (character or numeric per-residue annotations, or annotations at the
per-domain or per-sequence level). On the basis of this analysis, an XML DTD
was designed to abstract and encode the annotations provided by any prediction
server. On the basis of this DTD, a display tool and wrappers to a number of
annotation/prediction services running both locally and remotely were designed
and implemented.
APAT provides an easy way of comparing the output from various tools
through uniform output format, but does not suggest which particular tool among
a group of similar tools provides the best answer. It also does not provide a final
summary of output for each sequence. APAT is an annotation fan where the
choice of tools and interpretation of output is left with users.
Wrappers are provided for some of the currently available state-of-the-art
tools. Usage of the display program to obtain HTML output is optional and
could be replaced by any type of post analysis scripts.
APAT was used in TAPAS (Chapter 4) and also in the work of improving
transmembrane prediction (Chapter 5).
The system is designed to be downloaded and run locally allowing the user to
run many annotation/prediction services on one or more sequences without man-
ual intervention. Users can easily choose which plug-in annotation services they
wish to use and implementation of additional service wrappers is straightforward
using the existing wrappers as examples. While this may not be possible for the
average Biologist, it should take an experienced Bioinformatician no more than a
couple of hours to implement an additional wrapper. Compliance of the resulting
XML can be checked against the APATML DTD using a validating parser to
ensure compatibility.
81
3.4. SUMMARY AND DISCUSSIONCHAPTER 3. AN EXTENSIBLE AUTOMATED PROTEIN ANNOTATION
TOOL — APAT
While the system allows multiple single sequences to be sent to prediction
servers, it makes no attempt to handle servers which require multiple sequences
(for example, multiple sequence alignments and phylogeny). Similarly there is no
ability to deal with servers which return much more complex data such as three-
dimensional models built by comparative modelling. The display tool presents
the results of each annotation/prediction server separately; a further possible
enhancement would be to display multiple residue-level annotations on a single
view of the sequence as is done in DAS (http://www.biodas.org/).
Source code for the master and display programs and for a number of plug-in
service wrappers has been made available for download from the web site together
with the DTD and documentation. The download also provides the scripts for
converting a sequence to the input XML format and for running all the input
XML files in a specified directory through the APAT system. An installation
script (written by Dr. Andrew Martin) is provided which installs the software
and, optionally, the web interface. Documentation includes detailed descriptions
of the APATML format and a guide to implementing service wrappers. As a
demonstration, a web-based tool that allows a single sequence to be submitted
to a small number of prokaryotic and eukaryotic prediction tools is also provided.
The system may be accessed at http://www.bioinf.org.uk/apat/.
Frishman (2007) in his review of protein annotation on a genomic scale has
written about tools such as APAT having the advantage of being highly config-
urable and flexible. The following is an extract from Frishman’s review of protein
annotation:
“In recent years, the idea of protocol-based genome data processing
has been popularized, which draws parallels between the organization
82

3.4. SUMMARY AND DISCUSSIONCHAPTER 3. AN EXTENSIBLE AUTOMATED PROTEIN ANNOTATION
TOOL — APAT
of routine bioinformatics analyses and experimental lab work. Just as
wet experiments are carefully planned and then executed following a
defined sequence of steps, tools such as BioPipe and APAT allow for
the creation of customized workflows from standard modules, which
typically include XML parsers for a variety of input and output for-
mats, wrappers for running external applications, interfaces to SQL
databases and batch processing systems, and facilities for transport-
ing the results to the end user via standard exchange protocols, such
as Web services. In contrast to conventional integrated genome anal-
ysis systems, protocol-based analysis pipelines have the advantage of
being highly configurable and flexible, but their users are required to
have a good understanding of software technologies as well as substan-
tial system administration and bioinformatics skills. Recent releases
of major genome analysis systems, such as PEDANT, have also been
equipped with workflow-based process management (Frishman et al.,
in preparation)” (Frishman, 2007).
At the time of writing (June 2008), APAT had been downloaded by >600 users.
83

Chapter 4
Target Annotation Pipeline and
Automated Selection — TAPAS
In the previous chapter, I described a tool (APAT) that despatches an input
sequence to many annotation and prediction tools to obtain assorted annotations
which are displayed in a uniform manner for visual analysis. Results from various
tools are independent of one another because they are not serially dependent.
In this chapter, I describe a specialized pipeline tool that despatches different
inputs to different tools that are serially dependent on results obtained from the
previous tool. The output from one tool would be the input for another tool
except while executing APAT which is also integrated as a part of this tool. It is
appropriate to mention that Taverna is an extremely powerful tool which could
have been an alternative to TAPAS. TAPAS is a simple pipeline developed to
perform a specialized task of ranking proteins for their suitability for SBDD,
whereas Taverna is a general purpose Grid workflow management system which
is capable of performing tasks similar to TAPAS and also a wide range of other
tasks.
84
4.1. INTRODUCTIONCHAPTER 4. TARGET ANNOTATION PIPELINE AND AUTOMATED
SELECTION — TAPAS
In spite of the existance of general purpose workflow systems such as Taverna,
which are capable of building customized workflows, there are a number of special-
ized pipelines being developed. For example, GATO (Fujita et al., 2005), MPP
(Davey et al., 2007), MicroGen (Burgarella et al., 2005), PseudoPipe (Zhang et
al., 2006), BIPASS (Lacroix et al., 2007), PROSPECT-PSPP (Guo et al., 2004)
are all specialized pipelines, developed very recently. A few possible reasons for
this could be because: a) a custom solution is a low-risk strategy in terms of time
needed to understand, implement and extend these general purpose workflow sys-
tems, b) there is no real need for all the complex features (which include Grid
computing, distributed annotation, etc.) provided by such tools, c) an in-house
pipeline could be the ideal one for their needs — simple in terms of develope-
ment and usage, and precise in terms of fulfilling their needs. For similar reasons
a decision was made to create a specialized in-house system.
4.1 Introduction
If one would like to analyze the protein sequences of an organelle, a pathway, or
a genome and screen them for potential drug targets, then one needs to perform
a set of repetitive tasks (sequentially, or in parallel) such as running BLAST to
find homologues, screening for human hits, checking whether or not a protein
is an enzyme, looking for KEGG pathway maps, checking whether or not it is a
transmembrane protein, or looking for availability of 3D structures (of the protein
or of homologues) preferably with a bound ligand. Clearly this is a tedious job
to do manually. A computer analysis eliminates the risk of being incomplete as
computers are ideally suited for performing repetitive tasks and are better at
pattern matching for large sets of data.
85

4.1. INTRODUCTIONCHAPTER 4. TARGET ANNOTATION PIPELINE AND AUTOMATED
SELECTION — TAPAS
Having preliminary information about whether or not a protein could be a
good drug target is very useful for the pharmaceutical sector, especially for Struc-
ture Based Drug Design (SBDD). My aim was to look for potential drug targets
among protein sequences belonging to a particular organelle, the apicoplast and
a pathway, the MEP pathway.
While it is true that around 50% of drugs bind to membrane bound receptors,
the characteristics of good microbial druggable targets for which one intends to
design a drug by SBDD include:
(a) no human homologue: not having any human homologue is an ideal con-
dition because the chances of any cross-reaction owing to structural simi-
larity is minimal.
(b) known ligands: having known ligands from other data sources is useful
because they can be used as lead molecules on which one can modify the
chemical groups in such a way that they bind to the intended drug target,
often with increased specificity.
(c) availability of structural data: availability of structural data for the drug
target or for a close homologue from which a model can be built (ideally
with known ligands in bound and unbound states to understand conforma-
tional changes) is of great importance and a prerequisite in understanding
the interactions with the active site residues for SBDD. In the absence of
pre-existing data, ideally the structure would have to be solved by X-ray
crystallography or NMR. Computer built models of protein structure are
quite accurate when the sequence identity is >50% (Baker and Sali, 2001)
(Root Mean Square Deviation (RMSD) for main-chain atoms of about 1 A
86

4.1. INTRODUCTIONCHAPTER 4. TARGET ANNOTATION PIPELINE AND AUTOMATED
SELECTION — TAPAS
which is comparable to medium-resolution NMR structure or low-resolution
X-ray structure). Comparative models of moderate-accuracy can be built
when the sequence similarity is between 30–50%. Since structure is better
conserved than sequence during evolution, useful models can be produced
even at lower sequence identity. Normally, if the sequence similarity be-
tween the model and the template is lower than 30%, it is difficult to obtain
a model of good quality. However, Class A GPCRs are an exception, be-
cause each helix contains one or two highly conserved residues which permit
an unambiguous alignment (Oliveira et al., 2004). Thus, good models can
be obtained for Class A GPCRs even when the sequence similarity is as low
as 20% (Oliveira et al., 2004).
(d) known Enzyme commission (EC) number: Members of a protein fam-
ily having high structural and sequence similarity can perform different
functions while proteins with dissimilar structures can perform identical
biochemical roles (Todd et al., 1999). Strictly speaking an EC number cor-
responds to enzymatic reaction, but is used as a numerical classification
scheme for enzymes where enzymes are classified hierarchically (4 levels).
Having a known EC number indicates that the protein is an enzyme which
provides the opportunity to design inhibitors, especially competitive in-
hibitors that bind to the active site. However, these do not make the best
drugs because their effect diminishes as substrate concentration builds up.
Enzymes represent >47% of launched drug targets (Hopkins and Groom,
2002; Swindells and Overington, 2002). Here, the EC number helps to iden-
tify ligands for other enzymes having similar EC numbers as these enzymes
are likely to have similar substrates and thus similar inhibitors,
87

4.1. INTRODUCTIONCHAPTER 4. TARGET ANNOTATION PIPELINE AND AUTOMATED
SELECTION — TAPAS
(e) membrane bound: having information about whether a protein is mem-
brane bound or not is useful. Despite the fact that ∼50% of today’s
prescription drugs target membrane proteins (Elofsson and Heijne, 2007;
Terstappen and Reggiani, 2001; Flower, 1999; Gudermann et al., 1995),
these are not ideally suited for traditional SBDD because it is difficult to
obtain a high resolution 3D structure through X-ray crystallography or
multi-dimensional NMR spectroscopy.
Numerous factors must be considered while selecting a suitable target for
SBDD which can broadly be grouped into three major categories:
1. Biological suitability
(a) In the case of antimicrobials, one should avoid targets which have host
homologues especially functionally equivalent orthologues.
(b) In the case of host targets, one should avoid targets with close par-
alogues.
(c) Knowledge of function (e.g., enzyme class) helps to suggest leads.
(d) Knowledge of ligands and ligands that bind to (even distant) homo-
logues helps to provide leads.
2. General structural suitability
(a) Is a structure known?
(b) Is the structure of a homologue known? (from which a model might
be built).
88

4.1. INTRODUCTIONCHAPTER 4. TARGET ANNOTATION PIPELINE AND AUTOMATED
SELECTION — TAPAS
(c) If no structural data are known, is the protein an integral membrane
protein (in which case it is unlikely structural data can be obtained),
or could a structure be solved?
3. Detailed structural suitability
(a) Does the protein have a cleft/binding pocket that could be exploited?
(b) Is the protein involved in interactions which could be disrupted?
(c) Is a structure known with a ligand bound that could be modified to
form a drug?
The TAPAS pipeline essentially addresses the first two categories. It uses var-
ious runs of BLAST/PSI-BLAST to look for homologues, it looks for structural
data and identifies transmembrane proteins that may not be suitable for struc-
tural analysis. It ranks supplied sequences on the basis of these factors such that
the better looking sequences can then be taken forward for detailed structural
analysis.
To obtain further insight into the druggability of a protein, one must examine
various detailed structural features, such as the presence of hydrophobic deep
clefts which provide increased surface area thus increasing the probability of a
protein’s binding ability for a small drug molecule (Laskowski et al., 1996; Lewis,
1991). A tool that can automate the process of selection and annotation of drug
targets before embarking on detailed structural analysis and SBDD, would enable
one to process a set of protein sequences belonging to a particular pathway,
organelle, or genome, to obtain annotated proteins along with specific details
useful for determining whether or not a protein is a potential drug target at a
basic level.
89

4.1. INTRODUCTIONCHAPTER 4. TARGET ANNOTATION PIPELINE AND AUTOMATED
SELECTION — TAPAS
The general requirements for such a tool are: allowing one or more sequences
to be analyzed in a single run, using multiple prediction/annotation tools residing
locally, or over the web through normal CGI scripts or Web-services; cross-linking
data from various databases and handling inconsistency; obtaining an insight
into whether or not a protein is a possible drug target; and providing a compact
output summary (ideally in HTML) with key information about the parameters
that determine the selection of a possible drug target along with links to more
detailed output.
Various pipeline and workflow based systems were discussed in Chapter 2.
The analysis of other pipelines and workflows mentioned in the context of APAT
is also applicable to TAPAS.
Target Annotation Pipeline and Automated Selection (TAPAS) was there-
fore designed mainly to enable a set of sequences to be presented to a number
of different search, annotation and prediction tools which are run sequentially.
Output from one tool was parsed and written into an intermediate file. This was
then passed as input to another tool. Annotations and predictions were handled
by APAT, which was integrated into the TAPAS pipeline as a standalone tool.
Annotations of a protein sequence obtained from a set of tools were matched and
tabulated in an HTML file. This provides a quick overview of results which were
also hyperlinked for obtaining additional information from the world wide web
or a local file. This HTML table includes key information about the presence of
human hits (with E-values), structures (also ligands and heteroatoms), whether
or not a hit is an enzyme, and whether or not a protein is a transmembrane
protein (Swindells and Overington, 2002; Swindells and Fagan, 2001; Fagan and
Swindells, 2000). These are the key features that were considered in this study
90

4.2. SPECIFIC SOFTWARE REQUIREMENTSCHAPTER 4. TARGET ANNOTATION PIPELINE AND AUTOMATED
SELECTION — TAPAS
for obtaining some preliminary information about druggability of a protein for
SBDD. This is a stage preceding detailed structural studies of proteins for as-
sessing their suitability for druggability. Note that this project does not involve
any predictions of function, or regions of proteins such as the active site, but just
looks at some key biological characteristics of protein targets and ranks them
for SBDD at a basic level devoid of detailed structural studies. One could then
concentrate on those highly ranked proteins to further determine whether or not
it is a ‘druggable’ target.
4.2 Specific software requirements
The main requirements for the TAPAS software were:
1. allowing one or more protein sequences (particularly proteins that belong
to a particular pathway or an organelle) to be analyzed in a single run,
2. running multiple search, prediction and annotation tools (BLAST, PSI-
BLAST, and tools integrated into the APAT system — NetPhos, NetO-
Glyc, TargetP, ChloroP, TMHMM, DAS-TMfilter, PSORT, SubLoc, Plas-
Mit, PsiPred, PrositeScan) residing locally or over the web,
3. parsing output from one program and piping it as input for another to
obtain: GenBank style IDs (from BLAST output) =⇒ SwissProt ACs =⇒
Species name =⇒ EC numbers =⇒ KEGG pathway maps,
4. cross-linking and tabulating data obtained from the steps described above,
5. providing a compact HTML output page with key information about the
characteristics that determine the selection of a possible drug target for
91

4.3. APPROACH AND METHODSCHAPTER 4. TARGET ANNOTATION PIPELINE AND AUTOMATED
SELECTION — TAPAS
SBDD (at a basic level devoid of detailed structural studies) along with
hyperlinks for more detailed output.
These software requirements were devised by us to meet our needs of obtaining
preliminary information about specific characteristics of a protein (Chen and
Chen, 2008; Hopkins et al., 2006; Swindells and Overington, 2002; Fagan et al.,
2001; Weir et al., 2001). Thus TAPAS is a specialized pipeline where the tools to
be used and the data flow was determined by us in a way we envisioned would be
more useful for reaching our goals. TAPAS uses state-of-the-art tools for a specific
annotation in a systematic way in order to obtain a diverse set of annotations.
It is advantageous to wrap as many tools as possible within APAT (which is
integrated into TAPAS) even if they have no effect on ranking the proteins as
suitable drug targets.
The output design was such that the compact HTML page has details about
the key features being considered in this study which are a) human homologues
b) EC number c) known structure d) known ligand e) transmembrane. These
details are later used for ranking proteins for their suitability for SBDD.
4.3 Approach and methods
4.3.1 Workflow and overall architecture
The workflow of TAPAS is shown in Figure 4.1. This provides a brief overview
of tools used in the pipeline and the direction of flow of data in the workflow.
The overall architecture of TAPAS is shown in Figure 4.2. The system is
implemented in Perl and uses the XML::DOM module for parsing XML files
output from APAT (See Chapter 3 and Deevi and Martin (2006)). The pipeline
92

4.3. APPROACH AND METHODSCHAPTER 4. TARGET ANNOTATION PIPELINE AND AUTOMATED
SELECTION — TAPAS
Figure 4.1: Workflow of TAPAS.
93

4.3. APPROACH AND METHODSCHAPTER 4. TARGET ANNOTATION PIPELINE AND AUTOMATED
SELECTION — TAPAS
contains 4 major steps:
1. applying annotations in a stepwise manner by a master script,
2. integrating APAT into the system as a standalone tool for further annota-
tions,
3. cross-linking the results from heterogeneous tools to make an HTML table
provided with hyperlinks for additional information,
4. making a compact drug target selection table (with hyperlinks for relevant
websites or local files to obtain additional information) containing useful
information for obtaining insight into the selection of a protein as a possible
drug target (Swindells and Overington, 2002; Swindells and Fagan, 2001;
Fagan et al., 2001).
94

4.3. APPROACH AND METHODSCHAPTER 4. TARGET ANNOTATION PIPELINE AND AUTOMATED
SELECTION — TAPAS
Figure 4.2: Overall architecture of TAPAS.
95

4.3. APPROACH AND METHODSCHAPTER 4. TARGET ANNOTATION PIPELINE AND AUTOMATED
SELECTION — TAPAS
4.3.2 Applying annotations in a stepwise manner
Different types of annotations could be applied to a number of sequences in a
stepwise manner. The master program, accepts
1. a definition file containing information about origin of sequences as required
for running APAT,
2. a file containing protein sequences in Fasta format,
3. the output directory name for the results of running the pipeline.
A set of programs is then called one after another by this master program. The
output from one program is parsed and used as input for the next except when
running the APAT annotation fan which takes Fasta sequences as input. The
pipeline runs BLAST (Altschul et al., 1990), links GenBank (Benson et al., 2007)
style identifiers (IDs) to SwissProt (Bairoch and Apweiler, 2000) accession codes
(ACs), SwissProt ACs to species name, SwissProt ACs to Enzyme Commission
(EC) numbers (Bairoch, 2000), EC numbers to KEGG pathway maps (Kanehisa
et al., 2002), runs APAT, interlinks data from heterogeneous tools and tabulates
all these results in an HTML table, and makes a drug target selection table by
screening species names for human hits, looking for known structures and ligands,
and checking whether or not a protein is transmembrane.
Running BLAST
The master program calls another program to perform a set of BLAST runs:
• BLAST against the nr (non-redundant) protein database1,
1The nr protein database maintained by the NCBI as a target for their BLAST searchservices is a composite of SwissProt, SwissProt updates, PIR, and PDB. Entries with absolutelyidentical sequences have been merged.
96

4.3. APPROACH AND METHODSCHAPTER 4. TARGET ANNOTATION PIPELINE AND AUTOMATED
SELECTION — TAPAS
ABE11004.1 : Q1PKM6
ABE10930.1 : Q1PKS6
GAA02238.1 : Q1WYT7
AAR99081.1 : Q6R3F4
AAP56260.3 : Q7XYT1
ABH08964.1 : Q0MW94
CAB43344.1 : Q9XFS9 Q9M6U2
AAL37560.1 : Q8W250 Q9FTN0
AAW28998.1 : Q5MJZ5
Figure 4.3: Sample extract from the intermediate output file having GenBankstyle IDs cross-linked to their corresponding SwissProt ACs.
• PSI-BLAST (Altschul et al., 1997) against the nr protein database, and
• BLAST against the PDB (Berman et al., 2000).
The output from the BLAST runs is parsed and written into a file in a speci-
fied directory which is later used for extracting GenBank style IDs and E-values
(Expectation-value)2.
Linking GenBank style IDs to SwissProt ACs
The master program calls another program, which parses GenBank style IDs from
the BLAST output file and, where possible, links these IDs to their corresponding
SwissProt ACs. SwissProt ACs are obtained from a pre-created Perl DBM Hash
file which indexes GenBank style IDs and SwissProt ACs. A sample view of the
intermediate output file obtained at this stage is shown in Figure 4.3.
2The E-value describes the number of hits with a given score or better one can expect tosee by chance when searching a given database of a particular size.
97

4.3. APPROACH AND METHODSCHAPTER 4. TARGET ANNOTATION PIPELINE AND AUTOMATED
SELECTION — TAPAS
Q1PKM6 : uncultured Prochlorococcus marinus clone ASNC612
Q1PKS6 : uncultured Prochlorococcus marinus clone ASNC3046
Q1WYT7 : Pelotomaculum thermopropionicum SI
Q6R3F4 : Plectranthus barbatus
Q7XYT1 : Cistus creticus
Q0MW94 : Nicotiana tabacum (Common tobacco)
Q9XFS9 : Arabidopsis thaliana (Mouse-ear cress)
Q9M6U2 : Arabidopsis thaliana (Mouse-ear cress)
Q8W250 : Oryza sativa (Rice)
Figure 4.4: Sample extract from the intermediate output file having SwissProtACs mapped to their species name.
Linking SwissProt ACs to species name
The master program calls another program, which links SwissProt ACs to their
corresponding species names. Species names are obtained from a pre-created Perl
DBM Hash file having SwissProt ACs indexed against species names. A sample
view of the intermediate output file obtained at this stage is shown in Figure 4.4.
Linking SwissProt ACs to EC numbers
The master program calls another program, which links SwissProt ACs to their
corresponding EC numbers. EC numbers are obtained from a pre-created
PostgreSQL (http://www.postgresql.org/) database which has a copy of the
‘acac’ table and ‘sprotec’ table from databases ‘PDBSWS’ (Martin, 2005) (which
provides residue level mapping between PDB entries and UniProtKB/SwissProt
entries) and ‘PDBSprotEC’ (Martin, 2004) (which provides mapping between
PDB chains and EC numbers via SwissProt ACs) respectively. The PostgreSQL
relational database also contains two more pre-created tables ‘sprot ec’ and
‘sprot species’ and all four tables are accessed through the Perl::DBI module.
98

4.3. APPROACH AND METHODSCHAPTER 4. TARGET ANNOTATION PIPELINE AND AUTOMATED
SELECTION — TAPAS
Q9XFS9 : 1.1.1.267
Q9M6U2 : 1.1.1.267
Q8W250 : 1.1.1.267
Q9FTN0 : 1.1.1.267
Q57T35 : 1.1.1.267
P45568 : 1.1.1.267
P77209 : 1.1.1.267
Q8KMY5 : 1.1.1.267
P45568 : 1.1.1.267
Figure 4.5: Sample extract from the intermediate output file having SwissProtACs matched with their EC numbers.
Cross-references in various databases not being updated in other databases is
a complicating factor. For example, in SwissProt, outdated accession codes are
retained as ‘secondary accession codes’ of a SwissProt entry (which now has a
new primary accession code), but the Enzyme database, which is not updated as
frequently as SwissProt, may maintain the outdated accession codes making the
mapping more complex as both 1◦and 2◦accessions must be checked. In the PDB-
SWS database, the ‘acac’ table links secondary SwissProt ACs to their primary
ACs while the ‘sprotec’ table links the primary AC to its EC number which will
then enable one to obtain an EC number from a new primary accession code of a
SwissProt entry via its secondary accession code. A sample view of the interme-
diate output file obtained at this stage is shown in Figure 4.5. Format changes of
databases has also been a concern because they break any scripts relying on the
old format. For example, SwissProt has twice changed the allowed combinations
of characters in ACs and has changed the format of its Fasta sequence dump
headers during this project.
99

4.3. APPROACH AND METHODSCHAPTER 4. TARGET ANNOTATION PIPELINE AND AUTOMATED
SELECTION — TAPAS
1.1.1.267 : path:map00100
1.1.1.23 : path:map00340
6.3.2.3 : path:map00251
6.3.2.3 : path:map00480
1.1.1.3 : path:map00260
1.1.1.3 : path:map00300
Figure 4.6: Sample extract from the intermediate output file having EC numbersmatched with their KEGG pathway maps.
Searching for pathway maps in KEGG from EC numbers
The master program calls another program, which links EC numbers to their
corresponding KEGG pathway maps, using SOAP webservices via the KEGG
API. A sample view of the intermediate output file obtained at this stage is
shown in Figure 4.6.
4.3.3 Integrating APAT into the pipeline
APAT (Chapter 3 and Deevi and Martin (2006)) was integrated into the pipeline
as a stand-alone tool to provide more annotations by including the required wrap-
pers in the APAT system.
Having knowledge about subcellular location, post-translational modifica-
tions, whether or not a protein is transmembrane, 3-dimensional structure, and
ligands is useful for assessing accessibility of drug targets (for example, if the
drug target is inside a membrane bound organelle then the drug needs to cross
the extra bilipid barrier of the membrane to reach its target).
The following tools were included in APAT as used by the pipeline:
1. transmembrane predictors — TMHMM (Krogh et al., 2001), DAS-TMfilter
(Cserzo et al., 2004), and MEMSAT 2 (Jones et al., 1994)
100

4.3. APPROACH AND METHODSCHAPTER 4. TARGET ANNOTATION PIPELINE AND AUTOMATED
SELECTION — TAPAS
2. subcellular location predictors — SubLoc (Chen et al., 2006), TargetP
(Emanuelsson et al., 2000), PSORT (Nakai and Horton, 1999), ChloroP
(Emanuelsson et al., 1999) and PlasMit (Bender et al., 2003)
3. post translational modification predictors — NetPhos (Blom et al., 1999)
and NetOGlyc (Julenius et al., 2004)
4. secondary structure predictors — PsiPred (McGuffin et al., 2000)
5. motif predictors — PrositeScan (Gattiker et al., 2002)
The TAPAS master program calls three programs consecutively to complete
the execution of APAT:
• First, protein sequences in Fasta format and information about the origin
of the sequence are combined to form an input file for APAT in a defined
XML format (APATINML — DTD shown in Figure 3.4),
• Second, this XML input file is then processed by APAT to produce hetero-
geneous annotations in a defined XML format (APATML — DTD shown
in Figure 3.8), and
• Third, the XML output from APAT is converted to HTML by the ‘dis-
play.pl’ program for visual analysis.
4.3.4 Cross-linking and tabulating data
Data obtained from various annotation/prediction tools and databases are cross-
linked and assembled. These data are written into an HTML table to provide a
compact and quick overview of the results from the various tools. Details about
101

4.3. APPROACH AND METHODSCHAPTER 4. TARGET ANNOTATION PIPELINE AND AUTOMATED
SELECTION — TAPAS
Figure 4.7: Sample extract from the intermediate output file from the cross-linkeddata table.
the type of BLAST run (BLAST or PSI-BLAST), significant BLAST hits along
with their corresponding E-values, SwissProt ACs, species names, EC number,
and KEGG pathway maps are included in the table. Most of these data are
hyperlinked to obtain further details from relevant websites or local files. A
sample view of the intermediate output file obtained at this stage is shown in
Figure 4.7.
4.3.5 Making a drug target selection table
The conclusions for the output of all the sequences submitted to the pipeline
during a particular execution are provided in the form of a drug target selection
table. Details about the input protein, a list of human hits (if present) along
with the E-value, EC numbers of enzyme hits, PDB code of the best structural
hit based on E-value, a list of ligands and hetero atoms, and whether or not it
is a membrane protein are included in the table. These details are some of the
102

4.4. SUMMARY AND DISCUSSIONCHAPTER 4. TARGET ANNOTATION PIPELINE AND AUTOMATED
SELECTION — TAPAS
Figure 4.8: Sample extract from the final output file from the drug target selectiontable.
most crucial pieces of information needed for obtaining insight into the selection
of a protein as a target for SBDD. A sample view of the final output file is shown
in Figure 4.8. All ligand hits along with their PDB codes and e-values are shown
on the ligands page obtained by clicking the ‘All ligs’ link from the final output
page (Figure 4.9).
4.4 Summary and Discussion
TAPAS is designed mainly to enable a set of protein sequences to be presented
to a number of different database searches, annotation and prediction tools are
run sequentially to screen for potential drug targets. Output from one tool was
parsed and written into an intermediate file which was then passed as input for
103

4.4. SUMMARY AND DISCUSSIONCHAPTER 4. TARGET ANNOTATION PIPELINE AND AUTOMATED
SELECTION — TAPAS
Figure 4.9: Sample extract from the ligand page obtained by clicking ‘All ligs’link from the final output page of drug target selection table.
another tool. Sequence level annotations and predictions were obtained from
APAT which was incorporated into the pipeline as a standalone tool. Details of
a protein sequence from various tools were matched and written into an HTML
file for a quick overview of results and were also hyperlinked for obtaining addi-
tional information from the world wide web or a local file. Key information for
selecting a protein as a possible drug target was presented in an HTML table and
includes the presence of human hits (along with E-value), availability of struc-
ture (also presence of ligands and heteroatoms), and whether or not a protein is
transmembrane.
This approach of creating a specialized pipeline contrasts with tools like Tav-
erna, ToolBus, BioPipe, GPIPE, ICENI and Pegasys. TAPAS is more similar to
PseudoPipe (Zhang et al., 2006), BIPASS (Lacroix et al., 2007), PROSPECT-
PSPP (Guo et al., 2004), and MicroGen (Burgarella et al., 2005), which are more
specialized pipelines rather than general purpose pipelining systems.
In this Chapter, I have described the TAPAS pipeline. The results of applying
TAPAS to the MEP pathway and to the apicoplast proteins are discussed in
104

4.4. SUMMARY AND DISCUSSIONCHAPTER 4. TARGET ANNOTATION PIPELINE AND AUTOMATED
SELECTION — TAPAS
Chapter 6 together with the development of a ranking scheme for scoring potential
targets processed by the TAPAS pipeline.
105

Chapter 5
Improving Prediction of
Transmembrane Proteins
One of the most important annotations applied to a protein sequence by the
TAPAS system described in Chapter 4 is whether or not a protein is transmem-
brane and where the transmembrane segments are likely to occur.
In this chapter, I describe a combined neural network predictor developed by
me to improve prediction ability. The analysis includes stressing the need for
masking signal peptides to improve the prediction because they result in most of
the false positives.
5.1 Introduction
In the post-genome world, there is an urgent need to annotate protein sequences
of unknown structure and function. One particularly important class of proteins
are those with transmembrane regions.
106

5.1. INTRODUCTIONCHAPTER 5. IMPROVING PREDICTION OF TRANSMEMBRANE
PROTEINS
5.1.1 Membrane Proteins
All biological cells have a bounding plasma membrane which consists of lipids
and proteins, and acts as a barrier between the exterior (extracellular fluid or
matrix) and the interior of the cell. This phospolipid bilayer, which consists pre-
dominantly of amphiphilic phospholipids (such as phosphotidyl ethanolamine), is
arranged such that the hydrophobic fatty acid tails face each other, whereas their
hydrophilic phosphate polar heads face the exterior and interior of the cell. In
addition, eukaryotic cells have membrane-enclosed organelles such as the nucleus,
mitochondria, chloroplasts, and plastids.
Proteins that interact with membranes of a cell or an organelle are called
‘membrane proteins’. Based on the type of their interaction with the membrane,
membrane proteins are classified into two broad categories (shown in Figure 5.1).
(a) Integral membrane proteins (also called intrinsic membrane proteins)
are tightly bound to the membrane. Based on the type of binding, they
are further divided into:
1. Transmembrane proteins are integral membrane proteins that traverse
the membrane one or more times extending into the aqueous medium
on both sides of the membrane. The most common types span the
membrane 7 times (“7 TMs”, for example the G-protein coupled re-
ceptors, GPCRs) or once (e.g., Signal Anchor proteins). Based on the
secondary structure of the transmembrane region, they are divided
into:
(a) α-helical membrane proteins — The membrane spanning regions
consist of α-helices. They are present in all biological membranes
107

5.1. INTRODUCTIONCHAPTER 5. IMPROVING PREDICTION OF TRANSMEMBRANE
PROTEINS
Figure 5.1: Membrane protein architecture.
108

5.1. INTRODUCTIONCHAPTER 5. IMPROVING PREDICTION OF TRANSMEMBRANE
PROTEINS
and constitute the major group of transmembrane proteins.
(b) β-barrel membrane proteins — The membrane spanning regions
consist of antiparallel β-sheets that form a barrel-like structure.
Unlike the widespread α-helical membrane proteins, they form
only a minor group of transmembrane proteins (See Figure 5.2).
2. Integral monotopic proteins are integral membrane proteins that do
not traverse the phospholipid bilayer. Instead, they partially pene-
trate the membrane from one side. There are only four monotopic
proteins whose crystal structures are available and all of them are
pharmaceutically significant drug targets (Fowler and Coveney, 2006):
• prostaglandin H2 synthase (Picot et al., 1994),
• squalene-hopene cyclase (Wendt et al., 1997),
• monoamine oxidase (Binda et al., 2002), and
• fatty acid amide hydrolase (Bracey et al., 2002).
(b) Peripheral membrane proteins (also called extrinsic membrane
proteins) are loosely bound to the membrane and do not interact with
the hydrophobic core of the membrane (Lomize et al., 2007; Cho and
Stahelin, 2005; Goni, 2002). Instead they bind to the polar heads of the
phospholipid bilayer displaying amphitropic properties, or to other integral
membrane proteins (Johnson and Cornell, 1999). Many hormones, toxins
and inhibitors temporarily associate with the lipid bilayer before binding
to their actual targets. A few examples of peripheral membrane proteins
are:
• enzymes — Carboxypeptidase E (Rindler, 1998), Sialidase NEU3 (Sial-
109

5.1. INTRODUCTIONCHAPTER 5. IMPROVING PREDICTION OF TRANSMEMBRANE
PROTEINS
idases or Nueraminidases) (Zanchetti et al., 2007), Adenylate Cyclase
in Yeast (Mitts et al., 1990), Protein-Tyrosine Kinases (Quintrell et
al., 1987).
• polypeptide hormones (Ryan et al., 2002; Massague and Pandiella,
1993) — Transforming growth factor (TGF-α), epidermal growth fac-
tor (EGF), tumor necrosis factor, TNF-α,
• antimicrobial peptides — Lactoferricin B (Samuelsen et al., 2005; Vor-
land et al., 1999), Lantibiotics (Breukink, 2006; Chatterjee et al., 2005;
van Kraaij et al., 1999), Defensins (Oppenheim et al., 2003),
• Biotoxins (Chugh and Wallace, 2001; Rochet and Martin-Eauclaire,
2000; Schmitt et al., 1999)
Transmembrane Proteins
Transmembrane proteins play vital roles in living cells by participating in cell sig-
nalling, cell-cell interactions, self recognition mechanisms, energy transduction,
solute and ion transport across membranes by forming ion channels and pores,
and acquired drug resistance mechanisms. They constitute around 20–30% of
all proteins in fully sequenced genomes (Elofsson and Heijne, 2007; Bagos et al.,
2004a; Arai et al., 2003; Krogh et al., 2001; Jones, 1998; Wallin and von Heijne,
1998). They are of great interest to pharmaceutical research; membrane-bound
receptors (GPCRs — G-protein coupled receptors) and channels constitute ap-
proximately 50% of successful drug targets (Elofsson and Heijne, 2007; Terstap-
pen and Reggiani, 2001; Flower, 1999; Gudermann et al., 1995). However, trans-
membrane proteins constitute only ∼0.5% (Elofsson and Heijne, 2007; White,
2004; Berman et al., 2000) of the known structures in the Protein Databank
110

5.1. INTRODUCTIONCHAPTER 5. IMPROVING PREDICTION OF TRANSMEMBRANE
PROTEINS
Figure 5.2: Structural differences in the two types of transmembrane pro-teins — alpha helical bundles and beta barrels. (Figure adapted fromhttp://www.biologie.uni-konstanz.de/folding/Membrane%20ProtStructure.html).
(PDB) (Berman et al., 2000), because in general they are difficult to crystallize
and do not yield high quality diffracting crystals for study by X-ray crystallog-
raphy and are unsuitable for analysis by multidimensional nuclear magnetic res-
onance (NMR) spectroscopy because of their size and solubility issues (Arora et
al., 2001). They are not generally suited for SBDD owing to the limited quantity
of available 3D structures.
As described above, transmembrane proteins fall into two categories based on
the secondary structure of the transmembrane regions (Figure 5.2).
111

5.1. INTRODUCTIONCHAPTER 5. IMPROVING PREDICTION OF TRANSMEMBRANE
PROTEINS
(i) Alpha-helical transmembrane proteins have stretches of 15–35 predomi-
nantly hydrophobic amino acid residues (Bagos et al., 2005; Kall et al.,
2004; Taylor et al., 2003; von Heijne, 1999). They are the most common
type of transmembrane proteins and are present in both prokaryotic and
eukaryotic cell membranes. They are sometimes called helix-bundle pro-
teins because when there is more than one TM α-helix they pack into a
bundle. Features such as the continuous stretches of largely hydrophobic
amino acids and simple rules such as the positive inside rule1 (von Heijne,
1992) have allowed easier detection of α-helical transmembrane proteins
(Bagos et al., 2005, 2004a). Their abundance and importance in nature has
resulted in a large number of tools being developed for their detection and
for topology prediction. These include KKD (Klein et al., 1985), TopPred
II (Claros and von Heijne, 1994), SOSUI (Hirokawa et al., 1998), ALOM2
(Nakai and Kanehisa, 1992), MPEx (White and Wimley, 1999), TMpred
(Hofmann and Stoffel, 1993), SPLIT4 (Juretic et al., 2002, 1993), PRED-
TMR2 (Pasquier et al., 1999; Pasquier and Hamodrakas, 1999), TM Finder
(Deber et al., 2001), TMAP (Persson and Argos, 1997), PHD (Rost, 1996),
TMHMM 2.0 (Krogh et al., 2001), HMMTOP 2.0 (Tusnady and Simon,
2001, 1998)), DAS-TMfilter (Cserzo et al., 2004; Cserzo et al., 1997), and
MEMSAT 2 (Jones, 1998; Jones et al., 1994).
(ii) Beta-barrel transmembrane proteins have shorter segments of 6–22 (typi-
cally 12) moderately hydrophobic amino acid residues (Garrow et al., 2005).
As stated earlier, they occur only in the outer membrane of Gram-negative
1A tendency for positive charged residues to be inside the cell and negative charged residuesto be outside.
112

5.1. INTRODUCTIONCHAPTER 5. IMPROVING PREDICTION OF TRANSMEMBRANE
PROTEINS
bacteria, outer membrane of acid-fast Gram-positive bacteria, and outer
membranes of mitochondria and chloroplasts (plant plastids) (Bagos et al.,
2005; Garrow et al., 2005; Bagos et al., 2004b,a; Zhai and Saier, 2002). Their
presence in eukaryotic organelles like mitochondria and chloroplasts is ex-
plained by the endosymbiotic theory (Bagos et al., 2005; Cavalier-Smith,
2000; Moreira et al., 2000; Gray et al., 1999; Vellai et al., 1998). As their
name suggests, they are antiparallel β-sheets that form a barrel like struc-
ture by rolling themselves up in a way that the first and the last sheets
are next to each other with both N and C termini towards the periplasmic
side. Though they are not as easily detected as α-helices, there have been
some tools developed for their prediction such as TMB-Hunt (Garrow et al.,
2005), BBF (Zhai and Saier, 2002), PRED-TMBB (Bagos et al., 2004b,a),
PROFtmb (Bigelow and Rost, 2006), TMBEETA-NET (Gromiha et al.,
2004), evaluation and consensus predictions (Bagos et al., 2005) and others
(Martelli et al., 2002; Jacoboni et al., 2001).
5.1.2 Transmembrane Prediction
Transmembrane prediction can be divided into three classes:
i) residue level — whether or not an individual residue falls into a transmem-
brane region,
ii) topological — whether an approximate segment of the sequence forms a
transmembrane region and which end of each segment is in the inside of
the cell,
iii) protein level — is a protein a transmembrane protein?
113

5.1. INTRODUCTIONCHAPTER 5. IMPROVING PREDICTION OF TRANSMEMBRANE
PROTEINS
The first and third levels are the most useful with the information in the
second level being available from a complete residue-level prediction once the
orientation of the first transmembrane regions has been established.
Various transmembrane prediction methods
Transmembrane prediction techniques have employed a plethora of different
methodologies. For example,
• simple hydropathy based methods based on hydrophobicity scales such as
the Kyte and Doolittle (KD) hydrophobicity scale (1982), Whole-residue
hydrophobicity scale (WW scale) — MPEx (White and Wimley, 1999),
and the Augmented WW scale (aWW scale) (Jayasinghe et al., 2001a)
• hydropathy in combination with: a) more refined propensity indices and a
discriminant function to set boundaries for transmembrane regions — KKD
(Klein et al., 1985), b) positive inside rule — TopPred II (Claros and von
Heijne, 1994), c) amphiphilicity — SOSUI (Hirokawa et al., 1998), d) a rule
based system — ALOM2 (Nakai and Kanehisa, 1992), e) weight matrices
and statistical analysis of TMBase (Hofmann and Stoffel, 1993) — TMpred
(Hofmann and Stoffel, 1993), f) cytoplasmic location of basic charged clus-
ters — SPLIT4 (Juretic et al., 2002, 1993), g) detection of probable starts
and ends of transmembrane regions — PRED-TMR (Pasquier et al., 1999)
and a pre-processing by neural networks — PRED-TMR2 (Pasquier and
Hamodrakas, 1999), and h) Nonpolar Phase Helicity Scales — TM Finder
(Deber et al., 2001),
• multiple sequence alignment (e.g. TMAP (Persson and Argos, 1997))
114

5.1. INTRODUCTIONCHAPTER 5. IMPROVING PREDICTION OF TRANSMEMBRANE
PROTEINS
• machine learning methods such as neural networks (e.g. PHD (Rost, 1996))
or Hidden Markov Models (e.g. TMHMM 2.0 (Krogh et al., 2001), and
HMMTOP 2.0 (Tusnady and Simon, 2001, 1998)),
• combinatorial strategies and differences in distribution of amino acids (e.g.
DAS-TMfilter (Cserzo et al., 2004; Cserzo et al., 1997), and MEMSAT 2
(Jones, 1998; Jones et al., 1994) which additionally uses dynamic program-
ming).
Evaluation of methods and combined predictions
There have been efforts to compare a number of existing transmembrane pre-
dictors, evaluate their performance and assess and improve predictions using
consensus or majority-voting methods. A recent evaluation was performed by
Moller et al. (2001) declaring TMHMM as the best performing transmembrane
prediction method. Another assessment of ten methods was performed by Ikeda et
al. (2002) who noted that Hidden Markov Models dominated in prediction per-
formance. They went on to improve predictions up to 9% on 4 aspects they
chose ((i) the number of transmembrane segments (TMS) (ii) TMS and position
(iii) N-tail location (iv) TM topology) by using a consensus method (majority
voting) on their own TMPDB dataset (Ikeda et al., 2000). They also noted that
prediction performance was better for prokaryotes when compared with eukary-
otes. Both pieces of work were performed on low resolution datasets (which are
mainly obtained from the literature and from sequence databases rather than
from structural databanks).
It has to be noted that various groups report prediction accuracies on different
datasets (of varying quality) and apply different definitions to assess prediction
115
5.1. INTRODUCTIONCHAPTER 5. IMPROVING PREDICTION OF TRANSMEMBRANE
PROTEINS
performance (Chen et al., 2002).
There have been some recent efforts to assess performance using high resolu-
tion structural datasets (Cuthbertson et al., 2005; Chen et al., 2002; Jayasinghe
et al., 2001b), but these are limited by the small number of available structures.
Cuthbertson et al. (2005) examined thirteen methods and found that SPLIT4,
TMHMM2, HMMTOP2 and TMAP performed best. They also attempted to
improve performance by a simple majority-voting procedure.
An HMM-based prediction method, Phobius was presented by Kall et al.
(2004), for combined prediction of membrane protein topology and signal pep-
tides by using TMHMM and SignalP. A claimed strength is the capability to
distinguish signal peptide regions from transmembrane regions. Topology pre-
diction of membrane proteins having signal peptides was improved by assigning
the cytoplasmic side to the N-terminus of a mature protein.
Kall et al. (2005) have presented PolyPhobius which uses a HMM decoding
algorithm (implemented in Java) to include homology information obtained from
global multiple sequence alignment which improves the performance in prediction
of transmembrane proteins and signal peptides.
Signal peptides are often incorrectly predicted as trans-membrane regions
because of their hydrophobic nature. Lao et al. (2002b; 2002a) evaluated twelve
transmembrane topology prediction methods for the effect of signal peptides in
topology prediction and stressed the need for addressing the signal peptide issue.
They found that machine learning based prediction methods were less sensitive
to this problem than hydropathy based methods.
A consensus prediction by a majority-vote approach was also performed by
Nilsson et al. (2000) using five prediction methods. They concentrated on the
116

5.1. INTRODUCTIONCHAPTER 5. IMPROVING PREDICTION OF TRANSMEMBRANE
PROTEINS
reliability of predicted topology and found that prediction performance varied
strongly with the number of methods that agree with one another.
Arai et al. (2004) created ConPred II, a consensus prediction by majority
voting method using various combinations of five prediction methods among a
set of nine prediction methods — KKD, TMpred, TopPred II, DAS, TMAP,
MEMSAT 1.8, SOSUI, TMHMM 2.0, and HMMTOP 2.0 and is available as a
web server (http://bioinfo.si.hirosaki-u.ac.jp/~ConPred2/).
Taylor et al. (2003) have presented a web server, BPROMPT (Bayesian PRe-
diction Of Membrane Protein Topology), for consensus prediction of transmem-
brane protein topology by combining results from HMMTOP2, DAS, SOSUI,
TMpred and TopPred II using a Bayesian Belief Network (http://www.jenner.
ac.uk/BPrompt/).
To date, none of the work on combining predictors has used Neural Networks
as a machine learning approach. Such strategies have been used previously in
combining, for example, the output of secondary structure predictors (e.g. JPred
(Cuff et al., 1998)). In addition, none of the assessments or consensus methods to
date have made use of DAS-TMfilter (Cserzo et al., 2004), an improved version
of DAS (Cserzo et al., 1997).
Improving prediction of the transmembrane regions in membrane proteins is
useful and significant to both the scientific research community and the phar-
maceutical industry because it provides insight into their structure, function and
druggability. This work is done as a part of developing a stand-alone tool (for
improved transmembrane prediction) for APAT and for subsequent integration
into TAPAS.
117

5.2. METHODSCHAPTER 5. IMPROVING PREDICTION OF TRANSMEMBRANE
PROTEINS
5.2 Methods
A number of transmembrane predictors and datasets of transmembrane proteins
were examined as discussed earlier.
5.2.1 Tools and methods used in this analysis
On the basis of performance as assessed by Moller et al. (2001) and the types
of outputs returned by these predictors; TMHMM V2.0 (Krogh et al., 2001),
MEMSAT 2 (Jones et al., 1994) and DAS-TMfilter (Cserzo et al., 2004) were
selected as three of the best prediction methods for combining and improving
their prediction values using neural networks.
Although both the HMM-based methods, TMHMM and HMMTOP are
known to outperform other methods as evaluated by Ikeda et al. (2002),
HMMTOP does not provide prediction values for individual residues which is
necessary for this project and hence only TMHMM was chosen. MEMSAT has
also performed well in various evaluation studies carried out by different groups
(Moller et al., 2001; Ikeda et al., 2002). While DAS (Cserzo et al., 1997) has
underperformed in various evaluation studies (Moller et al., 2001; Ikeda et al.,
2002), DAS-TMfilter (Cserzo et al., 2004) is an improved version of DAS and
it was considered interesting to examine its performance. In the end, three
tools were chosen that use different methods — HMM (TMHMM), dynamic
programming (MEMSAT), and the improved ‘Dense Alignment Surface’
algorithm (DAS-TMfilter).
As shown by Lao et al. (2002b; 2002a), transmembrane predictors find it
difficult to distinguish true transmembrane regions from signal peptides owing to
the hydrophobic nature of these regions (see Figure 5.3). We therefore assessed
118

5.2. METHODSCHAPTER 5. IMPROVING PREDICTION OF TRANSMEMBRANE
PROTEINS
Figure 5.3: Any positive predictions for a residue being in a transmembraneregion are masked out (annulled - prediction value set to zero) up to the cleavagesite of a signal peptide in a give protein.
the effect of using SignalP 3.0 (Bendtsen et al., 2004; Nielsen et al., 1997) to mask
out residues predicted to be part of a signal peptide.
Which machine learning method to use?
Different machine learning methods were discussed in Chapter 2. A neural net-
work was used for the purpose of combining predictions from TMHMM V2.0,
MEMSAT 2 and DAS-TMfilter after evaluation of the pros and cons of different
machine learning methods.
Although it is straightforward to derive biological meaning out of Bayesian
networks, they are still considered to be complex methods. Furthermore, they
are not well known for tasks that involve combining methods and thus are not
the preferred choice for this work.
Hidden Markov Models (HMMs) are very good at pattern recognition and
would have been ideal for actual prediction of transmembrane proteins. However,
this study involves combining prediction methods to smooth the output from
them. HMMs are not well known for performing such tasks and thus they are
119

5.2. METHODSCHAPTER 5. IMPROVING PREDICTION OF TRANSMEMBRANE
PROTEINS
not chosen for this task.
Decision trees are widely used for data mining and classification. They could
have been used for this project by preparing proper scenarios for classification of
amino acids based on the cutoffs. Although the project involves classifying amino
acids, the prediction value for an amino acid is just smoothed by combining the
output from other methods. Decision trees are not generally used for such tasks
and are reported to have performed badly for combining secondary structure
prediction methods (King et al., 2000).
Being binary classifiers, SVMs could not have been the first choice for parts
of the related work. For example, while predicting topology of transmembrane
proteins, there are more than two outputs - inside, outside and membrane. Al-
though, this project does not involve topology prediction, any future develop-
ments on topology prediction would have been relatively difficult, though not
impossible.
The reasons for preferring artificial neural networks (ANNs) to SVMs for this
project include:
• ANNs being good at non-linear relationships,
• ANNs having a tendency to achieve improved accuracy with an increase in
the number of dataset parameters,
• ANNs not being just binary classifiers which would make the implementa-
tion relatively straightforward,
• ANNs being well known for tasks which involve combining methods.
King et al. (2000) have assessed whether or not it is better to combine pre-
diction methods as opposed to usage of a single secondary structure prediction
120

5.2. METHODSCHAPTER 5. IMPROVING PREDICTION OF TRANSMEMBRANE
PROTEINS
method and concluded that it is better to combine predictions. They also ob-
served that Decision trees performed the worst while neural networks performed
the best among all the combining methods, both learning and non-learning meth-
ods (voting, biased voting, linear discrimination, neural networks and decision
trees).
Results from the predictions at the individual residue level were combined
using neural networks implemented in the Stuttgart Neural Network Simulator
(SNNS V4.2) (Zell et al., 1995) (http://www-ra.informatik.uni-tuebingen.
de/software/snns/welcome_e.html).
A simple feed-forward neural network (Rumelhart and McClelland, 1986) was
employed using supervised training with the Rprop algorithm (Riedmiller and
Braun, 1993, 1992).
5.2.2 Datasets
Dataset used at the residue level
Among the various datasets available (Ikeda et al., 2003; Moller et al., 2000;
Nilsson et al., 2000; Klein et al., 1985) the larger Moller dataset of integral mem-
brane proteins was selected for training and assessment of residue level predic-
tions. The dataset, downloaded from ftp://ftp.ebi.ac.uk/pub/databases/
testsets/transmembrane/sequences/ consists of subsets A, B, C, C.P and D
on the basis of confidence (A being the best and D the worst). Moller suggests
that subset D should not be used for training or testing purposes, so the re-
maining subsets (A, 37 sequences; B, 23 sequences; C, 129 sequences; C.P, 17
sequences) were combined to form dataset ‘ABCP’ with 206 sequences. However,
two sequences from the ABCP dataset could not be processed by MEMSAT
121

5.2. METHODSCHAPTER 5. IMPROVING PREDICTION OF TRANSMEMBRANE
PROTEINS
using default parameters and these sequences were excluded to create a final
dataset named ‘ABCP-2’ used for training the neural network and for 5-fold
cross-validation. 5-fold cross validation involves splitting the whole dataset into
5 subsets and using 4 of these subsets as training data while using the remaining
1 subset as validation data. The cross-validation process is repeated, with each
of the 5 subsets used once as the validation data. The results from the 5 folds
then can be averaged to produce a single set of performance statistics.
Datasets used at the protein level
For protein level predictions, independent non-redundant datasets of
transmembrane and non-transmembrane proteins were generated from
UniprotKB/SwissProt (Wu et al., 2006). A program implemented in
Perl was written to look for the term ‘TRANSMEM’ in ‘FT’ lines of the
UniprotKB/SwissProt data file (see Figure 5.4). If the term was not present,
then the sequence was placed in the non-transmembrane dataset. If present, the
method looks for the terms ‘Potential’, ‘similarity’ or ‘Probable’. If any one of
these terms is present, the sequence is rejected. If the terms are not present,
then the sequence is placed in the transmembrane dataset. Any sequence
present in the ABCP-2 training set (described above) was then removed from
the transmembrane dataset. In the final phase of data preparation, redundancy
was removed from the datasets. Each dataset was treated as an input list of
sequences. The first sequence was transferred to an output list. Each remaining
sequence in the input list was scanned against the output list and against the
Moller training set using FASTA (Pearson, 1990; Pearson and Lipman, 1988).
If a significant hit was found, with sequence identity > 35%, the sequence was
122

5.2. METHODSCHAPTER 5. IMPROVING PREDICTION OF TRANSMEMBRANE
PROTEINS
Figure 5.4: Dataset preparation for analysis at the protein level.
123

5.2. METHODSCHAPTER 5. IMPROVING PREDICTION OF TRANSMEMBRANE
PROTEINS
rejected; otherwise the sequence was added to the output list. This was repeated
for the rest of the dataset or until the output list exceeded 200 sequences.
The aim of 35% threshold was not to exclude all homologues, but to exclude
all significantly similar sequences. Thus the dataset may contain homologous
sequences, but a diverse set of sequence data is guaranteed.
From the initial transmembrane set of 272 sequences, 20 were removed because
they were present in the training set, 173 sequences were removed as a result of
redundancy within the dataset and a further 29 sequences were removed because
of clear homology with the training set. One sequence could not be processed
by MEMSAT using default parameters leaving a final transmembrane dataset
of 49 sequences (see Figure 5.5). With < 35% sequence identity to each other
or to the Moller data used for training, the non-transmembrane dataset was
created in the same way and stopped when it reached a limit of 200 sequences.
Five sequences could not be processed by MEMSAT using default parameters
leaving a final dataset of 195 sequences. The resulting ratio of transmembrane
to non-transmembrane sequences (∼1:4) matches the ratio of transmembrane to
non-transmembrane proteins in a typical genome (Krogh et al., 2001; Jones, 1998;
Wallin and von Heijne, 1998).
5.2.3 Using APAT and implementation of the neural net-
work
The individual transmembrane predictors (TMHMM, DAS-TMfilter and MEM-
SAT) and the signal peptide predictor (SignalP) were run using APAT (Deevi
and Martin, 2006) (described in Chapter 3).
Input to the neural network consisted of a sliding window of size 5 to combine
124

5.2. METHODSCHAPTER 5. IMPROVING PREDICTION OF TRANSMEMBRANE
PROTEINS
Figure 5.5: Systematic removal of sequences from the transmembrane dataset toimprove the quality of dataset.
125

5.2. METHODSCHAPTER 5. IMPROVING PREDICTION OF TRANSMEMBRANE
PROTEINS
the outputs from the three prediction methods. TMHMM generates three values
(‘in’, ‘mem’ and ‘out’ scores) while single outputs were taken from MEMSAT and
DAS-TMfilter. Therefore input to the network consisted of 5 × 5 input nodes.
Networks were trained using both raw and normalized values from the component
predictors. Only one hidden layer was used because, in general more than one
hidden layer does not provide any advantage, instead more hidden nodes are
preferable (Guimaraes et al., 2003; Pasquier and Hamodrakas, 1999; Brightwell
et al., 1997). Hidden layer sizes of 5, 7, 10, 15 and 20 nodes were examined using
a single output node. Summed squared output errors were plotted against the
number of training cycles by using early-stopping after 30 cycles. 30 cycles was
chosen on evaluation of a number of training sets and showed that improvement
in error was levelling off at this point. Stopping at this point avoids over-fitting.
Training was performed using resilient back-propagation (Rprop) (Riedmiller and
Braun, 1993).
Additional partial validation was performed by using lower hidden layer sizes
of 3 and 4 hidden nodes and larger window sizes of 7 and 9.
Dataset preparation, creation of pattern-files for input to the neural network
and analysis of results were all performed using scripts written in Perl. Results
for individual residue performance (assessed using the Matthews’ Correlation
Coefficient, MCC (Matthews, 1975)) were averaged over 5-fold cross-validation.
Output from the neural networks was a single value between zero and one, and
this is used as a threshold (cutoff). The cutoff for a positive prediction was varied
in steps of 0.1 to optimize predictions.
126

5.3. RESULTS AND DISCUSSIONCHAPTER 5. IMPROVING PREDICTION OF TRANSMEMBRANE
PROTEINS
Performance was evaluated using:
MCC =(TP ∗ TN)− (FP ∗ FN)√
(TP + FN)(TN + FP )(TP + FP )(TN + FN)(5.1)
Sensitivity (TPrate) =TP
(TP + FN)(5.2)
Specificity =TN
(TN + FP )(5.3)
Where TP = True Positive; TN = True Negative; FP = False Positive; FN =
False Negative.
5.3 Results and Discussion
Performance of the combined method was assessed at the individual residue and
whole protein level. Performance was compared with the individual methods and
the effect of masking signal peptide residues as predicted by SignalP was assessed.
5.3.1 Single residue prediction
The performance of each of the individual predictors — DAS-TMfilter, TMHMM,
MEMSAT — was compared with the combined predictor, and the effect of mask-
ing residues using SignalP was assessed using the ABCP-2 dataset.
Performance of individual predictors
The performance of individual predictors was assessed using their default param-
eters to find out which among them performs the best. Of the three individual
127

5.3. RESULTS AND DISCUSSIONCHAPTER 5. IMPROVING PREDICTION OF TRANSMEMBRANE
PROTEINS
Hidden layer sizeCutoff 5 7 10 15 200.1 0.737 0.737 0.733 0.732 0.7300.2 0.777 0.770 0.769 0.770 0.7690.3 0.794 0.790 0.790 0.790 0.7890.4 0.801 0.802 0.803 0.801 0.8020.5 0.803 0.801 0.802 0.801 0.8010.6 0.795 0.791 0.791 0.790 0.7940.7 0.775 0.769 0.771 0.770 0.7760.8 0.720 0.731 0.737 0.736 0.7410.9 0.558 0.601 0.593 0.571 0.594
Table 5.1: MCC scores from varying the hidden layer size and prediction threshold(cutoff) for the un-masked and un-normalized combined predictor. The bestperformance is highlighted in bold. If the same performance value is achieved ata lower hidden layer size then that is preferred because a better generalizationcould be achieved.
predictors used,
• TMHMM performed best with MCC=0.796,
• MEMSAT performed moderately with MCC=0.733, and
• DAS-TMfilter performed worst with MCC=0.702
Performance of the un-masked and un-normalized combined predictor
Initial performance of the combined predictor was assessed using different hidden
layer sizes and thresholds and by feeding the raw (un-normalized) results from
the predictors into the network (Table 5.1). Optimum performance, resulting in
a mean MCC of 0.803, was seen using a prediction threshold of 0.5 with a hidden
layer size of 5. The same score is achieved with a cutoff of 0.4 and hidden layer
size of 10, but smaller hidden layer sizes are likely to maximize generalization.
128

5.3. RESULTS AND DISCUSSIONCHAPTER 5. IMPROVING PREDICTION OF TRANSMEMBRANE
PROTEINS
Figure 5.6: Histogram of output values from the neural network for the un-maskedun-normalized combined predictor using a hidden layer size of 5. It can be seenthat the vast majority of values are < 0.1 or > 0.9 explaining the insensitivity ofperformance to the cutoff used for positive predictions.
129

5.3. RESULTS AND DISCUSSIONCHAPTER 5. IMPROVING PREDICTION OF TRANSMEMBRANE
PROTEINS
It was interesting to note that the performance of the neural network (as
assessed by the MCC) was not very sensitive to the cutoff selected for a positive
or negative prediction, even when extreme cutoffs of 0.1 or 0.9 were used. It was
therefore assumed that the vast majority of values output by the network were
either < 0.1 or > 0.9. This hypothesis was confirmed by plotting a histogram of
values output by the network as show in Figure 5.6. Nonetheless, the cutoff was
varied for future neural network experiments (although in retrospect it can be
seen that all these neural networks are relatively insensitive to the selected cutoff
for the same reason).
Performance of the un-masked and normalized combined predictor
The effects of normalizing the results before input to the neural network were
then assessed. DAS-TMfilter produces positive output values and a value of
> 2.5 is normally recommended as a positive prediction. Values were therefore
normalized from the range 0–5 to 0–1 with all values > 5 being treated as five
using the equation:
Sn =
max
Sr
5.0
5(5.4)
where Sr is the raw score and Sn is the normalized score.
Similarly, MEMSAT generates positive scores for each predicted transmem-
brane helix. A preliminary examination of output from MEMSAT again sug-
gested that any helix with a score > 5 could be regarded as having very high
confidence so normalization was performed in the same way. Surprisingly, nor-
malization did not improve the results with a best MCC of 0.802 being achieved
130

5.3. RESULTS AND DISCUSSIONCHAPTER 5. IMPROVING PREDICTION OF TRANSMEMBRANE
PROTEINS
Hidden layer sizeCutoff 5 7 10 15 200.1 0.743 0.738 0.740 0.743 0.7420.2 0.775 0.771 0.774 0.775 0.7750.3 0.791 0.791 0.792 0.791 0.7910.4 0.801 0.802 0.799 0.801 0.8000.5 0.800 0.802 0.800 0.799 0.8010.6 0.790 0.791 0.793 0.793 0.7920.7 0.764 0.771 0.773 0.773 0.7730.8 0.733 0.736 0.739 0.741 0.7340.9 0.614 0.592 0.566 0.559 0.571
Table 5.2: MCC score from varying the hidden layer size and prediction thresh-old (cutoff) for the un-masked and normalized combined predictor. The bestperformance is highlighted in bold. If the same performance value is achieved ata lower hidden layer size then that is preferred because a better generalizationcould be achieved.
with a prediction threshold of 0.4 or 0.5 and hidden layer size of 7 (Table 5.2).
Raw values were therefore used in future prediction work.
Performance of the un-masked and un-normalized combined predictor
using only TMHMM and MEMSAT
The contribution of DAS-TMfilter (the worst individual predictor) was assessed
by performing a separate analysis using only TMHMM and MEMSAT. If the pre-
diction performance of the combined predictor (without DAS-TMfilter) is lower
than the predictor using all the 3 tools, then it implies that DAS-TMfilter is
contributing positively to the combined prediction (Table 5.3) despite its lower
individual performance. Optimum performance (MCC=0.801) was obtained us-
ing a hidden layer size of 20 and a prediction threshold of 0.4 or 0.5. This was
only slightly worse than the combined predictor using all three individual meth-
ods, but required a much larger hidden layer size to obtain this level of prediction
131

5.3. RESULTS AND DISCUSSIONCHAPTER 5. IMPROVING PREDICTION OF TRANSMEMBRANE
PROTEINS
Hidden layer sizeCutoff 5 7 10 15 200.1 0.747 0.738 0.741 0.746 0.7430.2 0.773 0.768 0.772 0.775 0.7720.3 0.791 0.791 0.792 0.794 0.7900.4 0.798 0.799 0.800 0.800 0.8010.5 0.798 0.797 0.799 0.799 0.8010.6 0.787 0.789 0.788 0.791 0.7920.7 0.770 0.774 0.773 0.771 0.7750.8 0.733 0.740 0.739 0.735 0.7340.9 0.611 0.541 0.573 0.591 0.580
Table 5.3: MCC scores from varying the hidden layer size and prediction threshold(cutoff) for the un-masked and un-normalized combined predictor using onlyTMHMM and MEMSAT. The best performance is highlighted in bold. If thesame performance value is achieved at a lower hidden layer size then that ispreferred because a better generalization could be achieved.
suggesting that the predictor may be less general. Thus while DAS-TMfilter is
the worst individual predictor, it does seem to play a small part in enhancing the
overall prediction.
Performance of the masked and un-normalized combined predictor
The effect of masking with SignalP was then assessed. Any residue predicted
by SignalP to be part of a signal peptide had its prediction value for being part
of a transmembrane segment reset to zero before running the network. In the
case of TMHMM which gives three predictions (membrane, inside, outside), the
membrane value was set to zero and the inside and outside values both set to 0.5.
The best performance was an average MCC of 0.787 obtained with a prediction
threshold of 0.5 and a hidden layer size of 15 (Table 5.4). Clearly, for individual
residue prediction, masking led to worse performance.
132

5.3. RESULTS AND DISCUSSIONCHAPTER 5. IMPROVING PREDICTION OF TRANSMEMBRANE
PROTEINS
Hidden layer sizeCutoff 5 7 10 15 200.1 0.734 0.726 0.723 0.719 0.7200.2 0.766 0.760 0.756 0.752 0.7500.3 0.779 0.777 0.776 0.763 0.7640.4 0.784 0.784 0.785 0.785 0.7860.5 0.785 0.786 0.786 0.787 0.7860.6 0.779 0.778 0.776 0.777 0.7800.7 0.762 0.755 0.757 0.758 0.7640.8 0.703 0.720 0.726 0.724 0.7290.9 0.583 0.613 0.585 0.591 0.601
Table 5.4: MCC scores from varying the hidden layer size and prediction thresh-old (cutoff) for the masked and un-normalized combined predictor. The bestperformance is highlighted in bold. If the same performance value is achieved ata lower hidden layer size then that is preferred because a better generalizationcould be achieved.
Performance of the un-masked and un-normalized combined predictor
using lower hidden layer size
In order to examine the effect of using a lower hidden layer size, hidden layer
sizes of 3 and 4 nodes were employed (Table 5.5). Best performance with the
smaller hidden layer sizes resulted in a mean MCC of 0.801, using a prediction
threshold of 0.4 with hidden layer sizes of 3 and 4. This is slightly worse than the
optimum performance (a mean MCC of 0.803 seen using a prediction threshold
of 0.5 with a hidden layer size of 5). This demonstrates that using hidden layer
sizes of 3 and 4 nodes provides no improvement over using 5 hidden nodes.
133

5.3. RESULTS AND DISCUSSIONCHAPTER 5. IMPROVING PREDICTION OF TRANSMEMBRANE
PROTEINS
Input window size 5Hidden layer size
Cutoff 3 4 5 7 10 15 200.1 0.742 0.734 0.737 0.737 0.733 0.732 0.7300.2 0.776 0.768 0.777 0.770 0.769 0.770 0.7690.3 0.794 0.786 0.794 0.790 0.790 0.790 0.7900.4 0.801 0.801 0.801 0.802 0.803 0.801 0.8020.5 0.801 0.798 0.803 0.801 0.802 0.801 0.8010.6 0.789 0.790 0.795 0.791 0.791 0.790 0.7940.7 0.769 0.773 0.775 0.769 0.771 0.770 0.7760.8 0.737 0.733 0.720 0.731 0.737 0.736 0.7410.9 0.596 0.559 0.558 0.601 0.593 0.571 0.594
Table 5.5: MCC scores from varying the hidden layer size and prediction threshold(cutoff) for the un-masked and un-normalized combined predictor while usinglower hidden layer size and an input window size of 5. The best performance ishighlighted in bold. If the same performance value is achieved at a lower hiddenlayer size then that is preferred because a better generalization could be achieved.
Performance of the un-masked and un-normalized combined predictor
using higher input window size
Input window size is crucial for motif predictions and a larger window size is
commonly employed by many secondary structure predictors (Guimaraes et al.,
2003; Chandonia and Karplus, 1995; Qian and Sejnowski, 1988). Here the aim
is to use the neural network to smooth the results from other predictors rather
than predicting patterns directly from amino acid sequences. In order to verify
that a higher window size did not help, neural networks with window sizes of 7
and 9 were employed. Using a window size of 7, optimum performance resulted
in a mean MCC of 0.803 (using a prediction threshold of 0.4 with hidden layer
sizes of 10 and 15) (Table 5.6). Using a window size of 9, optimum performance
resulted in a mean MCC of 0.803 (using a prediction threshold of 0.4 with hidden
layer sizes of 10) (Table 5.7). Using an input window of 5 (Table reftab-ABCP-
134

5.3. RESULTS AND DISCUSSIONCHAPTER 5. IMPROVING PREDICTION OF TRANSMEMBRANE
PROTEINS
Input window size 7Hidden layer size
Cutoff 3 4 5 7 10 15 200.1 0.719 0.739 0.717 0.735 0.733 0.737 0.7360.2 0.775 0.767 0.774 0.773 0.774 0.773 0.7750.3 0.789 0.791 0.794 0.793 0.794 0.792 0.7940.4 0.794 0.798 0.801 0.802 0.803 0.803 0.8010.5 0.798 0.800 0.800 0.802 0.801 0.802 0.8010.6 0.787 0.787 0.794 0.795 0.795 0.794 0.7940.7 0.771 0.772 0.772 0.772 0.777 0.773 0.7790.8 0.748 0.731 0.729 0.732 0.746 0.734 0.7430.9 0.608 0.640 0.618 0.613 0.553 0.605 0.566
Table 5.6: MCC scores from varying the hidden layer size and prediction threshold(cutoff) for the un-masked and un-normalized combined predictor while using aninput window size of 7. The best performance is highlighted in bold. If the sameperformance value is achieved at a lower hidden layer size then that is preferredbecause a better generalization could be achieved.
2-no-mask), the same score was achieved using a threshold of 0.5 with hidden
layer size of 5. Smaller input and hidden layer sizes are likely to maximize gen-
eralization and, as expected this demonstrates that using larger window size has
not improved the performance.
5.3.2 Whole protein prediction
Often, one would simply like to know whether a protein is a transmembrane
protein or not. As described in the Methods, a non-redundant test set of trans-
membrane and non-transmembrane proteins which showed low sequence identity
to the training data used for residue-level predictions was prepared. On the basis
of residue-level predictions it was decided whether a protein was a transmembrane
protein on the basis of three alternative strategies:
1. the total number of transmembrane residues predicted,
135
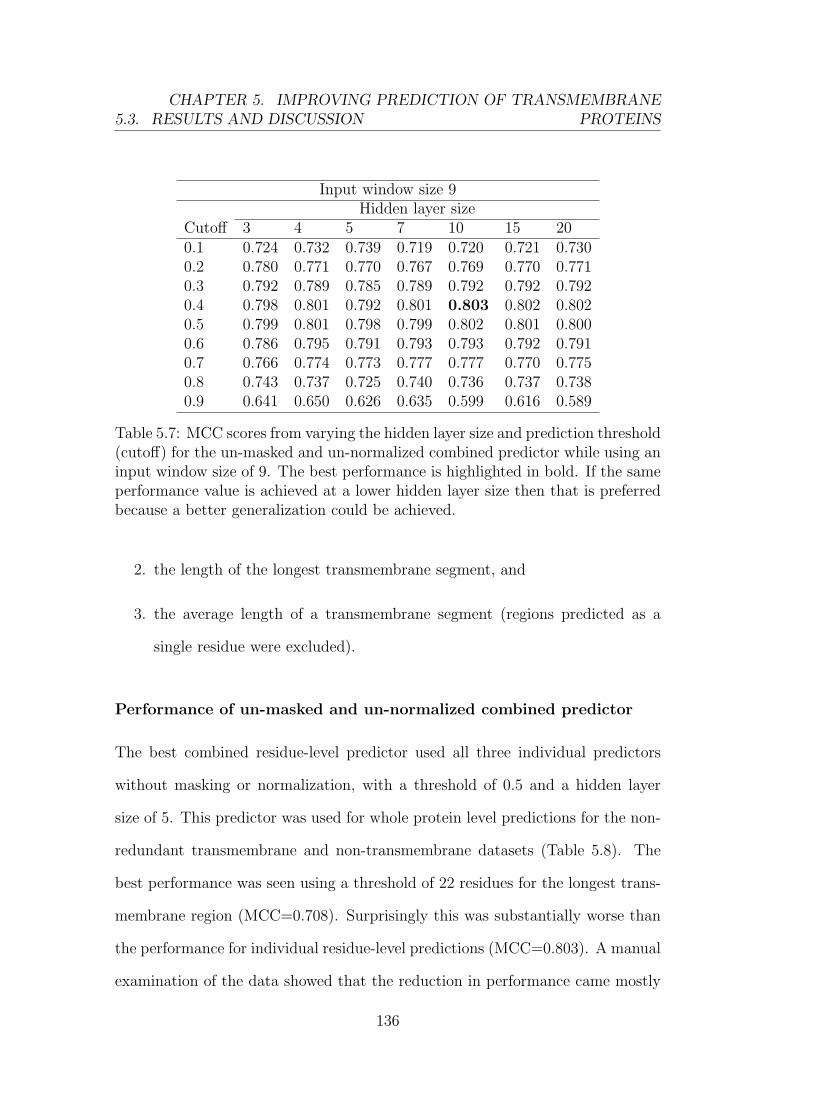
5.3. RESULTS AND DISCUSSIONCHAPTER 5. IMPROVING PREDICTION OF TRANSMEMBRANE
PROTEINS
Input window size 9Hidden layer size
Cutoff 3 4 5 7 10 15 200.1 0.724 0.732 0.739 0.719 0.720 0.721 0.7300.2 0.780 0.771 0.770 0.767 0.769 0.770 0.7710.3 0.792 0.789 0.785 0.789 0.792 0.792 0.7920.4 0.798 0.801 0.792 0.801 0.803 0.802 0.8020.5 0.799 0.801 0.798 0.799 0.802 0.801 0.8000.6 0.786 0.795 0.791 0.793 0.793 0.792 0.7910.7 0.766 0.774 0.773 0.777 0.777 0.770 0.7750.8 0.743 0.737 0.725 0.740 0.736 0.737 0.7380.9 0.641 0.650 0.626 0.635 0.599 0.616 0.589
Table 5.7: MCC scores from varying the hidden layer size and prediction threshold(cutoff) for the un-masked and un-normalized combined predictor while using aninput window size of 9. The best performance is highlighted in bold. If the sameperformance value is achieved at a lower hidden layer size then that is preferredbecause a better generalization could be achieved.
2. the length of the longest transmembrane segment, and
3. the average length of a transmembrane segment (regions predicted as a
single residue were excluded).
Performance of un-masked and un-normalized combined predictor
The best combined residue-level predictor used all three individual predictors
without masking or normalization, with a threshold of 0.5 and a hidden layer
size of 5. This predictor was used for whole protein level predictions for the non-
redundant transmembrane and non-transmembrane datasets (Table 5.8). The
best performance was seen using a threshold of 22 residues for the longest trans-
membrane region (MCC=0.708). Surprisingly this was substantially worse than
the performance for individual residue-level predictions (MCC=0.803). A manual
examination of the data showed that the reduction in performance came mostly
136

5.3. RESULTS AND DISCUSSIONCHAPTER 5. IMPROVING PREDICTION OF TRANSMEMBRANE
PROTEINS
Unmasked MaskedCriterion Criterion
Cutoff All Longest Mean All Longest Mean10 0.622 0.622 0.649 0.694 0.694 0.71512 0.622 0.622 0.663 0.694 0.694 0.71514 0.642 0.642 0.685 0.704 0.704 0.72616 0.656 0.677 0.700 0.726 0.738 0.74918 0.686 0.703 0.697 0.749 0.762 0.74720 0.669 0.704 0.668 0.731 0.729 0.72922 0.700 0.708 0.644 0.701 0.700 0.65324 0.606 0.556 0.404 0.606 0.556 0.40626 0.539 0.317 0.223 0.522 0.317 0.22328 0.539 0.317 0.223 0.522 0.317 0.22330 0.539 0.289 0.181 0.522 0.289 0.181
Table 5.8: MCC scores from the best residue-level predictor (un-masked, un-normalized) in whole protein level predictions. ‘Unmasked’ or ‘Masked’ refers toSignalP masking applied after the residue-level prediction is made. Proteins werepredicted as being transmembrane if the number of residues according to a spec-ified criterion was matched or exceeded. ‘All’: total number of residues predictedas being transmembrane; ‘Longest’: number of residues in the longest contiguousstretch; ‘Mean’: mean length of regions predicted as being transmembrane.
137

5.4. SUMMARYCHAPTER 5. IMPROVING PREDICTION OF TRANSMEMBRANE
PROTEINS
from false-positive predictions which appeared to be the result of signal peptides.
This suggested that signal masking (according to the prediction from SignalP)
might be important in obtaining good protein-level predictions.
Performance of the masked and un-normalized combined predictor
Therefore, the protein-level predictions were re-analyzed using the residue-level
predictor, but with SignalP masking after running the network. While the re-
sults were still not as good as the residue-level predictions, masking significantly
improved the performance of the protein-level predictor (Table 5.8). The best
performance was achieved using the length of the longest transmembrane seg-
ment (≥18 residues) and performance increased from MCC=0.708 (unmasked)
to MCC=0.762 (masked).
Performance of the masked and un-masked best individual predictor
For comparison, the performance of the best individual predictor (TMHMM) in
predicting at the protein level was assessed, both unmasked and masked using
SignalP (Table 5.9). This resulted in a best MCC of 0.762 masked (longest
transmembrane segment ≥18 residues) compared with 0.693 unmasked (longest
transmembrane segment or total number of transmembrane residues ≥18). Thus
TMHMM masked by SignalP performs just as well as the combined predictor for
protein-level predictions.
5.4 Summary
In summary, combining the outputs of three of the best transmembrane predic-
tion programs (TMHMM, MEMSAT and DAS-TMfilter) using a neural network
138

5.4. SUMMARYCHAPTER 5. IMPROVING PREDICTION OF TRANSMEMBRANE
PROTEINS
Unmasked MaskedCriterion Criterion
Cutoff All Longest Mean All Longest Mean10 0.640 0.640 0.640 0.715 0.738 0.73812 0.640 0.640 0.640 0.715 0.738 0.73814 0.640 0.640 0.640 0.715 0.738 0.73816 0.647 0.647 0.647 0.715 0.738 0.73818 0.693 0.693 0.678 0.749 0.762 0.74720 0.666 0.651 0.651 0.718 0.716 0.71622 0.668 0.653 0.606 0.715 0.714 0.65324 0.522 0.361 0.216 0.522 0.361 0.17726 0.503 0.177 0.181 0.503 0.177 0.18128 0.503 0.223 0.128 0.503 0.223 0.12830 0.503 0.222 0.000 0.503 0.223 0.000
Table 5.9: MCC score for TMHMM in whole protein level predictions. ‘Un-masked’ or ‘Masked’ refers to SignalP masking applied after the residue-levelprediction is made. Proteins were predicted as being transmembrane if the num-ber of residues according to a specified criterion was matched or exceeded. ‘All’:total number of residues predicted as being transmembrane; ‘Longest’: numberof residues in the longest contiguous stretch; ‘Mean’: mean length of regionspredicted as being transmembrane.
139

5.4. SUMMARYCHAPTER 5. IMPROVING PREDICTION OF TRANSMEMBRANE
PROTEINS
has resulted only in a marginal improvement over the best individual program
(MCC=0.803 for combined predictor compared with MCC=0.796 for TMHMM
alone). At the whole protein level, when masked to exclude signal peptides using
SignalP, the combined predictor did not perform better than TMHMM alone.
However masking was seen to be very important and improved the MCC from
0.708 to 0.762 (combined predictor) or 0.693 to 0.762 (TMHMM alone). It is ex-
pected that the performance of the combined predictor will improve as enhance-
ments are made to the underlying prediction tools. A new version of MEMSAT
(MEMSAT 3) (Jones, 2007) has recently been released and could be included to
assess the improvements made to the combined predictor.
140

Chapter 6
Analysis of the MEP Pathway
and Apicoplast Proteins Using
TAPAS
The methods developed in the previous chapters were then applied to the analysis
of the proteins of the MEP pathway and the apicoplast. As described in the
introduction, the MEP pathway of isoprenoid biosynthesis is of great interest to
the pharmaceutical sector and the scientific community because it is completely
absent in humans, where isoprenoids are synthesized by the Mevalonate pathway.
Thus it is a potentially important target for drug intervention in diseases such
as malaria, tuberculosis, leprosy, cholera, typhoid, gonorrhea, and syphilis. The
apicoplast is a unique organelle present only in apicomplexan protists and is
the target site for many nuclear encoded proteins that carry out a wide range
of functions, thus making it absolutely indispensable for the survival of these
organisms. The MEP pathway occurs inside the apicoplast of apicomplexans,
141

CHAPTER 6. ANALYSIS OF THE MEP PATHWAY AND APICOPLASTPROTEINS USING TAPAS
Disease PathogenMalaria Plasmodium falciparumTuberculosis Mycobacterium tuberculosisLeprosy Mycobacterium lepraeCholera Vibrio choleraeSyphilis Treponema pallidumBubonic plague Yersinia pestisChildhood meningitis Haemophilus influenzaSalmonellosis Salmonella typhimuriumTyphoid Salmonella typhiiMeningitis Neisseria meningitidisGonorrhea Neisseria gonorrhoeaeGas gangrene Clostridium perfringensBotulism Clostridium botulinumTetanus Clostridium tetaniDiphtheria Corynebacterium diphtheriaeChlamydia Chlamydia trachomatisToxoplasmosis Toxoplasma gondiiCoccidiosis (poultry and farm animals) Eimeria spp
Table 6.1: Some important diseases associated with the pathogens having theMEP pathway.
but its occurrence is independent of presence or absence of the apicoplast as it is
also present in organisms that lack the apicoplast.
Here, my aim was to scan the protein sequences of the apicoplast and the MEP
pathway to identify potential drug targets using TAPAS (described in Chapter 4).
I decided to look at the apicoplast (∼500 proteins) from Plasmodium falciparum
and the 8 MEP pathway proteins (enzymes) from some selected species.
142
6.1. APPROACH AND METHODSCHAPTER 6. ANALYSIS OF THE MEP PATHWAY AND APICOPLAST
PROTEINS USING TAPAS
6.1 Approach and Methods
6.1.1 Labelling sequence origin
Some of the analysis tools run by APAT require details of the origin of the
sequence, for example, eukaryote/prokaryote; gram-positive/gram-negative; etc.
Analyzing many sequences from a single organism, as in the case of apicoplast
sequences of Plasmodium falciparum, is straightforward as it just needs one set of
definitions for all sequences, but analyzing a few sequences of many organisms, as
in the case of the the MEP pathway proteins requires an automatic specification
of these required details. Specifically, the following data are required by specific
servers:
1. SubLoc — prokaryotic or eukaryotic,
2. TargetP — plant or non-plant,
3. PSORT — gram-positive bacterium or gram-negative bacterium or yeast
or animal or plant.
A perl script was written which looks at the taxonomical classification from
‘OC’ lines of the UniprotKB/SwissProt data file for each organism, classifies
them into the various categories required by different tools, and places the data
in a file which can then be used to make a definition file to run APAT through
TAPAS (Figure 6.1). Classifying the sequences into prokaryotic or eukaryotic is
achieved by looking at the taxonomical domain ‘Eukaryota’. The presence or
absence of this term in the taxonomical details of an organism classifies it into
eukaryote or prokaryote respectively. A sequence is classified into plant or non-
plant by looking at the taxonomical kingdom ‘Plantae’ where the presence of
143

6.1. APPROACH AND METHODSCHAPTER 6. ANALYSIS OF THE MEP PATHWAY AND APICOPLAST
PROTEINS USING TAPAS
#
DXR_NOCFA : psort origin : Gram-positive bacterium
DXR_NOCFA : species : Nocardia farcinica
DXR_NOCFA : subloc origin : prokaryotic
DXR_NOCFA : targetp origin : non-plant
#
DXR_ORYSA : psort origin : plant
DXR_ORYSA : species : Oryza sativa (Rice)
DXR_ORYSA : subloc origin : eukaryotic
DXR_ORYSA : targetp origin : plant
#
DXR_PARUW : psort origin : Gram-negative bacterium
DXR_PARUW : species : Protochlamydia amoebophila (strain UWE25)
DXR_PARUW : subloc origin : prokaryotic
DXR_PARUW : targetp origin : non-plant
#
Figure 6.1: Sample extract of output from origin-finder script which includesspecific details required by different tools.
this term groups it into plant and its absence groups it into non-plant. Labelling
a sequence as being of animal origin is achieved by looking at the presence of
taxonomical kingdom ‘Metazoa’. Similarly, yeast sequences are identified by the
presence of the taxonomical division ‘Ascomycota’ or ‘Basidiomycota’ (Kurtzman
and Piskur, 2006). Categorizing bacteria into gram-positive and gram-negative
is a more complex task.
Gram-Positive and Gram-Negative
There is no simple computational tool or straightforward way to differentiate
bacteria into gram-positive or gram-negative. This classification is based on
their ability (gram-positive) or inability (gram-negative) to be stained purple
with Gram’s staining technique. Based on a literature survey, I prepared a list
of phyla/divisions which fall into respective categories (Table 6.2) (Griffiths
144

6.1. APPROACH AND METHODSCHAPTER 6. ANALYSIS OF THE MEP PATHWAY AND APICOPLAST
PROTEINS USING TAPAS
Bacterial Phyla/DivisionsGram-negative Gram-PositiveAquificae FirmicutesBacteroidetes ActinobacteriaChlamydiae Deinococcus-ThermusChlorobiaceaeChloroflexiCrenarchaeotaCyanobacteriaFusobacteriaPlanctomycetesProteobacteriaSpirochaetesThermotogae
Table 6.2: Bacterial phyla/divisions that fall into gram-positive and gram-negative categories.
and Gupta, 2006; Yasin et al., 1996; Belunis et al., 1992; Guiney et al.,
1984; Hackman and Wilkins, 1975) (also from websites: http://users.rcn.
com/jkimball.ma.ultranet/BiologyPages/E/Eubacteria.html, http://
cubic.bioc.columbia.edu/services/proftmb/download/GenomesGramClass,
http://microbewiki.kenyon.edu/index.php/Pirellula, http://www.
palaeos.com/Bacteria/default.htm, http://highered.mcgraw-hill.com/
sites/0072320419/student_view0/chapter21/study_outline.html).
The origin-finding script then assigns prokaryotes as gram positive or gram
negative based on the presence of one of these taxonomical terms (Table 6.2).
145

6.1. APPROACH AND METHODSCHAPTER 6. ANALYSIS OF THE MEP PATHWAY AND APICOPLAST
PROTEINS USING TAPAS
##########################################################
Number of predicted TM residues by TMHMM(after nullifying signal peptide residues) : 111Length of longest stretch of TM residues : 24Threshold Value used during current run : 18
Is it a signal peptide according to SignalP? : YEScleavage site is just before residue : 21signal peptide is from : 1 - 20
>Prediction : Transmembranesignal anchor : NO
##########################################################
Figure 6.2: Output from the script that masks signal peptide residues amongTMHMM predictions to improve transmembrane prediction.
6.1.2 Predicting whether a protein is a transmembrane
protein
As shown in Chapter 5, masking any transmembrane residues predicted by
TMHMM if they fall in a signal peptide region as predicted by SignalP,
improved the transmembrane prediction at the whole protein level. Hence, in
this analysis, I have used the technique of signal masking TMHMM predictions
for predicting whether or not a protein contains transmembrane regions.
This procedure uses a threshold of ≥18 residues for the length of the longest
membrane spanning region because the best performance was obtained using
these parameters (Section 5.3.2).
This procedure was incorporated into the TAPAS system for prediction of
whether or not a protein is transmembrane.
146

6.1. APPROACH AND METHODSCHAPTER 6. ANALYSIS OF THE MEP PATHWAY AND APICOPLAST
PROTEINS USING TAPAS
6.1.3 Analysis of apicoplast proteins
The unpublished sequences of 544 apicoplast proteins from Plasmodium falci-
parum were kindly supplied by Prof. Geoff McFadden ([email protected]).
These sequences were analysed by the TAPAS pipeline followed by manual anal-
ysis of the output.
6.1.4 Execution of MEP proteins
In the case of proteins of the MEP pathway, I have selected a list of fifteen im-
portant pathogens for which sequences are available. The seven MEP enzymes
and the IDI enzyme which is common to both the MEP pathway and the meval-
onate pathway are represented by their respective EC numbers along with their
SwissProt ACs for the chosen set of pathogenic organisms (Table 6.3). The EC
numbers and the corresponding names of the enzymes of the MEP pathway are:
1. 2.2.1.7 ⇐⇒ 1-deoxy-d-xylulose-5-phosphate synthase (DXS)
2. 1.1.1.267 ⇐⇒ 1-deoxy-d-xylulose-5-phosphate reductoisomerase (DXPRI)
3. 2.7.7.60 ⇐⇒ 4-diphosphocytidyl-2C-methyl-d-erythritol cytidyltransferase
(CDP-ME Synthase)
4. 2.7.1.148⇐⇒ 4-diphosphocytidyl-2C-methyl-d-erythritol kinase (CDP-ME
Kinase)
5. 4.6.1.12 ⇐⇒ 2C-methyl-d-erythritol-2,4-cyclodiphosphate synthase
(MECDP Synthase)
6. 1.17.4.3 ⇐⇒ (E)-4-hydroxy-3-methylbut-2-enyl diphosphate synthase
(HMBPP Synthase)
147

6.1. APPROACH AND METHODSCHAPTER 6. ANALYSIS OF THE MEP PATHWAY AND APICOPLAST
PROTEINS USING TAPAS
7. 1.17.1.2 ⇐⇒ (E)-4-hydroxy-3-methylbut-2-enyl diphosphate reductase
(HMBPP Reductase)
8. 5.3.3.2⇐⇒ isopentenyl diphosphate isomerase (IPP Isomerase)/isopentenyl
diphosphate isomerase:dimethylallyl diphosphate isomerase (IDI)
6.1.5 Analysis of the output
A perl script was written to carry out further analysis of the output from TAPAS.
This performs quantitative analysis and also produces a ‘target score’ for each
protein to suggest its ability to be a good drug target for SBDD.
Quantitative analysis
The quantitative analysis was provided in the form of an HTML table which
contains the following data:
1. Number of proteins analysed in the current analysis run
2. Number of proteins having human hits
3. Number of proteins having enzyme hits
4. Number of proteins having 3D structure hits
5. Number of proteins having ligand hits
6. Number of proteins that are transmembrane
148

6.1. APPROACH AND METHODSCHAPTER 6. ANALYSIS OF THE MEP PATHWAY AND APICOPLAST
PROTEINS USING TAPAS
EC
Num
ber
Org
anis
m2.
2.1.
71.
1.1.
267
2.7.
7.60
2.7.
1.14
84.
6.1.
121.
17.4
.31.
17.1
.25.
3.3.
2C
hlam
ydia
trac
hom
atis
O84
335
O84
074
O84
468
O84
810
O84
441
O84
060
O84
867
Clo
stri
dium
perf
ring
ens
Q8X
JE1
Q8X
JR1
Q8X
HQ
3Q
8XIA
9Q
8XI0
8P
5866
7P
5867
5C
lost
ridi
umte
tani
Q89
4H0
Q89
5K5
Q89
0M1
Q89
9A2
Q89
9E9
Q89
5K3
Q89
5G2
Cor
yneb
acte
rium
diph
ther
iae
Q6N
GV
3Q
6NG
L1
Q6N
FC
1Q
6NIA
1Q
6NFC
2Q
6NG
L3
Q6N
I36
P60
923
Hae
mop
hilu
sin
fluen
zae
P45
205
P44
055
O05
029
P45
271
P44
815
P44
667
P44
976
Myc
obac
teri
umle
prae
Q50
000
Q9C
BU
3Q
9CC
W6
Q9C
D51
Q9C
CW
5Q
9CB
U5
Q9X
781
Myc
obac
teri
umtu
berc
ulos
isP
0A55
4P
6401
2P
9686
4P
6517
8P
6518
3O
3335
0P
0A5I
0,P
0A5I
2P
7200
2N
eiss
eria
gono
rrho
eae
(str
ain
AT
CC
7008
25/
FA10
90)
Q5F
AI2
Q5F
5X0
Q5F
829
Q5F
9F6
Q5F
830
Q5F
913
Q5F
AF2
Nei
sser
iam
enin
gitide
s(s
erog
roup
A)
Q9J
W13
Q9J
X33
Q9J
TM
3Q
9JU
X8
Q9J
TM
4Q
9JU
34P
6519
1
Nei
sser
iam
enin
gitide
s(s
erog
roup
B)
Q9J
XV
7Q
9K1G
8Q
9JY
M4
Q9J
ZW
4Q
9JY
M5
Q9J
Z40
P65
192
Salm
onel
laty
phi
Q8Z
8X3
Q8Z
9A6
Q8Z
471
Q8Z
699
Q8Z
472
P58
670
P58
678
Q8Z
3X9
Salm
onel
laty
phim
uriu
mQ
8ZR
D1
Q8Z
RP
3Q
8ZM
F6
P30
753
Q8Z
MF7
P58
671
P58
679
Q8Z
M82
Tox
opla
sma
gond
iiQ
1JSN
4Tre
pone
ma
palli
dum
O83
796
O83
610
O83
525
O83
386
O83
525
O83
460
O83
558
Vib
rio
chol
erae
Q9K
TL3
Q9K
PV
8Q
9KU
J2Q
9KQ
23Q
9KU
J1Q
9KT
X1
Q9K
U44
Yer
sini
ape
stis
Q8Z
C45
Q8Z
H62
Q8Z
BP
6Q
8ZE
Y1
Q8Z
BP
7P
5867
2P
5868
0
Tab
le6.
3:Sw
issP
rot
acce
ssio
nco
des
ofa
few
impor
tant
pat
hog
enic
orga
nis
ms
hos
ting
the
ME
Ppat
hw
ayar
ech
osen
for
the
anal
ysi
s.
149
6.1. APPROACH AND METHODSCHAPTER 6. ANALYSIS OF THE MEP PATHWAY AND APICOPLAST
PROTEINS USING TAPAS
Target score
A target score was predicted for rating each sequence based on the presence
or absence of certain parameters. The scoring scheme is shown in Figure 6.3.
Weighting different parameters appropriately based on their importance and the
value they add to the final outcome is a significant factor in scoring and as simple
a scheme as possible was chosen. Here I discuss the rationale behind weighting
different factors differently.
1. Structure — This is clearly necessary for SBDD. Thus a protein is given a
score of +3, if its structure is known. If the structure is not known, then it
is important to check whether it is a transmembrane protein. In order to
determine whether or not the structure could be solved with relative ease.
If the protein is not a transmembrane protein, then it is assigned a score of
+2 because there is higher possibility that the structure could be solved. If
the protein is a transmembrane protein, then there are two scenarios:
(a) Signal Anchor — Although signal anchor proteins are transmembrane
proteins, the N-terminal signal anchor region is the only part of the
protein that is buried in a membrane. The rest of the protein can
be easily cleaved from the signal anchor region which enhances the
possibility of solving its structure. Thus such proteins are also assigned
a score of +2.
(b) Not a signal anchor — Being a transmembrane protein and not just
a signal anchor diminishes the possibility of solving its structure and
therefore it is assigned a score of +1, also considering the fact that
approximately 50% of successful drugs are targeted against membrane
150

6.1. APPROACH AND METHODSCHAPTER 6. ANALYSIS OF THE MEP PATHWAY AND APICOPLAST
PROTEINS USING TAPAS
proteins (Elofsson and Heijne, 2007; Terstappen and Reggiani, 2001;
Flower, 1999; Gudermann et al., 1995).
2. Human homologue — While designing an antimicrobial drug, not having
a human homologue for the protein being tested as a drug target is highly
desirable because it reduces the chances of any possible cross reactivity and
hence it is assigned a score of +2. If the protein has a human homologue,
then it is given a score of 0. Although it is not desirable to have a human
homologue, it cannot be ruled out from being a good drug target (instead
the drug molecule will require precise selectivity).
3. Ligand or EC — Having a known ligand is an advantage either in unbound
form, or preferably, in bound form such that precise interactions can be
observed. Having both bound and unbound structures allows flexibility of
the binding site to be examined. While having an EC number indicates
that the protein is an enzyme, here it mainly serves in identifying known
ligands of proteins with similar EC numbers. Therefore, a protein having a
known ligand or an EC number is given a score of +1 and proteins without
these details is are given a score of 0.
The target score ranges from 1 to 6 where a target score of 6 denotes a
prediction that the protein will be an excellent target to be taken forward for
more detailed structural analysis for SBDD. Any score above 3 indicates that
the protein is a potential drug target for SBDD. In fact, many sequences whose
scores are 3 or below could also be good drug targets in reality, but may not
be currently suitable for SBDD because the structure is not yet available. Some
commercially available drugs act on targets that are generally regarded as non-
151

6.1. APPROACH AND METHODSCHAPTER 6. ANALYSIS OF THE MEP PATHWAY AND APICOPLAST
PROTEINS USING TAPAS
Figure 6.3: Scoring scheme for the target score. TM — transmembrane, SA— Signal Anchor, EC — Enzyme commission number, and SBDD — StructureBased Drug Design
152

6.2. RESULTS AND DISCUSSIONCHAPTER 6. ANALYSIS OF THE MEP PATHWAY AND APICOPLAST
PROTEINS USING TAPAS
druggable (Owens, 2007). So, it should be noted that the target score is only
appropriate for ranking of a protein’s suitability for further analysis for SBDD
at the sequence level (not at the structure level). The pipeline does not predict
druggability of a protein.
6.2 Results and Discussion
Most of the results were provided in the form of HTML tables with click-able links
to obtain additional relevant data. These results and sequences are all shown on
the CD provided with this thesis. A ‘README’ file on the CD describes the
location of various files, sequence numbers used in the following discussion and
additional details.
6.2.1 Analysis of the output
The analysis of TAPAS output includes the quantitative analysis of the number
of sequences that could be placed in a particular category such as those having
human hits, enzyme hits, structure hits, ligand hits, and transmembrane regions.
An extract of the quantitative analysis page for the apicoplast sequences is
shown in Figure 6.4. 52% of the 544 apicoplast proteins have human homologues
according to TAPAS. Although having human hits is not desirable, a protein can
still be a potential drug target. For example, IDI is also present in humans, but
still considered as an attractive drug target for designing novel drugs as described
in Section 1.1.1 (Steinbacher et al., 2003b).
49% of the 544 apicoplast proteins were predicted to be transmembrane pro-
teins. This large proportion could be explained by the presence of 4 membranes
153

6.2. RESULTS AND DISCUSSIONCHAPTER 6. ANALYSIS OF THE MEP PATHWAY AND APICOPLAST
PROTEINS USING TAPAS
Figure 6.4: Quantitative analysis of the TAPAS output for apicoplast sequences.
(owing to secondary endosymbiosis) in an apicoplast which might be hosting these
proteins and by the possibility of a few unpredicted signal peptides. In fact, a
careful review of the output from SignalP revealed that some of these proteins
were predicted to be ‘signal anchor proteins’ which have uncleaved signal peptides
that traverse the membrane once and are considered as valid transmembrane pro-
teins (Gomi and Mitaku, 1999; Wahlberg and Spiess, 1997; High et al., 1991)
(Figure 6.5). Prediction of a transmembrane region in a protein is seen as a neg-
ative trait when predicting the suitability for SBDD (unless it is a signal anchor
which could easily be cleared off) because the structure of these proteins cannot
normally be solved. However, these extra-cellular domains may be cleaved and
their structures solved in isolation. While membrane bound proteins are not nor-
mally suitable for SBDD, it remains true that approximately 50% of successful
drug targets are transmembrane proteins (Elofsson and Heijne, 2007; Terstappen
and Reggiani, 2001; Flower, 1999; Gudermann et al., 1995).
Quantitative analysis and target scores of MEP proteins of Corynebacterium
154

6.2. RESULTS AND DISCUSSIONCHAPTER 6. ANALYSIS OF THE MEP PATHWAY AND APICOPLAST
PROTEINS USING TAPAS
Figure 6.5: a. Preprotein or membrane protein synthesis starts on a free ribosomein the cytosol. The signal-recognition particle (SRP) complex binds to the signalor signal-anchor sequence, which is exposed from the ribosome tunnel exit afterapproximately 70 amino acids have been synthesized. b. The ribosome nascentchain-SRP complex is subsequently targeted to the protein-conducting channel(PCC) of the Sec translocase by the membrane bound receptor FtsY (or SR inmammals). c. The SRP-FtsY interaction increases the GTP-binding affinity ofboth proteins, and subsequent GTP binding releases the signal sequence from itsassociation with the SRP, after which the large subunit of the ribosome docksonto the PCC. The signal or signal-anchor sequence opens the PCC in conjunctionwith the ribosome and initiates the translocation or membrane insertion event.d. Hydrolysis of GTP dissociates the SRP-FtsY complex and recycles the SRPinto the cytosol for another round of ribosome membrane targeting. (Figureand caption reproduced from http://www.nature.com/nrmicro/journal/v4/
n7/images/nrmicro1440-f3.jpg.)
155

6.2. RESULTS AND DISCUSSIONCHAPTER 6. ANALYSIS OF THE MEP PATHWAY AND APICOPLAST
PROTEINS USING TAPAS
Target Score Number of se-quences
Sequence numbers
6 36 1, 2 ,3 ,6 , 31 , 32 , 33 , 37, 38, 45, 49, 55, 58, 63, 65, 71, 73, 77, 84, 87,89, 134, 153, 182, 219, 308, 337, 356, 423, 430, 443, 478, 485, 503, 513,514
5 36 4, 8, 9, 43, 56, 59, 62, 74, 99, 104, 189, 194, 196, 198, 221, 228, 235,310, 324, 332, 365, 366, 379, 389, 403, 406, 407, 410, 426, 452, 470, 472,512, 516, 518, 521
4 243 7, 11, 13, 14, 15, 16, 17, 18, 21, 22, 23, 24, 25, 27, 28, 29, 30, 36, 39,41, 42, 48, 50, 57, 64, 69, 72, 75, 78, 80, 81, 82, 83, 85, 88, 93, 94, 96,98, 101, 106, 107, 113, 116, 118, 123, 124, 128, 130, 131, 132, 137, 138,139, 141, 142, 143, 144, 145, 146, 150, 151, 152, 154, 156, 157, 158, 159,160, 161, 163, 165, 167, 168, 171, 172, 173, 179, 180, 183, 186, 187, 192,197, 199, 200, 201, 202, 204, 205, 207, 208, 211, 212, 213, 214, 215, 218,223, 226, 227, 229, 233, 234, 237, 238, 241, 242, 244, 246, 249, 250, 251,255, 256, 257, 260, 261, 263, 264, 268, 270, 272, 273, 274, 275, 279, 280,282, 284, 285, 289, 290, 292, 293, 294, 296, 298, 299, 300, 306, 307, 309,311, 313, 314, 316, 319, 323, 325, 327, 328, 329, 330, 331, 333, 335, 338,341, 343, 345, 347, 348, 349, 351, 352, 353, 355, 358, 362, 364, 367, 369,372, 373, 376, 378, 385, 386, 390, 392, 394, 397, 400, 401, 402, 404, 405,408, 409, 414, 417, 420, 421, 422, 425, 429, 431, 434, 441, 444, 445, 447,449, 450, 451, 453, 455, 458, 460, 464, 466, 468, 471, 473, 474, 477, 479,480, 493, 494, 495, 498, 499, 500, 502, 504, 506, 507, 508, 509, 519, 520,525, 529, 531, 534, 535, 536, 537, 539, 540, 543
3 130 5, 10, 12, 19, 20, 26, 44, 47, 53, 54, 67, 70, 91, 92, 103, 105, 109, 111,112, 115, 120, 121, 122, 125, 129, 133, 140, 147, 148, 155, 162, 164, 166,174, 175, 177, 178, 184, 188, 190, 191, 193, 195, 203, 220, 230, 231, 232,240, 243, 245, 252, 258, 259, 262, 265, 266, 267, 271, 276, 277, 278, 281,286, 288, 295, 297, 301, 304, 312, 317, 318, 320, 322, 336, 339, 344, 354,359, 360, 361, 368, 370, 371, 374, 375, 383, 387, 393, 395, 396, 398, 399,412, 416, 424, 427, 428, 435, 436, 437, 438, 446, 459, 461, 465, 475, 476,482, 483, 484, 486, 487, 488, 489, 490, 496, 497, 501, 511, 515, 517, 522,523, 526, 527, 532, 533, 538, 541, 542, 544
2 80 34, 35, 40, 46, 51, 52, 60, 61, 66, 68, 76, 79, 86, 90, 95, 97, 108, 110,114, 117, 119, 126, 135, 136, 149, 170, 176, 185, 206, 209, 210, 217, 222,224, 225, 236, 239, 247, 248, 253, 254, 283, 287, 291, 302, 303, 305, 315,321, 326, 334, 342, 350, 357, 377, 380, 381, 384, 388, 391, 413, 415, 432,439, 440, 442, 448, 454, 456, 457, 462, 463, 467, 469, 481, 492, 505, 510,524, 530
1 19 100, 102, 127, 169, 181, 216, 269, 340, 346, 363, 382, 411, 418, 419, 433,491, 528
Table 6.4: Target scores, number of sequences, and sequence numbers of api-coplast proteins that fall into a particular scoring zone.
diphtheriae are shown in Figure 6.6 as an example of the output for MEP se-
quences.
Sample extracts of the HTML table containing the SBDD target scores for
each apicoplast sequence output from TAPAS are shown in Figure 6.7.
A sample HTML table that shows the number of apicoplast sequences that
fall into high and low SBDD target scoring zones is shown in Figure 6.8.
The number of apicoplast sequences that fell into a particular scoring zone of
the target score is shown in Figure 6.9. Among the 544 apicoplast sequences, 315
(58%) were predicted to be potential drug targets for SBDD based on target scores
being high (Table 6.4). With increased availability of structural information,
156

6.2. RESULTS AND DISCUSSIONCHAPTER 6. ANALYSIS OF THE MEP PATHWAY AND APICOPLAST
PROTEINS USING TAPAS
Figure 6.6: Quantitative analysis of the TAPAS output for Corynebacteriumdiphtheriae sequences.
157

6.2. RESULTS AND DISCUSSIONCHAPTER 6. ANALYSIS OF THE MEP PATHWAY AND APICOPLAST
PROTEINS USING TAPAS
Figure 6.7: An extract showing the target score predicted for each apicoplastsequence based on the TAPAS output (figure was edited to accommodate a widerange of target scores — 1-6).
158

6.2. RESULTS AND DISCUSSIONCHAPTER 6. ANALYSIS OF THE MEP PATHWAY AND APICOPLAST
PROTEINS USING TAPAS
Figure 6.8: An extract showing the number of apicoplast sequences that fall intohigh and low scoring zones for SBDD.
more sequences (especially those with a score of 3) will obtain better scores and
thereby move into the potential drug target zone. This higher proportion of drug
targets could be attributed to the supposed occurrence of many vital pathways
in the apicoplast and also the fact that it is not the percentage of drug targets
in the whole organism (Plasmodium falciparum), but that of a vital organelle.
However, out of the 544 sequences, only 36 (6.6%) were given the highest rank (6
out of 6) and further 36 (6.6%) were given the second highest rank (5 out of 6)
(Figure 6.8) because of the distribution of 58% of targets as a result of ranking.
These are the sequences which should be taken forward for detailed structural
studies immediately. As such, this project deals with druggability for SBDD at a
basic stage which is mainly useful for concentrating on some proteins from a large
set of unannotated/hypothetical proteins and this percentage is bound to reduce
after carrying out extensive structural studies through lack of binding affinity.
Here, I present a review of 13 randomly chosen proteins from the 36 that
159

6.2. RESULTS AND DISCUSSIONCHAPTER 6. ANALYSIS OF THE MEP PATHWAY AND APICOPLAST
PROTEINS USING TAPAS
Figure 6.9: Target scores and the number of sequences of apicoplast that fall intoa particular scoring zone.
160

6.2. RESULTS AND DISCUSSIONCHAPTER 6. ANALYSIS OF THE MEP PATHWAY AND APICOPLAST
PROTEINS USING TAPAS
were given a SBDD target score of 6 out of 6. 12 of the 13 reviewed are
excellent proven drug targets with known drugs or inhibitors (Table 6.5).
The remaining protein is a hypothetical protein which is probably a tRNA
nucleotidyltransferase (EC number: 2.7.7.25) based on the output from BLAST.
A BLAST hit ‘XP 727593’ (E-value: 0) is a tRNA nucleotidyltransferase
mitochondrial precursor from Plasmodium yoelii yoelii str. 17XNL and the best
structure hit ‘PDB: 1VFG’ (E-value: 2e − 08) is a tRNA nucleotidyltransferase
from Aquifex aeolicus. Currently, there are no known drugs or inhibitors
for this protein, but it has a known ligand ‘Diphosphomethylphosphonic
Acid Adenosyl Ester’ (HETNAM=APC, PDB: 1VFG (Tomita et al., 2004)).
Following a link (http://bioinformatics.charite.de/superligands/
drug_similarity.php?hetero=APC) for drug similarity on the RCSB site
(http://www.rcsb.org/pdb/explore/explore.do?structureId=1VFG), lead
to a webpage showing the top 30 drug structures most similar in 2 dimensions
to APC which include drugs like Fludarabine, Bucladesine, Cobamamide (all of
these have > 80% 2D similarity). These could be potential lead compounds for
designing drugs to act on Sequence 356.
A review of other sequences with positive scores revealed that 8 sequences
scored 5 out of 6 because of not having a known ligand. Having a known structure,
these proteins could be potential drug targets for SBDD and virtual screening
(Nicola et al., 2007). Similarly, 28 sequences scored 5 out of 6 for not having
either structure or ligand (but have an EC number). Crystallographers and NMR
spectroscopists can concentrate on these proteins for solving their structure. The
sequence numbers for these proteins are shown in Table 6.6.
With the increase in structural information, computational techniques like
161

6.3. SUMMARYCHAPTER 6. ANALYSIS OF THE MEP PATHWAY AND APICOPLAST
PROTEINS USING TAPAS
SBDD, virtual screening, and chemical library design and screening are becoming
more popular to cut down cost and time in the drug discovery process (Fauman
et al., 2003). Even HTS is expensive because of staffing and compound stock
depletion. Recently such techniques have been used on many P. falciparum se-
quences with available structural information as a result of structures recently
solved through X-ray crystallography (Nicola et al., 2007; Mehlin, 2005). Even
when there are no X-ray crystallographic structures available, alternate compu-
tational techniques like comparative modelling are being used where possible, to
help in the drug discovery process (Singh et al., 2006a). Currently, there are only
very few P. falciparum proteins with known structures (Mehlin, 2005), but many
of them have bacterial homologues with known structures which provides a great
opportunity to model the structures of these proteins to look at the differences in
interspecies selectivity (binding affinity) and to use them in the drug discovery
process.
6.3 Summary
Among the 544 apicoplast protein sequences 58% (160 sequences) were predicted
as potential drug targets for SBDD. These are the sequences with high (> 3)
SBDD target scores. However, out of the 544 sequences, only 36 (6.6%) were
given the highest rank (6 out of 6) and further 36 (6.6%) were given the second
highest rank (5 out of 6) because of the distribution of 58% of targets as a result of
ranking. This percentage is bound to increase with the availability of more struc-
tural data and bound to decrease after carrying out detailed structural studies
(because of lack of binding affinity). 52% of the apicoplast sequences were found
to have human homologues which is not desirable, although a protein can still
162
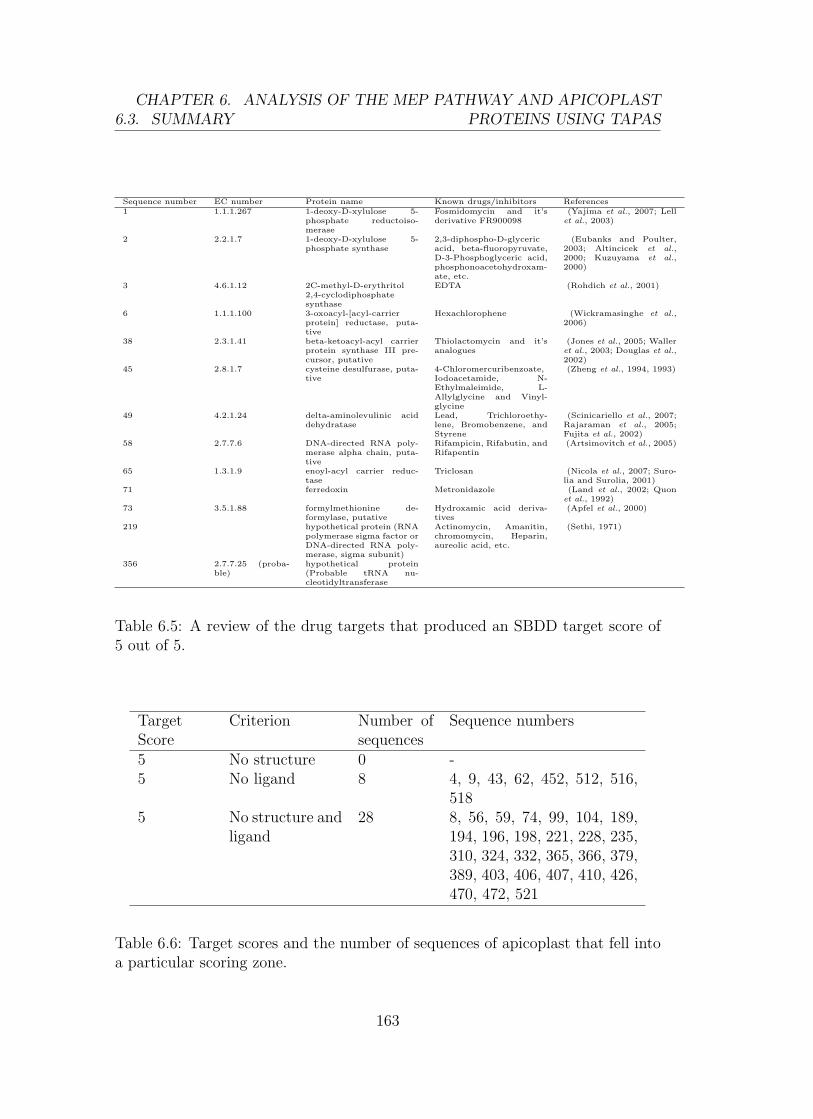
6.3. SUMMARYCHAPTER 6. ANALYSIS OF THE MEP PATHWAY AND APICOPLAST
PROTEINS USING TAPAS
Sequence number EC number Protein name Known drugs/inhibitors References1 1.1.1.267 1-deoxy-D-xylulose 5-
phosphate reductoiso-merase
Fosmidomycin and it’sderivative FR900098
(Yajima et al., 2007; Lellet al., 2003)
2 2.2.1.7 1-deoxy-D-xylulose 5-phosphate synthase
2,3-diphospho-D-glycericacid, beta-fluoropyruvate,D-3-Phosphoglyceric acid,phosphonoacetohydroxam-ate, etc.
(Eubanks and Poulter,2003; Altincicek et al.,2000; Kuzuyama et al.,2000)
3 4.6.1.12 2C-methyl-D-erythritol2,4-cyclodiphosphatesynthase
EDTA (Rohdich et al., 2001)
6 1.1.1.100 3-oxoacyl-[acyl-carrierprotein] reductase, puta-tive
Hexachlorophene (Wickramasinghe et al.,2006)
38 2.3.1.41 beta-ketoacyl-acyl carrierprotein synthase III pre-cursor, putative
Thiolactomycin and it’sanalogues
(Jones et al., 2005; Walleret al., 2003; Douglas et al.,2002)
45 2.8.1.7 cysteine desulfurase, puta-tive
4-Chloromercuribenzoate,Iodoacetamide, N-Ethylmaleimide, L-Allylglycine and Vinyl-glycine
(Zheng et al., 1994, 1993)
49 4.2.1.24 delta-aminolevulinic aciddehydratase
Lead, Trichloroethy-lene, Bromobenzene, andStyrene
(Scinicariello et al., 2007;Rajaraman et al., 2005;Fujita et al., 2002)
58 2.7.7.6 DNA-directed RNA poly-merase alpha chain, puta-tive
Rifampicin, Rifabutin, andRifapentin
(Artsimovitch et al., 2005)
65 1.3.1.9 enoyl-acyl carrier reduc-tase
Triclosan (Nicola et al., 2007; Suro-lia and Surolia, 2001)
71 ferredoxin Metronidazole (Land et al., 2002; Quonet al., 1992)
73 3.5.1.88 formylmethionine de-formylase, putative
Hydroxamic acid deriva-tives
(Apfel et al., 2000)
219 hypothetical protein (RNApolymerase sigma factor orDNA-directed RNA poly-merase, sigma subunit)
Actinomycin, Amanitin,chromomycin, Heparin,aureolic acid, etc.
(Sethi, 1971)
356 2.7.7.25 (proba-ble)
hypothetical protein(Probable tRNA nu-cleotidyltransferase
Table 6.5: A review of the drug targets that produced an SBDD target score of5 out of 5.
TargetScore
Criterion Number ofsequences
Sequence numbers
5 No structure 0 -5 No ligand 8 4, 9, 43, 62, 452, 512, 516,
5185 No structure and
ligand28 8, 56, 59, 74, 99, 104, 189,
194, 196, 198, 221, 228, 235,310, 324, 332, 365, 366, 379,389, 403, 406, 407, 410, 426,470, 472, 521
Table 6.6: Target scores and the number of sequences of apicoplast that fell intoa particular scoring zone.
163

6.3. SUMMARYCHAPTER 6. ANALYSIS OF THE MEP PATHWAY AND APICOPLAST
PROTEINS USING TAPAS
be a good drug target taking other factors into consideration such as exploiting
the differences in interspecies selectivity. 49% of the apicoplast sequences were
predicted to have transmembrane regions which is generally not good for SBDD
because it is difficult to obtain structural data (except signal anchor proteins
whose signal region can be cleaved to determine structure of rest of the protein).
12 out of the 13 (reviewed) proteins whose SBDD target score was 6 out of 6 are
well established drug targets having known drugs or inhibitors while the remain-
ing protein is a hypothetical protein thought to be a tRNA nucleotidyltransferase
based on results from BLAST. There are no known drugs or inhibitors available
for this enzyme, but there is a known ligand ‘Diphosphomethylphosphonic Acid
Adenosyl Ester’ which has many drug hits with more than 80% 2D similarity. 8
sequences scored 5 out of 6 for not having a known ligand. These proteins could
be potential drug targets for techniques such as SBDD and virtual screening be-
cause they have a known 3D structure. 28 sequences scored 5 out of 6 for not
having both structure and ligand. Crystallographers and NMR spectroscopists
can try to solve the 3D structure of these proteins.
6.3.1 Evaluation of performance of TAPAS ranking
scheme
Ideally, one would have liked to evaluate the performance of TAPAS in ranking
drug targets. However, it is virtually impossible to evaluate the performance
in any realistic way because, while it is relatively straightforward to obtain se-
quences of known drug targets, it is virtually impossible to obtain sequences of
failed drug targets and the reasons for failing. Even if such data were available,
the reasons for failure may not be inherent in the target itself but in the drugs
164

6.3. SUMMARYCHAPTER 6. ANALYSIS OF THE MEP PATHWAY AND APICOPLAST
PROTEINS USING TAPAS
that were tested. Thus, even if one had collaborated with laboratories such as
Structural Proteomics of Rational Targets (SPoRT — a UK Biotechnology and
Biological Sciences Research Council (BBSRC) initiative), or the Office of Can-
cer Genomics (OCG — http://ocg.cancer.gov/), and obtained sequences that
were not successful, a good negative dataset would not have been obtained since a
protein cannot be classified as a “bad” target just because one or two laboratories
have not succeeded. Thus, TAPAS is simply trying to define sequences which are
worth exploring rather than trying to predict whether SBDD will be successful
i.e., it is identifying the characteristics of a target in terms of its suitability rather
than trying to predict a successful out come.
Test sets such as those used by Macchiarulo et al. (2004) and Glaser et al.
(2006) are all suitable for extensive structural studies of proteins but would not
be suitable for evaluating the performance of TAPAS. They could only test that
the program is functioning correctly (rather than any evaluation of performance)
but this is already tested by studying sequences of the MEP pathway and the
apicoplast. The method is not looking at extensive structural details of proteins
in order to define potential ligand binding sites. It is simple ranking targets in
view of their biological role rather than specific drug design criteria. This would
be the next stage in the process — having selected biologically sensible targets,
one would go on to examine their suitability for ligand design.
165

Chapter 7
Conclusions
The aim of this project was to automate the process of protein annotation further
leading to preliminary evaluation of a set of protein sequences for SBDD. This will
enable us to concentrate on highly ranked protein sequences in order to further our
knowledge of druggability with the help of detailed structural studies. Proteins of
the MEP pathway and the apicoplast were chosen for the analysis because they
are of interest to the pharmaceutical sector and the scientific community.
The MEP pathway of isoprenoid biosynthesis is totally absent in humans,
but present in many pathogens such as Plasmodium falciparum, Mycobacterium
tuberculosis, Yersinia pestis, Vibrio cholerae, and Treponema pallidum. The MEP
pathway is indispensable in these organisms which makes it a potential drug
target.
The apicoplast is a unique organelle that occurs in apicomplexan protists and
hosts approximately 500 nuclear-encoded proteins including proteins of the MEP
pathway and the fatty acid biosynthesis pathway. The apicoplast is essential
for the survival of apicomplexans which include pathogens such as Plasmodium
falciparum and Toxoplasma gondii. Their absence in humans coupled with their
166

7.1. AUTOMATION OF ANNOTATION CHAPTER 7. CONCLUSIONS
necessity for the survival of these pathogens, makes proteins of the apicoplast
potentially suitable drug targets.
7.1 Automation of annotation
After a review of various bioinformatics tools for mass protein sequence analysis,
I concluded that none of these tools was ideal for my project. This resulted
in the development of APAT and TAPAS. APAT was designed to execute many
tools, where the tools were not serially dependent on the output from other tools,
whereas TAPAS was a specialized pipeline for ranking targets for SBDD where
the output from one tool would be the input for another.
7.1.1 Development of APAT
The output produced by a variety of annotation tools was analyzed and it was
determined that all the annotations can be expressed in one of four ways (per-
residue numbers, per-residue strings, per-domain values, per-sequence values).
Based on this analysis, the input and output of the APAT system was stan-
dardized using XML. The output XML format, was designed to accommodate
annotations provided by any prediction server. A display tool and wrappers to
a number of annotation/prediction tools running both locally and remotely were
designed based on this XML format. The choice of tools is left for users to decide
according to their needs.
The APAT system is designed to be downloaded and run locally allowing the
user automatically to execute many annotation tools on one or more sequences.
Comparative analysis was made straightforward by presenting results in a uni-
167

7.1. AUTOMATION OF ANNOTATION CHAPTER 7. CONCLUSIONS
form manner. Users can easily choose the annotation wrappers they wish to
execute and additional wrappers could be easily written using existing wrappers
as examples or alternately, they may want to write a simple wrapper to web-
services provided by Taverna (Oinn et al., 2004) or EBI (Labarga et al., 2007)
in which case the wrapper will handle the XML output so that it fits into the
specified DTD to utilize the display program. The XML output can be directly
used for post analysis tasks without using the display program (e.g. the XML
output was further processed and used in the work to improve transmembrane
protein prediction by combined neural network predictor). The HTML display
could be improved in future by having a better choice of graph plotting. Other
future developments to the display tool could be — a) to show all the annotations
together on the sequence in order to have a holistic picture, b) to provide a direct
comparison between similar tools, c) to provide a final summary (and sugges-
tions) of output from various tools for each sequence. Possible enhancements to
the software to deal with non-responsive servers instead of just reporting their
status would also be useful. Allowing multiple sequence alignment to be provided
as input and handling servers which require details such as sequence alignments
as input will be another useful enhancement. Similarly, improving APAT to deal
with servers which return complex data such as 3D models from comparative
modelling would be an advantage.
Source code for all the programs, the DTD for input and output, a detailed
description of the DTD, and a guide to implementing service wrappers were made
available for download at http://www.bioinf.org.uk/apat/.
At the time of writing (June 2008), APAT had been downloaded by >600
users illustrating the value of a system of this type. Frishman (2007) in his
168

7.1. AUTOMATION OF ANNOTATION CHAPTER 7. CONCLUSIONS
review of protein annotation on a genomic scale has written about tools such as
APAT having the advantage of being highly configurable and flexible.
7.1.2 Development of TAPAS
TAPAS is designed to score a set of protein sequences on the basis of suitability for
SBDD (at the sequence level devoid of detailed structural studies) by subjecting
them to various tasks such as database searches, and annotation and prediction
tools. Here, the output from one tool is treated as the input for another and
decisions about what tools are run are made on the basis of the output of pre-
ceding tools. Additional annotations were obtained from APAT (integrated as a
standalone tool).
During the process of annotation, TAPAS looks at some characteristics of
a protein which are crucial to providing insight into the ability of a protein to
be rated as a potential target for SBDD. These are the presence of human hits,
enzyme hits, structure hits, ligand hits, and transmembrane regions. In addition
to these, further details about protein sequences such as their association with
KEGG pathway maps, and output from BLAST and APAT were presented in
the form of an HTML table with hyperlinks to other data sources for additional
information.
TAPAS is useful and suitable for executing on a set of protein sequences (es-
pecially hypothetical or unannotated) that belong to a particular pathway, an
organelle or an organism. The resulting ranking of targets was supported by the
fact that 12 of 13 reviewed top-ranked proteins are already being exploited as
drug targets. Possible enhancements for TAPAS could include using a relational
database for storing and managing results (instead of the current file-based sys-
169

7.1. AUTOMATION OF ANNOTATION CHAPTER 7. CONCLUSIONS
tem), improving the scoring scheme by adding additional features (at the sequence
level) and altering weights to certain parameters (based on additional knowledge
gained) and including additional factors (at the structure level) such as knowledge
about clefts, active site interactions, and binding affinity. When these extensive
structural details are included in TAPAS, the other possible enhancements could
include integration of automatic comparative modelling (to obtain 3D models of
a protein structure), virtual screening (to obtain some potential lead molecules),
and docking modules (to examine the binding affinity). Another useful enhance-
ment could be integration of protein function prediction (by including tools such
as ProFunc (Laskowski et al., 2005)). Improving the ranking scheme and perform-
ing a review of highly ranked sequences through methods such as text mining, or
data mining may also be an advantage.
The ranking scheme of TAPAS, which is currently suitable for handling mi-
crobial sequences, could be used for other higher organisms by making slight
modifications to the weights attached to various factors.
It would be interesting to try to perform the same analysis using Taverna
and/or ICENI (both described in Chapter 2) to compare the performance and
flexibility in implementing and extending the pipelines.
7.1.3 Improving prediction of transmembrane proteins
Prediction of transmembrane regions in a protein was one of the most important
annotations applied by APAT and TAPAS. In an effort to improve transmem-
brane predictions, a combined neural network predictor was developed. This
combined predictor used the output from three of the best transmembrane pre-
dictors that are currently available — TMHMM (Krogh et al., 2001), MEMSAT
170

7.1. AUTOMATION OF ANNOTATION CHAPTER 7. CONCLUSIONS
(Jones et al., 1994), and DAS-TMfilter (Cserzo et al., 2004). Performance of
the combined predictor was evaluated at both the residue level and the whole
protein level and was compared with the individual predictors used. The effect
of masking signal peptide residues as predicted by SignalP was also evaluated.
APAT was used for running all these tools and the XML output from APAT was
used for as input post-processing.
Residue level
Among the three individual predictors used, TMHMM performed best with an
MCC of 0.796. Optimum performance of the combined predictor was achieved
with an un-masked and unnormalized combined predictor, giving an MCC of
0.803 using a prediction threshold of 0.5 and a hidden layer size of 5. Thus,
combining the output of the 3 best predictors only marginally improved perfor-
mance compared with TMHMM used alone. While DAS-TMfilter alone was the
worst predictor, it did enhance the quality of the combined prediction. Surpris-
ingly, masking with SignalP reduced the performance of the combined predictor
(MCC=0.787).
Whole protein level
In the case of selecting targets for SBDD, one simply wishes to know whether a
protein has transmembrane regions. Whole protein level predictions were made
based on residue level predictions by examining the total number of transmem-
brane residues predicted, the length of the longest transmembrane segment, and
the average length of a transmembrane segment. The best combined predictor
at the residue level was used and compared with the best individual predictor
171

7.1. AUTOMATION OF ANNOTATION CHAPTER 7. CONCLUSIONS
(TMHMM). The best performance of the combined predictor (MCC=0.708) was
obtained using a threshold of 22 residues for the longest transmembrane region.
This value is clearly worse than the performance value at the residue-level. Man-
ual examination revealed that the worse performance is caused by signal peptides.
This led to masking signal peptide residues at the whole protein level. For the
masked and un-normalized combined predictor, the best performance, with an
MCC of 0.762, was obtained using a threshold of ≥18 residues for the longest
transmembrane region.
The performance of the best individual predictor (TMHMM), before and after
masking was assessed at the protein level. The best MCC of 0.762 was obtained
after masking (longest transmembrane segment ≥18 residues) compared with an
MCC of 0.693 unmasked (longest transmembrane segment or the total number of
transmembrane residues ≥18). Thus, it was concluded that at the whole protein
level, TMHMM masked by SignalP performs as well as the combined predictor.
The performance of the combined predictor is likely to improve as individual
prediction tools are enhanced. A new version of MEMSAT was recently released
and could be included in the analysis to assess the improvements made to the
combined predictor.
7.1.4 Analysis of the MEP pathway and apicoplast pro-
teins using TAPAS
Various methods developed earlier and described above were then applied to the
analysis of the proteins of the MEP pathway and the apicoplast. I decided to
look at the apicoplast from Plasmodium falciparum and MEP pathway proteins
from selected pathogens. Details of the origin of the sequence were required by
172

7.1. AUTOMATION OF ANNOTATION CHAPTER 7. CONCLUSIONS
some of the analysis tools run by APAT. Labelling for MEP pathway proteins
was achieved by looking at the taxonomical classification from the ‘OC’ lines
of the UniprotKB/SwissProt data file for each organism. As mentioned above,
transmembrane region prediction is one of the important annotations applied
by APAT and TAPAS. As masking signal peptide residues improved the trans-
membrane prediction at the whole protein level, the technique of signal masking
TMHMM predictions for predicting whether or not a protein is transmembrane
was employed in TAPAS. This used a threshold of ≥18 residues for the length of
the longest membrane spanning region.
The sequences of 544 apicoplast proteins from Plasmodium falciparum, kindly
supplied by Prof. Geoff McFadden ([email protected]), and the sequences of
the MEP pathway from selected pathogens, were analysed by TAPAS followed
by post analysis which included manual analysis of the final output. Post analy-
sis involved quantitative analysis and SBDD target score prediction for ranking
proteins. Quantitative analysis of the apicoplast output provided the percentage
of proteins that had human homologues (52%), enzyme hits (38%), 3D structure
hits (34%), ligand hits (24%), and transmembrane regions (49%). 58% of api-
coplast proteins were given a positive SBDD target score over a scale of 1 to 6.
However, out of the 544 sequences, only 36 (6.6%) were given the highest rank
(6 out of 6) and further 36 (6.6%) were given the second highest rank (5 out of
6) because of the distribution of 58% of targets as a result of ranking. 12 out of
13 (reviewed) top-ranked (6 out of 6) sequences were already being exploited as
drug targets while the remaining protein is a hypothetical protein thought to be
a tRNA nucleotidyltransferase based on output from BLAST. There is no known
drug or inhibitor associated with it. However ‘Diphosphomethylphosphonic Acid
173

7.2. SUMMARY CHAPTER 7. CONCLUSIONS
Adenosyl Ester’ is a known ligand which shows over 80% 2D similarity to a
number of drugs (http://bioinformatics.charite.de/superligands/drug_
similarity.php?hetero=APC).
There are 8 sequences which scored 5 out of 6 because they did not have a
known ligand. Having a solved structure, these could be potential drug targets
for SBDD, or virtual screening (Nicola et al., 2007). Similarly there are 28 se-
quences which scored 5 out of 6 because they neither have a known structure
nor a ligand. These are the proteins crystallographers and NMR spectroscopists
could concentrate on to solve their 3D structure. This ranking of proteins is
useful in guiding one to decide which proteins to focus on among a large set of
unannotated protein sequences.
Analysis of the MEP pathway and apicoplast proteins using TAPAS resulted
in some significant annotations and clues about suitability of each protein to be
a target for SBDD.
7.2 Summary
In summary, this project has been successful in achieving its primary aims. I have
developed a new tool (APAT) for automated application of a number of annota-
tion and prediction servers to one or more protein sequences. I have attempted
to improve transmembrane protein prediction using a combined neural network
predictor and found that masking the prediction values of signal peptide residues
would improve the predictions from TMHMM alone (the same performance is
achieved by the combined predictor). I have developed a specialized pipeline
(TAPAS), which makes use of APAT, for ranking potential targets for structure-
based drug design (SBDD). This has then been applied to protein sequences of
174

7.2. SUMMARY CHAPTER 7. CONCLUSIONS
the MEP pathway from a number of selected organisms and to proteins of the
apicoplast from Plasmodium falciparum. The results justified the ranking scheme
used in TAPAS, as 12 of the 13 (reviewed) top-ranked hits are already being ex-
ploited as drug targets. A number of other proteins, for which structures are
known, were suggested as potential targets and a further group of sequences were
suggested as novel targets which should be brought to the attention of protein
crystallographers and NMR spectroscopists.
175

Bibliography
Acharya, K. R., Sturrock, E. D., Riordan, J. F. and Ehlers, M. R. W. (2003) Ace
revisited: a new target for structure-based drug design, Nat Rev Drug Discov,
2, 891–902.
Adam, P., Hecht, S., Eisenreich, W., Kaiser, J., Grawert, T., Arigoni, D.,
Bacher, A. and Rohdich, F. (2002) Biosynthesis of terpenes: Studies on 1-
hydroxy-2-methyl-2-(E)-butenyl 4-diphosphate reductase, Proc Natl Acad Sci
U S A, 99, 12108–12113.
Agranoff, B. W., Eggerer, H., Henning, U. and Lynen, F. (1959) Isopentenol
pyrophosphate isomerase, J. Am. Chem. Soc., 81, 1254–1255.
Agranoff, B. W., Eggerer, H., Henning, U. and Lynen, F. (1960) Biosynthesis of
terpenes. VII. Isopentenyl pyrophosphate isomerase, J Biol Chem, 235, 326–
332.
Alderden, R. A., Hall, M. D. and Hambley, T. W. (2006) The discovery and
development of cisplatin, J. Chem. Educ., 83, 728–734.
Almond, J. and Snelling, D. (1998) Unicore: Secure and uniform access to dis-
tributed resources via the world wide web, white paper.
176

BIBLIOGRAPHY BIBLIOGRAPHY
Aloisio, G., Cafaro, M., Fiore, S. and Mirto, M. (2005) ProGenGrid: a grid-
enabled platform for bioinformatics, Stud Health Technol Inform, 112, 113–
126.
Altincicek, B., Hintz, M., Sanderbrand, S., Wiesner, J., Beck, E. and Jomaa, H.
(2000) Tools for discovery of inhibitors of the 1-deoxy-D-xylulose 5-phosphate
(DXP) synthase and DXP reductoisomerase: an approach with enzymes from
the pathogenic bacterium Pseudomonas aeruginosa, FEMS Microbiol Lett, 190,
329–333.
Altincicek, B., Duin, E. C., Reichenberg, A., Hedderich, R., Kollas, A.-K.,
Hintz, M., Wagner, S., Wiesner, J., Beck, E. and Jomaa, H. (2002) LytB pro-
tein catalyzes the terminal step of the 2-C-methyl-D-erythritol-4-phosphate
pathway of isoprenoid biosynthesis, FEBS Lett, 532, 437–440.
Altschul, S. F., Gish, W., Miller, W., Myers, E. W. and Lipman, D. J. (1990)
Basic local alignment search tool, J. Mol. Biol., 215, 403–410.
Altschul, S. F., Madden, T. L., Schaffer, A. A., Zhang, J., Zhang, Z., Miller, W.
and Lipman, D. J. (1997) Gapped BLAST and PSI-BLAST: a new generation
of protein database search programs, Nuc. Ac. Res., 25, 3389–3402.
An, J., Totrov, M. and Abagyan, R. (2004) Comprehensive identification of “drug-
gable” protein ligand binding sites, Genome Inform, 15, 31–41.
Anastasiadis, A. D., Magoulas, G. D. and Vrahatis, M. N., (2003). An effi-
cient improvement of the Rprop algorithm. http://www.dcs.bbk.ac.uk/$\
sim$aris/Camera\_ready\_ANNPR03\_final.pdf.
177

BIBLIOGRAPHY BIBLIOGRAPHY
Anderson, A. C. (2003) The process of structure-based drug design, Chem Biol,
10, 787–797.
Anderson, M. S., Muehlbacher, M., Street, I. P., Proffitt, J. and Poulter, C. D.
(1989) Isopentenyl diphosphate:dimethylallyl diphosphate isomerase. An im-
proved purification of the enzyme and isolation of the gene from Saccharomyces
cerevisiae, J Biol Chem, 264, 19169–19175.
Apfel, C., Banner, D. W., Bur, D., Dietz, M., Hirata, T., Hubschwerlen, C.,
Locher, H., Page, M. G., Pirson, W., Rosse, G. and Specklin, J. L. (2000)
Hydroxamic acid derivatives as potent peptide deformylase inhibitors and an-
tibacterial agents, J Med Chem, 43, 2324–2331.
Apweiler, R., Attwood, T. K., Bairoch, A., Bateman, A., Birney, E., Biswas, M.,
Bucher, P., Cerutti, L., Corpet, F., Croning, M. D., Durbin, R., Falquet, L.,
Fleischmann, W., Gouzy, J., Hermjakob, H., Hulo, N., Jonassen, I., Kahn, D.,
Kanapin, A., Karavidopoulou, Y., Lopez, R., Marx, B., Mulder, N. J.,
Oinn, T. M., Pagni, M., Servant, F., Sigrist, C. J. and Zdobnov, E. M. (2001)
The InterPro database, an integrated documentation resource for protein fam-
ilies, domains and functional sites, Nuc. Ac. Res., 29, 37–40.
Arai, M., Ikeda, M. and Shimizu, T. (2003) Comprehensive analysis of transmem-
brane topologies in prokaryotic genomes, Gene, 304, 77–86.
Arai, M., Mitsuke, H., Ikeda, M., Xia, J.-X., Kikuchi, T., Satake, M. and
Shimizu, T. (2004) ConPred II: a consensus prediction method for obtaining
transmembrane topology models with high reliability, Nucleic Acids Res, 32,
W390–W393.
178

BIBLIOGRAPHY BIBLIOGRAPHY
Arora, A., Abildgaard, F., Bushweller, J. H. and Tamm, L. K. (2001) Structure
of outer membrane protein A transmembrane domain by NMR spectroscopy,
Nat Struct Biol, 8, 334–338.
Artsimovitch, I., Vassylyeva, M. N., Svetlov, D., Svetlov, V., Perederina, A.,
Igarashi, N., Matsugaki, N., Wakatsuki, S., Tahirov, T. H. and Vassylyev, D. G.
(2005) Allosteric modulation of the RNA polymerase catalytic reaction is an
essential component of transcription control by rifamycins, Cell, 122, 351–363.
Ashburner, M., Ball, C. A., Blake, J. A., Botstein, D., Butler, H., Cherry, J. M.,
Davis, A. P., Dolinski, K., Dwight, S. S., Eppig, J. T., Harris, M. A., Hill, D. P.,
Issel-Tarver, L., Kasarskis, A., Lewis, S., Matese, J. C., Richardson, J. E.,
Ringwald, M., Rubin, G. M. and Sherlock, G. (2000) Gene ontology: tool for
the unification of biology. The Gene Ontology Consortium, Nature: Genetics,
25, 25–29.
Bach, T. J., Boronat, A., Campos, N., Ferrer, A. and Vollack, K. U. (1999)
Mevalonate biosynthesis in plants, Crit Rev Biochem Mol Biol, 34, 107–122.
Bagos, P. G., Liakopoulos, T. D. and Hamodrakas, S. J. (2005) Evaluation of
methods for predicting the topology of beta-barrel outer membrane proteins
and a consensus prediction method, BMC Bioinformatics, 6, 7–7.
Bagos, P. G., Liakopoulos, T. D., Spyropoulos, I. C. and Hamodrakas, S. J.
(2004a) A Hidden Markov Model method, capable of predicting and discrimi-
nating beta-barrel outer membrane proteins, BMC Bioinformatics, 5, 29–29.
Bagos, P. G., Liakopoulos, T. D., Spyropoulos, I. C. and Hamodrakas, S. J.
179

BIBLIOGRAPHY BIBLIOGRAPHY
(2004b) PRED-TMBB: a web server for predicting the topology of beta-barrel
outer membrane proteins, Nucleic Acids Res, 32, W400–W404.
Bairoch, A. (2000) The ENZYME database in 2000, Nucleic Acids Res, 28, 304–
305.
Bairoch, A. and Apweiler, R. (2000) The SWISS-PROT protein sequence
database and its supplement TrEMBL in 2000, Nuc. Ac. Res., 28, 45–48.
Baker, D. and Sali, A. (2001) Protein structure prediction and structural ge-
nomics, Science, 294, 93–96.
Bayes, T. (1763) An essay towards solving a problem in the doctrine of chances.,
Philosophical Transactions of the Royal Society, 53, 370–418.
Begley, M., Gahan, C. G. M., Kollas, A.-K., Hintz, M., Hill, C., Jomaa, H. and
Eberl, M. (2004) The interplay between classical and alternative isoprenoid
biosynthesis controls gammadelta T cell bioactivity of Listeria monocytogenes,
FEBS Lett, 561, 99–9104.
Belunis, C. J., Mdluli, K. E., Raetz, C. R. and Nano, F. E. (1992) A novel 3-deoxy-
D-manno-octulosonic acid transferase from Chlamydia trachomatis required for
expression of the genus-specific epitope, J Biol Chem, 267, 18702–18707.
Bender, A., van Dooren, G. G., Ralph, S. A., McFadden, G. I. and Schneider, G.
(2003) Properties and prediction of mitochondrial transit peptides from Plas-
modium falciparum, Mol Biochem Parasitol, 132, 59–66.
Bendtsen, J. D., Nielsen, H., von Heijne, G. and Brunak, S. (2004) Improved
prediction of signal peptides: SignalP 3.0, J Mol Biol, 340, 783–795.
180

BIBLIOGRAPHY BIBLIOGRAPHY
Benson, D. A., Karsch-Mizrachi, I., Lipman, D. J., Ostell, J. and Wheeler, D. L.
(2007) GenBank, Nucleic Acids Res, 35, D21–D25.
Berman, F., Chien, A., Cooper, K., Dongarra, J., Foster, I., Gannon, D., Johns-
son, L., Kennedy, K., Kesselman, C., Mellor-Crummey, J., Reed, D., Torc-
zon, L. and Wolski, R. (2001) The GrADS Project: Software support for
high-level Grid application development, The International Journal of High
Performance Computing Applications, 15, 327–344.
Berman, H. M., Westbrook, J., Feng, Z., Gilliland, G., Bhat, T. N., Weissig, H.,
Shindyalov, I. N. and Bourne, P. E. (2000) The Protein Data Bank, Nucleic
Acids Res, 28, 235–242.
Beytıa, E. D. and Porter, J. W. (1976) Biochemistry of polyisoprenoid biosyn-
thesis, Annu Rev Biochem, 45, 113–142.
Bigelow, H. and Rost, B. (2006) PROFtmb: a web server for predicting bacterial
transmembrane beta barrel proteins, Nucleic Acids Res, 34, W186–W188.
Binda, C., Newton-Vinson, P., Hubalek, F., Edmondson, D. E. and Mattevi, A.
(2002) Structure of human monoamine oxidase B, a drug target for the treat-
ment of neurological disorders, Nat Struct Biol, 9, 22–26.
Blom, N., Gammeltoft, S. and Brunak, S. (1999) Sequence and structure-based
prediction of eukaryotic protein phosphorylation sites, J. Mol. Biol., 294, 1351–
1362.
Boeckmann, B., Bairoch, A., Apweiler, R., Blatter, M.-C., Estreicher, A.,
Gasteiger, E., Martin, M. J., Michoud, K., O’Donovan, C., Phan, I., Pilbout, S.
181

BIBLIOGRAPHY BIBLIOGRAPHY
and Schneider, M. (2003) The SWISS-PROT protein knowledgebase and its
supplement TrEMBL in 2003, Nuc. Ac. Res., 31, 365–370.
Bonanno, J. B., Edo, C., Eswar, N., Pieper, U., Romanowski, M. J., Ilyin, V.,
Gerchman, S. E., Kycia, H., Studier, F. W., Sali, A. and Burley, S. K. (2001)
Structural genomics of enzymes involved in sterol/isoprenoid biosynthesis, Proc
Natl Acad Sci U S A, 98, 12896–12901.
Boucher, Y. and Doolittle, W. F. (2000) The role of lateral gene transfer in the
evolution of isoprenoid biosynthesis pathways, Mol Microbiol, 37, 703–716.
Bracey, M. H., Hanson, M. A., Masuda, K. R., Stevens, R. C. and Cravatt, B. F.
(2002) Structural adaptations in a membrane enzyme that terminates endo-
cannabinoid signaling, Science, 298, 1793–1796.
Breukink, E. (2006) A lesson in efficient killing from two-component lantibiotics,
Mol Microbiol, 61, 271–273.
Brightwell, G., Kenyon, C. and Paugam-Moisy, H., (1997). Multilayer neural
networks: One or two hidden layers? In Mozer, M. C., Jordan, M. I. and
Petsche, T. (eds.), Advances in Neural Information Processing Systems, vol-
ume 9, page 148. The MIT Press.
Brocks, J. J., Logan, G. A., Buick, R. and Summons, R. E. (1999) Archean
molecular fossils and the early rise of eukaryotes, Science, 285, 1033–1036.
Brown, D. and Superti-Furga, G. (2003) Rediscovering the sweet spot in drug
discovery, Drug Discov Today, 8, 1067–1077.
Brunak, S., (1993). Doing sequence analysis by inspecting the order in which neu-
ral networks learn. In Proceedings of Computation of Biomolecular Structures
182

BIBLIOGRAPHY BIBLIOGRAPHY
- Achievements, Problems and Perspectives, Springer Verlag, Berlin, pages 43–
54.
Buhaescu, I. and Izzedine, H. (2007) Mevalonate pathway: a review of clinical
and therapeutical implications, Clin Biochem, 40, 575–584.
Burgarella, S., Cattaneo, D., Pinciroli, F. and Masseroli, M. (2005) MicroGen:
a MIAME compliant web system for microarray experiment information and
workflow management, BMC Bioinformatics, 6 Suppl 4, S6–S6.
Campbell, M., Hahn, F. M., Poulter, C. D. and Leustek, T. (1998) Analysis of
the isopentenyl diphosphate isomerase gene family from Arabidopsis thaliana,
Plant Mol Biol, 36, 323–328.
Campbell, S. J., Gold, N. D., Jackson, R. M. and Westhead, D. R. (2003) Ligand
binding: Functional site location, similarity and docking, Curr Opin Struct
Biol, 13, 389–395.
Cantor, C. R. and Little, D. P. (1998) Massive attack on high-throughput biology,
Nat Genet, 20, 5–6.
Cao, J., Jarvis, S. A., Saini, S. and Nudd, G. R., (2003). Gridflow: Work-
flow management for grid computing. In CCGRID ’03: Proceedings of the
3st International Symposium on Cluster Computing and the Grid, page 198,
Washington, DC, USA. IEEE Computer Society.
Cassera, M. B., Merino, E. F., Peres, V. J., Kimura, E. A., Wunderlich, G.
and Katzin, A. M. (2007) Effect of fosmidomycin on metabolic and transcript
profiles of the methylerythritol phosphate pathway in Plasmodium falciparum,
Mem Inst Oswaldo Cruz, 102, 377–383.
183

BIBLIOGRAPHY BIBLIOGRAPHY
Cavalier-Smith, T. (1982) The evolutionary origin and phylogeny of eukaryote
flagella, Symp Soc Exp Biol, 35, 465–493.
Cavalier-Smith, T. (2000) Membrane heredity and early chloroplast evolution,
Trends Plant Sci, 5, 174–182.
Chan, A. W. E. and Weir, M. P. (2001) Using chemistry to target treatments,
Chemical Innovation, 31, 12–17.
Chandonia, J. M. and Karplus, M. (1995) Neural networks for secondary structure
and structural class predictions, Protein Sci, 4, 275–285.
Chatterjee, C., Paul, M., Xie, L. and van der Donk, W. A. (2005) Biosynthesis
and mode of action of lantibiotics, Chem Rev, 105, 633–684.
Chen, C. P., Kernytsky, A. and Rost, B. (2002) Transmembrane helix predictions
revisited, Protein Sci, 11, 2774–2791.
Chen, H., Huang, N. and Sun, Z. (2006) SubLoc: a server/client suite for protein
subcellular location based on SOAP, Bioinformatics, 22, 376–377.
Chen, Y.-P. P. and Chen, F. (2008) Identifying targets for drug discovery using
bioinformatics, Expert Opin Ther Targets, 12, 383–389.
Cheng, A. C., Coleman, R. G., Smyth, K. T., Cao, Q., Soulard, P., Caffrey, D. R.,
Salzberg, A. C. and Huang, E. S. (2007) Structure-based maximal affinity
model predicts small-molecule druggability, Nat Biotechnol, 25, 71–75.
Cho, W. and Stahelin, R. V. (2005) Membrane-protein interactions in cell signal-
ing and membrane trafficking, Annu Rev Biophys Biomol Struct, 34, 119–151.
184

BIBLIOGRAPHY BIBLIOGRAPHY
Chugh, J. K. and Wallace, B. A. (2001) Peptaibols: models for ion channels,
Biochem Soc Trans, 29, 565–570.
Claros, M. G. and von Heijne, G. (1994) TopPred II: an improved software for
membrane protein structure predictions, Comput Appl Biosci, 10, 685–686.
Collins, F. S., Green, E. D., Guttmacher, A. E. and Guyer, M. S. (2003) A vision
for the future of genomics research, Nature, 422, 835–847.
Crane, C. M., Kaiser, J., Ramsden, N. L., Lauw, S., Rohdich, F., Eisenreich, W.,
Hunter, W. N., Bacher, A. and Diederich, F. (2006) Fluorescent inhibitors for
IspF, an enzyme in the non-mevalonate pathway for isoprenoid biosynthesis
and a potential target for antimalarial therapy, Angew Chem Int Ed Engl, 45,
1069–1074.
Cserzo, M., Wallin, E., Simon, I., von Heijne, G. and Elofsson, A. (1997) Pre-
diction of transmembrane alpha-helices in prokaryotic membrane proteins: the
dense alignment surface method, Protein Eng, 10, 673–676.
Cserzo, M., Eisenhaber, F., Eisenhaber, B. and Simon, I. (2004) TM or not
TM: transmembrane protein prediction with low false positive rate using DAS-
TMfilter, Bioinformatics, 20, 136–137.
Cuff, J. A. and Barton, G. J. (1999) Evaluation and improvement of multiple
sequence methods for protein secondary structure prediction, Proteins, 34,
508–519.
Cuff, J. A., Clamp, M. E., Siddiqui, A. S., Finlay, M. and Barton, G. J. (1998)
JPred: a consensus secondary structure prediction server, Bioinformatics, 14,
892–893.
185

BIBLIOGRAPHY BIBLIOGRAPHY
Cuthbertson, J. M., Doyle, D. A. and Sansom, M. S. P. (2005) Transmembrane
helix prediction: a comparative evaluation and analysis, Protein Eng Des Sel,
18, 295–308.
Dahl, E. L., Shock, J. L., Shenai, B. R., Gut, J., DeRisi, J. L. and Rosenthal, P. J.
(2006) Tetracyclines specifically target the apicoplast of the malaria parasite
Plasmodium falciparum, Antimicrob Agents Chemother, 50, 3124–3131.
Davey, R., Savva, G., Dicks, J. and Roberts, I. N. (2007) MPP: a microarray-to-
phylogeny pipeline for analysis of gene and marker content datasets, Bioinfor-
matics, 23, 1023–1025.
de Ruyck, J. and Wouters, J. (2008) Structure-based drug design targeting
biosynthesis of isoprenoids: a crystallographic state of the art of the involved
enzymes, Curr Protein Pept Sci, 9, 117–137.
de Ruyck, J., Durisotti, V., Oudjama, Y. and Wouters, J. (2006) Structural
role for Tyr-104 in Escherichia coli isopentenyl-diphosphate isomerase: Site-
directed mutagenesis, enzymology, and protein crystallography, J Biol Chem,
281, 17864–17869.
de Ruyck, J., Rothman, S. C., Poulter, C. D. and Wouters, J. (2005) Structure of
Thermus thermophilus type 2 isopentenyl diphosphate isomerase inferred from
crystallography and molecular dynamics, Biochem Biophys Res Commun, 338,
1515–1518.
Deber, C. M., Wang, C., Liu, L. P., Prior, A. S., Agrawal, S., Muskat, B. L. and
Cuticchia, A. J. (2001) TM Finder: a prediction program for transmembrane
186

BIBLIOGRAPHY BIBLIOGRAPHY
protein segments using a combination of hydrophobicity and nonpolar phase
helicity scales, Protein Sci, 10, 212–219.
Deelman, E., Blythe, J., Gil, Y. and Kesselman, C., (2004). Grid resource man-
agement: state of the art and future trends, chapter Workflow management in
GriPhyN, pages 99–116. Kluwer Academic Publishers, Norwell, MA, USA.
Deelman, E., Blythe, J., Gil, Y., Kesselman, C., Mehta, G., Vahi, K., Black-
burn, K., Lazzarini, A., Arbree, A., Cavanaugh, R. and Koranda, S. (March
2003) Mapping abstract complex workflows onto grid environments, Journal of
Grid Computing, V1, 25–39.
Deevi, S. V. V. and Martin, A. C. R. (2006) An extensible automated protein
annotation tool: Standardizing input and output using validated XML, Bioin-
formatics, 22, 291–296.
Dewick, P. M. (2002) The biosynthesis of C5-C25 terpenoid compounds, Nat Prod
Rep, 19, 181–222.
Ding, C. H. and Dubchak, I. (2001) Multi-class protein fold recognition using
support vector machines and neural networks, Bioinformatics, 17, 349–358.
Disney, M. D., Childs, J. L. and Turner, D. H. (2004) Hoechst 33258 selectively
inhibits group I intron self-splicing by affecting RNA folding, Chembiochem, 5,
1647–1652.
Douglas, J. D., Senior, S. J., Morehouse, C., Phetsukiri, B., Campbell, I. B.,
Besra, G. S. and Minnikin, D. E. (2002) Analogues of thiolactomycin: Po-
tential drugs with enhanced anti-mycobacterial activity, Microbiology, 148,
3101–3109.
187

BIBLIOGRAPHY BIBLIOGRAPHY
Dowell, R. D., Jokerst, R. M., Day, A., Eddy, S. R. and Stein, L. (2001) The
distributed annotation system, BMC Bioinformatics, 2, 7–7.
Draghici, S. and Potter, R. B. (2003) Predicting HIV drug resistance with neural
networks, Bioinformatics, 19, 98–9107.
Drews, J. (1996) Genomic sciences and the medicine of tomorrow, Nat Biotechnol,
14, 1516–1518.
Drews, J. and Ryser, S. (1997a) Classic drug targets, Nat Biotechnol, 15, 1350.
Pullout.
Drews, J. and Ryser, S. (1997b) The role of innovation in drug development, Nat
Biotechnol, 15, 1318–1319.
Dubey, J. P. and Welcome, F. L. (1988) Toxoplasma gondii-induced abortion in
sheep, J Am Vet Med Assoc, 193, 697–700.
Dubey, V. S., Bhalla, R. and Luthra, R. (2003) An overview of the non-
mevalonate pathway for terpenoid biosynthesis in plants, J Biosci, 28, 637–646.
Durbecq, V., Sainz, G., Oudjama, Y., Clantin, B., Bompard-Gilles, C., Tricot, C.,
Caillet, J., Stalon, V., Droogmans, L. and Villeret, V. (2001) Crystal structure
of isopentenyl diphosphate:dimethylallyl diphosphate isomerase, EMBO J, 20,
1530–1537.
Durinck, S., Moreau, Y., Kasprzyk, A., Davis, S., De Moor, B., Brazma, A.
and Huber, W. (2005) BioMart and Bioconductor: a powerful link between
biological databases and microarray data analysis, Bioinformatics, 21, 3439–
3440.
188

BIBLIOGRAPHY BIBLIOGRAPHY
Eberl, M., Hintz, M., Jamba, Z., Beck, E., Jomaa, H. and Christiansen, G. (2004)
Mycoplasma penetrans is capable of activating V gamma 9/V delta 2 T cells
while other human pathogenic mycoplasmas fail to do so, Infect Immun, 72,
4881–4883.
Eckart, J. D. and Sobral, B. W. S. (2003) A life scientist’s gateway to distributed
data management and computing: the PathPort/ToolBus framework, OMICS,
7, 79–88.
Ecker, D. and Griffey, R. (1999) RNA as a small-molecule drug target: Doubling
the value of genomics, Drug Discov Today, 4, 420–429.
Eisenreich, W., Bacher, A., Arigoni, D. and Rohdich, F. (2004) Biosynthesis of
isoprenoids via the non-mevalonate pathway, Cell Mol Life Sci, 61, 1401–1426.
Eisenreich, W., Schwarz, M., Cartayrade, A., Arigoni, D., Zenk, M. H. and
Bacher, A. (1998) The deoxyxylulose phosphate pathway of terpenoid biosyn-
thesis in plants and microorganisms, Chem Biol, 5, R221–R233.
Elofsson, A. and Heijne, G. v. (2007) Membrane Protein Structure: Prediction
versus Reality, Annu Rev Biochem, 76, 125–140.
Emanuelsson, O., Nielsen, H., Brunak, S. and von Heijne, G. (2000) Predict-
ing subcellular localization of proteins based on their N-terminal amino acid
sequence, J. Mol. Biol., 300, 1005–1016.
Emanuelsson, O., Nielsen, H. and von Heijne, G. (1999) ChloroP, a neural
network-based method for predicting chloroplast transit peptides and their
cleavage sites, Protein Sci, 8, 978–984.
189

BIBLIOGRAPHY BIBLIOGRAPHY
Eubanks, L. M. and Poulter, C. D. (2003) Rhodobacter capsulatus 1-deoxy-D-
xylulose 5-phosphate synthase: Steady-state kinetics and substrate binding,
Biochemistry, 42, 1140–1149.
Fagan, R. and Swindells, M. (2000) Bioinformatics, target discovery and the
pharmaceutical/biotechnology industry, Curr Opin Mol Ther, 2, 655–661.
Fagan, R., Swindells, M., Overington, J. and Weir, M. (2001) Nicastrin, a
presenilin-interacting protein, contains an aminopeptidase/transferrin recep-
tor superfamily domain, Trends Biochem Sci, 26, 213–214.
Fahringer, T., Jugravu, A., Pllana, S., Prodan, R., Clovis Seragiotto, J. and
Truong, H.-L. (2005) Askalon: a tool set for cluster and grid computing: Re-
search articles, Concurr. Comput. : Pract. Exper., 17, 143–169.
Fauman, E. B., Hopkins, A. L. and Groom, C. R., (2003). Structural Bioinformat-
ics, chapter 23. Structural Bioinformatics in Drug Discovery, pages 477–497.
Wiley-Liss Inc., Hoboken, New Jersey.
Finkelstein, R. and Rock, C., (2002). In C.R. Somerville, E.M. Meyerowitz,
eds, The Arabidopsis Book., chapter Abscisic acid biosynthesis and response.
American Society of Plant Biologists, Rockville, MD. Also available as www.
aspb.org/publications/arabidopsis/.
Flower, D. R. (1999) Modelling G-protein-coupled receptors for drug design,
Biochim Biophys Acta, 1422, 207–234.
Foster, I. and Kesselman, C. (eds.), (1999). The grid: blueprint for a new com-
puting infrastructure. Morgan Kaufmann Publishers Inc., San Francisco, CA,
USA.
190

BIBLIOGRAPHY BIBLIOGRAPHY
Fowler, P. W. and Coveney, P. V. (2006) A computational protocol for the inte-
gration of the monotopic protein prostaglandin H2 synthase into a phospholipid
bilayer, Biophys J, 91, 401–410.
Fox, T., Brennan, D., Austen, D. A., Swalley, S. E., Coll, J. T., Raybuck, S. A.
and Chambers, S. P. (2007) Development of a protease production platform
for structure-based drug design, Curr Protein Pept Sci, 8, 439–445.
Frishman, D., Albermann, K., Hani, J., Heumann, K., Metanomski, A., Zoll-
ner, A. and Mewes, H. W. (2001) Functional and structural genomics using
PEDANT, Bioinformatics, 17, 44–57.
Frishman, D. (2007) Protein annotation at genomic scale: the current status,
Chem Rev, 107, 3448–3466.
Fujita, A., Massirer, K. B., Durham, A. M., Ferreira, C. E. and Sogayar, M. C.
(2005) The GATO gene annotation tool for research laboratories, Braz J Med
Biol Res, 38, 1571–1574.
Fujita, H., Nishitani, C. and Ogawa, K. (2002) Lead, chemical porphyria, and
heme as a biological mediator, Tohoku J Exp Med, 196, 53–64.
Funes, S., Davidson, E., Reyes-Prieto, A., Magallon, S., Herion, P., King, M. P.
and Gonzalez-Halphen, D. (2002) A green algal apicoplast ancestor, Science,
298, 2155–2155.
Furmento, N., Lee, W., Mayer, A., Newhouse, S. and Darlington, J., (2002). Iceni:
an open grid service architecture implemented with jini. In Supercomputing
’02: Proceedings of the 2002 ACM/IEEE conference on Supercomputing, pages
1–10, Los Alamitos, CA, USA. IEEE Computer Society Press.
191

BIBLIOGRAPHY BIBLIOGRAPHY
Gabrielsen, M., Bond, C. S., Hallyburton, I., Hecht, S., Bacher, A., Eisenre-
ich, W., Rohdich, F. and Hunter, W. N. (2004) Hexameric assembly of the bi-
functional methylerythritol 2,4-cyclodiphosphate synthase and protein-protein
associations in the deoxy-xylulose-dependent pathway of isoprenoid precursor
biosynthesis, J Biol Chem, 279, 52753–52761.
Gabrielsen, M., Kaiser, J., Rohdich, F., Eisenreich, W., Laupitz, R., Bacher, A.,
Bond, C. S. and Hunter, W. N. (2006) The crystal structure of a plant 2C-
methyl-D-erythritol 4-phosphate cytidylyltransferase exhibits a distinct qua-
ternary structure compared to bacterial homologues and a possible role in
feedback regulation for cytidine monophosphate, FEBS J, 273, 1065–1073.
Gambari, R., Feriotto, G., Rutigliano, C., Bianchi, N. and Mischiati, C. (2000)
Biospecific interaction analysis (BIA) of low-molecular weight DNA-binding
drugs, J Pharmacol Exp Ther, 294, 370–377.
Garcia Castro, A., Thoraval, S., Garcia, L. J. and Ragan, M. A. (2005) Workflows
in bioinformatics: Meta-analysis and prototype implementation of a workflow
generator, BMC Bioinformatics, 6, 87–87.
Garrow, A. G., Agnew, A. and Westhead, D. R. (2005) TMB-Hunt: an amino acid
composition based method to screen proteomes for beta-barrel transmembrane
proteins, BMC Bioinformatics, 6, 56–56.
Gattiker, A., Gasteiger, E. and Bairoch, A. (2002) ScanProsite: a reference im-
plementation of a PROSITE scanning tool, Appl. Bioinformatics, 1, 107–108.
Geppert, A., Kradolfer, M. and Tombros, D., (1998). Market-based workflow
management. In TREC ’98: Proceedings of the International IFIP/GI Working
192

BIBLIOGRAPHY BIBLIOGRAPHY
Conference on Trends in Distributed Systems for Electronic Commerce, pages
179–191, London, UK. Springer-Verlag.
Glaser, F., Morris, R. J., Najmanovich, R. J., Laskowski, R. A. and Thorn-
ton, J. M. (2006) A method for localizing ligand binding pockets in protein
structures, Proteins, 62, 479–488.
Goldstein, J. L. and Brown, M. S. (1990) Regulation of the mevalonate pathway,
Nature, 343, 425–430.
Gomi, M. and Mitaku, S. (1999) Sequence analysis for discrimination of signal
peptides and signal anchor sequences, Genome Informatics, 10, 340–341.
Goni, F. M. (2002) Non-permanent proteins in membranes: when proteins come
as visitors (Review), Mol Membr Biol, 19, 237–245.
Gough, J., (2002). Hidden markov models. http://www.cs.bris.ac.uk/
~gough/book/.
Grawert, T., Kaiser, J., Zepeck, F., Laupitz, R., Hecht, S., Amslinger, S.,
Schramek, N., Schleicher, E., Weber, S., Haslbeck, M., Buchner, J., Rieder, C.,
Arigoni, D., Bacher, A., Eisenreich, W. and Rohdich, F. (2004) IspH protein of
Escherichia coli: Studies on iron-sulfur cluster implementation and catalysis, J
Am Chem Soc, 126, 12847–12855.
Gray, M. W., Burger, G. and Lang, B. F. (1999) Mitochondrial evolution, Science,
283, 1476–1481.
Griffiths, E. and Gupta, R. S. (2006) Molecular signatures in protein sequences
that are characteristics of the phylum Aquificae, Int J Syst Evol Microbiol, 56,
99–9107.
193

BIBLIOGRAPHY BIBLIOGRAPHY
Gromiha, M. M., Ahmad, S. and Suwa, M. (2004) Neural network-based predic-
tion of transmembrane beta-strand segments in outer membrane proteins, J
Comput Chem, 25, 762–767.
Gudermann, T., Nurnberg, B. and Schultz, G. (1995) Receptors and G proteins as
primary components of transmembrane signal transduction. Part 1. G-protein-
coupled receptors: Structure and function, J Mol Med, 73, 51–63.
Guimaraes, K. S., Melo, J. C. B. and Cavalcanti, G. D. C., (2003). Combining few
neural networks for effective secondary structure prediction. In BIBE ’03: Pro-
ceedings of the 3rd IEEE Symposium on BioInformatics and BioEngineering,
page 415, Washington, DC, USA. IEEE Computer Society.
Guiney, D. G., Hasegawa, P. and Davis, C. E. (1984) Plasmid transfer from
Escherichia coli to Bacteroides fragilis: Differential expression of antibiotic
resistance phenotypes, Proc Natl Acad Sci U S A, 81, 7203–7206.
Guo, J.-t., Ellrott, K., Chung, W. J., Xu, D., Passovets, S. and Xu, Y. (2004)
PROSPECT-PSPP: an automatic computational pipeline for protein structure
prediction, Nucleic Acids Res, 32, W522–W525.
Hackman, A. S. and Wilkins, T. D. (1975) Comparison of cefoxitin and
cephalothin therapy of a mixed Bacteroides fragilis and Fusobacterius
necrophorum infection in mice, Antimicrob Agents Chemother, 8, 224–225.
Hahn, F. M., Hurlburt, A. P. and Poulter, C. D. (1999) Escherichia coli open
reading frame 696 is idi, a nonessential gene encoding isopentenyl diphosphate
isomerase, J Bacteriol, 181, 4499–4504.
194

BIBLIOGRAPHY BIBLIOGRAPHY
Hahn, F. M., Xuan, J. W., Chambers, A. F. and Poulter, C. D. (1996) Human
isopentenyl diphosphate: Dimethylallyl diphosphate isomerase: Overproduc-
tion, purification, and characterization, Arch Biochem Biophys, 332, 30–34.
Hajduk, P. J., Huth, J. R. and Fesik, S. W. (2005a) Druggability indices for
protein targets derived from NMR-based screening data, J Med Chem, 48,
2518–2525.
Hajduk, P. J., Huth, J. R. and Tse, C. (2005b) Predicting protein druggability,
Drug Discov Today, 10, 1675–1682.
Hall, L. O., Chawla, N., Bowyer, K. W. and Kegelmeyer, W. P., (1999). Learning
rules from distributed data. In Large-Scale Parallel Data Mining, pages 211–
220.
Hamscher, V., Schwiegelshohn, U., Streit, A. and Yahyapour, R., (2000). Evalua-
tion of job-scheduling strategies for grid computing. In GRID ’00: Proceedings
of the First IEEE/ACM International Workshop on Grid Computing, pages
191–202, London, UK. Springer-Verlag.
Harb, O. S., Chatterjee, B., Fraunholz, M. J., Crawford, M. J., Nishi, M. and
Roos, D. S. (2004) Multiple functionally redundant signals mediate targeting
to the apicoplast in the apicomplexan parasite Toxoplasma gondii, Eukaryot
Cell, 3, 663–674.
He, C. Y., Striepen, B., Pletcher, C. H., Murray, J. M. and Roos, D. S. (2001)
Targeting and processing of nuclear-encoded apicoplast proteins in plastid seg-
regation mutants of Toxoplasma gondii, J Biol Chem, 276, 28436–28442.
195

BIBLIOGRAPHY BIBLIOGRAPHY
Hearst, M. A., Scholkapf, B., Dumais, S., Osuna, E. and Platt, J. (1998) Trends
and Constroversies - Support Vector Machines, IEEEIS, 13, 18–28.
Henriksson, L. M., Unge, T., Carlsson, J., Aqvist, J., Mowbray, S. L. and
Jones, T. A. (2007) Structures of Mycobacterium tuberculosis 1-deoxy-D-
xylulose-5-phosphate reductoisomerase provide new insights into catalysis, J
Biol Chem, 282, 19905–19916.
High, S., Flint, N. and Dobberstein, B. (1991) Requirements for the membrane
insertion of signal-anchor type proteins, J Cell Biol, 113, 25–34.
Hirokawa, T., Boon-Chieng, S. and Mitaku, S. (1998) SOSUI: classification and
secondary structure prediction system for membrane proteins, Bioinformatics,
14, 378–379.
Hofmann, K. and Stoffel, W. (1993) TMbase a database of membrane spanning
proteins segments, Biol Chem Hoppe-Seyler, 347, 166.
Hollingsworth, D., (1995). The workflow reference model. Handbook, The Work-
flow Management Coalition.
Hoon, S., Ratnapu, K. K., Chia, J.-M., Kumarasamy, B., Juguang, X., Clamp, M.,
Stabenau, A., Potter, S., Clarke, L. and Stupka, E. (2003) Biopipe: a flexible
framework for protocol-based bioinformatics analysis, Genome Res, 13, 1904–
1915.
Hopkins, A. L. and Groom, C. R. (2002) The druggable genome, Nat Rev Drug
Discov, 1, 727–730.
Hopkins, A. L., Mason, J. S. and Overington, J. P. (2006) Can we rationally
design promiscuous drugs?, Curr Opin Struct Biol, 16, 127–136.
196
BIBLIOGRAPHY BIBLIOGRAPHY
Hsieh, M.-H. and Goodman, H. M. (2006) Functional evidence for the involve-
ment of Arabidopsis IspF homolog in the nonmevalonate pathway of plastid
isoprenoid biosynthesis, Planta, 223, 779–784.
Hubbard, T., Barker, D., Birney, E., Cameron, G., Chen, Y., Clark, L., Cox, T.,
Cuff, J., Curwen, V., Down, T., Durbin, R., Eyras, E., Gilbert, J., Ham-
mond, M., Huminiecki, L., Kasprzyk, A., Lehvaslaiho, H., Lijnzaad, P., Mel-
sopp, C., Mongin, E., Pettett, R., Pocock, M., Potter, S., Rust, A., Schmidt, E.,
Searle, S., Slater, G., Smith, J., Spooner, W., Stabenau, A., Stalker, J.,
Stupka, E., Ureta-Vidal, A., Vastrik, I. and Clamp, M. (2002) The Ensembl
genome database project, Nuc. Ac. Res., 30, 38–41.
Hulo, N., Sigrist, C. J. A., Le Saux, V., Langendijk-Genevaux, P. S., Bordoli, L.,
Gattiker, A., De Castro, E., Bucher, P. and Bairoch, A. (2004) Recent improve-
ments to the PROSITE database, Nuc. Ac. Res., 32, D134–D137.
Hunter, W. N. (2007) The Non-mevalonate Pathway of Isoprenoid Precursor
Biosynthesis, J Biol Chem, 282, 21573–21577.
Hwang, S. and Kesselman, C., (2003). Grid workflow: A flexible failure handling
framework for the grid. In twelfth IEEE International Symposium on High
Performance Distributed Computing (HPDC-12), pages 126–137, Los Alamitos,
CA, USA. IEEE Computer Society Press.
Ikeda, M., Arai, M., Lao, D. M. and Shimizu, T. (2002) Transmembrane topology
prediction methods: a re-assessment and improvement by a consensus method
using a dataset of experimentally-characterized transmembrane topologies, In
Silico Biol, 2, 19–33.
197
BIBLIOGRAPHY BIBLIOGRAPHY
Ikeda, M., Arai, M., Okuno, T. and Shimizu, T. (2003) TMPDB: a database
of experimentally-characterized transmembrane topologies, Nucleic Acids Res,
31, 406–409.
Ikeda, M., Arai, M. and Shimizu, T. (2000) Evaluation of transmembrane topol-
ogy prediction methods by using an experimentally characterized topology
dataset, Genome Informatics, 11, 420–427.
Jacoboni, I., Martelli, P. L., Fariselli, P., De Pinto, V. and Casadio, R. (2001)
Prediction of the transmembrane regions of beta-barrel membrane proteins
with a neural network-based predictor, Protein Sci, 10, 779–787.
Jayasinghe, S., Hristova, K. and White, S. H. (2001a) Energetics, stability, and
prediction of transmembrane helices, J Mol Biol, 312, 927–934.
Jayasinghe, S., Hristova, K. and White, S. H. (2001b) MPtopo: A database of
membrane protein topology, Protein Sci, 10, 455–458.
Jenkins, M. C. (2001) Advances and prospects for subunit vaccines against pro-
tozoa of veterinary importance, Vet Parasitol, 101, 291–310.
Johnson, J. E. and Cornell, R. B. (1999) Amphitropic proteins: Regulation by
reversible membrane interactions (review), Mol Membr Biol, 16, 217–235.
Jones, D. T. (1998) Do transmembrane protein superfolds exist?, FEBS Lett,
423, 281–285.
Jones, D. T., Taylor, W. R. and Thornton, J. M. (1994) A model recognition ap-
proach to the prediction of all-helical membrane protein structure and topology,
Biochemistry, 33, 3038–3049.
198
BIBLIOGRAPHY BIBLIOGRAPHY
Jones, D. T. (2007) Improving the accuracy of transmembrane protein topology
prediction using evolutionary information, Bioinformatics, 23, 538–544.
Jones, E. and Mongin-Bulewski, C. (2002) Drug discovery technology 2002. Start-
up showcase and structure-based drug design, IDrugs, 5, 894–895.
Jones, S. M., Urch, J. E., Kaiser, M., Brun, R., Harwood, J. L., Berry, C. and
Gilbert, I. H. (2005) Analogues of thiolactomycin as potential antimalarial
agents, J Med Chem, 48, 5932–5941.
Julenius, K., Mølgaard, A., Gupta, R. and Brunak, S. (2004) Prediction, con-
servation analysis and structural characterization of mammalian mucin-type
O-glycosylation sites, Glycobiology.
Junier, T. and Bucher, P. (1998) SEView: a Java applet for browsing molecular
sequence data, In Silico Biol, 1, 13–20.
Juretic, D., Lee, B., Trinajstic, N. and Williams, R. W. (1993) Conformational
preference functions for predicting helices in membrane proteins, Biopolymers,
33, 255–273.
Juretic, D., Zoranic, L. and Zucic, D. (2002) Basic charge clusters and predictions
of membrane protein topology, J Chem Inf Comput Sci, 42, 620–632.
Kall, L., Krogh, A. and Sonnhammer, E. L. L. (2004) A combined transmembrane
topology and signal peptide prediction method, J Mol Biol, 338, 1027–1036.
Kall, L., Krogh, A. and Sonnhammer, E. L. L. (2005) An HMM posterior decoder
for sequence feature prediction that includes homology information, Bioinfor-
matics, 21 Suppl 1, i251–i257.
199

BIBLIOGRAPHY BIBLIOGRAPHY
Kaneda, K., Kuzuyama, T., Takagi, M., Hayakawa, Y. and Seto, H. (2001) An
unusual isopentenyl diphosphate isomerase found in the mevalonate pathway
gene cluster from Streptomyces sp. strain CL190, Proc Natl Acad Sci U S A,
98, 932–937.
Kanehisa, M., Goto, S., Kawashima, S. and Nakaya, A. (2002) The KEGG
databases at GenomeNet, Nucleic Acids Res, 30, 42–46.
Karkola, S., Holtje, H.-D. and Wahala, K. (2007) A three-dimensional model
of CYP19 aromatase for structure-based drug design, J Steroid Biochem Mol
Biol, 105, 63–70.
Kemp, L. E., Bond, C. S. and Hunter, W. N. (2002) Structure of 2C-methyl-D-
erythritol 2,4- cyclodiphosphate synthase: an essential enzyme for isoprenoid
biosynthesis and target for antimicrobial drug development, Proc Natl Acad
Sci U S A, 99, 6591–6596.
Kennard, o. (1993) Dna-drug interactions, Pure & Appl. Chem., 65, 1213–1222.
Kim, D., Xu, D., Guo, J.-t., Ellrott, K. and Xu, Y. (2003) PROSPECT II: protein
structure prediction program for genome-scale applications, Protein Eng, 16,
641–650.
King, R. D., Ouali, M., Strong, A. T., Aly, A., Elmaghraby, A., Kantardzic, M.
and Page, D. (2000) Is it better to combine predictions?, Protein Eng, 13,
15–19.
Kinoshita, T. (2007) [Application and development of structure-based drug design
using X-ray analysis], Nippon Yakurigaku Zasshi, 129, 186–190.
200
BIBLIOGRAPHY BIBLIOGRAPHY
Kishida, H., Wada, T., Unzai, S., Kuzuyama, T., Takagi, M., Terada, T., Shi-
rouzu, M., Yokoyama, S., Tame, J. R. H. and Park, S.-Y. (2003) Struc-
ture and catalytic mechanism of 2-C-methyl-D-erythritol 2,4-cyclodiphosphate
(MECDP) synthase, an enzyme in the non-mevalonate pathway of isoprenoid
synthesis, Acta Crystallogr D Biol Crystallogr, 59, 23–31.
Klein, P., Kanehisa, M. and DeLisi, C. (1985) The detection and classification of
membrane-spanning proteins, Biochim Biophys Acta, 815, 468–476.
Klinck, R., Westhof, E., Walker, S., Afshar, M., Collier, A. and Aboul-Ela, F.
(2000) A potential RNA drug target in the hepatitis C virus internal ribosomal
entry site, RNA, 6, 1423–1431.
Kobayashi, K., Suzuki, M., Tang, J., Nagata, N., Ohyama, K., Seki, H., Ki-
uchi, R., Kaneko, Y., Nakazawa, M., Matsui, M., Matsumoto, S., Yoshida, S.
and Muranaka, T. (2007) Lovastatin insensitive 1, a Novel pentatricopeptide
repeat protein, is a potential regulatory factor of isoprenoid biosynthesis in
Arabidopsis, Plant Cell Physiol, 48, 322–331.
Kohler, S., Delwiche, C. F., Denny, P. W., Tilney, L. G., Webster, P., Wil-
son, R. J., Palmer, J. D. and Roos, D. S. (1997) A plastid of probable green
algal origin in Apicomplexan parasites, Science, 275, 1485–1489.
Kollas, A.-K., Duin, E. C., Eberl, M., Altincicek, B., Hintz, M., Reichenberg, A.,
Henschker, D., Henne, A., Steinbrecher, I., Ostrovsky, D. N., Hedderich, R.,
Beck, E., Jomaa, H. and Wiesner, J. (2002) Functional characterization of
GcpE, an essential enzyme of the non-mevalonate pathway of isoprenoid biosyn-
thesis, FEBS Lett, 532, 432–436.
201

BIBLIOGRAPHY BIBLIOGRAPHY
Kroemer, R. T. (2007) Structure-based drug design: Docking and scoring, Curr
Protein Pept Sci, 8, 312–328.
Krogh, A., Larsson, B., von Heijne, G. and Sonnhammer, E. L. (2001) Predicting
transmembrane protein topology with a Hidden Markov Model: Application
to complete genomes, J. Mol. Biol., 305, 567–580.
Kurtzman, C. P. and Piskur, J., (2006). Comparative Genomics: Using Fungi
as Models, volume 15 of Topics in Current Genetics, chapter Taxonomy and
phylogenetic diversity among the yeasts, pages 29–46. Springer-Verlag, Berlin.
Kuzuyama, T., Takagi, M., Takahashi, S. and Seto, H. (2000) Cloning and char-
acterization of 1-deoxy-D-xylulose 5-phosphate synthase from Streptomyces sp.
Strain CL190, which uses both the mevalonate and nonmevalonate pathways
for isopentenyl diphosphate biosynthesis, J Bacteriol, 182, 891–897.
Kyte, J. and Doolittle, R. F. (1982) A simple method for displaying the hydro-
pathic character of a protein, J Mol Biol, 157, 105–132.
Labarga, A., Valentin, F., Anderson, M. and Lopez, R. (2007) Web services at
the European bioinformatics institute, Nucleic Acids Res, 35, W6–11.
Lacroix, Z., Legendre, C., Raschid, L. and Snyder, B. (2007) BIPASS: BioInfor-
matics Pipeline Alternative Splicing Services, Nucleic Acids Res.
Land, K. M., Delgadillo, M. G. and Johnson, P. J. (2002) In vivo expression of
ferredoxin in a drug resistant trichomonad increases metronidazole susceptibil-
ity, Mol Biochem Parasitol, 121, 153–157.
202

BIBLIOGRAPHY BIBLIOGRAPHY
Lange, B. M., Rujan, T., Martin, W. and Croteau, R. (2000) Isoprenoid biosyn-
thesis: the evolution of two ancient and distinct pathways across genomes, Proc
Natl Acad Sci U S A, 97, 13172–13177.
Lao, D. M., Arai, M., Ikeda, M. and Shimizu, T. (2002a) The presence of signal
peptide significantly affects transmembrane topology prediction, Bioinformat-
ics, 18, 1562–1566.
Lao, D. M., Okuno, T. and Shimizu, T. (2002b) Evaluating transmembrane topol-
ogy prediction methods for the effect of signal peptide in topology prediction,
In Silico Biol, 2, 485–494.
Laskowski, R. A. (2001) PDBsum: summaries and analyses of PDB structures,
Nuc. Ac. Res., 29, 221–222.
Laskowski, R. A., Luscombe, N. M., Swindells, M. B. and Thornton, J. M. (1996)
Protein clefts in molecular recognition and function, Protein Sci, 5, 2438–2452.
Laskowski, R. A., Watson, J. D. and Thornton, J. M. (2005) ProFunc: a server
for predicting protein function from 3D structure, Nucleic Acids Res, 33, W89–
W93.
Laszewski, G. v., (2005). Java cog kit workflow concepts for scientific experiments.
Technical report, Argonne National Laboratory, Argonne, IL, USA.
Le Pecq, J. B., Le Bret, M., Barbet, J. and Roques, B. (1975) DNA polyinterca-
lating drugs: DNA binding of diacridine derivatives, Proc Natl Acad Sci U S
A, 72, 2915–2919.
Lell, B., Ruangweerayut, R., Wiesner, J., Missinou, M. A., Schindler, A.,
Baranek, T., Hintz, M., Hutchinson, D., Jomaa, H. and Kremsner, P. G. (2003)
203

BIBLIOGRAPHY BIBLIOGRAPHY
Fosmidomycin, a novel chemotherapeutic agent for malaria, Antimicrob Agents
Chemother, 47, 735–738.
Letondal, C. (2001) A Web interface generator for molecular biology programs in
Unix, Bioinformatics, 17, 73–82.
Lewis, R. A. (1991) Clefts and binding sites in protein receptors, Methods Enzy-
mol, 202, 126–156.
Li, X.-h., Zou, H.-j., Wu, A.-h., Ye, Y.-l. and Shen, J.-h. (2007) Structure-based
drug design of a novel family of chalcones as PPARalpha agonists: Virtual
screening, synthesis, and biological activities in vitro, Acta Pharmacol Sin, 28,
2040–2052.
Lian, C. C., Tang, F., Issac, P. and Krishnan, A. (2005) Gel: grid execution
language, J. Parallel Distrib. Comput., 65, 857–869.
Lipinski, C. A., Lombardo, F., Dominy, B. W. and Feeney, P. J. (2001) Experi-
mental and computational approaches to estimate solubility and permeability
in drug discovery and development settings, Adv Drug Deliv Rev, 46, 3–26.
Liu, E. D., Yang, G. L., Tian, B. J., Li, Z. W. and Chen, Y. (2002) Application of
resilient backpropagation neural network in predicting hydrophobic parameters
of alkylbenzenes, SP, 20, 216–218.
Lohmann, R., Schneider, G., Behrens, D. and Wrede, P. (1994) A neural network
model for the prediction of membrane-spanning amino acid sequences, Protein
Sci, 3, 1597–1601.
Lomize, A. L., Pogozheva, I. D., Lomize, M. A. and Mosberg, H. I. (2007) The role
204

BIBLIOGRAPHY BIBLIOGRAPHY
of hydrophobic interactions in positioning of peripheral proteins in membranes,
BMC Struct Biol, 7, 44–44.
Lu, J., Wu, W., Cao, S., Zhao, H., Zeng, H., Lin, L., Sun, X. and Tang, K. (2007)
Molecular cloning and characterization of 1-hydroxy-2-methyl-2-(E)-butenyl-
4-diphosphate reductase gene from Ginkgo biloba, Mol Biol Rep.
Ludscher, B., Altintas, I., Berkley, C., Higgins, D., Jaeger, E., Jones, M., Lee, E.,
Tao, J. and Zhao, Y. (2005) Scientific workflow management and the kepler
system, Concurrency and Computation: Practice & Experience, 36.
Luft, B. J., Hafner, R., Korzun, A. H., Leport, C., Antoniskis, D., Bosler, E. M.,
Bourland, D. D., Uttamchandani, R., Fuhrer, J. and Jacobson, J. (1993) Toxo-
plasmic encephalitis in patients with the acquired immunodeficiency syndrome.
Members of the ACTG 077p/ANRS 009 Study Team, N Engl J Med, 329, 995–
991000.
Mac Sweeney, A., Lange, R., Fernandes, R. P. M., Schulz, H., Dale, G. E.,
Douangamath, A., Proteau, P. J. and Oefner, C. (2005) The crystal struc-
ture of E.coli 1-deoxy-D-xylulose-5-phosphate reductoisomerase in a ternary
complex with the antimalarial compound fosmidomycin and NADPH reveals
a tight-binding closed enzyme conformation, J Mol Biol, 345, 115–127.
Macchiarulo, A., Nobeli, I. and Thornton, J. M. (2004) Ligand selectivity and
competition between enzymes in silico, Nat Biotechnol, 22, 1039–1045.
Maggio, E. T. and Ramnarayan, K. (2001) Recent developments in computational
proteomics, Trends Biotechnol, 19, 266–272.
205

BIBLIOGRAPHY BIBLIOGRAPHY
Maggio, E. T. (2002) Want novel drugs in a hurry? You had better do the math!,
Drug Discov Today, 7, 855–856.
Mahmoud, S. S. and Croteau, R. B. (2002) Strategies for transgenic manipulation
of monoterpene biosynthesis in plants, Trends Plant Sci, 7, 366–373.
Margulis, L., (1981). Symbiosis in Cell Evolution. W. H. Freeman and Company,
San Francisco.
Margulis, L. and Bermudes, D. (1985) Symbiosis as a mechanism of evolution:
Status of cell symbiosis theory, Symbiosis, 1, 101–124.
Martelli, P. L., Fariselli, P., Krogh, A. and Casadio, R. (2002) A sequence-profile-
based HMM for predicting and discriminating beta barrel membrane proteins,
Bioinformatics, 18 Suppl 1, S46–S53.
Martin, A. C. R. (2004) PDBSprotEC: a Web-accessible database linking PDB
chains to EC numbers via SwissProt, Bioinformatics, 20, 986–988.
Martin, A. C. R. (2005) Mapping PDB chains to UniProtKB entries, Bioinfor-
matics, 21, 4297–4301.
Massague, J. and Pandiella, A. (1993) Membrane-anchored growth factors, Annu
Rev Biochem, 62, 515–541.
Matthews, B. W. (1975) Comparison of the predicted and observed secondary
structure of T4 phage lysozyme, Biochim Biophys Acta, 405, 442–451.
McFadden, G. (1999) Chloroplasts. Ever decreasing circles, Nature, 400, 119–120.
McFadden, G. I. (2001) Primary and secondary endosymbiosis and the origin of
plastids, J Phycol, 37, 951–959.
206

BIBLIOGRAPHY BIBLIOGRAPHY
Mcgough, S., Young, L., Afzal, A., Newhouse, S. and Darlington, J., (2004).
Workflow enactment in iceni. In In UK e-Science All Hands Meeting, pages
894–900.
McGuffin, L. J., Bryson, K. and Jones, D. T. (2000) The PSIPRED protein
structure prediction server, Bioinformatics, 16, 404–405.
Mehlin, C. (2005) Structure-based drug discovery for Plasmodium falciparum,
Comb Chem High Throughput Screen, 8, 5–14.
Metzker, M. L. (2005) Emerging technologies in DNA sequencing, Genome Res,
15, 1767–1776.
Meyer, O., Grosdemange-Billiard, C., Tritsch, D. and Rohmer, M. (2003) Iso-
prenoid biosynthesis via the MEP pathway. Synthesis of (3,4)-3,4-dihydroxy-
5-oxohexylphosphonic acid, an isosteric analogue of 1-deoxy-D-xylulose 5-
phosphate, the substrate of the 1-deoxy-D-xylulose 5-phosphate reducto-
isomerase, Org Biomol Chem, 1, 4367–4372.
Miallau, L., Alphey, M. S., Kemp, L. E., Leonard, G. A., McSweeney, S. M.,
Hecht, S., Bacher, A., Eisenreich, W., Rohdich, F. and Hunter, W. N.
(2003) Biosynthesis of isoprenoids: Crystal structure of 4-diphosphocytidyl-
2C-methyl-D-erythritol kinase, Proc Natl Acad Sci U S A, 100, 9173–9178.
Milburn, D., Laskowski, R. A. and Thornton, J. M. (1998) Sequences annotated
by structure: a tool to facilitate the use of structural information in sequence
analysis, Protein Eng., 11, 855–859.
Missinou, M. A., Borrmann, S., Schindler, A., Issifou, S., Adegnika, A. A., Mat-
207

BIBLIOGRAPHY BIBLIOGRAPHY
siegui, P.-B., Binder, R., Lell, B., Wiesner, J., Baranek, T., Jomaa, H. and
Kremsner, P. G. (2002) Fosmidomycin for malaria, Lancet, 360, 1941–1942.
Mitts, M. R., Grant, D. B. and Heideman, W. (1990) Adenylate cyclase in Sac-
charomyces cerevisiae is a peripheral membrane protein, Mol Cell Biol, 10,
3873–3883.
Moller, S., Croning, M. D. and Apweiler, R. (2001) Evaluation of methods for
the prediction of membrane spanning regions, Bioinformatics, 17, 646–653.
Moller, S., Kriventseva, E. V. and Apweiler, R. (2000) A collection of well char-
acterised integral membrane proteins, Bioinformatics, 16, 1159–1160.
Moreira, D., Le Guyader, H. and Philippe, H. (2000) The origin of red algae and
the evolution of chloroplasts, Nature, 405, 69–72.
Na-Bangchang, K., Ruengweerayut, R., Karbwang, J., Chauemung, A. and
Hutchinson, D. (2007) Pharmacokinetics and pharmacodynamics of fos-
midomycin monotherapy and combination therapy with clindamycin in the
treatment of multidrug resistant falciparum malaria, Malar J, 6, 70–70.
Nair, R. and Rost, B. (2004) LOCnet and LOCtarget: sub-cellular localization
for structural genomics targets, Nuc. Ac. Res., 32, W517–W521.
Nakai, K. and Horton, P. (1999) PSORT: a program for detecting sorting signals
in proteins and predicting their subcellular localization, Trends Biochem Sci,
24, 34–36.
Nakai, K. and Kanehisa, M. (1992) A knowledge base for predicting protein lo-
calization sites in eukaryotic cells, Genomics, 14, 897–911.
208

BIBLIOGRAPHY BIBLIOGRAPHY
Nayal, M., Hitz, B. C. and Honig, B. (1999) GRASS: a server for the graphical
representation and analysis of structures, Protein Sci., 8, 676–679.
Neshich, G., Togawa, R. C., Mancini, A. L., Kuser, P. R., Yamagishi, M. E. B.,
Pappas, G., Torres, W. V., Fonseca e Campos, T., Ferreira, L. L., Luna, F. M.,
Oliveira, A. G., Miura, R. T., Inoue, M. K., Horita, L. G., de Souza, D. F.,
Dominiquini, F., Alvaro, A., Lima, C. S., Ogawa, F. O., Gomes, G. B., Palan-
drani, J. F., dos Santos, G. F., de Freitas, E. M., Mattiuz, A. R., Costa, I. C.,
de Almeida, C. L., Souza, S., Baudet, C. and Higa, R. H. (2003) STING Mil-
lennium: A web-based suite of programs for comprehensive and simultaneous
analysis of protein structure and sequence, Nuc. Ac. Res., 31, 3386–3392.
Ni, S., Robinson, H., Marsing, G. C., Bussiere, D. E. and Kennedy, M. A. (2004)
Structure of 2C-methyl-D-erythritol-2,4-cyclodiphosphate synthase from She-
wanella oneidensis at 1.6 A: identification of farnesyl pyrophosphate trapped
in a hydrophobic cavity, Acta Crystallogr D Biol Crystallogr, 60, 1949–1957.
Nicola, G., Smith, C. A., Lucumi, E., Kuo, M. R., Karagyozov, L., Fidock, D. A.,
Sacchettini, J. C. and Abagyan, R. (2007) Discovery of novel inhibitors target-
ing enoyl-acyl carrier protein reductase in Plasmodium falciparum by structure-
based virtual screening, Biochem Biophys Res Commun, 358, 686–691.
Niedermayer, D., (1998). An introduction to bayesian networks and their con-
temporary applications. http://www.niedermayer.ca/papers/bayesian/.
Nielsen, H., Engelbrecht, J., Brunak, S. and von Heijne, G. (1997) Identification
of prokaryotic and eukaryotic signal peptides and prediction of their cleavage
sites, Protein Eng, 10, 1–6.
209

BIBLIOGRAPHY BIBLIOGRAPHY
Nilsson, J., Persson, B. and von Heijne, G. (2000) Consensus predictions of mem-
brane protein topology, FEBS Lett, 486, 267–269.
Oinn, T. M. (2003) Talisman–rapid application development for the grid, Bioin-
formatics, 19 Suppl 1, i212–i214.
Oinn, T., Addis, M., Ferris, J., Marvin, D., Senger, M., Greenwood, M.,
Carver, T., Glover, K., Pocock, M. R., Wipat, A. and Li, P. (2004) Taverna: a
tool for the composition and enactment of bioinformatics workflows, Bioinfor-
matics, 20, 3045–3054.
Okuhara, M., Kuroda, Y., Goto, T., Okamoto, M., Terano, H., Kohsaka, M.,
Aoki, H. and Imanaka, H. (1980) Studies on new phosphonic acid antibiotics.
III. Isolation and characterization of FR-31564, FR-32863 and FR-33289, J
Antibiot (Tokyo), 33, 24–28.
Oliveira, L., Hulsen, T., Lutje Hulsik, D., Paiva, A. C. M. and Vriend, G. (2004)
Heavier-than-air flying machines are impossible, FEBS Lett, 564, 269–273.
Oppenheim, J. J., Biragyn, A., Kwak, L. W. and Yang, D. (2003) Roles of an-
timicrobial peptides such as defensins in innate and adaptive immunity, Ann
Rheum Dis, 62 Suppl 2, ii17–ii21.
Oudjama, Y., Durbecq, V., Sainz, G., Clantin, B., Tricot, C., Stalon, V.,
Villeret, V. and Droogmans, L. (2001) Preliminary structural studies of Es-
cherichia coli isopentenyl diphosphate isomerase, Acta Crystallogr D Biol Crys-
tallogr, 57, 287–288.
Overington, J. P., Al-Lazikani, B. and Hopkins, A. L. (2006) How many drug
targets are there?, Nat Rev Drug Discov, 5, 993–996.
210

BIBLIOGRAPHY BIBLIOGRAPHY
Owens, J. (2007) Target validation: Determining druggability, Nat Rev Drug
Discovery, 6, 187.
Palmer, J. D. (2003) The symbiotic birth and spread of plastids: How many times
and whodunit?, J Phycol, 39, 4–12.
Pasquier, C. and Hamodrakas, S. J. (1999) An hierarchical artificial neural net-
work system for the classification of transmembrane proteins, Protein Eng, 12,
631–634.
Pasquier, C., Promponas, V. J., Palaios, G. A., Hamodrakas, J. S. and Hamod-
rakas, S. J. (1999) A novel method for predicting transmembrane segments in
proteins based on a statistical analysis of the SwissProt database: the PRED-
TMR algorithm, Protein Eng, 12, 381–385.
Pearl, J., (August 1985). Bayesian networks: A model of self-activated memory
for evidential reasoning. In Proceedings of the 7th Conference of the Cognitive
Science Society, University of California, Irvine, pages 329–334.
Pearl, J., (1988). Probabilistic Reasoning in Intelligent Systems: Networks of
Plausible Inference. Morgan Kaufmann Publishers Inc., San Francisco, CA,
USA.
Pearl, J., (March 2000). Causality : Models, Reasoning, and Inference. Cam-
bridge University Press.
Pearson, W. R. (1990) Rapid and sensitive sequence comparison with FASTP
and FASTA, Methods Enzymol, 183, 63–98.
Pearson, W. R. and Lipman, D. J. (1988) Improved tools for biological sequence
comparison, Proc Natl Acad Sci U S A, 85, 2444–2448.
211

BIBLIOGRAPHY BIBLIOGRAPHY
Persson, B. and Argos, P. (1997) Prediction of membrane protein topology uti-
lizing multiple sequence alignments, J Protein Chem, 16, 453–457.
Peters, M. B., Raha, K. and Merz, K. M. (2006) Quantum mechanics in structure-
based drug design, Curr Opin Drug Discov Devel, 9, 370–379.
Peyrone, M. (1845) Ueber die einwirkung des ammoniaks auf platinchlorur, Ann
Chemi Pharm, 51, 1–29.
Picot, D., Loll, P. J. and Garavito, R. M. (1994) The X-ray crystal structure of
the membrane protein prostaglandin H2 synthase-1, Nature, 367, 243–249.
Pruess, M., Kersey, P. and Apweiler, R. (2005) The Integr8 project–a resource
for genomic and proteomic data, In Silico Biol, 5, 179–185.
Qian, N. and Sejnowski, T. J. (1988) Predicting the secondary structure of glob-
ular proteins using neural network models, J Mol Biol, 202, 865–884.
Quintrell, N., Lebo, R., Varmus, H., Bishop, J. M., Pettenati, M. J.,
Le Beau, M. M., Diaz, M. O. and Rowley, J. D. (1987) Identification of a
human gene (HCK) that encodes a protein-tyrosine kinase and is expressed in
hemopoietic cells, Mol Cell Biol, 7, 2267–2275.
Quon, D. V., d’Oliveira, C. E. and Johnson, P. J. (1992) Reduced transcription
of the ferredoxin gene in metronidazole-resistant Trichomonas vaginalis, Proc
Natl Acad Sci U S A, 89, 4402–4406.
Rabiner, L. R., (1990). Readings in speech recognition, chapter A tutorial on
hidden Markov models and selected applications in speech recognition, pages
267–296. Morgan Kaufmann Publishers Inc., San Francisco, CA, USA.
212

BIBLIOGRAPHY BIBLIOGRAPHY
Raha, K., Peters, M. B., Wang, B., Yu, N., Wollacott, A. M., Westerhoff, L. M.
and Merz, K. M. (2007) The role of quantum mechanics in structure-based
drug design, Drug Discov Today, 12, 725–731.
Rajaraman, P., Schwartz, B. S., Rothman, N., Yeager, M., Fine, H. A.,
Shapiro, W. R., Selker, R. G., Black, P. M. and Inskip, P. D. (2005) Delta-
aminolevulinic acid dehydratase polymorphism and risk of brain tumors in
adults, Environ Health Perspect, 113, 1209–1211.
Ralph, S. A., D’Ombrain, M. C. and McFadden, G. I. (2001) The apicoplast as
an antimalarial drug target, Drug Resist Updat, 4, 145–151.
Ralph, S. A., Foth, B. J., Hall, N. and McFadden, G. I. (2004a) Evolutionary
pressures on apicoplast transit peptides, Mol Biol Evol, 21, 2183–2194.
Ralph, S. A., van Dooren, G. G., Waller, R. F., Crawford, M. J., Fraunholz, M. J.,
Foth, B. J., Tonkin, C. J., Roos, D. S. and McFadden, G. I. (2004b) Tropical in-
fectious diseases: Metabolic maps and functions of the Plasmodium falciparum
apicoplast, Nat Rev Microbiol, 2, 203–216.
Ricagno, S., Grolle, S., Bringer-Meyer, S., Sahm, H., Lindqvist, Y. and Schnei-
der, G. (2004) Crystal structure of 1-deoxy-d-xylulose-5-phosphate reductoiso-
merase from Zymomonas mobilis at 1.9-A resolution, Biochim Biophys Acta,
1698, 37–44.
Rice, P., (2007). Grid and e-science r&d. Embl-ebi annual scientific report 2007,
EMBL-EBI.
Richard, S. B., Bowman, M. E., Kwiatkowski, W., Kang, I., Chow, C.,
Lillo, A. M., Cane, D. E. and Noel, J. P. (2001) Structure of 4-diphosphocytidyl-
213

BIBLIOGRAPHY BIBLIOGRAPHY
2-C- methylerythritol synthetase involved in mevalonate- independent iso-
prenoid biosynthesis, Nat Struct Biol, 8, 641–648.
Richard, S. B., Ferrer, J.-L., Bowman, M. E., Lillo, A. M., Tetzlaff, C. N.,
Cane, D. E. and Noel, J. P. (2002) Structure and mechanism of 2-C-methyl-
D-erythritol 2,4-cyclodiphosphate synthase. An enzyme in the mevalonate-
independent isoprenoid biosynthetic pathway, J Biol Chem, 277, 8667–8672.
Riedmiller, M. and Braun, H., (1992). Rprop- a fast adaptive learning algorithm.
Technical Report (Also Proc. of ISCIS VII), Universitat Karlsruhe.
Riedmiller, M. and Braun, H., (1993). A direct adaptive method for faster back-
propagation learning: the Rprop algorithm. In Proceedings of the International
Conference on Neural Networks, pages 586–591.
Rindler, M. J. (1998) Carboxypeptidase E, a peripheral membrane protein im-
plicated in the targeting of hormones to secretory granules, co-aggregates with
granule content proteins at acidic pH, J Biol Chem, 273, 31180–31185.
Rochet, H. and Martin-Eauclaire, M.-F. (eds.), (2000). Animal Toxins: Facts
and Protocols. Birkhauser, Basel, Switzerland.
Rodrıguez-Concepcion, M. and Boronat, A. (2002) Elucidation of the methylery-
thritol phosphate pathway for isoprenoid biosynthesis in bacteria and plastids.
A metabolic milestone achieved through genomics, Plant Physiol, 130, 1079–
1089.
Rohdich, F., Eisenreich, W., Wungsintaweekul, J., Hecht, S., Schuhr, C. A.
and Bacher, A. (2001) Biosynthesis of terpenoids. 2C-Methyl-D-erythritol
214

BIBLIOGRAPHY BIBLIOGRAPHY
2,4-cyclodiphosphate synthase (IspF) from Plasmodium falciparum, Eur J
Biochem, 268, 3190–3197.
Rohdich, F., Bacher, A. and Eisenreich, W. (2004) Perspectives in anti-infective
drug design. The late steps in the biosynthesis of the universal terpenoid pre-
cursors, isopentenyl diphosphate and dimethylallyl diphosphate, Bioorg Chem,
32, 292–308.
Rohmer, M. (1999) The discovery of a mevalonate-independent pathway for iso-
prenoid biosynthesis in bacteria, algae and higher plants, Nat Prod Rep, 16,
565–574.
Roizen, N., Swisher, C. N., Stein, M. A., Hopkins, J., Boyer, K. M., Holfels, E.,
Mets, M. B., Stein, L., Patel, D. and Meier, P. (1995) Neurologic and develop-
mental outcome in treated congenital toxoplasmosis, Pediatrics, 95, 11–20.
Rosenberg, B., Vancamp, L. and Krigas, T. (1965) Inhibition of cell division in
Escherichia Coli by electrolysis products from a platinum electrode, Nature,
205, 698–699.
Rost, B. (1996) PHD: predicting one-dimensional protein structure by profile-
based neural networks, Meth. Enzymol., 266, 525–539.
Rost, B., Yachdav, G. and Liu, J. (2004) The PredictProtein server, Nucleic Acids
Res, 32, W321–W326.
Rumelhart, D. E. and McClelland, J. L. (1986) On learning the past tenses of
english verbs, Parallel distributed processing: explorations in the microstructure
of cognition, vol. 2: psychological and biological models, pages 216–271.
215

BIBLIOGRAPHY BIBLIOGRAPHY
Russell, S. J. and Norvig, P., (2003). Artificial Intelligence: A Modern Approach.
Pearson Education.
Russell, S. J., Norvig, P., Candy, J. F., Malik, J. M. and Edwards, D. D., (1996).
Artificial intelligence: a modern approach. Prentice-Hall, Inc., Upper Saddle
River, NJ, USA.
Ryan, C. A., Pearce, G., Scheer, J. and Moura, D. S. (2002) Polypeptide hor-
mones, Plant Cell, 14 Suppl, S251–S264.
Sacchettini, J. C. and Poulter, C. D. (1997) Creating isoprenoid diversity, Science,
277, 1788–1789.
Samuelsen, O., Haukland, H. H., Jenssen, H., Kramer, M., Sandvik, K., Ul-
vatne, H. and Vorland, L. H. (2005) Induced resistance to the antimicrobial
peptide lactoferricin B in Staphylococcus aureus, FEBS Lett, 579, 3421–3426.
Sanger, F., Nicklen, S. and Coulson, A. R. (1977) DNA sequencing with chain-
terminating inhibitors, Proc Natl Acad Sci U S A, 74, 5463–5467.
Saphire, E. O. (2002) Structure-based drug design, IDrugs, 5, 658–661.
Sauret-Gueto, S., Uros, E. M., Ibanez, E., Boronat, A. and Rodrıguez-
Concepcion, M. (2006) A mutant pyruvate dehydrogenase E1 subunit allows
survival of Escherichia coli strains defective in 1-deoxy-D-xylulose 5-phosphate
synthase, FEBS Lett, 580, 736–740.
Schiffmann, W., Joost, M. and Werner, R., (1993). Comparison of optimized
backpropagation algorithms. In Proc. ESANN 93.
216
BIBLIOGRAPHY BIBLIOGRAPHY
Schmitt, C. K., Meysick, K. C. and O’Brien, A. D. (1999) Bacterial toxins:
Friends or foes?, Emerg Infect Dis, 5, 224–234.
Schultz, J., Milpetz, F., Bork, P. and Ponting, C. P. (1998) SMART, a simple
modular architecture research tool: Identification of signaling domains, Proc.
Natl. Acad. Sci. USA, 95, 5857–5864.
Scinicariello, F., Murray, H. E., Moffett, D. B., Abadin, H. G., Sexton, M. J. and
Fowler, B. A. (2007) Lead and delta-aminolevulinic acid dehydratase polymor-
phism: Where does it lead? A meta-analysis, Environ Health Perspect, 115,
35–41.
Scordis, P., Flower, D. R. and Attwood, T. K. (1999) FingerPRINTScan: intel-
ligent searching of the PRINTS motif database, Bioinformatics, 15, 799–806.
Seemann, M., Bui, B. T. S., Wolff, M., Tritsch, D., Campos, N., Boronat, A.,
Marquet, A. and Rohmer, M. (2002) Isoprenoid biosynthesis through the
methylerythritol phosphate pathway: the (E)-4-hydroxy-3-methylbut-2-enyl
diphosphate synthase (GcpE) is a [4Fe-4S] protein, Angew Chem Int Ed Engl,
41, 4337–4339.
Seemann, M., Tse Sum Bui, B., Wolff, M., Miginiac-Maslow, M. and Rohmer, M.
(2006) Isoprenoid biosynthesis in plant chloroplasts via the MEP pathway:
Direct thylakoid/ferredoxin-dependent photoreduction of GcpE/IspG, FEBS
Lett, 580, 1547–1552.
Seemann, M., Wegner, P., Schunemann, V., Bui, B. T. S., Wolff, M., Marquet, A.,
Trautwein, A. X. and Rohmer, M. (2005) Isoprenoid biosynthesis in chloroplasts
via the methylerythritol phosphate pathway: the (E)-4-hydroxy-3-methylbut-
217

BIBLIOGRAPHY BIBLIOGRAPHY
2-enyl diphosphate synthase (GcpE) from Arabidopsis thaliana is a [4Fe-4S]
protein, J Biol Inorg Chem, 10, 131–137.
Senger, M., Rice, P. and Oinn, T., (2003). SoapLab — a unified sesame door to
analysis tools. In Proceedings of the UK e-Science All Hands Meeting 2003.
Sethi, V. S. (1971) Structure and function of DNA-dependent RNA-polymerase,
Prog Biophys Mol Biol, 23, 67–6101.
Sgraja, T., Kemp, L. E., Ramsden, N. and Hunter, W. N. (2005) A double muta-
tion of Escherichia coli2C-methyl-D-erythritol-2,4-cyclodiphosphate synthase
disrupts six hydrogen bonds with, yet fails to prevent binding of, an isoprenoid
diphosphate, Acta Crystallograph Sect F Struct Biol Cryst Commun, 61, 625–
629.
Shah, S. P., He, D. Y. M., Sawkins, J. N., Druce, J. C., Quon, G., Lett, D.,
Zheng, G. X. Y., Xu, T. and Ouellette, B. F. F. (2004) Pegasys: software for
executing and integrating analyses of biological sequences, BMC Bioinformat-
ics, 5, 40–40.
Shaikh, S. A., Ahmed, S. R. and Jayaram, B. (2004) A molecular thermodynamic
view of DNA-drug interactions: a case study of 25 minor-groove binders, Arch
Biochem Biophys, 429, 81–99.
Shigi, Y. (1989) Inhibition of bacterial isoprenoid synthesis by fosmidomycin, a
phosphonic acid-containing antibiotic, J Antimicrob Chemother, 24, 131–145.
Siepel, A., Farmer, A., Tolopko, A., Zhuang, M., Mendes, P., Beavis, W. and
Sobral, B. (2001) ISYS: a decentralized, component-based approach to the
218

BIBLIOGRAPHY BIBLIOGRAPHY
integration of heterogeneous bioinformatics resources, Bioinformatics, 17, 83–
94.
Singh, N., Cheve, G., Avery, M. A. and McCurdy, C. R. (2006a) Comparative
protein modeling of 1-deoxy-D-xylulose-5-phosphate reductoisomerase enzyme
from Plasmodium falciparum: a potential target for antimalarial drug discov-
ery, J Chem Inf Model, 46, 1360–1370.
Singh, S., Malik, B. K. and Sharma, D. K. (2006b) Molecular drug targets and
structure based drug design: A holistic approach, Bioinformation, 1, 314–320.
Sirois, S., Hatzakis, G., Wei, D., Du, Q. and Chou, K.-C. (2005) Assessment of
chemical libraries for their druggability, Comput Biol Chem, 29, 55–67.
Small, I., Peeters, N., Legeai, F. and Lurin, C. (2004) Predotar: A tool for rapidly
screening proteomes for N-terminal targeting sequences, Proteomics, 4, 1581–
1590.
Song, S. S., Kwok, Y. K. and Hwang, K., (2005). Trusted job scheduling in
open computational grids: Security-driven heuristics and a fast genetic algo-
rithm. In 19th IEEE International Parallel & Distributed Processing Sympo-
sium (IPDPS’05), Los Alamitos, CA, USA. IEEE Computer Society Press.
Spinosa, E. J. and de Carvalho, A. C. P. L. F. (2005) Support vector machines
for novel class detection in Bioinformatics, GMR, 4, 608–615.
Spooner, D. P., Cao2, J., Jarvis, S. A., He, L. and Nudd, G. R. (2004)
Performance-aware workflow management for grid computing, The Computer
Journal, 48, 347–357.
219

BIBLIOGRAPHY BIBLIOGRAPHY
Spurgeon, S. L. and Porter, J. W., (1981). in Biosynthesis of Isoprenoid Com-
pounds. John Wiley, New York.
Steinbacher, S., Kaiser, J., Eisenreich, W., Huber, R., Bacher, A. and Rohdich, F.
(2003a) Structural basis of fosmidomycin action revealed by the complex with
2-C-methyl-D-erythritol 4-phosphate synthase (IspC). Implications for the cat-
alytic mechanism and anti-malaria drug development, J Biol Chem, 278,
18401–18407.
Steinbacher, S., Kaiser, J., Gerhardt, S., Eisenreich, W., Huber, R., Bacher, A.
and Rohdich, F. (2003b) Crystal structure of the type II isopentenyl diphos-
phate:dimethylallyl diphosphate isomerase from Bacillus subtilis, J Mol Biol,
329, 973–982.
Steinbacher, S., Kaiser, J., Wungsintaweekul, J., Hecht, S., Eisenreich, W.,
Gerhardt, S., Bacher, A. and Rohdich, F. (2002) Structure of 2C-methyl-d-
erythritol-2,4-cyclodiphosphate synthase involved in mevalonate-independent
biosynthesis of isoprenoids, J Mol Biol, 316, 79–88.
Sugiyama, Y. (2005) Druggability: selecting optimized drug candidates, Drug
Discov Today, 10, 1577–1579.
Summons, R. (1999) Molecular probing of deep secrets, Nature, 398, 752–753.
Surolia, N. and Surolia, A. (2001) Triclosan offers protection against blood stages
of malaria by inhibiting enoyl-ACP reductase of Plasmodium falciparum, Nat
Med, 7, 167–173.
Swindells, M. and Fagan, R. (2001) Target discovery using bioinformatics, Chem-
ical Innovation, 31, 24–28.
220

BIBLIOGRAPHY BIBLIOGRAPHY
Swindells, M. B. and Overington, J. P. (2002) Prioritizing the proteome: Identi-
fying pharmaceutically relevant targets, Drug Discov Today, 7, 516–521.
Tang, F., Chua, C. L., Ho, L.-Y., Lim, Y. P., Issac, P. and Krishnan, A. (2005)
Wildfire: distributed, Grid-enabled workflow construction and execution, BMC
Bioinformatics, 6, 69–69.
Tannenbaum, T., Wright, D., Miller, K. and Livny, M., (2002). Condor: a dis-
tributed job scheduler. MIT Press, Cambridge, MA, USA.
Taylor, I., Shields, M. and Wang, I., (2004). Resource management for the Triana
peer-to-peer services. Kluwer Academic Publishers, Norwell, MA, USA.
Taylor, P. D., Attwood, T. K. and Flower, D. R. (2003) BPROMPT: A consensus
server for membrane protein prediction, Nucleic Acids Res, 31, 3698–3700.
Terstappen, G. C. and Reggiani, A. (2001) In silico research in drug discovery,
Trends Pharmacol Sci, 22, 23–26.
Tintelnot-Blomley, M. and Lewis, R. A. (2006) A critical appraisal of structure-
based drug design, IDrugs, 9, 114–118.
Todd, A. E., Orengo, C. A. and Thornton, J. M. (1999) Evolution of protein
function, from a structural perspective, Curr Opin Chem Biol, 3, 548–556.
Tomita, K., Fukai, S., Ishitani, R., Ueda, T., Takeuchi, N., Vassylyev, D. G. and
Nureki, O. (2004) Structural basis for template-independent RNA polymeriza-
tion, Nature, 430, 700–704.
Tusnady, G. E. and Simon, I. (1998) Principles governing amino acid composition
221

BIBLIOGRAPHY BIBLIOGRAPHY
of integral membrane proteins: Application to topology prediction, J Mol Biol,
283, 489–506.
Tusnady, G. E. and Simon, I. (2001) The HMMTOP transmembrane topology
prediction server, Bioinformatics, 17, 849–850.
van Dooren, G. G., Su, V., D’Ombrain, M. C. and McFadden, G. I. (2002) Pro-
cessing of an apicoplast leader sequence in Plasmodium falciparum and the
identification of a putative leader cleavage enzyme, J Biol Chem, 277, 23612–
23619.
van Kraaij, C., de Vos, W. M., Siezen, R. J. and Kuipers, O. P. (1999) Lan-
tibiotics: biosynthesis, mode of action and applications, Nat Prod Rep, 16,
575–587.
Vapnik, V. N., (1995). The nature of statistical learning theory. Springer-Verlag
New York, Inc., New York, NY, USA.
Vellai, T., Takacs, K. and Vida, G. (1998) A new aspect to the origin and evolu-
tion of eukaryotes, J Mol Evol, 46, 499–507.
Vogtherr, M. and Fiebig, K. (2003) NMR-based screening methods for lead dis-
covery, EXS, pages 183–202.
Volarath, P., Harrison, R. W. and Weber, I. T. (2007) Structure based drug design
for HIV protease: from molecular modeling to cheminformatics, Curr Top Med
Chem, 7, 1030–1038.
von Heijne, G. (1992) Membrane protein structure prediction. Hydrophobicity
analysis and the positive-inside rule, J Mol Biol, 225, 487–494.
222
BIBLIOGRAPHY BIBLIOGRAPHY
von Heijne, G. (1999) Recent advances in the understanding of membrane protein
assembly and structure, Q Rev Biophys, 32, 285–307.
Vorland, L. H., Ulvatne, H., Andersen, J., Haukland, H. H., Rekdal, O., Svend-
sen, J. S. and Gutteberg, T. J. (1999) Antibacterial effects of lactoferricin B,
Scand J Infect Dis, 31, 179–184.
Wada, T., Kuzuyama, T., Satoh, S., Kuramitsu, S., Yokoyama, S., Unzai, S.,
Tame, J. R. H. and Park, S.-Y. (2003) Crystal structure of 4-(cytidine 5’-
diphospho)-2-C-methyl-D-erythritol kinase, an enzyme in the non-mevalonate
pathway of isoprenoid synthesis, J Biol Chem, 278, 30022–30027.
Wahlberg, J. M. and Spiess, M. (1997) Multiple determinants direct the orien-
tation of signal-anchor proteins: the topogenic role of the hydrophobic signal
domain, J Cell Biol, 137, 555–562.
Waller, R. F., Keeling, P. J., Donald, R. G., Striepen, B., Handman, E., Lang-
Unnasch, N., Cowman, A. F., Besra, G. S., Roos, D. S. and McFadden, G. I.
(1998) Nuclear-encoded proteins target to the plastid in Toxoplasma gondii
and Plasmodium falciparum, Proc Natl Acad Sci U S A, 95, 12352–12357.
Waller, R. F., Reed, M. B., Cowman, A. F. and McFadden, G. I. (2000) Pro-
tein trafficking to the plastid of Plasmodium falciparum is via the secretory
pathway, EMBO J, 19, 1794–1802.
Waller, R. F., Keeling, P. J., van Dooren, G. G. and McFadden, G. I. (2003)
Comment on A green algal apicoplast ancestor, Science, 301, 49; author reply
49–49; author reply 49.
223

BIBLIOGRAPHY BIBLIOGRAPHY
Waller, R. F. and McFadden, G. I. (2005) The apicoplast: a review of the derived
plastid of apicomplexan parasites, Curr Issues Mol Biol, 7, 57–79.
Waller, R. F., Ralph, S. A., Reed, M. B., Su, V., Douglas, J. D., Minnikin, D. E.,
Cowman, A. F., Besra, G. S. and McFadden, G. I. (2003) A type II pathway
for fatty acid biosynthesis presents drug targets in Plasmodium falciparum,
Antimicrob Agents Chemother, 47, 297–301.
Wallin, E. and von Heijne, G. (1998) Genome-wide analysis of integral membrane
proteins from eubacterial, archaean, and eukaryotic organisms, Protein Sci, 7,
1029–1038.
Wanke, M., Skorupinska-Tudek, K. and Swiezewska, E. (2001) Isoprenoid
biosynthesis via 1-deoxy-D-xylulose 5-phosphate/2-C-methyl-D-erythritol 4-
phosphate (DOXP/MEP) pathway, Acta Biochim Pol, 48, 663–672.
Weir, M., Swindells, M. and Overington, J. (2001) Insights into protein function
through large-scale computational analysis of sequence and structure, Trends
Biotechnol, 19, S61–S66.
Wendt, K. U., Poralla, K. and Schulz, G. E. (1997) Structure and function of a
squalene cyclase, Science, 277, 1811–1815.
White, S. H. and Wimley, W. C. (1999) Membrane protein folding and stability:
Physical principles, Annu Rev Biophys Biomol Struct, 28, 319–365.
White, S. H. (2004) The progress of membrane protein structure determination,
Protein Sci, 13, 1948–1949.
W.H.O., (1999). World health report - 1999. Periodical, World Health Organi-
zation, Geneva.
224

BIBLIOGRAPHY BIBLIOGRAPHY
Wickramasinghe, S. R., Inglis, K. A., Urch, J. E., Muller, S., van Aalten, D.
M. F. and Fairlamb, A. H. (2006) Kinetic, inhibition and structural studies on
3-oxoacyl-ACP reductase from Plasmodium falciparum, a key enzyme in fatty
acid biosynthesis, Biochem J, 393, 447–457.
Wiesner, J., Borrmann, S. and Jomaa, H. (2003) Fosmidomycin for the treatment
of malaria, Parasitol Res, 90 Suppl 2, S71–S76.
Wiesner, J., Henschker, D., Hutchinson, D. B., Beck, E. and Jomaa, H. (2002)
In vitro and in vivo synergy of fosmidomycin, a novel antimalarial drug, with
clindamycin, Antimicrob Agents Chemother, 46, 2889–2894.
Wilson, R. J., Denny, P. W., Preiser, P. R., Rangachari, K., Roberts, K., Roy, A.,
Whyte, A., Strath, M., Moore, D. J., Moore, P. W. and Williamson, D. H.
(1996) Complete gene map of the plastid-like DNA of the malaria parasite
Plasmodium falciparum, J Mol Biol, 261, 155–172.
Wilson, R. J., Gardner, M. J., Feagin, J. E. and Williamson, D. H. (1991) Have
malaria parasites three genomes?, Parasitol Today, 7, 134–136.
Wilson, R. J. and Williamson, D. H. (1997) Extrachromosomal DNA in the Api-
complexa, Microbiol Mol Biol Rev, 61, 1–16.
Wilson, R. J. M. I. (2005) Parasite plastids: Approaching the endgame, Biol Rev
Camb Philos Soc, 80, 129–153.
Wolff, M., Seemann, M., Tse Sum Bui, B., Frapart, Y., Tritsch, D., Gar-
cia Estrabot, A., Rodrıguez-Concepcion, M., Boronat, A., Marquet, A. and
Rohmer, M. (2003) Isoprenoid biosynthesis via the methylerythritol phos-
phate pathway: the (E)-4-hydroxy-3-methylbut-2-enyl diphosphate reductase
225

BIBLIOGRAPHY BIBLIOGRAPHY
(LytB/IspH) from Escherichia coli is a [4Fe-4S] protein, FEBS Lett, 541, 115–
120.
Wouters, J., Oudjama, Y., Barkley, S. J., Tricot, C., Stalon, V., Droogmans, L.
and Poulter, C. D. (2003) Catalytic mechanism of Escherichia coli isopentenyl
diphosphate isomerase involves Cys-67, Glu-116, and Tyr-104 as suggested by
crystal structures of complexes with transition state analogues and irreversible
inhibitors, J Biol Chem, 278, 11903–11908.
Wouters, J., Oudjama, Y., Stalon, V., Droogmans, L. and Poulter, C. D. (2004)
Crystal structure of the C67A mutant of isopentenyl diphosphate isomerase
complexed with a mechanism-based irreversible inhibitor, Proteins, 54, 216–
221.
Wouters, J., Oudjama, Y., Ghosh, S., Stalon, V., Droogmans, L. and Oldfield, E.
(2003) Structure and mechanism of action of isopentenylpyrophosphate-
dimethylallylpyrophosphate isomerase, J Am Chem Soc, 125, 3198–3199.
Wouters, J., Yin, F., Song, Y., Zhang, Y., Oudjama, Y., Stalon, V., Droog-
mans, L., Morita, C. T. and Oldfield, E. (2005) A crystallographic investi-
gation of phosphoantigen binding to isopentenyl pyrophosphate/dimethylallyl
pyrophosphate isomerase, J Am Chem Soc, 127, 536–537.
Wu, C. H., Apweiler, R., Bairoch, A., Natale, D. A., Barker, W. C., Boeck-
mann, B., Ferro, S., Gasteiger, E., Huang, H., Lopez, R., Magrane, M., Mar-
tin, M. J., Mazumder, R., O’Donovan, C., Redaschi, N. and Suzek, B. (2006)
The Universal Protein Resource (UniProt): an expanding universe of protein
information, Nucleic Acids Res, 34, D187–D191.
226

BIBLIOGRAPHY BIBLIOGRAPHY
Xiang, S., Usunow, G., Lange, G., Busch, M. and Tong, L. (2007) Crystal struc-
ture of 1-deoxy-D-xylulose 5-phosphate synthase, a crucial enzyme for iso-
prenoids biosynthesis, J Biol Chem, 282, 2676–2682.
Xu, Y. and Xu, D. (2000) Protein threading using PROSPECT: design and eval-
uation, Proteins, 40, 343–354.
Yajima, S., Hara, K., Iino, D., Sasaki, Y., Kuzuyama, T., Ohsawa, K. and Seto, H.
(2007) Structure of 1-deoxy-D-xylulose 5-phosphate reductoisomerase in a qua-
ternary complex with a magnesium ion, NADPH and the antimalarial drug fos-
midomycin, Acta Crystallograph Sect F Struct Biol Cryst Commun, 63, 466–
470.
Yajima, S., Nonaka, T., Kuzuyama, T., Seto, H. and Ohsawa, K. (2002) Crystal
structure of 1-deoxy-D-xylulose 5-phosphate reductoisomerase complexed with
cofactors: Implications of a flexible loop movement upon substrate binding, J
Biochem (Tokyo), 131, 313–317.
Yan, S., Appleby, T., Larson, G., Wu, J. Z., Hamatake, R. K., Hong, Z. and
Yao, N. (2007) Thiazolone-acylsulfonamides as novel HCV NS5B polymerase
allosteric inhibitors: Convergence of structure-based drug design and X-ray
crystallographic study, Bioorg Med Chem Lett, 17, 1991–1995.
Yasin, B., Harwig, S. S., Lehrer, R. I. and Wagar, E. A. (1996) Susceptibility of
Chlamydia trachomatis to protegrins and defensins, Infect Immun, 64, 709–
713.
Yu, J. and Buyya, R., (2004). A novel architecture for realizing grid workflow
using tuple spaces. In GRID ’04: Proceedings of the Fifth IEEE/ACM Interna-
227
BIBLIOGRAPHY BIBLIOGRAPHY
tional Workshop on Grid Computing, pages 119–128, Washington, DC, USA.
IEEE Computer Society.
Yu, J. and Buyya, R. (2005a) A taxonomy of scientific workflow systems for grid
computing, SIGMOD Rec., 34, 44–49.
Yu, J. and Buyya, R., (Apr 2005b). A taxonomy of workflow management systems
for grid computing. http://arxiv.org/abs/cs.DC/0503025.
Z., W. A. (1893) Beitrag zur konstitution anorganischer verbindungen, Anorg.
Chem., 3, 267.
Zanchetti, G., Colombi, P., Manzoni, M., Anastasia, L., Caimi, L., Borsani, G.,
Venerando, B., Tettamanti, G., Preti, A., Monti, E. and Bresciani, R. (2007)
Sialidase NEU3 is a peripheral membrane protein localized on the cell surface
and in endosomal structures, Biochem J.
Zdobnov, E. M. and Apweiler, R. (2001) InterProScan–an integration platform for
the signature-recognition methods in InterPro, Bioinformatics, 17, 847–848.
Zell, A., Mamier, G., Vogt, M., Mache, N., Hubner, R., Doring, S., Herrmann, K.-
U., Soyez, T., Schmalzl, M., Sommer, T., Hatzigeorgiou, A., Posselt, D.,
Schreiner, T., Kett, B., Clemente, G. and Wieland, J., (1995). Stuttgart neural
network simulator. http://www-ra.informatik.uni-tuebingen.de/SNNS/.
Zhai, Y. and Saier, M. H. (2002) The beta-barrel finder (BBF) program, allowing
identification of outer membrane beta-barrel proteins encoded within prokary-
otic genomes, Protein Sci, 11, 2196–2207.
Zhang, C., Liu, L., Xu, H., Wei, Z., Wang, Y., Lin, Y. and Gong, W. (2007)
228

BIBLIOGRAPHY BIBLIOGRAPHY
Crystal structures of human IPP isomerase: new insights into the catalytic
mechanism, J Mol Biol, 366, 1437–1446.
Zhang, Z., Carriero, N., Zheng, D., Karro, J., Harrison, P. M. and Gerstein, M.
(2006) PseudoPipe: an automated pseudogene identification pipeline, Bioin-
formatics, 22, 1437–1439.
Zhang, Z., Carriero, N. and Gerstein, M. (2004) Comparative analysis of pro-
cessed pseudogenes in the mouse and human genomes, Trends Genet, 20, 62–
67.
Zhang, Z., Harrison, P. M., Liu, Y. and Gerstein, M. (2003) Millions of years of
evolution preserved: a comprehensive catalog of the processed pseudogenes in
the human genome, Genome Res, 13, 2541–2558.
Zheng, L., White, R. H., Cash, V. L. and Dean, D. R. (1994) Mechanism for the
desulfurization of L-cysteine catalyzed by the nifS gene product, Biochemistry,
33, 4714–4720.
Zheng, L., White, R. H., Cash, V. L., Jack, R. F. and Dean, D. R. (1993) Cysteine
desulfurase activity indicates a role for NIFS in metallocluster biosynthesis,
Proc Natl Acad Sci U S A, 90, 2754–2758.
Zheng, W., Sun, F., Bartlam, M., Li, X., Li, R. and Rao, Z. (2007) The crys-
tal structure of human isopentenyl diphosphate isomerase at 1.7 A resolution
reveals its catalytic mechanism in isoprenoid biosynthesis, J Mol Biol, 366,
1447–1458.
Zuegge, J., Ralph, S., Schmuker, M., McFadden, G. I. and Schneider, G. (2001)
Deciphering apicoplast targeting signals–feature extraction from nuclear-
229

BIBLIOGRAPHY BIBLIOGRAPHY
encoded precursors of Plasmodium falciparum apicoplast proteins, Gene, 280,
19–26.
230