contents · product groups 12 miba 2020 technologies for a cleaner planet 14 trend: population...
TRANSCRIPT


ContentsIntroduction
Key Performance Indicators 2
Preface by the Chief Executive Officer 4
Management Board 6
Supervisory Board 8
Global network 10
Product groups 12
Miba 2020
Technologies for a cleaner planet 14
Trend: population growth 18
Trend: climate change 20
Trend: scarcity of resources 22
Miba 2020 – Dynamic Evolution 24
Global Growth 28
Innovation and Technology 32
People 36
Challenges of the future 40
2014–2015 Consolidated Financial Statements in accordance with IFRS 86
Consolidated income statement 88
Consolidated statement of comprehensive income 89
Consolidated balance sheet 90
Consolidated statement of changes in equity 92
Consolidated cash flow statement 94
Notes to the consolidated financial statements
General disclosures 96
Consolidation 103
Accounting policies 110
Consolidated income statement and consolidated balance sheet disclosures 119
Other disclosures 147
Approval by the Management Board 175
Investees 176
Auditor’s report 184
Report of the Supervisory Board 186
Editorial details 188
Financial calendar 189
Management Report 42
Miba investor relations 44
Business development
Economic conditions 46
Income statement and balance sheet analysis 48
Disclosures in accordance with section 243a (1) of the Austrian Commercial Code (UGB) 51
Risk report 53
Company
Research & development 58
Employees 63
Corporate social responsibility 66
Segment reporting
Miba Europe 68
Miba Americas 70
Miba Asia 72
Miba Shared Services 74
Product groups
Miba sintered components 75
Miba engine bearings 75
Miba friction materials 75
Miba power electronics components 76
Miba coatings 76
Miba special machinery 76
Outlook 77
Corporate governance report 79
Key Performance Indicators 2014–2015
Income Statement (in EUR million) 2014–15 2013–14 2012–13
Revenue 669.3 610.2 606.6
Percentage of revenue outside Austria (%) 92.5 93.2 93.6
EBIT 81.9 70.2 69.9
EBT 80.5 66.7 65.5
Profit after tax 60.6 50.1 48.6
Balance Sheet (in EUR million)
Total assets 741.9 640.1 600.3
Non-current assets 353.4 313.4 286.3
Debt 319.9 290.5 284.3
Equity 422.0 349.6 316.0
Equity as % of total capital 56.9 54.6 52.6
Cash Flow and Capital Expenditure (in EUR million)
Cash flow from operating activities 107.0 103.2 114.3
Capital expenditure (excluding financial assets) 53.4 68.1 51.0
Depreciation, amortization and write-downs 41.0 38.6 37.7
Employees
Average number of employees for the year 4,753 4,294 4,119
Personnel expenses (in EUR million) 203.8 185.3 178.4
Key Stock Market Data (in EUR)
Earnings per share 47.24 39.37 38.44
Dividend per share 8.0* 8.0 8.0
Dividend yield in % 2.0 2.37 3.51
Share price at end of fiscal year (1/31) 399.95 338.0 228.0
* Subject to approval by the Annual General Meeting on June 25, 2015
3

2014 was an eventful and labor-intensive year for Miba. As in the previous years, those markets relevant for Miba developed inconsistently, and yet a positive trend emerged overall. Miba’s performance in this environment was highly encouraging. We were able to maintain or improve our market position thanks primarily to our strong customer focus, leading technologies and products, as well as a highly motivated and high-performing team. This is also reflected in the satisfactory improvement in revenue and profit compared to the previous year.
Compared to the previous year, we were able to increase our revenue by almost 10 percent to EUR 669.3 million and EBIT to EUR 81.9 million. In order to create the basis for further growth, we invested almost EUR 55 million or 8 percent of revenue mostly in expansions to premises and capacity, and brought to completion the major investment projects of the past years. In line with our core value of Technology Leadership, we also worked intensively on developing our products and technologies further as well as on new developments. At EUR 28 million, we invested more than ever in research and development over the past fiscal year. These investments along with our steadfast strong focus on the training and continuing education of our employees has helped us further reinforce our foundation for future growth.
A solid foundation: 2008–2015 strategy period
January 31, 2015, was not only the reporting date for a successful fiscal year for Miba but also the official end date of the Miba 2015 strategy period. As a family company, we place a special emphasis on the long term and on sustainability, which is why in addition to a review of the past fiscal year, I would also like to take this opportunity to provide a brief overview of the 2008–2015 strategy period.
Over this time period, we have increased our revenue from EUR 374.6 million in fiscal year 2008–2009 to EUR 669.3 million in 2014–2015, despite some significant declines during the economic and financial crisis. This corresponds to a growth rate of almost 80 percent in just six years. We grew both organically as well as through acquisitions in all divisions, expanded our technology and product portfolio and strengthened our global position. During this period, we opened a production site for sintered components in the US and have since doubled its capacity in order to keep pace with the growth of the US passenger vehicle market. Due to rapid market growth in China presenting Miba with many opportunities, we also completed an expansion tripling the size of our Suzhou site soon after it opened in 2007. The Miba Friction Group continued its expansionary course with the acquisition of the off-road business of a competitor in 2010. In addition, it doubled in size over the last
seven years and now is among the global market leaders in the off-highway segment. With the acquisition of two manufacturers of passive power electronics components, EBG (resistors) and DAU (heat sinks), Miba also entered into the strategically important energy segment in 2010. The success of these major projects – along with many small ones also playing a role in setting our path for growth – is attributable to our incredibly dynamic and flexible team. My heartfelt thanks go out to our employees – it is encouraging to see what we have achieved over the strategy period, and I know that we will be able to reach major goals in the future, too.
The path to the future: Miba 2020 – Dynamic Evolution
With our “Miba 2020 – Dynamic Evolution” strategy, we defined our work program and the focal points it includes for the upcoming years. As a technology leader and global company, we want to actively contribute to technological advancement and global economic growth and provide answers to a world in transition. Global population growth, climate change and the scarcity of resources demand innovative solutions to topics such as the reduction of CO2 emissions, increased efficiency of existing drive concepts and new alternative energy sources. Here, we see good opportunities for Miba. It is up to us to identify the potential in these opportunities, to exploit them boldly and, in doing so, to provide our customers with added value.
With Miba 2020, we are heading into the future with confidence, a clear vision, strategy and ambitious targets. With our “Innovation in Motion – Technologies for a Cleaner Planet” mission statement, we have the right stimulus.
I hope you will accompany us on our exciting journey to Miba 2020, and I thank you – our customers, shareholders and all of our partners – not only for your interest, but, above all, for the trust you have placed in Miba.
Preface by the Chief Executive Officer
Sincerely,
F. Peter Mitterbauer
4 5
> Miba > Preface by the Chief Executive Officer
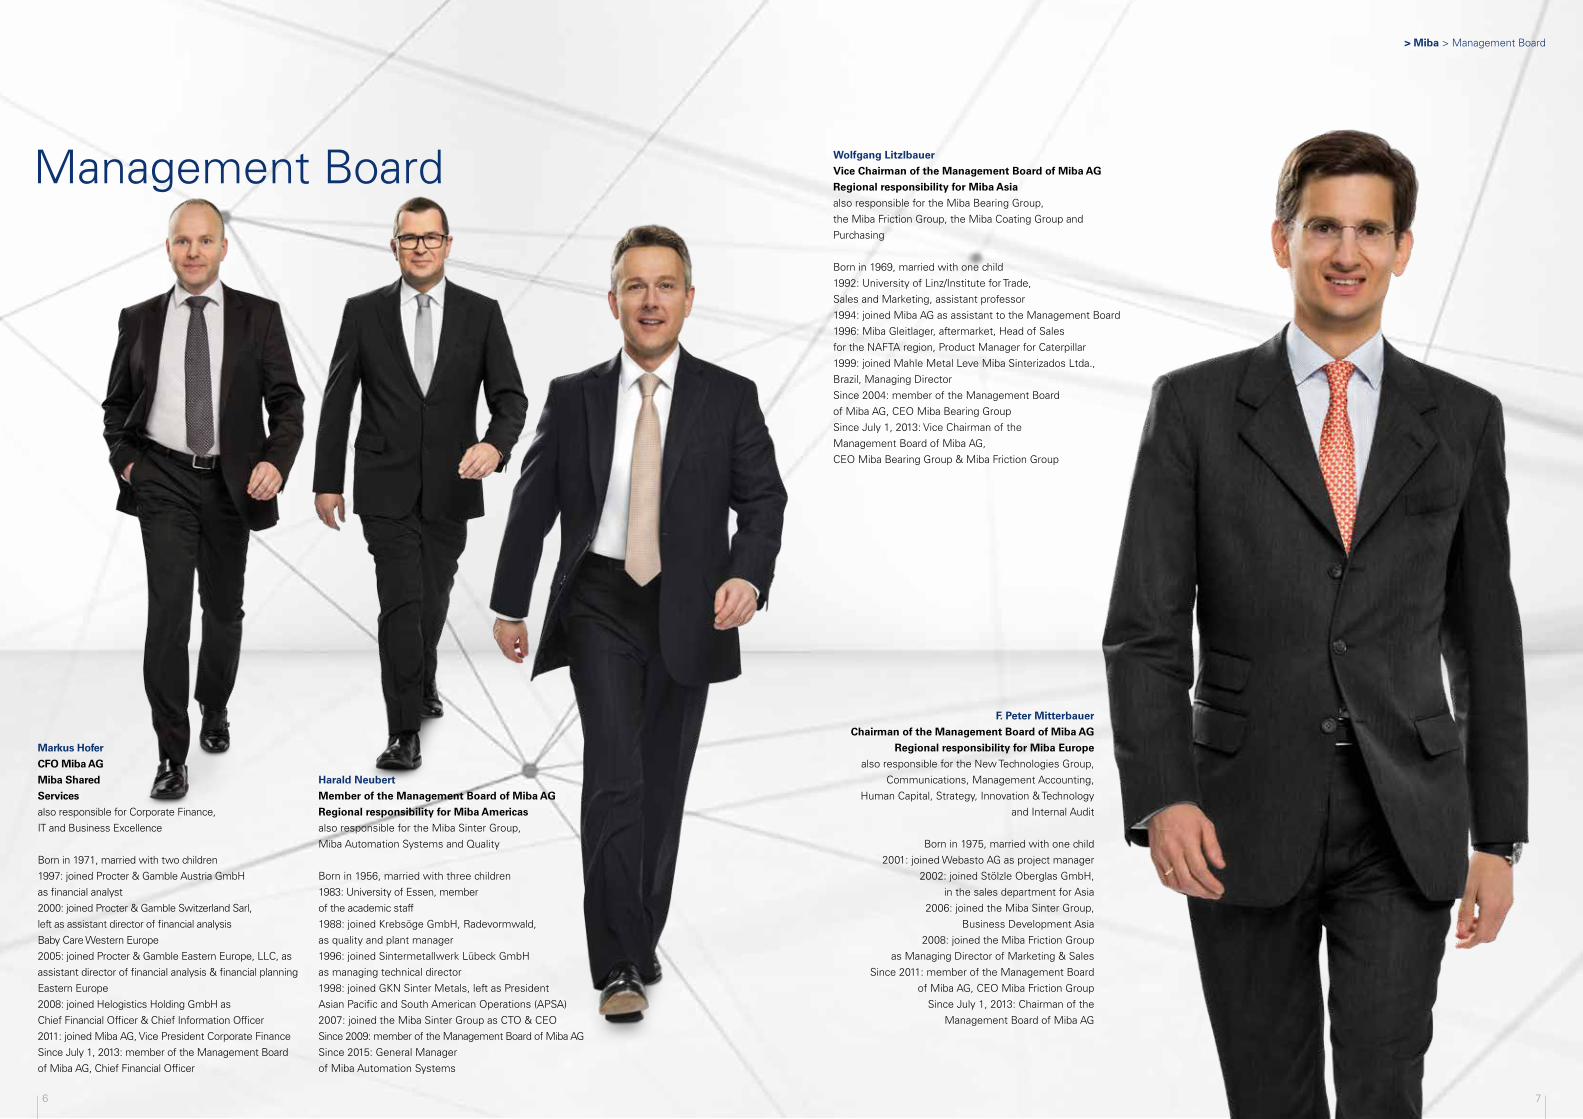
Wolfgang Litzlbauer
Vice Chairman of the Management Board of Miba AG
Regional responsibility for Miba Asia
also responsible for the Miba Bearing Group, the Miba Friction Group, the Miba Coating Group and Purchasing
Born in 1969, married with one child1992: University of Linz/Institute for Trade, Sales and Marketing, assistant professor1994: joined Miba AG as assistant to the Management Board1996: Miba Gleitlager, aftermarket, Head of Sales for the NAFTA region, Product Manager for Caterpillar1999: joined Mahle Metal Leve Miba Sinterizados Ltda., Brazil, Managing DirectorSince 2004: member of the Management Board of Miba AG, CEO Miba Bearing Group Since July 1, 2013: Vice Chairman of the Management Board of Miba AG, CEO Miba Bearing Group & Miba Friction Group
F. Peter Mitterbauer
Chairman of the Management Board of Miba AG
Regional responsibility for Miba Europe
also responsible for the New Technologies Group, Communications, Management Accounting,
Human Capital, Strategy, Innovation & Technology and Internal Audit
Born in 1975, married with one child2001: joined Webasto AG as project manager
2002: joined Stölzle Oberglas GmbH, in the sales department for Asia
2006: joined the Miba Sinter Group, Business Development Asia
2008: joined the Miba Friction Group as Managing Director of Marketing & Sales
Since 2011: member of the Management Board of Miba AG, CEO Miba Friction Group
Since July 1, 2013: Chairman of the Management Board of Miba AG
Harald Neubert
Member of the Management Board of Miba AG
Regional responsibility for Miba Americas
also responsible for the Miba Sinter Group, Miba Automation Systems and Quality
Born in 1956, married with three children1983: University of Essen, member of the academic staff1988: joined Krebsöge GmbH, Radevormwald, as quality and plant manager1996: joined Sintermetallwerk Lübeck GmbH as managing technical director1998: joined GKN Sinter Metals, left as President Asian Pacific and South American Operations (APSA)2007: joined the Miba Sinter Group as CTO & CEOSince 2009: member of the Management Board of Miba AGSince 2015: General Manager of Miba Automation Systems
Markus Hofer
CFO Miba AG
Miba Shared
Services
also responsible for Corporate Finance, IT and Business Excellence
Born in 1971, married with two children1997: joined Procter & Gamble Austria GmbH as financial analyst2000: joined Procter & Gamble Switzerland Sarl, left as assistant director of financial analysis Baby Care Western Europe2005: joined Procter & Gamble Eastern Europe, LLC, as assistant director of financial analysis & financial planning Eastern Europe2008: joined Helogistics Holding GmbH as Chief Financial Officer & Chief Information Officer2011: joined Miba AG, Vice President Corporate FinanceSince July 1, 2013: member of the Management Board of Miba AG, Chief Financial Officer
Management Board
6 7
> Miba > Management Board

Dkfm. Dr. Wolfgang C. Berndt (Chairman of the Supervisory Board),
former president and CEO of Global Fabric and Home Care, The Procter & Gamble Company; first elected on June 27, 2008; Chairman of the Supervisory Board of Miba AG since 2013, with term ending at the 2019 Annual General Meeting; member of the Remuneration Committee
Positions on other supervisory boards: GfK AG, OMV AG, BAST AG, Mitterbauer Beteiligungs-AG (Chair since June 28, 2013)
Dipl.-Bw. Alfred Heinzel (Vice Chairman),
independent; CEO of Heinzel Holding GmbH; first elected on July 4, 2003; Vice Chairman of the Supervisory Board of Miba AG since 2005, with term ending at the 2019 Annual General Meeting; member of the Audit Committee
Positions on other supervisory boards: Mitterbauer Beteiligungs-AG, Allianz Elementar Versicherungs-AG, Verbund AG, Wilfried Heinzel AG (Chair), Zellstoff Pöls AG (Chair), Europapier AG (Chair), Europapier International AG (Chair), Laakirchen Papier AG (Chair), AS Estonian Cell, AS Vao Agro and AS Diner (Chair) (all Estonia)
Dr. Robert Büchelhofer (member of the Supervisory Board until June 27, 2014), independent; former member of the management board of Volkswagen AG; first elected on July 4, 2003; member of the Supervisory Board of Miba AG, with term ending at the 2014 Annual General Meeting
Positions on other supervisory boards: Mitterbauer Beteiligungs-AG, Polytec Holding AG, SWARCO AG (Chair)
DI DDr. h.c. Peter Mitterbauer,
independent; former Chairman of the Management Board of Miba AG; member of the Management Board of Mitterbauer Beteiligungs-AG, first elected on June 28, 2013; member of the Supervisory Board of Miba AG, with term ending at the 2018 Annual General Meeting; member of the Remuneration Committee; member of the Audit Committee
Positions on other supervisory boards: ÖIAG (Chair until June 2014), Andritz AG, Oberbank AG, ERSTE Österreichische Spar-Casse Privatstiftung, Prinzhorn Holding GmbH, Rheinmetall AG
MMag. Peter Oswald,
independent; chairman of the board and CEO of Mondi AG; member of the board of Mondi plc; member of the board of Mondi Ltd., first elected on June 27, 2014; member of the Supervisory Board of Miba AG, with term ending at the 2019 Annual General Meeting
Positions on other supervisory boards: Mitterbauer Beteiligungs-AG
Supervisory Board of Miba AG
ELECTED MEMBERS
Hermann Aigner
Member of the Supervisory Board of Miba AG since 1994; member of the Audit Committee since 2009
Johann Forstner
Member of the Supervisory Board of Miba AG since 2009
DELEGATED MEMBERS
8 9
> Miba > Supervisory Board of Miba AG

MIBA SHARED SERVICES
Miba AG
Laakirchen, Austria
Miba Sinter Holding GmbH & Co KG
Laakirchen, Austria
Miba Friction Holding GmbH
Roitham, Austria
Miba Energy Holding GmbH
Laakirchen, Austria
MIBA AMERICAS
Miba Sinter USA LLC
McConnelsville, OH USA
Mahle Metal Leve
Miba Sinterizados Ltda.*
São Paulo, Brazil
Miba Bearings US LLC
McConnelsville, OH USA
ABM Advanced Bearing
Materials LLC*
Greensburg, IN USA
Miba HydraMechanica Corp.
Sterling Heights, MI USA
EBG Resistors LLC*• Middletown, PA USA
DAU Thermal Solutions
North America Inc.
Macedon, NY USA
Miba Energy Holding LLC
McConnelsville, OH USA
MIBA ASIA
Miba Precision Components
(China) Co. Ltd.
Suzhou, China
Sintercom India Pvt. Ltda.*
Pune, India
Miba Precision Components
(China) Co. Ltd.
Suzhou, China
Miba Far East PTE Ltd.• Singapore
Miba Drivetec India Pvt. Ltd.
Pune, India
Miba Precision Components
(China) Co. Ltd.
Suzhou, China
EBG Shenzhen Ltd.*
Shenzhen, China
PRODUCTION SITES AND SALES OFFICES IN TWELVE COUNTRIES
Miba Sinter Group
Miba Bearing Group
Miba Friction Group
Miba Coating Group
New Technologies Group
Miba Automation Systems
* affiliated companies
• sales/engineering offices
MIBA EUROPE
Miba Sinter Austria GmbH
Vorchdorf, Austria
Miba Sinter Slovakia s.r.o.
Dolný Kubín, Slovakia
Miba Gleitlager GmbH
Laakirchen, Austria
Miba Bearings Materials GmbH
Aurachkirchen, Austria
Miba Frictec GmbH
Roitham, Austria
Miba Steeltec s.r.o.
Vráble, Slovakia
Fibertec Štětí s.r.o.
Štětí, Czech Republic
High Tech Coatings GmbH*
Vorchdorf, Austria
Teer Coatings Ltd.
Droitwich, United Kingdom
EBG Elektronische Bauelemente GmbH
Kirchbach, Austria
DAU GmbH & Co KG
Ligist, Austria
EDMS d.o.o.*
Šentjernej, Slovenia
Miba Automation Systems GmbH
Aurachkirchen, Austria
Global network
10 11
> Miba > Global network

Product groups
Miba sintered components
Miba sintered components are used in engines, transmissions and steering systems of passenger vehicles. Their sophisticated design, which integrates several functions into one component, as well as their high precision, durability and lightweight structure set them apart from the competition. Thus, Miba technology is contributing to greater efficiency and is helping save on fuel consumption.
Miba friction materials
Friction materials are the decisive performance elements in vehicle clutches and brakes, optimizing speed and power. Miba Friction Group components reduce weight and the size of transmissions and axles. They are used in construction machinery, tractors, passenger vehicles, trucks, high-speed trains, motorcycles, aircraft and wind power plants.
Miba engine bearings
Engine bearings are crucial components that significantly affect engine function and service life. They help position crank- and camshafts, minimize friction during operation and protect the engine against damage and breakdown. They are used in diesel and gas engines in ships, heavy-duty vehicles, locomotives and power plants. The bearings produced by the Miba Bearing Group withstand higher ignition pressures, thus increasing engine efficiency.
Miba power electronics components
Resistors are among the Miba power electronics components. They are used in the conversion and transmission of energy. Miba resistors can be found, for instance, in the power electronics of frequency converters in wind turbines or in high-speed trains. Heat sinks and heat pipes are other examples of power electronics components. They protect electronic components from overheating and are used, for instance, in drive train control units, converters for electric motors and wind power plants.
Miba coatings
Miba develops customized coating solutions for refining functional surfaces. Among its core technologies are polymer and low-friction coatings for functional surfaces, electroplated overlays and PVD coatings. These coatings ensure maximum service life and optimum functionality. Miba coatings are used in components for engines and transmissions of passenger vehicles, trucks and Formula 1 race cars, as well as in other high-performance applications.
Miba special machinery
Miba’s special machinery is used for high-precision and efficient machining of small to very large components. Miba Automation Systems is a leader in engine bearing technology, robotics and automation, as well as stationary and mobile special machinery which is mainly used in the construction of power plants. Apart from power electronics, the core segment, special machinery is also part of the New Technologies Group.
MIBA IS AN INTERNATIONAL GROUP PRODUCING HIGH-PERFORMANCE AND TECHNOLOGICALLY DEMANDING POWER TRAIN COMPONENTS. WE SUPPORT OUR CUSTOMERS WORLDWIDE FROM DEVELOPMENT TO IMPLEMENTATION OF INDIVIDUAL SOLUTIONS. MIBA TECHNOLOGY ENABLES RESOURCE-EFFICIENT MOBILITY.
12 13
> Miba > Product groups

Technologies for a cleaner planet
MOBILITY AND POWER GENERATION ARE CHANGING – OUR MISSION IS TO REDUCE CO2 EMISSIONS, INCREASE EFFICIENCY OF EXISTING DRIVE CONCEPTS AND KEEP PACE WITH THE TREND TOWARD NEW ALTERNATIVE ENERGY SOURCES WITH PIONEERING TECHNOLOGIES.
> Miba > Technologies for a cleaner planet
1514

At Miba, thinking in a forward-looking manner means actively protecting the environment. Miba products improve the performance of motor vehicles, trains, ships, aircraft and power plants across the world and make them more efficient and environmentally friendly. We all reap the benefits of these results – today and tomorrow. We always keep a keen eye on the developments of the future: Megatrends such as population growth, climate change and the scarcity of resources play an important role in the upcoming years.
Our mission: contributing to a clean planet. Starting in production, active environmental management is the critical factor in improving ecological and economic efficiency. We focus on optimizing the use of energy and other resources, reducing emissions and using environment-friendly materials and equipment.
But it is primarily our products themselves that contribute to a livable planet. For instance, power electronics components such as Miba resistors and Miba heat sinks are the key to efficient use of regenerative energy sources. Miba friction materials are used in every other wind turbine worldwide; in construction machinery and tractors, for example, they contribute to the reduction of drag losses and therefore also to fuel efficiency thanks to the efficient friction technology.
By developing direct coatings for connecting rods, we also provide for reduced consumption and lower CO2 emissions: In passenger vehicle engines, these can replace bearing shells resulting in reductions in space and weight among other things. In Miba Gleitlager‘s area of expertise, special coatings for planetary gears are also currently under development, which in turbines, for example, contribute to a significant reduction of kerosene consumption and noise.
With respect to downsizing, weight reduction, vibrations (NHV), fuel efficiency and driving comfort, Miba sintered components offer a large proportion of positive complete solutions. Moreover, we are also involved with technologies for the future such as the electrification or hybridization of vehicle drives.
The result of our efforts is an important contribution to a clean planet – and to the sustained success of our customers and our Company.
1716
> Miba > Technologies for a cleaner planet

9,000,000,000
Population growth
LIFE EXPECTANCIES ARE ON THE RISE; PEOPLE ARE GROWING OLDER. THE DEMOGRAPHIC CHANGE HAS A CLEAR IMPACT ON OUR SOCIETY. BY THE YEAR 2050, OVER NINE BILLION PEOPLE WILL LIVE ON EARTH. THE DEMAND FOR INDIVIDUAL MOBILITY, PARTICULARLY IN ASIA, IS INCREASING.
According to the OECD, life expectancies in the European Union will be 89.1 years for women and 84.6 years for men by the year 2060. But people will not just reach a higher age, they will also age later. Older people will have greater buying power, be more active and, most of all, be more mobile than today. Mobility means flexibility, versatility and the ability to adapt, both on the individual and societal level. What on the one hand implies risk and uncertainty, offers new opportunities on the other hand, the possibility to discover and experience something new. Today, we are at the start of a multimobile age. With this, the search begins for ways to realize these mobility requirements and desires in an economic, convenient and sustainable way. The desire for flexible locomotion, increased transportation of goods and a growing demand for commercial vehicles of all types represent new opportunities for Miba.
Demand in the mobility area increases as a result of the population growth, but more and more energy and food are also required. Increased construction activity, new power plants and growing transportation needs also represent potential for Miba worldwide. A cycle that provides a boost for our innovative technologies and products.
At the same time, the demographic transition represents challenges for us as an employer. We want to retain employees with valuable experience in our Company for longer than at present and we make a point of promoting and supporting older employees.
people by 2050
Source: Zukunftsinstitut GmbH
18 19
> Miba > Population growth
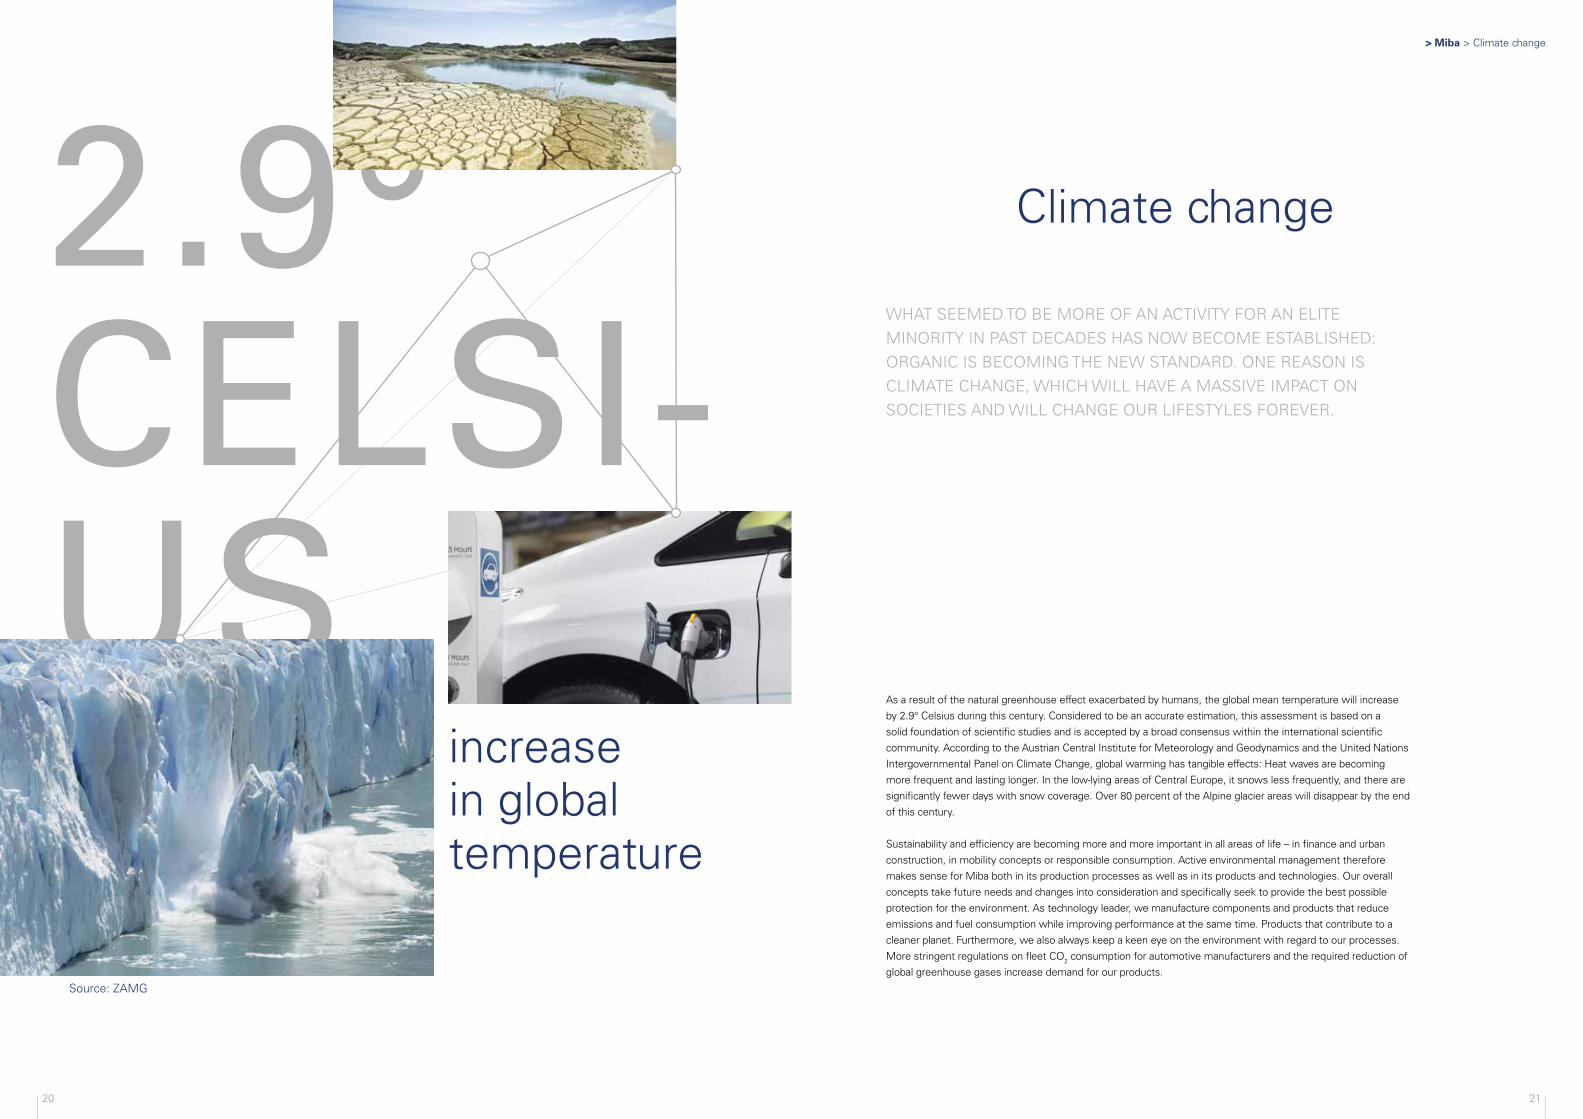
2.9°CELSI-US
Climate change
WHAT SEEMED TO BE MORE OF AN ACTIVITY FOR AN ELITE MINORITY IN PAST DECADES HAS NOW BECOME ESTABLISHED: ORGANIC IS BECOMING THE NEW STANDARD. ONE REASON IS CLIMATE CHANGE, WHICH WILL HAVE A MASSIVE IMPACT ON SOCIETIES AND WILL CHANGE OUR LIFESTYLES FOREVER.
As a result of the natural greenhouse effect exacerbated by humans, the global mean temperature will increase by 2.9° Celsius during this century. Considered to be an accurate estimation, this assessment is based on a solid foundation of scientific studies and is accepted by a broad consensus within the international scientific community. According to the Austrian Central Institute for Meteorology and Geodynamics and the United Nations Intergovernmental Panel on Climate Change, global warming has tangible effects: Heat waves are becoming more frequent and lasting longer. In the low-lying areas of Central Europe, it snows less frequently, and there are significantly fewer days with snow coverage. Over 80 percent of the Alpine glacier areas will disappear by the end of this century.
Sustainability and efficiency are becoming more and more important in all areas of life – in finance and urban construction, in mobility concepts or responsible consumption. Active environmental management therefore makes sense for Miba both in its production processes as well as in its products and technologies. Our overall concepts take future needs and changes into consideration and specifically seek to provide the best possible protection for the environment. As technology leader, we manufacture components and products that reduce emissions and fuel consumption while improving performance at the same time. Products that contribute to a cleaner planet. Furthermore, we also always keep a keen eye on the environment with regard to our processes. More stringent regulations on fleet CO2 consumption for automotive manufacturers and the required reduction of global greenhouse gases increase demand for our products.
increase in global temperature
Source: ZAMG
20 21
> Miba > Climate change

20 RAWMATE- RIALS
METALS, ORES, FOSSIL FUELS, BUT ALSO SOIL AND WATER WILL SOON BE SCARCE. MORE AND MORE PEOPLE WITH AN EVER-GROWING DEMAND FOR FOSSIL FUELS ARE COMPETING FOR HABITABLE LAND, DRINKING WATER, FOOD AND RAW MATERIALS.
The shortage of resources is becoming an issue of central importance, even for the future for global companies. Every second company currently fears economic losses as a result of the globally growing demand for raw materials. In the future, under these new conditions, companies will only be able to generate growth from a new mixture of economy, ecology and social commitment.
A total of 20 raw materials are currently classified as critical by the European Commission, including chromium, silicon, magnesium and metals of the platinum group. The sustainability issue is gaining in significance on an international level; Miba is trying to set standards for responsible environmental management. We are working hard to optimize our energy and raw material consumption on an ongoing basis by improving production processes and using advanced technical processes. Accrued residual material is fed back into the production process whenever possible or passed on to collection centers for recyclable materials. The fact that Miba products consist largely of metallic components that can be recycled is a key advantage.
Careful use of resources plays an important role at Miba when it comes to water, too: Our total water consumption is around 1 million m3; around 70 percent of that amount is used for cooling and is fed back into the natural water cycle in an unchanged state. Since water used for cooling and many other processes does not have to be potable, Miba uses its own wells at many sites. This cuts costs and relieves the burden on the public water supply.
Scarcity of resources
classified as critical
Source: European Commission
22 23
> Miba > Scarcity of resources

Our MissionInnovation in Motion – Technologies for a Cleaner Planet
Our VisionNo power train without Miba technology
Our Goals• Profitable growth to over EUR 1 billion • Increase in revenue from core business
and through M&A• Global number 1 in our market segments
Our StrategyStrive for technology leadership in demanding, financially attractive market segments Dynamic Evolution as the overarching guiding concept supported by three main pillars: Global Growth, Innovation and Technology, People
Our Values• Technology Leadership• Lifelong Learning• Entrepreneurship• Passion for Success
Miba 2020 – Dynamic Evolution
AS A TECHNOLOGY LEADER AND GLOBAL COMPANY, WE ARE MAKING AN ACTIVE CONTRIBUTION TO TECHNICAL PROGRESS AND GLOBAL ECONOMIC GROWTH. GLOBAL POPULATION GROWTH, CLIMATE CHANGE AND THE SCARCITY OF RESOURCES DEMAND INNOVATIVE SOLUTIONS. WE ARE PREPARING FOR THESE TASKS AND HAVE DEFINED OUR FOCUS FOR THE NEXT FEW YEARS. CHANGE ALWAYS MEANS NEW POSSIBILITIES AND OPPORTUNITIES TO BE EXPLOITED. WITH MIBA 2020, WE ARE HEADING INTO THE FUTURE WITH CONFIDENCE, A CLEAR VISION, STRATEGY AND AMBITIOUS TARGETS.
2524
> Miba > Miba 2020

Global GrowthInnovation and
Technology
Speed and agility –faster and better
than the competition
Performance principle –strive for top performance and
consistent implementation
Big goals –making the
impossible possible
Curiosity and thirst for knowledge –individual creativity
as a driver for innovation
Entrepreneurship – courage to
make decisions
People
Lean Processes
100% customer focus –externally and internally
Dynamic Evolution
The basis for Global Growth
MIBA IS CONTINUING TO WORK DILIGENTLY ON THE COMPANY’S FUTURE. IN DOING SO, THE OVERARCHING GUIDING CONCEPT IS DYNAMIC EVOLUTION – A CONCEPT SUPPORTED BY THREE MAIN PILLARS AND UNDERGIRDED BY SIX PRINCIPLES WHICH FORM A SOLID BASIS FOR CONTINUED SUCCESS ACROSS GENERATIONS.
26 27
> Miba > Dynamic Evolution

Global Growth
A STRONG AND RELIABLE PARTNER TO OUR CUSTOMERS ACROSS THE WORLD. WE ARE SEIZING BUSINESS OPPORTUNITIES IN THE WORLD’S MAJOR CENTERS AND DEVELOPING A STRONG PRESENCE THERE. WE ARE GROWING IN OUR EXISTING DIVISIONS AS WELL AS THROUGH THE ACQUISITION OF NEW BUSINESSES. WE ARE FOLLOWING A LOCAL-TO-LOCAL APPROACH AND AS A RESULT WE ARE ESTABLISHING THE REQUIRED COMPETENCIES AND CAPABILITIES IN THESE REGIONS.
2928
> Miba > Global Growth

For Miba, globalization of the markets represents both a challenge and an opportunity for the future. Entrepreneurship is needed, the courage to make decisions: Customer expectations are aimed at global support, fast and professional cooperation is essential for international success. To maintain and further increase its competitiveness, Miba is therefore investing more heavily in the US and China where there are the greatest opportunities for growth for technology-driven companies. Speed and agility are two critical issues when it comes to being faster and better than the competition.
China has largest Miba site worldwide
China is considered to be a country with great potential, particularly in the passenger vehicle and truck market. Miba Precision Components (China) opened the first production site in Asia back in 2007. Five years later, construction work began in the project to triple the size of the area; the second construction phase was officially opened in March 2014. The site now has a total surface area of 24,000 m2. In terms of area, Suzhou is thus among the largest Miba sites worldwide.Local production of engine bearings, sintered components and innovative coatings ensures proximity to international customers in Asia, and friction lining production also offers new potential for growth. As a result of strong demand for transportation capacities as well as for more powerful, more efficient and more environmentally friendly generations of engines, the business with sintered components and engine bearings is developing very dynamically. Individual mobility and the transportation of goods by truck and train are also on the rise in Asia. More cars need more streets, and demand for construction equipment is growing. A cycle with extremely positive effects for Miba’s performance in the individual areas. With the acquisition of the majority shareholding of EBG Shenzhen Ltd. in 2014, Miba also continues to push forward the expansion of its New Technologies Group in Asia. It produces high-power resistors, which are, for example, used in the power electronics of frequency converters or in modern medical equipment.
Promising developments in the US
But Miba is demonstrating its investment strength in the US as well. We have already been present in the American market for over 25 years, at now five production sites, in three sales and engineering offices and with a workforce totaling 600 employees.The area of Miba Sinter USA in McConnelsville, Ohio, was just doubled in July 2014 – the North American market has strong potential for growth, particularly in the passenger vehicle industry. More than 110 employees at the site produce innovative, functional and high-precision sintered components and modules for the automotive industry.
IN THE PAST FEW YEARS, MIBA HAS SUCCESSFULLY MADE THE TRANSITION FROM A MID-SIZED COMPANY TO A GLOBAL GROUP. PROCESS AND DECISION STRUCTURES MUST BE ADAPTED TO SUPPORT THE GLOBAL BUSINESS. CONSISTENT CUSTOMER ORIENTATION – EXTERNALLY AND INTERNALLY – WILL BE MORE IMPORTANT THAN EVER.
With continued growth of the site, this workforce will be further increased in the future. In addition to the passenger vehicle area, the truck segment and the locomotive area in the US show promising developments for Miba.
Europe continues on its successful course
The Miba sites in Slovakia have proven to be exceptionally successful. In Dolný Kubín, new equipment was purchased and areas developed at Miba Sinter Slovakia. The new machining center makes it possible to perform machining work in Slovakia and support other plants in machining projects. Miba Steeltec in Vráble is another success story. The site has grown considerably since the acquisition of the off-road business of a competitor in 2010. Establishing a dual vocational training system based on the Austrian model has been a focus over the past year to secure skilled personnel from the Company’s own ranks. Almost 90 years after the formation of Miba AG, the Miba Forum – a modern head-office building – is being built in Austria at the home site in Laakirchen. The new building will be a customer, technology and learning center to enable new forms of work and collaboration. Our decision to have our headquarters in Upper Austria is a long-term commitment.
100% customer focus
Under the local-to-local approach, Miba produces where its customers live – fulfilling all of our customers’ needs in the best possible way is central to all of our activities. Miba has set itself the task of supplying its customers around the world with uniformly high quality standards and advanced high-tech components. Regardless of the product group, we plan for increased growth in Europe as well as in Asia and the US in upcoming years. To this end, we are introducing efficiency and productivity improvement programs at all our sites and preparing our employees and our organization for the demands of the future.
Miba is determined to grow globally
Globalization of the markets as an opportunity and
a challenge: China is considered to be a country with
great potential. For this reason, the Miba site in Suzhou
was expanded in 2014 and now has an area comprising
24,000 m2. Investments were also made in the US: The
site in McConnelsville, Ohio, was expanded in 2014.
30 31
> Miba > Global Growth

WITH OUR TECHNOLOGIES FOR THE FUTURE, WE ARE STRIVING FOR THE GOAL OF ACHIEVING PRODUCT LEADERSHIP IN OUR DIVISIONS. THE FOCUS OF OUR INNOVATION IS ON ENERGY EFFICIENCY AS WELL AS ON INCREASED PRECISION AND COMFORT IN RELATION TO OUR CUSTOMERS’ PRODUCTS. WE ARE DEVELOPING TECHNOLOGIES FOR A CLEANER PLANET. WE FOSTER A SPIRIT AND CULTURE OF INNOVATION, NURTURE GLOBAL TECHNOLOGICAL COLLABORATION AND PROMOTE THE EXCHANGE OF KNOWLEDGE ACROSS THE GROUP.
Innovation andTechnology
> Miba > Innovation and Technology
3332

Miba is a technology- driven company
The culture of development has always been emphasized at Miba. Innovation and Technology are considered to be the Company’s most important success drivers. A total staff of 235 is employed in research and development, ensuring that customer needs are met and trends for the future are taken on quickly. The innovation process is clearly defined within Miba. In the best case, a creative idea becomes an innovation – in other words, an idea successfully brought to market. To achieve this, ideas from the brainstorming process must undergo various phases: the idea and concept phase, the technology development phase and the process development phase/industrialization. Thus, out of an uncertain starting point arises a specific technology, a specific product, by the end of an innovation process.
Clear commitment to innovation
Miba set itself the task of achieving product leadership in all of its divisions with technologies for the future. In fiscal year 2014–2015, a total of EUR 27.9 million was invested in research and development, representing a research ratio of 4.2 percent of total revenue – an investment that pays off in terms of an ensured competitive advantage. This is also reflected in Miba’s patent applications. The Company holds 233 valid patents; 18 of those alone were applied for in fiscal year 2014–2015. In addition to internal research and development, Miba also trusts in external expertise. Worldwide, Miba relies on the cooperation with over 40 universities and research institutes. But the customers themselves also play a crucial role in the development process. From the beginning, we try to remain involved in the process and are available with our expertise.
New developments shape the market
Miba innovations influence and shape the market in a significant way. The best example of this recently is the Miba Johammer, an extraordinary electric bike. This series-produced electric motorcycle with a range of 200 km has an electric engine made from soft magnetic powder pressed parts – developed by the Miba Sinter Austria team. Due to its lightweight structure and minimal assembly space, the engine design is suitable for many applications. Focal points also included development activities in the area of dry clutch systems for passenger and commercial vehicles. The new Pro Control Compound product family targets the high power density required in controlled clutch systems in current vehicle developments. An ideal combination of the classical qualities of sinter and organic technologies distinguishes these products. New potential applications for engine
OVER 20 PERCENT OF MIBA’S TOTAL REVENUE IS GENERATED WITH NEW TECHNOLOGIES. CLEAR PROOF THAT OUR COMPANY IS ON THE RIGHT PATH WITH ITS STRONGER SUPPORT OF TECHNOLOGIES CONTRIBUTING SIGNIFICANTLY TO ENERGY EFFICIENCY AS WELL AS INCREASED PRECISION AND COMFORT.
bearings in the transmission sector for wind energy and turbines were also tested in the past fiscal year. To meet the requirements in this area, new base technologies were developed for the bearing application.
Best practice in the Miba network
“Learning from the best”, internally and externally – big goals are made possible at Miba. One example of the exchange of information within the Group across all borders is the more global organization of the Miba Sinter Group’s industrial engineering team. The objective of the internationalization is to drive forward and implement innovations in order to use them to define Miba standards – in this way, the role of technology leader in the industry is strengthened and extended. In expert groups, specialists work on innovative machinery and facilities designs for manufacturing complex sintered components. Sophisticated solutions are defined as standards, and these standards enable us to supply our customers with the tried-and-proven Miba quality from all sites. The benefit: Standard systems considerably shorten assembly and commissioning times. In addition, costs can be reduced in procurement as well as in the stocking of spare parts.
Innovative ideas distinguished with the Franz Mitterbauer Award
Employees of the Company are making an important contribution to the development of new technologies. Individual creativity serves as a driver for innovation. Awarded for the first time in 2014, the Miba Innovation Award – named for the founder of the Company and pioneer Franz Mitterbauer – honors these developments. The winning project of 2014 deals with a new manufacturing process for composite materials as an alternative to pre-composite roll cladding, thus once again demonstrating Miba’s innovative strength. The Company also promotes curiosity and thirst for knowledge beyond the Innovation Award. For the past two years, the topic of innovation has been highlighted during the “Powerful Ideas for Miba!” idea competition. Employees are called upon to present their own ideas for Miba – as they are most familiar with the Company and the products through their day-to-day work.
The culture of development is emphasized at Miba.
Innovations such as the Miba Johammer shape
the market; employees are promoted as drivers of
innovation. For example with the Franz Mitterbauer
Award, bestowed to employees each year for
outstanding ideas.
34 35
> Miba > Innovation and Technology

People
WE RECRUIT, DEVELOP AND RETAIN MOTIVATED EMPLOYEES. WE ACTIVELY ENCOURAGE DEDICATION AND ENTREPRENEURSHIP IN MIBA’S PERFORMANCE-DRIVEN ENVIRONMENT. IN OUR COMPANY, AN OPEN CORPORATE CULTURE AND DIVERSITY ARE CRITICAL SUCCESS FACTORS. OUR PEOPLE ARE THE FOUNDATION OF OUR BUSINESS. TOGETHER, WE ARE PREPARING OURSELVES FOR FUTURE GENERATIONS IN THE GLOBAL LABOR MARKET AS WELL AS FOR NEW WAYS OF WORKING.
36 37
> Miba > People

Miba’s growth is also about our people‘s growth
It is not necessary for Miba employees to satisfy every item of their job profile 100 percent from the beginning – the Company places greater emphasis on the right attitude of the future employee towards challenges, as many things can be learned and improved in day-to-day work. Passion for Success is what counts. This is what guarantees the best customer orientation possible. We strive for top performance and consistent implementation, the performance principle is upheld at Miba. People are challenged but also promoted – this is achieved through numerous personnel development measures for all employees, regardless of age, qualification or hierarchy. In fiscal year 2014–2015, Miba invested a total of EUR 1.7 million in training and continuing education. Tailor-made development programs – such as the Miba Management Academy or Miba Leadership Academy – but also product-group-specific training courses – such as the Miba Bearing Academy in the Miba Bearing Group or the P/M Academy in the Miba Sinter Group – contribute to an increase in specialist knowledge.
Continuing education with a global perspective
Miba stays true to its global perspective in the area of continuing education as well. The Miba Leadership Academy has been reorganized in consideration of this. During the training courses, workshops are no longer held in Austria alone but also in the US and China. In addition, the participants are more international, and female executives are more frequently encountered in the program. The key topics of the Academy are Leading People, Leading Business and Leading Oneself. Furthermore, in addition to plant tours and customer visits, the program also offers a look at the sites and professional dynamics of a wide variety of countries. This makes it possible for Miba to fill most of its management positions with members of its own ranks.
STRIVING FOR TECHNOLOGY LEADERSHIP, ENTREPRENEURSHIP, LIFELONG LEARNING AND PASSION FOR SUCCESS – MIBA EMPLOYEES KNOW WHAT IT TAKES. WITH THEIR COMMITMENT, THEY HAVE A SIGNIFICANT IMPACT ON MIBA’S PERFORMANCE. THE KEY TO SUCCESS IN HUMAN RESOURCES IS A CAREER WITH VISION – PERFORMANCE IS REQUIRED, AND YET EACH INDIVIDUAL EMPLOYEE IS PROMOTED ACCORDING TO HIS OR HER ABILITIES.
Exchanges across borders are used in apprentice training as well. Dual vocational training, a standard practice in Austria, is now being rolled out internationally. Along Austrian lines, Miba is offering dual vocational training at its production site in Vráble in Slovakia as part of the youngSTAR pilot project. In addition to theoretical training at a local school, apprentices will acquire well-founded practical expertise directly in the workplace. The new apprentice workshop at Miba Steeltec ensures a high level of training quality. The project is a Slovakian government initiative supported by the Austrian Economic Chambers (WKO) and partner companies such as Miba. The dual vocational education project is the Company’s response to the increasing shortage of skilled personnel while counteracting the high levels of unemployment among young people in Slovakia. Dual vocational training will also be promoted in China and in the US. At the Upper Austrian sites, Miba will supplement its apprentice training activities by offering an on-the-job apprenticeship for existing employees.
Inspiring graduates with international program
An in-house Global Graduate Program is currently planned in order to increase awareness of Miba among highly qualified graduates. Suitable applicants for this special form of trainee program are currently sought in Austria, Slovakia, China and the US. Participants will accompany a project for six months in each country; at best, the experience they gather can then be put to use at one of the international sites after program completion. As they are becoming increasingly important within the Company, Miba will engage in global networks more intensively in the future.
Beyond the critical technical issues, Miba also relies on creating the right social framework for its employees. Preventative health care is a standard; in Austria, greater emphasis is placed on balancing career and family. With the establishment of Miba’s own day care center, child and career are more easily managed. This makes Miba one of the region’s pioneering companies, contributing to the promotion of women in day-to-day work.
In fiscal year 2014–2015, Miba invested a total of
EUR 1.7 million in training and continuing education.
The Company stays true to its global perspective
in this area as well. International sites will be more
closely integrated into the programs.
38 39
> Miba > People

Ready for the challenges of the future
What changes lie ahead in the future? What trends will we have to face? As strategic partner to the engine and vehicle industry, Miba has set itself the task of proactively recognizing new developments and reacting to them quickly with innovative ideas. Scan the QR code to find out
what challenges – and what opportunities – the upcoming years hold for Miba.
40 41
> Miba > Challenges of the future

ManagementReport
> M
anag
emen
t R
epo
rt

2
Miba preferred shares: increased share price with persistently low trading volume
In the past fiscal year, Miba preferred shares again recorded an increase in share price, thus following the trend in the influential international stock markets in 2014.1 Miba shares closed at EUR 399.95 at the year end and therefore 18.3 percent above the share price on February 1, 2014. With the rise in the share price in the past year, Miba consolidated its price/earnings ratio at an attractive level; as of January 31, 2015, it was 8.76 (January 31, 2014: 8.59). Earnings per share for the past fiscal year amounted to EUR 45.64 (January 31, 2014: EUR 39.37).
The shares peaked at EUR 450.00 on September 9, 2014. However, this was a one-time high with a sales volume of only three shares. From this time onwards, the share performance weakened slightly and stabilized at a level of about EUR 400.
Miba share trading volumes were already very low and in decline in previous years and performed even less well in the past fiscal year. Only 10,322 shares – including shares repurchased by the Company itself – were traded on the Vienna Stock Exchange in the past year. This equates to a year-on-year reduction in trading volume of 17 percent (previous year: 12,471 shares). Thus, only 3.4 percent of issued preferred shares were traded during the year as a whole.
Buyback of own shares
At the 27th Annual General Meeting of Miba Aktiengesellschaft on June 28, 2013, the Company was authorized in accordance with section 65(1) number 8 of the Austrian Stock Corporation Act (AktG) to carry out a general buyback of own shares (category B preferred shares) up to a maximum of 10 percent of the Company’s share capital from July 1, 2013, for the duration of 30 months. The acquisition may take place in any legally permissible, appropriate manner, in particular also over the counter and from individual shareholders who are willing to sell (negotiated purchase).
In the past fiscal year, 5,535 shares were repurchased under the share buyback program. An up-to-date overview of all share buyback programs is available to all interested parties on the Company’s website at www.miba.com. As of the January 31, 2015, reporting date, 97,979 own shares (previous year: 92,444) had been repurchased at an average price of EUR 166.42 per share. This equates to 7.54 percent of share capital.
Miba investor relations
1 cf., e.g., www.finanzen.net, historical share price data – February 1, 2014, to January 31, 2015: increase in Dow Jones by 11.7 percent, DAX by
16.4 percent, retrieval date: March 22, 2015
3
Miba’s share capital is EUR 9.5 million and is divided into 1,300,000 no-par value shares. The no-par value shares are split into 870,000 ordinary shares, 130,000 category A preferred shares and 300,000 category B preferred shares. Category A preferred shares do not have any voting rights but have the right to be converted into ordinary shares upon relinquishment of preferential rights. Category B preferred shares have neither voting rights nor the right to be converted into ordinary shares. Mitterbauer Beteiligungs-AG holds 76.92 percent of the shares. As of the reporting date, institutional and private investors held 15.54 percent of the shares. Miba AG holds 7.54 percent of the share capital as treasury shares.
Dividend for 2014–2015
Miba AG’s Management Board will propose a dividend of EUR 8.00 per ordinary and preferred share at the Annual General Meeting on June 25, 2015. With a share price on the reporting date of EUR 399.95 (as of January 31, 2015), this equates to a dividend yield of 2.00 percent. The EUR 8.00 dividend per share equates to a payout ratio (expected dividend payment divided by profit after tax [EAT]) of 15.86 percent.
Corporate bond as an attractive investment opportunity for investors
On February 27, 2012, Miba issued a seven-year bullet bond with a principal amount of EUR 75 million at an interest rate of 4.5 percent p.a. With this bond, Miba is providing its investors with an attractive investment opportunity, which, at EUR 108.25 on January 31, 2015, was trading at a price that was significantly above the issue price.
Miba shares WB Index (Vienna stock exchange index)
140%
Miba share price performance in fiscal year 2014-2015 (share price on February 1, 2014 = 100%)
02/2014
130%
120%
110%
100%
90%
80%
03/2014 04/2014 05/2014 06/2014 07/2014 08/2014 09/2014 10/2014 11/2014 12/2014 01/2015
2
Miba preferred shares: increased share price with persistently low trading volume
In the past fiscal year, Miba preferred shares again recorded an increase in share price, thus following the trend in the influential international stock markets in 2014.1 Miba shares closed at EUR 399.95 at the year end and therefore 18.3 percent above the share price on February 1, 2014. With the rise in the share price in the past year, Miba consolidated its price/earnings ratio at an attractive level; as of January 31, 2015, it was 8.76 (January 31, 2014: 8.59). Earnings per share for the past fiscal year amounted to EUR 45.64 (January 31, 2014: EUR 39.37).
The shares peaked at EUR 450.00 on September 9, 2014. However, this was a one-time high with a sales volume of only three shares. From this time onwards, the share performance weakened slightly and stabilized at a level of about EUR 400.
Miba share trading volumes were already very low and in decline in previous years and performed even less well in the past fiscal year. Only 10,322 shares – including shares repurchased by the Company itself – were traded on the Vienna Stock Exchange in the past year. This equates to a year-on-year reduction in trading volume of 17 percent (previous year: 12,471 shares). Thus, only 3.4 percent of issued preferred shares were traded during the year as a whole.
Buyback of own shares
At the 27th Annual General Meeting of Miba Aktiengesellschaft on June 28, 2013, the Company was authorized in accordance with section 65(1) number 8 of the Austrian Stock Corporation Act (AktG) to carry out a general buyback of own shares (category B preferred shares) up to a maximum of 10 percent of the Company’s share capital from July 1, 2013, for the duration of 30 months. The acquisition may take place in any legally permissible, appropriate manner, in particular also over the counter and from individual shareholders who are willing to sell (negotiated purchase).
In the past fiscal year, 5,535 shares were repurchased under the share buyback program. An up-to-date overview of all share buyback programs is available to all interested parties on the Company’s website at www.miba.com. As of the January 31, 2015, reporting date, 97,979 own shares (previous year: 92,444) had been repurchased at an average price of EUR 166.42 per share. This equates to 7.54 percent of share capital.
Miba investor relations
1 cf., e.g., www.finanzen.net, historical share price data – February 1, 2014, to January 31, 2015: increase in Dow Jones by 11.7 percent, DAX by
16.4 percent, retrieval date: March 22, 2015
> M
anag
emen
t R
epo
rt
4544
> Management report > Miba investor relations

4
Global economy
Global economic performance was once again below expectations in 2014. The tense geopolitical situation – particularly in Russia and Ukraine, as well as in the Middle East – is one example of the reasons for slower growth. In addition, the persistent instability in the financial markets had a negative effect on the recovery of the global economy. Countermeasures by central banks such as the lowering of interest rates to virtually zero and considerations about purchasing government bonds did not, at least for European markets, bring the desired success. Despite these measures, the expected economic surge failed to materialize in the major industrial nations; this put an additional dampener on the performance of the global economy. The US, which was one of the few countries to perform more strongly than expected in 2014, was almost the only country to benefit from the low interest rates and low crude oil prices. By contrast, the world’s second largest economy, China, has for some time now been showing declining growth rates, albeit still at a high level. The declining growth rates are above all attributable to the fact that China is changing from a heavily export-oriented economy with high consumption of resources and still low labor costs to an economy which is growing sustainably and where domestic consumption and labor costs are rising.
Compared with the previous year, the global economy grew by 3.3 percent in 2014 (after also having grown by 3.3 percent in 2013). Growth of 1.8 percent was reported for industrial nations (2013: 1.3 percent). After having been –0.5 percent in the previous year, GDP growth in the eurozone was 0.8 percent, while the US recorded growth of 2.4 percent (previous year: 2.2 percent). At 4.4 percent, growth in emerging markets declined slightly compared with 4.7 percent in 2013. In 2014, China was again the most important growth driver with growth of 7.4 percent (2013: 7.8 percent). With a growth rate of 5.8 percent, India recorded a renewed growth spurt compared to 2013 (2013: 5.0 percent). 2014 was disappointing for the other former growth drivers of the BRIC countries: Brazil only grew by 0.1 percent (2013: 2.5 percent) and Russia by 0.6 percent (2013: 1.3 percent).2
Sector performance
Performance of the markets which are of relevance to Miba was again inconsistent and difficult to predict in 2014. Overall, there was, however, a slightly positive trend.
With an increase in production of 2.9 percent to 67.5 million passenger vehicles, the global automotive industry was again able to record stable market growth.3 In Europe, the number of passenger vehicles produced rose by 2.5 percent year on year, the number of registrations by 5.4 percent.4 The negative performance in Eastern Europe was offset by higher growth rates in other countries such as the United Kingdom, Italy and Germany. The North American market recorded even more encouraging growth rates which was, among other things, also attributable to the good US economy and declining fuel prices in the past year. The number of passenger vehicles and light commercial vehicles (vans) produced rose by 5.9 percent to 17.6 million vehicles; new registrations increased by 6.0 percent.5 By contrast, production figures in the Brazilian automotive industry shrunk by over 15 percent, and new registrations by 7.1 percent.6 China produced 22.6 million passenger and light commercial vehicles in 2014. This corresponds to an increase of 8.2 percent compared to 2013.
Economic conditions
2 cf. International Monetary Fund (IMF): World Economic Outlook Update, January 2015 3 cf. Organisation Internationale des Constructeurs d’Automobiles (OICA): World Motor Vehicle Production by Country and Type, 2013–2014, Cars:
http://oica.net/wp-content/uploads//Cars–2014–Q41.pdf, retrieval date: March 23, 2015 4 cf. LMC Automotive, January 2015 5 cf. Automotive News, January 23, 2015 6 cf. www.anfavea.com.br/January2015, retrieval date: March 22, 2015
5
After performances which fluctuated from month to month, the Indian automotive market completed 2014 with a rise of a mere 0.8 percent in terms of passenger and light commercial vehicles produced.7
The global truck market also performed satisfactorily overall, which was primarily attributable to the strong market growth in the US. In the European Union, 6.1 percent fewer heavy trucks (over 16 tons) were registered in 2014; production figures even fell by 9.6 percent.8 In China, production was 2 percent lower. On the other hand, heavy truck revenue in the US rose by 19 percent compared with 2013.9
The global tractor market recorded a marked decline in some regions. In 2014, 3 percent fewer new tractors were sold than in the year before. Substantial decreases were recorded particularly in Brazil and Japan with –15 percent each and in the European Union with –8 percent. In China, roughly the same number of tractors were sold as in the previous year; the US recorded a rise of 3 percent.10 Reasons for the declining trend in the market include lower income of farmers and the political situation in Russia and Ukraine, a significant region for the used tractor market. A recovery in the weaker regions is not to be expected before 2016. As in 2013, the construction machinery and mining equipment market also remained at a low level in 2014; a number of regions even had trends that showed a further decline. The earliest a recovery can be expected is in 2016, depending on market prices for commodities such as oil, ore or copper.
Markets for high-speed diesel and gas engines as well as for locomotive applications performed satisfactorily overall, especially in the US. On the other hand, the large engine market, particularly for ship engines, remained at the low level of 2013.
Performance of the power electronics components market was subdued in many areas due to the difficult investment climate. While demand for industrial applications was still relatively stable in 2014, fewer high-voltage direct current (HVDC) transmission projects were carried out. The global wind power industry however continued to grow in 2014. Global capacity has already reached nearly 370 gigawatts. 51 gigawatts of this was installed in 2014 – almost half of this in China, which overall contributes a third to global capacity.11
7 cf. LMC Automotive, January 2014 and January 2015 8 cf. European Automobile Manufacturers’ Association (ACEA), Commercial Vehicle Registrations in the EU: http://www.acea.be/press-
releases/article/commercial-vehicle-registrations-7.6overtwelvemonths2.5indecember, retrieval date: March 12, 2015, and OICA: World Motor Vehicle
Production by Country and Type, 2013–2014, Heavy Trucks: http://oica.net/wp-content/uploads//HCV-2014-Q4.pdf, retrieval date: March 12, 2015 9 cf. ACEA, New Commercial Vehicle Registrations, January 2015; The Rhein Report, February 2015 and LMC Automotive, January 2015 10 cf. Agrievolution: Tractor Market Report, Calendar year 2014, http://www.agrievolution.com/PDF/2014-Agrievolution-Tractor-Market-Report.pdf,
retrieval date: March 12, 2015 11 cf. Global Wind Energy Council: Global Wind Statistics 2014
4
Global economy
Global economic performance was once again below expectations in 2014. The tense geopolitical situation – particularly in Russia and Ukraine, as well as in the Middle East – is one example of the reasons for slower growth. In addition, the persistent instability in the financial markets had a negative effect on the recovery of the global economy. Countermeasures by central banks such as the lowering of interest rates to virtually zero and considerations about purchasing government bonds did not, at least for European markets, bring the desired success. Despite these measures, the expected economic surge failed to materialize in the major industrial nations; this put an additional dampener on the performance of the global economy. The US, which was one of the few countries to perform more strongly than expected in 2014, was almost the only country to benefit from the low interest rates and low crude oil prices. By contrast, the world’s second largest economy, China, has for some time now been showing declining growth rates, albeit still at a high level. The declining growth rates are above all attributable to the fact that China is changing from a heavily export-oriented economy with high consumption of resources and still low labor costs to an economy which is growing sustainably and where domestic consumption and labor costs are rising.
Compared with the previous year, the global economy grew by 3.3 percent in 2014 (after also having grown by 3.3 percent in 2013). Growth of 1.8 percent was reported for industrial nations (2013: 1.3 percent). After having been –0.5 percent in the previous year, GDP growth in the eurozone was 0.8 percent, while the US recorded growth of 2.4 percent (previous year: 2.2 percent). At 4.4 percent, growth in emerging markets declined slightly compared with 4.7 percent in 2013. In 2014, China was again the most important growth driver with growth of 7.4 percent (2013: 7.8 percent). With a growth rate of 5.8 percent, India recorded a renewed growth spurt compared to 2013 (2013: 5.0 percent). 2014 was disappointing for the other former growth drivers of the BRIC countries: Brazil only grew by 0.1 percent (2013: 2.5 percent) and Russia by 0.6 percent (2013: 1.3 percent).2
Sector performance
Performance of the markets which are of relevance to Miba was again inconsistent and difficult to predict in 2014. Overall, there was, however, a slightly positive trend.
With an increase in production of 2.9 percent to 67.5 million passenger vehicles, the global automotive industry was again able to record stable market growth.3 In Europe, the number of passenger vehicles produced rose by 2.5 percent year on year, the number of registrations by 5.4 percent.4 The negative performance in Eastern Europe was offset by higher growth rates in other countries such as the United Kingdom, Italy and Germany. The North American market recorded even more encouraging growth rates which was, among other things, also attributable to the good US economy and declining fuel prices in the past year. The number of passenger vehicles and light commercial vehicles (vans) produced rose by 5.9 percent to 17.6 million vehicles; new registrations increased by 6.0 percent.5 By contrast, production figures in the Brazilian automotive industry shrunk by over 15 percent, and new registrations by 7.1 percent.6 China produced 22.6 million passenger and light commercial vehicles in 2014. This corresponds to an increase of 8.2 percent compared to 2013.
Economic conditions
2 cf. International Monetary Fund (IMF): World Economic Outlook Update, January 2015 3 cf. Organisation Internationale des Constructeurs d’Automobiles (OICA): World Motor Vehicle Production by Country and Type, 2013–2014, Cars:
http://oica.net/wp-content/uploads//Cars–2014–Q41.pdf, retrieval date: March 23, 2015 4 cf. LMC Automotive, January 2015 5 cf. Automotive News, January 23, 2015 6 cf. www.anfavea.com.br/January2015, retrieval date: March 22, 2015
> M
anag
emen
t R
epo
rt
4746
> Management report > Economic conditions

6
Revenue and income position
As a strategic partner to the international engine manufacturing and automotive industries, Miba was able to strengthen or maintain its market position in its core markets despite persistently challenging market trends; this is also reflected in the satisfactory year-on-year improvement in revenue and earnings. The Company therefore continued to consolidate its foundation even in an uncertain market environment and expanded its strong internal financing for growth investments.
In fiscal year 2014–2015, the Miba Group generated revenue of EUR 669.3 million. This equates to an increase of EUR 59.1 million, or 9.7 percent, compared to the previous year. Growth in fiscal year 2014–2015 consisted of organic growth (8.2 percentage points), growth through acquisitions (1.2 percentage points) and a positive exchange rate effect (0.3 percentage points).
Miba segments
All regions performed positively in the past fiscal year compared with fiscal year 2013–2014 despite some challenging market trends in a number of sectors. The Miba Europe segment achieved growth of 5.2 percent while the Miba Americas segment increased by 16.5 percent. The largest share of total growth came from the Miba Asia segment where revenue rose by 33.3 percent. The increases in revenue in America and Asia are not just attributable to the market but also arise from the initial proportionate consolidation of Advanced Bearing Materials LLC and the initial full consolidation of EBG Shenzhen Ltd.
The Miba Europe segment – taken to mean all consolidated production plants in Europe – generated revenue of EUR 478.2 million, or 71.5 percent of consolidated revenue, in the past fiscal year. The Miba Americas segment – taken to mean all consolidated production plants in America – generated revenue of EUR 113.5 million. This equates to 17.0 percent of consolidated revenue. In America, Miba benefited from a marked rise in domestic demand and the demand for technologically advanced solutions as part of the continent’s reindustrialization. Revenue in the Miba Asia segment – taken to mean all consolidated production plants in Asia – amounted to EUR 77.5 million in the past fiscal year, contributing 11.6 percent to consolidated revenue.
Income statement and balance sheet analysis
A STRONG FOUNDATION FOR THE FUTURE
Share of revenue by production planper region
Miba Europe71.5%
Miba Americas17.0%
Miba Asia11.6%
7
With 22 production sites in Europe, America and Asia, Miba is near its customers in the most important commercial centers of the world. In fiscal year 2014–2015, Miba generated 62.0 percent of its revenue in the European sales market (7.5 percent in Austria, 54.5 percent in the rest of Europe), 20.7 percent in America and 16.4 percent in Asia.
In terms of earnings quality, fiscal year 2014–2015 was generally satisfactory. Consolidated profit before interest and tax (EBIT) reached EUR 81.9 million. This equates to an increase of 16.7 percent compared with the previous year (EUR 70.2 million). The 2014–2015 profit was undergirded by one-off effects, the first and foremost of these being the positive exchange rate trend at the end of the year. The reported EBIT margin for the past fiscal year rose from the prior-year level of 11.5 percent to 12.2 percent. Profit before interest, tax, depreciation and amortization (EBITDA) amounted to EUR 123.8 million in the past year (previous year: EUR 108.8 million).
Consolidated profit before tax (EBT) of EUR 80.5 million also rose compared to the previous year (EUR 66.7 million). After deducting income tax expenses of EUR 19.9 million, consolidated profit after tax (EAT) amounted to EUR 60.6 million (previous year: EUR 50.1 million).
Net assets and financial position
Total assets rose significantly in the past fiscal year from EUR 640.1 million to EUR 741.9 million. Exchange rates on the one hand (EUR 27.0 million) and effects from initial consolidations on the other (EUR 17.8 million) were the main drivers for this sharp increase. As in previous years, capital expenditure which significantly exceeded the level of depreciation was also another driver (property, plant and equipment increased by EUR 30.6 million). Non-current assets thus rose by EUR 39.9 million, or 12.7 percent, to EUR 353.4 million. Non-current assets as a percentage of total assets declined slightly from 49.0 percent to 47.6 percent. The asset cover ratio (equity as a proportion of non-current assets less deferred tax assets) increased from 112.7 percent to 120.2 percent.
Investments in intangible assets and property, plant and equipment amounted to EUR 53.4 million (previous year: EUR 68.1 million). This includes non-cash capital expenditure from finance leases of EUR 2.0 million.
Miba’s financial independence was once again significantly strengthened in all respects in fiscal year 2014–2015. The Group continues to have a very high level of liquidity in particular and financial assets in general. Cash and cash equivalents were EUR 138.1 million (previous year: EUR 119.5 million); total financial assets (cash and cash equivalents plus (current and non-current) financial assets, excluding securities to cover pension provisions) were EUR 208.0 million (previous year: EUR 162.2 million). As of January 31, 2015, the Miba Group reported an excess of financial assets over debt (net liquidity plus (current and non-current) financial assets, excluding securities to cover pension provisions) of EUR 90.4 million (January 31, 2014: excess of financial assets over debt of EUR 48.1 million). Apart from the satisfactory cash flow from operating activities in the past
Share of revenueby regional distribution of customers
America20.7%
Europe (exkl. Austr54.5%
Other 0.9%
Asia16.4%
Austria7.5%
Europe (excl. A ustria)54.5 %
Share of revenue by regional distribution of customers
> M
anag
emen
t R
epo
rt
4948
> Management report > Income statement and balance sheet analysis

8
fiscal year, there was a positive currency effect of EUR 4.8 million which contributed to the improvement in the excess of financial assets over debt.
In the past fiscal year, group equity (including non-controlling interests) increased by 20.7 percent, or EUR 72.4 million, to EUR 422.0 million (previous year: EUR 349.6 million). Treasury shares amounting to EUR 16.3 million (previous year: EUR 14.2 million) were recognized directly in equity. The increase in group equity mainly resulted from consolidated profit after tax (EAT) of EUR 60.6 million and currency translation gains of EUR 27.0 million recognized directly in equity. These were offset by actuarial losses of EUR 4.9 million also recognized directly in equity and dividend payments in the amount of EUR 9.7 million.
The equity ratio is 56.9 percent. This represents an increase of 2.3 percentage points compared to the previous year (54.6 percent).
Cash flow from operating activities amounted to EUR 107.0 million (previous year: EUR 103.2 million). Free cash flow (cash flow from operating activities less cash flow from investments in property, plant and equipment and intangible assets, taking account of the acquisition of newly consolidated companies) amounted to EUR 51.6 million, or 7.7 percent of revenue, in the past fiscal year.
in EUR million 2014–15 2013–14
Revenue 669.3 610.2
EBIT 81.9 70.2
Cash flow from operating activities 107.0 103.2
Equity 422.0 349.6
Equity ratio in % 56.9 54.6
9
Section 243a(1) number 1 of the UGB
Miba AG’s share capital is EUR 9.5 million. The share capital is divided into 1,300,000 no-par value shares. Of these, 870,000 are ordinary shares (66.9 percent of share capital), 130,000 are category A preferred shares with no voting rights but with a right to be converted into ordinary shares upon relinquishment of preferential rights (10.0 percent of share capital), and 300,000 are category B preferred shares with no voting rights and no right to be converted into ordinary shares (23.1 percent of share capital). Each no-par value voting share entitles the holder to one vote at the Annual General Meeting. As of January 31, 2015, Miba AG held 97,979 treasury shares (previous year: 92,444).
Section 243a(1) number 2 of the UGB
Miba AG is not aware of any restrictions on voting rights and their transfer, including restrictions arising from shareholder agreements, other than those relating to the preferred shares.
Section 243a(1) number 3 of the UGB
As of January 31, 2015, Mitterbauer Beteiligungs-AG held a direct interest of 76.92 percent in Miba AG. 15.54 percent of Miba shares were in free float. As of the reporting date, Miba AG’s holding of treasury shares amounted to 7.54 percent of share capital.
Section 243a(1) number 4 of the UGB
There are no Miba shares with special rights of control.
Section 243a(1) number 5 of the UGB
There are no employee share-based payment plans in the Miba Group.
Section 243a(1) number 6 of the UGB
There are no provisions in the Articles of Incorporation that go beyond the legal provisions concerning the appointment of the Management Board and Supervisory Board or amendments to the Articles of Incorporation.
Section 243a(1) number 7 of the UGB
As of January 31, 2015, Miba AG’s Management Board did not possess any authority beyond the authority granted to it in law to issue or buy back Miba AG shares.
Section 243a(1) number 8 of the UGB
The 76.92-percent interest held by Mitterbauer Beteiligungs-AG precludes a change of control based on shares in free float.
Disclosures in accordance with section 243a(1) of the
Austrian Commercial Code (UGB)
> M
anag
emen
t R
epo
rt
5150
> Management report > Disclosures in accordance with section 243a (1) of the Austrian Commercial Code (UGB)
10
Section 243a(1) number 9 of the UGB
By virtue of the preceding paragraph, there are also no compensation arrangements between Miba AG and the members of its Management Board and Supervisory Board for the event of a public takeover bid.
Branches
No branches were maintained in the reporting period.
> Management Report > Risk report
11
As an international company, Miba serves different industrial sales markets and customers and is exposed to general and sector-specific risks in its daily business.
Proven risk management instruments are used to deal with these risks, their main objective being to recognize emerging risks early in order to initiate countermeasures quickly and effectively.
The Management Board has overall responsibility for risk management and receives regular information on the risk position from the Group Management Accounting and Corporate Finance departments. Risk management is further integrated into the management structure via the planning system and via detailed reporting and information systems with the appropriate delegation of authority.
Significant risks and uncertainties
The following risks have been identified as significant risks for Miba (this list is not exhaustive):
Economic risk
For the product groups of the Miba Group which have the strongest revenue, components are being developed and manufactured that are mainly used in power trains for motor vehicles, trucks, ships, trains, wind power plants, construction machinery and agricultural equipment. Demand for Miba Group products therefore depends to a large extent on the demand for these products, which can be strongly cyclical. Another relevant factor is the ongoing fragile situation in the global financial markets. The period after the general economic crisis in 2009 was characterized by an upturn for Miba. The past three fiscal years were, however, also characterized by unexpected upturns and downturns in relevant submarkets, highlighting the volatility risk of Miba’s business model. As a result, cancellations by customers on short notice continue to necessitate a high degree of organizational flexibility so as to be able to meet the demand. The components developed and produced by Miba companies are critical to the functionality of customer systems and are characterized by an ever increasing degree of complexity and shorter development cycles. This creates further economic risk for Miba.
Competition and portfolio risk
Miba is pursuing the long-term strategy of significantly reducing its dependence on individual sectors by broadening its product portfolio. On the one hand, this has happened by expanding the product groups in which Miba operates: With its entry into the power electronics components product group, the Company has, since 2010–2011, been opening up and developing new lines of business which are primarily relevant to end applications for power generation, storage and transmission. On the other hand, the aim within the individual product groups is to develop new areas of application.
Risk report
> M
anag
emen
t R
epo
rt
5352
> Management report > Risk report

12
Product and quality risk
Miba Group products require a high level of knowledge of the materials being used, as well expertise in application and process engineering. Throughout the Group, Miba operates a uniform, systematic quality management system which is embedded in the Group-wide Business Excellence and Zero Defect initiatives. In the past fiscal year, Miba started implementing a standardized quality management system; this will be completed during the course of 2015. Cases of liability cannot be entirely ruled out even with systematic and efficient organization. Defective product and component design or defects in the materials used, the use of unsuitable material or production errors may result in compensation payments or product liability claims against Miba Group companies. The globalization of customer programs mentioned earlier (“global platform strategy”) increases the potential level of liability risk in individual cases. Miba mainly operates as a component supplier; in most cases, it does not bear any responsibility for the design of the systems into which the components are incorporated. Miba has comprehensive insurance cover in place that is customary in the sector, although a residual risk remains concerning the level of insurance cover and claims that are not covered by insurance.
Personnel risk
The success of the Miba Group is largely dependent on key individuals with long-standing experience in the Miba Group’s product groups. Systematic personnel development and a performance-linked remuneration system are important means for retaining qualified and motivated employees in the Group. Internal programs to promote and develop key personnel, such as the Miba Management Academy, the Miba Leadership Academy or the apprenticeship training program ensure that the expertise of our employees is preserved and increased. Periodically conducted employee surveys are used to identify potential for improvements. Flexible organizational structures and corresponding working time models are needed in order to meet changing market conditions.
Financial risk
Adequate and cost-effective securing of liquidity and the associated financial independence have always been a core strategy of the Miba Group and have proved to provide a competitive advantage especially in the last few years of increasing volatility in the financial markets. Miba is hereby predominantly focused on internal financing and therefore on sufficient liquidity reserves. To strengthen its liquidity, Miba issued a seven-year bullet bond with a total volume of EUR 75 million in February 2012. Credit risk, which is already manageable as a result of the good creditworthiness profile of Miba’s customers, is generally limited by taking out credit insurances (with a couple of exceptions, mostly due to geographical considerations). In this connection, the creditworthiness of new and existing customers is also reviewed on an ongoing basis. Derivative financial instruments are also used in addition to standard futures contracts to manage and limit interest rate and currency risk.
The Miba Group has branches and subsidiaries in countries outside the eurozone, in particular in the United Kingdom, the US, China, Brazil and India. A considerable proportion of revenue and costs is invoiced not in euros but in the currencies of the respective national companies. Currency fluctuations may result in exchange
> Management Report > Risk report
13
rate losses in the consolidated financial statements (transaction risk). Furthermore, risks arise from the translation of foreign single-entity financial statements into the Group currency, i.e. the euro (translation risk). The foreign currency risk within the Group is primarily concentrated on the euro/US dollar and euro/RMB exchange rates, although the gradual expansion of the business in China and North America is resulting in an increased natural hedge.
Risk of losses
The assets of the individual companies are insured across the Group with uniform Group policies. Losses which may arise as a result of business interruption after natural disasters are also covered. In addition to these insurances, the remaining risks are covered by Group-wide liability and goods in transit insurances.
Overall risk
The Miba Group’s identified risks are manageable and are hedged appropriately. From today’s perspective, there are no risks to the continued existence of the Company as a going concern.
Significant characteristics of the accounting-related internal control and risk management system
Under section 82 of the Austrian Stock Corporation Act (AktG), the Management Board is responsible for establishing and designing an internal control and risk management system for the financial reporting process which is appropriate to the Company’s requirements.
General principles
The following statements apply equally to the single-entity and the consolidated financial statements of Miba AG.
Miba’s accounting-related internal control and risk management system serves to ensure proper and reliable financial reporting.
In order to better meet the increased demands on the internal control and risk management system, Miba established its own Internal Audit unit in fiscal year 2012–2013. This unit reports directly to the Chairman of the Management Board and the Chairman of the Audit Committee, and supports the Management Board and the Managing Directors of the individual companies in their efforts to take adequate account of the demands on the internal control system (ICS).
> M
anag
emen
t R
epo
rt
5554
> Management report > Risk report

14
The Management Board and the Audit Committee established by the Supervisory Board are provided with information about the accounting-related internal control and risk management system on a regular basis. A Group-wide accounting-related risk management and ICS report is submitted to these bodies once a year.
If significant control weaknesses have been identified and the resulting effects on the consolidated financial statements are material, they are presented in the Group report.
Organization of financial reporting
The Finance department in Laakirchen reports directly to the Chief Financial Officer and is responsible for the consolidated financial statements of the Miba Group. The financial statements of the individual companies are consolidated in Laakirchen; the IFRS financial statements of the foreign subsidiaries are audited in the respective countries and then transmitted to Group headquarters. Established consolidation software is used by the central Corporate Finance department to perform the consolidation and to prepare the consolidated financial statement data for external reporting.
Uniform Group-wide guidelines, such as the compulsory financial reporting time table, a Group-wide accounting manual, signature regulations, regulations on the segregation of functions, etc., are prescribed centrally by Miba AG. Implementation is decentralized and is carried out by those with local responsibility. To increase the quality of the local financial statements, a North American service center was set up in the past fiscal year which will gradually take over the responsibility for the financial reporting of all North American sites.
The consolidated financial statements of the Miba Group are prepared in accordance with IFRSs and interpretations issued by the International Financial Reporting Interpretations Committee (IFRIC) which have been adopted by the European Commission for application in the EU by the end of the reporting period and the application of which is mandatory as of the reporting date. Employees responsible for the application and implementation of current IFRSs attend IFRS training courses and updates during the course of the year so as to ensure IFRS-compliant reporting.
All material companies that are consolidated prepare their single-entity financial statements in the centrally-maintained Group SAP accounting system, taking account of uniform organizational specifications. The automated as well as manual specifications and controls which, by means of this system, are integrated throughout the Group, ensure that transactions are already being recorded and documented at the individual company level in full, in a timely manner, correctly and in the period in which they arise.
In order to ensure that material financial statement items are complete, an ongoing exchange of information takes place with the relevant departments responsible. If required, external experts are consulted so as to avoid errors of judgment.
The Management Board, the Supervisory Board and management are responsible for the Company-wide monitoring of the financial reporting function. Control measures range from the review of the periodic income
> Management Report > Risk report
15
statements and financial reports provided on a monthly and quarterly basis by Management Accounting and Corporate Finance, to the critical evaluation by the Management Board and the Supervisory Board of documents intended for publication.
> M
anag
emen
t R
epo
rt
5756
> Management report > Risk report

16
Miba’s technology leadership is the basis for its profitable growth. As a development partner, Miba develops customized solutions in close cooperation with customers. Miba researches materials and processes for the development and manufacture of components for more efficient power trains. Alternative power trains and trends in power generation, conversion and use are creating future opportunities for Miba. In this respect, its particular expertise – regardless of the product group – lies in its know-how and in years of experience in application engineering, materials and highly efficient production processes.
Miba secures its competitive edge through substantial investments in research and development. In fiscal year 2014–2015, Miba invested EUR 27.9 million in R&D. This equates to 4.2 percent of total revenue. 235 employees overall (FTE) were employed in this area throughout the Group. In the past fiscal year, the development outcomes were protected with 18 new patent applications. Currently, the Miba Group holds 233 valid patents. In-house R&D work is supplemented by cooperation with universities and research institutions.
Research center in Europe, application-related development in America and Asia
Research and development activities currently take place mostly in Europe. Miba’s research centers are located at the main plants in Austria. There is also a center for coatings in Droitwich (UK). The Slovakian sites are also increasingly starting to take on development responsibilities.
Adaptation of development outcomes to specific customer requirements then takes place in collaboration with the application engineering departments at the various sites across the world. Application-related development work is increasing in plants in the US and China in particular.
Optimized and new manufacturing methods for engine bearings
Manufacturers of high-performance diesel and gas engines are confronted with the use of alternative fuels and more efficient combustion systems as well as a rapidly changing market environment accompanied by increasing environmental requirements. As an engine bearings specialist, the Miba Bearing Group partners with engine manufacturers on topics ranging from bearing design and materials development to application engineering.
In the past fiscal year, one development focus was on new applications for engine bearings in the transmission sector for wind power and turbines. To meet the demands in this area, new basic technologies for bearing applications were developed and new approaches were introduced in the area of technical consulting services. The first products for use in gas turbines were already industrialized in 2014–2015, and the first preliminary tests for wind power applications were completed at customer sites.
Another focus was on pilot studies for new production processes for cast materials and high-performance coatings. These developments are being driven by increased price pressure in the engine business. This not only makes new production methods necessary for bearing designs which have already been introduced, but
Research & development
WE ARE DRIVEN BY NEW TECHNOLOGY
For more information on Miba engine bearings,
please refer to page 73.
> Management Report > Research & development
17
also requires completely new approaches to the materials manufacturing and production. The pilot study results demonstrated potential for cost reduction and confirmed the necessary mileage for use in engines.
In addition, the R&D team completed new simulation processes for transmission development. In the numerical simulation, there are now tools available which are used for bearing design, for the analysis of unexpected conditions that bearings may be subjected to and also to design new applications. The new simulation processes help make it possible to factor design features relevant to service life into the engine build during the engine design phase; these processes are already being used at potential customers.
Cost-efficient sintering solutions
The Miba Sinter Group is a development partner in the international automotive industry. The move towards efficient power trains and the global availability of all developed solutions resulting from customers’ global platform strategies present new challenges to the Miba Sinter Group. With its consistent R&D efforts, Miba is not only reacting to the shorter development times and rising price pressure among customers as well as the ever-increasing requirements for noise reduction, comfort and running smoothness, it is also contributing to significant increases in efficiency and reductions in fuel consumption.
In fiscal year 2014–2015, the technology portfolio for NVH-optimized gear drives was expanded. Noise-optimized sintered components were already being used in the current state-of-the-art high-end three cylinder engines, as a result of which Miba was able to further expand its technology leadership in this area. In addition, functional component testing and the test facility required for this were expanded. With this flexible test facility, customers can be offered prevalidated solutions, hereby reducing the cost and effort of evaluating new component projects. As in previous years, the R&D team was also looking at powder metallurgy production process applications for promising mobility designs, with a specific focus on hybrid and electric drives. In the past fiscal year, the functional capability of specially developed electric engine topologies with soft-magnetic sintered components was successfully demonstrated for the first time. The advantages of such topologies are build space efficiency, the fact that ferrite magnets can be used instead of rare-earth magnets, and reduced assembly costs.
As in the previous year, another focus was on the numerical simulation of manufacturing processes which helps visualize technical process details and thus make them more reproducible. From this, fundamental insights are gained for robust process management, which further increases the reliability of our products. In fiscal year 2014–2015, process costs of over EUR 500,000 were saved through systematic analyses of processes, process enhancements and subsequent improvement measures.
In order to support customers’ global platform strategies in the best possible way, the Miba Sinter Group implemented further global manufacturing standards and also expanded the Miba R&D support network into China. All customers are now benefiting from the global availability of cost-efficient solutions which are of Miba’s usual high quality.
For more information on Miba sintered components, please refer to page 73.
For more information
on Miba engine bearings,please refer to page 75.
For more information
on Miba sintered components, please refer to page 75.
> M
anag
emen
t R
epo
rt
5958
> Management report > Research & development

18
Maximum efficiency friction systems and high level of power density
The Miba Friction Group develops and manufactures technologically demanding clutch and brake components. In doing so, the R&D team focuses on developing components that are as small and light as possible and capable of delivering better and better performance. With its development work, the Miba Friction Group is responding to the growing demands in relation to driving dynamics and safety, increasing comfort requirements for clutches and rising pressure to reduce CO2 emissions in passenger vehicles.
In fiscal year 2014–2015, one focal point of the Miba Friction Group’s research was to continue development activities for light commercial vehicle and passenger vehicle dry clutch systems. Working in close cooperation with customers, solutions were developed to optimize the clutch disc and damper system in response to the demand for greater comfort. The Pro Control Compound product line targets the high power density required in controlled clutch systems in current vehicle developments. The products are characterized by their ideal combination of classic sintering and organic technology features. In the past fiscal year, passenger vehicles with dual-clutch transmissions and light commercial vehicles with stepped automatic transmissions were successfully tested in long-run tests.
In addition, the R&D team worked on the development and implementation of a completely new test rig design which revolutionizes analysis methods for efficiency losses when wet friction systems are used. Based on this, it will be possible to develop corresponding, targeted, advantageous designs based on data. The drivers behind these developments are the megatrends of increasing efficiency and reducing emissions which, especially for wet friction systems, require maximum efficiency at maximum power density at given specifications. The previously typical practice of increasing robustness by oversizing components and, therefore, systems must be avoided; better analysis capabilities during the design process along with the resulting new component designs are needed. The new test rig design improves measurement accuracy by a factor of more than ten and thereby also constitutes a completely new level of data quality on which to base Miba’s component development and the development of systems at customers.
One outcome of the R&D work in the past fiscal year is the preparation of a new powder-sintered lining for production. Powder sintering technology is famous for achieving the greatest power density of all current friction material technologies. The markedly positive friction characteristics and therefore very precision-balanced operation allow for better systems solutions and new areas of application.
For more information on Miba coatings, please
refer to page 73.
> Management Report > Research & development
19
High-precision power electronics components
Power electronics components play an important role in more efficient power trains and in the ever-increasing use of renewable energy sources. Passive electronic components, such as high-power resistors and cooling components for power electronics, serve to increase the performance and operational safety of these applications.
One focus in the area of resistors was on the development of prototypes for a maximum power resistor which allows an increase in performance of 100 percent compared to previous products, as well as on a new high-power resistor which surpasses the previous levels of precision achieved. With this, resistor discrepancies during operation can be reduced by half and more. Production is planned to commence in fiscal year 2015–2016 for both types of resistors.
Development efforts in the area of cooling components were, as in the previous year, focused on fine-tuning vacuum-soldering with a new generation of technology which is characterized by a combination of cost-effective manufacturing, good heat resistance and potential for a particularly low flow rate back pressure. Vacuum-soldered heat sinks are used in converters for HVDC12 power transmission systems and traction applications, for example. They have optimal thermal transmission characteristics and a design that is precisely tailored to the semiconductor elements to be cooled. Furthermore, a series production technique was developed for heat sinks with molded non-corroding tubes.
Fresh impetus from mobile special machinery
Miba Automation Systems is a specialist for special machinery for the high-precision and fast machining of small to very large components. Each system is developed and constructed based on a specific order and in close cooperation with the customer. The Company is the technology leader in mobile CNC-controlled machining equipment. These allow components to be worked on directly at their final destination. With this innovative concept, Miba is not only saving its customers high transportation costs and the otherwise necessary refinishing of components, but also valuable time.
The mobile special machinery also, for example, allows the quicker, more precise and more cost-efficient construction of wind towers. Modern wind turbine power trains are becoming ever more powerful and can, at optimum wind yield, already produce electricity of 7 MW and more. The prerequisite for this is a greater hub height coupled with a lower fault tolerance in the production of the wind towers. In the past fiscal year, Miba Automation Systems developed, among other things, milling machines which were specifically tailored to these requirements. For example, the double-sided girth weld milling machine, a world first, allows simultaneous double-sided machining of pipe sections which are up to eight meters in diameter. After the weld seam has been prepared, the wind tower tubes can be assembled with precision that was previously not possible.
For more information on Miba power electronics components, please refer to page 74.
12 High-voltage direct current
For more information
on Miba coatings, please refer to page 76.
For more information
on Miba power electronics components, please refer to page 76.
> M
anag
emen
t R
epo
rt
6160
> Management report > Research & development

20
Innovative coating solutions
The Miba Coating Group specializes in innovative coating solutions. The goal is to achieve maximum service life and optimum functionality of the coated parts while consuming a small amount of raw materials and conserving resources.
The successful completion of the Smart Coatings project which ran over a number of years and the continuation of these developments by focusing on PVD thin film technology were at the center of research activities in fiscal year 2014–2015. Here, we succeeded in using the Austrian Research Promotion Agency’s “Produktion der Zukunft” (production of the future) support framework for previously developed coating technologies to demonstrate suitable production processes and industrial technologies for the efficient implementation of volume production. In this project, the R&D team was particularly working on the (further) development of coatings to improve tribological properties as a contribution to low-consumption power trains and on direct coatings as a replacement for bearings and adaptive coatings for gear drives.
Another focus was on the development of coating solutions in the hydrogen economy and bio energy area, with the aim of increased efficiency and more profitable production of fuel cell, electrolyzer and reformer components. For example, the high electrical conductivity of the layers improves fuel cell performance. At the same time, the layers provide protection from oxidation which safeguards the fuel cell service life requirements.
In addition, the R&D team worked on the improvement of existing technologies in the area of polymer coatings, the development of very hard, wear-resistant layers which are, among other things, used in motorsport, and the development of coatings and industrial systems for manufacturing coins.
> Management Report > Employees
21
Picture your career with vision: this expression summarizes what makes Miba unique as an employer Miba has an ambitious corporate culture: Anyone joining Miba will be challenged and supported on a personal basis. They can use their freedom to explore autonomously and thus help to shape Miba and bring things about which they can be proud of.
Miba encourages its employees to think and act in an entrepreneurial manner, to contribute their own ideas, to pursue them passionately and thus to contribute to Miba’s progress. Miba does not regard technological advantage as the responsibility of a certain department, but as the responsibility of all of its employees. Thirst for knowledge, commitment and inventiveness are expected and encouraged at all levels. Under the maxim of Lifelong Learning, Miba supports the training and continuing education of all employees, thereby making room for their personal and professional development.
Increase in personnel in China, the US, Slovakia and Austria
In 2014–2015, the Miba Group on average employed 4,753 people at 22 production sites across the world (2013–2014: 4,294 employees). In addition, the Company employed an average of 196 temporary staff during the year. As of the January 31, 2015, reporting date, the number of employees was 4,936, and thus 11.6 percent, or 512 employees, above the prior-year level of 4,424 employees.
The increase in personnel mainly took place at Miba sites in China, the US, Slovakia and Austria. The number of employees increased the most in China with a rise of 282 employees. This is to a large extent attributable to the initial consolidation of EBG Shenzhen in the past fiscal year. At the same time, as many as 100 new jobs were created in the first year after the expansion of Miba’s Suzhou site. As of January 31, 2015, the number of employees in the US had also risen by 100 compared to January 31, 2014; 44 of these were employed by Advanced Bearing Materials LLC.13 As of January 31, 2015, Miba employed approximately 60 employees more in Slovakia and Austria each compared to January 31, 2014. Growth at foreign Miba sites is the prerequisite for further growth in Austria.
At EUR 203.8 million, personnel expenses for the past fiscal year were 10.0 percent above those for the previous year (EUR 185.3 million). At 30.4 percent, personnel expenses as a percentage of revenue were therefore at the prior-year level (30.4 percent). The consistently high proportion of personnel expenses in relation to revenue represents one of the challenges for the Company in its effort to continue to facilitate profitable growth.
Almost 12 percent of Miba’s employees are college or university graduates, and more than 20 percent are women. The average Miba employee is 36.9 years old and has been employed by the Company for about eight years.
EmployeesPICTURE YOUR CAREER WITH VISION – THE SECRET OF OUR SUCCESS
13 Advanced Bearing Materials LLC was proportionately consolidated for the first time in the past fiscal year. Employee numbers are, however,
disclosed as if the company had been consolidated in full.
Miba global headcountas of January 31, 2015: 4,936 employees
USA651
China665
Slovakia1,277
Austria2,191
Singapore33
India44
United Kingdom58
Other17
> M
anag
emen
t R
epo
rt
6362
> Management report > Employees

22
Customized training program
Miba has relied on high-quality in-house apprenticeship training for decades. With 205 young people in training overall, the number of vocational trainees reached a new high in the past fiscal year (previous year: 177). The customized training program is one of the secrets of Miba’s success – with teaching content that is exactly geared to Miba’s needs and an extensive range of additional qualifications on offer, the Company is training the next generation of specialists and also guarding against a shortage of skilled personnel. Nearly all former apprentices have stayed with the Company upon completing their apprenticeships.
At the Austrian sites, apprenticeship training has already been established for decades. For some years, Miba has also been offering a training program at the Slovakian sites. Miba Steeltec in Vráble has professionalized this as part of the youngSTAR pilot project, a Slovakian government initiative which is supported by the Austrian Economic Chambers and partner companies like Miba, and converted it into dual vocational training along upper-Austrian lines. Miba’s involvement and the experience gained with the youngSTAR project contributed directly to the parliamentary work and legislation which will regulate a new dual vocational training model in Slovakia from September 2015. A total of nearly 70 young people are undergoing training at Miba’s Slovakian sites.
Global growth – for Miba and for our employees
In fiscal year 2014–2015, human resources work focused mainly on personnel and organizational development while taking account of Miba’s global growth. In view of the expansion of the Chinese site and the sharp increase in employee numbers which is necessary as a result, it is, for example, important to safeguard the sustainable development of technical and managerial competencies at all hierarchical levels and to create the corresponding organizational structure. The first measures relating to this were initiated in the past fiscal year.
The development of executives in an international context was also at the center of the relaunch of the Miba Leadership Academy (MLA), Miba’s customized executive development program. Since 2014, training modules have been delivered in the US and China as well as in Austria in order to the prepare the participating executives in an even more targeted way for the challenges which arise as part of Miba’s continued global growth.
Under its core value of Lifelong Learning, Miba offers all employees extensive training and continuing education arrangements regardless of their education or hierarchical level. Training and continuing education expenses across Miba totaled EUR 1.7 million in fiscal year 2014–2015 (previous year: EUR 1.5 million).
Miba as an employer Further information
on Miba as an employer can be found at
www.miba.com/freiraum
> Management Report > Employees
23
Pointing the way ahead
In the past fiscal year, the Human Capital team implemented a new system for career and succession planning. As well as setting up a SAP-based system, COMPASS covers the implementation of a career and succession planning process across the Group. Existing human resources tools such as the employee review and the management development dialog are also being incorporated into the new system.
Every voice counts
An employee survey was conducted at all Miba sites in the spring of 2014. Overall, more than 3,200 employees took part, which corresponds to a participation rate of 71 percent (2012 participation rate: 57 percent). Participants assessed the importance of the following topics and Miba’s performance in these areas: work place and working conditions, work area, management, information and communication, opportunities for development, collaboration, as well as objectives and responsibilities of the Company. The survey results demonstrate positive developments in the area of management since the last survey in 2012 as well as noticeable improvements in terms of information and communication, among other things. At 70.65 points, the loyalty index, which measures the general mood in the Company, was at a very satisfactory level.
The survey results form an important basis for improvement measures at the employee, departmental and organizational level. The results were presented at each site in the summer and implementation of the initial measures was initiated.
Outlook for 2015–2016
Most of the activities described are being continued in fiscal year 2015–2016. The intention is to roll out the career management system across the world and to also accelerate dual vocational training in China and in the US in addition to Austria and Slovakia. At the Upper Austrian sites, Miba will supplement its apprenticeship training activities by offering an on-the-job apprenticeship for existing employees. The development of executives will again play a large role in 2015–2016.
At the center of all the improvement measures and progress is the Miba 2020 strategy which has been in force since the fall of 2014. In it, People are defined as one of the three pillars – also to demonstrate that we are aware of the role which is played by our employees: They are the drivers of our success – now and in the future.
> M
anag
emen
t R
epo
rt
6564
> Management report > Employees

24
For us, corporate social responsibility means that the pursuit of financial success goes hand in hand with environmentally-friendly conduct and an awareness of our responsibilities towards our employees and society. Sustainable and forward-looking thought and action is firmly established in our corporate culture. Since our company was formed over 85 years ago, our concern is to ensure that we organize our work in such a way that subsequent generations can also benefit from it. Our products and technologies are market leaders in terms of cost-effectiveness, quality and ecology and contribute to a cleaner planet. Our corporate strategy focuses on sustainable, long-term growth. We are creating secure jobs across the world and are therefore assuming responsibility for society – now and in the future.
Technologies for a Cleaner Planet
With 235 employees working in research and development, and expenditure on research as a percentage of revenue of 4.2 percent, Miba is following its mission: Technologies for a Cleaner Planet. Rising customer demands and increasing restrictions from environmental legislation are reinforcing our desire to make our products even more environmentally friendly and to continually optimize the use of resources in our production processes. Correspondingly, our innovation focuses on energy efficiency as well as on increasing the precision and comfort of the products of our customers. This ultimately leads to improved total cost of ownership, lower fuel consumption and reductions in emissions.
Towards great goals with awesome employees
With their commitment, expertise, ideas and suggestions, employees are the cornerstone of Miba’s success. As a responsible employer, the Company not only encourages its employees to develop their professional and personal competencies, it also makes every effort to provide a pleasant and healthy working environment and to support its employees in achieving a better balance of family and career.
With health-related activities such as ergonomic workshops, events dealing with stress and burnout prevention and smoking cessation courses, Miba motivates its employees to take even greater care of their own health while also giving them the opportunity to improve their work-life balance. Since the fall of 2013, Miba has been offering in-house child care for children from one to three years old. Due to the high demand, the number of child care places was doubled to 24 in 2014. With its day care center, Miba is making it easier for women to return to work after maternity leave and is setting itself apart as a family-friendly company. In May 2014, Miba was awarded the Felix Familia, the family prize of Upper Austria, for this initiative. In March 2015, Miba was awarded the Upper Austrian industry silver prize for corporate social responsibility, the Corona, also for the day care center.
Corporate social responsibility
CONSCIOUSLY ASSUMING RESPONSIBILITY
> Management Report > Corporate social responsibility
25
Active environmental management as an innovative factor
Miba products improve the performance of motor vehicles, trains, ships, aircraft and power plants and make them more efficient and environmentally friendly. The high-tech components help to reduce emissions and fuel consumption while at the same time improving the performance of engines and power trains. Even at the product manufacturing stage, active environmental management is the key innovative factor for increasing environmental and economic efficiency. In doing so, Miba is concentrating on optimizing the use of energy and resources, reducing emissions and using materials and supplies which do not harm the environment, thus advocating the preservation of an unspoiled environment as the basis of life for our society and for future generations.
In 2014, Miba set up an environment, security and energy efficiency support unit which links up all sites across the world. This unit is responsible for the implementation of and compliance with processes that span all sites as well as for other improvement measures in these areas. Miba Sinter Austria GmbH, for example, established a carbon footprint for sintered components which determines the environmental performance of the site and of the sintered components. An IT tool was also developed as part of this project which calculates the global warming potential (GWP) and renewable as well as non-renewable primary energy of existing and new sintered components at the press of a button. The sinter plant derived a number of improvement measures from the initial results which should generate savings of 23 tons of CO2e a year. The sinter site in Slovakia implemented measures to recycle waste water as a result of which approximately 480m3 or 480,000 liters less water is being used per year.
Support for charitable organizations and educational initiatives
Miba’s social responsibility ranges from the quality and eco-friendliness of its products to supporting educational and technology projects. For a number of years now, Miba has been a partner in the “Kinder erleben Technik” (KET – Children experience technology) project which encourages children from four to six years old to take an interest in technology with a mobile and innovative offering. The OTELO (Offenes Technologielabor – Open technology laboratory) association, which Miba also supports with monetary donations and donations in kind, is the KET sponsor.
In addition, Miba is taking an important step to integrate socially disadvantaged people and those with physical or mental disabilities into work and society. Miba supports aid projects directly in-house and far beyond such as the Elijah project in Siebenbuergen which was set up by Pater Georg Sporschill SJ or the KaKiHe association for the provision of drinking water in Cambodia which was founded by two Miba employees from Laakirchen. Moreover, every year, instead of giving Christmas gifts to customers and business partners, Miba supports a social project in one of the countries in which it operates. In 2014, the Christmas sponsorship went to the Suzhou City Social Welfare Home in Suzhou, China, which looks after orphans in particular. Miba’s donation was given to improve the home’s educational infrastructure. The children are also being allowed to participate in school and leisure activities which help them develop their individual strengths and social skills.
> M
anag
emen
t R
epo
rt
6766
> Management report > Corporate social responsibility

26
According to the IMF, the eurozone economy grew by 0.8 percent in 2014. This growth rate represents progress over 2013 when the economy shrunk by 0.5 percent and corresponds exactly to the IMF’s October 2014 forecast.14 The slow, uncertain performance of the eurozone in past years continued to be reflected in many Miba component sales markets. Approximately 9.6 percent fewer heavy trucks were produced in Europe in 2014 as a result.15 Sales of tractors declined in the European Union by 8 percent.16 As in other regions, demand for power electronics components was sluggish due to the restrained investment climate. By contrast, the performance of the European automotive industry was stable overall, with the number of passenger vehicles produced rising by 2.5 percent from 2013. The negative performance in Eastern Europe was offset by higher growth rates for example in the United Kingdom, Italy and Germany.17
Despite Europe’s rather subdued overall performance, Miba was able to further expand its activities in this region. With its research centers in Austria, the Company performs a large part of its development work in Europe and therefore near to the headquarters of the most important OEMs and tier one suppliers. Miba pursues a “local-to-local” approach in all the regions in which it operates and manufactures in the proximity of its customers. The production sites in Austria, Slovakia, the Czech Republic, Slovenia and the United Kingdom mostly supply the European market although they continue to play an important role internationally because they support the growth in the US and China.
In the past year, Miba Europe generated revenue of EUR 478.2 million which makes it Miba’s top division in terms of revenue. This equates to an increase of 5.2 percent compared to the previous year (EUR 454.5 million). The European sinter sites and the Austrian coatings site were the main contributors to this growth.
During the past fiscal year, Miba Europe invested EUR 29.2 million in capacity expansions as well as in new equipment and machinery (previous year: EUR 35.3 million). Among other things, the site belonging to Miba Sinter Slovakia s.r.o, a Miba Sinter Group company, was expanded further. With the help of these investments, Miba Sinter Slovakia s.r.o is becoming a competence center for the machining of sintered products. A strategically important project was completed for bearing products – the separating out of the input stock production line for engine bearings into a separate partial operation at Aurachkirchen (Upper Austria). The new site ensures that engine bearings plants across the world can be supplied with input stock even if there is an increase in demand at short notice. In the power electronics segment, capacities were not only expanded and machinery modernized at the sites of EBG Elektronische Bauelemente GmbH and DAU GmbH & Co KG in Styria in the past fiscal year, the decision was also taken to set up a second site for the manufacturing of resistors. Not only does this improve the workflow significantly, it also ensures that sufficient space is available for further growth.
Miba Europe POSITIVE PERFORMANCE IN A CHALLENGING MARKET ENVIRONMENT
An overview of all Miba Group sites by segment is presented on
pages 10 and 11.
14 cf. IMF: World Economic Outlook Update, January 2015 and World Economic Outlook, October 2014 15 cf. ACEA: New Commercial Vehicle Registrations, January 2015 16 cf. Agrievolution: Tractor Market Report, calendar year 2014, http://www.agrievolution.com/PDF/2014-Agrievolution-Tractor-Market-Report.pdf,
retrieval date: March 12, 2015 17 cf. LMC Automotive, January 2015
> Management Report > Miba Europe
27
Outlook
After the European automotive industry’s strong start into 2015, the outlook for the whole year is also cautiously positive. Despite the collapse of the market in Eastern Europe (Russia, Ukraine), slight growth of up to 2 percent is expected in Europe.18 For heavy trucks, it is being assumed that the weak performance in 2014 will also continue in 2015, while a marked decline is expected for agricultural light commercial vehicles. Forecasts for the development of demand for industrial facilities for which Miba produces power electronics components as well as for plant engineering remain difficult.
2014–15 2013–14
Revenue in EUR million 478.2 454.5
Capital expenditure in EUR million 29.2 35.3
Average number of employees for the year 3,382 3,239
18 cf. LMC Automotive: European Automotive Production Forecast, Monthly Commentary, February 2015
26
According to the IMF, the eurozone economy grew by 0.8 percent in 2014. This growth rate represents progress over 2013 when the economy shrunk by 0.5 percent and corresponds exactly to the IMF’s October 2014 forecast.14 The slow, uncertain performance of the eurozone in past years continued to be reflected in many Miba component sales markets. Approximately 9.6 percent fewer heavy trucks were produced in Europe in 2014 as a result.15 Sales of tractors declined in the European Union by 8 percent.16 As in other regions, demand for power electronics components was sluggish due to the restrained investment climate. By contrast, the performance of the European automotive industry was stable overall, with the number of passenger vehicles produced rising by 2.5 percent from 2013. The negative performance in Eastern Europe was offset by higher growth rates for example in the United Kingdom, Italy and Germany.17
Despite Europe’s rather subdued overall performance, Miba was able to further expand its activities in this region. With its research centers in Austria, the Company performs a large part of its development work in Europe and therefore near to the headquarters of the most important OEMs and tier one suppliers. Miba pursues a “local-to-local” approach in all the regions in which it operates and manufactures in the proximity of its customers. The production sites in Austria, Slovakia, the Czech Republic, Slovenia and the United Kingdom mostly supply the European market although they continue to play an important role internationally because they support the growth in the US and China.
In the past year, Miba Europe generated revenue of EUR 478.2 million which makes it Miba’s top division in terms of revenue. This equates to an increase of 5.2 percent compared to the previous year (EUR 454.5 million). The European sinter sites and the Austrian coatings site were the main contributors to this growth.
During the past fiscal year, Miba Europe invested EUR 29.2 million in capacity expansions as well as in new equipment and machinery (previous year: EUR 35.3 million). Among other things, the site belonging to Miba Sinter Slovakia s.r.o, a Miba Sinter Group company, was expanded further. With the help of these investments, Miba Sinter Slovakia s.r.o is becoming a competence center for the machining of sintered products. A strategically important project was completed for bearing products – the separating out of the input stock production line for engine bearings into a separate partial operation at Aurachkirchen (Upper Austria). The new site ensures that engine bearings plants across the world can be supplied with input stock even if there is an increase in demand at short notice. In the power electronics segment, capacities were not only expanded and machinery modernized at the sites of EBG Elektronische Bauelemente GmbH and DAU GmbH & Co KG in Styria in the past fiscal year, the decision was also taken to set up a second site for the manufacturing of resistors. Not only does this improve the workflow significantly, it also ensures that sufficient space is available for further growth.
Miba Europe POSITIVE PERFORMANCE IN A CHALLENGING MARKET ENVIRONMENT
An overview of all Miba Group sites by segment is presented on
pages 10 and 11.
14 cf. IMF: World Economic Outlook Update, January 2015 and World Economic Outlook, October 2014 15 cf. ACEA: New Commercial Vehicle Registrations, January 2015 16 cf. Agrievolution: Tractor Market Report, calendar year 2014, http://www.agrievolution.com/PDF/2014-Agrievolution-Tractor-Market-Report.pdf,
retrieval date: March 12, 2015 17 cf. LMC Automotive, January 2015
> M
anag
emen
t R
epo
rt
6968
> Management report > Miba Europe

28
In terms of economic performance, the US was one of the winners in 2014; with economic growth of 2.4 percent compared to 2013, it exceeded the growth forecasts in October by 0.2 percentage points. Canada recorded a rise in GDP of 2.4 percent which, however, corresponded to a negative adjustment of 0.1 percentage points compared with the October predictions. In contrast to North America, growth slowed down in Latin America in particular. Brazil only recorded growth of 0.1 percent and therefore 0.2 percentage points less than had been expected in October.19
As a consequence, the sales markets for Miba components in North America in particular performed quite positively. Falling fuel prices as well as the good US economy also contributed to an increase in production of passenger vehicles and light commercial vehicles of 5.9 percent.20 Heavy trucks also improved substantially in the US, with revenue rising by 19 percent from 2013.21 Performance in the market for locomotive applications was also particularly positive.
Miba Americas – taken to mean all consolidated production sites in America – benefited from this market environment and generated revenue of EUR 113.5 million in fiscal year 2014–2015 and thus 16 5 percent more than in 2013–2014 (previous year: EUR 97.5 million). This segment contributed 17.0 percent to the Miba Group’s total revenue.
Capital expenditure of the Miba Americas segment was EUR 11.8 million (previous year: EUR 14.4 million). In the first half of 2014–2015, the expansion work at Miba Sinter USA LLC in McConnelsville, Ohio, was completed. Miba doubled the production area only four years after opening the sinter plant; this is particularly attributable to the large potential of the North American automotive industry. Part of the investments also went into Miba HydraMechanica Corp. in Sterling Heights, Michigan, where new customer projects were being prepared.
Miba Americas TAKING ADVANTAGE OF OPPORTUNITIES IN THE MARKET
19 cf. IMF: World Economic Outlook Update, January 2015 and World Economic Outlook, October 2014 20 cf. Automotive News, January 23, 2015 21 cf. The Rhein Report, February 2015
> Management Report > Miba Americas
29
Outlook
For 2015, expectations are for slight growth in the automotive industry in North America, while a further decline is being assumed for Brazil. Signs for heavy trucks and locomotive applications look more positive, with further growth expected in both markets. According to forecasts, demand for off-road applications will continue to fall.
2014–15 2013–14
Revenue in EUR million 113.5 97.5
Capital expenditure in EUR million 11.8 14.4
Average number of employees for the year 628 539
.
> M
anag
emen
t R
epo
rt
7170
> Management report > Miba Americas

30
Asia’s emerging markets recorded growth of 6.5 percent in 2014. Despite a slight slow-down in economic performance, China continues to be the main growth driver with growth of 7.4 percent compared with 2013. India recorded GDP growth of 5.8 percent and was therefore only 0.2 percentage points below the October forecasts.22
With the rising demand for individual mobility, the Chinese automotive industry in particular performed positively. China produced 22.6 million passenger and light commercial vehicles in 2014 and thus 8.2 percent more than in 2013 (20.9 million passenger vehicles and light commercial vehicles). The Indian automotive market only grew by 0.8 percent compared with 2013. Performance in the heavy truck and tractor sales markets in China declined slightly or was stable. 2 percent fewer heavy trucks were produced; the demand for tractors remained roughly at the prior-year level.24 The large engine market, particularly for ship engines, remained at the low level of 2013.
Despite the performances in the sales markets which were at times weak, Miba was able to further expand its activities in Asia. With its consolidated production sites in China and India, Miba Asia recorded revenue of EUR 77.5 million in fiscal year 2014–2015 (previous year: EUR 58.2 million). This corresponds to an increase in revenue of 33.3 percent in only one year, which is also attributable to the initial consolidation of EBG Shenzhen Ltd. as well as to the growth of Miba Precision Components (China) Co. Ltd. EBG Shenzhen Ltd produces high-power resistors which are, for example, used in the power electronics of frequency converters or in modern medical equipment.
Miba Asia’s capital expenditure amounted to EUR 12.9 million in fiscal year 2014–2015 (previous year: EUR 15.6 million). Investments primarily related to the completion of the building work and to subsequent investments in production facilities at Miba Precision Components (China) Co. Ltd.’s site in Suzhou as well as the associated increase in machinery. The trebling of the floor space also set the foundation for the production of friction materials and coatings, as well as expanding capacity for the production of engine bearings and sintered components which has been on site since 2007. In Pune in India, expansion work started at Miba Drivetec India Ptv. Ltd. where fiber composite discs and steel counter discs are produced for tractors.
Miba Asia INVESTMENTS IN FUTURE MARKETS
22 cf. IMF: World Economic Outlook Update, January 2015 and World Economic Outlook, October 2014 23 cf. LMC Automotive, January 2014 and LMC Automotive, January 2013 24 cf. LMC Automotive, January 2014 and Agrievolution: Tractor Market Report, calendar year 2014, http://www.agrievolution.com/PDF/2014-
Agrievolution-Tractor-Market-Report.pdf, retrieval date: March 12, 2015
> Management Report > Miba Asia
31
Outlook
The automotive industry in China is expected to continue to grow in 2015, although growth rates will be lower than in recent years. India is also expected to perform positively. Although the demand for heavy trucks has stabilized after a very weak end to 2014, the outlook for the whole year still remains difficult. Similar to other regions, the markets for off-road applications and ships also continue to remain at an extremely low level in Asia.
2014–15 2013–14
Revenue in EUR million 77.5 58.2
Capital expenditure in EUR million 12.9 15.6
Average number of employees for the year 629 412
30
Asia’s emerging markets recorded growth of 6.5 percent in 2014. Despite a slight slow-down in economic performance, China continues to be the main growth driver with growth of 7.4 percent compared with 2013. India recorded GDP growth of 5.8 percent and was therefore only 0.2 percentage points below the October forecasts.22
With the rising demand for individual mobility, the Chinese automotive industry in particular performed positively. China produced 22.6 million passenger and light commercial vehicles in 2014 and thus 8.2 percent more than in 2013 (20.9 million passenger vehicles and light commercial vehicles). The Indian automotive market only grew by 0.8 percent compared with 2013. Performance in the heavy truck and tractor sales markets in China declined slightly or was stable. 2 percent fewer heavy trucks were produced; the demand for tractors remained roughly at the prior-year level.24 The large engine market, particularly for ship engines, remained at the low level of 2013.
Despite the performances in the sales markets which were at times weak, Miba was able to further expand its activities in Asia. With its consolidated production sites in China and India, Miba Asia recorded revenue of EUR 77.5 million in fiscal year 2014–2015 (previous year: EUR 58.2 million). This corresponds to an increase in revenue of 33.3 percent in only one year, which is also attributable to the initial consolidation of EBG Shenzhen Ltd. as well as to the growth of Miba Precision Components (China) Co. Ltd. EBG Shenzhen Ltd produces high-power resistors which are, for example, used in the power electronics of frequency converters or in modern medical equipment.
Miba Asia’s capital expenditure amounted to EUR 12.9 million in fiscal year 2014–2015 (previous year: EUR 15.6 million). Investments primarily related to the completion of the building work and to subsequent investments in production facilities at Miba Precision Components (China) Co. Ltd.’s site in Suzhou as well as the associated increase in machinery. The trebling of the floor space also set the foundation for the production of friction materials and coatings, as well as expanding capacity for the production of engine bearings and sintered components which has been on site since 2007. In Pune in India, expansion work started at Miba Drivetec India Ptv. Ltd. where fiber composite discs and steel counter discs are produced for tractors.
Miba Asia INVESTMENTS IN FUTURE MARKETS
22 cf. IMF: World Economic Outlook Update, January 2015 and World Economic Outlook, October 2014 23 cf. LMC Automotive, January 2014 and LMC Automotive, January 2013 24 cf. LMC Automotive, January 2014 and Agrievolution: Tractor Market Report, calendar year 2014, http://www.agrievolution.com/PDF/2014-
Agrievolution-Tractor-Market-Report.pdf, retrieval date: March 12, 2015
> M
anag
emen
t R
epo
rt
7372
> Management report > Miba Asia

32
The Miba Shared Services segment comprises all Miba Group companies that provide internal (management) services to all or to a number of segments. These companies therefore do not generate any external revenue.
(Intragroup) revenue in this segment was EUR 37.9 million in fiscal year 2014–2015 (previous year: EUR 25.3 million).
Capital expenditure in the Miba Shared Services segment amounted to EUR 1.3 million in fiscal year 2014–2015 (previous year: EUR 1.9 million) and concerned construction measures and IT applications.
2014–15 2013–14
Capital expenditure in EUR million 1.3 1.9
Average number of employees for the year 115 103
Miba Shared Services USING SYNERGY EFFECTS INTELLIGENTLY
> Management Report > Product groups
33
Miba sintered components
Miba sintered components are high-precision, high-strength components which have been developed in-house and are predominantly used in passenger vehicle engines and transmissions. High-volume manufacturing of sintered components is a very cost-effective technology. Maximum utilization of materials with little energy input also makes it very environmentally friendly.
Thanks to the slight improvement in the European automotive market and supported by new projects in Europe, North America and Asia, the sintered component business grew in the past fiscal year 2014–2015. Globally, Miba generated revenue of EUR 251.5 million from sintered components which corresponds to an increase of EUR 27.1 million or 12.1 percent compared with the previous year (EUR 224.4 million). All sites contributed to the rise in revenue.
Production areas in Slovakia, the US and China were expanded extensively and new production capacities were created in order to be prepared for future growth. Furthermore, Miba increased its international development team for sintered components and expanded its test facilities.
Miba engine bearings
Engine bearings are crucial components that significantly affect combustion engine function and service life. They help hold crank- and camshafts in place, minimize friction during operation and protect the engine against damage and breakdown. By constantly developing new types of bearings, the Miba Bearing Group is ensuring that modern engines are able to produce top performances efficiently and in an environmentally-friendly manner even under extreme conditions.
Performance in the engine bearings core markets was largely positive in the past fiscal year, 2014–2015. Globally, Miba generated revenue of EUR 205.6 million from engine bearings and thus EUR 24.3 million, or 13.3 percent, more than in 2013–2014 (previous year: EUR 181.3 million).
Miba friction materials
Miba friction materials are the element which determines performance in clutches and brakes. They make a significant contribution to efficiency improvements. Miba is a long-standing development partner and high-performance friction materials supplier of the international vehicle and machinery industry.
Against the background of once-again declining core markets such as the global mining vehicle market or the market for tractors in India, the performance of the friction materials business in fiscal year 2014–2015 was satisfactory. Globally, Miba recorded revenue of EUR 139.3 million in this area and was therefore roughly at the 2013–2014 level (previous year: EUR 140.7 million). The decline in some sales markets was more than offset by new business in other market segments such as automotive or off-road.
Product groups TECHNOLOGIES FOR A CLEANER PLANET
An overview of the whole product
portfolio is presented on pages 12 and 13.
An overview of R&D work in the
individual divisions is presented as of page 56.
An overview
of the whole product portfolio is presented on pages 12 and 13.
An overview
of R&D work in theindividual divisions ispresented as of page 58.
> M
anag
emen
t R
epo
rt
7574
> Management report > Product groups

34
Miba power electronics components
Miba develops and produces passive electronic components, such as resistors and cooling systems for power electronics. Miba resistors regulate the voltage in modern medical equipment, for example, or in the power electronics of frequency converters, e.g., for wind power plants. Miba heat sinks and heat pipes cool electronic components in drive train control units, power supply units, power transmission systems or wind power plants; component service life is increased as a result of their efficient performance.
Performance in the power electronics market was only weak in the past fiscal year, 2014–2015. Globally, Miba generated revenue of EUR 46.0 million from power electronics components which corresponds to an increase of 14.1 percent compared with 2013–2014 (previous year: EUR 40.3 million).
Miba coatings
Miba develops and produces innovative coating solutions such as polymer and low-friction coatings, electroplated overlays and PVD coatings. Components coated by Miba are incorporated into vehicle power trains and contribute, among other things, to ensuring that build space is gained and weight as well as costs are reduced. In addition, they minimize power train friction and improve the efficiency of modern combustion engines.
In the past fiscal year, sales markets performed very positively, particularly for polymer and low-friction coatings; the US and China were the main growth drivers. In 2014–2015, Miba generated revenue of EUR 17.6 million from coatings and thus EUR 2.4 million more than in 2013–2014 (previous year: EUR 15.2 million).
Miba special machinery
Miba develops and builds special machinery for the high-precision and fast machining of small to very large components, with a special focus on the development of mobile CNC machining units. Ever larger components and increasingly complex applications, as well as increased requirements for machining accuracy call for specifically designed equipment. The special machines are, for example, used to build wind towers, for the overhaul of power station turbines or in engine bearings production.
Special machinery revenue was EUR 9.3 million in fiscal year 2014–2015. This equates to an increase of 14.0 percent compared with 2013–2014 (previous year: EUR 8.1 million).
> Management Report > Outlook
35
While the performance of the global economy in 2014 with growth of 3.3 percent did not exceed the 2013 level, the IMF is currently expecting moderate growth rates of 3.5 and 3.7 percent for the coming two years. In October 2014, the IMF was still assuming 3.8 percent global growth for 2015; however, this forecast was lowered in January 2015. We also believe that this estimate is subject to significant risk factors. Reasons for the downward adjustment were, for example, weaker outlooks for China, Russia, Japan and the eurozone. The advantages of falling oil prices are expected to be wiped out by other unfavorable factors such as weaker investments due to lower growth expectations and general uncertainty about economic and geopolitical developments. For the eurozone, GDP growth is being projected at 1.2 percent for 2015 and 1.4 for 2016. This corresponds to a negative adjustment of 0.2 and 0.3 percentage points compared with the October 2014 forecast. As the only major industrialized country, growth expectations for the US were marked up by 0.5 percentage points to 3.6 percent for 2015 and by 0.3 percentage points to 3.3 percent for 2016 because of strong domestic demand. For China, the IMF forecast a further slowdown in growth in 2015 to 6.8 percent and to 6.3 percent in 2016. These forecasts were also recently revised downwards by 0.3 and 0.5 percentage points.25
This outlook confirms Miba’s expectations that particularly the US and China, despite the slowdown in growth, will continue to offer the main potential for growth in the years to come. Miba regards these two markets as growth drivers for the future. With the expansion of premises and capacity, the base for this has already been established in these countries in recent years. However, as in past years, it remains difficult to specifically forecast sales market trends by industry. Generally, we are anticipating moderate growth for the whole of 2015–2016. While the outlook for the first half of 2015–2016 is positive, expectations for the second half of the year are cautious to slightly negative. Expectations for the automotive industry are currently more positive than in recent years, as, on the one hand, the market in the US and China should continue to grow – albeit at a slower rate – and, on the other hand, in contrast to past years, there are once again indications of growth in Europe at least for the first half of the year. There are also, however, risks looming for the automotive industry in the second half of the year because of the uncertainties. Performance of the truck market is uncertain and mixed: While we are expecting growth in the US market in 2015, we are anticipating performance in Europe and China to be uncertain to negative. Although customer ordering patterns do not yet point to sustainable growth in large diesel and gas engines, expectations are slightly positive. Here too we are, however, forecasting a weakening in the quantity of goods being dispatched in the second half of the year. The market for ship engines is still likely to be very weak in the coming year. Agricultural product markets are currently declining sharply due to the Russia/Ukraine crisis, and we expect this trend to continue. The situation in the mining vehicle market is similar. The power electronics component market is characterized by very restrained and short-term ordering patterns. Industrial applications are characterized by reductions in revenue which are partly offset by energy applications (wind, HVDC) which are gaining in momentum again.
Despite the uncertainties which persist in many submarkets, the increased regional focus on America and Asia as part of the Miba 2020 strategy should be a success factor for further growth. Miba is also focusing on Innovation & Technology and People as well as on Global Growth, thus preparing itself for the way ahead towards Miba 2020.
OutlookFOCUS ON MIBA 2020 STRATEGY
25 IMF: World Economic Outlook Update, January 2015
> M
anag
emen
t R
epo
rt
7776
> Management report > Outlook

DI F. Peter Mitterbauer, MBAChairman,regional responsibility for Miba Europe,also responsible for the New Technologies Group, Communications, Management Accounting, Human Capital, Strategy, Innovation & Technology and Internal Audit
Dr.-Ing. Harald NeubertMember of the Management Board,regional responsibility for Miba Americas,also responsible for the Miba Sinter Group, MibaAutomation Systems and Quality
MMag. Markus HoferMember of the Management Board, ChiefFinancial Officer, Miba Shared Services,also responsible for Corporate Finance, IT and Business Excellence
Dr. Wolfgang LitzlbauerVice Chairman,regional responsibility for Miba Asia,also responsible for the Miba Bearing Group, the Miba Friction Group, the Miba Coating Group and Purchasing
Laakirchen on April 30, 2015The Management Board of Miba AG
> M
anag
emen
t R
epo
rt
7978
> Management report > Corporate governance report

38
Governing bodies of the Company
Management Board
DI F. Peter Mitterbauer, MBA, born in 1975
Chairman of the Management Board
Regional responsibility for Miba Europe
Also responsible in the Management Board for the New Technologies Group, Communications, Management Accounting, Human Capital, Strategy, Innovation & Technology and Internal Audit
Date of initial appointment to the Management Board of Miba AG: February 1, 2011
Date of initial appointment as Chairman of the Management Board: July 1, 2013
End of current term of office: June 30, 2018
Supervisory board appointments in other Austrian or foreign companies: none
Dr. Wolfgang Litzlbauer, born in 1969
Vice Chairman of the Management Board
Regional responsibility for Miba Asia
Also responsible in the Management Board for the Miba Bearing Group, the Miba Friction Group, the Miba Coating Group and Purchasing
Date of initial appointment to the Management Board of Miba AG: June 15, 2004
Date of initial appointment as Vice Chairman of the Management Board: July 1, 2013
End of current term of office: June 30, 2018
Supervisory board appointments in other Austrian or foreign companies: Alfred Umdasch Privatstiftung
Dr.-Ing. Harald Neubert, born in 1956
Regional responsibility for Miba Americas
Also responsible in the Management Board for the Miba Sinter Group, Miba Automation Systems and Quality
Date of initial appointment to the Management Board of Miba AG: February 1, 2009
End of current term of office: January 31, 2017
Supervisory board appointments in other Austrian or foreign companies: none
MMag. Markus Hofer, born in 1971
Chief Financial Officer
Miba Shared Services
Also responsible in the Management Board for Corporate Finance, IT and Business Excellence
Date of initial appointment to the Management Board of Miba AG: July 1, 2013
End of current term of office: January 31, 2020
Supervisory board appointments in other Austrian or foreign companies: none
> Management Report > Corporate governance report
39
Supervisory Board
The Supervisory Board of Miba AG comprises four shareholder representatives and two representatives from the Works Council:
Shareholder representatives:
Dkfm. Dr. Wolfgang C. Berndt, born in 1942
Chairman of the Supervisory Board
Independent
Date of initial appointment: June 27, 2008
End of current term of office: date of the Annual General Meeting which deals with the resolution to grant discharge for fiscal year 2018–2019
Member of the Remuneration Committee
Supervisory board appointments in other Austrian or foreign listed companies: GfK SE, OMV AG
Dipl.-Bw. Alfred Heinzel, born in 1947
Vice Chairman
Independent
Date of initial appointment: July 4, 2003
End of current term of office: date of the Annual General Meeting which deals with the resolution to grant discharge for fiscal year 2017–2018
Member of the Audit Committee
Supervisory board appointments in other Austrian or foreign listed companies: Verbund AG
DI DDr. h. c. Peter Mitterbauer, born in 1942
Independent
Date of initial appointment: June 28, 2013
End of current term of office: date of the Annual General Meeting which deals with the resolution to grant discharge for fiscal year 2017–2018
Member of the Remuneration Committee, member of the Audit Committee
Supervisory board appointments in other Austrian or foreign listed companies: Andritz AG (until March 2014), Oberbank AG, Rheinmetall AG
MMag. Peter Oswald, born in 1962
Independent
Date of initial appointment: June 27, 2014
End of current term of office: date of the Annual General Meeting which deals with the resolution to grant discharge for fiscal year 2018–2019
Supervisory board appointments in other Austrian or foreign listed companies: none
Dr. Robert Büchelhofer, born in 1942
Independent
Date of initial appointment: July 4, 2003
End of current term of office: June 27, 2014
Supervisory board appointments in other Austrian or foreign listed companies: Polytec Holding AG
> M
anag
emen
t R
epo
rt
8180
> Management report > Corporate governance report

40
Independence of Supervisory Board members:
The members of the Supervisory Board referred to the Austrian Code of Corporate Governance guidelines when determining the criteria for independence. The Supervisory Board of Miba AG determined the following criteria:
A member of the Supervisory Board shall be regarded as independent if he/she does not have any business or personal relationship with the Company or its Management Board which constitutes a material conflict of interest and might therefore influence the behavior of the Supervisory Board member.
A member shall not have a business relationship with the Company or one of its subsidiaries to an extent that is material to the Supervisory Board member, nor shall any member have had such a relationship in recent years. This also applies to business relationships with companies in which the Supervisory Board member has a substantial economic interest.
Members of the Supervisory Board shall not have been auditors of the Company, nor had an interest in or been an employee of the audit firm during the last three years.
Members of the Supervisory Board shall not be members of the management board of another company in which a member of the Company’s Management Board is a member of the supervisory board.
All members of the Supervisory Board meet the criteria for independence determined by the Supervisory Board, as well as the C-Rule 54 criteria.
Appointed from the Works Council:
Hermann Aigner, born in 1954
Date of initial appointment: May 19, 1994
Member of the Audit Committee
Johann Forstner, born in 1964
Date of initial appointment: December 17, 2009
Management Board and Supervisory Board modus operandi
The Management Board of Miba AG holds monthly Management Board meetings to address issues that are of relevance to the Group as well as issues relating to individual divisions.
Supervisory Board committees:
The Supervisory Board of Miba AG established an Audit Committee which held two meetings during the past 2014–2015 fiscal year. The meetings focused on dealing with the annual and consolidated financial statements for 2013–2014 and on the preparation for the audit of the annual and consolidated financial statements for 2014–2015, as well as on strengthening the internal control system. The members of the Audit Committee are as follows: Dipl.-Bw. Alfred Heinzel (Chairman from June 28, 2013, financial expert), DI DDr. h.c. Peter Mitterbauer (Vice Chairman from June 28, 2013) and Hermann Aigner.
The Remuneration Committee of the Supervisory Board of Miba AG held four meetings during the past fiscal year 2014–2015 and dealt with issues relating to the remuneration of the Management Board of Miba AG as
> Management Report > Corporate governance report
41
well as with succession planning. The members of the Remuneration Committee are as follows: Dr. Wolfgang C. Berndt (Chairman from June 28, 2013) and DI DDr. h.c. Peter Mitterbauer (Vice Chairman from June 28, 2013).
Miba AG’s Supervisory Board held five meetings in fiscal year 2014–2015. These meetings focused on monitoring the Miba Group’s business performance, on strategic goals and on special agenda items such as the acquisition of businesses and other transactions requiring approval.
Management Board and Supervisory Board remuneration
The objective of the Management Board remuneration system is to provide remuneration to members of the Management Board which is appropriate in terms of their duties and areas of responsibility, as well as competitive both nationally and internationally. A significant component of this is the highly variable portion which takes account of the success of the Company, including both positive as well as negative performance. The annual bonus is a variable cash payment with shortterm, mediumterm and long-term incentive effect, the amount of which is made up of individual and earnings-oriented targets. Total remuneration of the members of the Management Board of Miba AG for fiscal year 2014–2015 was EUR 2,767 thousand. It comprised the following: DI F. Peter Mitterbauer, MBA, received fixed remuneration of EUR 330 thousand and variable remuneration of EUR 141 thousand, EUR 175 thousand from long-term oriented remuneration and EUR 73 thousand from the increase in value of long-term remuneration components already acquired in previous years; Dr. Wolfgang Litzlbauer received fixed remuneration of EUR 330 thousand, variable remuneration of EUR 134 thousand, EUR 283 thousand from long-term oriented remuneration and EUR 138 thousand from the increase in value of long-term remuneration components already acquired in previous years; Dr.-Ing. Harald Neubert received fixed remuneration of EUR 263 thousand, variable remuneration of EUR 126 thousand, EUR 157 thousand from long-term oriented remuneration and EUR 127 thousand from the increase in value of long-term remuneration components already acquired in previous years; and MMag. Markus Hofer received fixed remuneration of EUR 253 thousand, variable remuneration of EUR 89 thousand, EUR 135 thousand from long-term oriented remuneration and EUR 13 thousand from the increase in value of long-term remuneration components already acquired in previous years. For one member of the Management Board, an incentive agreement which focuses on the long term was entered into in January 2015; however, this did not yet affect remuneration in the past fiscal year.
Management Board members have individual pension arrangements under which the Company pays predetermined amounts to the Management Board members.
On termination of office, all members of the Management Board are entitled to statutory termination benefits, provided their employment ends at the same time.
Miba AG has directors and officers liability insurance in place (D&O insurance); the costs for this are borne by the Company. The annual premium is approximately EUR 17 thousand.
Under Article 18 of the Articles of Incorporation, members of the Supervisory Board receive an annual reimbursement of expenses in addition to an attendance fee of EUR 1 thousand per meeting. Total Supervisory Board remuneration is determined annually by the Annual General Meeting, with this amount being divided among the members of the Supervisory Board by the Supervisory Board itself.
> M
anag
emen
t R
epo
rt
8382
> Management report > Corporate governance report

DI F. Peter Mitterbauer, MBAChairman,regional responsibility for Miba Europe,also responsible for the New Technologies Group, Communications, Management Accounting, Human Capital, Strategy, Innovation & Technology and Internal Audit
Dr.-Ing. Harald NeubertMember of the Management Board,regional responsibility for Miba Americas,also responsible for the Miba Sinter Group, MibaAutomation Systems and Quality
MMag. Markus HoferMember of the Management Board, ChiefFinancial Officer, Miba Shared Services,also responsible for Corporate Finance, IT and Business Excellence
Dr. Wolfgang LitzlbauerVice Chairman,regional responsibility for Miba Asia,also responsible for the Miba Bearing Group, the Miba Friction Group, the Miba Coating Group and Purchasing
Laakirchen on April 30, 2015The Management Board of Miba AG
Promotion of women in the Management Board, Supervisory Board and in managerial positions
Miba promotes the development of women in leadership positions for all functions, particularly through an increased involvement of women in internal executive training programs.
> M
anag
emen
t R
epo
rt
8584
> Management report > Corporate governance report

IFRS ConsolidatedFinancial
Statements > C
on
solid
ated
Fin
anci
al S
tate
men
ts A
cco
rdin
g t
o IF
RS
s

86
in TEUR Note 2014–15 2013–14
Revenue (1) 669,302 610,167
Changes in inventories of finished goods and work in progress 509 –91
Own work capitalized 4,056 9,917
Gross operating revenue 673,867 619,993
Other operating income (2) 26,824 16,745
Cost of materials and other manufacturing services purchased (3) –270,156 –258,288
Personnel expenses (4) –203,794 –185,334
Other operating expenses (5) –102,975 –84,338
Profit before interest, tax, depreciation and amortization (EBITDA) 123,766 108,778
Depreciation and amortization (6) –40,998 –38,628
Impairment losses (6) –897 0
Profit before interest and tax (EBIT) 81,871 70,151
Share of profits and losses of associates (7) 299 1,049
Net interest income (8) –4,430 –4,504
Other financial result (9) 2,743 12
Financial result –1,389 –3,443
Profit before tax (EBT) 80,483 66,708
Income tax expense (10) –19,858 –16,589
Profit after tax (EAT) 60,625 50,119
Financing costs for LP minority shareholders –3,673 –1,398
Profit after tax and financing costs attributable to LP minority shareholders (EAT after LPMS) 56,951 48,721
of which attributable to
Shareholders of Miba Aktiengesellschaft 54,938 47,787
Non-controlling interests 2,013 934
Weighted average number of shares issued 1,203,857 1,213,695
Earnings per share in EUR 45.64 39.37
Diluted earnings per share in EUR = basic earnings per share in EUR 45.64 39.37
Dividend proposed or paid per share in EUR 8.00 8.00
IFRS consolidated income statement for fiscal year 2014–2015
> Consolidated financial statements 2014–2015 > Consolidated statement of comprehensive income
87
in TEUR 2014–15 2013–14
Profit after tax and financing costs attributable to LP minority shareholders (EAT after LPMS) 56,951 48,721
Currency translation gains/losses 27,002 –143
Gains/losses on available-for-sale financial assets 35 0
Attributable deferred taxes –9 0
Share of other comprehensive income of equity-accounted companies 30 –698
Total other comprehensive income for items which may be reclassified subsequently to profit or loss 27,058 –841
Actuarial gains/losses –6,488 –1,480
Attributable deferred taxes 1,622 370
Total other comprehensive income for items which will not be reclassified subsequently to profit or loss –4,866 –1,110
Total comprehensive income 79,143 46,770
of which attributable to
Shareholders of Miba Aktiengesellschaft 75,619 45,844
Non-controlling interests 3,524 926
IFRS consolidated statement of comprehensive income for fiscal year 2014–2015
8988
> C
on
solid
ated
Fin
anci
al S
tate
men
ts A
cco
rdin
g t
o IF
RS
s
> Consolidated financial statements 2014–2015 > Consolidated statement of comprehensive income

88
in TEUR Note 1/31/2015 1/31/2014
Assets
Non-current assets
Intangible assets (11) 45,149 40,272
Property, plant and equipment (12) 265,707 235,117
Investments in associates (13) 3,155 9,438
Financial assets (14) 37,110 25,325
Deferred tax assets (15) 2,260 3,296
353,381 313,449
Current assets
Inventories (16) 93,084 78,236
Trade receivables (17) 97,107 84,311
Other assets (18) 23,712 21,848
Current financial assets (19) 36,451 22,724
Cash and cash equivalents (20) 138,132 119,523
388,486 326,642
Total assets 741,867 640,091
IFRS consolidated balance sheet as of January 31, 2015
> Consolidated financial statements 2014–2015 > Consolidated balance sheet
89
in TEUR Note 1/31/2015 1/31/2014
Equity and liabilities
Group equity
Share capital (21) 9,500 9,500
Capital reserves (21) 18,089 18,089
Treasury shares (21) –16,305 –14,221
Retained earnings (21) 397,836 332,596
Non-controlling interests (21) 12,856 3,606
421,975 349,569
Non-current liabilities
Termination benefit and pension provisions26 (22) 29,951 23,939
Deferred tax liabilities (15) 5,946 6,799
Other non-current provisions (25) 1,833 1,969
Financial liabilities26 (23) 112,428 107,785
Other non-current liabilities26 (24) 6,417 5,472
156,575 145,965
Current liabilities
Current provisions26 (25) 19,303 11,645
Tax provisions (25) 16,734 12,600
Trade payables26 (26) 61,250 64,388
Current financial liabilities26 (27) 19,313 15,307
Income tax liabilities (28) 0 694
Other current liabilities26 (29) 46,716 39,923
163,316 144,556
Total equity and liabilities 741,867 640,091
26 Prior-year comparatives have been adjusted. See C.8. “Change in the reporting of obligations to employees, financial and other obligations” in the
notes to the consolidated financial statements.
9190
> C
on
solid
ated
Fin
anci
al S
tate
men
ts A
cco
rdin
g t
o IF
RS
s
> Consolidated financial statements 2014–2015 > Consolidated balance sheet

9392
> C
on
solid
ated
Fin
anci
al S
tate
men
ts A
cco
rdin
g t
o IF
RS
s
> Consolidated financial statements 2014–2015 > Consolidated statement of changes in equity

92
in TEUR 2014–15 2013–14
1. Consolidated cash flow from operating activities
Profit before tax (EBT) 80,483 66,708
+ (–) Financial result 1,389 3,443
= Profit before interest and tax (EBIT) 81,871 70,151
+ (–) Depreciation, amortization and impairment losses 41,895 38,628
+ (–) Increase (decrease) in non-current provisions –1,889 –589
– (+) Gains (losses) from the disposal of non-current assets 1,850 657
= Consolidated cash flow from profit 123,726 108,847
– (+) Increase (decrease) in inventories –5,763 2,862
– (+) Increase (decrease) in trade receivables, group receivables and other assets –619 –9,414
+ (–) Increase (decrease) in trade payables, group liabilities and other liabilities27 6,489 19,478
+ (–) Increase (decrease) in current provisions27 –5,045 8
– (+) Currency translation and other non-cash changes 2,422 –821
+ Dividends from associates 967 1,119
+ Interest received 1,563 1,239
– Tax paid –16,739 –20,129
= Consolidated cash flow from operating activities 107,002 103,190
2. Consolidated cash flow from investing activities
– Investments in property, plant and equipment, and intangible assets –51,437 –61,883
– Investments in financial assets (excluding equity interests) –25,471 –4,721
– Acquisition of investments in associates 0 –1,477
– Acquisition of subsidiaries and contingent consideration from company acquisitions –3,951 –3,616
+ Proceeds from disposals of investments 714 1,146
= Consolidated cash flow from investing activities –80,145 –70,551
Consolidated cash flow statement for fiscal year 2014–2015
27 Prior-year comparatives have been adjusted. See C.8. “Change in the reporting of obligations to employees, financial and other obligations” in the
notes to the consolidated financial statements.
> Consolidated financial statements 2014–2015 > Consolidated cash flow statement
93
in TEUR 2014–15 2013–14
3. Consolidated cash flow from financing activities
– Group parent dividend –9,616 –9,727
– Dividends relating to non-controlling interests –131 –404
– Payments to limited partners relating to non-controlling interests 0 –1,785
+ Proceeds from loans and long-term borrowing 20,642 12,345
– Repayment of loans, long-term borrowing and finance lease liabilities –20,033 –23,852
– Purchase of treasury shares –2,084 –3,082
+ (–) Change in other financial liabilities 0 –27
– Interest paid –4,999 –4,719
– Increase in equity interests in subsidiaries –1,116 0
= Consolidated cash flow from financing activities –17,337 –31,251
+ (–) Consolidated cash flow from operating activities 107,002 103,190
+ (–) Consolidated cash flow from investing activities –80,145 –70,551
+ (–) Consolidated cash flow from financing activities –17,337 –31,251
= Change in cash and cash equivalents 9,521 1,388
+ (–) Change due to currency translation 8,149 125
+ (–) Change due to changes in the basis of consolidation 939 0
+ Opening balance of cash and cash equivalents 119,523 118,011
= Closing balance of cash and cash equivalents 138,132 119,523
9594
> C
on
solid
ated
Fin
anci
al S
tate
men
ts A
cco
rdin
g t
o IF
RS
s
> Consolidated financial statements 2014–2015 > Consolidated cash flow statement

94
A. General disclosures
1. Information on the Company
Miba Aktiengesellschaft (in short: “Miba AG” or “Company”) is an international group domiciled in Austria. The Group’s head office is located at Dr.-Mitterbauer-Strasse 3, 4663 Laakirchen, Austria. The Company is registered at the Wels regional and commercial court (Landes- als Handelsgericht Wels) under number FN 107386 x.
The Miba Group has a presence in Europe, America and Asia. Business activities focus on the following products:
Sintered components (Sinter)
Bearings (Bearing)
Friction materials (Friction)
Passive electronic components (New Technologies)
Coatings (Coating) and
Special machinery (Equipment Manufacturing)
The Company is a member of the consolidated group of Mitterbauer Beteiligungs-Aktiengesellschaft, Laakirchen, Austria, which prepares consolidated financial statements as the Group parent.
2. Basis of preparation of the financial statements
The accompanying consolidated financial statements of Miba AG for fiscal year 2014–2015 (February 1, 2014, to January 31, 2015) have been prepared in accordance with the International Financial Reporting Standards (IFRSs) and Interpretations issued by the International Financial Reporting Interpretations Committee (IFRIC), as adopted by the European Union (EU) and applicable at the reporting date, in compliance with section 245a of the Austrian Commercial Code (UGB) under the responsibility of the Management Board.
For clarity, all amounts are generally reported in thousands of euros (TEUR). Rounding differences may arise when adding rounded amounts and percentages due to the use of accounting software.
The reporting date for associates included in the consolidated financial statements is January 31 of each year, with two exceptions (reporting date of December 31 for one company and March 31 for one company) for which no interim financial statements were prepared. These variations arise from national legislation or articles of incorporation and are immaterial overall.
Notes to the consolidated financial statements of Miba Aktiengesellschaft, Laakirchen, for fiscal year 2014–2015
> Consolidated financial statements 2014–2015 > Notes to the consolidated financial statements
95
3. New accounting pronouncements
Standards and interpretations required to be applied for the first time in the consolidated financial
statements for the period ended January 31, 2015
The IASB (International Accounting Standards Board) and IFRIC (International Financial Reporting Interpretations Committee) published the following amendments to existing IFRSs as well as a few new IFRSs and IFRICs which have also already been adopted by the European Commission:
Applies to fiscal years beginning on
or after the date specified (according
to the IASB) Endorsed
by the EU?
Applies to fiscal years beginning on
or after the date specified (according to EU endorsement)
IFRS 10 Consolidated Financial Statements 1/1/2013 Yes 1/1/2014
IFRS 11 Joint Arrangements 1/1/2013 Yes 1/1/2014
IFRS 12 Disclosure of Interests in Other Entities 1/1/2013 Yes 1/1/2014
Amendments to IFRS 10, IFRS 11 and IFRS 12: transition provisions 1/1/2013 Yes 1/1/2014
Amendments to IFRS 10, IFRS 12 and IAS 27: Investment Entities 1/1/2014 Yes 1/1/2014
IAS 27 Separate Financial Statements 1/1/2013 Yes 1/1/2014
IAS 28 Investments in Associates and Joint Ventures 1/1/2013 Yes 1/1/2014
Amendments to IAS 32 Financial Instruments: Presentation – Offsetting Financial Assets and Financial Liabilities 1/1/2014 Yes 1/1/2014
Amendments to IAS 36: Impairment of Assets – Recoverable Amount Disclosures for Non-Financial Assets 1/1/2014 Yes 1/1/2014
Amendments to IAS 39 Financial Instruments: Recognition and Measurement – Novation of Derivatives and Continuation of Hedge Accounting 1/1/2014 Yes 1/1/2014
IFRS 10 replaces the consolidation requirements of IAS 27 “Consolidated and Separate Financial Statements” and SIC 12 “Consolidation – Special Purpose Entities” and creates a uniform definition of control. The Group companies were analyzed using the new definition of control. As a result, EDMS d.o.o., Šentjernej, Slovenia, was reclassified. In previous years, the Slovenian company had been included in the Miba Group using the equity method. It has been consolidated from February 1, 2014, onwards because Miba AG controls the relevant activities which have the greatest influence on returns despite having an interest of 49 percent.
9796
> C
on
solid
ated
Fin
anci
al S
tate
men
ts A
cco
rdin
g t
o IF
RS
s
> Consolidated financial statements 2014–2015 > Notes to the consolidated financial statements

96
Prior-year figures have not been adjusted as the inclusion in the consolidation is not material to the assets, liabilities, financial position and profit or loss of the Miba Group.
IFRS 11 replaces IAS 31 “Interests in Joint Ventures” and SIC 13 “Jointly Controlled Entities – Nonmonetary Contributions by Venturers” and contains requirements on the identification and classification of joint arrangements. For a joint operation, the share of the assets and liabilities as well as the share of income and expenses must be recognized. Joint ventures must be accounted for using the equity method. The joint operation at ABM Advanced Bearing Materials LLC, Greensburg, USA, which had previously been accounted for using the equity method, is from February 1, 2014, being recognized on the basis of the share of assets, liabilities, expenses and income because, based on the joint venture agreement, the parties have the right to all the economic benefits even though ABM is a legally separate entity. Due to the small size of the company, the reclassification also does not have a material effect on the consolidated financial statements of the Miba Group; prior-year figures have therefore not been adjusted.
The retrospective inclusion of EDMS d.o.o. and ABM LLC, after taking account of consolidation effects, would result in the following change in the consolidated balance sheet and consolidated income statement:
Change in consolidated balance sheet in TEUR Assets
Change in consolidated
financial statements:
Share of ABM LLC
1/31/2014
Change in consolidated
financial statements:
Consolidation of EDMS d.o.o.
1/31/2014
Change in consolidated
financial statements:
Total 1/31/2014
Financial assets –229 26 –203
Investments in associates 0 –430 –430
Inventories 2,208 71 2,279
Trade receivables and other assets 886 –35 851
Cash and cash equivalents 106 851 957
Equity and liabilities
Change in consolidated
financial statements:
Share of ABM LLC
1/31/2014
Change in consolidated
financial statements:
Consolidation of EDMS d.o.o.
1/31/2014
Change in consolidated
financial statements:
Total 1/31/2014
Non-controlling interests 0 556 556
Provisions 80 0 80
Trade payables and other liabilities 886 36 922
Interest-bearing liabilities 326 0 326
> Consolidated financial statements 2014–2015 > Notes to the consolidated financial statements
97
Change in income statement in TEUR Change in consolidated
financial statements:
Share of ABM LLC
1/31/2014
Change in consolidated
financial statements:
Consolidation of EDMS d.o.o.
1/31/2014
Change in consolidated
financial statements:
Total 1/31/2014
Revenue 4,764 –87 4,677
Changes in inventories of finished goods and work in progress 1,866 0 1,866
Other operating income 1,055 15 1,070
Cost of materials and other manufacturing services purchased –5,121 371 –4,751
Personnel expenses –1,458 –40 –1,498
Other operating expenses –965 –1 –966
Depreciation, amortization and impairment losses –115 –14 –129
Share of profits and losses of associates 0 –104 –104
Net interest income –26 13 –13
Income tax expense 0 –44 –44
Profit after tax (EAT) 0 109 109
Financing costs for LP minority shareholders 0 27 27
Non-controlling interests 0 109 109
9998
> C
on
solid
ated
Fin
anci
al S
tate
men
ts A
cco
rdin
g t
o IF
RS
s
> Consolidated financial statements 2014–2015 > Notes to the consolidated financial statements

98
The new IFRS 12 sets out the disclosures required for subsidiaries, joint arrangements, associates and unconsolidated structured entities in the consolidated financial statements. The disclosures are significantly more comprehensive compared to IAS 27, 28 and 31. The enhanced disclosures can be found in note B.2. “Basis of consolidation” and note (35) “Business relationships with related parties”.
The first-time application of the remaining standards listed either did not have any, or only had a subordinate effect on the consolidated financial statements of Miba AG for the year ended January 31, 2015.
Published standards and interpretations which are only required to be applied in later fiscal years
The new standards and interpretations listed in the following table have not been applied early.
> Consolidated financial statements 2014–2015 > Notes to the consolidated financial statements
99
IFRS 9 is intended to replace existing IAS 39 in stages and comprises requirements for the classification, recognition and measurement of financial instruments and provisions concerning general hedge accounting and additional note disclosures. IFRS 9 has not yet been adopted by the EU. The examination of the effects on the consolidated financial statements of Miba AG has not yet been completed.
IFRS 10, IFRS 12 and IAS 28: Investment Entities: These deal with the application of the consolidation exception for investment entities. The standard will not affect the consolidated financial statements of Miba AG.
The amendment to IFRS 10 and IAS 28 – Sale or Contribution of Assets between an Investor and its Associate or Joint Venture – clarifies that the extent of recognition of gains or losses depends on whether the assets sold or contributed constitute a business. The effects on the consolidated financial statements of Miba AG are currently being examined.
Applies to fiscal years beginning on
or after the date specified (according
to the IASB) Endorsed
by the EU?
Applies to fiscal years beginning on
or after the date specified (according to EU endorsement)
IFRS 9 Financial Instruments 1/1/2018 No
IFRS 10, IFRS 12 and IAS 28: Investment Entities – Applying the Consolidation Exception 1/1/2016 No
IFRS 10 and IAS 28: Sale or Contribution of Assets between an Investor and its Associate or Joint Venture 1/1/2016 No
IFRS 11 Accounting for Acquisitions of Interests in Joint Operations 1/1/2016 No
IFRS 14 Regulatory Deferral Accounts 1/1/2016 No
IFRS 15 Revenue from Contracts with Customers 1/1/2017 No
Annual Improvements to IFRSs 2010–2012 Cycle 7/1/2014 Yes 2/1/2015
Annual Improvements to IFRSs 2011–2013 Cycle 7/1/2014 Yes 1/1/2015
Annual Improvements to IFRSs 2012–2014 Cycle 1/1/2016 No
IAS 1 Disclosure Initiative 1/1/2016 No
IAS 16 and IAS 38: Clarification of Acceptable Methods of Depreciation and Amortization 1/1/2016 No
IAS 16 and IAS 41: Agriculture: Bearer Plants 1/1/2016 No
Amendments to IAS 19 Employee Benefits – Defined Benefit Plans: Employee Contributions 7/1/2014 Yes 2/1/2015
IAS 27 Equity Method in Separate Financial Statements 1/1/2016 No
IFRIC 21 Levies 1/1/2014 Yes 6/17/2014
101100
> C
on
solid
ated
Fin
anci
al S
tate
men
ts A
cco
rdin
g t
o IF
RS
s
> Consolidated financial statements 2014–2015 > Notes to the consolidated financial statements

100
IFRS 11 Accounting for Acquisitions of Interests in Joint Operations serves to clarify how to account for acquisitions of interests which constitute a business. The effects on the consolidated financial statements of Miba AG are currently being examined.
IFRS 14, which allows regulatory deferral accounts for first-time adopters of IFRSs, does not apply to Miba AG.
IFRS 15 replaces the current requirements on revenue recognition in IAS 11 and IAS 18 as well as the associated interpretations. IFRS 15 determines whether, in what amount and at what point in time revenue has to be recognized. In addition, the note disclosures are enhanced. The determination of the effects on the consolidated financial statements of Miba AG has not yet been completed.
IAS 1 Disclosure Initiative: In the first instance, this deals with clarifications concerning materiality, presentation in the income statement and in other comprehensive income, and disclosure requirements. The effects on the consolidated financial statements of Miba AG are currently being examined.
The amendments to IAS 16 and IAS 38 clarify which methods of depreciating property, plant and equipment and amortizing intangible assets are acceptable. The effects on the consolidated financial statements of Miba AG are currently being examined.
IAS 16 and IAS 41, Agriculture – Bearer Plants: These amendments clarify the scope of IAS 16. The standard does not affect the consolidated financial statements of Miba AG.
The amendments to IAS 19 (Employee Benefits – Defined Benefit Plans: Employee Contributions) clarify the attribution of contributions from employees or third parties. The effects on the consolidated financial statements of Miba AG are currently being examined.
IAS 27 allows future investments in subsidiaries, joint ventures and associates to be accounted for in IFRS separate financial statements using the equity method. The standard will not affect the consolidated financial statements of Miba AG.
IFRIC Interpretation 21 contains rules on the accounting for liabilities to pay statutory levies which are not levies within the meaning of IAS 12. The effects on the consolidated financial statements of Miba AG are still being examined.
The remaining amendments referred to above are currently either expected to have an immaterial effect or no effect on the consolidated financial statements of Miba AG.
> Consolidated financial statements 2014–2015 > Notes to the consolidated financial statements
101
B. Consolidation
1. Consolidation principles
According to IFRS 3, acquired subsidiaries are accounted for under the acquisition method. Under this method, the consideration – plus, if applicable, the fair value of shares already held and the amount of non-controlling interests – is compared to the subsidiary’s remeasured assets and liabilities. Consideration includes contingent consideration at the expected amount. Incidental acquisition costs are expensed. Any remaining excess of cost of acquisition over net assets acquired is capitalized as goodwill, tested for impairment annually and only written down if impaired. The excess of net assets acquired over cost of acquisition is recognized in profit or loss in the consolidated income statement in the year of acquisition after a further review of the amounts.
Non-controlling interests represent the share of profit or loss and net assets that is not attributable to Miba AG’s shareholders. Both in the income statement and in the statement of comprehensive income, the profit or loss attributable to these interests is presented separately from the profit or loss attributable to the shareholders of the parent company. In the balance sheet, non-controlling interests are reported as part of equity, but separate from equity that is attributable to the shareholders of the parent company.
Non-controlling interests in Austrian limited partnerships do not meet the IAS 32 conditions for being reported in equity (since limited partners have a statutory right to offer their shares to the general partner). These interests are recognized in other liabilities as “liabilities to affiliated companies” as these interests are held by higher-tier Group companies. The “financing expense” arising from the appropriation of profit to these limited partnership minority shareholders is reported separately.
Intragroup receivables and liabilities, income and expenses, and intercompany profits are eliminated during the preparation of the consolidated financial statements as part of the consolidation.
The necessary tax prepayments and accruals are applied to temporary differences arising from the consolidation.
Changes in the percentage of shares held which do not lead to a loss of control over the subsidiary are treated as equity transactions.
Associates, i.e., interests in which the Company can exercise a significant influence on financial and operating policies, but which it does not control, are accounted for under the equity method.
2. Basis of consolidation
Appendix 1 to the notes lists an overview of the companies that are included in the Miba AG Group and the consolidation method applied.
103102
> C
on
solid
ated
Fin
anci
al S
tate
men
ts A
cco
rdin
g t
o IF
RS
s
> Consolidated financial statements 2014–2015 > Notes to the consolidated financial statements

102
The basis of consolidation has been determined in accordance with the principles of IFRS 10, resulting in 15 (previous year: 16) Austrian and 22 (previous year: 19) foreign subsidiaries in which Miba AG directly or indirectly holds the majority of voting rights being consolidated (100 percent) in the consolidated Group.
Miba Energy Holding GmbH & Co KG and the companies held by Miba Energy Holding GmbH & Co KG in which the indirect share of capital is 49 percent or less are also controlled and consolidated, as Miba Energy Holding GmbH, the managing general partner, is a wholly owned subsidiary of Miba AG. Miba Energy Holding GmbH as the only partner has the right to manage Miba Energy Holding GmbH & Co KG. The Miba Group therefore controls Miba Energy Holding GmbH & Co KG and its subsidiaries via Miba Energy Holding GmbH, as it has the ability to influence fluctuating returns through its right of control.
Two (previous year: five) investments in associates have been accounted for under the equity method in Miba AG’s consolidated financial statements.
Furthermore, one (previous year: zero) company has been proportionately consolidated in Miba AG’s consolidated financial statements. Control over the net assets of ABM Advanced Bearing Materials LLC is limited to the extent that the second shareholder has tender rights if a transfer is desired.
The nine (previous year: four) unconsolidated subsidiaries and the two (previous year: three) associates that were not accounted for under the equity method are also not material in the aggregate.
Miba AG’s consolidated group includes a special fund (held-to-maturity fund) which is classified as a structured entity. Fund assets are controlled on the basis of comprehensive codetermination rights and therefore consolidated. The fund invests in corporate bonds and serves as a long-term investment vehicle. The significant risks are credit default risk and market risk. Miba AG does not intend to provide financial support or any other assistance to the fund.
Changes to the consolidated group in fiscal year 2014–2015
Consolidation of EDMS d.o.o. EDMS d.o.o., Šentjernej, Slovenia, has been consolidated since February 1, 2014. 49 percent of the shares of EDMS d.o.o. are owned by EBG Elektronische Bauelemente GmbH, Laakirchen, Austria. The company was previously accounted for using the equity method.
Proportionate consolidation of ABM Advanced Bearing Materials LLC Since February 1, 2014, ABM Advanced Bearing Materials LLC, Greensburg, Indiana, USA, has been proportionately consolidated in the consolidated financial statements of Miba AG because of the joint operation. 50 percent of the shares of ABM Advanced Bearing Materials LLC are owned by Miba Bearings US LLC, McConnelsville, Ohio, USA. The company was previously accounted for using the equity method.
Increase in shareholding in EBG LLC On March 28, 2014 (signing and settlement date), Miba Energy Holding LLC, McConnelsville, Ohio, USA (wholly owned subsidiary of Miba Energy Holding GmbH & Co KG, Laakirchen, Austria) acquired the remaining
> Consolidated financial statements 2014–2015 > Notes to the consolidated financial statements
103
30 percent of EBG LLC, Middletown, Pennsylvania, USA. Miba Energy Holding LLC already owned 70 percent of the shares. It was an acquisition which did not change the company’s status (increase in shareholding) and resulted in a year-on-year decline in non-controlling interests of TEUR 936. The difference of TEUR 203 resulting from the transaction was offset against retained earnings.
Acquisition of Miba Asia Holding Pte. Ltd. On March 28, 2014, Miba China Holding GmbH, Laakirchen, Austria, acquired 100 percent of newly formed Miba Asia Holding Pte. Ltd., Singapore, for a purchase price of one Singapore dollar.
Acquisition of Shenzhen Rui Xi Si Te Industry Co., Ltd./step acquisition of EBG Shenzhen Ltd. On March 28, 2014 (signing date), Miba Asia Holding Pte. Ltd., Singapore, (wholly owned subsidiary of Miba China Holding GmbH, Laakirchen, Austria) entered into an agreement to acquire 100 percent of the shares in Shenzhen Rui Xi Si Te Industry Co., Ltd., Shenzhen, China. Shenzhen Rui Xi Si Te Industry Co., Ltd. holds 30 percent of the shares in EBG Shenzhen Ltd.
Miba AG already holds 25 percent of the shares in EBG Shenzhen Ltd. via EBG LLC, Middletown, Pennsylvania, USA. With the 55 percent of the voting rights that are attributable to Miba AG in total, Miba AG now controls EBG Shenzhen Ltd. The step acquisition took place on July 31, 2014, with the change of control. The company was therefore consolidated from July 31, 2014.
EBG Shenzhen Ltd. was accounted for using the equity method until the date of acquisition.
EBG Shenzhen Ltd. produces high-power resistors which are used, for example, in the power electronics of frequency converters and in modern medical equipment.
Control of EBG Shenzhen Ltd. allows the Group to serve its international resistor customers using the local-to-local approach they have been looking for. This creates a clear competitive advantage over other market participants. Miba AG is now the only group which has a local production and engineering presence for high-performance thick film resistors in Europe, North America and Asia. Moreover, the acquisition of a majority holding in EBG Shenzhen Ltd. is expected to lead to cost reductions as a result of synergies in purchasing, sales and R&D.
Since control was gained on July 31, 2014, EBG Shenzhen Ltd. had contributed TEUR 4,433 to consolidated revenue and TEUR 1,803 to consolidated EAT. If the acquisition had taken place on February 1, 2014, EBG Shenzhen Ltd. would have contributed TEUR 9,462 to consolidated revenue and TEUR 4,355 to consolidated EAT.
105104
> C
on
solid
ated
Fin
anci
al S
tate
men
ts A
cco
rdin
g t
o IF
RS
s
> Consolidated financial statements 2014–2015 > Notes to the consolidated financial statements

104
The step acquisition was accounted for based on the following amounts:
in TEUR
Purchase price of additional acquisition (30 percent) = total consideration transferred 6,294
Fair value of shares already held by EBG LLC (25 percent) 3,540
Non-controlling interests at proportionate fair value of assets acquired (45 percent) 6,626
Total 16,460
Net assets of EBG Shenzhen Ltd. (100 percent) 14,724
Difference = Miba’s partial goodwill 1,736
The adjustment of the fair value of EBG LLC’s existing shareholding in EBG Shenzhen Ltd. – this company now has to be consolidated – resulted in a gain of TEUR 1,325, which is reported under share of profits and losses of associates in the consolidated income statement. TEUR 20 related to the negative foreign currency translation reserve which arose from accounting for EBG Shenzhen Ltd. under the equity method until July 31, 2014.
> Consolidated financial statements 2014–2015 > Notes to the consolidated financial statements
105
Identifiable net assets based on fair values determined as of the acquisition date comprised the following:
in TEUR
Non-current assets
Goodwill (partial goodwill) 1,736
Intangible assets 6,839
Property, plant and equipment 511
Deferred tax assets 72
9,158
Current assets
Inventories 2,012
Trade receivables 4,249
Other assets 748
Cash and cash equivalents 2,824
9,832
Non-current liabilities
Deferred tax liabilities 1,018
1,018
Current liabilities
Trade payables 958
Other current liabilities and provisions 554
1,512
Total identifiable net assets 16,460
of which: 55% of identifiable net assets before goodwill plus partial goodwill = Miba’s share 9,834
of which: 45% of identifiable net assets before goodwill = non-controlling interests 6,626
Miba AG uses the option under IFRS 3.19 to apply the partial goodwill method. The share of goodwill attributable to non-controlling interests (45 percent) is not accounted for.
The goodwill results from the opportunity to market the Chinese-produced “High Voltage Low Cost Line” globally and from the R&D expertise of the local employees. Goodwill is allocated in full to the EBG Shenzhen Ltd. cash-generating unit. The goodwill is not tax deductible.
The fair value of the land use right was determined based on an expert opinion. The land use right is being amortized over the term of the agreement.
Gross trade receivables assumed amounted to TEUR 4,300. Valuation allowances for expected bad debts were TEUR 51. Receivables of TEUR 143 were derecognized as uncollectable at the acquisition date.
107106
> C
on
solid
ated
Fin
anci
al S
tate
men
ts A
cco
rdin
g t
o IF
RS
s
> Consolidated financial statements 2014–2015 > Notes to the consolidated financial statements

106
Net cash flow from acquisitions was as follows:
in TEUR
Cash flow from operating activities
Transaction costs –35
Cash flow from investing activities
Acquisition price paid in cash –6,775
Cash-in-hand and current funds 2,824
Net cash flow from acquisitions –3,986
If, within one year of the acquisition date, new information comes to light about facts and circumstances which existed at the acquisition date and which would lead to the correction of the amounts shown, then the accounting for the company acquisition will be adjusted.
Formation of Miba Engineering Center India Pvt. Ltd. Miba Engineering Center India Pvt. Ltd., Pune, India, was formed on January 22, 2015. 99.99 percent of the shares are held by Miba Asia Holding Pte. Ltd., Singapore, and the remaining 0.01 percent of the shares by Miba Sinter Holding GmbH & Co KG, Laakirchen, Austria. The company is not yet being consolidated.
Formation of Miba Bearings Materials GmbH Miba Bearings Materials GmbH, Laakirchen, Austria, was formed on January 27, 2015. Miba Gleitlager GmbH, Laakirchen, Austria, holds 100 percent of the shares in Miba Bearings Materials GmbH. The company is not yet being consolidated.
Formation of Miba Bearings Austria GmbH Miba Bearings Austria GmbH, Laakirchen, Austria, was formed on January 30, 2015. Miba Gleitlager GmbH, Laakirchen, Austria, holds 100 percent of the shares in Miba Bearings Austria GmbH. The company is not yet being consolidated.
Changes in business combinations recognized in fiscal year 2011–2012
Final determination of contingent consideration from company acquisitions took place in the past fiscal year for the Hoerbiger Antriebstechnik friction lining business for off-road applications acquired in fiscal year 2011–2012. This adjustment had the following effect on the consolidated income statement and the consolidated balance sheet:
> Consolidated financial statements 2014–2015 > Notes to the consolidated financial statements
107
Adjustment recognized in profit or loss in fiscal year 2014–2015 in TEUR
IFRS consolidated income statement
Other operating expenses –2,475
IFRS consolidated balance sheet
Other current liabilities +2,475
3. Currency translation
Foreign financial statements are translated in accordance with IAS 21 using the functional currency concept. This is the respective national currency for all companies since the companies operate independently from a financial, economic and organizational perspective.
Assets and liabilities are therefore translated at the mid-market rate on the reporting date (closing rate). Income and expenses are translated at annual average exchange rates.
Foreign exchange differences arising from using the closing rate in the consolidated balance sheet and the average rate in the consolidated income statement are presented in other comprehensive income, as are translation differences arising from adjustments to equity compared to initial consolidation.
Movements in the foreign currencies used in the Group were as follows:
Currencies in EUR Exchange rate as of the
reporting date Annual average rate
1/31/2015 1/31/2014 2014–15 2013–14
Brazilian real (BRL) 3.0045 3.2926 3.1046 2.9154
British pound (GBP) 0.7511 0.8214 0.8011 0.8487
Indian rupee (INR) 70.2100 84.9200 80.0390 78.9772
Renminbi yuan (CNY) 7.0639 8.1923 8.1021 8.1618
Singapore dollar (SGD) 1.5292 1.7278 1.6674 1.6705
Czech koruna (CZK) 27.7970 27.5000 27.5699 26.1456
US dollar (USD) 1.1305 1.3516 1.3119 1.3309
109108
> C
on
solid
ated
Fin
anci
al S
tate
men
ts A
cco
rdin
g t
o IF
RS
s
> Consolidated financial statements 2014–2015 > Notes to the consolidated financial statements

108
C. Accounting policies
1. Non-current assets
Intangible assets are measured at cost less straight-line amortization (useful life of 3 to 15 years) in accordance with IAS 38. In accordance with IAS 38.54, research expenses are not capitalized. Own development expenses do not meet all the criteria listed in IAS 38.57 and are therefore not capitalized. In fiscal year 2014–2015, research and development costs amounting to EUR 27.9 million (previous year: EUR 26.7 million) were expensed.
For goodwill, an impairment test is performed in accordance with IAS 36. This test is performed at least once a year or if there are internal or external indicators of impairment.
Under IAS 16, property, plant and equipment is carried at cost less straight-line depreciation or at the lower recoverable amount. No borrowing costs were incurred for property, plant and equipment manufactured or acquired over a longer period of time.
Assets showing evidence of impairment are written down to the lower recoverable amount. If the reasons for the previously recognized impairment loss no longer apply, the impairment loss is reversed.
The production cost for internally generated plant and equipment includes a share of fixed and variable production overheads as well as costs that are directly attributable to the production units. These production overheads also include a share of the cost of occupational pensions and voluntary social benefits.
Straight-line depreciation is based mainly on the following useful lives:
Asset category Useful life (in years)
Buildings 10 to 40
Technical equipment 4 to 10
Other equipment, operating and office equipment 3 to 10
Leased property, plant and equipment for which substantially all risks and rewards incidental to the ownership of the asset are transferred to the lessee (finance lease) is capitalized at fair value or at the lower present value of minimum lease payments in accordance with IAS 17.
Assets covered by all other lease agreements are treated as operating leases and thus attributed to the lessor.
During the past fiscal year, investment subsidies amounting to TEUR 25 were recognized as liability items (previous year: TEUR 32). These are reversed in accordance with the useful life of the asset and relate exclusively to property, plant and equipment.
> Consolidated financial statements 2014–2015 > Notes to the consolidated financial statements
109
In fiscal year 2014–2015, expenditure-related government grants amounting to TEUR 5,181 (previous year: TEUR 5,047) for research and development and for measures to promote the labor market were received and recognized in profit or loss. These grants are recognized when there is sufficient assurance that the associated conditions will be met and the grants will be awarded.
Intangible assets and property, plant and equipment are tested at each reporting date in accordance with IAS 36 to see whether there are any indications of possible impairment, such as external or internal information indicating a potential loss of value. The carrying amount of an interest in an associate is tested for impairment if there are indications when applying IAS 39 that the interest might be impaired. Irrespective of whether there are any indications of potential impairment, intangible assets with indefinite useful lives and goodwill are tested annually for any need to recognize impairment losses.
If there are indications of potential impairment, the recoverable amount of the asset is determined. The recoverable amount is defined as the higher of fair value less costs of disposal and value in use.
If the carrying amount exceeds the value in use determined by the discounted cash flow calculation (DCF) based on the budgets approved by the Management Board and on the forecast medium-term planning, a corresponding impairment is recognized. For the impairment test, assets are combined at the lowest level for which separate cash flows can be identified. If cash flows are not separately identifiable for an asset, the impairment test is based on the cash-generating unit (CGU) to which the asset belongs. In the Miba AG Group, the legally independent company units each form a CGU.
If the recoverable amount does not cover the carrying amount, impairment losses are recognized in profit or loss in accordance with the requirements of IAS 36. An impairment loss in excess of the amount of goodwill is recognized in the CGU’s other assets.
When determining the present value in use of the investments in associates, the future cash flows expected to be generated by the associate, including the cash flows from the operations of the associate and also the proceeds from the ultimate disposal of the investment, are discounted.
The discount rate used in the DCF calculation equates to the interest rate after tax which reflects current market assessments of the time value of money and the specific risks of the assets per country in which a branch is located. This is calculated using the weighted average cost of capital for the company’s debt and equity, with reference to current market information (WACC). The country-specific WACC after tax is recalculated at least once a year.
To determine cash flows, a detailed annual budget for the following fiscal year is prepared and approved. The budget is projected forward for the subsequent two years. The cash flows for the period after the third year are extrapolated based on a constant annual growth rate which depends on the country in which the branch is located. Growth rates in this case equate to 50 percent of the average of the rates of inflation forecast by the IMF for 2015 and 2019.28
28 cf. International Monetary Fund (IMF), World Economic Outlook: Legacies, Clouds, Uncertainties, October 2014
111110
> C
on
solid
ated
Fin
anci
al S
tate
men
ts A
cco
rdin
g t
o IF
RS
s
> Consolidated financial statements 2014–2015 > Notes to the consolidated financial statements

110
The DCF calculations for fiscal year 2014–2015 were based on the cost of capital (WACC) after tax and growth rates listed in the following table.
Fiscal year 2014–15 in percent Weighted cost of capital
(WACC) after tax Perpetual bond growth
rate
Miba Europe
Austria 8.3 0.9
Miba Americas
USA 9.2 1.0
Brazil 14.9 2.6
Miba Asia
People’s Republic of China 10.3 1.4
In the previous year, the country-specific WACC after tax used ranged from 7.9 percent for Austria to 14.3 percent for Brazil. The annual growth rate in the previous year was a uniform 2.0 percent for all sites.
No impairment losses had to be recognized for goodwill as a result of the impairment tests performed during fiscal year 2014–2015 (previous year: TEUR 0). Even a possible change, after prudent judgment, in these key assumptions would not result in a requirement to recognize an impairment loss. For EBG Shenzhen Ltd., whose initial consolidation took place in fiscal year 2014–2015, even assuming a 10 percent reduction in its budget and medium-term planning, all other assumptions remaining constant, would not require the recognition of an impairment loss for goodwill. Assuming an increase in the country-specific WACC by 1 percentage point, all other assumptions remaining constant, would also not require the recognition of an impairment loss.
As a result of impairment tests conducted in fiscal year 2014–2015, impairment losses of TEUR 897 (previous year: TEUR 0) had to be recognized for property, plant and equipment, and for associates, an impairment loss of TEUR 1,722 (previous year: TEUR 0) had to be recognized for an investment in an associate.
Non-current financial assets mainly include securities classified as non-current assets. For accounting policies relating to financial assets, please refer to 5. Financial assets and liabilities.
Deferred tax is determined in accordance with the balance sheet liability method for all temporary differences between the IFRS balance sheet and the tax accounts. In addition, tax benefits from existing loss carryforwards whose realization is probable are included in the calculation. Deferred tax is not taken into account for differences from non-tax deductible goodwill and temporary differences associated with investments insofar as these will not reverse in the foreseeable future. Deferred tax assets are recognized if it is probable that the underlying tax benefit can be realized. Deferred tax assets relating to tax loss carryforwards are recognized to the extent that it is probable that there will be taxable income in the foreseeable future.
Deferred tax is calculated at the tax rates which apply in individual countries at the reporting date or which have already been determined for the date when the deferred tax assets and liabilities will be realized.
> Consolidated financial statements 2014–2015 > Notes to the consolidated financial statements
111
2. Current assets
Inventories are measured at the lower of cost and net realizable value as of the reporting date. Deductions are generally taken into account if the potential for realization is limited. The cost formula being used is the moving weighted average cost formula.
Production costs include all direct expenses as well as a share of variable and fixed production overheads, which also include a share of the cost of occupational pensions and voluntary social benefits. Borrowing costs are not capitalized as the IAS 23 conditions are not met.
Current assets also include trade receivables, current financial assets and other assets. For accounting policies relating to financial assets, please refer to 5. Financial assets and liabilities.
Tax receivables are offset against tax liabilities if they involve the same tax authority and there is a right and an intention to offset.
3. Employee benefits
Austrian Group companies recognize appropriate provisions for future termination benefit obligations since there is a statutory obligation for employers to pay employees a one-off termination benefit on termination of employment by the employer or on retirement. The amount of the termination benefit depends on the length of employment and the relevant remuneration when the termination benefit is triggered.
A defined contribution system is used for employees with Austrian contracts of employment whose employment commenced after January 1, 2003. A legally prescribed amount equating to 1.53 percent of gross remuneration must be paid to a Mitarbeitervorsorgekasse (Austrian occupational pension fund); this is recognized in personnel expenses.
Provisions for termination benefits and jubilee benefits for employees with an Austrian employment contract are determined in accordance with the projected unit credit method as of the reporting date based on actuarial assumptions, using a discount rate of 1.70 percent p.a. (previous year: 3.50 percent) and including a wage and salary increase rate of 2.40 percent p.a. for salaried employees (previous year: 2.80 percent) and 2.40 percent p.a. for wage earners (previous year: 2.80 percent). Taking transitional regulations into account, the earliest possible date of entitlement to a retirement pension was taken as a basis for the assumed retirement age. A company-specific deduction for staff turnover was applied.
The Rechnungsgrundlagen für die Pensionsversicherung AVÖ–P08 ANG (AVÖ–P08 ANG calculation principles for pension insurance) were used to calculate provisions.
113112
> C
on
solid
ated
Fin
anci
al S
tate
men
ts A
cco
rdin
g t
o IF
RS
s
> Consolidated financial statements 2014–2015 > Notes to the consolidated financial statements

112
Pension provisions must be established for Austrian Group companies and are calculated in accordance with recognized actuarial principles using the projected unit credit method based on a discount rate of 1.70 percent p.a. (previous year: 3.50 percent).
The Rechnungsgrundlagen für die Pensionsversicherung AVÖ–P08 ANG (AVÖ–P08 ANG calculation principles for pension insurance) were used to calculate provisions.
Actuarial gains or losses arising from changes in actuarial parameters (demographic, financial and experience assumptions) are recognized in other comprehensive income in the year in which they arise.
Defined contribution pension benefits are granted by seven Austrian and six foreign subsidiaries, whereby the employer pays contributions to external funds. The contributions to the funds are a current period expense.
In addition, long-term oriented remuneration components were agreed for members of the Management Board. This entitles the holder to a cash settlement after three years. The amount paid out depends on the change in group equity as of each reporting date. Obligations from entitlements which have not yet been paid out are accounted for under other non-current personnel provisions.
4. Provisions
Provisions are reported under other current or non-current liabilities and comprise all legal or constructive obligations to third parties resulting from past events that are identifiable up to the preparation of the financial statements, insofar as they will in future lead to a probable outflow of funds and can be established reliably. The amount recognized is established on the basis of the best possible estimate.
5. Financial assets and liabilities
Under IAS 39, financial assets are either classified on initial recognition as loans and receivables, available for sale, held to maturity or financial assets at fair value through profit or loss, with the latter also being subdivided into held for trading and fair value option.
In the Miba Group, the loans and receivables category comprises trade receivables, loans, current financial assets, other financial assets and cash and cash equivalents. Financial instruments classified as loans and receivables are recognized at amortized cost, using the effective interest method if applicable. If there are doubts concerning collectability, receivables are recognized at the lower realizable amount. The conclusion of insolvency proceedings results in the derecognition of the respective receivable. Valuation allowances are applied by using allowance accounts.
Investments in unconsolidated companies and other equity investments are generally classified as available for sale. As there are no active markets for these equity instruments and there are significant margins of
> Consolidated financial statements 2014–2015 > Notes to the consolidated financial statements
113
fluctuation for possible fair values, they are reported at cost. In addition, debt instruments (securities) are allocated to the available for sale category. Fluctuations in the value of financial assets that are classified as available for sale are, if material, presented in other comprehensive income, taking account of deferred tax. Recycling to profit or loss for the period of the amounts recognized in other comprehensive income only takes place on the date of disposal or in the event of a material or permanent impairment of the corresponding financial assets.
Securities categorized as held to maturity are measured at amortized cost, taking account of impairments if relevant.
In the Miba Group, debt instruments (securities) are allocated to the financial assets at fair value through profit or loss (held for trading) category. In addition, there are debt instruments (securities) which are classified on initial recognition as financial assets at fair value through profit or loss (fair value option) if the IAS 39 criteria are met. These comprise securities which are managed and reported on the basis of fair value while complying with a documented risk management strategy. They are accounted for at fair value at the date of acquisition and in subsequent periods. Changes in value, if material, are recognized in the income statement. Among other things, positive fair values of derivative financial instruments classified as held for trading and for which the Miba Group does not use hedge accounting are also reported under other assets.
Trade payables and financial liabilities are recognized at amortized cost, if applicable using the effective interest method, and classified as financial liabilities at amortized cost. Liabilities under finance leases are generally recognized as a liability at the present value of future lease payments. Among other things, negative fair values of derivative financial instruments classified as financial liabilities at fair value through profit or loss (held for trading) and for which the Miba Group does not use hedge accounting are also reported under current provisions.
If a derivative financial instrument forms part of an effective hedging relationship in accordance with IAS 39, the IAS 39 hedge accounting provisions are applied. The effective portion of the change in value of the hedging instrument is recognized in other comprehensive income (hedging provision) until the gain or loss from the hedged item is recognized; the ineffective portion of the change in value of the hedging instrument is recognized in profit or loss. Reversal to profit or loss takes place when the hedged item is realized. The Miba Group does not currently use hedge accounting.
Fair values of financial assets and liabilities generally equate to market prices on the reporting date. If prices in active markets are not directly available, fair values are – if they are not immaterial – calculated using recognized actuarial valuation techniques and actual market parameters (especially interest rates, exchange rates and credit ratings of counterparties). Financial instrument cash flows are discounted to the reporting date.
Fair values of financial assets and liabilities are classified into levels 1 to 3 depending on how observable the inputs used to determine fair value are or how material they are to the measurement (for details see note (32) Financial instruments, financial risk management and capital management). Financial assets and liabilities
115114
> C
on
solid
ated
Fin
anci
al S
tate
men
ts A
cco
rdin
g t
o IF
RS
s
> Consolidated financial statements 2014–2015 > Notes to the consolidated financial statements

114
recognized at fair value have not been transferred between levels of the fair value hierarchy. Transfers between the levels are applied at the end of the reporting period in which a change has taken place.
Recognition of all financial assets and liabilities takes place on the respective settlement date. Financial assets and liabilities are derecognized when rights to payments from the investment have terminated or been transferred and the Miba Group has substantially transferred all risks and rewards associated with ownership.
6. Revenue recognition
Revenue from the sale of goods and merchandise is recognized at the time when the risks and rewards are transferred to the buyer.
Income from long-term construction contracts is accounted for based on the stage of completion in accordance with IAS 11.
The percentage of completion is determined by the ratio of contract costs incurred up to the reporting date to estimated total contract costs.
Interest income is recognized on a time proportion basis using the effective interest method. Dividend income is reported when the right to receive payment is established.
7. Management judgments and estimation uncertainties
Preparation of the consolidated financial statements requires certain estimates and assumptions that affect the reported assets and liabilities, the disclosure of other obligations as of the reporting date and the reporting of income and expenses during the reporting period. Actual amounts arising in the future may differ from these estimates. The true and fair view principle has also been complied with in full when using estimates.
Furthermore, the preparation of the consolidated financial statements requires the assessment of future developments. The assumptions and estimates are based on underlying assumptions that reflect the state of knowledge available at the time when the annual financial statements or the consolidated financial statements are prepared. Actual amounts recognized at a later date may deviate from original estimates due to developments that are unforeseen and outside of management’s influence. In this case, the underlying assumptions and, if necessary, the carrying amounts of the assets and liabilities affected are adjusted accordingly. A change is recognized in the period of the change and in future periods, provided the change affects both the reporting period and future periods.
The Miba Group’s most important assumptions concerning the future as well as the other main sources of estimation uncertainties as of the reporting date are listed below.
> Consolidated financial statements 2014–2015 > Notes to the consolidated financial statements
115
Assumptions about future cash surpluses and the discount rate when determining recoverable amounts as part of the impairment tests of intangible assets, goodwill and property, plant and equipment (note C.1.).
Assumptions about interest rates and future salary and pension increases for the measurement of existing social capital obligations (note C.3.).
Assumptions about the level and probability of future events in relation to the recognition of other provisions based on past experience or external opinions (note C.4).
Assumptions about credit risk such as, for example, customer credit ratings or maturity structure, on the basis of which valuation allowances for doubtful debts are established. As of January 31, 2015, valuation allowances for trade receivables and long-term construction contracts amounted to TEUR 2,731 (previous year: TEUR 2,537) (note (17)).
The recognition of deferred tax assets is based on assumptions about the generation of future taxable income being sufficient to utilize existing loss carryforwards (note (15)).
8. Change in the reporting of obligations to employees, financial and other obligations
In the current fiscal year, provisions are being reclassified retrospectively as liabilities and liabilities under finance leases are being reclassified in accordance with IAS 1. The details are listed in the following tables.
In the previous year, the accrued expense of a contribution payable to the defined contribution Vorsorgekasse (Austrian pension fund) was reported under pension provisions. In future, this accrued expense will be presented under other current liabilities.
1/31/2014
in TEUR Reclassifi-
cation
Reclassification of pension obligations
Pension provisions –259
Other current liabilities 259
In the previous consolidated financial statements, accrued expenses for vacations, time off in lieu as well as vacation and Christmas pay were reported under other personnel provisions. Other accrued expenses were also allocated to provisions. In view of the relatively low estimation uncertainty, such accrued expenses will in future be reported under liabilities.
117116
> C
on
solid
ated
Fin
anci
al S
tate
men
ts A
cco
rdin
g t
o IF
RS
s
> Consolidated financial statements 2014–2015 > Notes to the consolidated financial statements

116
1/31/2014
in TEUR Reclassifi-
cation
Reclassification of other obligations and obligations to employees
Other provisions –776
Other personnel provisions –11,285
Trade payables 462
Other current liabilities 11,598
Previously, liabilities under finance leases were reported in other non-current or current liabilities with the addendum “financial liabilities”. In the present financial statements, liabilities under finance leases have been reclassified from other non-current liabilities to financial liabilities and from other current liabilities to current financial liabilities.
1/31/2014
in TEUR Reclassifi-
cation
Reclassification of financial liabilities
Financial liabilities 7,697
Other non-current liabilities –7,697
Current financial liabilities 1,205
Other current liabilities –1,205
Changes in the reporting of individual balance sheet items are summarized in the following table. The comparative period has been adjusted retroactively. Group equity, consolidated profit for the year, earnings per share and total assets are not affected.
1/31/2014
in TEUR
Reported in previous
year Reclassifi-
cation
Previous year
adjusted
Pension provisions 2,218 –259 1,958
Other provisions 6,641 –776 5,865
Other personnel provisions 17,065 –11,285 5,780
Trade payables 63,925 462 64,388
Financial liabilities 100,088 7,697 107,785
Other non-current liabilities 13,170 –7,697 5,472
Current financial liabilities 14,102 1,205 15,307
Other current liabilities 29,271 10,652 39,923
> Consolidated financial statements 2014–2015 > Notes to the consolidated financial statements
117
D. Consolidated income statement and consolidated balance sheet disclosures
The consolidated income statement is presented using the total cost (nature of expense) method.
(1) Revenue
Revenue for fiscal year 2014–2015 includes income from long-term construction contracts of TEUR 4,990 (previous year: TEUR 2,835).
For a breakdown of revenue by country please refer to segment reporting.
(2) Other operating income
in TEUR 2014–15 2013–14
Government grants 5,181 5,047
Unrealized exchange rate gains 7,302 967
Income from the disposal of and reversal of impairment losses to non-current assets excluding financial assets 136 233
Income from the reversal of provisions 1,004 2,229
Realized exchange rate gains 1,367 809
Other income 11,834 7,459
Total 26,824 16,745
(3) Cost of materials and other manufacturing services purchased
in TEUR 2014–15 2013–14
Cost of materials 199,345 193,557
Cost of other manufacturing services purchased 70,811 64,731
Total 270,156 258,288
119118
> C
on
solid
ated
Fin
anci
al S
tate
men
ts A
cco
rdin
g t
o IF
RS
s
> Consolidated financial statements 2014–2015 > Notes to the consolidated financial statements

118
(4) Personnel expenses
in TEUR 2014–15 2013–14
Wages 89,509 81,581
Salaries 67,860 61,060
Termination benefit expenses and contributions to betriebliche Mitarbeitervorsorgekassen (Austrian occupational pension funds) 2,072 2,119
Direct retirement contributions 2,286 1,567
Social security contributions required by law as well as remuneration-dependent levies and mandatory contributions 36,512 33,673
Other social welfare expenses 5,556 5,333
Total 203,794 185,334
In the past fiscal year, contributions amounting to TEUR 959 (previous year: TEUR 831) were paid to the Mitarbeitervorsorgekasse (Austrian occupational pension fund).
Defined contribution pension benefit expenses recognized in the income statement were TEUR 1,770 (previous year: TEUR 1,306).
> Consolidated financial statements 2014–2015 > Notes to the consolidated financial statements
119
(5) Other operating expenses
in TEUR 2014–15 2013–14
Taxes not included under income tax expenses 1,291 853
Temporary staff 10,164 10,341
Repairs, maintenance and maintenance contracts 18,766 15,085
Freight and warehousing 9,078 8,534
Advisory services 9,400 8,873
Rent and leasing 7,808 6,602
Travel costs 5,259 4,159
Commissions 1,664 2,152
Insurance 2,467 2,900
Realized exchange rate losses 901 1,433
Unrealized exchange rate losses 302 329
Office costs, postage and telephone 1,687 1,419
Training courses 1,666 1,502
Liability charges and commissions 472 530
Subscriptions 484 331
Advertising and corporate hospitality expenses 1,888 1,339
Contingent consideration from company acquisitions 2,495 0
Other 27,181 17,956
Total 102,975 84,338
Audit fees for the Group auditor for the fiscal year totaled TEUR 238 (previous year: TEUR 223), of which TEUR 180 (previous year: TEUR 201) related to the audit of the consolidated financial statements (including the single-entity financial statements of individual affiliated companies), TEUR 37 (previous year: TEUR 17) to other assurance services and TEUR 21 (previous year: TEUR 6) to other advisory services.
121120
> C
on
solid
ated
Fin
anci
al S
tate
men
ts A
cco
rdin
g t
o IF
RS
s
> Consolidated financial statements 2014–2015 > Notes to the consolidated financial statements

120
(6) Depreciation, amortization and impairment losses
Depreciation and amortization
in TEUR 2014–15 2013–14
Intangible assets 6,909 6,501
Property, plant and equipment 34,089 32,127
Total 40,998 38,628
Impairment losses
A change in the future use of land and buildings in Miba AG’s property, plant and equipment led to an indication of an impairment under IAS 36.8. The write-down to the recoverable amount resulted in an impairment loss of TEUR 897. The impairment loss is attributable to the Miba Shared Services segment.
(7) Share of profits and losses of associates
in TEUR 2014–15 2013–14
Share of profits and losses 666 1,049
Fair value measurement of EBG Shenzhen Ltd. 1,325 0
Currency translation 30 0
Impairment losses –1,722 0
Total 299 1,049
As a result of the impairment tests performed in fiscal year 2014–2015, an impairment loss of TEUR 1,722 was recognized on the equity-accounted investment in Mahle Metal Leve Miba Sinterizados Ltda.
> Consolidated financial statements 2014–2015 > Notes to the consolidated financial statements
121
(8) Net interest income
in TEUR 2014–15 2013–14
Other interest and similar income 894 1,008
Income from other securities 673 398
Interest and similar expenses –5,005 –4,781
of which from affiliated companies 0 –102
Interest on social capital –993 –1,130
Total –4,430 –4,504
of which from affiliated companies 0 –102
(9) Other financial result
in TEUR 2014–15 2013–14
Income from the disposal of financial assets 0 12
Unrealized exchange rate differences in financial result 2,481 0
Income from the reversal of impairment losses on financial assets 262 0
Total 2,743 12
(10) Income taxes
in TEUR 2014–15 2013–14
Current year 19,645 14,142
Adjustment to provision for foreign losses 0 –333
Adjustment for prior periods 303 617
Current tax expense 19,948 14,427
Origination or reversal of temporary differences 1,612 1,475
Change in tax rates 0 161
Change in tax loss carryforwards recognized –1,702 939
Change due to the write-down, or the reversal of an earlier write-down, of a deferred tax asset 0 –413
Movement in deferred tax balance –90 2,161
Total 19,858 16,589
123122
> C
on
solid
ated
Fin
anci
al S
tate
men
ts A
cco
rdin
g t
o IF
RS
s
> Consolidated financial statements 2014–2015 > Notes to the consolidated financial statements

122
The difference between the calculated income tax expense (profit before tax multiplied by the national tax rate of 25 percent) and the income tax expense for fiscal year 2014–2015 as reported in the consolidated income statement is explained as follows:
in TEUR 2014–15 2013–14
Profit before tax 80,483 66,708
of which 25% (previous year: 25%) calculated income tax expense 20,121 16,677
Effect from foreign tax rates 46 136
Change in tax rates 0 161
Tax effects from loss carryforwards 228 –279
Tax credits or additional charges from prior periods 303 151
Tax incentives and tax-exempt income –1,755 –1,257
Non-tax deductible expenses 757 513
Tax effects from consolidation 362 –236
Other items –204 724
Income tax expense for period 19,858 16,589
Group tax rate in % 24.67 24.87
(11) Intangible assets
in TEUR Patents and
licenses
Customer relation-
ships
Other rights Goodwill Total
Cost 29,882 51,672 0 7,031 88,586
Accumulated amortization and impairment losses –16,996 –25,598
0 –254 –42,848
Carrying amount 1/31/2013 12,886 26,075 0 6,777 45,738
Cost 30,993 51,126 0 7,048 89,168
Accumulated amortization and impairment losses –18,926 –29,715
0 –255 –48,895
Carrying amount 1/31/2014 12,067 21,412 0 6,793 40,272
Cost 29,192 56,317 7,940 10,395 103,844
Accumulated amortization and impairment losses –20,024 –38,177
–190 –304 –58,695
Carrying amount 1/31/2015 9,168 18,140 7,750 10,091 45,149
> Consolidated financial statements 2014–2015 > Notes to the consolidated financial statements
123
Changes in the carrying amounts of intangible assets were as follows:
in TEUR Patents and
licenses
Customer relation-
ships
Other rights Goodwill Total
Carrying amount 1/31/2013 12,886 26,075 0 6,777 45,738
Additions 1,307 0 0 0 1,307
Reclassifications 32 0 0 0 32
Amortization and impairment losses –2,258 –4,243
0 0 –6,501
Foreign currency difference 100 –419 0 16 –303
Carrying amount 1/31/2014 = carrying amount 2/1/2014 12,067 21,412 0 6,793 40,272
Changes in consolidated group 90 0 7,940 1,736 9,766
Additions 1,028 0 0 0 1,028
Disposals –2,066 0 0 0 –2,066
Reclassifications 21 0 0 0 21
Amortization and impairment losses –2,483 –4,257
–165 0 –6,905
Foreign currency difference 511 986 –24 1,561 3,034
Carrying amount 1/31/2015 9,168 18,140 7,750 10,091 45,149
Patents and licenses, customer relationships, technologies and other rights
Intangible assets mainly include customer relationships and technologies. Additions in fiscal year 2014–2015 related to patents and licenses as well as the addition of the land use right from the initial consolidation of EBG Shenzhen Ltd. The land use right is being amortized in accordance with the contractual useful life over a period of 20 years.
Goodwill
As of January 31, 2015, total goodwill amounted to TEUR 10,091 (previous year: TEUR 6,793), of which the following amounts were attributable to the respective cash-generating units (CGU):
125124
> C
on
solid
ated
Fin
anci
al S
tate
men
ts A
cco
rdin
g t
o IF
RS
s
> Consolidated financial statements 2014–2015 > Notes to the consolidated financial statements

124
in TEUR 1/31/2015 1/31/2014
Miba Bearings US LLC/Americas 7,649 6,398
EBG Shenzhen Ltd./Asia 2,030 0
Miba Frictec GmbH/Europe 316 316
EBG Resistors LLC/Americas 89 74
EBG LLC/Americas 6 5
Total 10,091 6,793
For goodwill, an impairment test is performed in accordance with IAS 36. This test is performed at least once a year or if there are internal or external indicators of impairment.
To determine whether an impairment loss needs to be recognized, the goodwill is allocated to those cash-generating units (CGU) which will benefit in future from the expected synergy potential of the business combination. In the Miba AG Group, the legally independent company units each form a CGU.
Additions in fiscal year 2014–2015 relate to EBG Shenzhen Ltd. The goodwill results from the opportunity to market the Chinese-produced “High Voltage Low Cost Line” globally and from the R&D expertise of the local employees. Goodwill is allocated in full to the EBG Shenzhen Ltd. cash-generating unit. The goodwill is not tax deductible.
(12) Property, plant and equipment
in TEUR Land and buildings
Technical equipment
Other equipment,
operating and office
equipment
Advance payments
and assets under
construction Total
Cost 84,094 349,508 33,528 19,677 486,806
Accumulated depreciation and impairment losses –38,037 –224,057 –23,723 –275 –286,092
Carrying amount 1/31/2013 46,056 125,450 9,805 19,402 200,714
Cost 92,163 371,178 37,262 41,882 542,485
Accumulated depreciation and impairment losses –41,012 –241,075 –25,216 –65 –307,368
Carrying amount 1/31/2014 51,151 130,103 12,046 41,817 235,117
Cost 119,388 428,465 42,269 26,381 616,503
Accumulated depreciation and impairment losses –47,200 –275,244 –28,319 –33 –350,796
Carrying amount 1/31/2015 72,188 153,221 13,949 26,348 265,707
> Consolidated financial statements 2014–2015 > Notes to the consolidated financial statements
125
Changes in the carrying amounts of property, plant and equipment were as follows:
in TEUR Land and buildings
Technical equipment
Other equipment,
operating and office
equipment
Advance payments
and assets under
construction Total
Carrying amount 1/31/2013 46,056 125,450 9,805 19,402 200,714
Additions 5,046 18,624 4,424 38,703 66,797
Disposals –5 –629 –84 –218 –936
Reclassifications 2,946 12,493 598 –16,068 –32
Depreciation and impairment losses –3,015 –26,345 –2,702 –65 –32,127
Foreign currency difference 123 509 5 63 700
Carrying amount 1/31/2014 = carrying amount 2/1/2014 51,151 130,103 12,046 41,817 235,117
Changes in consolidated group 207 2,004 350 259 2,820
Additions 8,658 25,621 3,909 14,229 52,417
Disposals –9 –237 –85 –1,613 –1,944
Reclassifications 14,831 16,789 724 –32,365 –21
Depreciation and impairment losses –4,325 –27,650 –3,015 0 –34,990
Foreign currency difference 1,674 6,591 20 4,022 12,307
Carrying amount 1/31/2015 72,188 153,221 13,949 26,348 265,707
127126
> C
on
solid
ated
Fin
anci
al S
tate
men
ts A
cco
rdin
g t
o IF
RS
s
> Consolidated financial statements 2014–2015 > Notes to the consolidated financial statements

126
Finance leases
The carrying amounts of property, plant and equipment that are subject to finance leases are as follows:
in TEUR Land and buildings
Technical equipment
Other equipment,
operating and office
equipment Total
Cost 12,878 0 0 12,878
Accumulated depreciation and impairment losses –3,663 0 0 –3,663
Carrying amount 1/31/2013 9,215 0 0 9,215
Cost 14,465 332 1,069 15,866
Accumulated depreciation and impairment losses –4,324 –3 –36 –4,362
Carrying amount 1/31/2014 10,141 329 1,034 11,504
Cost 21,082 0 1,069 22,151
Accumulated depreciation and impairment losses –5,152 0 –77 –5,229
Carrying amount 1/31/2015 15,930 0 992 16,922
The finance lease for land and buildings that already existed in previous years mainly relates to a property lease for a building that is being used for operational purposes – with the option to purchase the property at the end of the twelve-year term. The current remaining term of this lease is four years. The lease is based on an interest rate of 2.73 percent p.a.
The significant additions in the fiscal year were attributable to property leases for Miba Sinter USA LLC for a building that is being used for operational purposes. There is an option to purchase the property at the end of the term. These leases have remaining terms of between 15 and 29 years and are based on interest rates of between 1.00 and 3.00 percent p.a.
> Consolidated financial statements 2014–2015 > Notes to the consolidated financial statements
127
Finance lease obligations as of January 31, 2015, and January 31, 2014, were as follows:
Minimum lease payments Present value of minimum
lease payments
in TEUR 1/31/2015 1/31/2014 1/31/2015 1/31/2014
Remaining term of less than 1 year 1,806 1,467 1,470 1,205
Remaining term of 1 to 5 years 7,355 5,257 6,384 4,503
Remaining term of more than 5 years 7,221 3,847 6,229 3,195
16,382 10,572 14,083 8,902
Less:
Future financing cost –2,299 –1,669 0 0
Present value of minimum lease payments 14,083 8,902 14,083 8,902
of which accounted for as liabilities under
current lease liabilities 1,470 1,205
non-current lease liabilities 12,613 7,697
Operating leases
In addition to finance leases, there are operating lease commitments for property, plant and equipment which are not reported in the balance sheet.
Use of this property, plant and equipment which is not reported in the balance sheet resulted in expenses of TEUR 6,944 in the past fiscal year (previous year: TEUR 6,052).
Leasing and rental commitments in the coming years for buildings and machinery are as follows:
in TEUR 1/31/2015 1/31/2014
Term of up to 1 year 5,987 5,777
Term of between 1 and 5 years 13,356 13,738
Term of more than 5 years 12,607 14,148
Commitments to acquire items of property, plant and equipment amounted to TEUR 19,239 as of January 31, 2015 (previous year: TEUR 6,617).
Property, plant and equipment amounting to TEUR 84,977 (previous year: TEUR 32,417) was pledged as collateral for liabilities. There are no restrictions on right of use.
129128
> C
on
solid
ated
Fin
anci
al S
tate
men
ts A
cco
rdin
g t
o IF
RS
s
> Consolidated financial statements 2014–2015 > Notes to the consolidated financial statements

128
(13) Investments in associates
Changes in equity-accounted investments were as follows:
in TEUR 2014–15 2013–14
Balance 2/1 9,438 8,740
Additions 0 1,477
Disposal due to EBG Shenzhen Ltd. step acquisition –3,540 0
Disposal due to full consolidation of EDMS d.o.o. –430 0
Disposal due to proportionate consolidation of ABM Advanced Bearing Materials LLC –1,679 0
Mahle Metal Leve Miba Sinterizados Ltda. impairment loss –1,722 0
Share of profits and losses of EBG Shenzhen Ltd. 679 1,049
Fair value measurement of EBG Shenzhen Ltd. 1,325 0
Currency translation (EBG Shenzhen Ltd. step acquisition) 186 0
Currency translation (outside profit or loss) 30 –698
Currency translation (through profit or loss) –9 –9
Dividend –1,122 –1,119
Balance 1/31 3,155 9,438
In fiscal year 2014–2015, Mahle Metal Leve Miba Sinterizados Ltda., São Paulo, Brazil, and Sintercom India Pvt. Ltd., Pune, India, were recognized using the equity method. EBG Shenzhen Ltd., Shenzhen, China, was accounted for using the equity method until July 31, 2014. Details about the subsequent step acquisition of EBG Shenzhen Ltd. are contained in the notes under B.2. Basis of consolidation.
Mahle Metal Leve Miba Sinterizados Ltda. is a strategic partner in the production, sale, import and export of sintered components and other metal commodities and the provision of services. The company’s principal place of business is São Paulo, Brazil. Control over the net assets of Mahle Metal Leve Miba Sinterizados Ltda is limited to the extent that a share transfer can only take place with the agreement of the second shareholder and the second shareholder has tender rights if a transfer is desired.
As a result of the impairment tests performed in fiscal year 2014–2015, an impairment loss of TEUR 1,722 was recognized on the equity-accounted investment in Mahle Metal Leve Miba Sinterizados Ltda.
Sintercom India Pvt. Ltd., with its principal place of business in Pune, India, is a sintering research and development partnership. Control over the net assets of Sintercom India Pvt. Ltd. is limited to the extent that Miba AG has a tender obligation in relation to the other shareholders in the event of an intention to sell.
In addition, in fiscal year 2013–2014 EDMS d.o.o., Šentjernej, Slovenia, which is being consolidated in full from February 1, 2014, and ABM Advanced Bearing Materials LLC, Greensburg, USA, which is being proportionately
> Consolidated financial statements 2014–2015 > Notes to the consolidated financial statements
129
consolidated in Miba AG’s consolidated financial statements from February 1, 2014, were included using the equity method.
At their reporting dates, associates included in the consolidated financial statements reported non-current assets of TEUR 28,526 (previous year: TEUR 25,238), current assets of TEUR 12,755 (previous year: TEUR 33,887), non-current liabilities of TEUR 7,502 (previous year: TEUR 11,071), current liabilities of TEUR 3,201 (previous year: TEUR 21,043) as well as revenue of TEUR 44,611 (previous year: TEUR 80,777).
(14) Financial assets
in TEUR
Investments in affiliated companies Loans
Securities (vested rights)
classified as non-current
assets Total
Carrying amount 1/31/2014 261 12,832 12,232 25,325
Carrying amount 1/31/2015 582 10,742 25,787 37,110
Loans to third parties mainly include term deposits with Austrian banks with terms of three to five years. Securities classified as non-current financial assets mainly comprise a held-to-maturity fund which invests in corporate bonds and was entered into as a long-term investment as well as securities which are managed and measured on the basis of fair value and also serve as a long-term investment.
131130
> C
on
solid
ated
Fin
anci
al S
tate
men
ts A
cco
rdin
g t
o IF
RS
s
> Consolidated financial statements 2014–2015 > Notes to the consolidated financial statements

130
(15) Deferred taxes
The measurement differences between the tax accounts and the IFRS consolidated balance sheet arise from the following differences and/or have the following effect on deferred taxes:
1/31/2015 1/31/2014
in TEUR Deferred tax
asset Deferred tax
liability Deferred tax
asset Deferred tax
liability
Consolidated financial statements
Assets
Non-current assets 3,105 19,039 4,207 15,991
Inventories 1,041 1,030 895 0
Other assets 1,342 9 101 162
Equity and liabilities
Untaxed reserves 0 529 0 554
Provisions 4,862 162 3,212 63
Other items in equity and liabilities 1,720 1 1,578 131
Subtotal 12,070 20,770 9,992 16,900
Loss carryforwards 4,330 0 2,401 0
Deferred tax asset measurement reductions –473 0 –245 0
Prepaid/accrued taxes 15,927 20,770 12,148 16,900
Consolidation
Non-current assets 802 0 1,011 0
Elimination of intercompany profits 354 0 239 0
Offset –14,824 –14,824 –10,101 –10,101
Deferred taxes 2,260 5,946 3,296 6,799
Management’s assessment of the extent to which it is probable that deferred tax assets will be realized is key to judging the recoverability of deferred tax assets. This depends on future taxable profits arising during periods in which the taxable temporary differences reverse and tax loss carryforwards can be claimed. The expected reversal of deferred tax liabilities as well as future taxable profits are taken into account in the process.
Based on the taxable profit forecasts for the next three years, the recoverability of the excess of deferred tax assets over deferred tax liabilities in the amount of TEUR 2,260 (previous year: TEUR 3,296) has been assessed as being sufficiently secure.
Deferred taxes relating to tax loss carryforwards are attributable to foreign companies. The significant losses will not expire before 2029. Tax loss carryforwards amounted to a total of TEUR 13,706 (previous year: TEUR 7,616).
> Consolidated financial statements 2014–2015 > Notes to the consolidated financial statements
131
For companies which reported a loss in the previous year or in the current period, a deferred tax asset of TEUR 3,872 (previous year: TEUR 587) was recognized because, based on the expected reversal of deferred tax liabilities and the taxable profit forecasts, the realization of the tax asset is probable.
Deferred tax assets were not recognized for tax loss carryforwards amounting to TEUR 2,302 (previous year: TEUR 842) as the tax assets are not expected to be realized in the foreseeable future. The use of tax loss carryforwards for which no deferred tax assets had previously been recognized had no effect on the reporting year (previous year: positive effect of TEUR 517).
Under the Austrian Corporate Income Tax Act (KStG), tax-deductible investment write-downs and losses arising from the disposal of investments must be claimed by being spread over a period of seven years. Deferred tax assets include deferred taxes relating to outstanding one-seventh write-downs amounting to TEUR 769 (previous year: TEUR 984). Deferred tax assets were recognized for all outstanding one-seventh write-downs under section 12 of the Austrian Corporate Income Tax Act (KStG).
In fiscal year 2014–2015, deferred taxes of TEUR 1,613 (previous year: TEUR 370) were recognized in other comprehensive income in the statement of comprehensive income; they relate to actuarial gains and losses and changes in the fair value of financial assets belonging to the available for sale category.
In accordance with IAS 12.39, no deferred taxes were reported in the consolidated balance sheet for differences arising from investments in subsidiaries.
(16) Inventories
in TEUR 1/31/2015 1/31/2014
Raw materials, consumables and supplies 29,969 21,933
Work in progress 29,327 25,335
Finished goods 20,497 18,070
Merchandise 13,077 11,437
Advance payments for inventories 214 1,460
Total 93,084 78,236
Inventories include accumulated write-downs in the amount of TEUR 6,447 (previous year: TEUR 6,743). The current year write-down is included in cost of materials in the consolidated income statement and amounted to TEUR 297 in fiscal year 2014–2015 (previous year: TEUR 1,281).
133132
> C
on
solid
ated
Fin
anci
al S
tate
men
ts A
cco
rdin
g t
o IF
RS
s
> Consolidated financial statements 2014–2015 > Notes to the consolidated financial statements

132
(17) Trade receivables
in TEUR 1/31/2015 1/31/2014
Trade receivables 93,963 83,030
Receivables from long-term construction contracts 5,423 2,885
Payments on account received in respect of receivables from long-term construction contracts –3,177 –1,609
Receivables from unconsolidated affiliated companies 898 6
Total 97,107 84,311
As a means of securing liquidity, an agreement to assign customer receivables was entered into with an Austrian bank in fiscal year 2012–2013. Under this agreement, trade receivables, which are insured on a monthly revolving basis, are sold at their principal amount up to a maximum volume of TEUR 17,000. As of the reporting date, receivables with a carrying amount of TEUR 12,196 (previous year: TEUR 11,383) had been assigned and derecognized under IAS 39 rules as the associated material opportunities and risks had been transferred. Miba AG undertook to obtain credit insurance for the receivables sold and to take on the debtor management. The insurance deductible still has to be borne by Miba AG. The maximum loss exposure from the insurance deductible (aggregate first loss) applies to all insured receivables, i.e., also to those which have not been sold, and, as of the reporting date, amounted to TEUR 250 in relation to insured receivables of TEUR 76,345. The bank has the right to transfer receivables back to Miba AG for procedural reasons in the event of a legal dispute. This does not, however, result in the credit default risk being transferred back. Any cash outflows resulting from the buyback would – if at all – take place at short notice, i.e., in 2015.
Trade receivables were due within one year as of January 31, 2015, and January 31, 2014.
Long-term construction contracts
Long-term construction contracts in TEUR 1/31/2015 1/31/2014
For all contracts not invoiced as of the balance sheet date
Income from contracts for the period reported as revenue 4,990 2,835
Contract costs incurred up to the reporting date 4,226 2,003
Profits/(losses) incurred up to the reporting date 764 832
Advances and part payments received 3,646 4,275
> Consolidated financial statements 2014–2015 > Notes to the consolidated financial statements
133
The carrying amounts of trade receivables and receivables from long-term construction contracts as of January 31, 2015, and January 31, 2014, were as follows:
Trade receivables and receivables from long-term construction contracts in TEUR 1/31/2015 1/31/2014
Neither impaired nor past due as of the reporting date 81,559 68,609
Not impaired as of the reporting date and past due in the following time bands
Less than 60 days past due 9,964 10,896
Between 60 and 180 days past due 4,026 2,920
Between 180 and 360 days past due 814 1,196
More than 360 days past due 61 44
Receivables for which specific allowances for impairment have been recognized 683 647
Total 97,107 84,311
With regard to the balance of trade receivables and receivables from long-term construction contracts which are neither impaired nor past due, there were no indications as of the reporting date that the debtors will not meet their payment obligations.
Valuation allowances for trade receivables changed as follows in fiscal years 2014–2015 and 2013–2014:
in TEUR 2014–15 2013–14
Balance 2/1 2,537 2,399
Reversal/utilization –559 –478
Increase in valuation allowances 753 616
Balance 1/31 2,731 2,537
Expenses for fully derecognized trade receivables amounted to TEUR 214 (previous year: TEUR 175) in fiscal year 2014–2015.
135134
> C
on
solid
ated
Fin
anci
al S
tate
men
ts A
cco
rdin
g t
o IF
RS
s
> Consolidated financial statements 2014–2015 > Notes to the consolidated financial statements

134
(18) Other assets
in TEUR 1/31/2015 1/31/2014
Other receivables and assets 21,263 20,531
Prepaid expenses 2,450 1,317
Total 23,712 21,848
of which financial receivables 4,175 3,334
Other receivables and assets include non-current receivables amounting to TEUR 3,176 (previous year: TEUR 2,907).
(19) Current financial assets
Financial assets mainly include medium-term liquidity reserves in the form of term deposits with a remaining maturity of more than three and up to twelve months, which are measured at amortized cost, and securities which serve as a medium-term investment (more than three and up to twelve months).
(20) Cash and cash equivalents
This item mainly includes cash-in-hand, cash at banks and short-term available-for-sale securities classified as current assets with a remaining maturity of up to three months.
There were no restrictions on the amounts included in this item as of the reporting date.
(21) Group equity
Share capital
The share capital of Miba AG was TEUR 9,500 as of January 31, 2015. It is divided into 1,300,000 no-par value shares. Of these, 870,000 are ordinary shares, 130,000 are category A preferred shares with no voting rights but with a right to be converted into ordinary shares upon relinquishment of preferential rights, and 300,000 are category B preferred shares with no voting rights and no right to be converted into ordinary shares. All shares issued are also fully paid up. There is no authorized capital in addition to the shares issued.
Miba category B preferred shares are listed in the “Standard Market Auction” segment of the Vienna Stock Exchange.
> Consolidated financial statements 2014–2015 > Notes to the consolidated financial statements
135
Changes in the number of shares and treasury shares in circulation were as follows:
Number of
ordinary shares
Number of preferred shares
(category A)
Number of preferred shares
(category B)
Number of treasury shares
(category B)
Balance 2/1/2013 870,000 130,000 218,451 81,549
Repurchased 0 0 –10,895 10,895
Balance 1/31/2014 870,000 130,000 207,556 92,444
Number of
ordinary shares
Number of preferred shares
(category A)
Number of preferred shares
(category B)
Number of treasury shares
(category B)
Balance 2/1/2014 870,000 130,000 207,556 92,444
Repurchased 0 0 –5,535 5,535
Balance 1/31/2015 870,000 130,000 202,021 97,979
Capital reserves
Capital reserves solely comprised allocated capital reserves (premium) and remained unchanged at TEUR 18,089.
Treasury shares – June 28, 2013, share buyback program
Miba AG’s 27th Annual General Meeting on June 28, 2013, authorized Miba AG’s Management Board – by revoking the authorization granted at the 25th Annual General Meeting on July 1, 2011 – to buy back own shares (category B preferred shares) to the maximum extent permitted in law of 10 percent of the share capital including shares already acquired, for a period of 30 months from July 1, 2013, as a general acquisition pursuant to section 65(1) number 8 of the Austrian Stock Corporation Act (AktG), and to set the terms of the buy-back, whereby the buy-back amount to be paid per share may not be less than EUR 100.00 and not more than a maximum of 10 percent above the average non-weighted closing price of the ten trading days prior to the buy-back and the acquisition may take place in any manner permissible in law, in particular including over the counter and from individual shareholders who are willing to sell (negotiated purchase). Trading in own shares is precluded from being a purpose of the acquisition.
On August 21, 2013, Miba AG’s Management Board resolved to use the Annual General Meeting’s authorization to buy back own shares and to acquire up to 45,000 Miba no-par value category B preferred shares (ISIN AT0000734835) via the stock exchange and/or over the counter, taking account of restrictions under Austrian stock corporation law.
In fiscal year 2014–2015, 5,535 own shares (previous year: 10,895) were bought back under this share buy-back program.
137136
> C
on
solid
ated
Fin
anci
al S
tate
men
ts A
cco
rdin
g t
o IF
RS
s
> Consolidated financial statements 2014–2015 > Notes to the consolidated financial statements

136
By the reporting date of, January 31, 2015, 97,979 own shares (previous year: 92,444) had been bought back at an average price of EUR 166.42 (previous year: EUR 153.84) per share. This equates to about 7.5 percent (previous year: 7.1 percent) of share capital.
As of the reporting date, none of the treasury shares had been used as authorized by the Annual General Meeting.
Retained earnings
Retained earnings include:
Profit after tax less dividend payments and less profit attributable to non-controlling interests, as well as the components of other comprehensive income, in particular
the offset of actuarial gains and losses from the measurement of termination benefit and pension provisions and attributable deferred taxes,
the foreign currency translation from foreign subsidiary financial statements,
the share of other comprehensive income of equity-accounted companies, and
changes in the fair value of financial assets belonging to the available for sale category.
Non-controlling interests
Non-controlling interests relate to third-party interests in consolidated Group companies. There are material direct non-controlling interests in two of Miba AG’s subsidiaries and, as a result, material indirect non-controlling interests in their subsidiaries. This involves Miba Energy Holding GmbH & Co KG and its subsidiaries as well as High Tech Coatings GmbH and its subsidiaries. Both subsidiaries have their principal places of business in Laakirchen, Austria. The direct non-controlling interest in Miba Energy Holding GmbH & Co KG is 51.0 percent; in High Tech Coatings GmbH, it is 49.9 percent. In order to present a true and fair view of the non-controlling interests, the indirect non-controlling interests in the subsidiaries were also taken into account. The disclosures on non-controlling interests presented in the following table can therefore not be calculated with the direct non-controlling interests.
The financial information of the companies is summarized below. This information is stated before intragroup eliminations. Intragroup eliminations are only carried out between the companies included in the consolidation.
Miba Energy Holding GmbH & Co KG’s direct and indirect subsidiaries include EBG Elektronische Bauelemente GmbH, EBG & DAU Kühlerentwicklung GmbH, EBG Shenzhen Ltd., EBG LLC, EBG Resistors LLC, EDMS d.o.o., DAU GmbH & Co KG, Dau GmbH, DAU Thermal Solutions North America Inc, Miba Energy Holding LLC, Miba Asia Holding Pte. Ltd. and shares in Miba China Holding GmbH.
High Tech Coatings GmbH’s direct and indirect subsidiaries comprise Miba Coatings Trading (Suzhou) Ltd., shares in Miba China Holding GmbH and shares in Miba Precision Components (China) Co. Ltd.
> Consolidated financial statements 2014–2015 > Notes to the consolidated financial statements
137
Company
Miba Energy Holding GmbH & Co KG
and related subsidiaries High Tech Coatings GmbH
and related subsidiaries
1/31/2015 1/31/2014 1/31/2015 1/31/2014
Non-controlling interests in percent 51.0 51.0 49.9 49.9
in TEUR
Revenue 45,992 40,329 16,420 12,073
Profit after tax and financing costs attributable to LP minority shareholders (EAT after LPMS) 4,523 1,976 1,403 780
of which attributable to non-controlling interests 1,311 544 700 389
Other comprehensive income 1,219 –43 78 –6
Total comprehensive income 5,742 1,933 1,481 775
of which attributable to non-controlling interests 2,794 540 729 386
Non-current assets 33,758 26,723 8,555 6,421
Current assets 41,533 22,591 6,136 4,786
Non-current liabilities 41,612 29,296 4,134 4,368
Current liabilities 20,626 17,671 4,751 2,490
Net assets 13,052 2,347 5,807 4,349
of which attributable to non-controlling interests 10,191 1,670 2,665 1,936
Cash flow from operating activities 4,610 –2,314 3,449 2,013
Cash flow from investing activities –1,402 –1,271 –3,433 –1,076
Cash flow from financing activities 6,226 7,094 172 –260
of which dividends to non-controlling interests 131 404 0 0
Change in cash and cash equivalents 9,434 3,509 188 677
On March 28, 2014, the Miba Group acquired the remaining 30 percent of EBG LLC, Middletown, Pennsylvania, USA, which led to a year-on-year decline in non-controlling interests of TEUR 936.
The initial consolidation of EDMS d.o.o., Šentjernej, Slovenia, resulted in an increase in non-controlling interests of TEUR 238.
The initial consolidation of EBG Shenzhen Ltd., Shenzhen, China, resulted in an addition to non-controlling interests in the amount of TEUR 9,024.
139138
> C
on
solid
ated
Fin
anci
al S
tate
men
ts A
cco
rdin
g t
o IF
RS
s
> Consolidated financial statements 2014–2015 > Notes to the consolidated financial statements

138
(22) Termination benefit and pension provisions
The most important actuarial assumptions used as of the reporting date are listed below in percent.
Actuarial assumptions – in percent 1/31/2015 1/31/2014
Discount rate (termination benefit and pension provision) 1.70 3.50
Future wage or salary increases (termination benefit provision) 2.40 2.80
Assumptions about future mortality are based on the Rechnungsgrundlagen für die Pensionsversicherung AVÖ-P08 GEM (AVÖ-P08 GEM calculation principles for pension insurance). Taking transitional regulations into account, the earliest possible date of entitlement to a retirement pension was taken as a basis for the assumed retirement age. A company-specific deduction for staff turnover was applied.
Termination benefit provisions
in TEUR 1/31/2015 1/31/2014
Present value of termination benefit obligations = opening balance 21,981 20,767
Current service cost 1,020 977
Past service cost 0 211
Interest expense 757 712
Termination benefit payments –2,176 –2,232
Actuarial gains (–)/losses (+) from changes in financial assumptions 4,268 792
Actuarial gains (–)/losses (+) from changes in experience assumptions 731 753
Present value of termination benefit obligations = closing balance 26,579 21,981
Expected payments from termination benefit obligations for fiscal year 2015–2016 are TEUR 654 (previous year: TEUR 670).
The weighted average duration of defined benefit obligations as of January 31, 2015, was 13.3 years (previous year: 12.7 years).
Changes deemed possible as of the reporting date, applying prudent judgment, in one of the material actuarial assumptions while keeping other assumptions constant would have influenced defined benefit obligations by the following amounts:
> Consolidated financial statements 2014–2015 > Notes to the consolidated financial statements
139
Effect as of 1/31/2015, in TEUR Increase Decrease
Discount rate (1% change) –3,157 3,814
Future wage or salary increases (0.5% change) 1,793 –1,648
Effect as of 1/31/2014, in TEUR Increase Decrease
Discount rate (1% change) –2,461 2,951
Future wage or salary increases (0.5% change) 1,410 –1,299
Pension provisions
in TEUR 1/31/2015 1/31/2014
Present value of pension obligations (DBO) = opening balance 7,687 8,062
Change in the reporting 0 –259
Interest expense 260 263
Pension payments from plan assets –401 –400
Employer pension payments –144 –152
Actuarial gains (–)/losses (+) from changes in financial assumptions 1,438 0
Actuarial gains (–)/losses (+) from changes in experience assumptions 101 173
Present value of pension obligations (DBO) = closing balance 8,941 7,687
Value of plan assets (pension liabilities insurance) –5,570 –5,728
Pension provisions 3,371 1,958
Explanations on the change in reporting are provided under C.8. Change in the reporting of obligations to employees, financial and other obligations.
There is an individual agreement which provides for an annual consumer price index-related pension adjustment for the material pension benefit to a former member of the Management Board included in pension obligations.
Changes deemed possible as of the reporting date, applying prudent judgment, in one of the material actuarial assumptions while keeping other assumptions constant would have influenced defined benefit obligations by the following amounts:
Effect as of 1/31/2015, in TEUR Increase Decrease
Future pension increase (0.5% change) 464 –430
141140
> C
on
solid
ated
Fin
anci
al S
tate
men
ts A
cco
rdin
g t
o IF
RS
s
> Consolidated financial statements 2014–2015 > Notes to the consolidated financial statements

140
Plan assets include two insurance contracts which were entered into to cover this direct pension commitment.
There is also another individual agreement which provides for an increase of 1.0 percentage point per year for another pension. The other pension obligations do not provide for any further pension adjustments.
The movement in the fair value of plan assets is presented in the following table:
in TEUR 1/31/2015 1/31/2014
Value of plan assets at beginning of fiscal year 5,728 5,887
Interest income from plan assets 193 198
Income from plan assets (excluding interest income) 49 43
Pension payments from plan assets –401 –400
Value of plan assets at end of fiscal year 5,570 5,728
Expected payments from pension obligations for fiscal year 2015–2016 amount to TEUR 548 (previous year: TEUR 541).
The weighted average duration of defined benefit obligations as of January 31, 2015, was 10.4 years (previous year: 9.9 years).
Changes deemed possible as of the reporting date, applying prudent judgment, in one of the material actuarial assumptions while keeping other assumptions constant would have influenced defined benefit obligations by the following amounts:
Effect as of 1/31/2015, in TEUR Increase Decrease
Discount rate (1% change) –806 953
Effect as of 1/31/2014, in TEUR Increase Decrease
Discount rate (1% change) –682 802
> Consolidated financial statements 2014–2015 > Notes to the consolidated financial statements
141
(23) Financial liabilities
This item includes all interest-bearing liabilities with a remaining maturity of more than one year. For details, please refer to the financial liabilities table in note (32) Financial instruments, financial risk management and capital management.
in TEUR 1/31/2015 1/31/2014
Bond 74,783 74,736
of which with a remaining maturity of more than 5 years 0 74,736
Liabilities to banks 22,205 22,790
of which with a remaining maturity of more than 5 years 0 445
Liabilities to non-banks (loans) 2,827 2,562
of which with a remaining maturity of more than 5 years 0 532
Liabilities under finance leases 12,613 7,697
of which with a remaining maturity of more than 5 years 6,229 3,195
Total 112,428 107,785
of which with a remaining maturity of more than 5 years 6,229 78,907
On February 27, 2012, Miba AG issued a seven-year bullet bond with a principal amount of EUR 75,000,000.00 (ISIN AT0000A0T8M1). The bond comprises 150,000 notes with a principal amount of EUR 500.00 each. The interest rate is 4.5 percent p.a. Interest is payable annually in arrears on February 27.
Transaction costs that are directly attributable to the issue have been added to the bond in accordance with IAS 39.43 and are recognized over the term using the effective interest method.
The Miba Group had sufficient unused approved credit lines available as of the reporting date. There are no restrictions on the use of the credit lines.
143142
> C
on
solid
ated
Fin
anci
al S
tate
men
ts A
cco
rdin
g t
o IF
RS
s
> Consolidated financial statements 2014–2015 > Notes to the consolidated financial statements

142
(24) Other non-current liabilities
This item includes other non-current liabilities with a remaining maturity of more than one year.
in TEUR 1/31/2015 1/31/2014
Personnel obligations 6,109 4,936
of which with a remaining maturity of more than 5 years 6,109 4,936
Payments on account received in respect of orders 283 8
of which with a remaining maturity of more than 5 years 0 0
Other non-current liabilities 0 496
of which with a remaining maturity of more than 5 years 0 0
Investment subsidies 25 32
of which with a remaining maturity of more than 5 years 0 0
Total 6,417 5,472
of which with a remaining maturity of more than 5 years 6,109 4,936
of which financial liabilities 0 496
(25) Provisions
in TEUR Balance
2/1/2014
Foreign ex-
change differ-ences
Changes in
consoli-dated group Utilized
Rever-sals
Alloca- tion to
pro-visions
Balance 1/31/2015
Deferred taxes 6,799 1,812 1,163 6,584 0 2,757 5,946
Other non-current personnel provisions 1,969 0 0 349 0 213 1,833
Other personnel provisions 5,780 508 71 5,613 28 6,432 7,150
Other provisions 5,865 80 5 4,360 976 11,538 12,153
Explanations on the change in reporting are provided under C.8. Change in the reporting of obligations to employees, financial and other obligations.
Other non-current personnel provisions relate to long-term oriented remuneration components for members of the Management Board. After the initial allocation, this variable remuneration component changes in line with the performance of equity as of each reporting date. After a holding period of three years, the beneficiaries have the option of a cash settlement.
> Consolidated financial statements 2014–2015 > Notes to the consolidated financial statements
143
(26) Trade payables
in TEUR 1/31/2015 1/31/2014
Trade payables due to third parties 59,164 61,005
Liabilities to unconsolidated affiliated companies 2,087 3,382
Total 61,250 64,388
Explanations on the change in reporting are provided under C.8. Change in the reporting of obligations to employees, financial and other obligations.
Since fiscal year 2014–2015, the Miba Group has been using reverse factoring as part of its working capital financing. In cooperation with an Austrian bank, suppliers’ Miba Group receivables are bought by the bank. This gives suppliers the opportunity to discount their receivables before the payment period expires. The Miba Group settles the liability as it falls due by payment to the bank. As of January 31, 2015, reverse factoring affected liabilities amounting to TEUR 8,093.
(27) Current financial liabilities
This item includes all interest-bearing liabilities with a remaining maturity of less than one year. For details, please refer to the financial liabilities table in note (32) Financial instruments, financial risk management and capital management.
in TEUR 1/31/2015 1/31/2014
Liabilities to banks 17,139 13,603
Liabilities to unconsolidated affiliated companies 0 83
Other loans 704 416
Liabilities under finance leases 1,470 1,205
Total 19,313 15,307
(28) Income tax liabilities
in TEUR 1/31/2015 1/31/2014
Income tax liabilities 0 694
145144
> C
on
solid
ated
Fin
anci
al S
tate
men
ts A
cco
rdin
g t
o IF
RS
s
> Consolidated financial statements 2014–2015 > Notes to the consolidated financial statements

144
(29) Other current liabilities
in TEUR 1/31/2015 1/31/2014
Payments on account received in respect of orders 626 3,451
Other liabilities 14,839 11,380
Other personnel-related liabilities 11,394 11,285
Other liabilities to unconsolidated affiliated companies 12,471 6,980
Other liabilities to tax authorities 3,149 2,724
Other liabilities from social obligations 3,611 3,353
Deferred income 624 751
Total 46,716 39,923
of which financial liabilities 7,674 4,895
Explanations on the change in reporting are provided under C.8. Change in the reporting of obligations to employees, financial and other obligations.
Other liabilities to affiliated companies include the non-controlling interest in Miba Energy Holding GmbH & Co KG held by the ultimate affiliated company, Mitterbauer Beteiligungs-Aktiengesellschaft. Further explanations are provided in the notes under note B.2. Basis of consolidation. Other liabilities to affiliated companies changed as follows:
in TEUR 1/31/2015 1/31/2014
Carrying amount 2/1 6,980 7,364
Change in consolidated group 234 0
Dividend 0 –1,785
Share of profit/loss for the year 3,673 1,398
Currency translation 1,585 3
Carrying amount 1/31 12,471 6,980
> Consolidated financial statements 2014–2015 > Notes to the consolidated financial statements
145
(30) Contingent liabilities and other financial obligations
Contingent liabilities were as follows:
in TEUR 1/31/2015 1/31/2014
Guarantees 3,529 2,654
Leasing
The parent company of High Tech Coatings GmbH, Laakirchen, Austria, provided a guarantee in the amount of TEUR 2,346 (previous year: TEUR 2,648) to the lessor in connection with the construction of the company’s new building in Vorchdorf.
Other
Management considers the probability of current litigation having a negative impact to be low.
There are no other obligations or risks which have not been reported appropriately in the accompanying consolidated financial statements or in the disclosures.
E. Other disclosures
(31) Consolidated cash flow statement
The consolidated cash flow statement has been prepared using the indirect method. Cash and cash equivalents comprise cash-in-hand, checks, cash at banks and short-term available-for-sale securities with a remaining maturity of up to three months. Income taxes paid as well as interest and dividends received have been classified as operating activities. Interest and dividends paid are classified as financing activities. The effects from currency translation and changes to the basis of consolidation have been eliminated from the respective items in the three classification areas.
(32) Financial instruments, financial risk management and capital management
The carrying amounts (classified according to IAS 39 measurement categories) and fair values (classified into the fair value hierarchy, see explanation below) of financial assets and financial liabilities as of January 31, 2015, and January 31, 2014, were as follows:
147146
> C
on
solid
ated
Fin
anci
al S
tate
men
ts A
cco
rdin
g t
o IF
RS
s
> Consolidated financial statements 2014–2015 > Notes to the consolidated financial statements

149148
> C
on
solid
ated
Fin
anci
al S
tate
men
ts A
cco
rdin
g t
o IF
RS
s
> Consolidated financial statements 2014–2015 > Notes to the consolidated financial statements

151150
> C
on
solid
ated
Fin
anci
al S
tate
men
ts A
cco
rdin
g t
o IF
RS
s
> Consolidated financial statements 2014–2015 > Notes to the consolidated financial statements

150
Fair values of financial assets are classified into levels 1 to 3 depending on how observable their fair value is:
Level 1: Market prices quoted in active markets for identical financial assets and liabilities.
Level 2: Fair values determined using quoted prices or measurement methods for which the inputs that are important for determining value are based on observable market data.
Level 3: Fair values calculated using models in which the inputs that are important for determining value are based on non-observable data.
Trade receivables and payables, receivables from long-term construction contracts as well as from current investments, other financial receivables and liabilities and cash and cash equivalents are financial assets and liabilities which are not recognized at fair value and have predominantly short remaining maturities. Their carrying amounts equate approximately to fair value as of the reporting date.
The fair value of securities (with the exception of other equity investments) is based on current prices and equates to the market value as of the reporting date.
Investments in (unconsolidated) affiliated companies and other equity investments in companies include unquoted equity instruments whose fair value cannot be reliably determined and which are recognized at cost. No disposals are planned in the foreseeable future.
The fair value of loans to third parties equates, if material, to the present value of the payments associated with the assets, taking the respective current, observable market parameters (interest rates and currencies) and unobservable parameters (credit ratings of counterparties) into account.
Derivative financial instruments are valued using recognized actuarial techniques (DCF method) which are based on observable market parameters (yield curves, exchange rates, quoted copper prices) and unobservable parameters (credit ratings and counterparty default risk). In addition, as of the reporting date, market prices established by banks are used and adjustments made taking account of the credit risk (credit value adjustments) if these adjustments are material.
Fair values of financial liabilities are, if material, calculated as present values of the payments associated with the liabilities, based on current observable market parameters (yield curves and exchange rates) and unobservable parameters (Miba AG’s credit rating).
Liabilities under finance leases are recognized at the present value of future lease payments because they bear variable interest.
Financial assets and liabilities are generally reported gross. They are only offset if an offset of the amounts is currently legally enforceable by Miba AG and an offset is actually intended. There are also offsetting framework agreements within the Miba Group which allow for derivative-related offsetting. The IFRS 7 disclosures have not been provided as there were no amounts requiring offset as of the reporting date.
> Consolidated financial statements 2014–2015 > Notes to the consolidated financial statements
151
Analysis of contractually agreed payments of interest and principal
The contractually agreed (undiscounted) payments of interest and principal for primary financial liabilities as well as for derivative financial liabilities with negative fair values comprised the following as of January 31, 2015, and January 31, 2014:
Carrying amount Cash flows 2015–16
Cash flows 2016–17 to 2019–20
Cash flows from 2020–21
in TEUR 1/31/2015 Interest Principal Interest Principal Interest Principal
Nonderivative financial liabilities
Interest-bearing liabilities 117,659 4,661 17,843 14,252 100,032 0 0
Liabilities under finance leases 14,083 336 1,470 971 6,384 992 6,229
Other liabilities 7,674 0 7,674 0 0 0 0
Trade payables 61,250 0 61,250 0 0 0 0
Total 200,666 4,997 88,238 15,223 106,416 992 6,229
Derivative financial liabilities
Derivatives with negative fair values not in hedging relationships 449 67 0 246 0 31 0
Total 449 67 0 246 0 31 0
153152
> C
on
solid
ated
Fin
anci
al S
tate
men
ts A
cco
rdin
g t
o IF
RS
s
> Consolidated financial statements 2014–2015 > Notes to the consolidated financial statements

152
Carrying amount Cash flows 2014–15
Cash flows 2015–16 to 2018–19
Cash flows from 2019–20
in TEUR 1/31/2014 Interest Principal Interest Principal Interest Principal
Nonderivative financial liabilities
Interest-bearing liabilities 114,190 4,282 14,102 14,275 24,376 3,377 75,977
Liabilities under finance leases 8,902 262 1,205 755 4,503 652 3,195
Other liabilities 5,390 0 5,390 0 0 0 0
Trade payables 63,925 0 63,925 0 0 0 0
Total 192,408 4,544 84,623 15,030 28,878 4,029 79,171
Derivative financial liabilities
Derivatives with negative fair values not in hedging relationships 91 50 0 192 0 58 0
Total 91 50 0 192 0 58 0
All financial instruments held as of the reporting date and for which payments had already been contractually agreed have been included. Projected figures for future new liabilities are not included. Amounts denominated in foreign currencies have been translated at the closing rate. Variable interest payments for financial instruments were determined based on the last interest rates fixed before the reporting date. Financial liabilities that are repayable at any time are always allocated to the earliest maturity banding.
Derivatives not subject to hedge accounting
All derivative financial instruments which do not meet the hedge accounting criteria of IAS 39 and have been classified as held for trading are recognized at fair value. Derivative financial instruments with positive fair values are reported under other receivables and assets, while those with negative fair values are reported under current provisions.
A multiple settlement commodity swap based on the “LME Copper Cash” index was entered into during the fiscal year. Future purchases of copper as a raw material were designated as the hedged item. This hedging transaction is intended to reduce the risk of rising copper prices by transferring variable purchase costs for a basic purchase volume into fixed (commodity swap) purchase costs. The maximum remaining maturity of the commodity hedges is five months.
In order to hedge the planned adjustment to lease payments provided for in the lease agreements of a number of Group companies, whereby lease payments will be brought into line with the performance of short-term interest rates, two interest rate swaps (five and seven years) were entered into in fiscal year 2013–2014 as
> Consolidated financial statements 2014–2015 > Notes to the consolidated financial statements
153
hedging instruments, in which Miba AG, who pays fixed interest and receives variable interest, is transferring variable payments into fixed payments in order to hedge against rising interest rates.
Net losses of TEUR 416 from derivative financial instruments not included in a hedging relationship that are designated as financial liabilities at fair value through profit or loss have been recognized in the consolidated income statement.
The level of outstanding derivative financial instruments was as follows:
1/31/2015 1/31/2014
Notional amount in TUSD
(copper)/ in TEUR (interest
rate)
Positive fair value in
TEUR
Negative fair value in
TEUR
Notional amount in TUSD
(copper)/ in TEUR (interest
rate)
Positive fair value in
TEUR
Negative fair value in
TEUR
Hedging of raw material prices (copper) 1,306 0 –187 11,073 0 –48
Interest rate hedge 6,500 0 –262 6,500 0 –43
Net income from financial instruments
Net income from financial instruments, broken down by the IAS 39 measurement categories, was as follows in fiscal year 2014–2015 and 2013–2014:
155154
> C
on
solid
ated
Fin
anci
al S
tate
men
ts A
cco
rdin
g t
o IF
RS
s
> Consolidated financial statements 2014–2015 > Notes to the consolidated financial statements

154
From subsequent measurement
Fiscal year 2014–15 in TEUR From
interest
at fair value
through profit or
loss
at fair value
outside profit or
loss
Allowance for impair-
ment From
disposals Total
Loans and receivables 1,169 0 0 20 –214 975
Held to maturity 360 0 0 0 0 360
Financial assets at fair value through profit or loss (held for trading) 10 112 0 0 0 122
Financial assets at fair value through profit or loss (fair value option) 0 150 0 0 0 150
Available for sale 29 0 35 0 0 64
Financial liabilities at amortized cost –4,626 0 0 0 0 –4,626
Financial liabilities at fair value through profit or loss –55 –406 0 0 45 –416
Total –3,114 –144 35 20 –169 –3,372
From subsequent measurement
Fiscal year 2013–14 in TEUR From
interest
at fair value
through profit or
loss
at fair value
outside profit or
loss
Allowance for impair-
ment From
disposals Total
Loans and receivables 1,008 0 0 36 –175 870
Held to maturity 197 0 0 0 0 197
Financial assets at fair value through profit or loss (held for trading) 175 0 0 0 0 175
Financial assets at fair value through profit or loss (fair value option) 0 0 0 0 0 0
Available for sale 26 0 0 0 12 38
Financial liabilities at amortized cost –4,540 0 0 0 0 –4,540
Financial liabilities at fair value through profit or loss –54 –91 0 0 0 –145
Total –3,187 –91 0 36 –163 –3,404
> Consolidated financial statements 2014–2015 > Notes to the consolidated financial statements
155
The loans and receivables category includes interest income, allowances for impairment and expenses from the derecognition of trade receivables. The held to maturity category comprises interest income. Financial assets at fair value through profit or loss include dividend income and income from the reversal of impairment losses. The available for sale category includes interest income, income from the reversal of impairment losses and income from the disposal of financial assets. Financial liabilities at amortized cost comprise interest expenses. Financial liabilities at fair value through profit or loss include expenses from the measurement of derivatives not in hedging relationships, interest expenses and income from the disposal of derivatives.
Financial risk management and capital management
As a global business, the Miba Group is exposed to certain general and sector-specific risks.
It is corporate policy to identify emerging risks at an early stage through the close monitoring of existing exposures and market developments, and to take countermeasures quickly.
The annual evaluation of Group companies did not reveal any material new or previously unrecognized risks. In addition, based on the information currently available, there are no individual risks to the continued existence of the Miba Group as a going concern which might have a material, detrimental effect on the assets, liabilities, financial position and profit or loss.
Financial instruments represent an important area when hedging risks. Financial instruments such as trade receivables and trade payables, as well as financial assets and liabilities are included under IAS 32. The carrying amount of the primary financial instruments reported in the consolidated balance sheet mainly equates to market value or fair value.
a) Credit risk
The risk of delayed payments or payment defaults affects both customers and banks for which the Group holds receivables in the form of trade receivables or invested funds.
Credit ratings of new and existing customers are monitored continually as part of an extensive credit insurance policy for trade receivables. As of the reporting date, the largest customer made up 4.8 percent (previous year: 4.2 percent) of outstanding receivables.
For banks, an internal credit assessment is performed continually using various key performance indicators. Investment volume limits are issued for each bank. According to internal guidelines, investments may only be placed with banks that have an excellent credit rating.
As the majority (78.6 percent) of trade receivables are insured, their risk of default is low. The carrying amounts of receivables and other financial assets represent the maximum credit or default risk as of the reporting date.
b) Interest rate risk
Interest rate risk exists when rising or falling interest rates result in a higher interest expense or in lower interest income.
157156
> C
on
solid
ated
Fin
anci
al S
tate
men
ts A
cco
rdin
g t
o IF
RS
s
> Consolidated financial statements 2014–2015 > Notes to the consolidated financial statements

156
Interest rate risk is limited by the 4.5 percent fixed interest bond, which represents more than half of the interest-bearing liabilities, as well as by further fixed interest loans. In addition, an interest rate swap has been entered into to reduce the risk from interest rate changes which arises from lease agreements.
On the asset side of the balance sheet, cash balances and, assuming reinvestment, variable interest and short-term investments are subject to interest rate risk. The risk of falling interest rates is very limited due to the prevailing low level of interest rates in both major currency areas (USD and EUR). Rising interest rates would lead to significantly higher interest income.
c) Currency risk
Currency risks on the asset side of the balance sheet mainly relate to the US dollar and result from trade receivables from international customers as well as cash balances and investments. On the equity and liabilities side, there are no notable currency risks except in relation to trade payables, since the ongoing financing of operations by Group companies takes place in the respective local currency.
Because the manufacturing sites are located in the three significant customer currency areas, costs are also incurred in the currency in which customer payments are made, which significantly reduces currency risk (natural hedge).
d) Liquidity risk
Liquidity safeguarding must secure the Group’s solvency at all times. Liquidity in the Group is secured by appropriate liquidity planning at the start of the year, by having sufficient cash and cash equivalents during the year and by means of short-term borrowing.
The current excess of cash and cash equivalents available at short notice over financial liabilities, together with the additional financing available, represent an adequate liquidity buffer.
Current cash and cash equivalents are managed centrally via a cash reporting system, which allows negative developments to be recognized early and to be reacted to quickly. If required, a rolling short-term liquidity forecast is also prepared.
e) Commodity price risk
Miba AG uses various commodities for its products which are subject to price fluctuations. Copper is material to the Company in addition to various types of steel. Copper purchasing volumes in fiscal year 2014–2015 amounted to 2,951 tons, of which a total of 700 tons were hedged by financial instruments (620 tons by forward transactions and 80 by option contracts). Price escalator clauses in customer contracts are a further hedge.
f) Capital management
Miba AG’s Articles of Incorporation do not specify any minimum capital requirements. The objective of the Group is to maintain an appropriate capital structure as well as to increase the value of the Group in the long term.
> Consolidated financial statements 2014–2015 > Notes to the consolidated financial statements
157
The equity ratio, based on equity and total assets in the consolidated balance sheet, is used to manage capital. No specific target is set.
1/31/2015 1/31/2014
Group equity in TEUR 421,975 349,569
Group total assets in TEUR 741,867 640,091
Group equity ratio in percent 56.9 54.6
g) Sensitivity analyses
Sensitivity analysis principles
In order to present material market risks for financial instruments, IFRS 7 requires sensitivity analyses which demonstrate the effects that hypothetical changes to relevant risk variables might have on profit or loss and group equity. The Miba Group is mainly exposed to foreign currency, interest rate, commodity price and market risk. Therefore, appropriate sensitivity analyses were performed for these market risks.
The financial instrument holdings affected as of the reporting date were used as the basis for determining the effects from hypothetical changes to the risk variables. In doing so, it was assumed that the respective risk as of the reporting date for the most part represents the risk during the fiscal year.
The Austrian corporate income tax rate of 25 percent was used uniformly as the tax rate.
In the interest rate risk sensitivity analysis, only the cash flow risk was taken into account since fair value risk is not relevant due the accounting policies applied.
Sensitivity analysis for foreign currency risk
There are three main currency areas within the Miba Group which reflect the majority of foreign currency financial assets and liabilities. The table below shows the material foreign currency items in the three currency areas as of the reporting date, subdivided into financial assets (including trade receivables) and financial liabilities (including trade payables).
1/31/2015 1/31/2014
in thousand EUR USD CNY EUR USD CNY
Financial assets (incl. trade receivables) 219 42,371 120 251 25,241 120
Financial liabilities (incl. trade payables) –25,375 –12,865 –666 –30,696 –3,992 –3,653
Net risk exposure –25,155 29,507 –546 –30,445 21,248 –3,533
159158
> C
on
solid
ated
Fin
anci
al S
tate
men
ts A
cco
rdin
g t
o IF
RS
s
> Consolidated financial statements 2014–2015 > Notes to the consolidated financial statements

158
If the euro had appreciated against the US dollar or the renminbi yuan by 10 percent as of the reporting date, then profit and equity would have changed by the following amounts:
1/31/2015 1/31/2014
Appreciation of EUR by 10 percent in TEUR
Effect on profit (after
tax) Effect on
equity
Effect on profit (after
tax) Effect on
equity
EUR–USD –2,510 –2,510 –1,923 –1,923
EUR–CNY –1,002 –1,002 –1,224 –1,224
If the euro had depreciated against the US dollar or the renminbi yuan by 10 percent as of the reporting date, then profit and equity would have changed by the following amounts:
1/31/2015 1/31/2014
Depreciation of EUR by 10 percent in TEUR
Effect on profit (after
tax) Effect on
equity
Effect on profit (after
tax) Effect on
equity
EUR–USD 3,068 3,068 2,350 2,350
EUR–CNY 1,224 1,224 1,496 1,496
It has been assumed in this analysis that all other variables, particularly interest rates, remain constant.
Sensitivity analysis for interest rate risk
Variable interest-bearing assets and liabilities that are exposed to interest rate risk are presented in the following table:
in TEUR 1/31/2015 1/31/2014
Variable interest-bearing assets 193,024 149,962
Variable interest-bearing liabilities –53,721 –51,328
Interest rate hedges (interest rate swaps) 6,500 6,500
Total 145,804 105,134
> Consolidated financial statements 2014–2015 > Notes to the consolidated financial statements
159
An increase in the market interest rate by 100 basis points as of the reporting date would have the following effect on profit and group equity:
1/31/2015 1/31/2014
Increase in market interest rate by 100 basis points, in TEUR
Effect on profit (after
tax) Effect on
equity
Effect on profit (after
tax) Effect on
equity
Variable interest-bearing assets and liabilities 1,045 1,045 740 740
Interest rate hedges (interest rate swaps) 49 49 49 49
Total 1,094 1,094 789 789
The derivative financial instruments used to hedge interest rates (interest rate swaps) transfer variable payments into fixed payments. As the variable interest rate recipient, an increase in the market interest rate of 100 basis points would result in an increase in profit and equity by the amounts presented in the above table as the fixed payments are not affected by interest rate changes.
At present, a reduction in the market interest rate by 100 basis points as of the reporting date would theoretically result in negative interest, which is precluded in the case of most investments. A lower reduction in the market interest rate would have an aliquot effect, but with a reversed plus or minus sign, on profit and on group equity.
It was assumed in this analysis that all other variables, particularly exchange rates, remain constant. The sensitivity of group equity was solely affected by profit (after tax).
Sensitivity analysis for commodity price risk
Changes in commodity prices and above all copper can have an effect on the profit of the Group. These effects are partly reduced by derivative financial instruments used to hedge commodity prices (copper price hedge). As of the reporting date, 200 tons were hedged by forward transactions. If the copper price as of the reporting date had been 20 percent lower, then the profit (after tax) from commodity derivatives would have declined by TEUR 154. An increase of 20 percent in the copper price would have improved the profit (after tax) accordingly. Equity would have been affected in the same way.
On the other hand, option contracts are entered into which cap the risk of rising commodity prices and limit participation in falling prices (zero cost collar option). A volume of 80 tons has been hedged in this way. Neither the cap nor the floor of this derivative was reached in fiscal year 2014–2015. As a result, there were no compensatory payments and profit and equity were unaffected.
161160
> C
on
solid
ated
Fin
anci
al S
tate
men
ts A
cco
rdin
g t
o IF
RS
s
> Consolidated financial statements 2014–2015 > Notes to the consolidated financial statements

160
Sensitivity analysis for market risk
The quoted securities which are subject to market risk comprise the held-for-trading and fair value option securities recognized at fair value (both through profit or loss) and the available-for-sale securities (outside of profit or loss).
A 5 percent rise in market prices would result in an increase in profit (after tax) of TEUR 567 and equity of TEUR 676. A 5 percent decline in market prices would result in a reduction in profit (after tax) and equity by the same amounts.
It was assumed in this analysis that all other variables remain constant.
(33) Segment reporting
Change in segment reporting structure
Under IFRS 8, segments must be determined and the profit or loss reported based on internal reporting (management approach). The additional geographical information for segment income from external customers must be presented based on customer location.
In the fourth quarter of 2014–2015, the internal organization, management responsibilities and reporting to the Management Board were switched to a regional structure. Under the IFRS 8 management approach, segment reporting now takes place in accordance with this new internal focus. The previous year was adjusted accordingly.
The Group is now divided into the Europe, Americas and Asia regions and the Shared Services segment. This classification corresponds to the internal organization and management structure of the Group. The segments are as follows:
Miba Europe
All consolidated production plants and trading branches of the Miba Group which are domiciled in Europe.
Miba Americas
All consolidated production plants and trading branches of the Miba Group which are domiciled in North or South America. The Miba Americas segment also includes Miba Energy Holding LLC, McConnelsville, Ohio, USA, which also serves as the North America service center in addition to its holding company function. There are currently no consolidated companies in South America.
Miba Asia
All consolidated production plants and trading branches of the Miba Group which are domiciled in Asia. This also includes Miba Asia Holding Pte. Ltd., Singapore, which serves as a holding company for the Asia region.
> Consolidated financial statements 2014–2015 > Notes to the consolidated financial statements
161
Miba Shared Services
The Miba Shared Services segment comprises all companies which serve as holding companies for or provide services to more than one region. All companies in the Miba Shared Services segment are domiciled in Europe.
The accounting policies of the reportable segments correspond to those of the Group.
Intersegment sales are transacted at standard market prices, with prices generally equating to prices used in transactions with third parties.
Miba Europe
Despite Europe’s rather subdued overall performance, the Miba Group was able to further expand its activities in this region. With its research centers in Austria, the Group performs a large part of its development work in Europe and therefore near to the headquarters of the most important OEMs and tier one suppliers. The Miba Group pursues a “local-to-local” approach in all the regions in which it operates and manufactures in close proximity to its customers. The production sites in Austria, Slovakia, the Czech Republic, Slovenia and the United Kingdom mostly supply the European market although they continue to play an important role internationally because they support the growth in the US and China.
In the past fiscal year, Miba Europe generated revenue of EUR 478.2 million which, at 71.5 percent of total revenue, makes it Miba AG’s top segment in terms of revenue. This equates to an increase of 5.2 percent compared to the previous year (EUR 454.5 million). The European sinter sites and the Austrian coatings site were the main contributors to this growth.
During the past fiscal year, Miba Europe invested EUR 29.2 million in capacity expansion as well as in new equipment and machinery (previous year: EUR 35.3 million). The Miba Sinter Slovakia s.r.o. site, for example, was expanded further. With the help of these investments, Miba Sinter Slovakia s.r.o. is becoming a center of expertise for the machining of sintered components. A strategically important project was completed for engine bearings: the separating out of the input stock production line for engine bearings into a separate partial operation at Aurachkirchen/Ohlsdorf (Upper Austria). The new site ensures that engine bearings plants across the world can be supplied with input stock even if there is an increase in demand at short notice. For power electronics, capacity was not only expanded and machinery at the sites of EBG Elektronische Bauelemente GmbH and DAU GmbH & Co KG in Styria modernized in the past fiscal year, the decision was also taken to set up a second site for the manufacturing of resistors. Not only does this improve the workflow significantly; it also ensures that sufficient space is available for further growth.
163162
> C
on
solid
ated
Fin
anci
al S
tate
men
ts A
cco
rdin
g t
o IF
RS
s
> Consolidated financial statements 2014–2015 > Notes to the consolidated financial statements

162
Miba Americas
Miba Americas – taken to mean all consolidated production sites in America – benefited from a positive market environment in North America and generated revenue of EUR 113.5 million in fiscal year 2014–2015 and thus 16.5 percent more than in 2013–2014 (previous year: EUR 97.5 million). This segment therefore contributed 17.0 percent to the Miba Group’s total revenue.
Capital expenditure in the Miba Americas segment was EUR 11.8 million (previous year: EUR 14.4 million). In the first half of 2014–2015, the expansion work at Miba Sinter USA LLC in McConnelsville, Ohio, was completed. The Miba Group doubled the production area just four years after opening the sinter plant, due in particular to the considerable potential of the North American automotive industry. Some of the investments also went into Miba HydraMechanica Corp. in Sterling Heights, Michigan, where new customer projects were being prepared.
> Consolidated financial statements 2014–2015 > Notes to the consolidated financial statements
163
Miba Asia
Despite the performances in the sales markets, which – with the exception of the passenger vehicle market in China – were at times weak, the Miba Group was able to further expand its activities in Asia. With its consolidated production sites in China and India, Miba Asia recorded revenue of EUR 77.5 million in fiscal year 2014–2015 (previous year: EUR 58.2 million). This corresponds to an increase in revenue of 33.3 percent in just one year, which is also attributable to the initial consolidation of EBG Shenzhen Ltd. as well as to the growth of Miba Precision Components (China) Co. Ltd. EBG Shenzhen Ltd. produces high-power resistors which are, for example, used in the power electronics of frequency converters and in modern medical equipment. Miba Asia therefore contributed 11.6 percent to the Miba Group’s total revenue.
Miba Asia’s capital expenditure amounted to EUR 12.9 million in fiscal year 2014–2015 (previous year: EUR 15.6 million). Investments primarily related to the completion of the building work and to the subsequent setting up of production facilities at Miba Precision Components (China) Co. Ltd.’s site in Suzhou as well as the associated increase in machinery. The trebling of the floor space also set the foundation for the production of friction materials and coatings, as well as expanding capacity for the production of engine bearings and sintered components which has been in situ since 2007. In Pune, India, expansion work started at Miba Drivetec India Pvt. Ltd., where fiber composite discs and steel counter discs are produced for tractors.
Miba Shared Services
(Intragroup) revenue in this segment was EUR 37.9 million in fiscal year 2014–2015 (previous year: EUR 25.3 million).
Capital expenditure in the Miba Shared Services segment amounted to EUR 1.3 million in fiscal year 2014–2015 (previous year: EUR 1.9 million) and concerned construction measures and IT applications.
165164
> C
on
solid
ated
Fin
anci
al S
tate
men
ts A
cco
rdin
g t
o IF
RS
s
> Consolidated financial statements 2014–2015 > Notes to the consolidated financial statements

167166
> C
on
solid
ated
Fin
anci
al S
tate
men
ts A
cco
rdin
g t
o IF
RS
s
> Consolidated financial statements 2014–2015 > Notes to the consolidated financial statements

166
Information about geographical areas in accordance with IFRS 8.33
The geographical information below shows revenue and non-current assets analyzed by country. Revenue has been analyzed in line with the geographical domicile of customers, segment assets on the basis of the geographical location of the assets.
External revenue in TEUR 2014–15 2013–14
Austria 48,048 39,481
Germany 193,996 185,401
USA 110,491 95,456
People’s Republic of China 47,830 38,705
Other 268,938 251,123
Total 669,302 610,167
Non-current assets in TEUR 1/31/2015 1/31/2014
Austria 121,028 123,537
USA 69,261 53,594
People’s Republic of China 56,302 34,230
Slovakia 56,615 56,101
Other 9,525 9,554
Consolidation –1,875 –1,628
Total 310,856 275,389
(34) Events after the reporting date
Events after the reporting date which are significant to measurement as of the reporting date, such as ongoing litigation or claims for damages and other obligations or expected losses which must be recognized or disclosed under IAS 10, have been reflected in the accompanying consolidated financial statements or are not known.
(35) Business relationships with related parties
Related entities include members of the same group; related persons include members of the Management Board and Supervisory Board and close members of their families.
Related party transactions are conducted at arm’s length.
> Consolidated financial statements 2014–2015 > Notes to the consolidated financial statements
167
Business relationships under IAS 24 with associates, unconsolidated affiliated companies and joint
ventures
in TEUR
Equity-accounted companies
Joint ventures
Unconsoli-dated
affiliated companies
Mitterbauer Beteiligungs
AG
Mitterbauer Privat-
stiftung
Amount of transactions in fiscal year 2014–15
Revenue 38 0 0 0 0
Other income 42 0 0 76 0
Other expenses –28 –662 –2,562 –790 –312
Material costs 0 –14,525 0 0 0
Tax allocation 0 0 0 –832 0
Balances outstanding as of 1/31/2015
Loans 0 3,098 71 0 0
Trade receivables 120 6 88 9 0
Trade payables –62 –897 –449 –264 0
Tax allocation liabilities 0 0 0 –832 0
Other liabilities 0 0 0 0 –49
169168
> C
on
solid
ated
Fin
anci
al S
tate
men
ts A
cco
rdin
g t
o IF
RS
s
> Consolidated financial statements 2014–2015 > Notes to the consolidated financial statements

168
in TEUR
Equity-accounted companies
Joint ventures
Unconsoli-dated
affiliated companies
Mitterbauer Beteiligungs
AG
Mitterbauer Privat-
stiftung
Amount of transactions in fiscal year 2013–14
Revenue 11 0 0 0 0
Other income 194 27 3 0 0
Other expenses 0 –569 –2,350 –582 –230
Material costs 0 –12,611 0 0 0
Interest expense 0 0 0 –102 0
Tax allocation 0 0 0 –761 0
Balances outstanding as of 1/31/2014
Loans 0 2,832 0 0 0
Trade receivables 94 0 6 0 0
Interest-bearing liabilities 0 0 0 –83 0
Trade payables 0 –1,710 –213 –698 0
Tax allocation liabilities 0 0 0 –761 0
Mitterbauer Beteiligungs-Aktiengesellschaft, Laakirchen, Austria, is the majority shareholder of Miba AG. Mitterbauer Privatstiftung, Laakirchen, Austria, is the majority shareholder of Mitterbauer Beteiligungs-Aktiengesellschaft.
In October 2014, Mitterbauer Privatstiftung and EBG Elektronische Bauelemente GmbH entered into an agreement to rent production space in Styria on arm’s length terms.
In addition, there are two lease agreements, between Mitterbauer Privatstiftung and Miba Automation Systems Ges.m.b.H and between Mitterbauer Privatstiftung and Miba Gleitlager GmbH, for the rental of production facilities and offices at the Aurachkirchen site in Upper Austria.
Business relationships under IAS 24 with members of the Management Board and
the Supervisory Board
Management Board and Supervisory Board remuneration is shown in the note on governing bodies and employees below. There are no other business relationships with the Management Board or the Supervisory Board. There are also no business relationships with close family members of this group of persons and their companies or business relationships with any companies which are subject to the control, significant influence or joint control of this group of persons.
> Consolidated financial statements 2014–2015 > Notes to the consolidated financial statements
169
(36) Disclosures on governing bodies and employees
Number of employees
The number of employees changed as follows during fiscal year 2014–2015:
1/31/2015 2014–15 1/31/2014 2013–14
Reporting date Average Reporting date Average
Wage earners 3,489 3,361 3,157 3,076
Salaried employees 1,447 1,392 1,267 1,218
Total 4,936 4,753 4,424 4,294
The number of employees for the current fiscal year 2014–2015 includes the full headcount of ABM Advanced Bearing Materials LLC, which was proportionately consolidated. As of January 31, 2015, ABM Advanced Bearing Materials LLC had 44 employees, of which 27 were wage earners and 17 were salaried employees. The average number of employees for the year was 45; 27 of these were wage earners and 18 were salaried employees.
Termination benefit expenses and direct retirement contributions
Termination benefit expenses and contributions to betriebliche Mitarbeitervorsorgekassen (Austrian occupational pension funds), and direct retirement contributions comprised the following:
2014–15 2013–14
in TEUR
Termination benefits and
contributions to betriebliche Mitarbeiter-
vorsorgekassen (Austrian
occupational pension funds)
Direct retirement
contributions
Termination benefits and
contributions to betriebliche Mitarbeiter-
vorsorgekassen (Austrian
occupational pension funds)
Direct retirement
contributions
Members of the Management Board, managing directors and executives 607 241 904 116
Other employees 1,465 2,045 1,215 1,451
Total 2,072 2,286 2,119 1,567
Pension payments to former members of the Management Board, managing directors, executives and their surviving dependents amounted to TEUR 111 (previous year: TEUR 47).
171170
> C
on
solid
ated
Fin
anci
al S
tate
men
ts A
cco
rdin
g t
o IF
RS
s
> Consolidated financial statements 2014–2015 > Notes to the consolidated financial statements

170
Members of the Management Board in the year under review:
DI F. Peter Mitterbauer, MBA: Chairman of the Management Board, regional responsibility for Miba Europe, also responsible for the New Technologies Group, Communications, Management Accounting, Human Capital, Strategy, Innovation & Technology and Internal Audit
Dr. Wolfgang Litzlbauer: Vice Chairman of the Management Board, regional responsibility for Miba Asia, also responsible for the Miba Bearing Group, the Miba Friction Group, the Miba Coating Group and Purchasing
Dr.-Ing. Harald Neubert: Regional responsibility for Miba Americas, also responsible for the Miba Sinter Group, Miba Automation Systems and Quality
MMag. Markus Hofer: Regional responsibility for Miba Shared Services, Chief Financial Officer, also responsible for Corporate Finance, IT and Business Excellence
Members of the Supervisory Board in the year under review:
Dkfm. Dkfm. Dr. Wolfgang Berndt, Seewalchen am Attersee, Austria (Chairman) Dipl.-Bw. Alfred Heinzel, Vorchdorf, Austria (Vice Chairman) DI DDr. h. c. Peter Mitterbauer, Gmunden, Austria MMag. Peter Oswald, Vienna, Austria, since June 27, 2014 Dr. Robert Büchlhofer, Starnberg, Germany, until June 27, 2014 Hermann Aigner, Vorchdorf, Austria (delegated by the Works Council) Johann Forstner, Pinsdorf, Austria (delegated by the Works Council)
Management Board and Supervisory Board remuneration
The objective of the Management Board remuneration system is to provide remuneration to members of the Management Board which is appropriate in terms of their duties and areas of responsibility as well as competitive both nationally and internationally. A significant component of this is the highly variable portion for those members of the Management Board with operational responsibilities which takes account of the Company’s performance. The annual bonus is a variable cash payment, the amount of which is made up of individual targets and earnings-oriented targets.
In addition, long-term oriented remuneration components were agreed for members of the Management Board.
Management Board members have individual pension arrangements under which the Company pays predetermined amounts to the Management Board members. For one member of the Management Board, an incentive agreement which focuses on the long term was entered into in January 2015; however, this did not yet have an effect on remuneration in the past fiscal year.
The former Chairman of the Management Board also has a pension arrangement which provides for a fixed, guaranteed level of pension. This obligation is covered by pension liabilities insurance.
> Consolidated financial statements 2014–2015 > Notes to the consolidated financial statements
171
Management Board remuneration during the fiscal year was TEUR 2,767 (previous year: TEUR 2,423), which was attributable to:
in TEUR 1/31/2015 1/31/2014
Short-term benefits payable to members of the Management Board 1,577 1,480
Post-employment benefits 231 345
Other long-term benefits payable to members of the Management Board 959 598
Total 2,767 2,423
Post-employment benefits include direct retirement contributions for members of the Management Board in the amount of TEUR 89 (previous year: TEUR 57).
Remuneration paid to a former member of the Management Board and current member of the Supervisory Board amounted to TEUR 45 (previous year: TEUR 25).
In the past fiscal year, remuneration totaling TEUR 95 (previous year: TEUR 93) was paid to members of the Supervisory Board for their services.
(37) Earnings per share
Under IAS 33 (earnings per share), basic earnings per share are calculated by dividing the profit or loss for the period attributable to ordinary equity holders (consolidated net income for the year) by the weighted average number of ordinary shares outstanding during the period. Preferred shares are not counted as ordinary shares. Since earnings per preferred share in the periods shown equate to earnings per ordinary share, the calculation is presented in one table.
The holders of preferred shares receive a preference dividend from the net retained profit of each fiscal year equating to 8 percent of the part of share capital which is attributable to the preferred shares (this being calculated by dividing share capital by the number of no-par value shares and then multiplying the result by the number of preferred shares). The Annual General Meeting decides on the appropriation of the remaining net retained profit between ordinary shares and preferred shares.
Category A preferred shares which could be converted into ordinary shares upon relinquishment of preferential rights must not be taken into account when calculating diluted earnings per share, as conversion would not have a dilutive effect.
173172
> C
on
solid
ated
Fin
anci
al S
tate
men
ts A
cco
rdin
g t
o IF
RS
s
> Consolidated financial statements 2014–2015 > Notes to the consolidated financial statements

DI F. Peter Mitterbauer, MBAChairman of the Management Board,regional responsibility for Miba Europe,also responsible for the New Technologies Group, Communications, Management Accounting, Human Capital, Strategy, Innovation & Technology and Internal Audit
Dr.-Ing. Harald NeubertMember of the Management Board,regional responsibility for Miba Americas,also responsible for the Miba Sinter Group, MibaAutomation Systems and Quality
MMag. Markus HoferMember of the Management Board, ChiefFinancial Officer, Miba Shared Services,also responsible for Corporate Finance, IT and Business Excellence
Dr. Wolfgang LitzlbauerVice Chairman of the Management Board,regional responsibility for Miba Asia,also responsible for the Miba Bearing Group, the Miba Friction Group, the Miba Coating Group and Purchasing
Laakirchen on April 30, 2015The Management Board of Miba AG
Approval by the Management Board
We confirm to the best of our knowledge that the consolidated financial statements give a true and fair view ofthe assets, liabilities, financial position and profit or loss of the Group as required by the applicable accountingstandards and that the group management report gives a true and fair view of the development andperformance of the business and the position of the Group, together with a description of the principal risksand uncertainties the Group faces.
The Management Board of Miba AG approved the consolidated financial statements for submission to theSupervisory Board on April 30, 2015.
Appendix 1 to the notes: Investees
175174
> C
on
solid
ated
Fin
anci
al S
tate
men
ts A
cco
rdin
g t
o IF
RS
s
> Consolidated financial statements 2014–2015 > Notes to the consolidated financial statements

174
Appendix 1/1
Overall, equity interests were held in 51 companies. Of these, 11 companies have not been included in the consolidated financial statements on grounds of immateriality. The following list contains the parent company, 37 consolidated subsidiaries, 1 proportionately consolidated company, 2 associates as well as 9 unconsolidated subsidiaries and 2 associates not accounted for under the equity method:
Company Company domicile
Nominal capital in thousand Currency
Direct and
indirect holding
%
Type of consoli-
dation
Affiliated company
Miba Aktiengesellschaft Laakirchen, AUT 9,500 EUR C
Miba Shared Services
Miba Sinter Holding GmbH Laakirchen, AUT 35 EUR 100.00 C
Miba Sinter Holding GmbH & Co KG Laakirchen, AUT 110 EUR 100.00 C
Miba Friction Holding GmbH Laakirchen, AUT 35 EUR 100.00 C
Miba Energy Holding GmbH Laakirchen, AUT 35 EUR 100.00 C
Miba Energy Holding GmbH & Co KG Laakirchen, AUT 10 EUR 49.00 C
Direct and indirect equity interests have been calculated from a Group perspective.
Investees as of January 31, 2015
C = consolidation
> Consolidated financial statements 2014–2015 > Appendices – Investees
175
Appendix 1/2
Company Company domicile
Nominal capital in thousand Currency
Direct and
indirect holding
%
Type of consoli-
dation
Miba Europe
Miba Sinter Austria GmbH Laakirchen, AUT 8,400 EUR 100.00 C
Miba Sinter Slovakia s.r.o. Dolný Kubín, SVK 3,699 EUR 100.00 C
Miba Deutschland GmbH Stuttgart, DEU 26 EUR 100.00 NC
Miba France SARL Paris, FRA 20 EUR 100.00 NC
Miba Italia S.r.l. Turin, ITA 20 EUR 100.00 NC
Miba Gleitlager GmbH Laakirchen, AUT 8,750 EUR 100.00 C
Miba Bearings Materials GmbH Laakirchen, AUT 35 EUR 100.00 NC
Miba Bearings Austria GmbH Laakirchen, AUT 35 EUR 100.00 NC
Miba Frictec GmbH Laakirchen, AUT 40 EUR 100.00 C
Miba Steeltec s.r.o. Vráble, SVK 5,163 EUR 100.00 C
Fibertec Steti s.r.o. Štětí, CZE 200 CZK 100.00 C
High Tech Coatings GmbH Laakirchen, AUT 1,000 EUR 50.10 C
Teer Coatings Ltd. Droitwich, GBR 1 GBP 100.00 C
EBG Elektronische Bauelemente GmbH Laakirchen, AUT 364 EUR 49.00 C
DAU GmbH & Co KG Laakirchen, AUT 291 EUR 49.00 C
Dau GmbH Laakirchen, AUT 36 EUR 49.00 C
EBG & DAU Kühlerentwicklung GmbH Laakirchen, AUT 40 EUR 49.00 C
EDMS d.o.o.1 Šentjernej, SVN 13 EUR 24.01 C
Miba Automation Systems Ges.m.b.H. Laakirchen, AUT 45 EUR 100.00 C
Miba Kantinen GmbH1 Laakirchen, AUT 116 EUR 100.00 NC
Miba China Holding GmbH Laakirchen, AUT 4,706 EUR 94.96 C
Direct and indirect equity interests have been calculated from a Group perspective.
C = consolidation
NC = not consolidated 1 Reporting date: December 31, 2014
177176
> C
on
solid
ated
Fin
anci
al S
tate
men
ts A
cco
rdin
g t
o IF
RS
s
> Consolidated financial statements 2014–2015 > Appendices – Investees

176
Appendix 1/3
Company Company domicile
Nominal capital in thousand Currency
Direct and
indirect holding
%
Type of consoli-
dation
Miba Americas
Miba Sinter USA LLC McConnelsville,
Ohio, USA 12,000 USD 100.00 C
Miba Sinter Sales Corp. McConnelsville,
Ohio, USA 10 USD 100.00 C
Metalaxis Precision Machining LLC
McConnelsville, Ohio, USA 1 USD 100.00 C
Mahle Metal Leve Miba Sinterizados Ltda.1 São Paulo, BRA 100 BRL 40.00 EM
Miba Bearings US LLC McConnelsville,
Ohio, USA 29,000 USD 100.00 C
Miba Bearings Sales Corp. McConnelsville,
Ohio, USA 10 USD 100.00 C
ABM Advanced Bearing Materials LLC1
Greensburg, Indiana, USA 4,540 USD 50.00 PC
Miba HydraMechanica Corp. Sterling Heights,
Michigan, USA 8,284 USD 100.00 C
Miba Energy Holding LLC McConnelsville,
Ohio, USA 100 USD 49.00 C
EBG Resistors LLC Middletown,
Pennsylvania, USA 40 USD 34.30 C
EBG LLC Middletown,
Pennsylvania, USA 10 USD 49.00 C
DAU Thermal Solutions North America Inc.
Middletown, Pennsylvania, USA 10 USD 49.00 C
Direct and indirect equity interests have been calculated from a Group perspective.
C = consolidation
PC = proportionate consolidation
EM = equity method 1 Reporting date: December 31, 2014
> Consolidated financial statements 2014–2015 > Appendices – Investees
177
Appendix 1/4
Company Company domicile
Nominal capital in thousand Currency
Direct and
indirect holding
%
Type of consoli-
dation
Miba Asia
Miba Precision Components (China) Co. Ltd.1
Suzhou, Industrial Park, CHN 115,802 CNY 94.96 C
Miba Engineering Center India Pvt. Ltd. Pune, IND 100 INR 94.96 NC
Sintercom India Pvt. Ltd.2 Pune, IND 191,868 INR 26.00 EM
Miba Far East Pte. Ltd. Singapore, SGP 1,075 SGD 100.00 C
Miba Drivetec India Pvt. Ltd. Pune, IND 20,002 INR 100.00 C
Miba Coatings Trading (Suzhou) Ltd.1
Suzhou, Industrial Park, CHN 349 CNY 50.10 C
Dong Guang ART – Teer Coating Techn. Co. Ltd.1 Hong Kong, CHN 1,500 HKD 35.00 NC
Hangzhou Hui – Teer Surface Advanced Coatings Ltd.1 Linan, CHN 10,321 CNY 41.00 NC
EBG Shenzhen Ltd.1 Shenzhen, CHN 10,860 CNY 40.74 C
Shenzhen Rui Xi Si Te Industry Co. Ltd.1 Shenzhen, CHN 3,000 CNY 94.96 NC
Miba Asia Holding Pte. Ltd. Singapore, SGP 0 SGD 94.96 C
Direct and indirect equity interests have been calculated from a Group perspective.
C = consolidation
EM = equity method
NC = not consolidated 1 Reporting date: December 31, 2014 2 Reporting date: March 31, 2015
179178
> C
on
solid
ated
Fin
anci
al S
tate
men
ts A
cco
rdin
g t
o IF
RS
s
> Consolidated financial statements 2014–2015 > Appendices – Investees

178
Appendix 1/5
Overall, equity interests were held in 47 companies. Of these, 7 companies have not been included in the consolidated financial statements on grounds of immateriality. The following list contains the parent company, 35 consolidated subsidiaries, 5 associates as well as 4 unconsolidated subsidiaries and 3 associates not accounted for under the equity method:
Company Company domicile
Nominal capital in thousand Currency
Direct and
indirect holding
%
Type of consoli-
dation
Affiliated company
Miba Aktiengesellschaft Laakirchen, AUT 9,500 EUR C
Miba Shared Services
Miba Sinter Holding GmbH Laakirchen, AUT 35 EUR 100.00 C
Miba Sinter Holding GmbH & Co KG Laakirchen, AUT 110 EUR 100.00 C
Miba Friction Holding GmbH Laakirchen, AUT 35 EUR 100.00 C
Miba Energy Holding GmbH Laakirchen, AUT 35 EUR 100.00 C
Miba Energy Holding GmbH & Co KG Laakirchen, AUT 10 EUR 49.00 C
Direct and indirect equity interests have been calculated from a Group perspective.
Investees as of January 31, 2014
C = consolidation
> Consolidated financial statements 2014–2015 > Appendices – Investees
179
Appendix 1/6
Company Company domicile
Nominal capital in thousand Currency
Direct and
indirect holding
%
Type of consoli-
dation
Miba Europe
Miba Sinter Austria GmbH Laakirchen, AUT 8,400 EUR 100.00 C
Miba Sinter Slovakia s.r.o. Dolný Kubín, SVK 3,699 EUR 100.00 C
Miba Deutschland GmbH Stuttgart, DEU 26 EUR 100.00 NC
Miba France SARL Paris, FRA 20 EUR 100.00 NC
Miba Italia S.r.l. Turin, ITA 20 EUR 100.00 NC
Miba Gleitlager GmbH Laakirchen, AUT 8,750 EUR 100.00 C
Miba Frictec GmbH Laakirchen, AUT 40 EUR 100.00 C
Miba Steeltec s.r.o. Vráble, SVK 5,163 EUR 100.00 C
Fibertec Steti s.r.o. Štětí, CZE 200 CZK 100.00 C
High Tech Coatings GmbH Laakirchen, AUT 1,000 EUR 50.10 C
Teer Coatings Ltd. Droitwich, GBR 1 GBP 100.00 C
EBG Elektronische Bauelemente GmbH Laakirchen, AUT 364 EUR 49.00 C
DAU GmbH & Co KG Laakirchen, AUT 291 EUR 49.00 C
Dau GmbH Laakirchen, AUT 36 EUR 49.00 C
EBG & DAU Kühlerentwicklung GmbH Laakirchen, AUT 40 EUR 49.00 C
EDMS d.o.o.1 Šentjernej, SVN 13 EUR 24.01 EM
Miba Automation Systems Ges.m.b.H. Laakirchen, AUT 45 EUR 100.00 C
Miba Kantinen GmbH1 Laakirchen, AUT 116 EUR 100.00 NC
Miba China Holding GmbH Laakirchen, AUT 4,000 EUR 100.00 C
Direct and indirect equity interests have been calculated from a Group perspective.
C = consolidation
EM = equity method
NC = not consolidated 1 Reporting date: December 31, 2013
181180
> C
on
solid
ated
Fin
anci
al S
tate
men
ts A
cco
rdin
g t
o IF
RS
s
> Consolidated financial statements 2014–2015 > Appendices – Investees

180
Appendix 1/7
Company Company domicile
Nominal capital in thousand Currency
Direct and
indirect holding
%
Type of consoli-
dation
Miba Americas
Miba Sinter USA LLC McConnelsville,
Ohio, USA 12,000 USD 100.00 C
Miba Sinter Sales Corp. McConnelsville,
Ohio, USA 10 USD 100.00 C
Metalaxis Precision Machining LLC
McConnelsville, Ohio, USA 1 USD 100.00 C
Mahle Metal Leve Miba Sinterizados Ltda.1 São Paulo, BRA 100 BRL 40.00 EM
Miba Bearings US LLC McConnelsville,
Ohio, USA 29,000 USD 100.00 C
Miba Bearings Sales Corp. McConnelsville,
Ohio, USA 10 USD 100.00 C
ABM Advanced Bearing Materials LLC1
Greensburg, Indiana, USA 4,540 USD 50.00 EM
Miba HydraMechanica Corp. Sterling Heights,
Michigan, USA 8,284 USD 100.00 C
Miba Energy Holding LLC McConnelsville,
Ohio, USA 100 USD 49.00 C
EBG Resistors LLC Middletown,
Pennsylvania, USA 40 USD 34.30 C
EBG LLC Middletown,
Pennsylvania, USA 10 USD 34.30 C
DAU Thermal Solutions North America Inc.
Middletown, Pennsylvania, USA 10 USD 49.00 C
Direct and indirect equity interests have been calculated from a Group perspective.
C = consolidation
EM = equity method 1 Reporting date: December 31, 2013
> Consolidated financial statements 2014–2015 > Appendices – Investees
181
Appendix 1/8
Company Company domicile
Nominal capital in thousand Currency
Direct and
indirect holding
%
Type of consoli-
dation
Miba Asia
Miba Precision Components (China) Co. Ltd.1
Suzhou, Industrial Park, CHN 115,802 CNY 100.00 C
Sintercom India Pvt. Ltd.2 Pune, IND 191,868 INR 26.00 EM
Miba Far East Pte. Ltd. Singapore, SGP 1,075 SGD 100.00 C
Miba Drivetec India Pvt. Ltd. Pune, IND 20,002 INR 100.00 C
Miba Coatings Trading (Suzhou) Ltd.1
Suzhou, Industrial Park, CHN 349 CNY 50.10 C
Dong Guang ART – Teer Coating Techn. Co. Ltd.1 Hong Kong, CHN 1,500 HKD 35.00 NC
Hangzhou Hui – Teer Surface Advanced Coatings Ltd.1 Linan, CHN 10,321 CNY 41.00 NC
Zhejiang Huijin - Teer Coatings Techn. Co. Ltd.1 Linan, CHN 12,000 USD 25.00 NC
EBG Shenzhen Ltd.1, 3 Shenzhen, CHN 10,860 CNY 8.58 EM
Direct and indirect equity interests have been calculated from a Group perspective.
C = consolidation
EM = equity method
NC = not consolidated 1 Reporting date: December 31, 2013 2 Reporting date: March 31, 2014 3 25 percent of voting rights
183182
> C
on
solid
ated
Fin
anci
al S
tate
men
ts A
cco
rdin
g t
o IF
RS
s
> Consolidated financial statements 2014–2015 > Appendices – Investees

182
We have audited the accompanying consolidated financial statements of Miba Aktiengesellschaft, Laakirchen,
Austria, for the fiscal year from February 1, 2014, to January 31, 2015. These consolidated financial statements comprise the consolidated balance sheet as of January 31, 2015, the consolidated income statement, the consolidated statement of comprehensive income, the consolidated cash flow statement and the consolidated statement of changes in equity for the fiscal year ended January 31, 2015, as well as the notes to the consolidated financial statements.
Management’s responsibility for the consolidated financial statements and for the accounting system
The Company’s management is responsible for the group accounting system and for the preparation and fair presentation of the consolidated financial statements in accordance with International Financial Reporting Standards (IFRSs) as adopted by the EU. This responsibility includes: Designing, implementing and maintaining internal control relevant to the preparation and fair presentation of consolidated financial statements that are free from material misstatement, whether due to fraud or error; selecting and applying appropriate accounting policies; making accounting estimates that are reasonable in the circumstances.
Auditor’s responsibility and description of type and scope of the statutory audit
Our responsibility is to express an opinion on these consolidated financial statements based on our audit. We conducted our audit in accordance with laws and regulations applicable in Austria and with the International Standards on Auditing (ISAs) issued by the International Auditing and Assurance Standards Board (IAASB) of the International Federation of Accountants (IFAC). Those standards require that we comply with professional guidelines and that we plan and perform the audit to obtain reasonable assurance whether the consolidated financial statements are free from material misstatement.
An audit involves performing procedures to obtain audit evidence about the amounts and disclosures in the consolidated financial statements. The procedures selected depend on the auditor’s judgment, including the assessment of the risks of material misstatement of the consolidated financial statements, whether due to fraud or error. In making those risk assessments, the auditor considers internal control relevant to the Group’s preparation and fair presentation of the consolidated financial statements in order to design audit procedures that are appropriate in the circumstances, but not for the purpose of expressing an opinion on the effectiveness of the Group’s internal control. An audit also includes evaluating the appropriateness of accounting policies used and the reasonableness of accounting estimates made by management, as well as evaluating the overall presentation of the consolidated financial statements.
Auditor’s report REPORT ON THE CONSOLIDATED FINANCIAL STATEMENTS
> Consolidated financial statements 2014–2015 > Auditor’s report
183
We believe that the audit evidence we have obtained is sufficient and appropriate to provide a reasonable basis for our audit opinion.
Opinion
Our audit did not give rise to any objections. In our opinion, which is based on the results of our audit, the consolidated financial statements comply with legal requirements and give a true and fair view of the financial position of the Group as of January 31, 2015, and of its financial performance and its cash flows for the fiscal year from February 1, 2014, to January 31, 2015, in accordance with International Financial Reporting Standards (IFRSs) as adopted by the EU.
Comments on the management report for the Group
Pursuant to statutory provisions, the management report for the Group is to be audited as to whether it is consistent with the consolidated financial statements and as to whether the other disclosures are not misleading with respect to the Group’s position. The auditor’s report also has to contain a statement as to whether the management report for the Group is consistent with the consolidated financial statements and whether the disclosures pursuant to section 243a of the Austrian Commercial Code (UGB) are appropriate.
In our opinion, the management report for the Group is consistent with the consolidated financial statements. The disclosures pursuant to section 243a of the Austrian Commercial Code (UGB) are appropriate.
Linz, on April 30, 2015
KPMG Austria GmbH Wirtschaftsprüfungs- und Steuerberatungsgesellschaft
Mag. Cäcilia Gruber
Austrian Certified Public Accountant
Mag. Peter Humer
Austrian Certified Public Accountant
185184
> C
on
solid
ated
Fin
anci
al S
tate
men
ts A
cco
rdin
g t
o IF
RS
s
> Consolidated financial statements 2014–2015 > Auditor‘s report

184
During the past fiscal year, the Supervisory Board performed the duties required of it under Austrian law and the Articles of Incorporation. Good cooperation within the Supervisory Board, the availability of high-quality information and compliance with the Austrian Code of Corporate Governance constitute the framework for advising the Management Board on a regular basis on important points that are relevant to the development of the business, as well as for the careful monitoring of the activity of the Management Board.
The Management Board provided the Supervisory Board with written and oral regular, timely and comprehensive information on all relevant questions concerning the development of the business, including the risk position and risk management in the Company and the material Group companies. Agreement of the Supervisory Board was obtained for those transactions where such agreement was necessary under the provisions of the Articles of Incorporation.
Five Supervisory Board meetings were held during the fiscal year. No Supervisory Board member attended fewer than half of the meetings.
In open discussions at the Supervisory Board meetings, the members of the Management Board and the Supervisory Board came to a consensus on essential questions, particularly in relation to the strategic direction of the Company. The Management Board and the Chairman of the Supervisory Board also regularly discussed specific current topics.
The Supervisory Board set up two subcommittees: The Audit Committee discharges the legal duties in relation to the monitoring of the accounting function and the examination and preparation of the adoption of the annual financial statements, the proposal for the appropriation of profit and the management report, as well as the examination and preparation of the adoption of the consolidated financial statements and the Group management report. The Remuneration Committee deals with the content of the contracts of employment of the members of the Management Board and with remuneration matters. The Audit Committee met twice during the past year; the Remuneration Committee held four meetings.
The annual financial statements including notes and management report as well as the consolidated annual financial statements including notes and management report were audited by KPMG Austria GmbH, Linz, Austria. The final audit findings did not give rise to any objections and unqualified auditor’s reports were issued for the respective annual financial statements.
Audit firm representatives participated in the Audit Committee meeting and in the meeting of the Supervisory Board which dealt with the annual financial statements, and provided explanations.
Report of the Supervisory Board of Miba Aktiengesellschaft
> Consolidated financial statements 2014–2015 > Supervisory Board report
185
The Supervisory Board approved the annual financial statements, which are thereby deemed to have been adopted in accordance with section 96(4) of the Austrian Stock Corporation Act (AktG). The management report, consolidated financial statements, Group management report and corporate governance report were approved after due examination. On completing its own examination, the Supervisory Board agreed with the Management Board’s proposed profit appropriation.
The Supervisory Board would like to take this opportunity to acknowledge and thank the Management Board and all employees for their personal commitment and dedication to the work carried out during this challenging fiscal year.
Laakirchen, April 2015
Dr. Wolfgang Berndt Chairman
187186
> C
on
solid
ated
Fin
anci
al S
tate
men
ts A
cco
rdin
g t
o IF
RS
s
> Consolidated financial statements 2014–2015 > Supervisory Board report

Publisher
Miba AktiengesellschaftDr.-Mitterbauer-Strasse 34663 Laakirchen, Austriawww.miba.com
Editor
Miba Aktiengesellschaft, Laakirchen, Austria
Image sources
Miba Aktiengesellschaft, Laakirchen, AustriaDaniele Mattioli, Suzhou, ChinaChristian Schneider, Salzburg, AustriaFlorian Stöllinger, Gallneukirchen, AustriaEric Wagner, Columbus, OH USA
Design & layout
SPS MARKETING GmbH, Linz, Austria
Financial reporting system
This annual report was produced in-house with FIRE.sys. Translation & language services
Austria Sprachendienst International, Vienna, Austria
Printing
Vorarlberger Verlagsanstalt GmbH, Dornbirn, Austria
Editorial details
Please note:
This annual report includes statements concerning the future that are based on Miba AG‘s current estimates and assumptions made to the best of its knowledge. Disclosures using the words “shall”, “may”, “will”, “expects”, “assumes”, “plans”, “intends” or similar formulations are indicative of such statements concerning the future. Forecasts relating to Miba AG‘s future performance are estimates that have been arrived at based on the information available at the point in time when this annual report was printed. If the assumptions underlying the forecasts do not materialize or if risks do not occur at the level calculated, then actual results may deviate from forecasts. Rounding differences may arise when adding rounded amounts and percentages. The annual report has been prepared with the utmost care to ensure the accuracy and completeness of all disclosures. Rounding, typesetting and printing errors cannot, however, be entirely ruled out.
Press Conference on Fiscal Year 2014–2015, Vienna, Austria May 6, 2015
First-Quarter Results for 2015–2016 June 3, 2015
29th Annual General Meeting, Laakirchen, Austria June 25, 2015
Ex-Dividend Date July 3, 2015
Half-Year Results for 2015–2016 September 2, 2015
First-to-Third-Quarter Results for 2015–2016 December 2, 2015
Financial calendar 2015–2016
188
