ovs · ovs group – annual report at 31 january 2015 pg. 5 ovs s.r.l. was also transformed into a...
TRANSCRIPT

OVS Group – Annual Report at 31 January 2015 pg. 1
OVS
ANNUAL REPORT FOR FINANCIAL YEAR 2014
OVS S.p.A.
Registered office: 17, Via Terraglio, Mestre, Venice
Reg. no. with Venice Companies Register, VAT and Tax code: 04240010274
Share capital: €227,000,000, fully paid in
Corporate website: www.ovscorporate.it

OVS Group – Annual Report at 31 January 2015 pg. 2
CORPORATE OFFICERS
Board of Directors Nicholas Stathopoulos Chairman Stefano Beraldo Chief Executive Officer and General Manager Gabriele Del Torchio Director Stefano Ferraresi Director Lori Hall-Kim Director Heinz Jürgen Krogner-Kornalik Director Jerome Pierre Losson Director Board of Statutory Auditors Giuseppe Moretti Chairman
Roberto Cortellazzo Wiel Standing Auditor Lucio Giulio Ricci Standing Auditor Lorenzo Boer Alternate Auditor Stefano Lenoci Alternate Auditor External auditor PricewaterhouseCoopers S.p.A. Director responsible for preparing the corporate accounting statements
Nicola Perin
OVS Group – Annual Report at 31 January 2015 pg. 3
Contents
OVS Pg.
Report on Operations 4
Consolidated financial statements at 31 January 2015 31
Notes to the consolidated statement of financial position 66
Notes to the consolidated income statement 93
Relations with related parties 100
Appendices to the consolidated financial statements 106
Separate financial statements of OVS S.p.A. at 31 January 2015 110
Notes to the statement of financial position 140
Notes to the income statement 169
Relations with related parties 176
Appendices to the separate financial statements 182
OVS Group – Annual Report at 31 January 2015 pg. 4
OVS
Board of Directors' Report
on Operations for the year ended
31 January 2015
(financial year 2014)
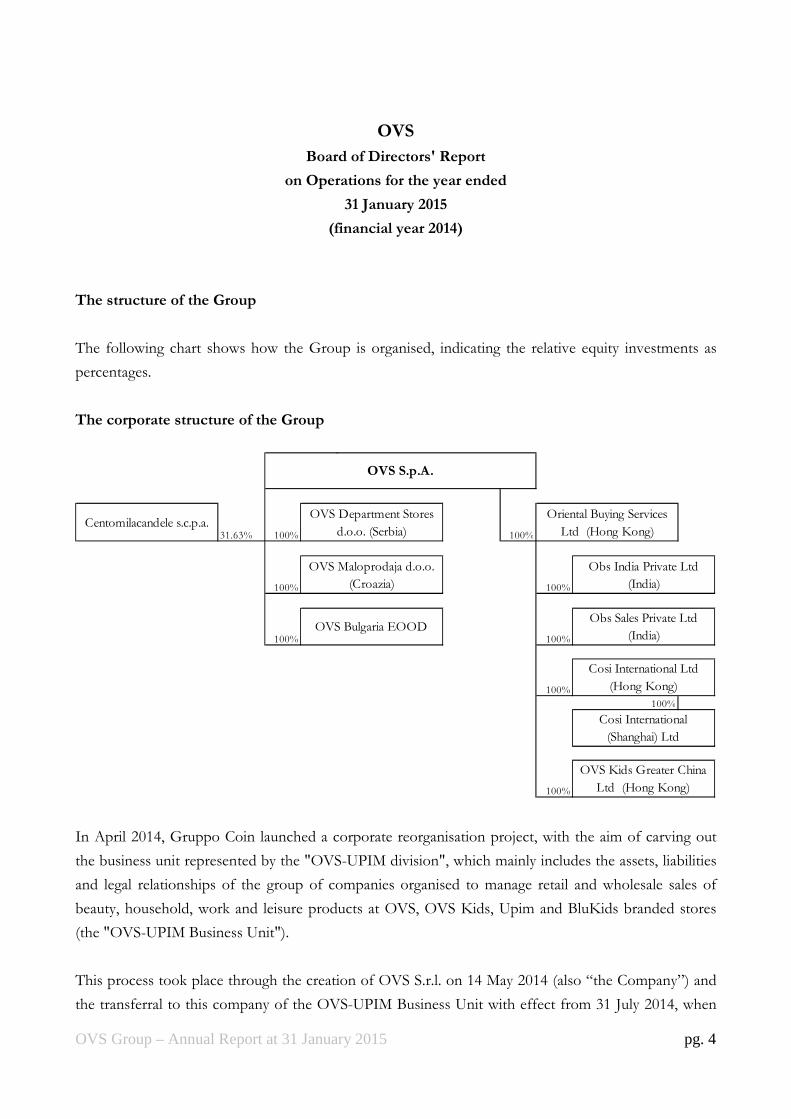
The structure of the Group
The following chart shows how the Group is organised, indicating the relative equity investments as
percentages.
The corporate structure of the Group
31.63% 100% 100%
100% 100%
100% 100%
100%
100%
100%
OVS S.p.A.
OVS Bulgaria EOOD
OVS Maloprodaja d.o.o.
(Croazia)
OVS Kids Greater China
Ltd (Hong Kong)
Centomilacandele s.c.p.a.OVS Department Stores
d.o.o. (Serbia)
Oriental Buying Services
Ltd (Hong Kong)
Cosi International Ltd
(Hong Kong)
Obs Sales Private Ltd
(India)
Obs India Private Ltd
(India)
Cosi International
(Shanghai) Ltd
In April 2014, Gruppo Coin launched a corporate reorganisation project, with the aim of carving out
the business unit represented by the "OVS-UPIM division", which mainly includes the assets, liabilities
and legal relationships of the group of companies organised to manage retail and wholesale sales of
beauty, household, work and leisure products at OVS, OVS Kids, Upim and BluKids branded stores
(the "OVS-UPIM Business Unit").
This process took place through the creation of OVS S.r.l. on 14 May 2014 (also “the Company”) and
the transferral to this company of the OVS-UPIM Business Unit with effect from 31 July 2014, when
OVS Group – Annual Report at 31 January 2015 pg. 5
OVS S.r.l. was also transformed into a limited company.
On 10 February 2015, Borsa Italiana approved the admission to trading on the MTA, organized and
managed by Borsa Italiana S.p.A. of ordinary shares of OVS S.p.A., and on 11 February 2015, Consob
approved the Prospectus for the offer for sale and subscription. 2 March 2015 was the first day of
trading in the Company's shares on the MTA. The operation entailed a capital increase of €87,000,000,
taking the share capital from €140,000,000 to €227,000,000, divided into 227,000,000 ordinary shares
with no par value.
Introduction
As a result of the corporate operations described above and in view of the fact that the Company was
created on 14 May 2014 and became operational in the final instant of 31 July 2014, the information on
assets and liabilities, results and cash flows shown in the consolidated financial statements relate to the
period of effective operation of the Company, i.e., from 1 August 2014 to 31 January 2015 and
comparative figures are not shown.
In the Report on Operations, in order to provide for the financial year ended 31 January 2015,
information relating to a 12-month period that could be used for comparison with carve out figures of
OVS-UPIM Business Unit related to financial year 2013, thereby allowing for a critical analysis of
Group's performance in terms of assets and liabilities, results and cash flows in the periods under
review, the following are shown:
• an income statement and a restated statement of cash flows for the period from 1 February
2014 to 31 January 2015, derived by aggregating the consolidated information from the carve-
out of the OVS-UPIM Business Unit for the period from 1 February 2014 to 31 July 2015
(information represented in the Prospectus prepared in the Global Offering of ordinary
shares OVS S.p.A. for the listing of these shares on the MTA organized and managed by
Borsa Italiana SpA the "Prospectus") with the consolidated financial information of OVS
Group for the period from 1 August 2014 to 31 January 2015;
• an income statement and a restated statement of cash flows for the period from 1 February
2013 to 31 January 2014, derived from the consolidated information from the carve-out of
the OVS-Upim Business Unit as reported in the Prospectus for the offer for sale or
subscription;
• the statement of financial position of OVS Group at 31 January 2015, compared with
comparative carve-out figures at 31 January 2014 as reported in the Prospectus for the offer
for sale or subscription.
OVS Group – Annual Report at 31 January 2015 pg. 6
However, it should be noted that if the companies in question had actually operated as a single group in
the period in question, the performance recorded through aggregation of assets and liabilities, profit
and cash flows might not necessarily have been achieved.
Macroeconomic context and main actions undertaken by the Group
2014 proved to be a year of crisis for Italy. Although the crisis still had an international dimension, the
Euro area - and, more specifically, the Mediterranean countries - remained at the epicentre of the
recessionary cycle. GDP contracted by 0.4%, while household consumption gave no signs of recovery,
after a steep decline in the previous two years. Generally speaking, the context remained heavily
influenced by uncertainty and market volatility, although increased political stability allowed for the
launch of a process of structural reform to boost the country's economy in the second part of the year.
In addition, in the final months of the year, a series of factors and macroeconomic initiatives combined,
including (i) the European Central Bank's announcement of the launch of expansive monetary policy
through quantitative easing, which strengthened the dollar, and (ii) falling oil prices, which have laid the
foundations for a potential upturn in consumption from 2015.
Looking at the Group's core market, we can see that the clothing market contracted by 2.9% (source:
Sitaricerca, for the period January – December 2014); the decline was even greater (3.5%) for the
specific portion of the market on which the Group's brands are focused, i.e., excluding the luxury
goods and technical sportswear segments.
It should be noted that the autumn weather was once again particularly mild and dry this year, with the
warmest average temperatures in October and November for the past 200 years, with the result that
sales of the winter collection were much slower to take off.
Despite this persistently difficult environment, the Group achieved a very positive performance, with
sales of €1,227.4 million, up 8% on the previous year, and further strengthened its leadership position
in Italy, where it increased its market share from 5.84% to 6.39% (source: Sitaricerca, for the period
January – December 2014). The Groups profits also grew strongly: EBITDA, net of non recurring
items, increased from €131.5 million in 2013 to €157.1 million in 2014. This was the result of a number
of measures taken by management to improve commercial performance and streamline corporate
processes, including the following:
1) Positioning – The Group is benefiting, in both its OVS and Upim formats, not only from a
growing shift in market demand towards "value" products, but also from a structural trend of
consolidation in organised distribution. This has meant a steady increase in its market share in
recent years, to 61% in 2014 (from 54% five years ago), mainly to the detriment of independent
OVS Group – Annual Report at 31 January 2015 pg. 7
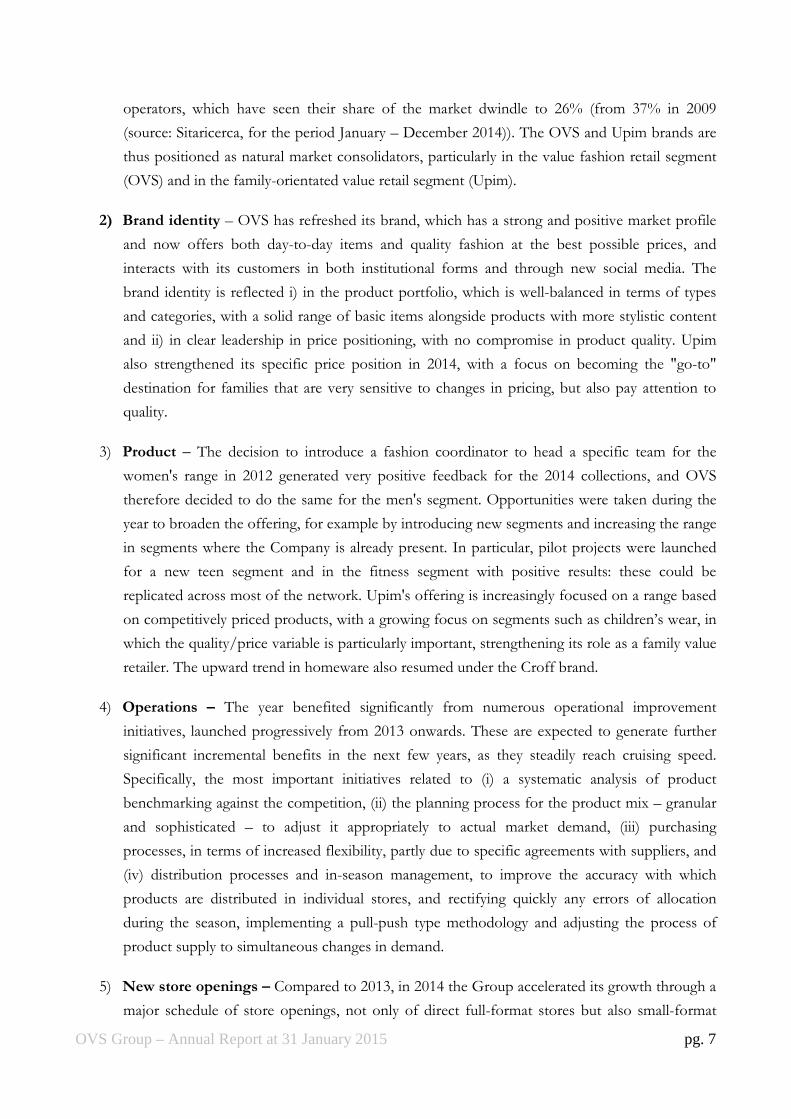
operators, which have seen their share of the market dwindle to 26% (from 37% in 2009
(source: Sitaricerca, for the period January – December 2014)). The OVS and Upim brands are
thus positioned as natural market consolidators, particularly in the value fashion retail segment
(OVS) and in the family-orientated value retail segment (Upim).
2) Brand identity – OVS has refreshed its brand, which has a strong and positive market profile
and now offers both day-to-day items and quality fashion at the best possible prices, and
interacts with its customers in both institutional forms and through new social media. The
brand identity is reflected i) in the product portfolio, which is well-balanced in terms of types
and categories, with a solid range of basic items alongside products with more stylistic content
and ii) in clear leadership in price positioning, with no compromise in product quality. Upim
also strengthened its specific price position in 2014, with a focus on becoming the "go-to"
destination for families that are very sensitive to changes in pricing, but also pay attention to
quality.
3) Product – The decision to introduce a fashion coordinator to head a specific team for the
women's range in 2012 generated very positive feedback for the 2014 collections, and OVS
therefore decided to do the same for the men's segment. Opportunities were taken during the
year to broaden the offering, for example by introducing new segments and increasing the range
in segments where the Company is already present. In particular, pilot projects were launched
for a new teen segment and in the fitness segment with positive results: these could be
replicated across most of the network. Upim's offering is increasingly focused on a range based
on competitively priced products, with a growing focus on segments such as children’s wear, in
which the quality/price variable is particularly important, strengthening its role as a family value
retailer. The upward trend in homeware also resumed under the Croff brand.
4) Operations – The year benefited significantly from numerous operational improvement
initiatives, launched progressively from 2013 onwards. These are expected to generate further
significant incremental benefits in the next few years, as they steadily reach cruising speed.
Specifically, the most important initiatives related to (i) a systematic analysis of product
benchmarking against the competition, (ii) the planning process for the product mix – granular
and sophisticated – to adjust it appropriately to actual market demand, (iii) purchasing
processes, in terms of increased flexibility, partly due to specific agreements with suppliers, and
(iv) distribution processes and in-season management, to improve the accuracy with which
products are distributed in individual stores, and rectifying quickly any errors of allocation
during the season, implementing a pull-push type methodology and adjusting the process of
product supply to simultaneous changes in demand.
5) New store openings – Compared to 2013, in 2014 the Group accelerated its growth through a
major schedule of store openings, not only of direct full-format stores but also small-format
OVS Group – Annual Report at 31 January 2015 pg. 8
franchise stores for the children's collections, under the OVS Kids and BluKids brands.
6) Conversions - In 2014, the conversion of the other brands acquired was also largely
completed: 7 of them were converted into OVS-format stores, while 36 were converted into
Upim stores; to date, both brands have seen substantial improvements from these stores in
terms of turnover and margins compared with the previous format.
7) Cost control – The year’s results benefited from the rationalisation of operating costs launched
in the second half of 2013, as well as new specific initiatives implemented by managers mainly
connected to i) rents, with a continuous renegotiation campaign to realign payments at least
partly with current market conditions, and ii) electricity costs, with the launch of an overhaul of
the lighting fleet that has already generated cost gains of around 50%. These initiatives have
already made substantial contributions to operating performance and the Group's profits, but
their full effects will roll out in the next few years.

OVS Group – Annual Report at 31 January 2015 pg. 9
Consolidated profit performance
The following table sets out the consolidated profit performance for 2014, compared with the results
for the carve-out of the previous year (see the introduction to this Report on Operations for the
presentation methods applied). The figures have been restated from an operational perspective and
represent the best reading of the Group profit performance in terms of disclosure and comparison with
the previous year, as non-recurring items have been stripped out.
€ mln % on NS € mln % on NS
Net Sales 1,227.4 100.0 1,136.2 100.0 91.2
8.0%
EBITDA (b) 157.1 12.8 131.5 11.6 25.6
19.5%
Depreciation (58.8) (4.8) (56.8) (5.0) (2.0)
of which from PPA (8.6) (8.6)
EBIT (b) 98.3 8.0 74.7 6.6 23.6
Net financial income/(charges) (61.1) (5.0) (55.0) (4.8) (6.1)
of which ammortised costs and exchange differences (7.9) (0.9)
Pre-tax profit/(loss) 37.2 3.0 19.7 1.7 17.5
Tax ( c) (20.5) (1.7) (25.3) (2.2) 4.8
Net Profit 16.7 1.4 (5.6) (0.5) 22.3
(c) Taxes in both year have been calculated considering the fiscal effect of the non recurring costs, with only reference of 2014, taxes have been
calculated in a yearly base.
(a) EBITDA are to be considered reclassified on the basis of management criteria. Rent expense on a straight - line basis (IAS 17) and Non-
recurring income and charges are excluded; both are included in the consolidated accounts of operating income and costs.
(b) EBIT are to be considered reclassified on the basis of management criteria. Non-recurring income and charges are excluded; both are included
in the consolidated accounts of operating income and costs.
31 January '15 31 January '14Change
Thanks to the initiatives described above, the Group has substantially increased both its like-for-like
sales, which grew by 4.6%, and its overall sales, which came in at €1,227.4 million, up 8.0% or €91.2
million on 2013 when they stood at €1,136.2 million.
EBITDA reached €157.1 million in 2014 (12.8% of net sales), up by €25.6 million on 2013, when it
came in at €131.5 million (11.6% of net sales). It was boosted by (i) improved operating leverage
primarily on staff costs in the face of sales growth, and (ii) the specific cost-cutting moves described
above, which resulted in a one percentage point reduction in the proportion of costs for the use of
third-party assets (rents) and a €3.1 million decrease in operating costs.

OVS Group – Annual Report at 31 January 2015 pg. 10
Net financial expenses of €61.1 million increased by €6.1 million compared with 2013. This change was
due to foreign exchange differences resulting in a loss of €8.0 million year on year (from positive €4.2
million in 2013 to negative €3.8 million in 2014). These differences reflect the effect of translating trade
payable balances into euros at period-end, and will therefore have no monetary effect, since normal
company policy is to hedge foreign exchange purchases.
Profit before tax came in at €37.2 million (3.0% of net sales), representing an improvement on the
previous year, when it stood at €19.7 million (1.7% of net sales).
Net result was also positive for €16.7 million, up by €22.3 million on 2013, when it was negative for
€5.6 million.
Net non-recurring expenses, excluding the operational information reported above and net of the
relative tax effect, came to €25.7 million, and are summarised below in relation to the financial
statement items concerned:
(In Euro million) 31 January '15 31 January '14 P&L item at 31st January 2015
Losses on sales below cost 9.1 2.5 Purchases of raw materials, consumables and goods
Personnel Lay off 0.8 Personnel expenses
IPO costs operation 3.0 Costs for services
Upim and Bernardi integration 0.5 1.4 Costs for use of third-party assets
Discontinued Business 0.9 Other operating charges
Write-downs and provisions 0.3 2.0 Write-downs and provisions
Other 0.3 1.2 Costs for services and other operating charges
Write off amortized cost 17.0 Financial charges
Subtotal before tax effect 31.9 7.1
Tax effect (6.2) (2.6)
Total 25.7 4.5
The most significant items in the table above are as follows:
- €9.1 million relating to non recurring costs due to the total disposal of goods before the
conversion of the stores
- €3.0 million for services rendered in connection to the listing and the carve-out,
recognised under "Service costs";
- extraordinary expenses connected to the results of discontinued business of around €0.9
million, relating to streamlining measures taken in the foreign subsidiaries, recognised
under "Other operating charges";
- €17.0 million relating to the writing off of amortised costs on a loan agreement that
existed at the reporting date but was fully repaid on 2 March 2015, when the Company's
shares were listed on the MTA. Another €6.3 million relating to this item will be written
off in 2015. This item is recognised under "Financial income and expenses".

OVS Group – Annual Report at 31 January 2015 pg. 11
The Group has recognised non-recurring expenses totalling €7.1 million for the financial year ended 31
January 2014, mainly concerning:
- €2.5 million, mostly relating to write-downs of goods due to the process of integrating
the Bernardi brand, recognised under "Purchases of raw materials, consumables and
goods";
- €1.4 million for consulting and legal fees relating to the process of integrating Upim and
Bernardi and reorganising the corporate processes, recognised under "Service costs";
- €2.0 million relating to expenses incurred to convert the Upim and Bernardi stores,
recognised under "Write-downs and provisions".
The non-recurring tax balance for both years relates to (i) the tax effect calculated on non-recurring
items and (ii) a gain of €2.3 million in 2013, transferred at cost in 2014 due to a positive change in the
expected IRAP rate which was used in the calculation of deferred tax in 2013 but then did not take
place.
OVS Group – Annual Report at 31 January 2015 pg. 12
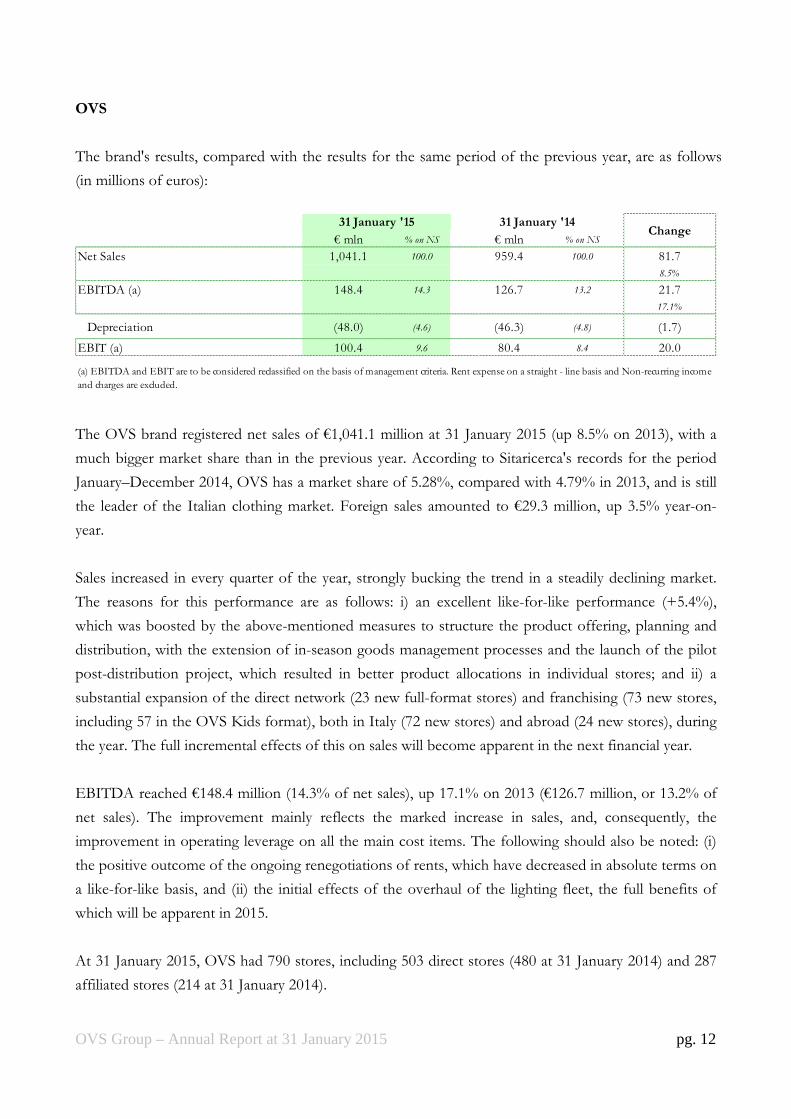
OVS
The brand's results, compared with the results for the same period of the previous year, are as follows
(in millions of euros):
€ mln % on NS € mln % on NS
Net Sales 1,041.1 100.0 959.4 100.0 81.7
8.5%
EBITDA (a) 148.4 14.3 126.7 13.2 21.7
17.1%
Depreciation (48.0) (4.6) (46.3) (4.8) (1.7)
EBIT (a) 100.4 9.6 80.4 8.4 20.0
(a) EBITDA and EBIT are to be considered reclassified on the basis of management criteria. Rent expense on a straight - line basis and Non-recurring income
and charges are excluded.
31 January '15 31 January '14Change
The OVS brand registered net sales of €1,041.1 million at 31 January 2015 (up 8.5% on 2013), with a
much bigger market share than in the previous year. According to Sitaricerca's records for the period
January–December 2014, OVS has a market share of 5.28%, compared with 4.79% in 2013, and is still
the leader of the Italian clothing market. Foreign sales amounted to €29.3 million, up 3.5% year-on-
year.
Sales increased in every quarter of the year, strongly bucking the trend in a steadily declining market.
The reasons for this performance are as follows: i) an excellent like-for-like performance (+5.4%),
which was boosted by the above-mentioned measures to structure the product offering, planning and
distribution, with the extension of in-season goods management processes and the launch of the pilot
post-distribution project, which resulted in better product allocations in individual stores; and ii) a
substantial expansion of the direct network (23 new full-format stores) and franchising (73 new stores,
including 57 in the OVS Kids format), both in Italy (72 new stores) and abroad (24 new stores), during
the year. The full incremental effects of this on sales will become apparent in the next financial year.
EBITDA reached €148.4 million (14.3% of net sales), up 17.1% on 2013 (€126.7 million, or 13.2% of
net sales). The improvement mainly reflects the marked increase in sales, and, consequently, the
improvement in operating leverage on all the main cost items. The following should also be noted: (i)
the positive outcome of the ongoing renegotiations of rents, which have decreased in absolute terms on
a like-for-like basis, and (ii) the initial effects of the overhaul of the lighting fleet, the full benefits of
which will be apparent in 2015.
At 31 January 2015, OVS had 790 stores, including 503 direct stores (480 at 31 January 2014) and 287
affiliated stores (214 at 31 January 2014).

OVS Group – Annual Report at 31 January 2015 pg. 13
UPIM
The brand’s results, both in the Italian market and internationally, compared with the results for the
same period of the previous year, are as follows (in millions of euros):
€ mln % on NS € mln % on NS
Net Sales 179.5 100.0 128.9 100.0 50.6
39.3%
EBITDA (a) 9.7 5.4 5.1 4.0 4.6
90.2%
Depreciation (9.3) (5.2) (8.0) (6.2) (1.3)
EBIT (a) 0.4 0.2 (2.9) (2.2) 3.3
31 January '15 31 January '14Change
(a) EBITDA and EBIT are to be considered reclassified on the basis of management criteria. Rent expense on a straight - line basis and Non-recurring income
and charges are excluded.
Brand sales at 31 January 2015, including the sales of the converted Bernardi stores as of the date of
this conversion, were €179.5 million (up 39.3% on 2013) and, according to Sitaricerca's records for the
period January–December 2014, the brand’s market share was 1.11%, representing an increase on 2013,
due to the contribution of the 36 store conversions and new store openings, including full-format direct
store openings (10 new stores) and BluKids franchised stores (13 new stores).
Like-for-like sales decreased by 3.9%, mainly due to (i) long shipment delays in the children's clothing
segment, (ii) a slowdown in fragrance, which has been much more negatively affected than other
segments in the value sector (NPD data shows a decline in value fragrances of 20.3% in 2014), and (iii)
the policy of limiting introductions of new collections in order to increase sell through and improve
store rotation. It should also be noted that the performance of the Upim product categories and stores
concerned by the above factors was better than in the previous year.
The Upim division registered a 90.2% increase in EBITDA, from €5.1 million (4.0% of net sales) in
2013 to €9.7 million (5.4% of net sales) in 2014.
At 31 January 2015, the Upim and BluKids brands had 257 stores overall, including 116 direct stores
(71 at 31 January 2013) and 141 affiliated stores (128 at 31 January 2013).).
Other stores under conversion
This business segment comprises the Bernardi network stores taken over to OVS S.p.A. at the time of
the Transferral. The process of integrating these stores into the OVS/Upim network was almost
completed during the year, when seven stores were converted to the OVS format and 36 to the Upim
format. The stores registered substantial increases in turnover by comparison with the previous format,
with a fairly low investment for restructuring. The remaining stores started operating as outlets, with

OVS Group – Annual Report at 31 January 2015 pg. 14
the Group using them as the focus for extraordinary destocking measures intended to improve financial
management of working capital and stock quality. During 2015, these eight remaining stores will be
transformed into Upim outlets, and the negative contribution to results of this business segment will be
eliminated.
The segment registered revenues of €7.0 million (€47.9 million in 2013), generating negative EBITDA
of €1.0 million (negative €0.4 million in 2013).
€ mln % on NS € mln % on NS
Net Sales 7.0 100.0 47.9 100.0 (40.9)
-85.4%
EBITDA (a) (1.0) (14.3) (0.4) (0.8) (0.6)
-350.0%
Depreciation (1.5) (21.4) (2.5) (5.2) 1.0
EBIT (a) (2.5) (35.8) (2.9) (6.1) 0.4
(a) EBITDA and EBIT are to be considered reclassified on the basis of management criteria. Rent expense on a straight - line basis and Non-recurring income
and charges are excluded.
31 January '15 31 January '14Change
OVS Group – Annual Report at 31 January 2015 pg. 15
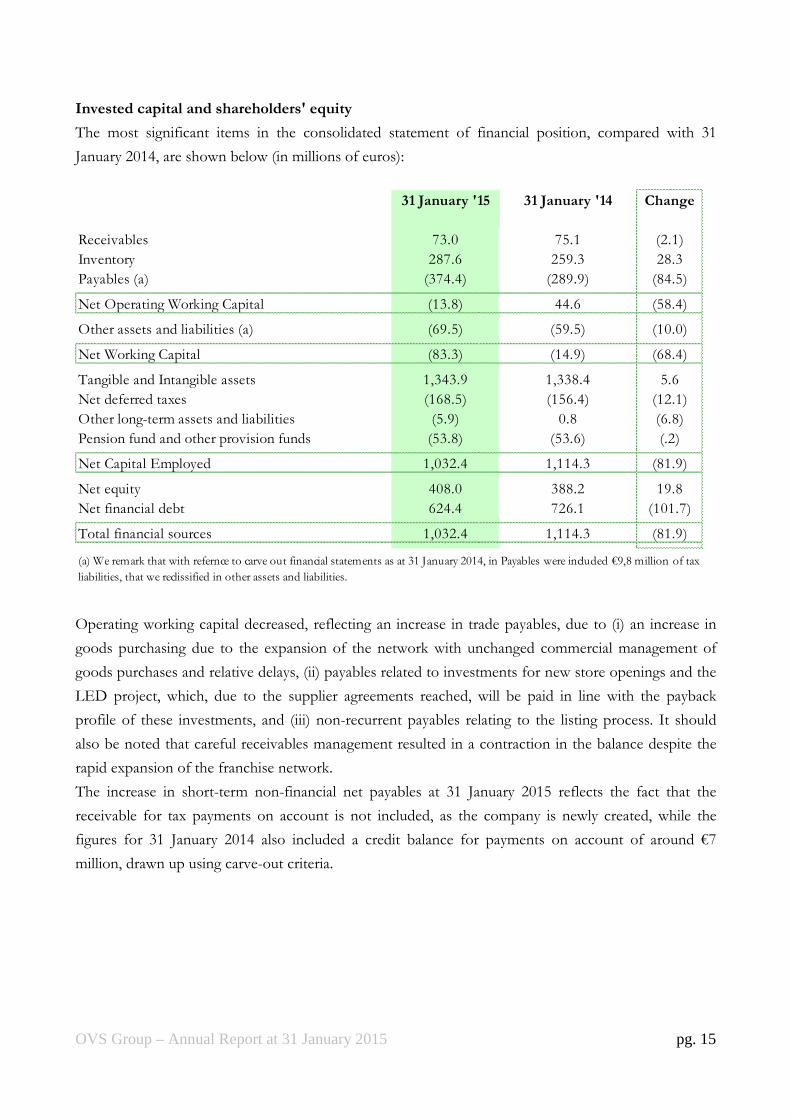
Invested capital and shareholders' equity The most significant items in the consolidated statement of financial position, compared with 31
January 2014, are shown below (in millions of euros):
31 January '15 31 January '14 Change
Receivables 73.0 75.1 (2.1)
Inventory 287.6 259.3 28.3
Payables (a) (374.4) (289.9) (84.5)
Net Operating Working Capital (13.8) 44.6 (58.4)
Other assets and liabilities (a) (69.5) (59.5) (10.0)
Net Working Capital (83.3) (14.9) (68.4)
Tangible and Intangible assets 1,343.9 1,338.4 5.6
Net deferred taxes (168.5) (156.4) (12.1)
Other long-term assets and liabilities (5.9) 0.8 (6.8)
Pension fund and other provision funds (53.8) (53.6) (.2)
Net Capital Employed 1,032.4 1,114.3 (81.9)
Net equity 408.0 388.2 19.8
Net financial debt 624.4 726.1 (101.7)
Total financial sources 1,032.4 1,114.3 (81.9)
(a) We remark that with refernce to carve out financial statements as at 31 January 2014, in Payables were included €9,8 million of tax
liabilities, that we reclissified in other assets and liabilities.
Operating working capital decreased, reflecting an increase in trade payables, due to (i) an increase in
goods purchasing due to the expansion of the network with unchanged commercial management of
goods purchases and relative delays, (ii) payables related to investments for new store openings and the
LED project, which, due to the supplier agreements reached, will be paid in line with the payback
profile of these investments, and (iii) non-recurrent payables relating to the listing process. It should
also be noted that careful receivables management resulted in a contraction in the balance despite the
rapid expansion of the franchise network.
The increase in short-term non-financial net payables at 31 January 2015 reflects the fact that the
receivable for tax payments on account is not included, as the company is newly created, while the
figures for 31 January 2014 also included a credit balance for payments on account of around €7
million, drawn up using carve-out criteria.
OVS Group – Annual Report at 31 January 2015 pg. 16
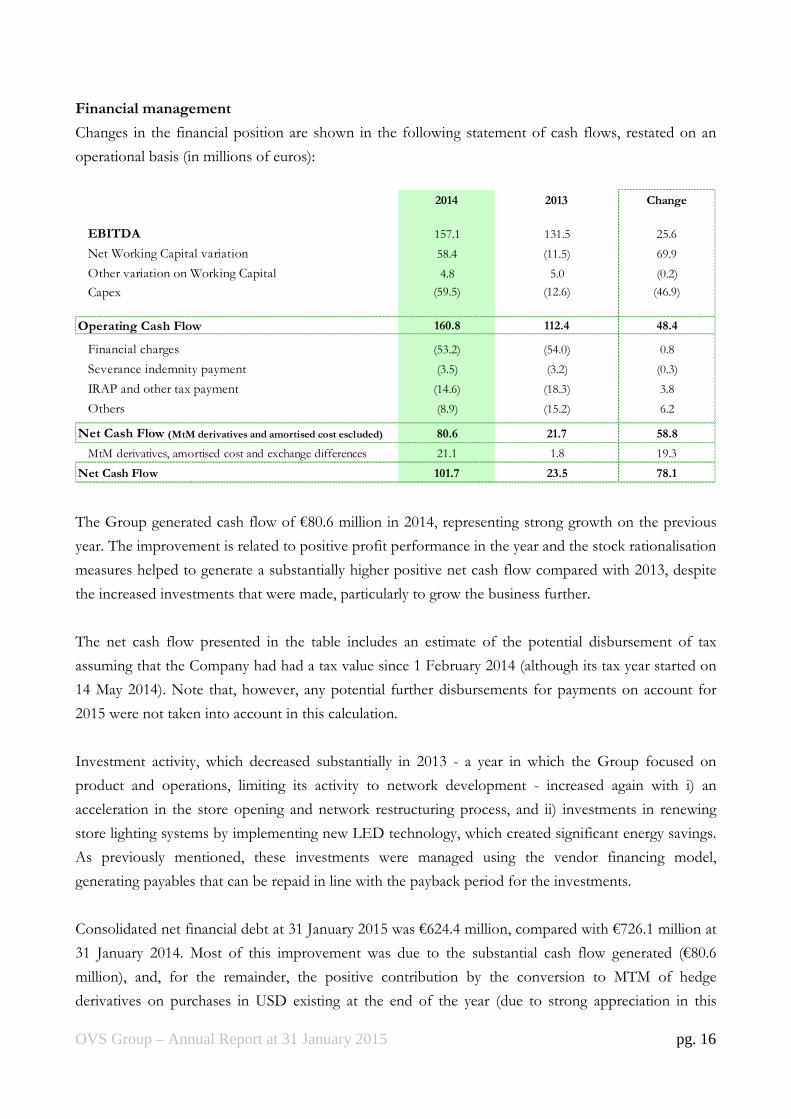
Financial management
Changes in the financial position are shown in the following statement of cash flows, restated on an
operational basis (in millions of euros):
2014 2013 Change
EBITDA 157.1 131.5 25.6
Net Working Capital variation 58.4 (11.5) 69.9
Other variation on Working Capital 4.8 5.0 (0.2)
Capex (59.5) (12.6) (46.9)
Operating Cash Flow 160.8 112.4 48.4
Financial charges (53.2) (54.0) 0.8
Severance indemnity payment (3.5) (3.2) (0.3)
IRAP and other tax payment (14.6) (18.3) 3.8
Others (8.9) (15.2) 6.2
Net Cash Flow (MtM derivatives and amortised cost escluded) 80.6 21.7 58.8
MtM derivatives, amortised cost and exchange differences 21.1 1.8 19.3
Net Cash Flow 101.7 23.5 78.1
The Group generated cash flow of €80.6 million in 2014, representing strong growth on the previous
year. The improvement is related to positive profit performance in the year and the stock rationalisation
measures helped to generate a substantially higher positive net cash flow compared with 2013, despite
the increased investments that were made, particularly to grow the business further.
The net cash flow presented in the table includes an estimate of the potential disbursement of tax
assuming that the Company had had a tax value since 1 February 2014 (although its tax year started on
14 May 2014). Note that, however, any potential further disbursements for payments on account for
2015 were not taken into account in this calculation.
Investment activity, which decreased substantially in 2013 - a year in which the Group focused on
product and operations, limiting its activity to network development - increased again with i) an
acceleration in the store opening and network restructuring process, and ii) investments in renewing
store lighting systems by implementing new LED technology, which created significant energy savings.
As previously mentioned, these investments were managed using the vendor financing model,
generating payables that can be repaid in line with the payback period for the investments.
Consolidated net financial debt at 31 January 2015 was €624.4 million, compared with €726.1 million at
31 January 2014. Most of this improvement was due to the substantial cash flow generated (€80.6
million), and, for the remainder, the positive contribution by the conversion to MTM of hedge
derivatives on purchases in USD existing at the end of the year (due to strong appreciation in this
OVS Group – Annual Report at 31 January 2015 pg. 17
currency).
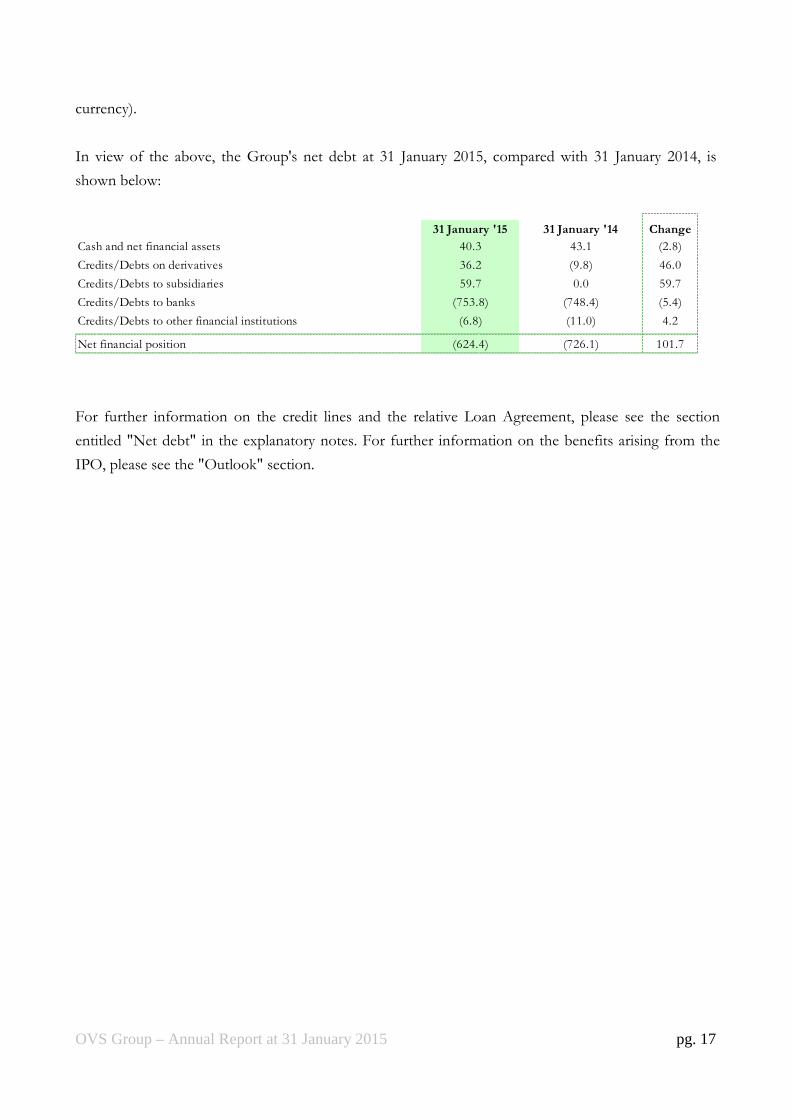
In view of the above, the Group's net debt at 31 January 2015, compared with 31 January 2014, is
shown below:
31 January '15 31 January '14 Change
Cash and net financial assets 40.3 43.1 (2.8)
Credits/Debts on derivatives 36.2 (9.8) 46.0
Credits/Debts to subsidiaries 59.7 0.0 59.7
Credits/Debts to banks (753.8) (748.4) (5.4)
Credits/Debts to other financial institutions (6.8) (11.0) 4.2
Net financial position (624.4) (726.1) 101.7
For further information on the credit lines and the relative Loan Agreement, please see the section
entitled "Net debt" in the explanatory notes. For further information on the benefits arising from the
IPO, please see the "Outlook" section.
OVS Group – Annual Report at 31 January 2015 pg. 18
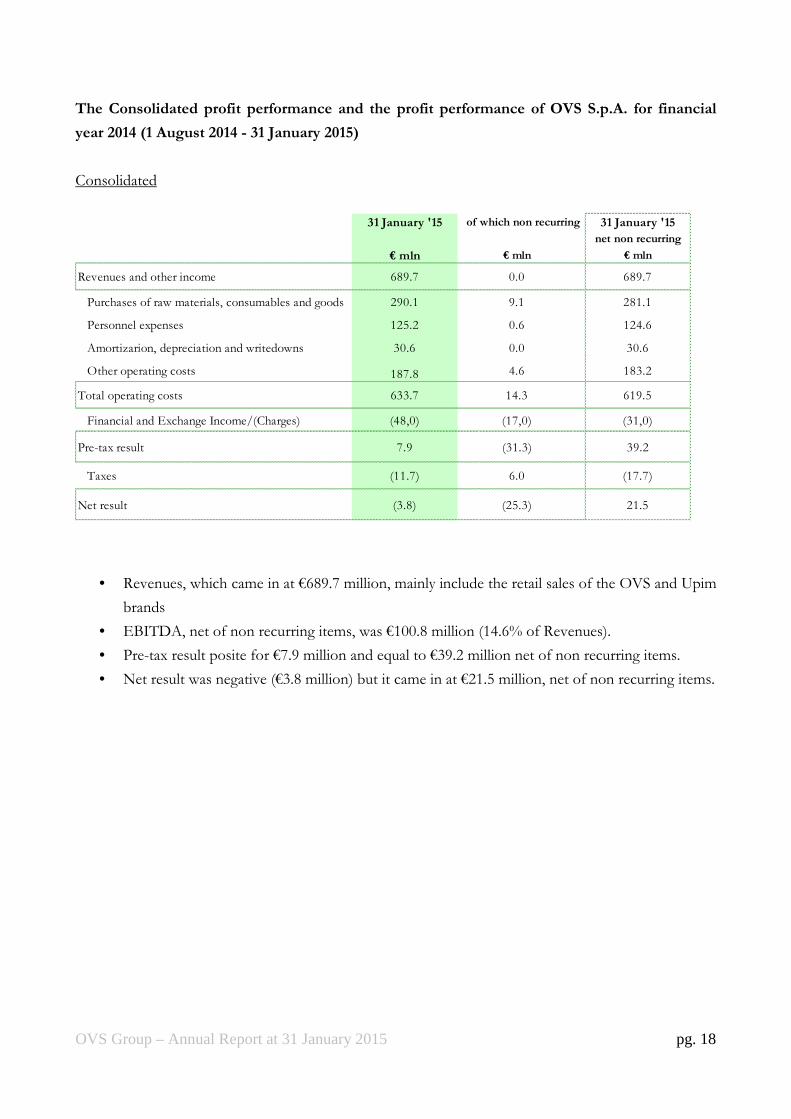
The Consolidated profit performance and the profit performance of OVS S.p.A. for financial
year 2014 (1 August 2014 - 31 January 2015)
Consolidated
31 January '15 of which non recurring 31 January '15
net non recurring
€ mln € mln € mln
Revenues and other income 689.7 0.0 689.7
Purchases of raw materials, consumables and goods 290.1 9.1 281.1
Personnel expenses 125.2 0.6 124.6
Amortizarion, depreciation and writedowns 30.6 0.0 30.6
Other operating costs 187.8 4.6 183.2
Total operating costs 633.7 14.3 619.5
Financial and Exchange Income/(Charges) (48,0) (17,0) (31,0)
Pre-tax result 7.9 (31.3) 39.2
Taxes (11.7) 6.0 (17.7)
Net result (3.8) (25.3) 21.5
• Revenues, which came in at €689.7 million, mainly include the retail sales of the OVS and Upim
brands
• EBITDA, net of non recurring items, was €100.8 million (14.6% of Revenues).
• Pre-tax result posite for €7.9 million and equal to €39.2 million net of non recurring items.
• Net result was negative (€3.8 million) but it came in at €21.5 million, net of non recurring items.
OVS Group – Annual Report at 31 January 2015 pg. 19
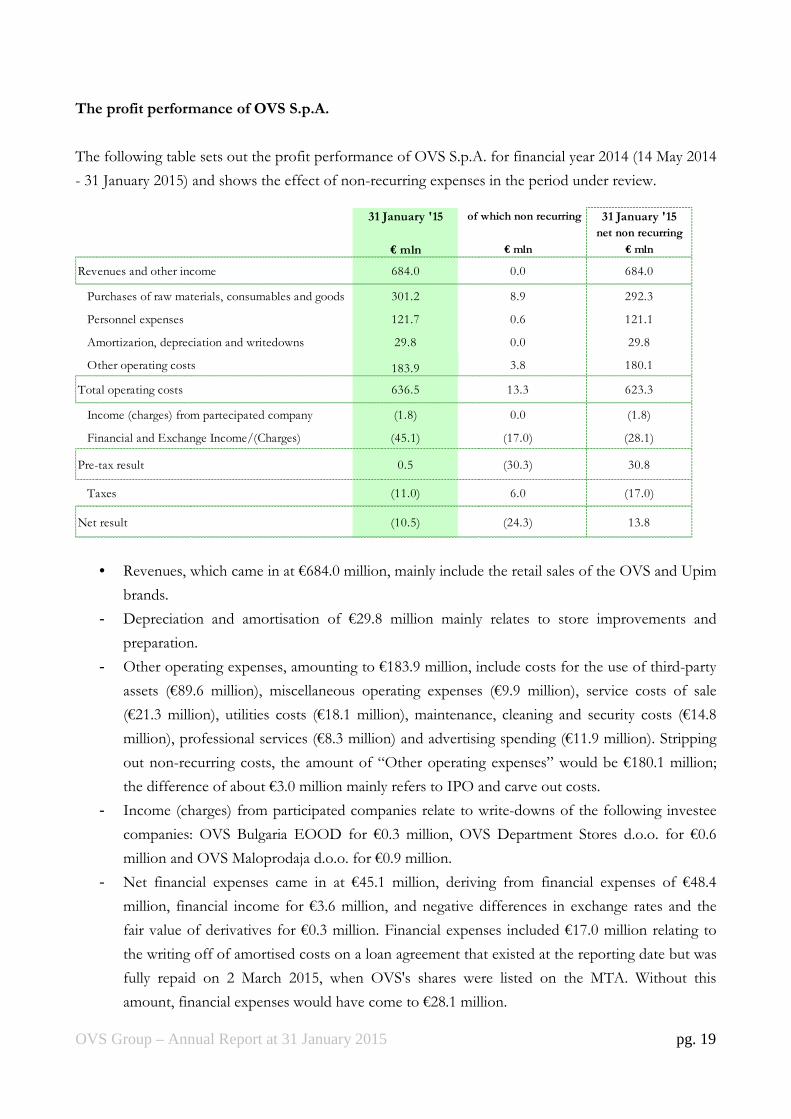
The profit performance of OVS S.p.A.
The following table sets out the profit performance of OVS S.p.A. for financial year 2014 (14 May 2014
- 31 January 2015) and shows the effect of non-recurring expenses in the period under review.
31 January '15 of which non recurring 31 January '15
net non recurring
€ mln € mln € mln
Revenues and other income 684.0 0.0 684.0
Purchases of raw materials, consumables and goods 301.2 8.9 292.3
Personnel expenses 121.7 0.6 121.1
Amortizarion, depreciation and writedowns 29.8 0.0 29.8
Other operating costs 183.9 3.8 180.1
Total operating costs 636.5 13.3 623.3
Income (charges) from partecipated company (1.8) 0.0 (1.8)
Financial and Exchange Income/(Charges) (45.1) (17.0) (28.1)
Pre-tax result 0.5 (30.3) 30.8
Taxes (11.0) 6.0 (17.0)
Net result (10.5) (24.3) 13.8
• Revenues, which came in at €684.0 million, mainly include the retail sales of the OVS and Upim
brands.
- Depreciation and amortisation of €29.8 million mainly relates to store improvements and
preparation.
- Other operating expenses, amounting to €183.9 million, include costs for the use of third-party
assets (€89.6 million), miscellaneous operating expenses (€9.9 million), service costs of sale
(€21.3 million), utilities costs (€18.1 million), maintenance, cleaning and security costs (€14.8
million), professional services (€8.3 million) and advertising spending (€11.9 million). Stripping
out non-recurring costs, the amount of “Other operating expenses” would be €180.1 million;
the difference of about €3.0 million mainly refers to IPO and carve out costs.
- Income (charges) from participated companies relate to write-downs of the following investee
companies: OVS Bulgaria EOOD for €0.3 million, OVS Department Stores d.o.o. for €0.6
million and OVS Maloprodaja d.o.o. for €0.9 million.
- Net financial expenses came in at €45.1 million, deriving from financial expenses of €48.4
million, financial income for €3.6 million, and negative differences in exchange rates and the
fair value of derivatives for €0.3 million. Financial expenses included €17.0 million relating to
the writing off of amortised costs on a loan agreement that existed at the reporting date but was
fully repaid on 2 March 2015, when OVS's shares were listed on the MTA. Without this
amount, financial expenses would have come to €28.1 million.

OVS Group – Annual Report at 31 January 2015 pg. 20
- Taxes were negative for €11.0 million; without non-recurring expenses, they would have
negative and amounting to €17.0 million. It should be noted that the tax amount shown in the
“non-recurring” column includes €2.3 million relating to the change in IRAP from 3.5% at
Transferral to 3.9%, which was used to calculate the calculation of current deferred taxes.
- The net loss registered of €10.5 million would have been a positive €13.8 million if the
Company had not incurred the non-recurring costs shown.
Financial performance
The company's financial performance, described in more detail in the explanatory notes to the financial
statements, is set out below.
31 January '15
€ mln
Working capital (A) (329.3)
Net capital employed (B) 1,351.0
Net Financial position 625.8
Shareholders' equity 395.9
(A) The item includes: Trade receivables and payables, current and deferred tax assets, other receivables, inventories, current and deferred tax liabilities, other payables, severance payment fund and risk provisions. (B) The item includes: Property, plant and equipment, intangible assets, goodwill and equity investments.
Financial management Net debt stood at €625.8 million at 31 January 2015. The breakdown is as follows (in millions of euros):
31 January '15
Cash and net financial assets 38.3
Credits/Debts on derivatives 36.2
Credits/Debts to subsidiaries 59.7
Credits/Debts to banks (753.2)
Credits/Debts to other financial institusions (6.8)
Net financial position (625.8)
Payables to banks have been reclassified under short-term liabilities, as on 2 March 2015, after the OVS
listing, they were repaid in full under a New Loan Agreement described later in this report.
OVS Group – Annual Report at 31 January 2015 pg. 21
Main subsidiaries
OBS
Oriental Buying Services Ltd, which has its registered office in Hong Kong, operates in the Far East
(mainly in China, Bangladesh and India, and, more generally, in the regions outside Europe). The
company selects suppliers, obtains orders, manages every stage of product development up to and
including quality control, supports production activity and ensures, using its own monitoring structures,
that product cost and quality are in line with Group standards. A particular focus for the company has
been strengthening existing supplier relationships in Asia, and building on its presence in Bangladesh by
expanding purchasing volumes. Meanwhile, purchasing has also grown in India, and the company has
continued to seek new supply sources in countries in the region that can meet the quality standards
required by the Group in a less costly environment (e.g., Cambodia and Myanmar).
In 2014, OBS Ltd registered net profit of €16.8 million, compared with €7.4 million in 2013.; while for
financial year 2014 (1 August 2014 - 31 January 2015) the Company registered positive result of €6.4
million.
OVS Maloprodaja d.o.o.
This company operates in the Croatian market, directly managing nine OVS branded stores and three
Coincasa branded stores.
In 2014, in order to rationalise the network by improving the company's profitability, two OVS stores
were closed (in May and August 2014) and two Coincasa stores were closed (January 2015). At the end
of the year, the Spalato store was closed for relocation and restructuring, with relaunch scheduled for
early 2015.
The expansion of OVS in Croatia is set to continue as the franchising formula rolls out.
OVS Department Stores Beograd d.o.o.
This company operates in the Serbian market, directly managing five OVS branded stores and three
Coincasa branded stores.
In 2014, in order to rationalise the network by improving the company's profitability, the closure of
two Coincasa stores was negotiated and scheduled for early 2015.
The expansion of OVS in Serbia is set to continue as the franchising formula rolls out.
OVS Bulgaria EOOD
In 2014, the company managed three OVS branded stores in Bulgaria. The three stores were closed in
November 2014 and the company will be placed in liquidation in 2015.
The expansion of OVS in Bulgaria is set to continue as the franchising formula rolls out.
OVS Group – Annual Report at 31 January 2015 pg. 22
Management of financial risks and operating risks
The Group is a retail and wholesale trader, with exposure to market risks associated with changes in
interest rates, exchange rates and commodity prices. The risk of changes in prices and cash flows is
intrinsically connected to the nature of the business and can only partly be mitigated by using suitable
risk management policies.
Credit risk
Credit risk represents the Group's exposure to the risk of potential losses arising from default by a
counterparty.
At 31 January 2015, there were no significant concentrations of credit risk, as this risk is mitigated by
the fact that credit exposure is spread over a large number of customers.
To reduce the risk, the Group also obtains guarantees in the form of sureties in respect of loans granted
for the supply of goods.
Financial assets are recognised net of write-downs calculated on the basis of the risk of counterparty
default, determined by using available information on the solvency of the customer and taking historical
data into account.
Liquidity risk
Liquidity risk is the risk that financial resources may be difficult to recover.
At present, the Group believes that, due to the availability of sources of financing and lines of credit, it
has access to sufficient funds to meet its foreseeable financial requirements.
Management of market risks
Market risks include the effects that changes in the market may have on any of the Group's commercial
activity that is sensitive to changes in consumer spending choices.
Positive results can be influenced by, inter alia, the business environment, interest rates, taxation, local
economic conditions, uncertainty over the economic outlook and shifts in spending choices towards
other goods and services. Consumer preferences and economic conditions may change from time to
time in all of the Group's markets.
We must be able to counteract the deflationary price pressure associated with increased competition
and changes in consumer choices, which could have adverse effects on the financial position and profit
performance.
Risk of price and cash flow changes
The Group's margins are affected by changes in the prices of the goods it handles.
Any reduction in the prices of the items sold, if not accompanied by a corresponding reduction in the
purchase price, generally has a negative effect on operating results.
The Group's cash flows are also exposed to the risk of changes in exchange rates and interest rates on
the market. More specifically, the exposure to exchange rates arises from the fact that the Group
OVS Group – Annual Report at 31 January 2015 pg. 23
operates in currencies other than the euro. Because of this, a significant part of the marketed products
purchased by the Group are denominated in or linked to the US dollar.
Interest rate variations affect the market value of the Group's financial liabilities and the amount of net
financial expenses.
Objectives and policies for managing the risk of changes in cash flows
The Group uses guidelines on financial operations that stipulate the use of derivatives to reduce
exchange rate risk in respect of the US dollar and interest rate risk.
Derivative contracts
Nominal value of derivative contracts
The nominal value of a derivative contract is intended to mean the amount in monetary terms that each
contract represents. Monetary amounts in foreign currencies are converted into euros at the prevailing
exchange rate at year-end.
Management of interest rate risk
On 30 June 2011, as well as signing loan agreements that are described in more detail in the explanatory
notes to the financial statements, the Group entered into “Interest Rate Swap” contracts to manage
interest rate risk, expiring on 31 July 2015. Due to the Transferral operation, one of these contracts was
transferred to OVS and extinguished on 27 February 2015.
Management of exchange rate risk
The Group enters into a range of currency contracts to manage the exchange rate risk associated with
future purchases in foreign currencies.
These contracts are mainly used to insure against the risk of appreciation in the foreign currency (US
dollar).

OVS Group – Annual Report at 31 January 2015 pg. 24
Investments and development
In 2014 (1 February 2014 – 31 January 2015), total investments amounted to €64.6 million (€59.5
million net of disinvestments), mainly related to group expansion and mainly involving (i) new store
openings (around €17 million) and (ii) conversions of the stores of other brands and restructuring
(around €8 million), (iii) store maintenance (around €8 million), (iv) the renewal of the lighting fleet at
many stores under the LED project previously described (around €18 million), and (v) the development
of IT systems and the restructuring of the logistics network in reference to the implementation of
innovative operating processes, (€12 million). Investments during the period August 2014 - January
2015 amounted to €32.9 million.
At Group level, the sales network comprised a total of 1,055 stores at 31 January 2015 (including the
small format stores) including 615 direct stores, 428 affiliates (of which 125 abroad) and 12 direct stores
abroad.
In 2015 (1 February 2014 – 31 January 2015), the direct network added 127 stores, including 41 direct
stores and 86 affiliated stores.
Organization
To support the company's growth plans, during 2014 an integrated programme of measures has been
developed, to increase the overall quality of resources and continuously streamline the organizational
structure.
In terms of organizational development, the following measures have been devised:
• developing the Business Innovation and Change Management programs, partly through the
creation of a new dedicated department, aimed at giving the company new support processes
and systems to provide product planning, quantification, distribution and in-season
management pathways, to respond more flexibly to the various requirements of individual local
markets and target customers;
• introducing new methods of integrating the product development activities carried out in Italy
and the international sourcing unit, to increase the ability to guide and control suppliers, also
introducing new ways of responding to the need for speed and flexibility, while complying with
quality and cost targets;
• strengthening the systems and expertise dedicated to international expansion.
In terms of the commitment to quality improvement and the involvement of internal resources, the key
plans are as follows:
• the launch of WEshare, an in-house social tool that gives all employees direct access to services
OVS Group – Annual Report at 31 January 2015 pg. 25
dedicated to them, e-learning activities and key information about the business;
• strengthening the corporate training programs with the use of new tools, particularly the Retail
School, which is dedicated to promoting new managers for the stores, and has taken on more
than 150 student store managers;
• strengthening cooperation with universities and other external centres of expertise, to ensure
strong integration between distinctive corporate capabilities and comparison with innovation,
particularly in the world of products, images and digital technology;
• the expansion of the "Talent Management" programs, to offer development courses to internal
resources who show the greatest potential for advancement;
• the addition of new people to strengthen internal specialist expertise, particularly in the world of
style and products.
All the brands have implemented integrated training and development plans to improve customer
service and management efficiency. At OVS, more than 400 managers were involved in plans to
optimise image and store operation, while at Upim training plans were launched for managers who will
support the network expansion programme.
In terms of industrial relations, the national trades unions and some regional trades unions became
involved in measures to optimise resources and streamline the business, always finding solutions
consistent with the corporate objectives and with the agreement of the employees involved.
Special attention was also paid to curbing rising labour costs, to make them compatible with market
trends, with targeted measures developed to make maximum use of flexibility tools.
We conclude with an analysis of the overall quantitative figures.
The average age of employees is 40 years and four months, with average length of service at around 13
years.
Women represent 79.3% of the total workforce. The percentage of university and high school
graduates increased to 75.6% of the total.
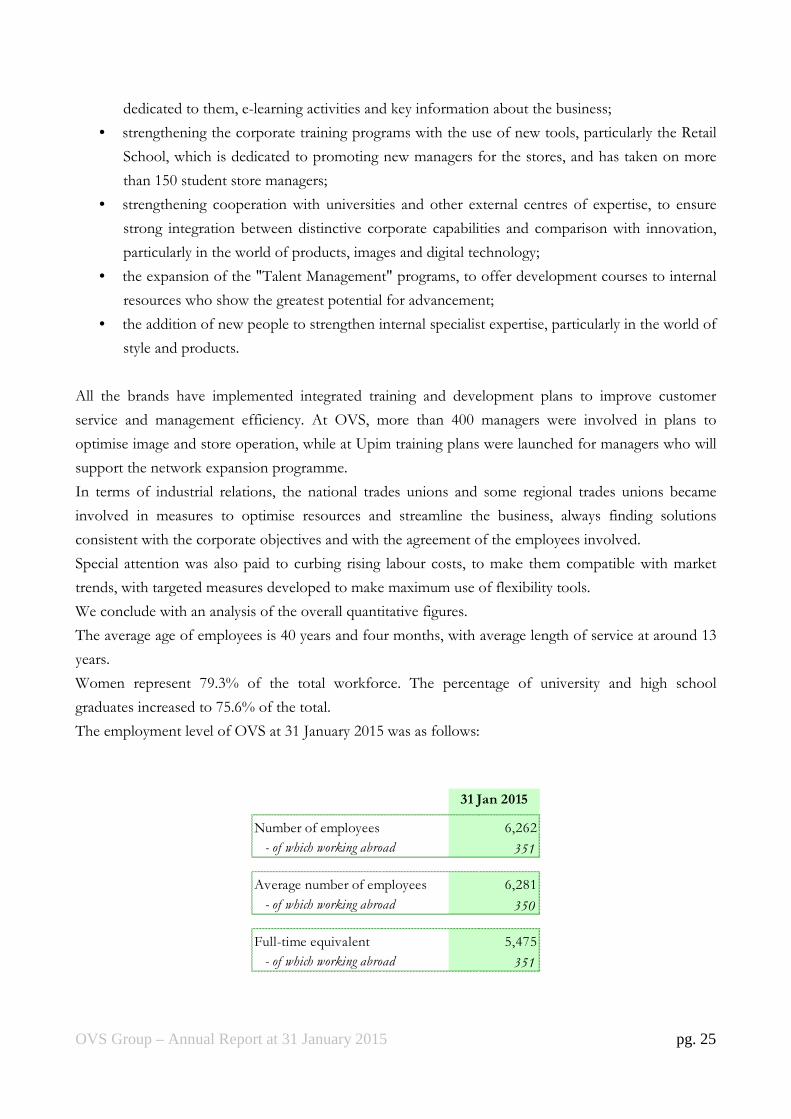
The employment level of OVS at 31 January 2015 was as follows:
31 Jan 2015
Number of employees 6,262
- of which working abroad 351
Average number of employees 6,281
- of which working abroad 350
Full-time equivalent 5,475
- of which working abroad 351
OVS Group – Annual Report at 31 January 2015 pg. 26
Risks associated with the environmental policy
In compliance with article 2428, paragraph 2 of the Italian Civil Code, it should be noted that the Group
conducts its business in compliance with the provisions relating to the environment and health in the
workplace.
Corporate governance
The Company has prepared a report on corporate governance and ownership structure, which
describes OVS’s corporate governance system and also provides information on the ownership
structure and the system of internal control and risk management. The complete report – which refers
to year 2014 – is available on the Company’s website: www.ovscorporate.it in the section
“Governance”.
Management and coordination
At 31 January 2015, OVS S.p.A. was a wholly owned investee company of Gruppo Coin S.p.A., while
at the reference date, due to the IPO already described, this interest decreased to 52.12%. Although
Gruppo Coin holds a majority stake in OVS, OVS does not regard itself as subject to the management
and coordination of Gruppo Coin, as:
a) it operates completely autonomously;
b) Gruppo Coin does not carry out any cash pooling activity for the Company;
c) key decisions relating to management of the Company and its subsidiaries are made by the
Company's own management bodies;
d) the Company's Board of Directors is responsible, inter alia, for reviewing and approving the
strategic, business, financial and budget plans of the Company and the OVS Group, reviewing
and approved the organizational structure of the OVS Group and assessing the suitability of the
organizational, management and accounting structure of the Company and the OVS Group.
Research and development
It should be noted that the Group did not conduct research and development activities within the
meaning of the provisions of the accounting standards.
However, a certain number of people were continuously engaged in creating and developing clothing
collections, with the aim of provided an exclusive offering in keeping with the positioning of the
Group's various brands.

OVS Group – Annual Report at 31 January 2015 pg. 27
Treasury shares
As at the date of preparation of this annual report, the Parent Company, OVS S.p.A., does not hold
(and did not hold at any time during 2014) treasury shares or shares and/or units of parent companies,
either directly or indirectly.
Related-party transactions
In accordance with the applicable laws and regulations, the Board of Directors of the parent company,
by resolution of 23 July 2014, effective as of 2 March 2015, approved the "Regulation governing
related-party transactions" to govern transactions of strategic, economic or financial significance,
including those carried out with related parties. The regulation aims to define powers and
responsibilities in relation to significant transactions and to ensure the transparency and material and
procedural correctness thereof.
In the explanatory notes to the consolidated financial statements and the separate financial statements,
detailed information is provided on relations with related parties, as required under IAS 24.
Compliance with the Privacy Code
Pursuant to Appendix B, point 26 of Legislative Decree 196/2003, which sets out the personal data
protection code, the management body hereby acknowledges that the Company has complied with the
personal data protection measures in light of the provisions introduced by Legislative Decree
196/2003, under the terms and conditions specified therein.
In particular, it should be noted that the Security Policy Document, which is filed at the registered
office and freely available, has been updated by the data controller pursuant to the law.
Significant events after the reporting date
As already indicated in the first part of this report, on 24 February 2015, the global offer for
subscription and sale was successfully completed, with requests made for 226,832,292 shares by 5,233
requesters and demand of round twice the quantity of shares on offer.
Based on the offer price of €4.10 per share, the Company's market capitalisation was around €930.7
million.
The start of trading on the MTA was set by Borsa Italiana for Monday, 2 March 2015. The subscription
OVS Group – Annual Report at 31 January 2015 pg. 28
operation entailed a capital increase of €87,000,000, taking the share capital from €140,000,000 to
€227,000,000, divided into 227,000,000 ordinary shares with no par value.
Due to the corporate events and the imminent listing, on 23 January 2015, OVS entered into an
agreement, conditional upon completion of the IPO, for a New Loan Agreement with Banca IMI as
the lending bank and the agent bank ("Agent Bank"), and Unicredit S.p.A., Natixis SA, Milan Branch,
HSBC Bank PLC, Milan Branch, Crèdit Agricole Corporate and Investment Bank, Milan Branch, Banca
Popolare Friuladria S.p.A., BNP Paribas, Milan Branch, Banca Monte dei Paschi di Siena S.p.A., MPS
Capital Services – Banca per le Imprese S.p.A., Banca Popolare di Vicenza S.c.p.A., Banca Popolare di
Milano S.c.a r.l., Banca Popolare di Sondrio S.c.p.A., Banca Popolare Soc. Coop. and Banca Popolare
dell’Alto Adige S.c.p.A. as the lending banks. The New Loan Agreement provides for the granting of a
medium-/long-term line of credit of €375,000,000, which, together with the income from the capital
increase servicing the global offer, was intended to repay the pre-existing debt of the Issuer and to pay
costs associated with the listing process, and a revolving line of credit of €100,000,000 that may be
drawn down in different currencies, for a total maximum amount of €475,000,000.
The applicable interest rate for both the senior loan and the revolving line of credit is equal to the sum
of (i) the margin of 3% per annum (the "Margin") and (ii) the Euribor or, if the currency used is not the
euro, the Libor (the "Interest"). Interest will be calculated on a quarterly or half-yearly basis for the
senior loan, and on a monthly or quarterly or half-yearly basis for the revolving line of credit (unless
otherwise agreed between the parties). The Margin will decrease or increase according to the ratio of
average total net debt to EBITDA (as contractually specified), calculated on the basis, depending on the
case, of the consolidated financial statements (subject to revision) at 31 January and the consolidated
interim report (not subject to revision) at 31 July, drawn up pursuant to IFRS. Specifically, the New
Loan Agreement stipulates that:
• if the ratio is equal to, or greater than 3.00:1, the applicable Margin will be 3.50%;
• if the ratio is less than 3.00:1 but equal to, or greather than 2.00:1, the applicable Margin will be
3.00%;
• if the ratio is less than 2.00:1 but equal to, or greater than 1.50:1, the applicable Margin will be
2.50%; and
• if the ratio is less than 1.50:1, the applicable Margin will be 2.00%;
The senior loan was disbursed on 2 March 2015, as trading of the shares began on the MTA. On the
date that trading of the shares started on the MTA, the Company fully repaid the Old Loan Agreement
(which therefore ceased to be effective), using a portion of the income deriving from the global offer to
reduce the OVS Group's gross debt, and the senior loan to restructure the remainder: pursuant to the
New Loan Agreement, the senior loan must be used, inter alia, to fully repay the debt arising from the
Old Loan Agreement. Therefore, on the date that trading started, financial debt mainly consisted of the
New Loan Agreement.
OVS Group – Annual Report at 31 January 2015 pg. 29
Outlook
In macroeconomic terms, there are some positive signs that suggest an interruption of the decline in
consumption in 2015, or a small recovery. The consumer confidence index, which had already shown
signs of recovery in the last months of 2014, has gained in strength due to encouraging data in the first
part of 2015. Expectations regarding GDP and consumption growth are limited, but still positive (0.7%
and 0.5% respectively), while the clothing market remains negative, with a further contraction of 1.2%
(Sitaricerce) predicted.
The trend of growth in own-brand retail distribution continued, however, as did, particularly, the
market share of the "value" price band covered by our brands.
In the first three months of 2015, Group’s sales will continue to record positive growth, with a sound
like for like, despite (i) the fact that it had recorded double-digit growth in the same period a year
previously, and (ii) particularly rainy and cold weather in March.
The network expansion continued in these early months of the year, with nine new full-format OVS
stores and one Upim store opened. The expansion of small-format stores for children's clothing was
even stronger, with the OVS Kids and BluKids brands opening around 40 direct or franchised stores.
Lastly, the process to convert stores to the Bernardi brand is in its final stages and will be completed in
2015.
The margin on sales is expected broadly in line with the previous year.
As expected the corporate results also benefited from more contained payroll increases than in previous
years, from scheduled savings related to the renegotiation of rental payments and substantial energy
savings due to the aforementioned LED project.
Moreover, as explained above, as a result of the IPO, which provided in €356.7 million in financial
resources, debt (€624.4 million at 31 January 2015) decreased substantially. The decrease in debt and
the more favourable interest rates secured under the New Loan Agreement will result in a significant
reduction in the Group's financial expenses.
Consob Regulation 16191/2007 - Article 36
Investee companies with registered offices in countries outside the European Union, the most
significant of which is OSB Ltd Hong Kong, are not significant within the meaning of article 151 of the
Issuer Regulation, as their respective assets amount to less than 2% of the Group's consolidated assets
at 31 January 2015, and their respective revenues amount to less than 5% of the Group's consolidated
revenues at 31 January 2015.
OVS Group – Annual Report at 31 January 2015 pg. 30
Motion for Approval of the Annual Financial Report and allocation of 2014 Net Result
Shareholders,
We hereby submit for your approval the true and fair view of the Statutory Financial Statements for the
year ended 31 January 2015, which reports a net loss of 10,536,472.00 Euro.
We propose the loss to be allocated to the Retained Earnings reserve.
On behalf of the Board of Directors
CEO
Stefano Beraldo
Venice – Mestre, 22 April 2015
OVS Group – Annual Report at 31 January 2015 pg. 31
Consolidated Financial Statements
OVS Group – Annual Report at 31 January 2015 pg. 32
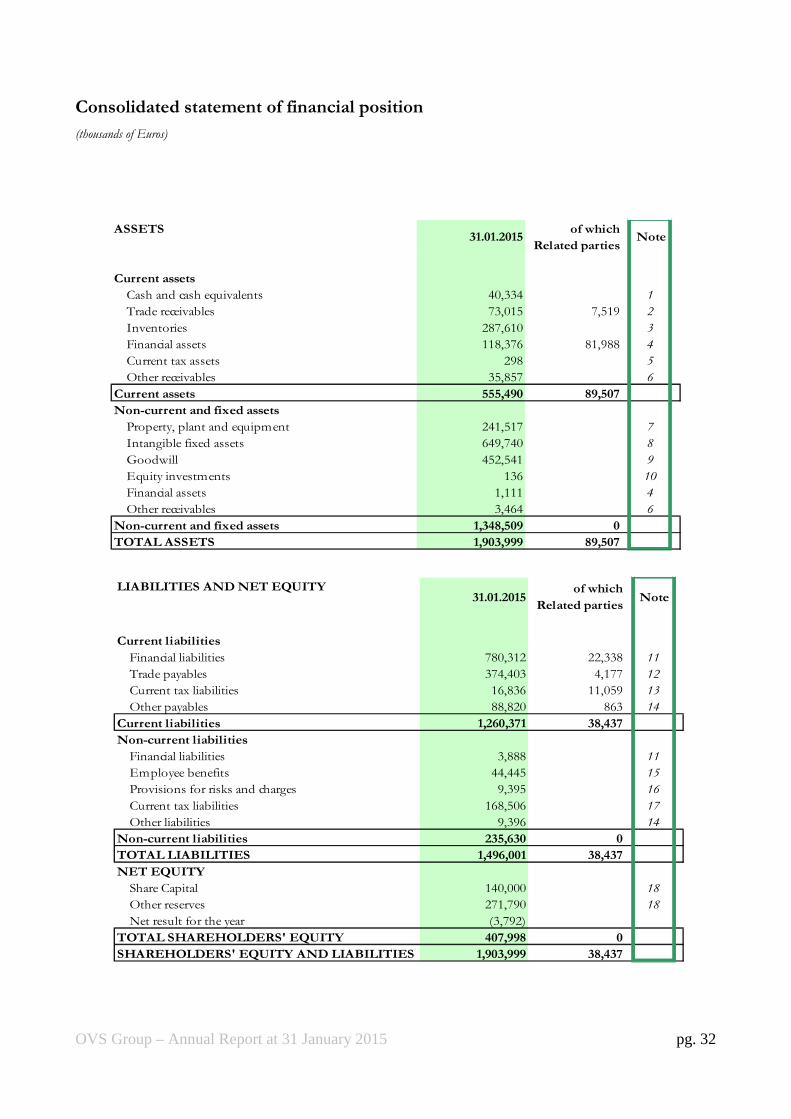
Consolidated statement of financial position
(thousands of Euros)
ASSETS31.01.2015
of which
Related partiesNote
Current assets
Cash and cash equivalents 40,334 1
Trade receivables 73,015 7,519 2
Inventories 287,610 3
Financial assets 118,376 81,988 4
Current tax assets (A) 298 5
Other receivables 35,857 6
Current assets 555,490 89,507
Non-current and fixed assets
Property, plant and equipment 241,517 7
Intangible fixed assets 649,740 8
Goodwill 452,541 9
Equity investments 136 10
Financial assets 1,111 4
Other receivables 3,464 6
Non-current and fixed assets 1,348,509 0
TOTAL ASSETS 1,903,999 89,507
31.01.2015of which
Related partiesNote
Current liabilities
Financial liabilities 780,312 22,338 11
Trade payables 374,403 4,177 12
Current tax liabilities (B) 16,836 11,059 13
Other payables 88,820 863 14
Current liabilities 1,260,371 38,437
Non-current liabilities
Financial liabilities (C) 3,888 11
Employee benefits 44,445 15
Provisions for risks and charges 9,395 16
Current tax liabilities 168,506 17
Other liabilities 9,396 14
Non-current liabilities 235,630 0
TOTAL LIABILITIES 1,496,001 38,437
NET EQUITY
Share Capital 140,000 18
Other reserves 271,790 18
Net result for the year (3,792)
TOTAL SHAREHOLDERS' EQUITY 407,998 0
SHAREHOLDERS' EQUITY AND LIABILITIES 1,903,999 38,437
LIABILITIES AND NET EQUITY

OVS Group – Annual Report at 31 January 2015 pg. 33
Consolidated income statement
(thousands of Euros)
31.01.2015
Unusual
income /
(expense)
of which
Related partiesNote
Revenues 656,985 2,302 19
Other operating income and revenues 32,729 24 551 20
Total Revenues 689,714 24 2,853
Purchase of raw materials, consumables and goods 290,143 9,118 2,358 21
Personnel expenses 125,226 641 1,515 22
Amortisation, depreciation and write-downs of fixed assets 30,571 23
Other costs
- costs for services (D) 84,578 3,027 8,183 24
- costs for use of third party assets 91,262 309 (355) 25
- costs for write-downs and provisions 1,817 317 26
- other operating charges 10,151 880 27
Net result before net financial charges and taxes 55,966 (14,268) (8,848)
Financial income 3,682 3,660 28
Financial charges (48,512) (16,983) (1,973)
Exchange differences (3,189)
Pre-tax net result for the year 7,947 (31,251) (7,161)
Tax (11,739) 6,036 29
Net Result (3,792) (25,215) (7,161)
Net Result attributable to:
Owners of the parent (3,792)
Non-controlling interests 0
Earnings/(loss) per ordinary share (Euro)
- basic (0.03)
- diluted (0.03)

OVS Group – Annual Report at 31 January 2015 pg. 34
Consolidated statement of comprehensive income(thousands of Euros) 31.01.2015
Net Profit (A) (3,792)
Total other profit/(loss) that will not subsequently be reclassified to the income statement
- Actuarial profit/(loss) on employee benefits (3,706)
- Tax on items recognized in the reserve for actuarial profit/(loss) 1,019
Total other profit/(loss) that will not subsequently be reclassified to the income statement (2,687)
Total other profit/(loss) that will subsequently be reclassified to the income statement
- Profit/(loss) on hedging instruments (cash flow hedge) 26,558
- Cash flow hedge relatex tax impact (7,303)
- Changes in conversion reserve 2,881
Total other profit/(loss) that will subsequently be reclassified to the income statement 22,136
Total other components of comprehensive net result (B) 19,449
Total comprehensive net result of the year (A) + (B) 15,657
Comprehensive net result attributable to the Group 15,657
Comprehensive net result attributable to non-controlling interests -

OVS Group – Annual Report at 31 January 2015 pg. 35
Consolidated Statement of Cash Flows
(thousands of Euros)
Note 31.01.2015
Operating activities
Net profit/ (loss) (3,792)
Provisions for income taxes 29 11,739
Changes for:
Depreciation and impairment of fixed assets 23 30,571
Net capital gains/ (losses) on assets 510
Net financial income/ (charges) 28 44,830
Income/ (charges) on exchange rate differences and derivatives 28 11,424
(Gains)/losses on derivative financial instruments for the change in fair
value 28 (8,235)
Provision 15-16 237
Change in provisions 15-16 (2,061)
Cash flow from operating activity before changes in working capital 85,223
Cash flow generated/(absorbed) by changes in working capital2-3-5-6-12-13-
14-17 58,986
Net received/ (paid) interest (14,569)
Exchange rate and cash flows on currency (1,898)
Other changes 2,812
Cash flow from operating activities 130,554
Investing activities
(Investments) in fixed assets 7-8-9 (33,673)
Disposal of fixed assets 7-8-9 744
Investments (Increase) / decrease 10 (1)
Cash flow from investing activities (32,930)
Financing activities
Change in financial assets/ liabilities 4-11 (71,753)
Incorporation of the parent Company OVS S.p.A. 10
Net cash due to carve out OVS-UPIM business units 14,453
Cash flow from financing activities (57,290)
Increase / (decrease) in cash and cash equivalents 40,334
Cash and cash equivalents at the beginning of the year 0
Cash and cash equivalents at the end of the year 40,334 The effects of related party transactions are described under the paragraph "Related parties transactions" in the Notes to this Consolidated financial statements.
OVS Group – Annual Report at 31 January 2015 pg. 36
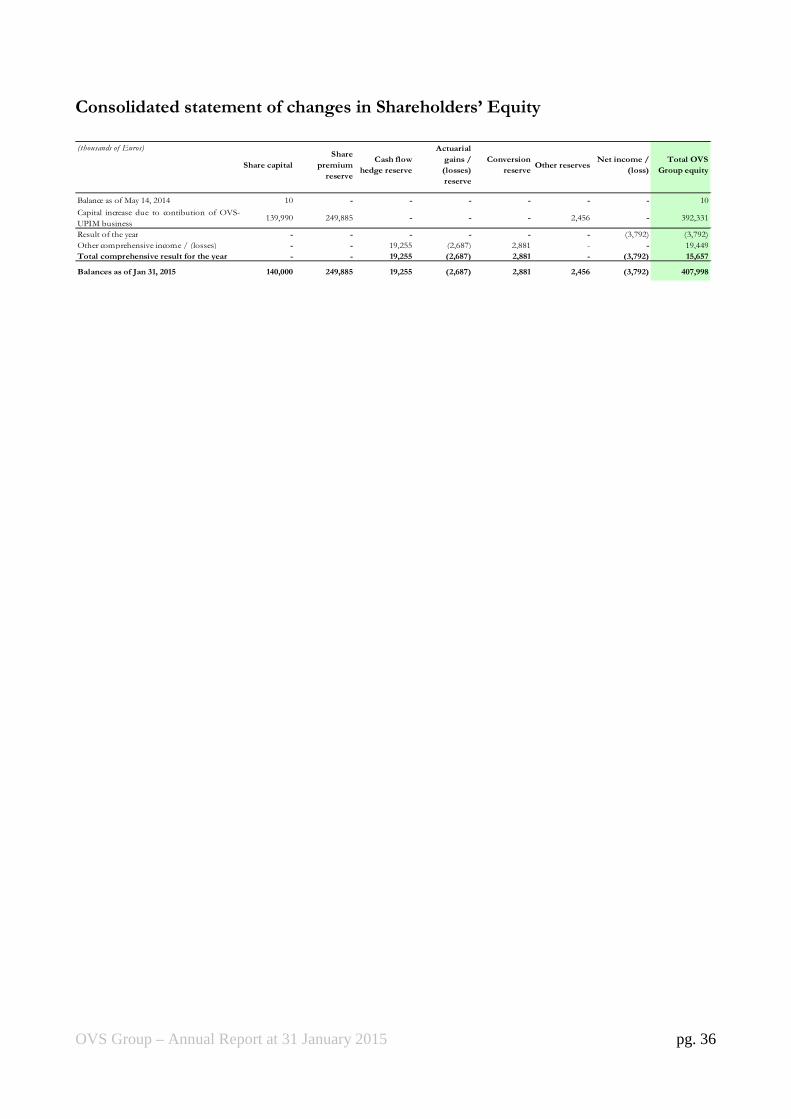
Consolidated statement of changes in Shareholders’ Equity
(thousands of Euros)
Balance as of May 14, 2014 10 - - - - - - 10
Capital increase due to contibution of OVS-
UPIM business 139,990 249,885 - - - 2,456 - 392,331
Result of the year - - - - - - (3,792) (3,792)
Other comprehensive income / (losses) - - 19,255 (2,687) 2,881 - - 19,449
Total comprehensive result for the year - - 19,255 (2,687) 2,881 - (3,792) 15,657
Balances as of Jan 31, 2015 140,000 249,885 19,255 (2,687) 2,881 2,456 (3,792) 407,998
Cash flow
hedge reserve
Actuarial
gains /
(losses)
reserve
Conversion
reserve
Net income /
(loss)
Total OVS
Group equityShare capital
Share
premium
reserve
Other reserves

OVS Group – Annual Report at 31 January 2015 pg. 37
EXPLANATORY NOTES
GENERAL INFORMATION
OVS S.p.A. (hereinafter the Company or Parent Company) is a company formed on 14 May 2014 and
domiciled in Italy and is organised under the law of the Italian Republic with registered office in
Venice-Mestre, via Terraglio No. 17.
OVS S.p.A., in its current configuration, came about due to a corporate reorganisation process that
entailed the carving out of a group of assets and liabilities (the OVS-UPIM Business Unit, together with
the Company and hereinafter, "OVS Group ") by means of the transferral of this business unit (the
"Transferral") by Gruppo Coin to a newly created company (OVS S.p.A.) which is wholly controlled by
it, by means of a capital increase in kind subscribed by Gruppo Coin, with effect from 31 July 2014.
Therefore, the financial year ended 31 January 2015 represent the first financial year for OVS Group.
Specifically, on 23 July 2014:
a) the Company's extraordinary general meeting resolved to increase the share capital by 139,990,000
euros, from 10,000 euros to 140,000,000 euros, with a premium of 249,885,000 euros, to be paid in
through the Transferral of the OVS-UPIM Business Unit by sole shareholder Gruppo Coin;
b) Gruppo Coin subscribed for the entire capital increase and executed it immediately, with the
Transferral taking effect as of the final instant of 31 July 2014; and
c) the same extraordinary general meeting resolved to transform OVS S.r.l. into a limited company
named OVS S.p.A. As a result of this transformation, the Company's share capital was divided into
140,000,000 shares with no par value.
The Transferral procedure was configured as a "business combination involving entities or businesses
under common control". This operation is not governed by IFRS 3, which applies to methods of
accounting for business combinations, nor by any other IFRS. In the absence of a reference accounting
standard, it is believed that the choice of methodology for the accounting representation of the
operation must still meet the requirements of IAS 8: i.e., the reliable and faithful representation of the
operation. Moreover, the accounting standard chosen to represent operations "under common control"
must reflect the economic substance of such operations, regardless of their legal form. The notion of
economic substance is therefore a key guiding factor for the choice of methods used to account for the
operations in question. Economic substance must refer to the generation of added value that effectively
results in significant changes in the cash flows of the net assets transferred. The current interpretations
and current guidelines should also be considered for the accounting recognition of the operation, and
specifically, the Assirevi [Italian Association of Auditors] Preliminary Guidelines on IFRS (OPI 1),
relating to the "accounting treatment of business combinations of entities under common control in
the separate financial statements and the consolidated financial statements". The net assets transferred
OVS Group – Annual Report at 31 January 2015 pg. 38
must therefore be recognised at the carrying amounts that they had in the acquired company, or, if
available, the amounts recorded in the consolidated financial statements of the company with common
control. The Company therefore recognised the net assets transferred at the carrying amounts recorded
in the consolidated financial statements of the controlling company (Gruppo Coin).
Borsa Italiana, with Provision 8006 of 10 February 2015, approved the admission to trading of the
Company's shares on the Mercato Telematico Azionario (MTA), organised and managed by Borsa
Italiana S.p.A..
2 March 2015 was the first day of trading in the Company's shares on the MTA.
STRUCTURE AND CONTENT OF THE FINANCIAL STATEMENTS
The consolidated financial statements of OVS Group at 31 January 2015 were prepared in accordance
with the International Financial Reporting Standards (“IFRS”) issued by the International Accounting
Standards Board. "IFRS" is intended to mean all the revised International Accounting Standards (IAS),
and all the interpretations of the International Financial Reporting Interpretations Committee (IFRIC),
previously known as the Standing Interpretations Committee (SIC). which at the reporting date for the
consolidated financial statements were approved by the European Union under the procedure set forth
in (EC) Regulation 1606/2002 of the European Parliament and the European Council of 19 July 2002.
The consolidated financial statements of OVS Group, which comprise the consolidated statement of
financial position, the consolidated income statement, the consolidated statement of comprehensive
income, the consolidated statement of cash flows, the statement of changes in consolidated
shareholders' equity and the explanatory notes, and are presented in euros as the current currency of
the economies in which the Group chiefly operates, unless otherwise indicated.
These consolidated financial statements were prepared on a going concern basis, as the directors have
verified the absence of any financial, operational or other indicators that could signal problems with the
Group's ability to meet its obligations in the foreseeable future, and particularly in the next 12 months.
OVS S.p.A. has chosen the following types of accounting schedules to present its consolidated
accounts from among the options provided by IAS 1:
- Statement of financial position: assets and liabilities are classified by expiry, with current and non-
current items shown separately;
- Income statement: prepared separately from the statement of comprehensive income with
operating costs classified by nature ;
OVS Group – Annual Report at 31 January 2015 pg. 39
- Statement of comprehensive income: includes, as well as net profit, changes in shareholders'
equity related to items of an economic nature which, by express provision of the international
accounting standards, are recognised as components of shareholders' equity;
- Statement of cash flows: the statement shows the cash flows from operating, investment and
financial activities. The indirect method was used to prepare this statement;
- Consolidated statement of changes in shareholders' equity: profit for the year and each item of
income and expense not posted to the income statement but recognised directly in equity
pursuant to specific IFRS.
The schedules used, as specified above, provide the best representation of the OVS Group’s financial
position and profit performance.
These explanatory notes analyse, expand upon and comment on the values shown in OVS Group’s
consolidated financial statements. They are accompanied by additional information deemed necessary
to give a true and fair view of the Group's financial position and results.
Changes in the items recognised under assets and liabilities are elaborated upon when they are
significant.
The consolidated financial statements are prepared on a historical cost basis, altered as required for the
valuation of some derivatives.
Please see the Report on Operations for information on the nature of the Group's activity and
significant events taking place after the reporting period.
The financial statements have been audited by PricewaterhouseCoopers S.p.A.
OVS Group – Annual Report at 31 January 2015 pg. 40
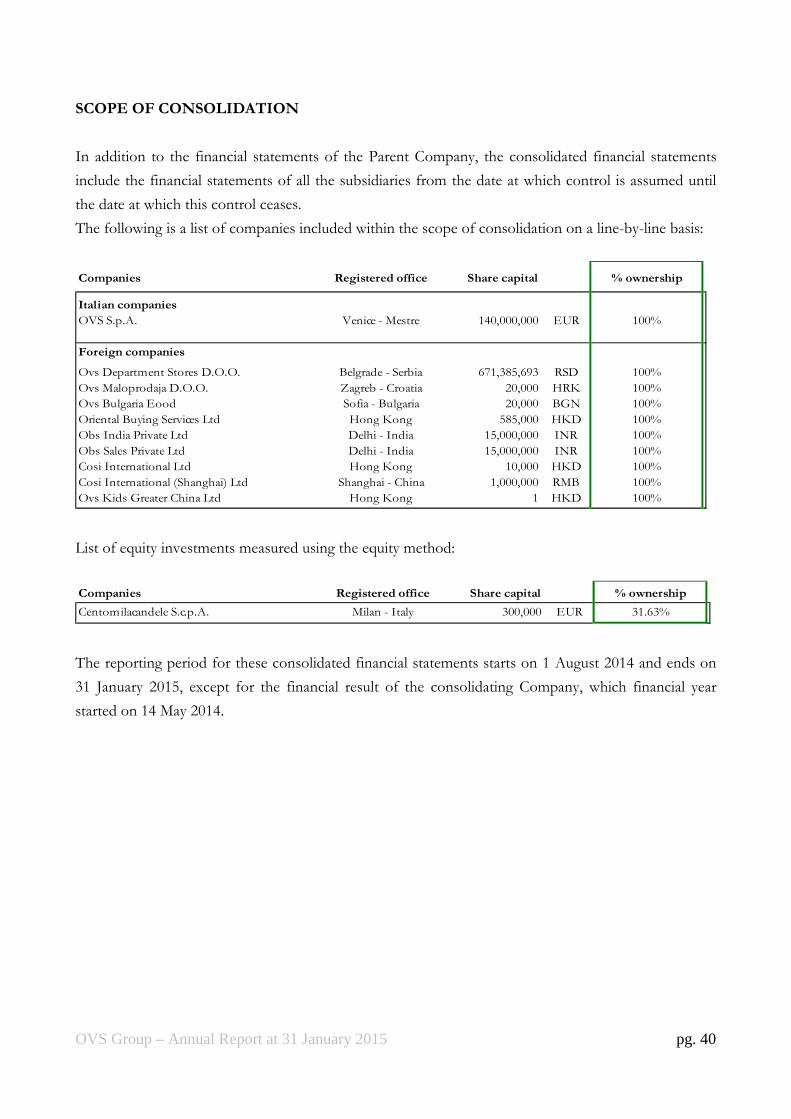
SCOPE OF CONSOLIDATION
In addition to the financial statements of the Parent Company, the consolidated financial statements
include the financial statements of all the subsidiaries from the date at which control is assumed until
the date at which this control ceases.
The following is a list of companies included within the scope of consolidation on a line-by-line basis:
Companies Registered office Share capital % ownership
Italian companies
OVS S.p.A. Venice - Mestre 140,000,000 EUR 100%
Foreign companies
Ovs Department Stores D.O.O. Belgrade - Serbia 671,385,693 RSD 100%
Ovs Maloprodaja D.O.O. Zagreb - Croatia 20,000 HRK 100%
Ovs Bulgaria Eood Sofia - Bulgaria 20,000 BGN 100%
Oriental Buying Services Ltd Hong Kong 585,000 HKD 100%
Obs India Private Ltd Delhi - India 15,000,000 INR 100%
Obs Sales Private Ltd Delhi - India 15,000,000 INR 100%
Cosi International Ltd Hong Kong 10,000 HKD 100%
Cosi International (Shanghai) Ltd Shanghai - China 1,000,000 RMB 100%
Ovs Kids Greater China Ltd Hong Kong 1 HKD 100%
List of equity investments measured using the equity method:
Companies Registered office Share capital % ownership
Centomilacandele S.c.p.A. Milan - Italy 300,000 EUR 31.63%
The reporting period for these consolidated financial statements starts on 1 August 2014 and ends on
31 January 2015, except for the financial result of the consolidating Company, which financial year
started on 14 May 2014.
OVS Group – Annual Report at 31 January 2015 pg. 41
PRINCIPLES OF CONSOLIDATION
The consolidated financial statements include the financial statements of the Parent Company, OVS
S.p.A., and the companies over which it has the right to exercise control according to the definition of
IFRS 10. That definition states that an investor controls an entity in which it has invested when it has
the power to govern the entity’s significant activities, has exposure or rights to variable returns from its
involvement with the entity and has a tangible opportunity to use its power to influence the amount of
returns from the investment.
Investments in affiliated enterprises (those under significant influence pursuant to IAS 28) are
recognised using the equity method. Joint arrangements (under agreements that establish that two or
more parties hold common control, pursuant to IFRS 11) are recognised using the equity method, if
they can be classified as joint ventures, or by recognising their shares of assets, liabilities, costs and
revenues, if they can be classified as joint operations.
Financial statements of subsidiaries are included in the consolidated financial statements from the date
at which control is assumed until the date at which this control ceases.
Where necessary, the statements used to draw up the consolidated statements were appropriately
reclassified and adjusted to bring them into line with the Group’s accounting policies.
The following consolidation criteria are used:
• for equity investments consolidated line by line, the carrying amount of the individual
consolidated equity investments is eliminated against the relative shareholders' equity, with the
assumption of the assets, liabilities, costs and revenues of the subsidiaries, regardless of the
size of the investment held. Any share of shareholders’ equity and net profit allocated to
minority shareholders are identified separately on the balance sheet and income statement;
• all intra-group balances and transactions are eliminated, as are profits and losses (the latter
only if they do not represent effective impairment of the asset transferred) arising from
commercial transactions, including the sale of business units in the Parent Company's
subsidiaries, or financial intra-group transactions not yet realised with third parties;
• all increases/decreases in the shareholders' equity of the consolidated companies arising from
results generated after the date of acquisition of the equity investment are booked to a
dedicated equity reserve named "Retained earnings (accumulated losses)" at the time of the
elision;
• the dividends distributed by Group companies are eliminated in the income statement at the
time of consolidation;
• changes in the amounts held in subsidiaries that do not lead to a loss of control or that
represent increases after acquisition of control are recognised as changes in shareholders’
equity.
OVS Group – Annual Report at 31 January 2015 pg. 42
Business combinations
The Group recognises business combinations using the acquisition method pursuant to IFRS 3 –
Business Combinations.
Under that method, the acquisition cost in a business combination is regarded as the fair value, at the
date of transfer of control, of the assets transferred, the liabilities assumed in exchange for control of
the acquired company. Ancillary costs related to the transaction are generally recognised in the income
statement at the time they are incurred.
Goodwill is determined as the excess of the sum of the considerations transferred for the business
combination, shareholders' equity attributable to third parties and the fair value of any equity
investment previously held in the acquiree, over the net assets and liabilities acquired/assumed at the
acquisition date.
If a business combination is achieved in different stages by successive purchases of shares, each stage is
treated separately using the cost and information related to the fair value of assets, liabilities and
contingent liabilities at the date of each transaction to determine the amount of any difference. When a
subsequent acquisition allow to reach the control of a company, the stake previously owned are
accounted based on the fair value of assets, liabilities and contingent liabilities, determined on the date
of purchase of control and the difference is recognized in income statement.
Financial statements in foreign currencies
The translation into euros of the financial statements of foreign subsidiaries denominated in currencies
other than the Euro is carried out by applying the exchange rates in force at the end of the year to
assets and liabilities and applying average exchange rates in the period to income statement items, while
shareholders' equity is recognised at historical exchange rates, usually identified as the exchange rates at
the end of the first year in which the investee company was included in the scope of consolidation.
Exchange rate gains or losses arising from the translation of financial statements presented in foreign
currencies using the above methods are cumulatively recognised in the statement of comprehensive
income in a specific equity reserve until the equity investments are disposed of.
The exchange rates used for translation are shown in the following table:
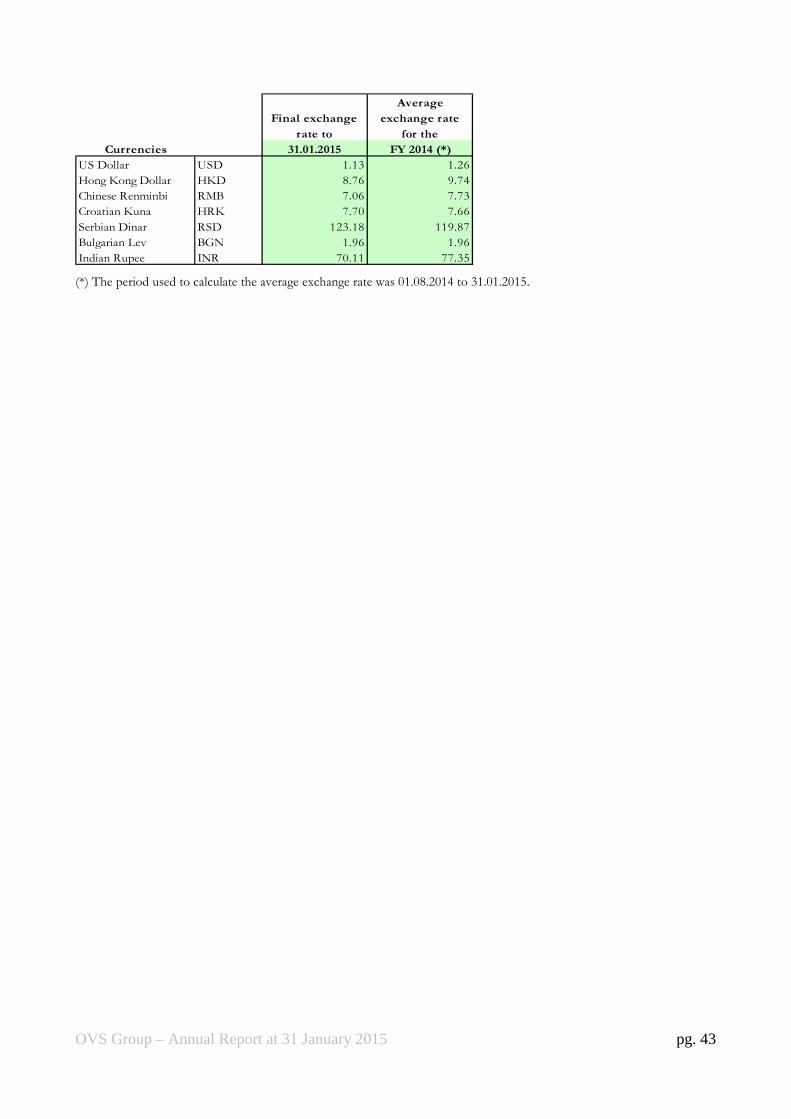
OVS Group – Annual Report at 31 January 2015 pg. 43
Final exchange
rate to
Average
exchange rate
for the
Currencies 31.01.2015 FY 2014 (*)
US Dollar USD 1.13 1.26
Hong Kong Dollar HKD 8.76 9.74
Chinese Renminbi RMB 7.06 7.73
Croatian Kuna HRK 7.70 7.66
Serbian Dinar RSD 123.18 119.87
Bulgarian Lev BGN 1.96 1.96
Indian Rupee INR 70.11 77.35
(*) The period used to calculate the average exchange rate was 01.08.2014 to 31.01.2015.
OVS Group – Annual Report at 31 January 2015 pg. 44
ACCOUNTING STANDARDS AND VALUATION CRITERIA
The main accounting policies and valuation criteria used by the Group are described below.
Goodwill
Goodwill is recognised at cost, less any accumulated impairment.
Goodwill acquired as part of a business combination is determined as the excess of the sum of the
considerations transferred for the business combination, shareholders' equity attributable to third
parties and the fair value of any equity investment previously held in the acquiree, over the net assets
and liabilities acquired/assumed at the acquisition date.
If the value of the net assets acquired and liabilities assumed at the acquisition date exceeds the value of
the amounts transferred, of the value of net equity attributable to non-controlling interest and of the
fair value of previously held equity interest in the acquire company, the excess is immediately
recognized in the income statement as income.
Goodwill is not amortised, but is tested annually, and whenever events or circumstances indicate the
possibility of impairment, for recoverability pursuant to IAS 36 - Impairment of Assets.
If the recoverable amount is lower than the carrying amount, the asset is written down to the
recoverable amount. If goodwill is allocated to a cash-generating unit that is partially
transferred/disposed of, the goodwill associated with this unit is used to determine any gain/loss
arising from the operation.
Brands
Brands deriving from business combinations are recognised at fair value at the date of the combination,
according to the acquisition method. They are not amortised as they have an indefinite useful life, but
are tested annually, and whenever events or circumstances indicate the possibility of impairment, for
recoverability pursuant to IAS 36 - Impairment of Assets. After initial recognition, the brands are
valued at cost less any cumulative impairment.
Intangible assets
Intangible assets consist of non-monetary items, identifiable and without physical substance, which can
be controlled by the Group, can generate future economic benefits and whose cost can be reliably
determined. These items are recognised at cost, less amortisation, calculated using the straight-line
method for a period corresponding to the useful life, and any impairment. Useful life is reviewed
annually. Specifically:

OVS Group – Annual Report at 31 January 2015 pg. 45
Licences – Licenses deriving from business combinations are recognised at fair value at the date of the
combination, according to the acquisition method. After initial recognition, licences are valued at cost
less amortisation and any cumulative impairment. Amortisation is calculated based on the difference
between the cost and the residual value at the end of their useful life, on a straight line basis over their
useful life (defined as 40 years).
Please see note 8 "Intangible assets" for a description of the criteria used to define useful life and
residual value at the end of useful life.
Software – The costs of software licences, including ancillary costs, are capitalised and recognised in the
financial statements net of amortisation and any cumulative impairment. The amortisation rate used is
20%.
Other intangible assets – These assets are measured at acquisition cost, less amortisation calculated on a
straight-line basis throughout their useful life and cumulative impairment.
The value of the franchising network, recognised after the business combination, is amortised on the
basis of a useful life of 20 years.
Property, plant and equipment
Property, plant and equipment is measured at acquisition cost, including ancillary costs booked directly,
less depreciation and cumulative impairment. Land is not depreciated even if acquired at the same time
as buildings.
Depreciation is booked from the month in which the assets enter into operation.
Depreciation rates are charged on a monthly basis at constant rates that allow assets to be depreciated
until their useful life is ended or, in the case of disposals, until the last month of use.
The depreciation rates used are as follows:
Buildings 3 - 6%
Light construction 10%
Plant and equipment for lifting, loading, unloading and weighing 7.5%
Miscellaneous machinery, appliances and equipment 11.1%
Special facilities for communications and remote signalling 25%
Furnishings 11.1%
Alarm systems 11.1%
Specific bar, restaurant and canteen facilities 8%
Bar, restaurant and canteen furnishings 25%
Office furniture and ordinary machinery 12%
Electromechanical and electronic office equipment 20%
Cash registers 20%
Motor vehicles and internal transport 20 - 25%
OVS Group – Annual Report at 31 January 2015 pg. 46
Ordinary maintenance costs are charged in full to the income statement in the period in which they are
incurred.
Leasehold improvements are classified as property, plant and equipment based on the nature of the
cost incurred. The amortisation period is the lesser of the remaining useful life of the tangible asset and
the remaining term of the lease, which is usually 12 years.
Assets assumed through finance leases, through which all the risks and rewards of ownership are
substantially transferred to the Group, are recognised under tangible assets at their current value, or, if
lower, the present value of the minimum lease payments, with a contra-entry of financial debt to the
lessor.
This debt is progressively reduced according to the plan for repayment of principal amounts included in
the contractually established payments, while the value of the asset recognised under tangible assets is
systematically depreciated according to the economic and technical life of the asset.
Impairment of tangible and intangible assets
IAS 36 stipulates that impairment of tangible and intangible assets must be measured if there are
indicators suggesting that such a problem might exist.
Impairment testing takes place at least once a year in the case of goodwill, other intangible assets with
an indefinite useful life and assets not available for use.
The recoverability of the amounts recognised is assessed by comparing the carrying amount with the
higher of fair value (current realisable value) less the costs of disposal and the value in use of the asset.
Value in use is defined by discounting the expected cash flows generated by the asset.
To determine value in use, expected future cash flows are discounted using a rate that reflects current
market valuations of the time value of money, compared with the investment period and the specific
risks associated with the activity.
For the purposes of assessing impairment, assets are analysed starting from the lowest level for which
there are separately identifiable independent cash flows (cash generating units). Within the Group, the
individual OVS and Upim stores have been identified as cash generating units.
If the recoverable amount of an asset is lower than the carrying amount, the carrying amount is reduced
to the recoverable amount. This reduction constitutes impairment and is charged to the income
statement.
If there is an indicator of reversal of the impairment loss, the recoverable amount of the asset is
recalculated and the carrying amount is increased to this new amount. The increase in the carrying
amount may not, however, exceed the net carrying amount that the asset would have had if the
impairment had not arisen.
Goodwill impairment cannot be reversed.

OVS Group – Annual Report at 31 January 2015 pg. 47
Other equity investments
Other equity investments (i.e., other than in subsidiaries, associates and companies under common
control) are included among non-current assets, or among current assets if they will remain among the
assets of OVS Group for a period of, respectively, more than one year and no longer than one year.
Other equity investments constituting financial assets available for sale are measured at fair value, if this
can be determined, and any gains or losses deriving from changes in the fair value are entered directly
under other comprehensive gains/(losses), until they are transferred or undergo impairment, at which
time the other comprehensive gains/(losses) previously recognised in equity are recognised in the
income statement for the period.
Other equity investments for which fair value is not available are recognised at cost, written down for
any impairment.
Financial assets
Financial assets are recognised under current and non-current assets based on maturity and
expectations of when they will be converted into monetary assets. Financial assets include equity
investments in other companies (other than subsidiaries, associates and companies under common
control), derivatives, receivables and cash and cash equivalents.
a) Classification
For the purposes of measurement, the Group subdivides financial assets into the following categories:
financial assets at fair value with changes recognised directly in the income statement, loans and
receivables, financial assets held to maturity and financial assets available for sale. Classification
depends on the purpose for which the financial asset was acquired. Financial assets are classified at the
time of initial recognition.
i. Financial assets measured at fair value with changes recognised directly in the income statement
This category includes both financial assets held for trading and derivatives that do not meet the criteria
for hedge accounting.
ii. Loans and receivables
Loans and receivables comprise non-derivative financial assets with fixed or determinable maturities.
They are recognised under current assets, except for the portion falling due beyond the 12-month
period after the reporting date, which are classified as non-current assets.
OVS Group – Annual Report at 31 January 2015 pg. 48
iii. Financial assets held to maturity
Financial assets held to maturity comprise non-derivative assets with fixed or determinable payments
that the Group intends to hold to maturity. Classification to current or non-current assets depends on
whether they are expected to be realised within or beyond the 12-month period after the reporting date.
iv. Financial assets available for sale
Financial assets available for sale represent a residual category comprising designated non-derivative
financial instruments or those not attributable to any of the above categories of financial instruments.
These assets are included among non-current assets, unless there is an intention to dispose of them
within the 12-month period after the reporting date.
b) Recognition and measurement
Financial assets, regardless of how they are classified, are initially recognised at fair value, with possible
additions for ancillary acquisition costs.
After initial recognition, financial assets at fair value with changes recognised directly in the income
statement and financial assets available for sale are recognised at fair value. In the first case, changes in
fair value are posted to the income statement in the period in which they take place; in the second, they
are posted to the statement of comprehensive income.
Loans and receivables and financial assets held to maturity are recognised using the amortised cost
criterion and the effective interest rate method after initial recognition. Any impairment is recorded in
the income statement to offset the value of the asset. The value of assets previously written down for
impairment is reversed if the circumstances that led to the write-down no longer exist.
Financial assets are eliminated from the financial statements when the rights to receive the cash flows
associated with the financial assets expire or have been transferred to third parties and the Group has
substantially transferred all the risks and benefits of ownership.
For the treatment of derivatives, please see the relevant section below.
Inventories
Inventories are recognised at the lower of acquisition cost and net realisable value.
The purchase cost is determined by configuring the weighted average cost for the reporting period. The
cost also includes ancillary costs directly attributable to the purchase of goods.
Goods relating to the collections are written down according to the presumed possibility of their future
realisation, by recognising a specific adjustment provision.
OVS Group – Annual Report at 31 January 2015 pg. 49
Cash and cash equivalents
Cash and cash equivalents includes available cash and credit balances of bank current accounts with no
limits or restrictions.
Cash in foreign currency is valued according to period-end exchange rates.
Provision for risks and charges
Provisions for risks and charges are allocated for current obligations, legal or constructive, arising from
a past event in respect of third parties for which the utilisation of resources, the amount of which can
be reliably estimated, is probable.
The amount recognised as a provision is the best estimate of the expenditure required to settle the
current obligation fully. Risks for which the emergence of a liability is only possible are disclosed in the
explanatory notes, and no provision is made.
Employee benefits
Post-employment benefits are defined under either "defined contribution" plans or "defined benefit"
plans.
Defined benefit plans, such as the provision for employee severance benefits accrued before the entry
into force of the 2007 Finance Law, are plans with guaranteed benefits for employees that are paid out
at the end of the employment relationship. The liability relating to defined benefit plans is determined
on the basis of actuarial assumptions and booked on an accruals basis in line with the service required
to obtain the benefits; the liability is measured annually by independent actuaries.
Employee severance benefits and pension provisions, which are determined using an actuarial method,
provide for the recognition in the income statement under employment cost of the rights accrued
during the year, while the figurative cost is included among net financial income (expenses). Actuarial
gains and losses that reflect the effects of changes in the actuarial assumptions used are instead fully
recognised in shareholders' equity in the year in which they arise.
From 1 January 2007, the 2007 Law and the associated implementing decrees introduced significant
amendments to the rules on employee severance benefits, including options for employees, to be
exercised by 30 June 2007, with regard to the allocation of their accruing severance benefits.
Specifically, new flows of severance benefits may be directed by the employee to preselected or
company pension schemes (in the latter case, the company will pay severance benefit contributions into
a treasury account set up with the INPS [Italian social security and welfare institution]).
As a result of these amendments, the provision for employee severance benefits accrued since the date
OVS Group – Annual Report at 31 January 2015 pg. 50
of the employee option (defined benefit plan) has been recalculated by independent actuaries to exclude
the component relating to future pay increases.
The portion of the employee severance benefits that has accrued since the option date (30 June 2007) is
regarded as a defined benefit plan, and the accounting treatment is similar to that used for all other
contribution payments.
Employee benefits also include pension provisions and similar obligations. This provision mainly
includes liabilities and rights accrued by the employees of the former Standa, in relation to
supplementary pension schemes; the liability associated with such defined-benefit programs is
determined on the basis of actuarial assumptions and the amount recognised in the financial statements
represents the present value of the Group's obligation.
Financial liabilities
Payables and other financial and/or trade liabilities are initially recognised at fair value, less any
transaction costs incurred in relation to obtaining financing. They are subsequently carried at amortised
cost; any difference between the amount received (less transaction costs) and the total repayment
amount is recognised in the income statement over the period of the loan, using the effective interest
rate method.
Borrowings are classified as current liabilities unless the Group has an unconditional right to defer
settlement of the liability for 12 months after the reporting date; in this case, only the portion falling
due within 12 months of the reporting date is classified as a current liability.
Derivatives
Derivatives are assets and liabilities recognised at fair value.
The Group uses derivatives to hedge exchange rate risk or interest rate risk.
Pursuant to IAS 39, derivatives may only be booked using hedge accounting methods when:
• at the beginning of the hedge there is formal designation and documentation of the hedging
relationship;
• it is assumed that the hedge is highly effective;
• effectiveness can be reliably measured;
• the hedge is highly effective throughout the financial reporting periods for which it is designated.
When derivatives meet the criteria for hedge accounting, the following accounting treatments apply:
• if the derivatives hedge the risk of changes in the fair value of the assets or liabilities being hedged
OVS Group – Annual Report at 31 January 2015 pg. 51
(fair value hedge, e.g., hedging of fluctuations in the fair value of fixed-rate assets/liabilities), the
derivatives are recognised at fair value with changes recognised in the income statement;
correspondingly, the assets or liabilities being hedged are adjusted to reflect changes in fair value
associated with the hedged risk;
• if the derivatives hedge the risk of changes in the cash flows of the assets or liabilities being hedged
(cash flow hedge, e.g., hedging of changes in the cash flows of assets/liabilities due to variations in
interest rates), changes in the fair value of the derivatives are initially recognised in equity and
subsequently in the income statement in line with the economic effects of the hedged transaction.
If hedge accounting cannot be applied, gains or losses arising from the measurement of the derivative
at fair value are immediately recognised in the income statement.
Business segment information
The information relating to business segments was provided pursuant to IFRS 8 – Operating Segments,
which stipulates that information be presented in a way that is consistent with the procedures used by
management to make operational decisions. The operating segments and the information presented are
therefore identified according to the internal reports used by management to allocate resources to the
various segments and to analyse their performance.
IFRS 8 defines an operating segment as a component of an entity that: i) engages in business activities
from which it may earn revenues and incur expenses (including revenues and expenses relating to
transactions with other components of the same entity); ii) whose operating results are reviewed
regularly by the entity's chief operating decision maker to make decisions about resources to be
allocated to the segment and assess its performance; and iii) for which discrete financial information is
available.
The operating segments identified by management, which incorporate all of the services and products
provided to customers, are represented by the OVS division, dedicated to the marketing of clothing
products for the value fashion market segment, and the UPIM division, which provides women’s,
men’s and children clothing to the value segment of the Italian market, as well as products relating to
the homeware and fragrance segments.
Revenues and costs
Revenues are recognised in so far as it is likely that the economic benefits associated with the sale of
goods or the provision of services will flow to the Group and the relative amount can be reliably
measured. Revenues are recognised at the fair value of the consideration received or receivable, taking
OVS Group – Annual Report at 31 January 2015 pg. 52
into account the amount of any trade discounts, reductions and rebates granted.
Revenues from sales and services are recognised respectively at the time of the actual transfer of the
risks and benefits typically associated with ownership or on completion of the service.
Costs are recognised when they relate to goods and services sold or used during the year, while in the
case of multi-year use the costs are systematically spread.
Income and costs deriving from leases
Income and costs deriving from operating leases are recognised on a straight-line basis over the
duration of the leases to which they relate. Potential rental payments are recognised as income in the
years in which they are obtained.
Income tax
Current income tax for the year is calculated by applying the current tax rates on reasonably estimated
taxable income, determined in accordance with the tax regulations in force. The expected payable, net
of payments on account and withholding taxes, is recognised in the statement of financial position
under "Current tax liabilities" (or under "Current tax assets" if the payments on account made and the
withholdings exceed the expected payable).
Deferred tax assets and deferred tax liabilities are determined on the basis of taxable temporary
differences between the carrying amount of assets and liabilities and their value for tax purposes, except
for goodwill, which is not tax deductible, and are classified under non-current assets and liabilities.
Income tax is recognised in the income statement, except in relation to items directly credited to or
debited from equity, in which case the tax effect is recognised directly in equity.
Deferred tax assets, including those relating to previous tax losses, are recognised to the extent that it is
probable that future taxable income will be available in respect of which they can be recovered.
The value of deferred tax assets is reviewed at each reporting date and reduced to the extent that it is
no longer probable that sufficient taxable income will be available in the future to use all or part of this
receivable.
Deferred tax assets and deferred tax liabilities are measured at the tax rates that are expected to apply to
the period when the asset is realised or the liability is settled, based on the tax rates in force and tax
rates that have been enacted or substantively enacted at the reporting date.
OVS Group – Annual Report at 31 January 2015 pg. 53
OVS S.p.A., Gruppo Coin S.p.A. and C.O.S.I. S.p.A. have joined the tax consolidation scheme.
Relations arising from participating in the tax consolidation scheme are regulated by specific contractual
agreements approved and signed by the member parties.
Exchange rate gains and losses
Foreign exchange transactions are recognised at the current exchange rate at the date of completion of
the transaction. Monetary assets and liabilities denominated in foreign currencies are translated into
euros at the current exchange rate at the reporting date and recognised in the income statement under
financial income and expenses.
Earnings per share
Earnings per share – basic
Basic earnings per share is calculated by dividing the profit pertaining to OVS Group by the weighted
average of the ordinary shares outstanding during the year, excluding treasury shares.
Earnings per share – diluted
Diluted earnings per share is calculated by dividing the profit pertaining to OVS Group by the weighted
average of the ordinary shares outstanding during the year, excluding treasury shares. To calculate
diluted earnings per share, the weighted average number of shares outstanding is adjusted assuming the
exercise by all owners of rights with a potentially dilutive effect, while the profit pertaining to OVS
Group is adjusted to take account of any effects, net of tax, arising from the exercise of these rights.
Dividends
Dividends are recognised at the date of approval by the general meeting.
Use of estimates
The preparation of the consolidated financial statements in accordance with the IFRSs requires
management to make estimates and assumptions that affect the reported amounts of assets and
liabilities and the disclosure of contingent assets and liabilities at the reporting date. The final results
may differ from these estimates. Estimates are used to recognise provisions for doubtful accounts,
OVS Group – Annual Report at 31 January 2015 pg. 54
inventory obsolescence, depreciation and amortisation, impairment of assets, employee benefits,
restructuring provisions, deferred tax assets, other provisions for risk and valuations of derivatives.
Estimates and assumptions are reviewed periodically and the effects of any changes are immediately
reflected in the income statement.
Impairment of tangible and intangible assets
Goodwill and the brands are tested annually, and whenever events or circumstances indicate the
possibility of impairment, for recoverability pursuant to IAS 36 - Impairment of Assets. If the
recoverable amount is less than the carrying amount, the asset is written down to its recoverable
amount (defined as the greater of its value in use and its fair value). Verification of the amount requires
subjective judgements to be made, based on information available within OVS Group and from the
market, as well as past experience. In addition, if potential impairment is identified, it is determined
using evaluation techniques regarded as appropriate. The same verifications of value and the same
evaluation techniques are applied to intangible and tangible assets with a definite useful life when there
are indicators suggesting that recovery of the relative net carrying amount through use might be
difficult. The correct identification of indicators of potential impairment and estimates to determine
this depend on factors that may vary over time, with an effect on the valuations and estimates made by
OVS Group.
Depreciation and amortisation
Depreciation and amortisation reflect the best estimate of the expected useful life of assets with a finite
life.
This estimate is based on the possibility of using these assets and their capacity to contribute to
Group's results in future years.
Inventory obsolescence
OVS Group develops and sells items of clothing that change according to customer taste and trends in
the world fashion. The provision for inventory write-downs therefore reflects estimated expected
impairment of the collections in stock, taking account of the Group's capacity to sell items of clothing
through a range of distribution channels.
Provisions for doubtful accounts
The provision for doubtful accounts reflects the best estimate of losses relating to the portfolio of trade
receivables. This estimate is based on the losses expected by OVS Group, determined on the basis of
past experience with similar receivables, current and previous receivables falling due, the careful
monitoring of credit quality and projections of economic and market conditions.
OVS Group – Annual Report at 31 January 2015 pg. 55
Deferred tax assets
Deferred tax assets are booked based on expectations of taxable income in future years for the purpose
of recovering them. The evaluation of expected taxable income for the accounting of deferred tax
assets depends on factors that may vary over time and have significant effects on the recoverability of
the deferred tax assets.
Provisions for risks and charges
Provisions representing the risk of a negative outcome are recognised for legal and tax risks. The
amount of provisions recorded in the financial statements in relation to these risks represents the best
estimate to deal with potential risks. This estimate entails the use of assumptions that depend on factors
that might change over time and that might therefore have significant effects compared with the
current estimates used to prepare the financial statements.
Valuation of derivatives
The determination of the fair value of unlisted financial assets, such as derivatives, takes place using
commonly used valuation techniques that require basic assumptions and estimates. These assumptions
may not occur within the timeframes and in the manner envisaged. Estimates of derivatives may
therefore differ from the final figures.
OVS Group – Annual Report at 31 January 2015 pg. 56
ACCOUNTING STANDARDS, AMENDMENTS AND INTERPRETATIONS WITH
EFFECT FROM 1 JANUARY 2014
The new and/or revised standards of the International Accounting Standards Board (IASB) and the
interpretations of the International Financial Reporting Interpretations Committee (IFRIC), the
application of which is mandatory as of financial year 2014, are set out below.
Description Approved at the date of Effective date stipulated by the standard
this document
IFRS 10 - Consolidated financial statements December 2012 Years beginning on or after 1 January 2014
IFRS 11 - Joint Arrangements December 2012 Years beginning on or after 1 January 2014
IFRS 12 - Disclosure of Interests in Other Entities December 2012 Years beginning on or after 1 January 2014
Amendments to IFRS 10, 11 and 12
on Transition Guidance April 2013 Years beginning on or after 1 January 2014
IAS 27 (revised 2011) - Separate Financial Statements December 2012 Years beginning on or after 1 January 2014
IAS 28 (revised 2011) - Associates and Joint Ventures December 2012 Years beginning on or after 1 January 2014
Amendment to IAS 32 - Financial instruments:
Presentation, on offsetting financial assets
and financial liabilities December 2012 Years beginning on or after 1 January 2014
Amendments to IFRS 10 - Consolidated Financial Statements, IFRS 12 and IAS 27
for investment entities November 2013 Years beginning on or after 1 January 2014
Amendments to IAS 36 - Impairment of Assets December 2013 Years beginning on or after 1 January 2014
Amendment to IAS 39 - Financial instruments: Recognition and Measurement, on the novation of derivatives and hedge accounting December 2013 Years beginning on or after 1 January 2014
IFRS 21 - Levies June 2014 Years beginning on or after 1 January 2014
The adoption of accounting standards, amendments and interpretations shown in the above table had
no significant effects on OVS Group’s financial position or results.
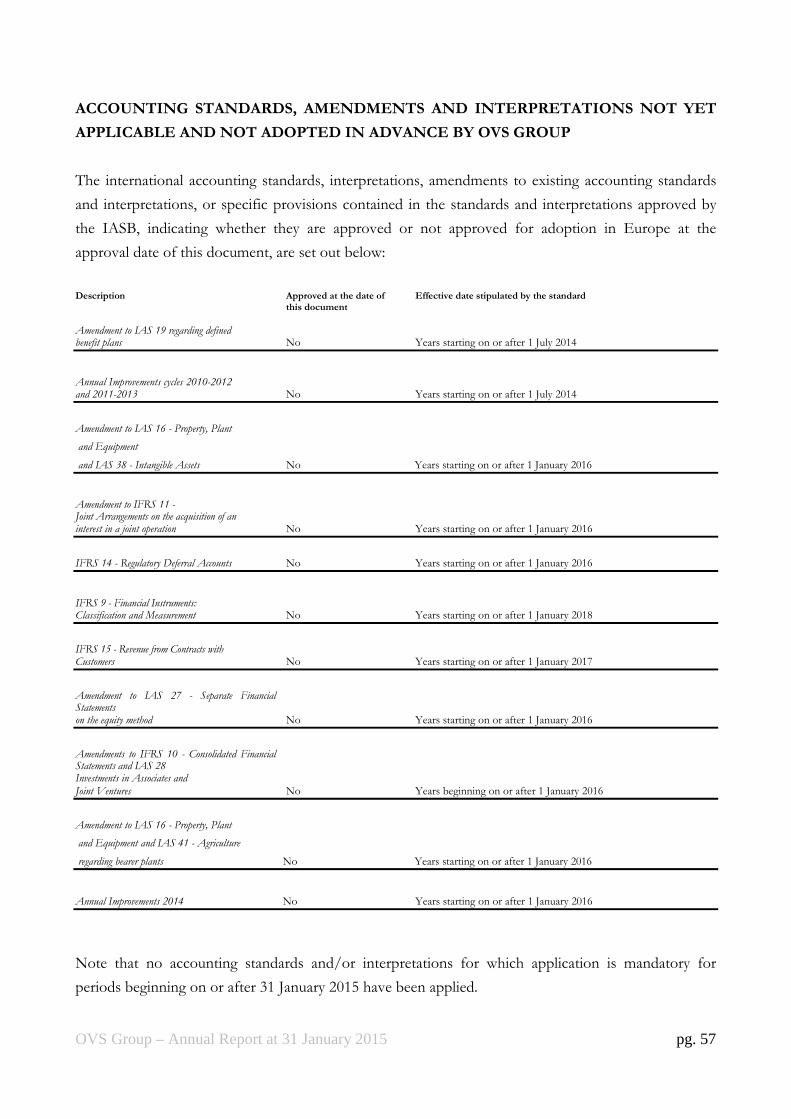
OVS Group – Annual Report at 31 January 2015 pg. 57
ACCOUNTING STANDARDS, AMENDMENTS AND INTERPRETATIONS NOT YET
APPLICABLE AND NOT ADOPTED IN ADVANCE BY OVS GROUP
The international accounting standards, interpretations, amendments to existing accounting standards
and interpretations, or specific provisions contained in the standards and interpretations approved by
the IASB, indicating whether they are approved or not approved for adoption in Europe at the
approval date of this document, are set out below:
Description Approved at the date of Effective date stipulated by the standard
this document
Amendment to IAS 19 regarding defined benefit plans No Years starting on or after 1 July 2014
Annual Improvements cycles 2010-2012 and 2011-2013 No Years starting on or after 1 July 2014
Amendment to IAS 16 - Property, Plant
and Equipment
and IAS 38 - Intangible Assets No Years starting on or after 1 January 2016
Amendment to IFRS 11 - Joint Arrangements on the acquisition of an interest in a joint operation No Years starting on or after 1 January 2016
IFRS 14 - Regulatory Deferral Accounts No Years starting on or after 1 January 2016
IFRS 9 - Financial Instruments: Classification and Measurement No Years starting on or after 1 January 2018
IFRS 15 - Revenue from Contracts with Customers No Years starting on or after 1 January 2017
Amendment to IAS 27 - Separate Financial Statements on the equity method No Years starting on or after 1 January 2016
Amendments to IFRS 10 - Consolidated Financial Statements and IAS 28 Investments in Associates and Joint Ventures No Years beginning on or after 1 January 2016
Amendment to IAS 16 - Property, Plant
and Equipment and IAS 41 - Agriculture
regarding bearer plants No Years starting on or after 1 January 2016
Annual Improvements 2014 No Years starting on or after 1 January 2016
Note that no accounting standards and/or interpretations for which application is mandatory for
periods beginning on or after 31 January 2015 have been applied.

OVS Group – Annual Report at 31 January 2015 pg. 58
OVS Group is assessing the effects of applying the above standards; they are currently not regarded as
likely to have an impact.
FINANCIAL RISKS
The key risks identified, monitored and, as described below, actively managed by OVS Group are as
follows:
• market risk (exchange rate and interest rate risk);
• credit risk (both in relation to normal business relations with customers and to financial
activities); and
• liquidity risk (involving recoverability of financial resources and access to credit and financial
instruments in general).
OVS Group aims to achieve balanced management of its financial exposure over time, geared to
keeping a healthy balance of liabilities and assets in order to ensure the kind of flexibility it needs by
using liquidity generated by current assets and relying on bank loans.
Management of financial risks is guided and monitored in a centralized manner. More specifically, the
central financial office is responsible for analyzing and approving expected financial needs, and it
monitors progress and, when necessary, implements appropriate corrective action.
The financial instruments that OVS Group uses most frequently are the following:
• medium-/long-term financing to cover investments in fixed assets;
• short-term financing, use of lines of credit to finance working capital.
OVS Group has also employed financial instruments to cover fluctuating interest rate risks, which
influenced expenses related to medium-/long-term financial borrowings and consequently the OVS
Group income statement, as well as derivatives geared to reducing exchange rate risks related to the
US dollar.
The following section provides qualitative and quantitative information on the impact on OVS
Group of these risks.
Credit risk
Credit risk represents OVS Group’s exposure to the risk of potential losses arising from default by a
counterparty.
For the period in question, there were no significant concentrations of credit risk, as this risk is
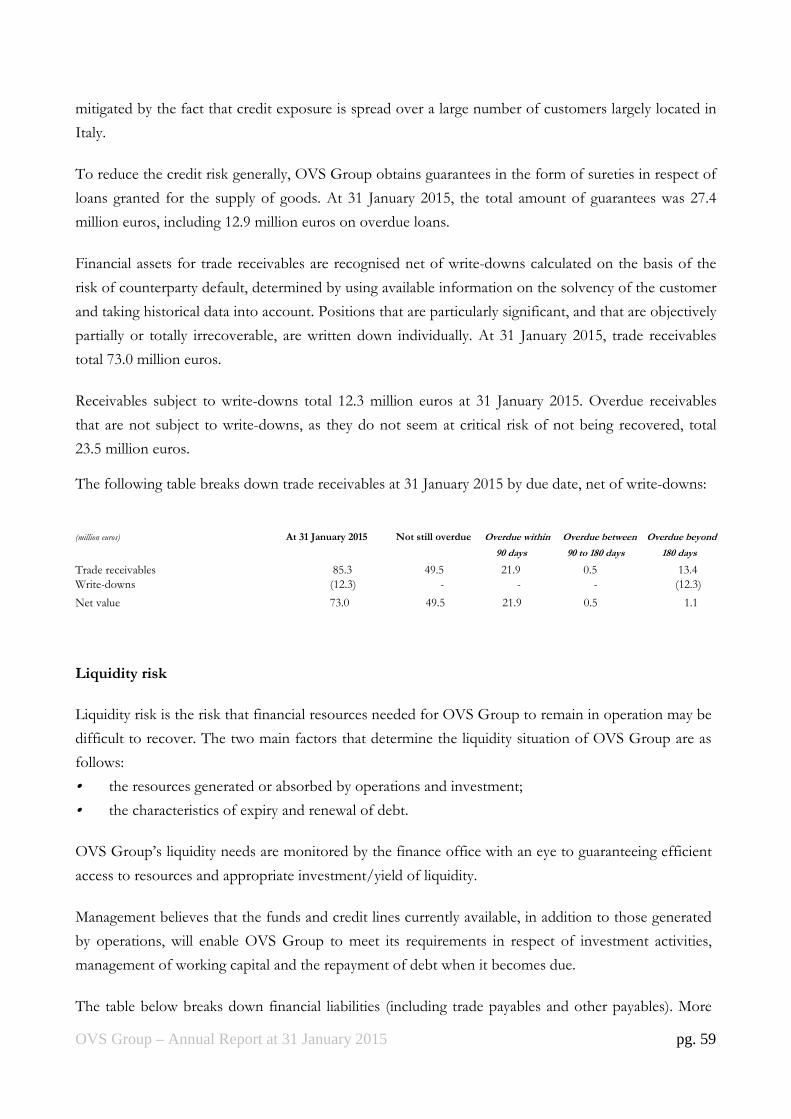
OVS Group – Annual Report at 31 January 2015 pg. 59
mitigated by the fact that credit exposure is spread over a large number of customers largely located in
Italy.
To reduce the credit risk generally, OVS Group obtains guarantees in the form of sureties in respect of
loans granted for the supply of goods. At 31 January 2015, the total amount of guarantees was 27.4
million euros, including 12.9 million euros on overdue loans.
Financial assets for trade receivables are recognised net of write-downs calculated on the basis of the
risk of counterparty default, determined by using available information on the solvency of the customer
and taking historical data into account. Positions that are particularly significant, and that are objectively
partially or totally irrecoverable, are written down individually. At 31 January 2015, trade receivables
total 73.0 million euros.
Receivables subject to write-downs total 12.3 million euros at 31 January 2015. Overdue receivables
that are not subject to write-downs, as they do not seem at critical risk of not being recovered, total
23.5 million euros.
The following table breaks down trade receivables at 31 January 2015 by due date, net of write-downs:
(million euros) At 31 January 2015 Not still overdue Overdue within Overdue between Overdue beyond
90 days 90 to 180 days 180 days
Trade receivables 85.3 49.5 21.9 0.5 13.4
Write-downs (12.3) - - - (12.3)
Net value 73.0 49.5 21.9 0.5 1.1
Liquidity risk
Liquidity risk is the risk that financial resources needed for OVS Group to remain in operation may be
difficult to recover. The two main factors that determine the liquidity situation of OVS Group are as
follows:
• the resources generated or absorbed by operations and investment;
• the characteristics of expiry and renewal of debt.
OVS Group’s liquidity needs are monitored by the finance office with an eye to guaranteeing efficient
access to resources and appropriate investment/yield of liquidity.
Management believes that the funds and credit lines currently available, in addition to those generated
by operations, will enable OVS Group to meet its requirements in respect of investment activities,
management of working capital and the repayment of debt when it becomes due.
The table below breaks down financial liabilities (including trade payables and other payables). More

OVS Group – Annual Report at 31 January 2015 pg. 60
specifically, all flows indicated are non-discounted future nominal cash flows determined using
remaining contractual due dates, regarding both capital expenditures and interest. Financing was
calculated using the contractual payment due date. (million euros) Balance at 31 Jan 2015 < 1 year 1 to 5 years > 5 years Total
Trade payables 374.4 368.8 5.6 - 374.4
Bank liabilities (*) 759.3 759.0 0.3 - 759.3
Other financial payables 6.8 3.2 3.6 - 6.8
Financial payables to parent Company 22.3 22.3 - - 22.3
Financial charges vs banks(**) 5.4 4.9 0.5 - 5.4
Total 1,168.2 1,158.2 10.0 - 1,168.2
(*) The amount includes the value of deferred interest expenses up to 31 January 2015 not still paid. (**) This value has been calculated analyzing accrued real interest paid since 1 February 2015 to the loan depreciation plan. Furthermore, the aggregate includes the nominal interest value for leasing up to expiry date and the value resulting from future cash flows from derivative contracts that, at the Balance sheet date, had a negative fair value.
Derivatives
A breakdown of OVS Group derivatives is shown in the table below:
(million euros) 2014
Assets Liabilities
Interest rate swaps – coverage cash flow 0.0 (1.3)
Forward contracts – coverage cash flow 26.4 0,0
Forward contracts - trading 11.1 0.0
Total 37.5 (1.3)
Current values:
Interest rate swaps – coverage cash flow 0.0 (1.3)
Forward contracts – coverage cash flow 26.4 0.0
Forward contracts – trading 10.0 0.0
Total current values 36.4 (1.3)
Non-current values:
Forward contracts – trading 1.1 0.0
Total non-current values 1.1 0.0

OVS Group – Annual Report at 31 January 2015 pg. 61
Market risk
Interest rate risk
OVS Group uses external financial resources in the form of lending and uses cash from bank
accounts. Changes in market interest rates influence the cost and yield of various forms of financing,
with a consequent effect on the level of financial expenses and proceeds seen by OVS Group.
To manage these risks, OVS Group uses interest rate derivatives (interest rate swaps, or IRS) with the
aim of mitigating, under economically acceptable conditions, the potential impact of changes in
interest rates on the income statement.
The derivatives (IRS) in place at 31 January 2015 consist of one contract signed in 2011 with a primary
bank that is scheduled to come due in July 2015 to cover fluctuating interest rates on existing loans. As
provided in said contracts, exchanged interest rates are at a fixed average rate of 2.48%.
The major elements of that contract are broken down below:
(thousand euros)
Nominal value Fair value at
Derivatives contracts Date of signing Termination date 31 Jan 2015 31 Jan 2015
Interest rate swap (IRS) 22 July 2011 31 July 2015 105,772 (1,256)
Sensitivity analysis
OVS Group exposure to interest rate risk was subject to a sensitivity analysis that shows the impact on
the income statement and balance sheet of a hypothetical shift in market rates of +40 or -40 basis
points compared to the assumed forward rate curve to 31 January 2015. This analysis is based on the
assumption of a generalised and instantaneous change in benchmark interest rates.
Excluding the impact of derivatives on interest rates and the amortized cost of loans, the results of
such a hypothetical, instantaneous and unfavourable (favourable) change in the short-term interest
rates applicable to OVS Group’s variable-rate financial liabilities are illustrated in the table below:
Change on financial charges effect – P&L effect
(million euros) - 40 bps + 40 bps
At 31 Jan 2015 1.6 (1.6)
There are no effects booked on net equity, connected to the only existing IRS.
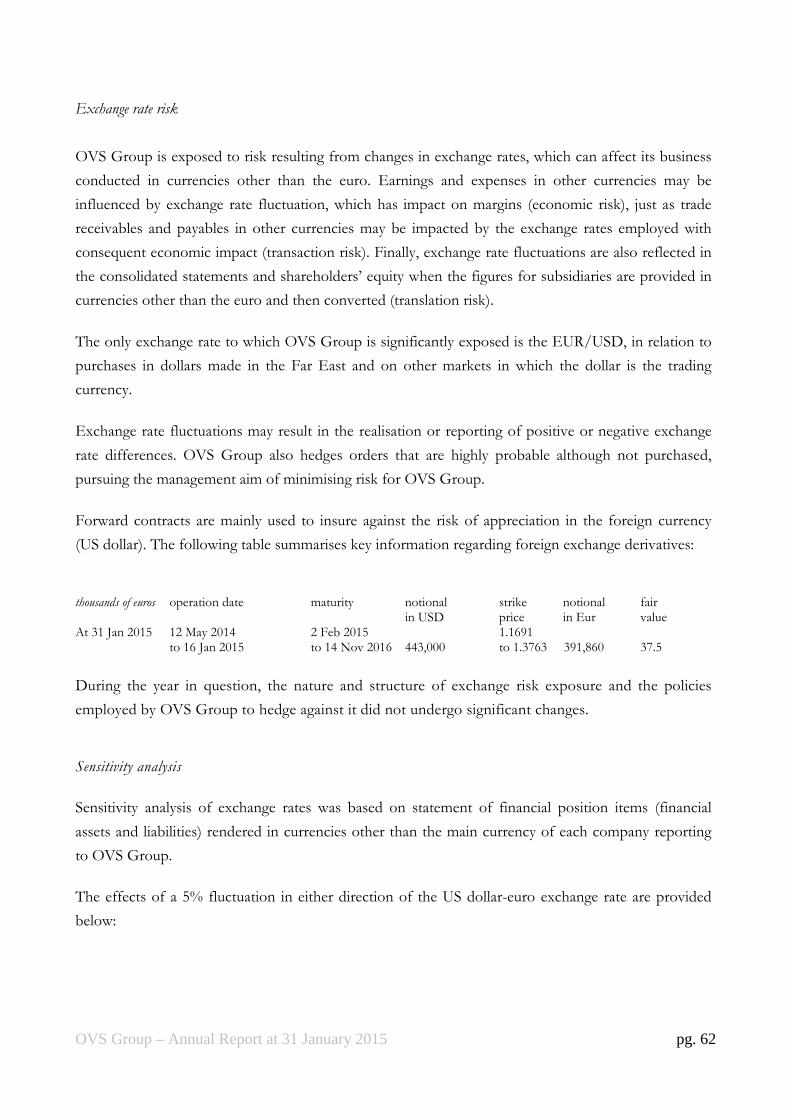
OVS Group – Annual Report at 31 January 2015 pg. 62
Exchange rate risk
OVS Group is exposed to risk resulting from changes in exchange rates, which can affect its business
conducted in currencies other than the euro. Earnings and expenses in other currencies may be
influenced by exchange rate fluctuation, which has impact on margins (economic risk), just as trade
receivables and payables in other currencies may be impacted by the exchange rates employed with
consequent economic impact (transaction risk). Finally, exchange rate fluctuations are also reflected in
the consolidated statements and shareholders’ equity when the figures for subsidiaries are provided in
currencies other than the euro and then converted (translation risk).
The only exchange rate to which OVS Group is significantly exposed is the EUR/USD, in relation to
purchases in dollars made in the Far East and on other markets in which the dollar is the trading
currency.
Exchange rate fluctuations may result in the realisation or reporting of positive or negative exchange
rate differences. OVS Group also hedges orders that are highly probable although not purchased,
pursuing the management aim of minimising risk for OVS Group.
Forward contracts are mainly used to insure against the risk of appreciation in the foreign currency
(US dollar). The following table summarises key information regarding foreign exchange derivatives:
thousands of euros operation date maturity notional strike notional fair in USD price in Eur value At 31 Jan 2015 12 May 2014 2 Feb 2015 1.1691 to 16 Jan 2015 to 14 Nov 2016 443,000 to 1.3763 391,860 37.5
During the year in question, the nature and structure of exchange risk exposure and the policies
employed by OVS Group to hedge against it did not undergo significant changes.
Sensitivity analysis
Sensitivity analysis of exchange rates was based on statement of financial position items (financial
assets and liabilities) rendered in currencies other than the main currency of each company reporting
to OVS Group.
The effects of a 5% fluctuation in either direction of the US dollar-euro exchange rate are provided
below:

OVS Group – Annual Report at 31 January 2015 pg. 63
Changes in result and net equity – net tax effect
(thousands of euros) -5% +5%
At 31 Jan 2015 1.7 (1.6)
The impact on derivatives of a 5% fluctuation in either direction of the US dollar-euro exchange rate is
illustrated below:
Changes in cash flow hedge reserve – net equity
(thousands of euros) -5% +5%
At 31 Jan 2015 12.5 (11.3)
Fair value
The fair value of financial instruments quoted in an active market is based on the market price on the
reporting date. The fair value of instruments that are not quoted in an active market is determined
using valuation techniques based on methods and assumptions that are in turn based on arm’s length
conditions on the reporting date.
Fair value classification of financial instruments can be broken down into three levels:
• Level 1: fair value determined based on quoted (not adjusted) prices in active markets for identical
financial instruments;
• Level 2: fair value determined using variable inputs observable on the market;
• Level 3: fair value determined using inputs that are not based on observable market data.
The OVS Group financial instruments shown at fair value are classified as Level 2, and the general
criterion used to calculate that is the present value of future cash flows expected from the instrument
being valued.
Liabilities relating to bank borrowings are measured using the “amortised cost” criterion.
Trade receivables and payables were measured at their carrying value as this is deemed to be close to
the current value.
In addition to the information on financial risk, the following is a reconciliation between classes of
financial assets and liabilities as identified in the Group's statement of financial position, and the types
of financial assets and liabilities identified pursuant to IFRS 7 at 31 January 2015:
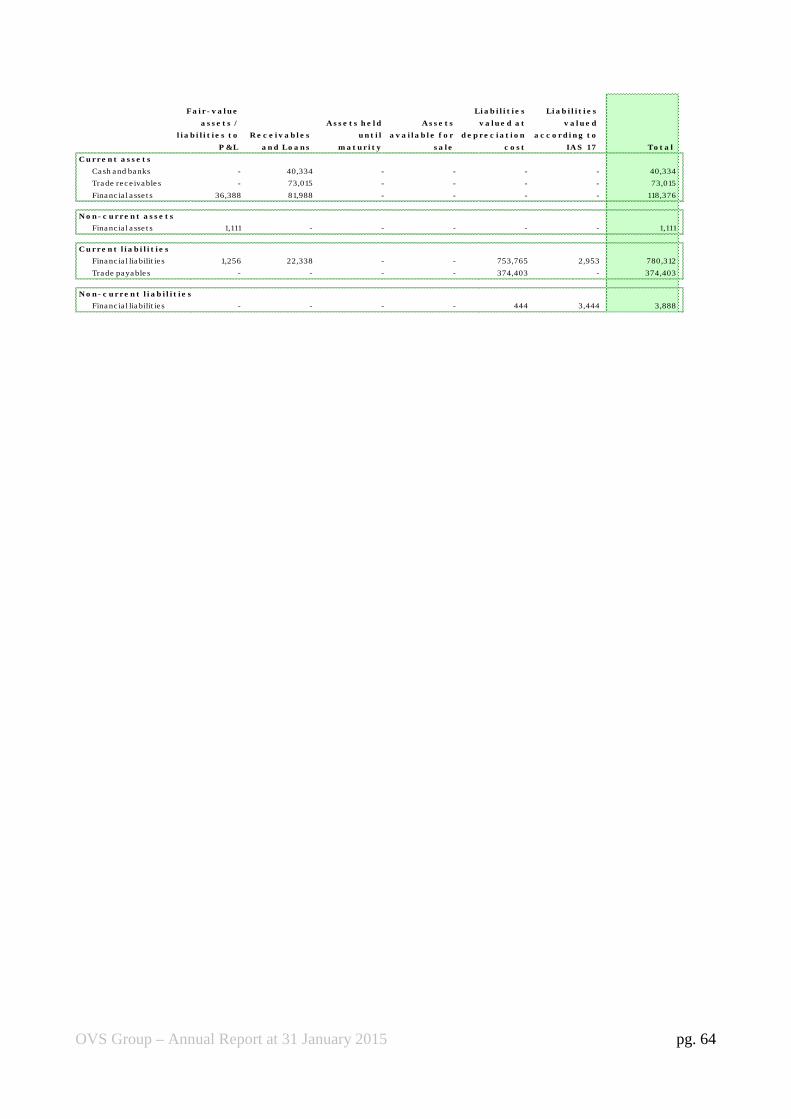
OVS Group – Annual Report at 31 January 2015 pg. 64
C u r r e n t a s s e t s
Cash and banks - 40,334 - - - - 40,334
Trade rece ivables - 73,015 - - - - 73,015
Financ ia l asse t s 36,388 81,988 - - - - 118,376
N o n - c u r r e n t a s s e t s
Financ ia l asse t s 1,111 - - - - - 1,111
C u r r e n t l i a b i l i t i e s
Financ ia l liabilit ies 1,256 22,338 - - 753,765 2,953 780,312
Trade payables - - - - 374,403 - 374,403
N o n - c u r r e n t l i a b i l i t i e s
Financ ia l liabilit ies - - - - 444 3,444 3,888
Fa i r - v a l u e
a s s e t s /
l i a b i l i t i e s t o
P &L
R e c e i v a b l e s
a n d Lo a n s
A s s e t s h e l d
u n t i l
m a t u r i t y To t a l
A s s e t s
a v a i l a b l e f o r
s a l e
Li a b i l i t i e s
v a l u e d a t
d e p r e c i a t i o n
c o s t
Li a b i l i t i e s
v a l u e d
a c c o r d i n g t o
IA S 17

OVS Group – Annual Report at 31 January 2015 pg. 65
INFORMATION ON OPERATING SEGMENTS
Pursuant to IFRS 8, management has identified the following operating segments:
• OVS, active in the value fashion market and offering stylish, quality clothing products at competitive
prices, with a focus on the latest fashion trends; and
• UPIM, active in the value segment of the Italian market, offering women's, men's and children's
clothing products, homeware and fragrance, with particularly competitive price positioning and a key
focus on the family.
The results of the operating segments are measured by analysing EBITDA and Adjusted EBITDA,
defined, respectively, as earnings before depreciation and amortisation, asset write-downs, financial
income and expenses and tax and EBITDA net of non-recurring income and charges.
Specifically, management believes that EBITDA and Adjusted EBITDA are good performance
indicators as they are not affected by tax legislation or depreciation/amortisation policy.
(thousands of Euros)
OVS UPIM (*) Total
Segment Revenues 557,623 99,362 656,985
EBITDA (A) 87,123 (586) 86,537
% on revenues 15.6% (0.6)% 13.2%
Unusual expense 5,051 9,217 14,268
EBITDA Adjusted 92,174 8,631 100,805
% on revenues 16.5% 8.7% 15.3%
Amortizazion and depreciation of assets (B) (24,939) (5,632) (30,571)
EBIT (A-B) 62,184 (6,218) 55,966
Financial income 3,682
Financial expense (39,463) (8,556) (48,512)
Exchange rates (3,189)
Trading profit / (loss) 22,721 (14,774) 7,947
Income taxes (11,739)
Net result (3,792)
31 Jan 2015
(*) The figures include the contribution of the Bernardi points of sales, not yet converted to
points of sales of OVS brand or UPIM brand.
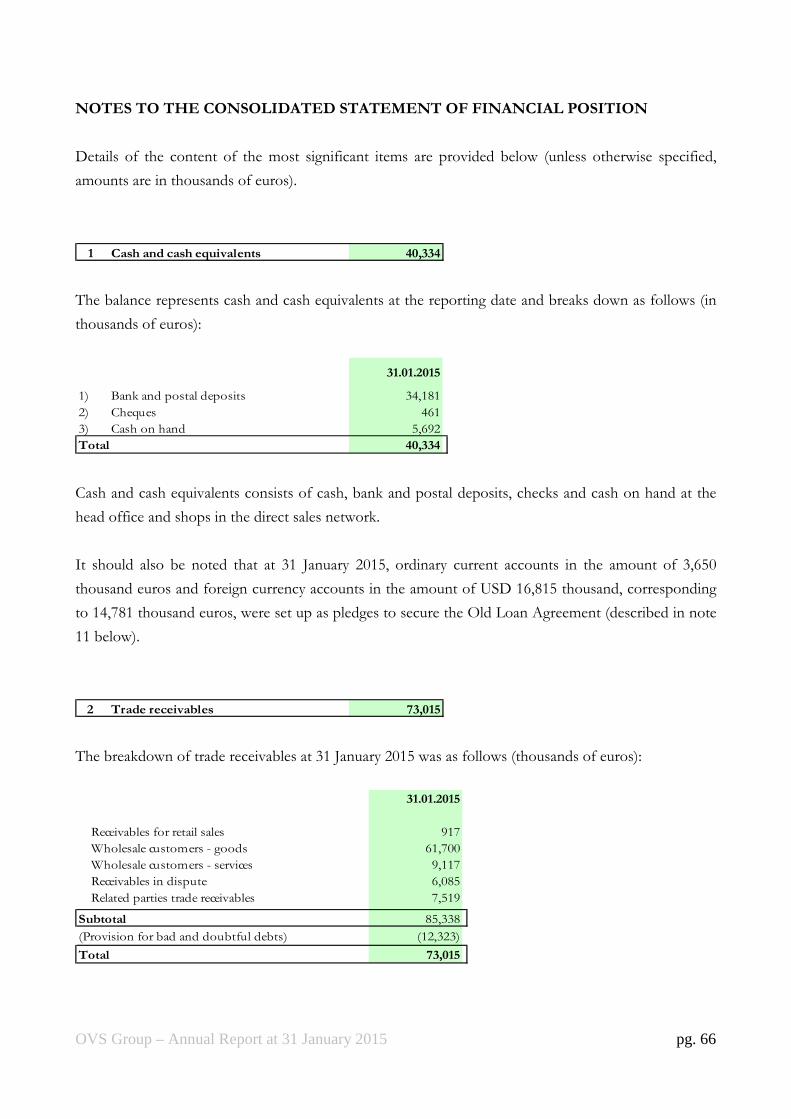
OVS Group – Annual Report at 31 January 2015 pg. 66
NOTES TO THE CONSOLIDATED STATEMENT OF FINANCIAL POSITION
Details of the content of the most significant items are provided below (unless otherwise specified,
amounts are in thousands of euros).
1 Cash and cash equivalents 40,334
The balance represents cash and cash equivalents at the reporting date and breaks down as follows (in
thousands of euros):
31.01.2015
1) Bank and postal deposits 34,181
2) Cheques 461
3) Cash on hand 5,692
40,334Total
Cash and cash equivalents consists of cash, bank and postal deposits, checks and cash on hand at the
head office and shops in the direct sales network.
It should also be noted that at 31 January 2015, ordinary current accounts in the amount of 3,650
thousand euros and foreign currency accounts in the amount of USD 16,815 thousand, corresponding
to 14,781 thousand euros, were set up as pledges to secure the Old Loan Agreement (described in note
11 below).
2 Trade receivables 73,015
The breakdown of trade receivables at 31 January 2015 was as follows (thousands of euros):
31.01.2015
Receivables for retail sales 917
Wholesale customers - goods 61,700
Wholesale customers - services 9,117
Receivables in dispute 6,085
Related parties trade receivables 7,519
Subtotal 85,338
(Provision for bad and doubtful debts) (12,323)
Total 73,015
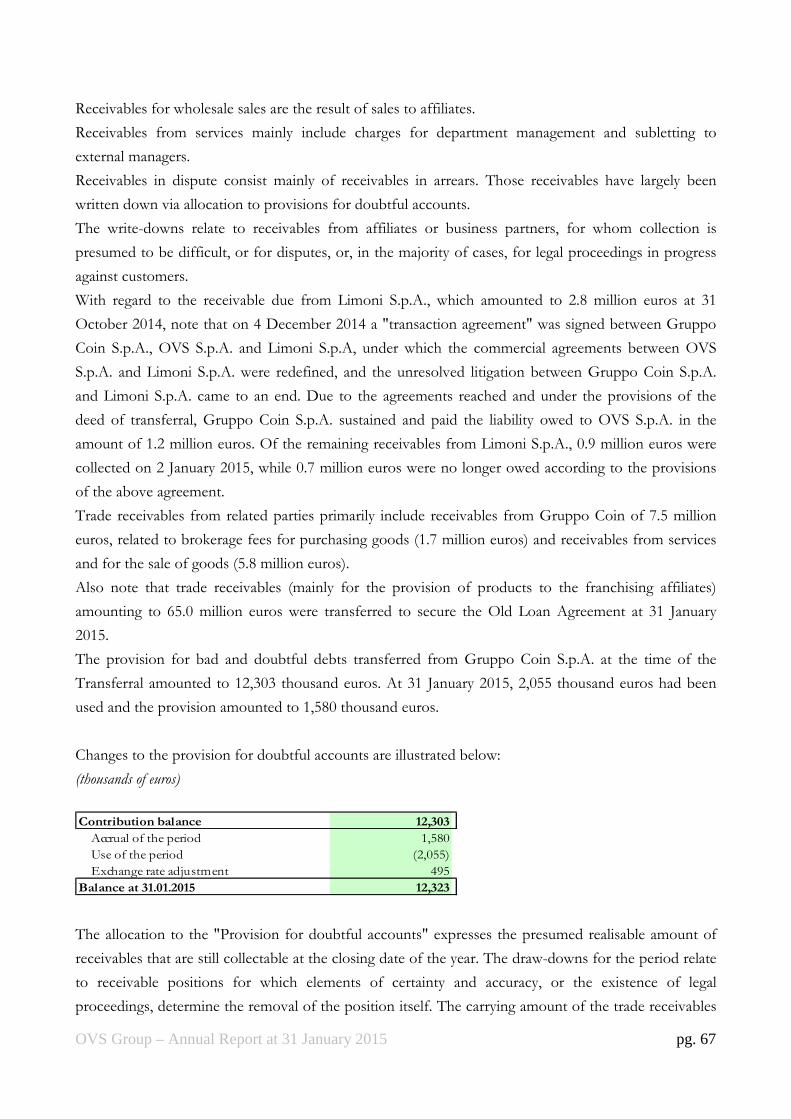
OVS Group – Annual Report at 31 January 2015 pg. 67
Receivables for wholesale sales are the result of sales to affiliates.
Receivables from services mainly include charges for department management and subletting to
external managers.
Receivables in dispute consist mainly of receivables in arrears. Those receivables have largely been
written down via allocation to provisions for doubtful accounts.
The write-downs relate to receivables from affiliates or business partners, for whom collection is
presumed to be difficult, or for disputes, or, in the majority of cases, for legal proceedings in progress
against customers.
With regard to the receivable due from Limoni S.p.A., which amounted to 2.8 million euros at 31
October 2014, note that on 4 December 2014 a "transaction agreement" was signed between Gruppo
Coin S.p.A., OVS S.p.A. and Limoni S.p.A, under which the commercial agreements between OVS
S.p.A. and Limoni S.p.A. were redefined, and the unresolved litigation between Gruppo Coin S.p.A.
and Limoni S.p.A. came to an end. Due to the agreements reached and under the provisions of the
deed of transferral, Gruppo Coin S.p.A. sustained and paid the liability owed to OVS S.p.A. in the
amount of 1.2 million euros. Of the remaining receivables from Limoni S.p.A., 0.9 million euros were
collected on 2 January 2015, while 0.7 million euros were no longer owed according to the provisions
of the above agreement.
Trade receivables from related parties primarily include receivables from Gruppo Coin of 7.5 million
euros, related to brokerage fees for purchasing goods (1.7 million euros) and receivables from services
and for the sale of goods (5.8 million euros).
Also note that trade receivables (mainly for the provision of products to the franchising affiliates)
amounting to 65.0 million euros were transferred to secure the Old Loan Agreement at 31 January
2015.
The provision for bad and doubtful debts transferred from Gruppo Coin S.p.A. at the time of the
Transferral amounted to 12,303 thousand euros. At 31 January 2015, 2,055 thousand euros had been
used and the provision amounted to 1,580 thousand euros.
Changes to the provision for doubtful accounts are illustrated below:
(thousands of euros)
Contribution balance 12,303
Accrual of the period 1,580
Use of the period (2,055)
Exchange rate adjustment 495
Balance at 31.01.2015 12,323
The allocation to the "Provision for doubtful accounts" expresses the presumed realisable amount of
receivables that are still collectable at the closing date of the year. The draw-downs for the period relate
to receivable positions for which elements of certainty and accuracy, or the existence of legal
proceedings, determine the removal of the position itself. The carrying amount of the trade receivables

OVS Group – Annual Report at 31 January 2015 pg. 68
is believed to approximate their fair value.
Given the types of products and services sold by OVS Group, there is no significant concentration of
revenues and trade receivables with individual customers.
3 Inventories 287,610
The table below breaks down inventories:
(thousands of Euros) 31.01.2015
Goods 309,257
Total inventories -gross amount 309,257
Depreciation fund (13,589)
Inventory difference fund (8,058)
Total - stock depreciation fund (21,647)
Total inventories - net amount 287,610
This item includes stocks of goods at warehouses and stores at the reporting date.
The amount is largely in line with the amounts that would be obtained by valuing the inventories at
current cost at the reporting date.
The provision for depreciation reflects management's best estimate based on the breakdown by type
and season of inventories, considerations arising from past experience and the outlook for sales
volumes. The provision for inventory differences includes the estimate of inventory differences at the
end of each of the periods under review, in view of the fact that OVS Group carries out a physical
inventory in June of every year. These provisions are based on management’s best estimate and are
therefore believed by management to be consistent with their respective purposes.
Changes in the provision for depreciation and the provision for inventory differences for the period
ending at 31 January 2015 are shown below:
(thousands of euros)
Depreciation
fund
Inventory
difference fund Total
Balance at contribution date 7,375 981 8,356
Provision 11,256 9,621 20,877
Use (5,042) (2,544) (7,586)
Balance at 31 Jan 2015 13,589 8,058 21,647
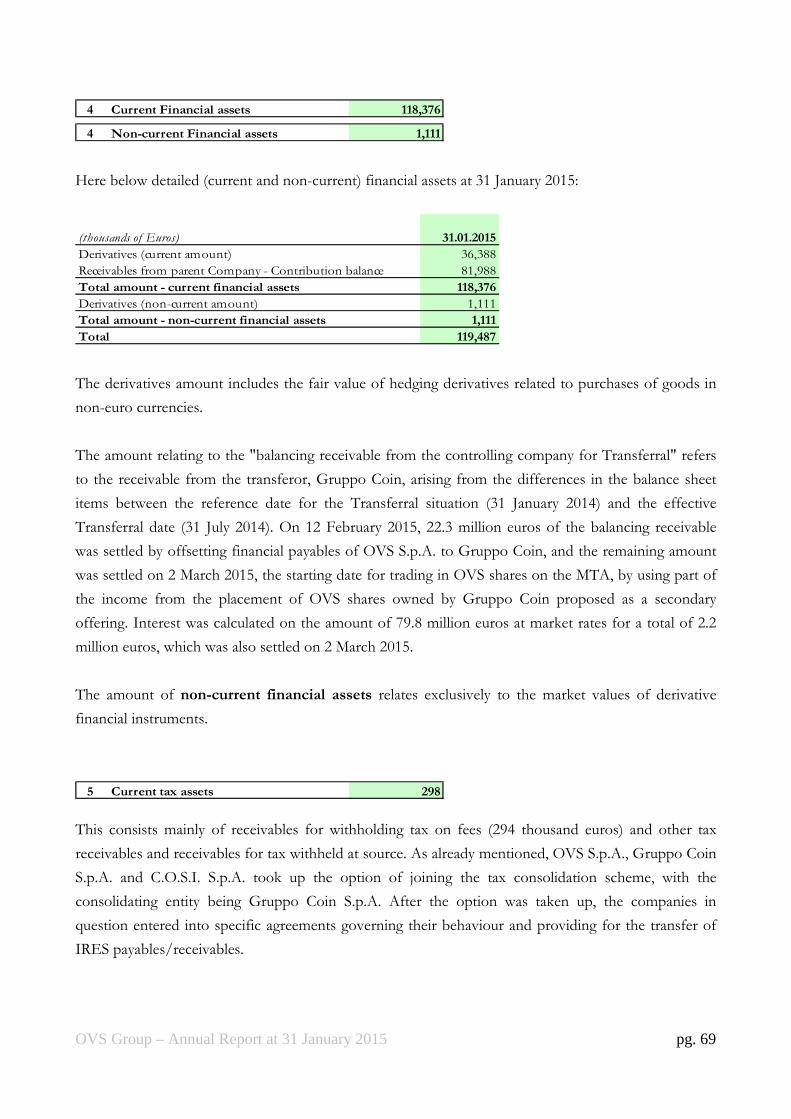
OVS Group – Annual Report at 31 January 2015 pg. 69
4 Current Financial assets 118,376
4 Non-current Financial assets 1,111
Here below detailed (current and non-current) financial assets at 31 January 2015:
(thousands of Euros) 31.01.2015
Derivatives (current amount) 36,388
Receivables from parent Company - Contribution balance 81,988
Total amount - current financial assets 118,376
Derivatives (non-current amount) 1,111
Total amount - non-current financial assets 1,111
Total 119,487
The derivatives amount includes the fair value of hedging derivatives related to purchases of goods in
non-euro currencies.
The amount relating to the "balancing receivable from the controlling company for Transferral" refers
to the receivable from the transferor, Gruppo Coin, arising from the differences in the balance sheet
items between the reference date for the Transferral situation (31 January 2014) and the effective
Transferral date (31 July 2014). On 12 February 2015, 22.3 million euros of the balancing receivable
was settled by offsetting financial payables of OVS S.p.A. to Gruppo Coin, and the remaining amount
was settled on 2 March 2015, the starting date for trading in OVS shares on the MTA, by using part of
the income from the placement of OVS shares owned by Gruppo Coin proposed as a secondary
offering. Interest was calculated on the amount of 79.8 million euros at market rates for a total of 2.2
million euros, which was also settled on 2 March 2015.
The amount of non-current financial assets relates exclusively to the market values of derivative
financial instruments.
5 Current tax assets 298
This consists mainly of receivables for withholding tax on fees (294 thousand euros) and other tax
receivables and receivables for tax withheld at source. As already mentioned, OVS S.p.A., Gruppo Coin
S.p.A. and C.O.S.I. S.p.A. took up the option of joining the tax consolidation scheme, with the
consolidating entity being Gruppo Coin S.p.A. After the option was taken up, the companies in
question entered into specific agreements governing their behaviour and providing for the transfer of
IRES payables/receivables.
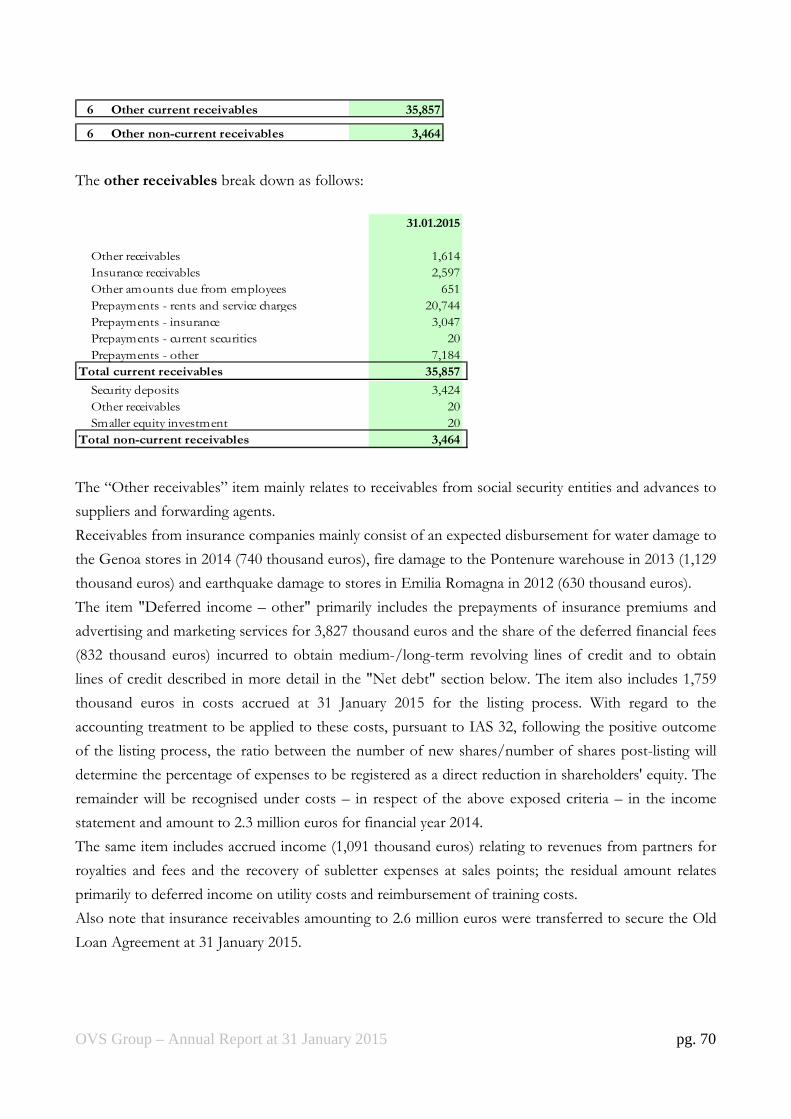
OVS Group – Annual Report at 31 January 2015 pg. 70
6 Other current receivables 35,857
6 Other non-current receivables 3,464
The other receivables break down as follows:
31.01.2015
Other receivables 1,614
Insurance receivables 2,597
Other amounts due from employees 651
Prepayments - rents and service charges 20,744
Prepayments - insurance 3,047
Prepayments - current securities 20
Prepayments - other 7,184
Total current receivables 35,857 Security deposits 3,424
Other receivables 20
Smaller equity investment 20
Total non-current receivables 3,464
The “Other receivables” item mainly relates to receivables from social security entities and advances to
suppliers and forwarding agents.
Receivables from insurance companies mainly consist of an expected disbursement for water damage to
the Genoa stores in 2014 (740 thousand euros), fire damage to the Pontenure warehouse in 2013 (1,129
thousand euros) and earthquake damage to stores in Emilia Romagna in 2012 (630 thousand euros).
The item "Deferred income – other" primarily includes the prepayments of insurance premiums and
advertising and marketing services for 3,827 thousand euros and the share of the deferred financial fees
(832 thousand euros) incurred to obtain medium-/long-term revolving lines of credit and to obtain
lines of credit described in more detail in the "Net debt" section below. The item also includes 1,759
thousand euros in costs accrued at 31 January 2015 for the listing process. With regard to the
accounting treatment to be applied to these costs, pursuant to IAS 32, following the positive outcome
of the listing process, the ratio between the number of new shares/number of shares post-listing will
determine the percentage of expenses to be registered as a direct reduction in shareholders' equity. The
remainder will be recognised under costs – in respect of the above exposed criteria – in the income
statement and amount to 2.3 million euros for financial year 2014.
The same item includes accrued income (1,091 thousand euros) relating to revenues from partners for
royalties and fees and the recovery of subletter expenses at sales points; the residual amount relates
primarily to deferred income on utility costs and reimbursement of training costs.
Also note that insurance receivables amounting to 2.6 million euros were transferred to secure the Old
Loan Agreement at 31 January 2015.

OVS Group – Annual Report at 31 January 2015 pg. 71
Other non-current receivables include security deposits paid under leases, utilities and deposits with
customs to guarantee goods imports.
The item “smaller equity investment” mainly refers to investment in Consortium, booked at cost.
The "Other receivables" item includes receivables from affiliates falling due in over 12 months.
7 Property, plant and equipment 241,517
Appendix 1 shows the historical cost for each item, the accumulated depreciation and amortisation that
was merged after the Transferral, changes during the year and the final balances.
Investments in the period mainly related to:
- expenses for modernising, renovating and upgrading stores in the commercial network;
- purchases of furniture and fittings for the commercial network to furnish both newly opened
and renovated branches.
The leasehold improvements allocated to the items in question mainly refer to renovations of stores
not under direct ownership.
Pursuant to IAS 36, for businesses showing signs of impairment the Group assessed the recoverability
of the relative assets using the discounted cash flow method.
The analysis did not show any impairment during the year.
Also note that, pursuant to the Old Loan Agreement, at 31 January 2015 a lien was created on property
in the amount of 147.6 million euros.
8 Intangible fixed assets 649,740
Intangible fixed assets at 31 January 2015 mainly include the amounts allocated to OVS Group deriving
from the acquisition of Gruppo Coin by Icon. At 31 January 2015, these include:
• The OVS brand for 377.5 million euros, with an indefinite life (included under "Concessions,
licences and brands");
• The Upim brand for 13.3 million euros, with an indefinite life (included under "Concessions,
licences and brands");
• The OVS franchising network for 90.6 million euros, amortised over 20 years (included under
"Other intangible assets");
• The Upim franchising network for 36.0 million euros, amortised over 20 years (included under
"Other intangible assets");

OVS Group – Annual Report at 31 January 2015 pg. 72
• Administrative licences relating to OVS stores, 94.4 million euros, amortised over 40 years
(included under "Concessions, licences and brands");
• Administrative licences relating to Upim stores, 18.2 million euros, amortised over 40 years
(included under "Concessions, licences and brands");
• Administrative licences relating to ex-Bernardi stores, 4.4 million euros, amortised over 40 years
(included under "Concessions, licences and brands").
The brands attributed to OVS Group are regarded as having an indefinite useful life.
To establish this, a management analysis was performed on all relevant factors (legal, judicial,
contractual, competitive, economic and other) relating to the brands. The conclusion was reached that
there is no foreseeable time limit for the generation of cash inflows for OVS Group.
The recoverability of the assets related to these brands was measured using the discounted cash flow
method, related to CGU in which these brands have been booked. Please see the following section,
"Impairment testing", for the outcome of the assessments carried out.
Note that the useful life of the licences is 40 years.
This was estimated on the basis of historical analyses carried out within OVS Group.
It should be noted, in this regard, that the time limit placed on the duration of the leases is insignificant.
There are protections provided to the tenant in market practice and under specific legal provisions; in
addition, a strategy of gradual further expansion of the network is being implemented by OVS Group,
which usually renews leases before they expire naturally. All these factors have resulted over time in the
almost completely successful implementation of the renewal policy. Also note that we have identified a
component of residual value (non-amortised residual value at the end of the useful life) calculated over
18 monthly rental payments, representing the amount payable by the lessor if the lease is not renewed
for a reason not attributable to OVS Group.
The remainder of the item mainly consists of rights to industrial patents and intellectual property rights
relating to investments in software programs.
Also note that, pursuant to the Old Loan Agreement, at 31 January 2015 a pledge was created using
OVS Group brands in the amount of 390.8 million euros.
9 Goodwill 452,541
The goodwill allocated to OVS Group mainly relates to the acquisition of Gruppo Coin by Icon on 30
June 2011, for 451,778 thousand euros.
Goodwill was tested for impairment: the results are shown in the "Impairment testing" section below.
OVS Group – Annual Report at 31 January 2015 pg. 73
Impairment testing
Pursuant to IAS 36, the Group verifies the recoverability of intangible assets with an indefinite useful
life (goodwill and brands) at least once a year, or more frequently if there are indicators of impairment,
while for tangible assets and other assets with a finite useful life it does this when there are indicators of
impairment. The recoverable amount of the cash-generating units (CGUs) to which the individual
assets are allocated is verified by calculating their value in use and/or fair value.
a) OVS CGU
Impairment testing was performed by comparing the carrying value (“carrying amount”) of the cash
generating unit (CGU) compared with value in use (“value in use” or “VIU”) of the same.
Note that the carrying amount of the CGU OVS includes goodwill, completely allocated to the same
and amounting to 452.5 million euros, and the OVS brand amounting to 377.5 million euros, both with
indefinite life.
The CGUs identified by management line up with OVS and UPIM operating units that contain the
flow of all services and products provided to customers.
The estimated value in use for the OVS operating unit for the purposes of impairment testing is based
on discounted calculations using forecast data for the OVS CGU, based on the following:
• expected cash flows for the OVS operating unit are extrapolated from the 2015-2017 three-year
business plan drawn up by management. The forecast cash flows for the OVS CGU are based on levels
of growth in sales and EBITDA based on both past income/profit performance and on future
expectations;
• expected future cash flows, calculated over a total period of 30 years, are calculated by applying an
ongoing 2% annual growth rate (“g”) to EBITDA, using the EBITDA of the last year of the plan as a
starting point. Annual investments are estimated on a constant basis based on the final year of the plan
(31.7 million euros), an amount that is considered indicative of the investments needed to maintain the
property in existence. Furthermore, changes to net working capital are calculated as zero as it is
considered reasonable, in light of the specific nature of the business field in which the CGU operates,
to predict that over the long term i) trade receivables and payables and ii) stock will balance out.
• the post-tax discount rate (WACC) used to estimate the current value of cash flows is 7.59% and is
determined based on the following assumptions: i) the risk-free rate used is equivalent to the 1-month
average (at 31 January 2015) of yield on ten-year Italian government bonds (BTP); ii) the equity risk
premium of 5.5% is an average rate in line with both the results of long-term analysis of industrialized
countries and professional practice; iii) the beta coefficient is estimated based on a panel of comparable
listed companies in the retail clothing business; iv) financial debt of 4.34% is estimated by calculating
the 1-month average of the 10-year EurIRS rate with a 300bps spread; and v) a debt/equity ratio used is
OVS Group – Annual Report at 31 January 2015 pg. 74
calculated using the average of a panel of comparable companies.
Based on considerations described above, the VIU of the OVS CGU at 31 January 2015 is 1,469.2
million euros. Based on the VIU of 1,469.2 million euros and the carrying amount (net invested capital)
of OVS CGU of 924.2 million euros, the CGU’s value in use is higher than its carrying value, therefore
there was no impairment to be booked.
b) UPIM CGU
Although no goodwill value was attributed to the UPIM CGU, the Group performed impairment
testing on it, also considering that it includes a value allocated to the brand for an amount equivalent to
€13.3 million, with an indefinite life.
The estimated value in use for the UPIM operating unit for the purposes of impairment testing is based
on discounted calculations using forecast data for the UPIM CGU, based on the following:
• expected cash flows for the UPIM operating unit are extrapolated from the 2015-2017 three-year
business plan drawn up by management. The forecast cash flows for the UPIM CGU are based on
levels of growth in sales and EBITDA based on both past income/profit performance and on future
expectations;
• expected future cash flows, calculated over a total period of 30 years, are calculated by applying an
ongoing 2% annual growth rate (“g”) to EBITDA, using the EBITDA of the last year of the plan as a
starting point. Annual investments are estimated on a constant basis based on the final year of the plan
(8.1 million euros), an amount that is considered indicative of the investments needed to maintain the
property in existence) Furthermore, changes to net working capital are calculated as zero as it is
considered reasonable, in light of the specific nature of the business field in which the CGU operates,
to predict that over the long term i) trade receivables and payables and ii) stock will balance out.
• the post-tax discount rate (WACC) used to estimate the current value of cash flows is 7.59% and is
determined based on the following assumptions: i) the risk-free rate used is equivalent to the 1-month
average (at 31 January 2015) of yield on ten-year Italian government bonds (BTP); ii) the equity risk
premium of 5.5% is an average rate in line with both the results of long-term analysis of industrialized
countries and professional practice; iii) the beta coefficient is estimated based on a panel of comparable
listed companies in the retail clothing business; iv) financial debt of 4.34% is estimated by calculating
the 1-month average of the 10-year EurIRS rate with a 300bps spread; and v) a debt/equity ratio used is
calculated using the average of a panel of comparable companies.
Based on considerations described above, the VIU of the UPIM CGU at 31 January 2015 is 135.6
million euros. Based on the VIU of 135.6 million euros and the carrying amount (net invested capital)
of UPIM CGU of 78.3 million euros, the CGU’s value in use is higher than its carrying value, therefore
there was no impairment to be booked.
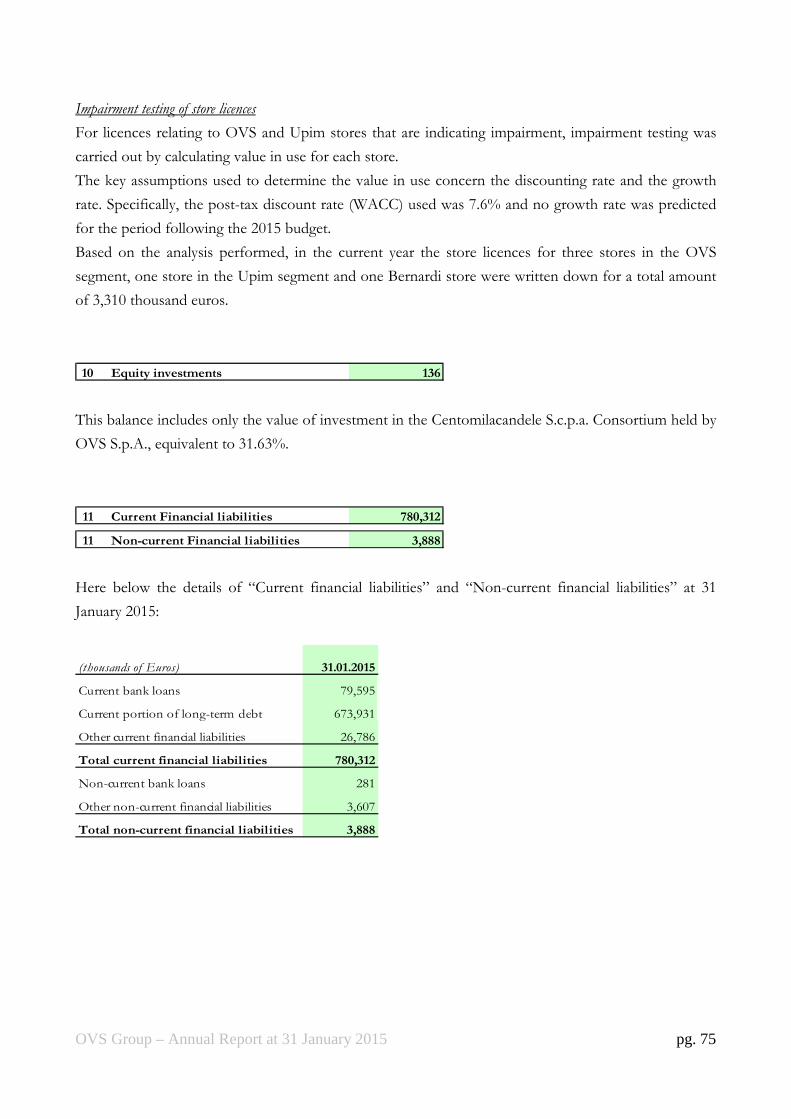
OVS Group – Annual Report at 31 January 2015 pg. 75
Impairment testing of store licences
For licences relating to OVS and Upim stores that are indicating impairment, impairment testing was
carried out by calculating value in use for each store.
The key assumptions used to determine the value in use concern the discounting rate and the growth
rate. Specifically, the post-tax discount rate (WACC) used was 7.6% and no growth rate was predicted
for the period following the 2015 budget.
Based on the analysis performed, in the current year the store licences for three stores in the OVS
segment, one store in the Upim segment and one Bernardi store were written down for a total amount
of 3,310 thousand euros.
10 Equity investments 136
This balance includes only the value of investment in the Centomilacandele S.c.p.a. Consortium held by
OVS S.p.A., equivalent to 31.63%.
11 Current Financial liabilities 780,312
11 Non-current Financial liabilities 3,888
Here below the details of “Current financial liabilities” and “Non-current financial liabilities” at 31
January 2015:
(thousands of Euros) 31.01.2015
Current bank loans 79,595
Current portion of long-term debt 673,931
Other current financial liabilities 26,786
Total current financial liabilities 780,312
Non-current bank loans 281
Other non-current financial liabilities 3,607
Total non-current financial liabilities 3,888

OVS Group – Annual Report at 31 January 2015 pg. 76
Current and non-current bank payables and the current portion of long-term debt
Current and non-current bank payables of OVS Group at 31 January 2015 are shown below:
(thousands of euros) Maturity* Interest rate
Total
of which
non-current
portion
of which
current
portion
Revolving Facility 2017 Euribor + 4.50% 79,252 - 79,252
Bank current accounts 343 - 343
Current bank debt 79,595 - 79,595
Facility A1A and Facility A2A 2017 Euribor + 4.50% 17,125 - 17,125
Facility A1B and Facility A2B 2017 Euribor + 4.75% 198,696 - 198,696
Facility B1A 2018 Euribor + 5.00% 119,472 - 119,472
Facility B1B 2018 Euribor + 5.00% 107,525 - 107,525
Facility B2A 2018 Euribor + 5.00% 93,572 - 93,572
Facility B2B 2018 Euribor + 5.00% 84,215 - 84,215
Capex Facility A 2017 Euribor + 4.50% 5,457 - 5,457
Capex Facility B 2017 Euribor + 4.75% 42,944 - 42,944
Liabilities due to financial charges 9,955 - 9,955
Ancillary borrowing costs (5,405) - (5,405)
Bank loan - foreign companies 656 281 375
Non-current bank debt 674,212 281 673,931
*please see following notes, explaining what happened on March 2, 2015
At January 31, 2015
The lines of credit available to the Group at 31 January 2015 consist of the portion of the lines of credit
originally granted to controlling company Gruppo Coin S.p.A. under the loan agreement named the
"Senior Term Capex and Revolving Facilities Agreement", which was signed on 29 June 2011 and
amended on 2 January 2012 and 16 April 2013 under two contractual waivers granted to Gruppo Coin
S.p.A. (the Old Loan Agreement). Pursuant to the requests presented in a waiver dated 30 May 2014,
the original lines of credit were partially transferred to OVS S.p.A. under an amendment to the Old
Loan Agreement signed on 5 August 2014 and the relative Intercreditor Agreement, and include:
(i) two medium-/long-term lines named "Facility A1A" and "Facility A2A" amounting to 17.1
million euros at 31 January 2015, fully drawn down and repayable under the following repayment
schedule:

OVS Group – Annual Report at 31 January 2015 pg. 77
Date
Amount to be refunded (Euro)
(“Facility A1A” and “Facility A2A”)
31 July 2015 2,014,221.26
31 January 2016 3,742,941.71
31 July 2016 2,446,401.37
31 January 2017 4,892,802.74
30 June 2017 4,028,442.50
(ii) two medium-/long-term lines named "Facility A1B" and “Facility A2B" amounting to 198.7
million euros at 31 January 2015, fully drawn down and repayable under the following repayment
schedule:
Date
Amount to be refunded (Euro)
(“Facility A1B” and “Facility A2B”)
31 July 2015 3,814,971.13
31 January 2016 7,093,461.94
31 July 2016 4,649,496.05
31 January 2017 9,279,122.48
30 June 2017 173,859,361.25
(iii) a medium-/long-term line named "Facility B1A" for a maximum amount of around 119.5 million
euros, to be repaid in a lump sum on 30 June 2018, drawn down in the amount of 119.5 million
euros at 31 January 2015;
(iv) a medium-/long-term line named "Facility B1B" for a maximum amount of around 107.5 million
euros, to be repaid in a lump sum on 30 June 2018, drawn down by OVS Group in the amount of
107.5 million euros at 31 January 2015;
(v) a medium-/long-term line named "Facility B2A" for a maximum amount of around 93.6 million
euros, to be repaid in a lump sum on 30 June 2018, drawn down by OVS Group in the amount of
93.6 million euros at 31 January 2015;
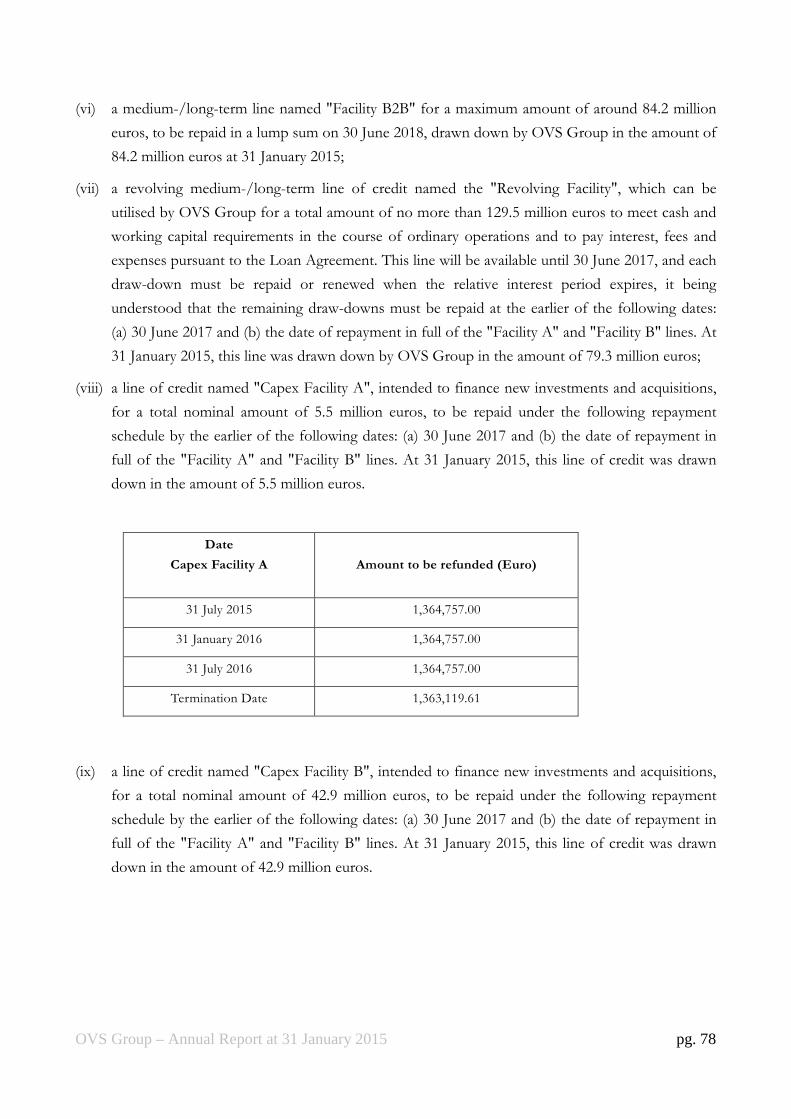
OVS Group – Annual Report at 31 January 2015 pg. 78
(vi) a medium-/long-term line named "Facility B2B" for a maximum amount of around 84.2 million
euros, to be repaid in a lump sum on 30 June 2018, drawn down by OVS Group in the amount of
84.2 million euros at 31 January 2015;
(vii) a revolving medium-/long-term line of credit named the "Revolving Facility", which can be
utilised by OVS Group for a total amount of no more than 129.5 million euros to meet cash and
working capital requirements in the course of ordinary operations and to pay interest, fees and
expenses pursuant to the Loan Agreement. This line will be available until 30 June 2017, and each
draw-down must be repaid or renewed when the relative interest period expires, it being
understood that the remaining draw-downs must be repaid at the earlier of the following dates:
(a) 30 June 2017 and (b) the date of repayment in full of the "Facility A" and "Facility B" lines. At
31 January 2015, this line was drawn down by OVS Group in the amount of 79.3 million euros;
(viii) a line of credit named "Capex Facility A", intended to finance new investments and acquisitions,
for a total nominal amount of 5.5 million euros, to be repaid under the following repayment
schedule by the earlier of the following dates: (a) 30 June 2017 and (b) the date of repayment in
full of the "Facility A" and "Facility B" lines. At 31 January 2015, this line of credit was drawn
down in the amount of 5.5 million euros.
Date
Capex Facility A
Amount to be refunded (Euro)
31 July 2015 1,364,757.00
31 January 2016 1,364,757.00
31 July 2016 1,364,757.00
Termination Date 1,363,119.61
(ix) a line of credit named "Capex Facility B", intended to finance new investments and acquisitions,
for a total nominal amount of 42.9 million euros, to be repaid under the following repayment
schedule by the earlier of the following dates: (a) 30 June 2017 and (b) the date of repayment in
full of the "Facility A" and "Facility B" lines. At 31 January 2015, this line of credit was drawn
down in the amount of 42.9 million euros.

OVS Group – Annual Report at 31 January 2015 pg. 79
Date
Capex Facility B
Amount to be refunded (Euro)
31 July 2015 1,790,749.49
31 January 2016 1,790,749.49
31 July 2016 1,790,749.49
Termination Date of
Capex Facility
37,571,384.31
At 31 January 2015, the above detailed lines of credit were drawn down for a total nominal amount of
748.3 million euros. The average interest rate on the lines of credit granted to OVS Group in existence
at 31 January 2015 was 5.45%.
Please see the following section, "Exposure to and management of financial risks", for an indication of
the interest rate hedging policy adopted by OVS.
Guarantees and covenants
The amendment of the Old Loan Agreement resulted, inter alia, in some adjustments to the guarantee
structure. Without prejudice to the guarantees issued by controlling company Gruppo Coin S.p.A.
under the contracts signed, on 5 August 2014, OVS S.p.A. signed the following guarantees in relation
to the transferred debt:
1. the issue of a pledge under UK law on the shares of Oriental Buying Services Limited;
2. the assignment as collateral of receivables held by OVS S.p.A. arising from any infra-group
loans of which OVS S.p.A. is the lending party;
3. a lien on certain assets;
4. the assignment as collateral of trade receivables;
5. a pledge on certain intellectual property titles;
6. a pledge on certain current accounts.
With regard to the Old Loan Agreement, you will recall that on 29 June 2011, two loan agreements
governed by UK law, named the "Senior bridge term and revolving facilities agreement" (the BT Loan
Agreement) and the "Senior term, capex and revolving facilities agreement" were stipulated by, inter
alios, Icon 2 S.à r.l. and a banking syndicate (Banca IMI S.p.A., BNP Paribas, Crédit Agricole Corporate
and Investment Bank, HSBC Bank p.l.c., Mediobanca – Banca di Credito Finanziario S.p.A., Natixis

OVS Group – Annual Report at 31 January 2015 pg. 80
S.A. Milan, UBS Limited and UniCredit S.p.A.); Giorgione Investimenti S.p.A., Gruppo Coin S.p.A.,
Oviesse S.p.A., Upim S.r.l., Coin S.p.A., Oviesse Franchising S.p.A. and Oriental Buying Services
Limited also signed up to the agreements by entering into individual accession agreements on 30 June
2011.
On 15 April 2012, the reverse merger of controlling holding companies Icon S.p.A. and Giorgione
Investimenti S.p.A. into Gruppo Coin S.p.A. took effect (the First Merger). On 1 January 2013, the
merger by incorporation of Coin S.p.A., Oviesse S.p.A., Coin Franchising S.p.A., Oviesse Franchising
S.p.A. and Upim S.r.l. into Gruppo Coin S.p.A. took effect (the Second Merger).
At the time of the First Merger and the Second Merger, the necessary adjustments were made to all
commitments, declarations and guarantees formalised at the time of entering into the BT Loan
Agreement and the Old Loan Agreement. In line with market practice, these clauses are intended to
guarantee repayment of the lines of credit currently awarded to Gruppo Coin S.p.A. by the banking
syndicate.
Specifically, as a result of the First Merger and the Second Merger, Gruppo Coin S.p.A. assumed the
liabilities, payables, obligations, commitments, expenses, encumbrances, debt positions and guarantees
granted of each of the incorporated companies (including the guarantees granted by the incorporated
companies when the loan agreements were entered into). Gruppo Coin S.p.A. therefore issued and, if
appropriate, confirmed, inter alia, the following guarantees to the banking syndicate: (i) a pledge on the
Group's key trademarks, (ii) a pledge on some current accounts, (iii) the assignment as collateral of
receivables arising from insurance policies and trade receivables, (iv) the creation of a lien (pursuant to
article 46 of Legislative Decree 385/93) on corporate assets, and, lastly, (v) an autonomous first-
demand guarantee governed by UK law (a "corporate guarantee"). Declarations were also issued,
commitments assumed and guarantees created to guarantee the loan agreements (including a pledge on
100% of shares of Gruppo Coin S.p.A.) by the companies in the chain of control, i.e., Icon 1 S.A. and
Icon 2 S.à r.l.. The commitments assumed include, in particular, those relating to financial covenants at
consolidated level for Gruppo Coin S.p.A. and its subsidiaries.
The amendment to the Old Loan Agreement did not entail any change to the covenant structure and
thresholds in place, to be all calculated at consolidated level.
Specifically, the financial covenants are calculated on a quarterly basis and relate to interest cover (the
ratio of adjusted EBITDA to adjusted net financial expenses), cash flow cover (the ratio of adjusted
cash flows to adjusted servicing of debt), the leverage ratio (the ratio of net debt, including the financial
exposure of direct controlling company Icon 2 S.à r.l., to EBITDA) and capital expenditure (the
amount of investments in tangible and intangible assets). Pursuant to the Old Loan Agreement and
again at consolidated level, a contractual obligation also applies, according to which the use of the
revolving line of credit (net of the cash deposited in bank current accounts) must not exceed: (i) 40
million euros for at least five consecutive business days during the financial year ended 31 January 2015;
OVS Group – Annual Report at 31 January 2015 pg. 81
and (ii) 25 million euros for at least five consecutive business days after the financial year ended 31
January 2015. The covenants for 2014 were achieved between 22 and 30 December 2014.
Change of control clause
According to standard practice, the Old Loan Agreement contains a change of control clause, pursuant
to which, inter alia, (i) loss of ownership (direct or indirect) of an absolute majority of the share capital
of Icon 2 S.à r.l. by BC Partners, or (ii) loss of ownership (direct or indirect) of the share capital of
Gruppo Coin S.p.A. by Icon 2 S.à r.l., would lead to the cancellation and the obligation to immediately
repay the lines of credit granted to Gruppo Coin S.p.A. and to OVS S.p.A. under the Old Loan
Agreement.
New Loan Agreement
As described above, this was extinguished on 2 March 2015, the effective date of the New Loan
Agreement (hereinafter the “New Loan Agreement”), as indicated in the Report on Operations.
The key conditions of this agreement are as follows.
The New Loan Agreement, equivalent to 475,000,000 euros, provides for the granting of a medium-
/long-term line of credit of 375,000,000 euros, which, together with the income from the capital
increase servicing the global offer, was intended to repay the pre-existing debt of the Issuer and to pay
costs associated with the listing process (the "Senior Loan"), and a revolving line of credit of
100,000,000 euros that may be drawn down in different currencies (the "Revolving Line of Credit").
The Senior Loan was disbursed on 2 March 2015, as trading of the shares began on the MTA. On the
date that trading of the shares started on the MTA, the Company fully repaid the Old Loan Agreement
(which therefore ceased to be effective), using a portion of the income deriving from the global offer to
reduce the OVS Group's gross debt, and the Senior Loan to restructure the remainder: pursuant to the
New Loan Agreement, the Senior Loan had to be used, inter alia, to repay fully the debt arising from the
Old Loan Agreement. Therefore, on the date that trading started, financial debt mainly consisted of the
New Loan Agreement.
Furthermore, for this reason, the representation in the financial statements of the Old Loan Agreement
considers the effective date of repayment of the same, not the date of the contract, with all the financial
effects related to.
The applicable interest rate for both the Senior Loan and the revolving line of credit is equal to the sum
of (i) the margin of 3% per annum (the "Margin") and (ii) the Euribor rate or, if the currency used is
not the euro, the Libor rate (the "Interest"). Interest will be calculated on a quarterly or half-yearly basis
for the Senior Loan, and on a monthly or quarterly or half-yearly basis for the revolving line of credit
(unless otherwise agreed between the parties).
OVS Group – Annual Report at 31 January 2015 pg. 82
The Margin may decrease or increase according to the ratio of average total net debt to EBITDA (as
contractually specified), calculated on the basis, depending on the case, of the consolidated financial
statements (subject to revision) at 31 January and the consolidated interim report (not subject to
revision) at 31 July, drawn up pursuant to IFRS. Specifically, the New Loan Agreement stipulates that:
• if the ratio is equal to, or greater than 3.00:1, the applicable Margin will be 3.50%;
• if the ratio is less than 3.00:1 but equal to, or greather than 2.00:1, the applicable Margin will be
3.00%;
• if the ratio is less than 2.00:1 but equal to, or greater than 1.50:1, the applicable Margin will be
2.50%; and
• if the ratio is less than 1.50:1, the applicable Margin will be 2.00%;
From 31 July 2015, the Company must ensure that the aforementioned ratio of net debt to EBITDA
(as contractually specified) for each 12-month period, ending on 31 January and 31 July of each year, is
equal to or less than 3.50:1. The final due date of the New Loan Agreement, which also coincides with
the repayment date for the lines of credit, is fixed as the fifth anniversary of the date at which the
Senior Loan was initially disbursed.
The New Loan Agreement provides for mandatory early repayment if one of the following
circumstances, inter alia, should occur:
• the lending banks are unable to maintain the commitments provided for under the New Loan
Agreement due to an illegal event; and
• there is a change in control in the Issuer (intended to mean the acquisition by one party (or
several parties acting in concert) (i) of a percentage of voting rights that is sufficient, directly or
indirectly, to result in a mandatory public tender offer for shares of the Issuer and/or (ii) of the
power to appoint or dismiss all, or the majority, of the Issuer's directors.
The New Loan Agreement provides that, as a guarantee of its obligations, the following guarantees are
constituted in favour of the bank syndicate on own tangible assets, infra-group loans, patents, current
accounts, trade and insurance receivables, whose terms and conditions will be in line with those
currently provided by similar guarantees supporting the Old Loan Agreement, and in particular:
1. the assignment as collateral of receivables held by the Company arising from any infra-group
loans of which OVS S.p.A. is the lending party;
2. the assignment as collateral of trade and insurance receivables (mostly represented by trade
receivables from supply of products to franchisees and insurance receivables);
3. a lien has been created on corporate assets (mainly furnishings and equipment connected to OVS
business) owned by the Group;

OVS Group – Annual Report at 31 January 2015 pg. 83
4. a pledge on 100% of the shares of Oriental Buying Services Limited owned by OVS S.p.A.;
5. a pledge on 100% of the shares of the other subsidiaries of OVS S.p.A. that might be included, in
the future, in the definition of Material Company, as defined in the New Loan Agreement, with
Material Company understood to indicate each new Company that would in the future be controlled
by OVS S.p.A. and that is relevant, under the New Loan Agreement, because of the revenues
generated by it in relation to Group EBITDA;
6. a pledge on certain trademarks held by OVS S.p.A. (especially the OVS and UPIM trademarks);
7. a pledge on some of OVS S.p.A.'s current accounts.
OVS S.p.A. undertakes to announce the occurrence of any significant adverse events or default events
that could restrict and/or impede the ability of OVS S.p.A. or any guarantor to meet its contractual
obligations under the New Loan Agreement.
In terms of financial obligations, the only parameter that OVS S.p.A. is committed to comply with is
the leverage ratio, i.e., OVS Group's ratio of net debt to EBITDA, on a consolidated basis. From 31
July 2015, this parameter must be equal to or less than 3.50:1 for each 12-month period ending in a
reporting date (i.e., 31 January and 31 July of each year), according to a calculation based on the
consolidated financial statements and interim reports of OVS Group.
The New Loan Agreement is governed by UK law and any disputes relating thereto are under the
exclusive jurisdiction of the UK courts.
The breakdown of the consolidated net financial debt of OVS Group at 31 January 2015, determined
according to the provisions of the Consob Communication of 28 July 2006 and pursuant to the
ESMA/2013/319 Recommendations, is shown below:
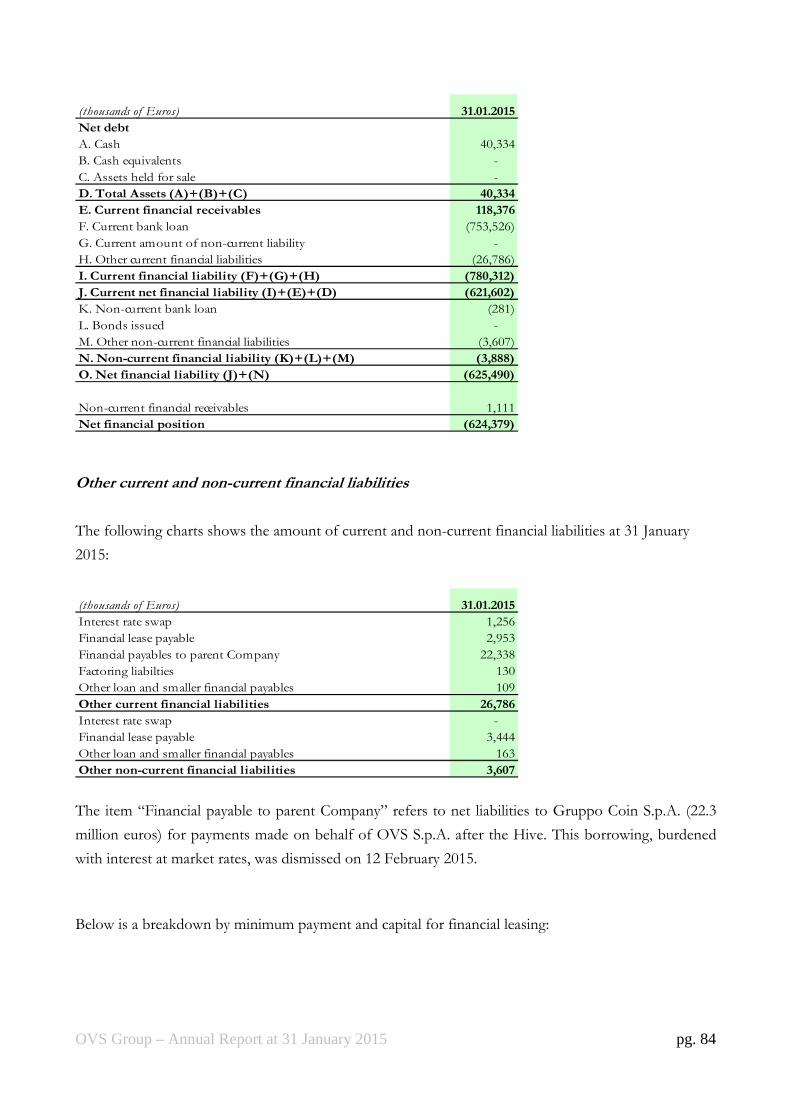
OVS Group – Annual Report at 31 January 2015 pg. 84
(thousands of Euros) 31.01.2015
Net debt
A. Cash 40,334
B. Cash equivalents -
C. Assets held for sale -
D. Total Assets (A)+(B)+(C) 40,334
E. Current financial receivables 118,376
F. Current bank loan (753,526)
G. Current amount of non-current liability -
H. Other current financial liabilities (26,786)
I. Current financial liability (F)+(G)+(H) (780,312)
J. Current net financial liability (I)+(E)+(D) (621,602)
K. Non-current bank loan (281)
L. Bonds issued -
M. Other non-current financial liabilities (3,607)
N. Non-current financial liability (K)+(L)+(M) (3,888)
O. Net financial liability (J)+(N) (625,490)
Non-current financial receivables 1,111
Net financial position (624,379)
Other current and non-current financial liabilities
The following charts shows the amount of current and non-current financial liabilities at 31 January
2015:
(thousands of Euros) 31.01.2015
Interest rate swap 1,256
Financial lease payable 2,953
Financial payables to parent Company 22,338
Factoring liabilties 130
Other loan and smaller financial payables 109
Other current financial liabilities 26,786
Interest rate swap -
Financial lease payable 3,444
Other loan and smaller financial payables 163
Other non-current financial liabilities 3,607
The item “Financial payable to parent Company” refers to net liabilities to Gruppo Coin S.p.A. (22.3
million euros) for payments made on behalf of OVS S.p.A. after the Hive. This borrowing, burdened
with interest at market rates, was dismissed on 12 February 2015.
Below is a breakdown by minimum payment and capital for financial leasing:
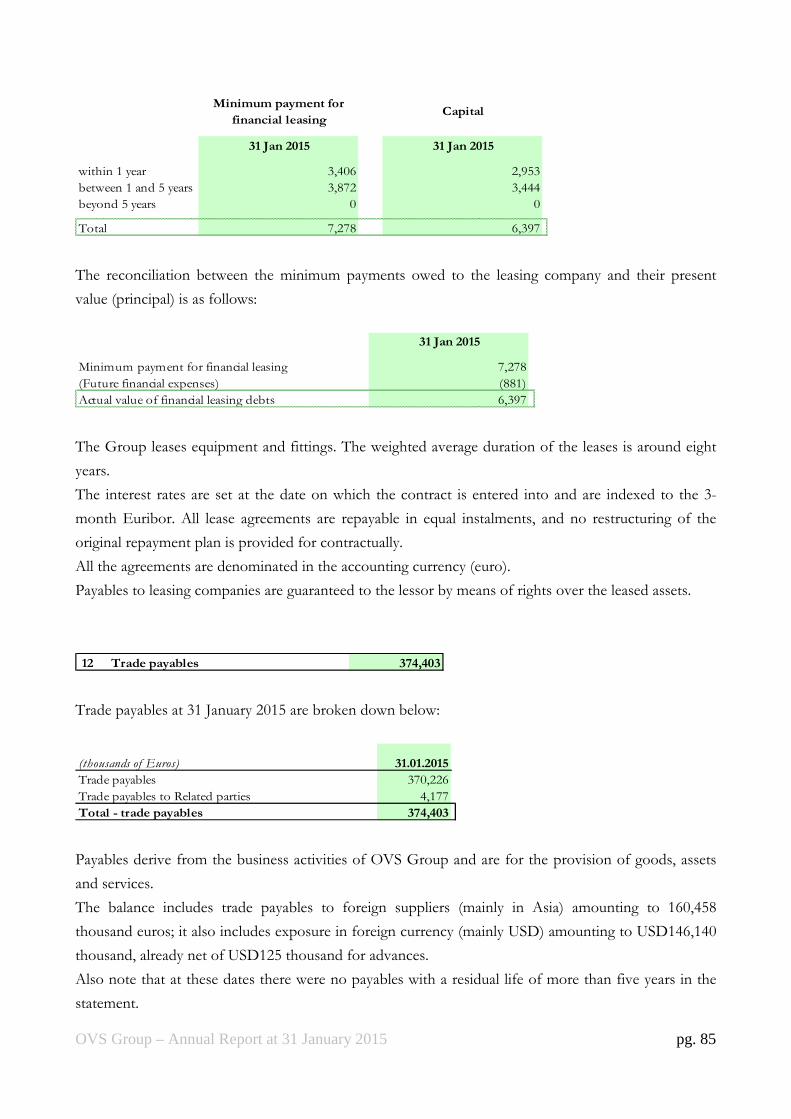
OVS Group – Annual Report at 31 January 2015 pg. 85
31 Jan 2015 31 Jan 2015
within 1 year 3,406 2,953
between 1 and 5 years 3,872 3,444
beyond 5 years 0 0
Total 7,278 6,397
Minimum payment for
financial leasingCapital
The reconciliation between the minimum payments owed to the leasing company and their present
value (principal) is as follows:
31 Jan 2015
Minimum payment for financial leasing 7,278
(Future financial expenses) (881)
Actual value of financial leasing debts 6,397
The Group leases equipment and fittings. The weighted average duration of the leases is around eight
years.
The interest rates are set at the date on which the contract is entered into and are indexed to the 3-
month Euribor. All lease agreements are repayable in equal instalments, and no restructuring of the
original repayment plan is provided for contractually.
All the agreements are denominated in the accounting currency (euro).
Payables to leasing companies are guaranteed to the lessor by means of rights over the leased assets.
12 Trade payables 374,403
Trade payables at 31 January 2015 are broken down below:
(thousands of Euros) 31.01.2015
Trade payables 370,226
Trade payables to Related parties 4,177
Total - trade payables 374,403
Payables derive from the business activities of OVS Group and are for the provision of goods, assets
and services.
The balance includes trade payables to foreign suppliers (mainly in Asia) amounting to 160,458
thousand euros; it also includes exposure in foreign currency (mainly USD) amounting to USD146,140
thousand, already net of USD125 thousand for advances.
Also note that at these dates there were no payables with a residual life of more than five years in the
statement.

OVS Group – Annual Report at 31 January 2015 pg. 86
13 Current tax liabilities 16,836
The amount shown includes IRES (corporation tax) payables of 11.1 million euros and IRAP (regional
production tax) payables of 5.3 million euros, as well as taxes paid by the foreign companies.
14 Other current payables 88,820
14 Other non-current payables 9,396
At 31 January 2015, the item Other payables breaks down as follows:
31.01.2015
Due to employees for holiday leave 6,883
Other amounts due to employees 16,406
Due to directors, statutory auditors and
shareholders 434
Other payables 4,987
Due to Social Security 6,066
VAT payables 34,662
Other tax payables 2,709
Other payables - due to customers 70
Leasing instalment accruals/deferrals 6,639
Utilities accruals and deferrals 2,231
Insurance accruals and deferrals 50
Other accruals and deferrals 7,683
Total current liabilities 88,820
Straight lining of rental expenses 8,556
Accrued expenses and deferred income 840
Total non-current liabilities 9,396
Payables to employees relates to benefits accrued and not paid out at 31 January 2015.
“Other payables” mainly refers to customer advances to book goods and purchases of goods vouchers
for 2,291 thousand euros, down payments received on the sale of the Milan Piazzale Loreto and Padua
business units for 300 thousand euros and to payables to a former Upim S.r.l. supplier for a legal
dispute amounting to 340 thousand euros.
The largest component of the increase in payables to pension and social security institutions is in the
form of payables to the INPS.
At the reporting date the Group had a VAT payable deriving from retail and wholesale sales and to a
lesser extent from the sale of goods and services.

OVS Group – Annual Report at 31 January 2015 pg. 87
The "Other tax payables" item includes IRPEF (personal tax) on employees, payables to tax offices and
payables for unpaid withholding tax.
It should be noted that the "Other accrued expenses/deferred income" item includes 3,127 thousand
euros in accrued expenses for local taxes, 415 thousand euros for travel expenses and 2,498 thousand
euros in deferred income for contributions payable by partners and lessors.
It also includes 240 thousand euros relating to current amount of extending the right to use software
licences granted to Gruppo Coin for a period of five years, whose non-current value is is booked in
“Non-current other accrued expenses and deferral income” for an amount ot 840 thousand euros.
The amount of 8,556 thousand euros refers to non-current liabilities due to the straight lining of
rental expenses that have increasing rents over the term of the contract.
15 Employee benefits 44,445
The amount represents the provisions made by the Group for accrued employee severance benefits.
Post-employment benefits are guaranteed by the Group as part of its defined benefit plans. The defined
benefit plans include the provision for employee severance benefits accrued at 31 December 2006, as
since that date, due to the reform that has taken place, the provision has been identified as a defined
contribution provision.
As already mentioned, from 1 January 2007, the Finance Law and the associated implementing decrees
introduced significant amendments to the rules on employee severance benefits, including options for
employees with regard to the allocation of their accruing severance benefits. Specifically, new flows of
severance benefits may be directed by the employee to preselected or company pension schemes (in the
latter case, the company will pay severance benefit contributions into a treasury account set up with the
INPS [Italian social security and welfare institution]).
The change in the "Employee benefits" item is shown below.
Value at contribution date 42,497
Increase for the period 186
Actuarial earnings / (losses) 3,706
Contributions / benefits paid (1,944)
Value at 31.01.2015 44,445
The working economic and demographic assumptions used for the actuarial assessments are as follows:

OVS Group – Annual Report at 31 January 2015 pg. 88
Demographic assumptions:
• for the expectation of death, the IPS55 demographic, broken down by gender;
• for the expectation of disability, the assumptions used by the INPS model for projections to
2010. Expectations are constructed starting with the distribution by age and gender of pensions
in force at 1 January 1987 starting in 1984, 1985 and 1986 relating to personnel in the credit
unit;
• for the age of retirement of the general working population, achievement of the first retirement
requirement applicable for Mandatory General Insurance was assumed;
• for the probability of leaving employment for reasons other than death, based on statistics
provided by the Group, an annual frequency rate of 5.00% was assumed;
• for the probability of early retirement, a year-on-year figure of 3.00% was assumed.
Economic and financial assumptions:
Annual discount rate 1.25%
Annual inflation rate 1.75%
Annual increase in employee severance benefits 2.81%
The iBoxx Eurozone Corporates AA 10+ at the calculation date was used as the benchmark for the
discount rate. This expiry relates to the average remaining period of service at the company of the
employees of Group Companies, weighted with the expected payment.
Sensitivity analysis
As required by the revised version of IAS 19, a sensitivity analysis was carried out on changes in the
key actuarial assumptions included in the calculation model.
The above scenario was used as the baseline scenario; from this, the most significant assumptions –
i.e., the average annual discount rate, the average inflation rate and the turnover rate – were
increased and decreased by one half, one quarter and two percentage points, respectively. The
results obtained are summarised in the following table (millions of euros):
Annual discount rate Annual inflation rate Annual turnover rate (amounts in millions of
Euros) +0.50% -0.50% +0.25% -0.25% +2.00% -2.00% OVS 42.8 47.0 45.4 44.2 44.3 45.5

OVS Group – Annual Report at 31 January 2015 pg. 89
Future cash flows
As required by the revised version of IAS 19, the expected payment flows for the next few years
were calculated, as the following table shows (million euros ):
Years Cash Flow
0 - 1 3.4 1 - 2 3.0 2 - 3 3.0 3 - 4 2.7 4 - 5 2.8
5 - beyond 36.3
The amount also includes 81 thousand euros related to a pension provision, with disbursement
scheduled for when the employee retires or the agency contract is terminated. Like the employee
severance benefits, the provision is calculated on an actuarial basis using the Projected Unit Credit
method.
The average number of personnel during the period just ended was 72 managers, 5,968 white-collar
workers and 241 blue-collar workers.
At 31 January 2015, the Group had 74 managers, 5,946 white-collar workers and 242 blue-collar
workers in its employ.
16 Provisions for risks and charges 9,395
The change in the provisions for the current year is as follows:
Value at contribution date 9,249
Increase for the period 237
Exchange rate effect 26
Decrease of the period (117)
Value at 31.01.2015 9,395
The provision is made for the risk of disputes with suppliers in relation to product sales and marketing,
public entities, former employees and third parties of various kinds.
The outcome of these risks cannot be defined with certainty, and the amount recorded therefore
represents the best estimate of the presumed charge at year-end.
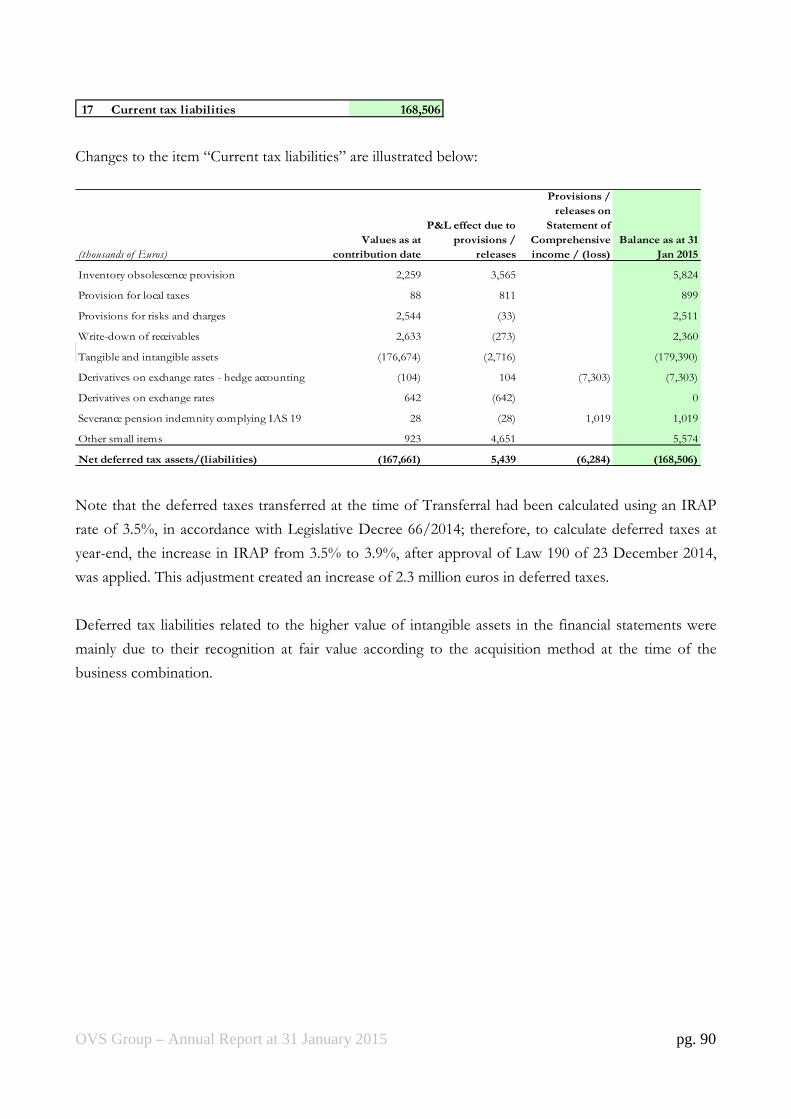
OVS Group – Annual Report at 31 January 2015 pg. 90
17 Current tax liabilities 168,506
Changes to the item “Current tax liabilities” are illustrated below:
(thousands of Euros)
Values as at
contribution date
P&L effect due to
provisions /
releases
Provisions /
releases on
Statement of
Comprehensive
income / (loss)
Balance as at 31
Jan 2015
Inventory obsolescence provision 2,259 3,565 5,824
Provision for local taxes 88 811 899
Provisions for risks and charges 2,544 (33) 2,511
Write-down of receivables 2,633 (273) 2,360
Tangible and intangible assets (176,674) (2,716) (179,390)
Derivatives on exchange rates - hedge accounting (104) 104 (7,303) (7,303)
Derivatives on exchange rates 642 (642) 0
Severance pension indemnity complying IAS 19 28 (28) 1,019 1,019
Other small items 923 4,651 5,574
Net deferred tax assets/(liabilities) (167,661) 5,439 (6,284) (168,506)
Note that the deferred taxes transferred at the time of Transferral had been calculated using an IRAP
rate of 3.5%, in accordance with Legislative Decree 66/2014; therefore, to calculate deferred taxes at
year-end, the increase in IRAP from 3.5% to 3.9%, after approval of Law 190 of 23 December 2014,
was applied. This adjustment created an increase of 2.3 million euros in deferred taxes.
Deferred tax liabilities related to the higher value of intangible assets in the financial statements were
mainly due to their recognition at fair value according to the acquisition method at the time of the
business combination.
OVS Group – Annual Report at 31 January 2015 pg. 91
SHAREHOLDERS' EQUITY
Shareholders' equity came in at 408.0 million euros.
Details of changes in the items included in shareholders' equity are provided in the relative accounting
schedule.
18 Share capital
At 31 January 2015, the share capital of OVS S.p.A. amounted to 140,000,000 euros, comprising
140,000,000 ordinary shares with no par value.
OVS was incorporated on 14 May 2014 with the name "OVS S.r.l.", with share capital of 10,000 euros.
The extraordinary general meeting of 23 July 2014 resolved to increase the share capital by 139,990,000
euros, from 10,000 euros to 140,000,000 euros, with a premium of 249,885,000 euros, to be paid in
through the Transferral of the OVS-UPIM Business Unit by sole shareholder Gruppo Coin.
With effect from the final instant of 31 July 2014, OVS changed its legal form into a limited company
named "OVS S.p.A.".
Therefore, at the reporting date, the share capital, fully subscribed and paid in, amounted to
140,000,000 euros, represented by 140,000,000 ordinary shares with no par value.
18 Other reserves
The breakdown of other reserves is as follows:
The share premium reserve of 249.9 million euros resulted from the capital increase by OVS S.p.A., as
already mentioned.
There are also other reserves amounting to 21.9 million euros, mainly including the effects of booking
directly to equity the actuarial gains/(losses) relating to employee severance benefits, the cash flow
hedging reserve and the translation reserve.

OVS Group – Annual Report at 31 January 2015 pg. 92
Changes in the cash flow hedging reserve were as follows:
thousands of Euros 2014
Value at contribution date 0
Release to Cogs level of the part relating to instruments for which ended the hedging
relationship (212)
Deferred tax effect 58
Release to the change in inventories for the part relating to instruments
for which ended the hedging relationship (2,023)
Deferred tax effect 556
Release in P&L of fair value related to instruments for which ended the
hedging relationship 11,083
Deferred tax effect (3,048)
Changes in fair value 17,710
Deferred tax effect (4,869)
Total changes 19,255
Value at the end of the year 19,255
Changes in the reserve for actuarial gains/(losses) were as follows:
thousands of Euros 2014
Value at contribution date 0
Changes in severance fund in accordance with IAS 19 (3,706)
Deferred tax effect 1,019
Total changes (2,687)
Value at the end of the year (2,687)
For further details on changes during the year, please see the consolidated statement of changes in
shareholders' equity.

OVS Group – Annual Report at 31 January 2015 pg. 93
NOTES TO THE CONSOLIDATED INCOME STATEMENT
We will now provide details of some income statement items (values are expressed in thousands of
Euros).
It should be noted that the amounts shown include the economic balances of OVS Group from the
date of incorporation to the end of the year, i.e., from 14 May 2014 to 31 January 2015; in particular,
OVS Group acquired the OVS-UPIM Business Unit by transferral with effect from 31 July 2014.
19 Revenues
Revenues break down as follows:
31.01.2015
Revenues for retail sales 716,945
VAT on retail sales (129,666)
Net Sales 587,279
Revenues from sales to affiliates and wholesale 69,641
Subtotal Net Sales 656,920
Revenues for services 65
Total 656,985
20 Other operating income and revenues
31.01.2015
Revenues from provision of services 18,924
Rental and leasing income 8,682
Compensation for damages 28
Capital gains from disposal of assets 33
Other 5,062
Total 32,729
Revenues from services mainly relate to the recovery of transport expenses, recovery of advertising
expenses, promotional contributions, chargebacks of staff costs and other services, including fees from
commercial concession partners at OVS Group stores.
The item “Rental and leasing income” mainly includes rent from concession partners at OVS and Upim
stores.
The "Other revenues" item mainly includes contributions from suppliers and lessors, repayment of
training costs and various contingent assets.

OVS Group – Annual Report at 31 January 2015 pg. 94
21 Purchases of raw materials, consumables and goods
Purchases of raw materials, supplies, consumables and goods mainly consists of purchases of products
for sale and amounts to 290,143 thousand euros.
These break down as follows:
31.01.2015
Purchase of raw materials, consumables and goods 297,704
Change in inventories (7,561)
Total 290,143
The consideration in Euros for purchases abroad, mainly in dollars, including ancillary costs, is 245,027
thousand euros.
22 Personnel costs
Personnel costs break down as follows:
31.01.2015
Wages and salaries 91,036
Social security charges 27,994
Staff leaving indemnity 5,550
Personnel expenses - other costs 288
Remuneration of Directors 358
Total 125,226
Note that, as part of the operation to acquire an equity investment in Gruppo Coin by funds assisted by
BC Partners, which was completed on 30 June 2011, Icon 1 S.A., a holding company operating under
Luxembourg law, issued a series of financial instruments to serve the acquisition, assigned to a range of
classes of persons, including some managers at Gruppo Coin and at OVS Group.
For further information on the characteristics of said financial instruments and the way they were
handled in accounting terms by the contributing company, Gruppo Coin S.p.A., please consult the
section of the Prospectus on carve-out statements (section 20.1.3) on the Investor Relations page of the
Company’s website.
Also note that, in conjunction with the addition of three more managers as Icon 1 S.A. shareholders,
the characteristics of those instruments are currently being redefined and that process is nearing
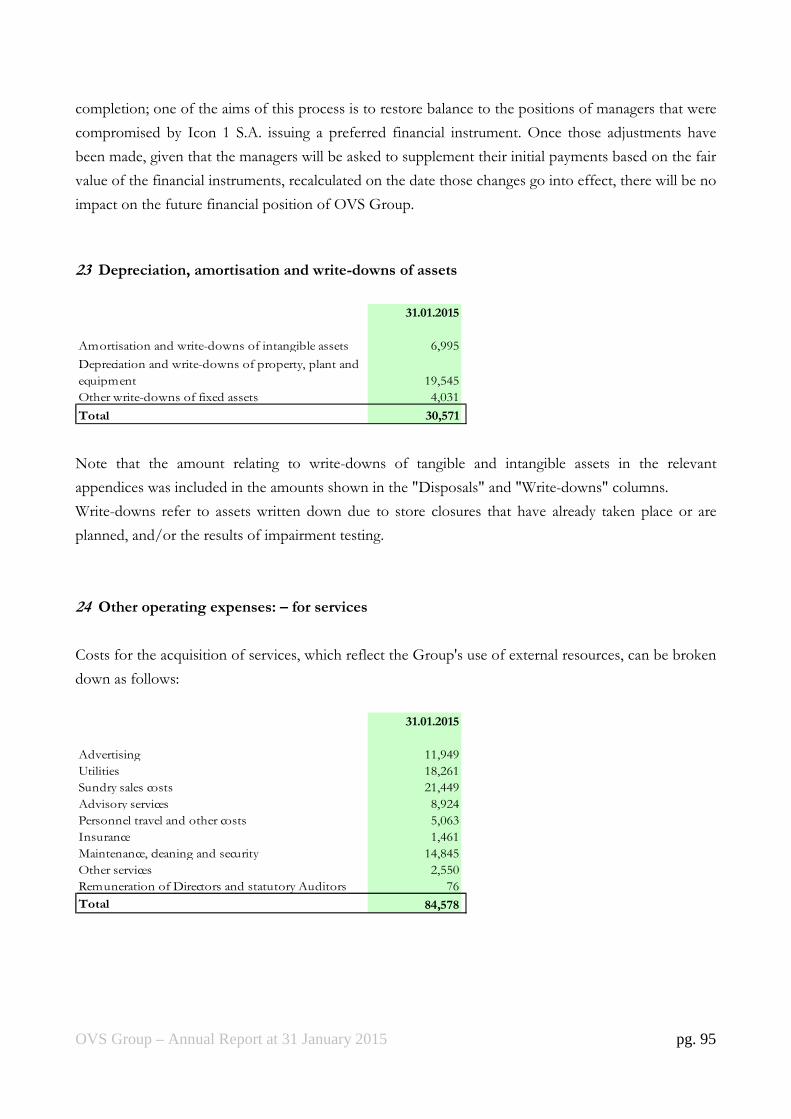
OVS Group – Annual Report at 31 January 2015 pg. 95
completion; one of the aims of this process is to restore balance to the positions of managers that were
compromised by Icon 1 S.A. issuing a preferred financial instrument. Once those adjustments have
been made, given that the managers will be asked to supplement their initial payments based on the fair
value of the financial instruments, recalculated on the date those changes go into effect, there will be no
impact on the future financial position of OVS Group.
23 Depreciation, amortisation and write-downs of assets
31.01.2015
Amortisation and write-downs of intangible assets 6,995
Depreciation and write-downs of property, plant and
equipment 19,545
Other write-downs of fixed assets 4,031
Total 30,571
Note that the amount relating to write-downs of tangible and intangible assets in the relevant
appendices was included in the amounts shown in the "Disposals" and "Write-downs" columns.
Write-downs refer to assets written down due to store closures that have already taken place or are
planned, and/or the results of impairment testing.
24 Other operating expenses: – for services
Costs for the acquisition of services, which reflect the Group's use of external resources, can be broken
down as follows:
31.01.2015
Advertising 11,949
Utilities 18,261
Sundry sales costs 21,449
Advisory services 8,924
Personnel travel and other costs 5,063
Insurance 1,461
Maintenance, cleaning and security 14,845
Other services 2,550
Remuneration of Directors and statutory Auditors 76
Total 84,578

OVS Group – Annual Report at 31 January 2015 pg. 96
25 Other operating expenses: – for the use of third-party assets
Costs for the use of third-party assets break down as follows:
31.01.2015
Rents payable and related costs 89,312
Leasing of plants, equipment and motor vehicles 1,950
Total 91,262
The item "Rents payable and related costs" mainly includes rents and condominium expenses generated
by the sales network. The leases were signed at arm's length conditions.
26 Other operating expenses –write-downs and provisions
The breakdown is as follows:
31.01.2015
Allowance for doubtful accounts 1,580
Allowance for risks 237
Total 1,817
For details of the amounts described above, please see the details for the respective items of the
allowance for bad debt and the provision for risks and charges.
27 Other operating expenses: – other operating charges
Other operating charges break down as follows:
31.01.2015
Other operating charges - material and equipment 3,174
Other operating charges - taxes and duties 4,905
Other operating charges - losses on assets 460
Other operating charges - charitable donations 110
Other operating charges - corporate expenses 161
Other operating costs - other admin. and general costs 608
Other operating costs - other smaller costs 733
Total 10,151
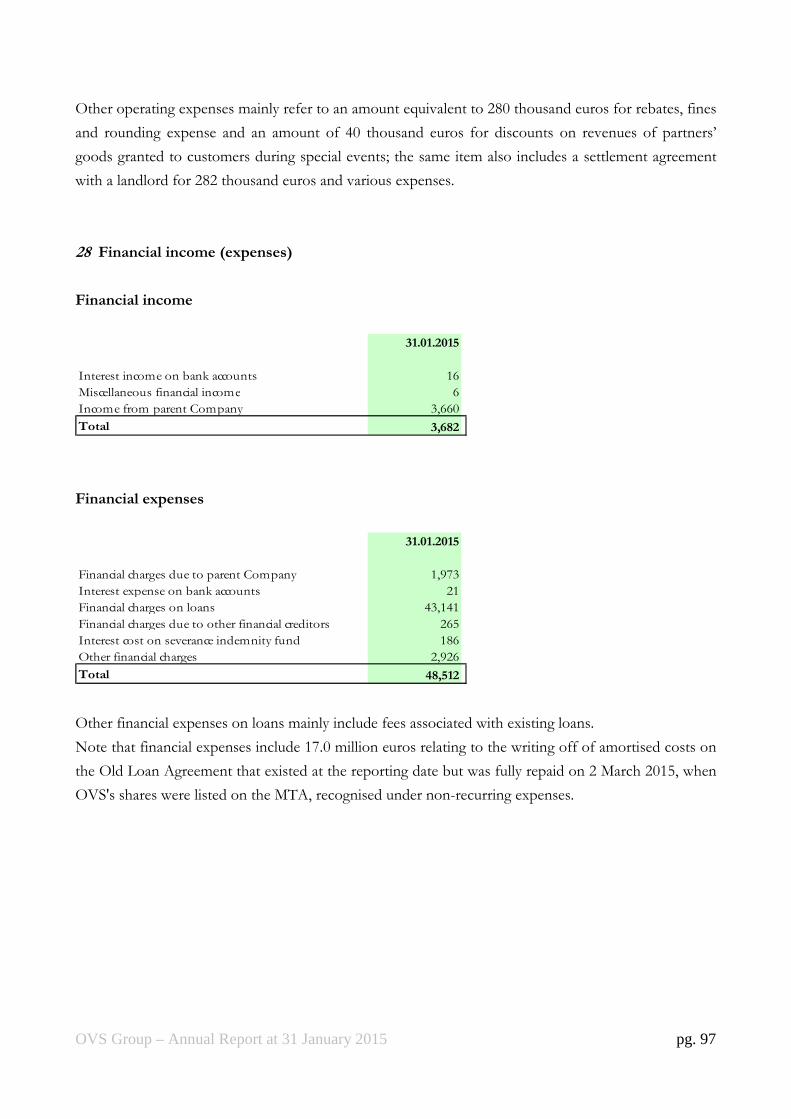
OVS Group – Annual Report at 31 January 2015 pg. 97
Other operating expenses mainly refer to an amount equivalent to 280 thousand euros for rebates, fines
and rounding expense and an amount of 40 thousand euros for discounts on revenues of partners’
goods granted to customers during special events; the same item also includes a settlement agreement
with a landlord for 282 thousand euros and various expenses.
28 Financial income (expenses)
Financial income
31.01.2015
Interest income on bank accounts 16
Miscellaneous financial income 6
Income from parent Company 3,660
Total 3,682
Financial expenses
31.01.2015
Financial charges due to parent Company 1,973
Interest expense on bank accounts 21
Financial charges on loans 43,141
Financial charges due to other financial creditors 265
Interest cost on severance indemnity fund 186
Other financial charges 2,926
Total 48,512
Other financial expenses on loans mainly include fees associated with existing loans.
Note that financial expenses include 17.0 million euros relating to the writing off of amortised costs on
the Old Loan Agreement that existed at the reporting date but was fully repaid on 2 March 2015, when
OVS's shares were listed on the MTA, recognised under non-recurring expenses.

OVS Group – Annual Report at 31 January 2015 pg. 98
Exchange rate gains and losses
31.01.2015
Foreign exchange gains 3,185
Foreign exchange losses (14,609)
Income/(expense) due to change on trading fair value
on exchange rate differences 2,670
Income/(expense) due to change on hedging fair
value on exchange rate differences 5,565
Total (3,189)
29 Income tax for the year
The following is a breakdown of the charge to the income statement:
31.01.2015
IRES tax 11,059
IRAP tax 5,351
Foreign taxes 768
Deferred taxes (5,439)
Total 11,739
The following table shows the reconciliation of the theoretical tax charge with the effective tax charge:
(thousands of Euros) 31.01.2015 %
Profit before taxes 7,947
Theoretical tax - IRES (2,185) (27.5)%
IRAP tax (5,466) (68.8)%
Permanent differences (4,088) (51.4)%
Income taxes (11,739)
Effective tax rate (147.7)%
Note that the deferred taxes transferred at the time of Transferral had been calculated using an IRAP
rate of 3.5%, in accordance with Legislative Decree 66/2014; therefore, to calculate deferred taxes at
year-end, the increase in IRAP from 3.5% to 3.9%, after approval of Law 190 of 23 December 2014,
was applied. This adjustment created an increase of 2.3 million euros in deferred taxes.
It also be should noted that IRAP tax takes an important place respect to the net result, which is also
affected by the significant amount referred to financial charges.
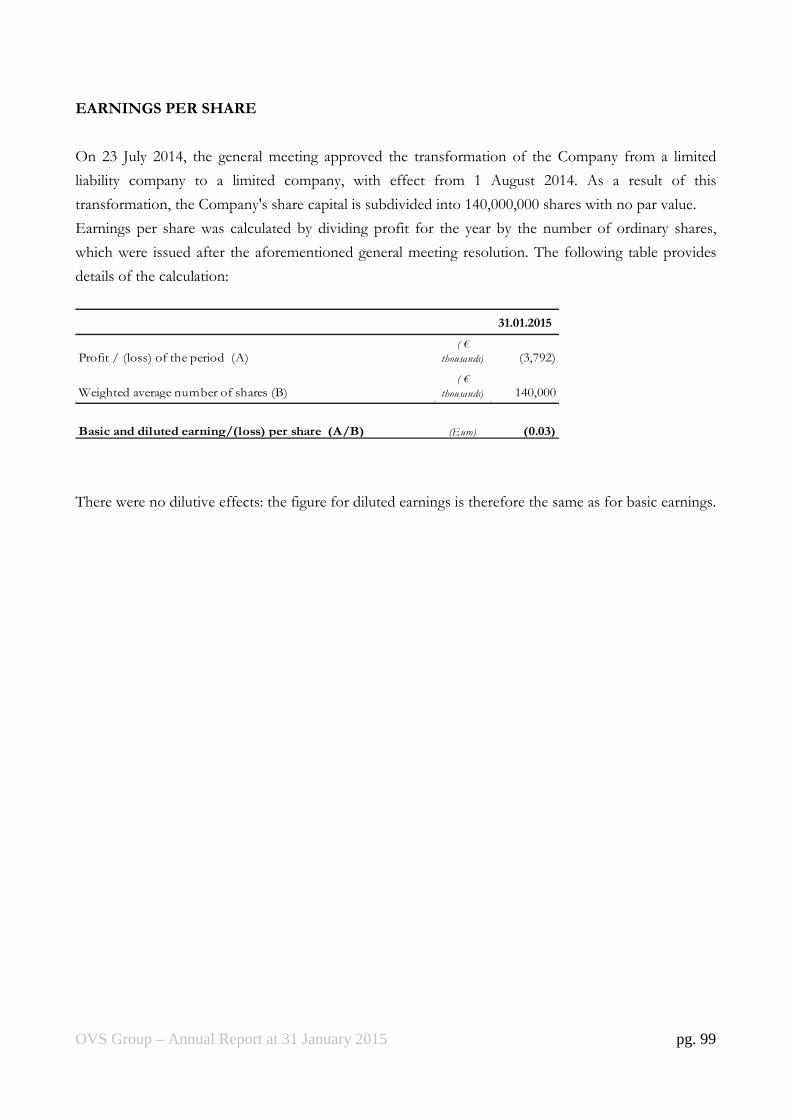
OVS Group – Annual Report at 31 January 2015 pg. 99
EARNINGS PER SHARE
On 23 July 2014, the general meeting approved the transformation of the Company from a limited
liability company to a limited company, with effect from 1 August 2014. As a result of this
transformation, the Company's share capital is subdivided into 140,000,000 shares with no par value.
Earnings per share was calculated by dividing profit for the year by the number of ordinary shares,
which were issued after the aforementioned general meeting resolution. The following table provides
details of the calculation:
31.01.2015
Profit / (loss) of the period (A)( €
thousands) (3,792)
Weighted average number of shares (B)( €
thousands) 140,000
Basic and diluted earning/(loss) per share (A/B) (Euro) (0.03)
There were no dilutive effects: the figure for diluted earnings is therefore the same as for basic earnings.

OVS Group – Annual Report at 31 January 2015 pg. 100
RELATIONS WITH RELATED PARTIES
Relationships with related parties largely involve the controlling company Gruppo Coin S.p.A. and its
subsidiaries.
The following table summarises OVS Group's lending and borrowing relationships with related parties,
as defined by IAS 24:
(thousands of Euros)
Gruppo
Coin S.p.A.
COSI -
Concept of
Style Italy
S.p.A.
Excelsior
Verona
S.r.l.
GCF
S.p.A.
Centomila-
candele
S.c.p.a.
Directors and
Key
Management Total
BS item
value %
Trade receivables 7,474 40 2 3 - - 7,519 73,015 10.3%
Current financial assets 81,988 - - - - - 81,988 118,376 69.3%-
Current financial liabilities (22,338) - - - - - (22,338) (780,312) 2.9%
Trade payables (2,718) (25) - (2) (1,432) - (4,177) (374,403) 1.1%
Current tax liabilities (11,059) - - - - - (11,059) (16,836) 65.7%
Other current liabilities - - - - - (863) (863) (88,820) 1.0%
Related parties
Gruppo Coin's main financial relationships at 31 January 2015 were as follows:
• 81,988 thousand euros relating to the balancing receivable for Transferral, arising due to adjustments
and additions made to the items subject to Transferral between the reference date for the Transferral
situation and the effective date, plus the relative accrued interest, recognised under "Current financial
assets";
• 22,338 thousand euros as the difference between the amount of payments made by Gruppo Coin
S.p.A. on behalf of the Company (principally for letters of credit, VAT, financial expenses and other tax
items) and the amount of the short-term loan granted in several tranches by the parent Company to
Gruppo Coin, in order to fulfil temporarily the financial requirements described above, plus the relative
accrued interest, recognised under "Current financial liabilities".
Other lending and borrowing relationships with related parties mainly concern the supply of goods and
consumables for sales points, goods brokerage fees, charged-back employee expenses and the provision
of product purchasing services.
Relationships with Centomilacandele S.c.p.a. relate to the provision of services for the purchase of
electricity. Centomilacandele S.c.p.a. is a non-profit consortium company, engaged in the supply of
electricity and natural gas under the best possible conditions to the consortium entities.
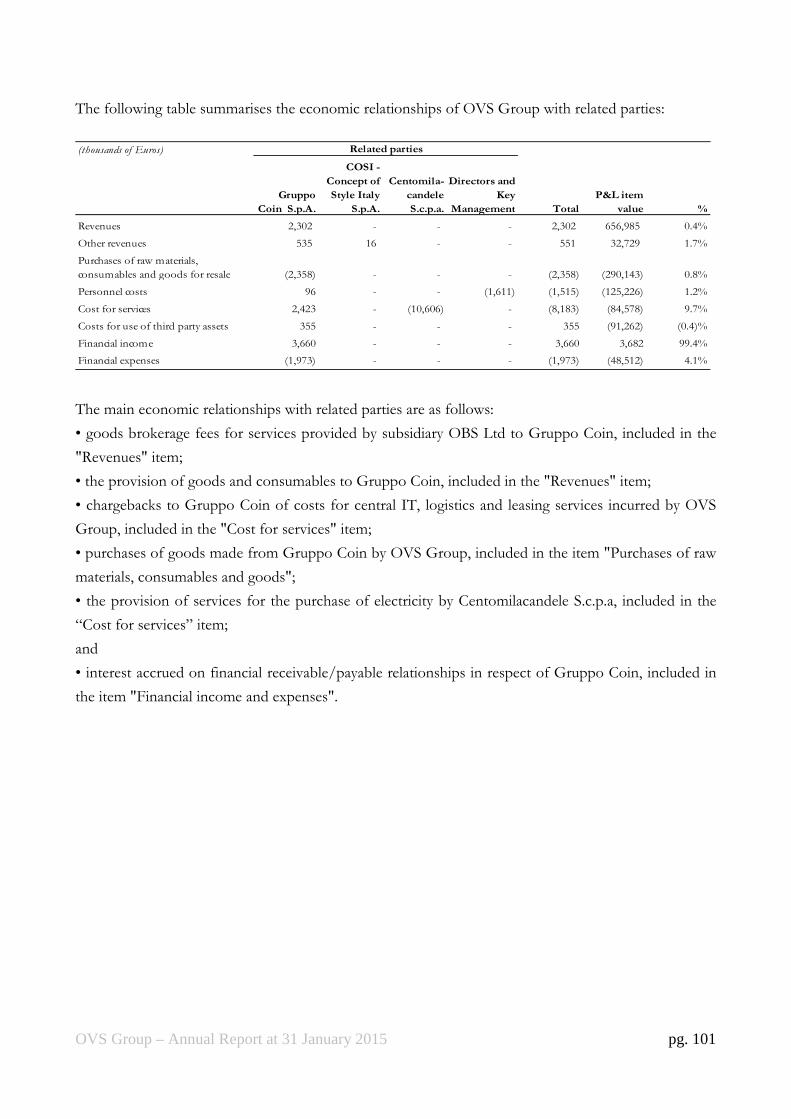
OVS Group – Annual Report at 31 January 2015 pg. 101
The following table summarises the economic relationships of OVS Group with related parties:
(thousands of Euros)
Gruppo
Coin S.p.A.
COSI -
Concept of
Style Italy
S.p.A.
Centomila-
candele
S.c.p.a.
Directors and
Key
Management Total
P&L item
value %
Revenues 2,302 - - - 2,302 656,985 0.4%
Other revenues 535 16 - - 551 32,729 1.7%
Purchases of raw materials,
consumables and goods for resale (2,358) - - - (2,358) (290,143) 0.8%
Personnel costs 96 - - (1,611) (1,515) (125,226) 1.2%
Cost for services 2,423 - (10,606) - (8,183) (84,578) 9.7%
Costs for use of third party assets 355 - - - 355 (91,262) (0.4)%
Financial income 3,660 - - - 3,660 3,682 99.4%
Financial expenses (1,973) - - - (1,973) (48,512) 4.1%
Related parties
The main economic relationships with related parties are as follows:
• goods brokerage fees for services provided by subsidiary OBS Ltd to Gruppo Coin, included in the
"Revenues" item;
• the provision of goods and consumables to Gruppo Coin, included in the "Revenues" item;
• chargebacks to Gruppo Coin of costs for central IT, logistics and leasing services incurred by OVS
Group, included in the "Cost for services" item;
• purchases of goods made from Gruppo Coin by OVS Group, included in the item "Purchases of raw
materials, consumables and goods";
• the provision of services for the purchase of electricity by Centomilacandele S.c.p.a, included in the
“Cost for services” item;
and
• interest accrued on financial receivable/payable relationships in respect of Gruppo Coin, included in
the item "Financial income and expenses".

OVS Group – Annual Report at 31 January 2015 pg. 102
Cash flows as per the following chart represent the effective payments and cash received, booked with
related parties, they have not to be intended as changes on the items of the financial statement occurred
during the year 2014.
(thousands of Euros)
Gruppo
Coin S.p.A.
Centomila-
candele
S.c.p.a.
Directors and
Key
Management Total
Total cash flow
as per cash flow
statement %
Cash flow generated/(absorbed) by
changes in working activity (25,074) (11,507) (1,387) (37,968) 130,554 (29.1)%
Cash flow generated/(absorbed) by
changes in financing activity (*) 14,453 - 14,453 (57,290) (25.2)%
Related parties
(*) The cash-in due to the contribution of the OVS-UPIM Business Unit was entirely allocated to the transferor Gruppo Coin SpA, even if 1,881 thousand euros are attributable to cash-in of the subsidiaries that have been contributed.
The transactions listed above took place under arm's length conditions.
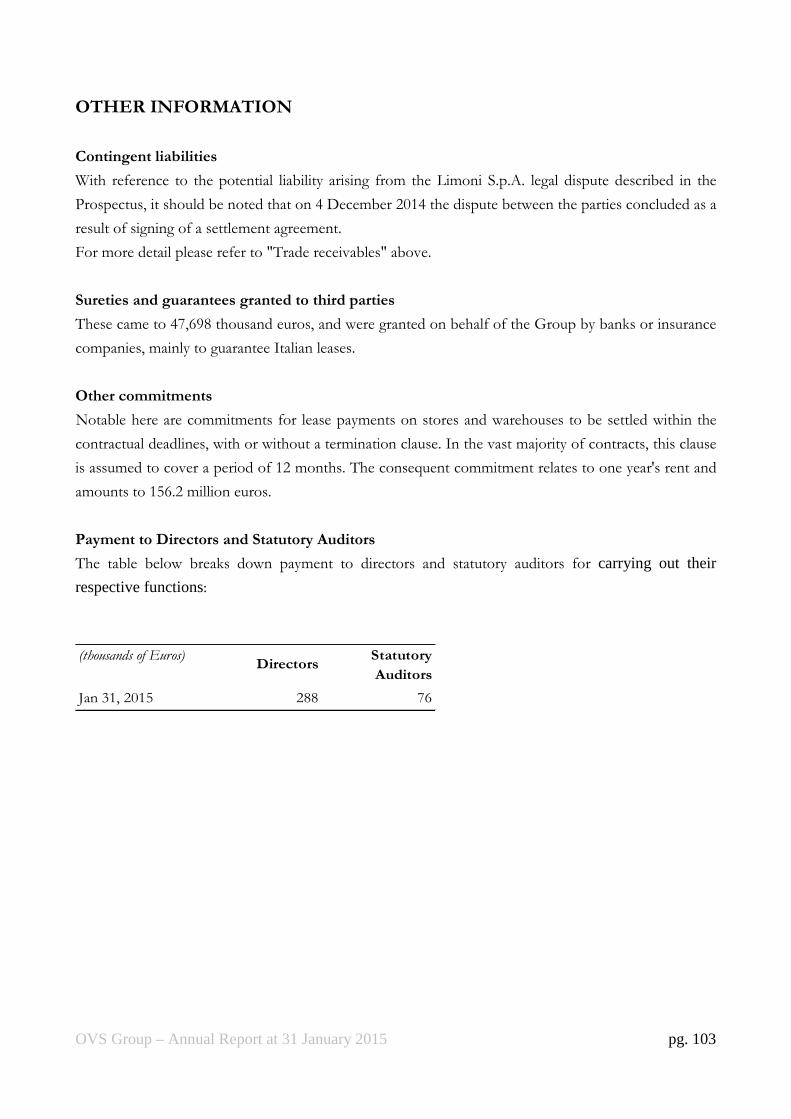
OVS Group – Annual Report at 31 January 2015 pg. 103
OTHER INFORMATION
Contingent liabilities
With reference to the potential liability arising from the Limoni S.p.A. legal dispute described in the
Prospectus, it should be noted that on 4 December 2014 the dispute between the parties concluded as a
result of signing of a settlement agreement.
For more detail please refer to "Trade receivables" above.
Sureties and guarantees granted to third parties
These came to 47,698 thousand euros, and were granted on behalf of the Group by banks or insurance
companies, mainly to guarantee Italian leases.
Other commitments
Notable here are commitments for lease payments on stores and warehouses to be settled within the
contractual deadlines, with or without a termination clause. In the vast majority of contracts, this clause
is assumed to cover a period of 12 months. The consequent commitment relates to one year's rent and
amounts to 156.2 million euros.
Payment to Directors and Statutory Auditors
The table below breaks down payment to directors and statutory auditors for carrying out their
respective functions:
(thousands of Euros) Statutory
Auditors
Jan 31, 2015 288 76
Directors
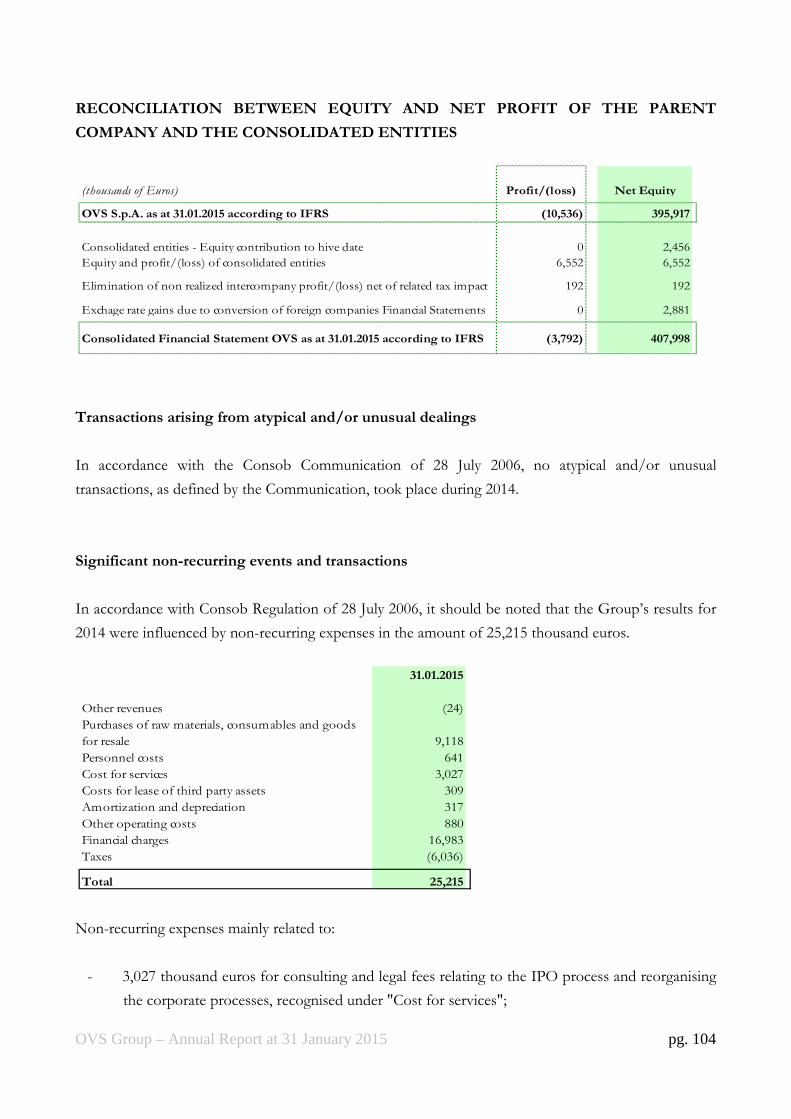
OVS Group – Annual Report at 31 January 2015 pg. 104
RECONCILIATION BETWEEN EQUITY AND NET PROFIT OF THE PARENT
COMPANY AND THE CONSOLIDATED ENTITIES
(thousands of Euros) Profit/(loss) Net Equity
OVS S.p.A. as at 31.01.2015 according to IFRS (10,536) 395,917
Consolidated entities - Equity contribution to hive date 0 2,456
Equity and profit/(loss) of consolidated entities 6,552 6,552
Elimination of non realized intercompany profit/(loss) net of related tax impact 192 192
Exchage rate gains due to conversion of foreign companies Financial Statements 0 2,881
Consolidated Financial Statement OVS as at 31.01.2015 according to IFRS (3,792) 407,998
Transactions arising from atypical and/or unusual dealings
In accordance with the Consob Communication of 28 July 2006, no atypical and/or unusual
transactions, as defined by the Communication, took place during 2014.
Significant non-recurring events and transactions
In accordance with Consob Regulation of 28 July 2006, it should be noted that the Group’s results for
2014 were influenced by non-recurring expenses in the amount of 25,215 thousand euros.
31.01.2015
Other revenues (24)
Purchases of raw materials, consumables and goods
for resale 9,118
Personnel costs 641
Cost for services 3,027
Costs for lease of third party assets 309
Amortization and depreciation 317
Other operating costs 880
Financial charges 16,983
Taxes (6,036)
Total 25,215
Non-recurring expenses mainly related to:
- 3,027 thousand euros for consulting and legal fees relating to the IPO process and reorganising
the corporate processes, recognised under "Cost for services";

OVS Group – Annual Report at 31 January 2015 pg. 105
- 9,118 thousand euros for write-downs of goods, mainly relating to the process of disposal of
goods in the shops before conversion, recognised under "Purchases of raw materials,
consumables and goods";
- 880 thousand euros in expenses relating to reorganisations, recognised under "Other operating
costs";
- 16,983 thousand euros regarding the write-off of amortised cost on the Old Loan Agreement in
existence at the end of the year but fully repaid on 2 March 2015, at the time company shares
were listed on the MTA, recognised under “Financial charges”.
Significant events after the reporting period
In order to have a clearer description of significant events after the end of the year, please refer to what
was already described in the Report on Operations.

OVS Group – Annual Report at 31 January 2015 pg. 106
APPENDICES TO THE CONSOLIDATED FINANCIAL STATEMENTS
The following documents contain additional information on the consolidated financial statements for
the year ended 31 January 2015.
Appendices:
1) Property, plant and equipment at 31 January 2015;
2) Intangible fixed assets at 31 January 2015.
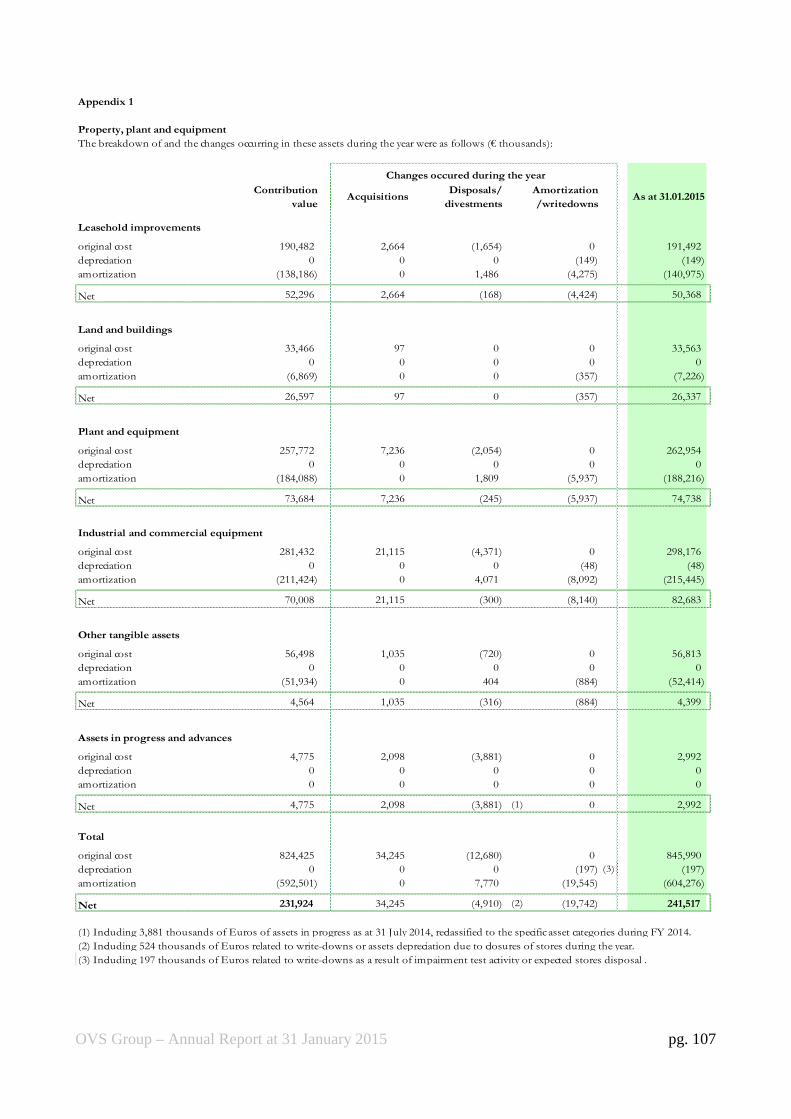
OVS Group – Annual Report at 31 January 2015 pg. 107
Appendix 1
Property, plant and equipment
The breakdown of and the changes occurring in these assets during the year were as follows (€ thousands):
Contribution
valueAcquisitions
Amortization
/writedownsAs at 31.01.2015
Leasehold improvements
original cost 190,482 2,664 (1,654) 0 191,492
depreciation 0 0 0 (149) (149)
amortization (138,186) 0 1,486 (4,275) (140,975)
Net 52,296 2,664 (168) (4,424) 50,368
Land and buildings
original cost 33,466 97 0 0 33,563
depreciation 0 0 0 0 0
amortization (6,869) 0 0 (357) (7,226)
Net 26,597 97 0 (357) 26,337
Plant and equipment
original cost 257,772 7,236 (2,054) 0 262,954
depreciation 0 0 0 0 0
amortization (184,088) 0 1,809 (5,937) (188,216)
Net 73,684 7,236 (245) (5,937) 74,738
Industrial and commercial equipment
original cost 281,432 21,115 (4,371) 0 298,176
depreciation 0 0 0 (48) (48)
amortization (211,424) 0 4,071 (8,092) (215,445)
Net 70,008 21,115 (300) (8,140) 82,683
Other tangible assets
original cost 56,498 1,035 (720) 0 56,813
depreciation 0 0 0 0 0
amortization (51,934) 0 404 (884) (52,414)
Net 4,564 1,035 (316) (884) 4,399
Assets in progress and advances
original cost 4,775 2,098 (3,881) 0 2,992
depreciation 0 0 0 0 0
amortization 0 0 0 0 0
Net 4,775 2,098 (3,881) (1) 0 2,992
Total
original cost 824,425 34,245 (12,680) 0 845,990
depreciation 0 0 0 (197) (3) (197)
amortization (592,501) 0 7,770 (19,545) (604,276)
Net 231,924 34,245 (4,910) (2) (19,742) 241,517
(3) Including 197 thousands of Euros related to write-downs as a result of impairment test activity or expected stores disposal .
Changes occured during the year
Disposals/
divestments
(1) Including 3,881 thousands of Euros of assets in progress as at 31 July 2014, reclassified to the specific asset categories during FY 2014.
(2) Including 524 thousands of Euros related to write-downs or assets depreciation due to closures of stores during the year.
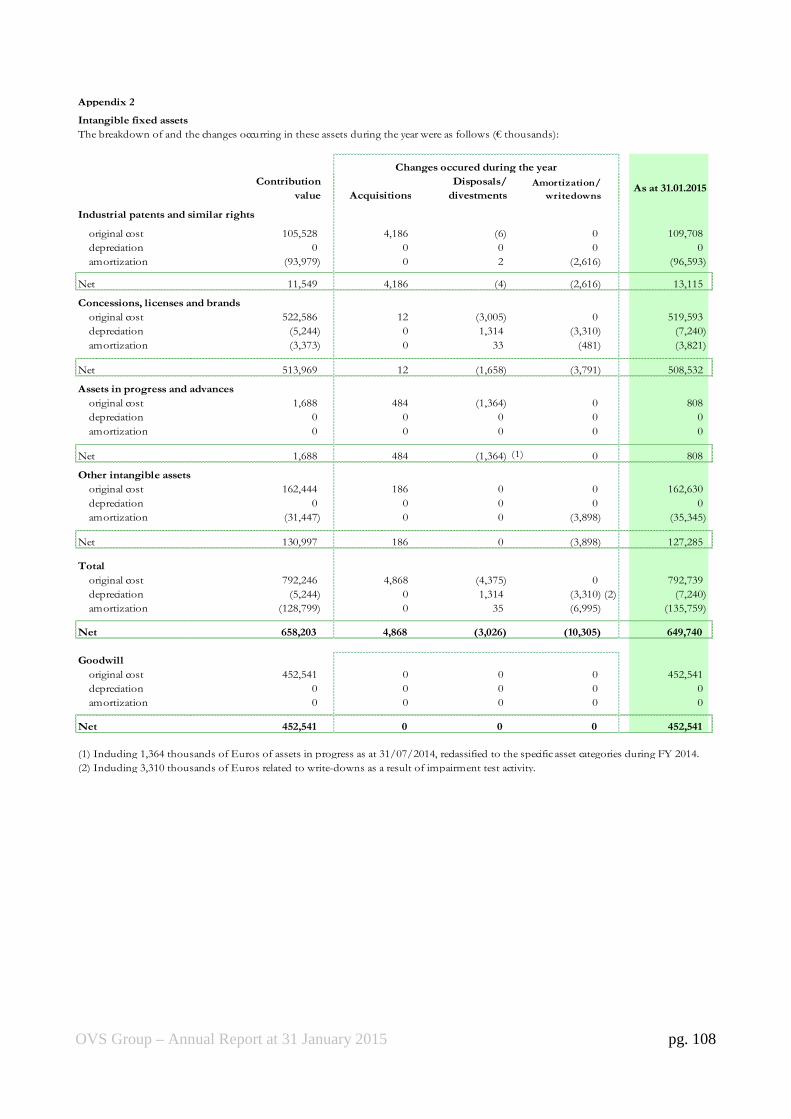
OVS Group – Annual Report at 31 January 2015 pg. 108
Intangible fixed assets
The breakdown of and the changes occurring in these assets during the year were as follows (€ thousands):
Contribution
value Acquisitions
Amortization/
writedownsAs at 31.01.2015
Industrial patents and similar rights
original cost 105,528 4,186 (6) 0 109,708
depreciation 0 0 0 0 0
amortization (93,979) 0 2 (2,616) (96,593)
Net 11,549 4,186 (4) (2,616) 13,115
Concessions, licenses and brands
original cost 522,586 12 (3,005) 0 519,593
depreciation (5,244) 0 1,314 (3,310) (7,240)
amortization (3,373) 0 33 (481) (3,821)
Net 513,969 12 (1,658) (3,791) 508,532
Assets in progress and advances
original cost 1,688 484 (1,364) 0 808
depreciation 0 0 0 0 0
amortization 0 0 0 0 0
Net 1,688 484 (1,364) (1) 0 808
Other intangible assets
original cost 162,444 186 0 0 162,630
depreciation 0 0 0 0 0
amortization (31,447) 0 0 (3,898) (35,345)
Net 130,997 186 0 (3,898) 127,285
Total
original cost 792,246 4,868 (4,375) 0 792,739
depreciation (5,244) 0 1,314 (3,310) (2) (7,240)
amortization (128,799) 0 35 (6,995) (135,759)
Net 658,203 4,868 (3,026) (10,305) 649,740
Goodwill
original cost 452,541 0 0 0 452,541
depreciation 0 0 0 0 0
amortization 0 0 0 0 0
Net 452,541 0 0 0 452,541
Appendix 2
Changes occured during the year
Disposals/
divestments
(1) Including 1,364 thousands of Euros of assets in progress as at 31/07/2014, reclassified to the specific asset categories during FY 2014.
(2) Including 3,310 thousands of Euros related to write-downs as a result of impairment test activity.
OVS Group – Annual Report at 31 January 2015 pg. 109
Certification of the Consolidated Financial Statements pursuant to article 81-ter
of Consob regulation 11971 of 14 May 1999, as subsequently amended and supplement
1. We, the undersigned, Stefano Beraldo, in his capacity as Chief Executive Officer, and Nicola Perin, in his
capacity as Director responsible for preparing the corporate accounting statements of OVS S.p.A., hereby
declare, also taking account of article 154-bis, paragraphs 3 and 4, of Legislative Decree 58 of 24 February
1998:
• the suitability in relation to characteristics of the business, and
• the effective application
of the administrative and accounting procedures for the preparation of the consolidated financial
statements for the period ended 31 January 2015.
2. The CFO (“Manager in charge of the preparation of the company financial reports” as identified by the company’s
articles of association), with the support of a Team composed by internal and external resources, has
assessed the design adequacy and the operational effectiveness of the OVS Group’s Internal Control
System over Financial Reporting (ICFR), through the set up of a company framework based on the CoSO
framework (Committee of Sponsoring Organizations of the Treadway Commission) and in accordance with
international standards and best practices. According to CFO’s Compliance Program supporting the
declaration, the OVS Group framework is focused on key controls, which should be able to mitigate
adequately the risks over company financial reporting, in accordance with the company risk profile.
3. Moreover:
3.1 the consolidated financial statements:
a) were prepared in compliance with the international accounting standards recognised by the
European Community pursuant to (EC) Regulation 1606/2002 of the European Parliament and
of the Council of 19 July 2002;
b) correspond to the accounting books and records;
c) are suitable to provide a true and fair representation of the financial position, income and cash
flows performance of the issuer and the consolidated companies.
3.2 The Report on Operations includes a reliable analysis of the performance and operating results, as well
as the situation, of the issuer and the consolidated companies, as well as a description of the main risks
and uncertainties to which they are exposed.
Venice – Mestre, 22 April 2015
Stefano Beraldo Nicola Perin
Chief Executive Officer Director responsible for preparing the corporate accounting statements

OVS Group – Annual Report at 31 January 2015 pg. 110
Separate financial statements of OVS S.p.A.
at 31 January 2015

OVS Group – Annual Report at 31 January 2015 pg. 111
Statement of financial position (€ units) ASSETS
31.01.2015of which
Related partiesNote
Current assets
Cash and cash equivalents 38,288,592 1
Trade receivables 76,315,091 11,369,571 2
Inventories 286,072,065 3
Financial assets 118,376,346 81,988,242 4
Current tax assets (A) 296,338 5
Other receivables 35,519,151 6
Current assets 554,867,583 93,357,813
Non-current and fixed assets
Property, plant and equipment 239,839,532 7
Intangible fixed assets 649,715,725 8
Goodwill 452,540,909 9
Equity investments 8,852,503 10
Financial assets 1,110,936 4
Other receivables 2,537,600 6
Non-current and fixed assets 1,354,597,205 0
TOTAL ASSETS 1,909,464,788 93,357,813
31.01.2015of which
Related partiesNote
Current liabilities
Financial liabilities 779,936,912 22,338,415 11
Trade payables 390,867,608 21,541,787 12
Current tax liabilities (B) 16,410,080 11,059,160 13
Other payables 88,026,280 863,417 14
Current liabilities 1,275,240,880 55,802,779
Non-current liabilities
Financial liabilities (C) 3,606,774 11
Employee benefits 44,402,469 15
Provisions for risks and charges 11,985,693 16
Current tax liabilities 168,916,177 17
Other liabilities 9,396,000 14
Non-current liabilities 238,307,113 0
TOTAL LIABILITIES 1,513,547,993 55,802,779
NET EQUITY
Share Capital 140,000,000 18
Other reserves 266,453,267 18
Net result for the year (10,536,472)
TOTAL SHAREHOLDERS' EQUITY 395,916,795 0
SHAREHOLDERS' EQUITY AND LIABILITIES 1,909,464,788 55,802,779
LIABILITIES AND NET EQUITY

OVS Group – Annual Report at 31 January 2015 pg. 112
Income statement (€ units)
31.01.2015
Unusual
income /
(expense)
of which
Related partiesNote
Revenues 651,966,638 3,079,703 19
Other operating income and revenues 31,987,747 23,992 242,842 20
Total Revenues 683,954,385 23,992 3,322,545
Purchase of raw materials, consumables and goods 301,213,733 8,909,186 15,222,568 21
Personnel expenses 121,720,816 641,385 1,514,580 22
Amortisation, depreciation and write-downs of fixed assets 29,741,609 23
Other costs
- costs for services (D) 82,837,519 3,027,304 8,182,813 24
- costs for use of third party assets 89,637,373 219,014 (354,284) 25
- costs for write-downs and allocations 1,500,000 26
- other operating charges 9,880,183 526,153 27
Net result before net financial charges and taxes 47,423,152 (13,299,050) (21,243,132)
Financial income 3,672,125 3,660,290 28
Financial charges (48,443,967) (16,982,800) (1,973,244)
Exchange differences (328,669)
Income (charges) from equity investments (1,837,000)
Pre-tax net result for the year 485,641 (30,281,850) (19,556,086)
Tax (11,022,113) 6,036,000 29
Net Result (10,536,472) (24,245,850) (19,556,086)
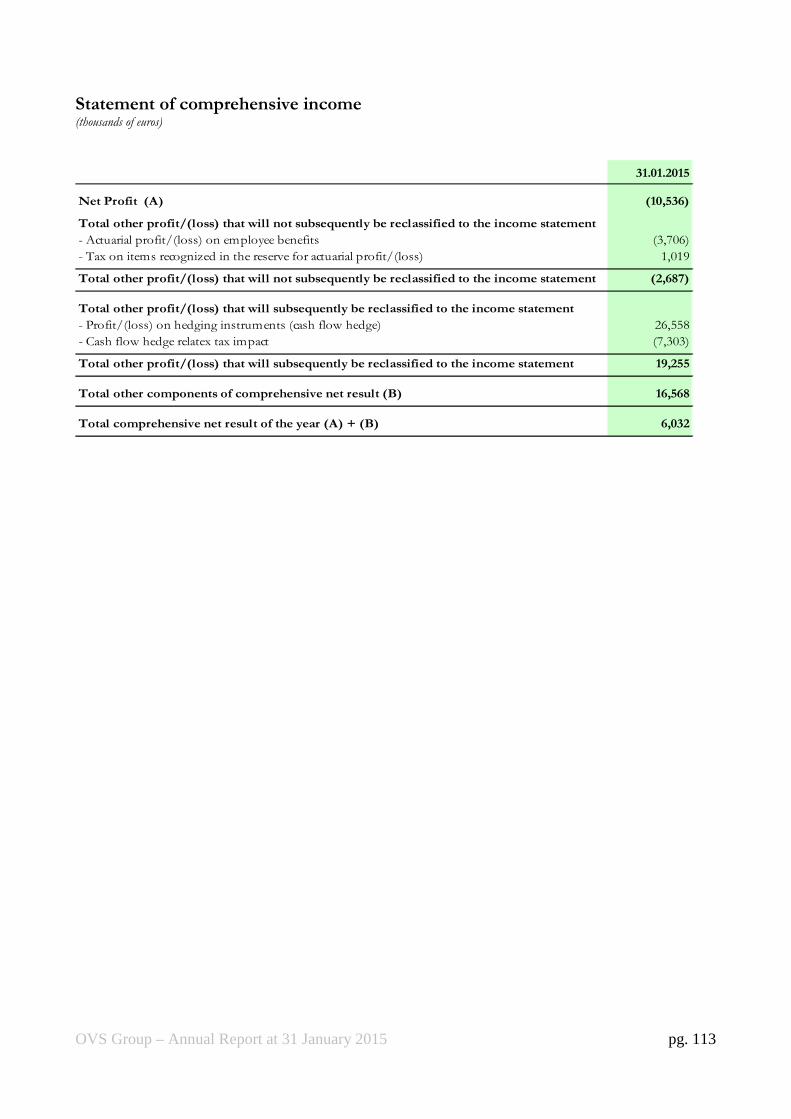
OVS Group – Annual Report at 31 January 2015 pg. 113
Statement of comprehensive income (thousands of euros)
31.01.2015
Net Profit (A) (10,536)
Total other profit/(loss) that will not subsequently be reclassified to the income statement
- Actuarial profit/(loss) on employee benefits (3,706)
- Tax on items recognized in the reserve for actuarial profit/(loss) 1,019
Total other profit/(loss) that will not subsequently be reclassified to the income statement (2,687)
Total other profit/(loss) that will subsequently be reclassified to the income statement
- Profit/(loss) on hedging instruments (cash flow hedge) 26,558
- Cash flow hedge relatex tax impact (7,303)
Total other profit/(loss) that will subsequently be reclassified to the income statement 19,255
Total other components of comprehensive net result (B) 16,568
Total comprehensive net result of the year (A) + (B) 6,032
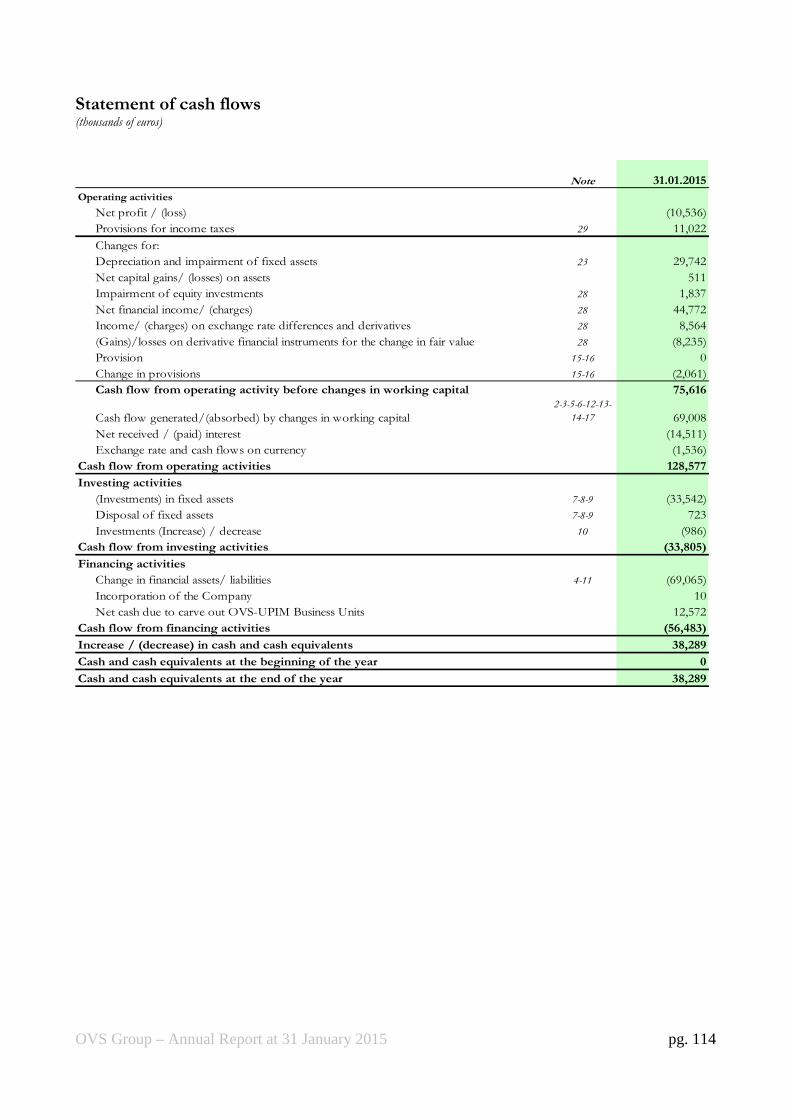
OVS Group – Annual Report at 31 January 2015 pg. 114
Statement of cash flows (thousands of euros)
Note 31.01.2015
Operating activities
Net profit / (loss) (10,536)
Provisions for income taxes 29 11,022
Changes for:
Depreciation and impairment of fixed assets 23 29,742
Net capital gains/ (losses) on assets 511
Impairment of equity investments 28 1,837
Net financial income/ (charges) 28 44,772
Income/ (charges) on exchange rate differences and derivatives 28 8,564
(Gains)/losses on derivative financial instruments for the change in fair value 28 (8,235)
Provision 15-16 0
Change in provisions 15-16 (2,061)
Cash flow from operating activity before changes in working capital 75,616
Cash flow generated/(absorbed) by changes in working capital2-3-5-6-12-13-
14-17 69,008
Net received / (paid) interest (14,511)
Exchange rate and cash flows on currency (1,536)
Cash flow from operating activities 128,577
Investing activities
(Investments) in fixed assets 7-8-9 (33,542)
Disposal of fixed assets 7-8-9 723
Investments (Increase) / decrease 10 (986)
Cash flow from investing activities (33,805)
Financing activities
Change in financial assets/ liabilities 4-11 (69,065)
Incorporation of the Company 10
Net cash due to carve out OVS-UPIM Business Units 12,572
Cash flow from financing activities (56,483)
Increase / (decrease) in cash and cash equivalents 38,289
Cash and cash equivalents at the beginning of the year 0
Cash and cash equivalents at the end of the year 38,289
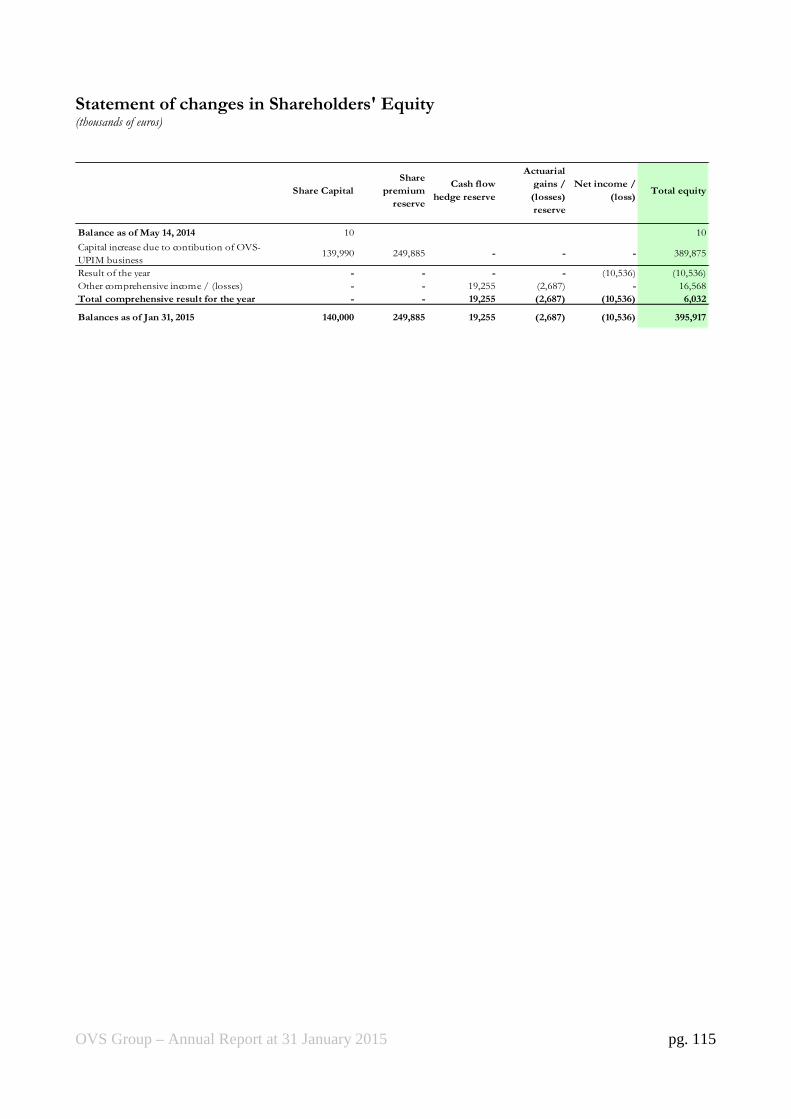
OVS Group – Annual Report at 31 January 2015 pg. 115
Statement of changes in Shareholders' Equity (thousands of euros)
Balance as of May 14, 2014 10 10
Capital increase due to contibution of OVS-
UPIM business139,990 249,885 - - - 389,875
Result of the year - - - - (10,536) (10,536)
Other comprehensive income / (losses) - - 19,255 (2,687) - 16,568
Total comprehensive result for the year - - 19,255 (2,687) (10,536) 6,032
Balances as of Jan 31, 2015 140,000 249,885 19,255 (2,687) (10,536) 395,917
Share CapitalCash flow
hedge reserve
Net income /
(loss)
Share
premium
reserve
Actuarial
gains /
(losses)
reserve
Total equity

OVS Group – Annual Report at 31 January 2015 pg. 116
EXPLANATORY NOTES
GENERAL INFORMATION
OVS S.p.A. (hereinafter also the "Company") is a company incorporated on 14 May 2014, domiciled in
Italy and organised under the laws of the Italian Republic, with its registered office at 17, via Terraglio,
Mestre, Venice, Italy.
OVS S.p.A. came about due to a corporate reorganisation process that entailed the carving out of a
group of assets and liabilities (the OVS-UPIM Business Unit, together with the Company and
hereinafter, "OVS Group") by means of the transferral of this business unit (the "Transferral") by
Gruppo Coin to a newly created company wholly owned by Gruppo Coin (OVS S.p.A.), by means of a
capital increase in kind subscribed by Gruppo Coin, with effect from 31 July 2014.
Therefore, the financial year ended 31 January 2015 represent the first financial year for OVS S.p.A..
Specifically, on 23 July 2014:
a) the Company's extraordinary general meeting resolved to increase the share capital by 139,990,000
euros, from 10,000 euros to 140,000,000 euros, with a premium of 249,885,000 euros, to be paid in
through the Transferral of the OVS-UPIM Business Unit by sole shareholder Gruppo Coin;
b) Gruppo Coin subscribed for the entire capital increase and executed it immediately, with the
Transferral taking effect as of the final instant of 31 July 2014; and
c) the same extraordinary general meeting resolved to transform OVS S.r.l. into a limited company
named OVS S.p.A.. As a result of this transformation, the Company's share capital was divided into
140,000,000 shares with no par value.
The Transferral procedure was configured as a "business combination involving entities or businesses
under common control". This operation is not governed by IFRS 3, which applies to methods of
accounting for business combinations, nor by any other IFRS. In the absence of a reference accounting
standard, it is believed that the choice of methodology for the accounting representation of the
operation must still meet the requirements of IAS 8: i.e., the reliable and faithful representation of the
operation. Moreover, the accounting standard chosen to represent operations "under common control"
must reflect the economic substance of such operations, regardless of their legal form. The notion of
economic substance is therefore a key guiding factor for the choice of methods used to account for the
operations in question. Economic substance must refer to the generation of added value that effectively
results in significant changes in the cash flows of the net assets transferred. The current interpretations
and current guidelines should also be considered for the accounting recognition of the operation, and
specifically, the Assirevi [Italian Association of Auditors] Preliminary Guidelines on IFRS (OPI 1),
relating to the "accounting treatment of business combinations of entities under common control in
OVS Group – Annual Report at 31 January 2015 pg. 117
the separate financial statements and the consolidated financial statements". The net assets transferred
must therefore be recognised at the carrying amounts that they had in the acquired company, or, if
available, the amounts recorded in the consolidated financial statements of the company with common
control. The Company therefore recognised the net assets transferred at the carrying amounts recorded
in the consolidated financial statements of the controlling company (Gruppo Coin).
Borsa Italiana, with Provision 8006 of 10 February 2015, approved the admission to trading of the
Company's shares on the Mercato Telematico Azionario (MTA), organised and managed by Borsa
Italiana S.p.A..
2 March 2015 was the first day of trading in the Company's shares on the MTA.
STRUCTURE AND CONTENT OF THE FINANCIAL STATEMENTS
The separate financial statements of OVS S.p.A. at 31 January 2015 were prepared in accordance with
the International Financial Reporting Standards ("IFRS") issued by the International Accounting
Standards Board. "IFRS" is intended to mean all the revised International Accounting Standards (IAS)
and all the interpretations of the International Financial Reporting Interpretations Committee (IFRIC),
previously known as the Standing Interpretations Committee (SIC). At the reporting date for the
separate financial statements, these had been approved by the European Union under the procedure set
forth in (EC) Regulation 1606/2002 of the European Parliament and the European Council of 19 July
2002.
The Company's separate financial statements comprise the statement of financial position, the income
statement, the statement of comprehensive income, the statement of cash flows, the statement of
changes in shareholders' equity and the explanatory notes. The amounts shown in the statement of
financial position and in the income statement are expressed in euro/units, while the amounts shown in
the statement of comprehensive income, the statement of cash flows, the statement of changes in
shareholders' equity and the explanatory notes, unless otherwise specified, are expressed in thousands
of euros.
These consolidated financial statements were prepared on a going concern basis, as the directors have
verified the absence of any financial, operational or other indicators that could signal problems with the
Group's ability to meet its obligations in the foreseeable future, and particularly in the next 12 months.
With regard to procedures for the presentation of the accounting schedules, in the context of
transactions provided for by IAS 1, OVS S.p.A. has opted for the following types of accounting
schedules:

OVS Group – Annual Report at 31 January 2015 pg. 118
- Statement of financial position: assets and liabilities are classified with current and non-current
items shown separately;
- Income statement: prepared separately from the statement of comprehensive income with
operating costs classified by nature;
- Statement of comprehensive income: includes, as well as net profit, changes in shareholders'
equity related to items of an economic nature which, by express provision of the international
accounting standards, are recognised as components of shareholders' equity;
- Statement of cash flows: shows the cash flows from operating, investment and financial
activities. The indirect method was used to prepare this statement;
- Statement of changes in shareholders' equity: shows net profit and each item of income and
expense not posted to the income statement but recognised directly in equity pursuant to
specific IFRS.
The schedules used, as specified above, provide the best representation of the Company's separate
financial position and profit performance.
These explanatory notes analyse, expand upon and comment on the amounts shown in OVS S.p.A.'s
financial statements. They are accompanied by additional information deemed necessary to give a true
and fair view of the Company's financial position and results.
Changes in the items recognised under assets and liabilities are elaborated upon when they are
significant.
The separate financial statements are prepared on a historical cost basis, altered as required for the
valuation of some derivatives.
Please see the Report on Operations for information on the nature of the Company's business and
significant events taking place after the reporting period.
The financial statements have been audited by PricewaterhouseCoopers S.p.A..

OVS Group – Annual Report at 31 January 2015 pg. 119
ACCOUNTING STANDARDS AND VALUATION CRITERIA
The main accounting policies and valuation criteria used by OVS S.p.A. are described below.
Business combinations
The Company recognises business combinations using the acquisition method pursuant to IFRS 3 -
Business Combinations.
Under this method, the consideration transferred to a business combination is measured at fair value,
calculated as the sum of the fair values of the assets transferred and the liabilities assumed at the
acquisition date. The ancillary costs of the transaction are usually recognised in the income statement
when they are incurred.
Goodwill is determined as the excess of the sum of the considerations transferred to the business
combination, the shareholders' equity attributable to third parties and the fair value of any equity
investment previously held in the acquiree, over the fair value of the net assets acquired and liabilities
assumed at the acquisition date.
If a business combination is achieved in different stages by successive purchases of shares, each stage is
treated separately using the cost and information related to the fair value of assets, liabilities and
contingent liabilities at the date of each transaction to determine the amount of any difference. When a
subsequent acquisition allow to reach the control of a company, the stake previously owned are
accounted based on the fair value of assets, liabilities and contingent liabilities, determined on the date
of purchase of control and the difference is recognized in income statement.
Goodwill
Goodwill is recognised at cost, less any accumulated impairment.
Goodwill acquired as part of a business combination is determined as the excess of the sum of the
considerations transferred to the business combination, shareholders' equity attributable to third parties
and the fair value of any equity investment previously held in the acquiree, over the net assets and
liabilities acquired/assumed at the acquisition date.
If the value of the net assets acquired and liabilities assumed at the acquisition date exceeds the value of
the amounts transferred, of the value of net equity attributable to non-controlling interest and of the
fair value of previously held equity interest in the acquire company, the excess is immediately
recognized in the income statement as income.

OVS Group – Annual Report at 31 January 2015 pg. 120
Goodwill is not amortised, but is tested annually, and whenever events or circumstances indicate the
possibility of impairment, for recoverability pursuant to IAS 36 - Impairment of Assets.
If the recoverable amount is lower than the carrying amount, the asset is written down to the
recoverable amount. If goodwill is allocated to a cash-generating unit that is partially
transferred/disposed of, the goodwill associated with this unit is used to determine any gain/loss
arising from the operation.
Brands
Brands deriving from business combinations are recognised at the fair value at the date of the
combination, according to the acquisition method. They are not amortised as they have an indefinite
useful life, but they are tested annually, and whenever events or circumstances indicate the possibility of
impairment, for recoverability pursuant to IAS 36 - Impairment of Assets. After initial recognition, the
brands are valued at cost less any cumulative impairment.
Intangible assets
Intangible assets consist of non-monetary items, identifiable and without physical substance, which can
be controlled by the Company, can generate future economic benefits and whose cost can be reliably
determined. These items are recognised at cost, less amortisation, calculated using the straight-line
method for a period corresponding to the useful life, and any impairment. Useful life is reviewed
annually. Specifically:
Licences – Licenses deriving from business combinations are recognised at fair value at the date of the
combination, according to the acquisition method. After initial recognition, licences are valued at cost
less amortisation and any cumulative impairment. Amortisation is calculated based on the difference
between the cost and the residual value at the end of their useful life, on a straight line basis over their
useful life (defined as 40 years).
Please see note 8 "Intangible assets" for a description of the criteria used to define useful life and
residual value at the end of useful life.
Software – The costs of software licences, including ancillary costs, are capitalised and recognised in the
financial statements net of amortisation and any cumulative impairment. The amortisation rate used is
20%.
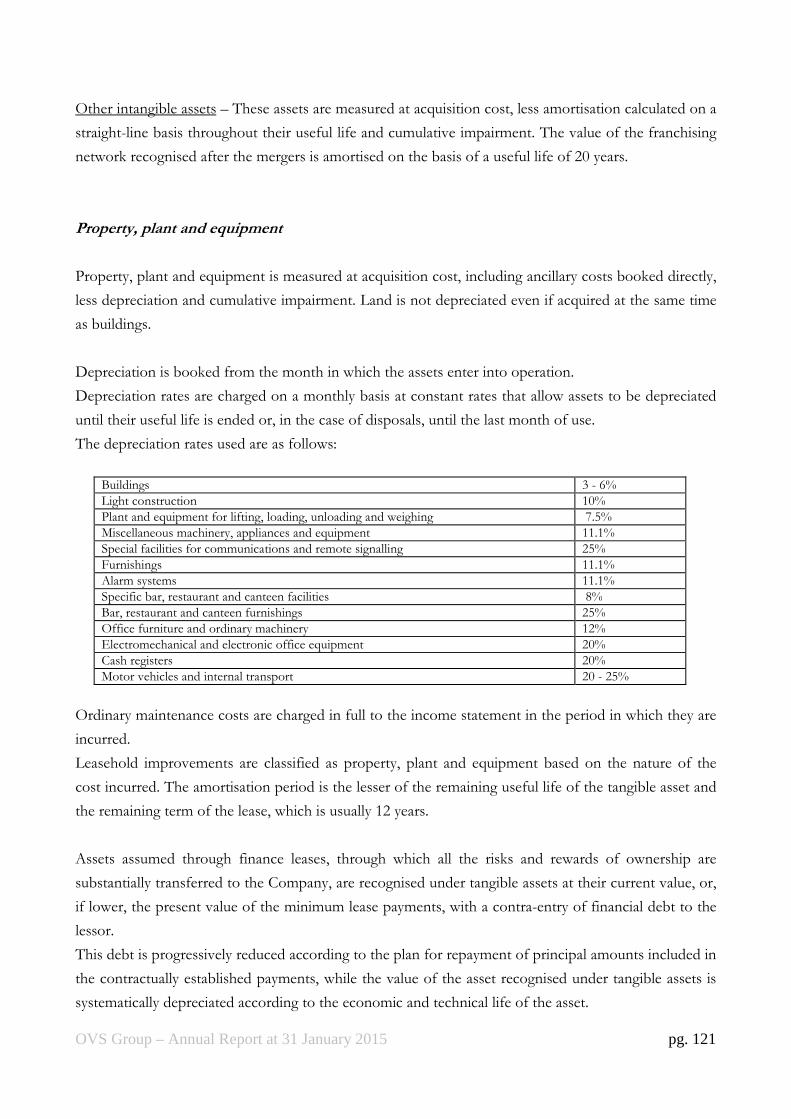
OVS Group – Annual Report at 31 January 2015 pg. 121
Other intangible assets – These assets are measured at acquisition cost, less amortisation calculated on a
straight-line basis throughout their useful life and cumulative impairment. The value of the franchising
network recognised after the mergers is amortised on the basis of a useful life of 20 years.
Property, plant and equipment
Property, plant and equipment is measured at acquisition cost, including ancillary costs booked directly,
less depreciation and cumulative impairment. Land is not depreciated even if acquired at the same time
as buildings.
Depreciation is booked from the month in which the assets enter into operation.
Depreciation rates are charged on a monthly basis at constant rates that allow assets to be depreciated
until their useful life is ended or, in the case of disposals, until the last month of use.
The depreciation rates used are as follows:
Buildings 3 - 6%
Light construction 10%
Plant and equipment for lifting, loading, unloading and weighing 7.5%
Miscellaneous machinery, appliances and equipment 11.1%
Special facilities for communications and remote signalling 25%
Furnishings 11.1%
Alarm systems 11.1%
Specific bar, restaurant and canteen facilities 8%
Bar, restaurant and canteen furnishings 25%
Office furniture and ordinary machinery 12%
Electromechanical and electronic office equipment 20%
Cash registers 20%
Motor vehicles and internal transport 20 - 25%
Ordinary maintenance costs are charged in full to the income statement in the period in which they are
incurred.
Leasehold improvements are classified as property, plant and equipment based on the nature of the
cost incurred. The amortisation period is the lesser of the remaining useful life of the tangible asset and
the remaining term of the lease, which is usually 12 years.
Assets assumed through finance leases, through which all the risks and rewards of ownership are
substantially transferred to the Company, are recognised under tangible assets at their current value, or,
if lower, the present value of the minimum lease payments, with a contra-entry of financial debt to the
lessor.
This debt is progressively reduced according to the plan for repayment of principal amounts included in
the contractually established payments, while the value of the asset recognised under tangible assets is
systematically depreciated according to the economic and technical life of the asset.

OVS Group – Annual Report at 31 January 2015 pg. 122
Impairment of tangible and intangible assets
IAS 36 stipulates that impairment of tangible and intangible assets must be measured if there are
indicators suggesting that such a problem might exist.
Impairment testing takes place at least once a year in the case of goodwill, other intangible assets with
an indefinite useful life and assets not available for use.
The recoverability of the amounts recognised is assessed by comparing the carrying amount with the
higher of fair value (current realisable value) less the costs of disposal and the value in use of the asset.
Value in use is defined by discounting the expected cash flows generated by the asset.
To determine value in use, expected future cash flows are discounted using a rate that reflects current
market valuations of the time value of money, compared with the investment period and the specific
risks associated with the activity.
For the purposes of assessing impairment, assets are analysed starting from the lowest level for which
there are separately identifiable independent cash flows (cash generating units). Within the Group, the
individual OVS and Upim stores have been identified as cash generating units.
If the recoverable amount of an asset is lower than the carrying amount, the carrying amount is reduced
to the recoverable amount. This reduction constitutes impairment and is charged to the income
statement.
If there is an indicator of reversal of the impairment loss, the recoverable amount of the asset is
recalculated and the carrying amount is increased to this new amount. The increase in the carrying
amount may not, however, exceed the net carrying amount that the asset would have had if the
impairment had not arisen.
Goodwill impairment cannot be reversed.
Other equity investments
Other equity investments (i.e., other than in subsidiaries, associates and companies under common
control) are included among non-current assets, or among current assets if they will remain among the
assets of the Company, for a period of, respectively, more than one year and no longer than one year.
Other equity investments constituting financial assets available for sale are measured at fair value, if this
can be determined, and any gains or losses deriving from changes in the fair value are entered directly
under other comprehensive gains/(losses), until they are transferred or undergo impairment, at which
time the other comprehensive gains/(losses) previously recognised in equity are recognised in the
income statement for the period.
Other equity investments for which fair value is not available are recognised at cost, written down for
any impairment.
OVS Group – Annual Report at 31 January 2015 pg. 123
Financial assets
Financial assets are recognised under current and non-current assets based on maturity and
expectations of when they will be converted into monetary assets. Financial assets include equity
investments in other companies (other than subsidiaries, associates and companies under common
control), derivatives, receivables, and cash and cash equivalents.
a) Classification
For the purposes of measurement, the Company subdivides financial assets into the following
categories: financial assets at fair value with changes recognised directly in the income statement, loans
and receivables, financial assets held to maturity and financial assets available for sale. Classification
depends on the purpose for which the financial asset was acquired. Financial assets are classified at the
time of initial recognition.
i. Financial assets measured at fair value with changes recognised directly in the income statement
This category includes both financial assets held for trading and derivatives that do not meet the criteria
for hedge accounting.
ii. Loans and receivables
Loans and receivables comprise non-derivative financial assets with fixed or determinable maturities.
They are recognised under current assets, except for the portion falling due beyond the 12-month
period after the reporting date, which are classified as non-current assets.
iii. Financial assets held to maturity
Financial assets held to maturity comprise non-derivative assets with fixed or determinable payments
that the Company intends to hold to maturity. Classification to current or non-current assets depends
on whether they are expected to be realised within or beyond the 12-month period after the reporting
date.
iv. Financial assets available for sale
Financial assets available for sale represent a residual category comprising designated non-derivative
financial instruments or those not attributable to any of the above categories of financial instruments.
These assets are included among non-current assets, unless there is an intention to dispose of them
within the 12-month period after the reporting date.

OVS Group – Annual Report at 31 January 2015 pg. 124
b) Recognition and measurement
Financial assets, regardless of how they are classified, are initially recognised at fair value, with possible
additions for ancillary acquisition costs.
After initial recognition, financial assets at fair value with changes recognised directly in the income
statement and financial assets available for sale are recognised at fair value. In the first case, changes in
fair value are posted to the income statement in the period in which they take place; in the second, they
are posted to the statement of comprehensive income.
Loans and receivables and financial assets held to maturity are recognised using the amortised cost
criterion and the effective interest rate method after initial recognition. Any impairment is recorded in
the income statement to offset the value of the asset. The value of assets previously written down for
impairment is reversed if the circumstances that led to the write-down no longer exist.
Financial assets are eliminated from the financial statements when the rights to receive the cash flows
associated with the financial assets expire or have been transferred to third parties and the Company
has substantially transferred all the risks and benefits of ownership.
For the treatment of derivatives, please see the relevant section below.
Inventories
Inventories are recognised at the lower of acquisition cost and net realisable value.
The purchase cost is determined by configuring the weighted average cost for the reporting period. The
cost also includes ancillary costs directly attributable to the purchase of goods.
Goods relating to the collections are written down according to the presumed possibility of their future
realisation, by recognising a specific adjustment provision.
Cash and cash equivalents
Cash and cash equivalents includes available cash and credit balances of bank current accounts with no
limits or restrictions.
Cash in foreign currency is valued according to period-end exchange rates.
OVS Group – Annual Report at 31 January 2015 pg. 125
Provision for risks and charges
Provisions for risks and charges are allocated for current obligations, legal or constructive, arising from
a past event in respect of third parties for which the utilisation of resources, the amount of which can
be reliably estimated, is probable.
The amount recognised as a provision is the best estimate of the expenditure required to settle the
current obligation fully. Risks for which the emergence of a liability is only possible are disclosed in the
explanatory notes, and no provision is made.
Employee benefits
Post-employment benefits are defined under either "defined contribution" plans or "defined benefit"
plans.
Defined benefit plans, such as the provision for employee severance benefits accrued before the entry
into force of the 2007 Finance Law, are plans with guaranteed benefits for employees that are paid out
at the end of the employment relationship. The liability relating to defined benefit plans is determined
on the basis of actuarial assumptions and booked on an accruals basis in line with the service required
to obtain the benefits; the liability is measured annually by independent actuaries.
Employee severance benefits and pension provisions, which are determined using an actuarial method,
provide for the recognition in the income statement under employment cost of the rights accrued
during the year, while the figurative cost is included among net financial income (expenses). Actuarial
gains and losses that reflect the effects of changes in the actuarial assumptions used are instead fully
recognised in shareholders' equity in the year in which they arise.
From 1 January 2007, the 2007 Finance Law and the associated implementing decrees introduced
significant amendments to the rules on employee severance benefits, including options for employees,
to be exercised by 30 June 2007, with regard to the allocation of their accruing severance benefits.
Specifically, new flows of severance benefits may be directed by the employee to preselected or
company pension schemes (in the latter case, the company will pay severance benefit contributions into
a treasury account set up with the INPS [Italian social security and welfare institution]).
As a result of these amendments, the provision for employee severance benefits accrued since the date
of the employee option (defined benefit plan) has been recalculated by independent actuaries to exclude
the component relating to future pay increases.
The portion of the employee severance benefits that has accrued since the option date (30 June 2007) is
regarded as a defined benefit plan, and the accounting treatment is similar to that used for all other
contribution payments.
Employee benefits also include pension provisions and similar obligations. This provision mainly
includes liabilities and rights accrued by the employees of the former Standa, in relation to
OVS Group – Annual Report at 31 January 2015 pg. 126
supplementary pension schemes; the liability associated with such defined-benefit programs is
determined on the basis of actuarial assumptions and the amount recognised in the financial statements
represents the present value of the Company’s obligation.
Financial liabilities
Payables and other financial and/or trade liabilities are initially recognised at fair value, less any
transaction costs incurred in relation to obtaining financing. They are subsequently carried at amortised
cost; any difference between the amount received (less transaction costs) and the total repayment
amount is recognised in the income statement over the period of the loan, using the effective interest
rate method.
Borrowings are classified as current liabilities unless the Company has an unconditional right to defer
settlement of the liability for 12 months after the reporting date; in this case, only the portion falling
due within 12 months of the reporting date is classified as a current liability.
Derivatives
Derivatives are assets and liabilities recognised at fair value.
The Company uses derivatives to hedge exchange rate risk or interest rate risk.
Pursuant to IAS 39, derivatives may only be booked using hedge accounting methods when:
• at the beginning of the hedge there is formal designation and documentation of the hedging
relationship;
• it is assumed that the hedge is highly effective;
• effectiveness can be reliably measured;
• the hedge is highly effective throughout the financial reporting periods for which it is designated.
When derivatives meet the criteria for hedge accounting, the following accounting treatments apply:
• if the derivatives hedge the risk of changes in the fair value of the assets or liabilities being hedged
(fair value hedge, e.g., hedging of fluctuations in the fair value of fixed-rate assets/liabilities), the
derivatives are recognised at fair value with changes recognised directly in the income statement;
correspondingly, the assets or liabilities being hedged are adjusted to reflect changes in fair value
associated with the hedged risk;
• if the derivatives hedge the risk of changes in the cash flows of the assets or liabilities being hedged
(cash flow hedge, e.g., hedging of changes in the cash flows of assets/liabilities due to variations in
interest rates), changes in the fair value of the derivatives are initially recognised in equity and
OVS Group – Annual Report at 31 January 2015 pg. 127
subsequently to profit or loss in line with the economic effects of the hedged transaction.
If hedge accounting cannot be applied, gains or losses arising from the measurement of the derivative
at fair value are immediately recognised in the income statement.
Revenues and costs
Revenues are recognised in so far as it is likely that the economic benefits associated with the sale of
goods or the provision of services will flow to the Company and the relative amount can be reliably
measured. Revenues are recognised at the fair value of the consideration received or receivable, taking
into account the amount of any trade discounts, reductions and rebates granted.
Revenues from sales and services are recognised respectively at the time of the actual transfer of the
risks and benefits typically associated with ownership or on completion of the service.
Costs are recognised when they relate to goods and services sold or used during the year, while in the
case of multi-year use the costs are systematically spread.
Income and costs deriving from leases
Income and costs deriving from operating leases are recognised on a straight-line basis over the
duration of the leases to which they relate. Potential rental payments are recognised as income in the
years in which they are obtained.
Income tax
Current income tax for the year is calculated by applying the current tax rates on reasonably estimated
taxable income, determined in accordance with the tax regulations in force. The expected payable, net
of payments on account and withholding taxes, is recognised in the statement of financial position
under "Current tax liabilities", or under "Current tax assets" if the payments on account made and the
withholdings exceed the expected payable.
Deferred tax assets and deferred tax liabilities are determined on the basis of taxable temporary
differences between the carrying amount of assets and liabilities and their value for tax purposes, except
for goodwill, which is not tax deductible, and are classified under non-current assets and liabilities.
Income tax is recognised in the income statement, except in relation to items directly credited to or
debited from equity, in which case the tax effect is recognised directly in equity.

OVS Group – Annual Report at 31 January 2015 pg. 128
Deferred tax assets, including those relating to previous tax losses, are recognised to the extent that it is
probable that future taxable income will be available in respect of which they can be recovered.
The value of deferred tax assets is reviewed at each reporting date and reduced to the extent that it is
no longer probable that sufficient taxable income will be available in the future to use all or part of this
receivable.
Deferred tax assets and deferred tax liabilities are measured at the tax rates that are expected to apply to
the period when the asset is realised or the liability is settled, based on the tax rates in force and tax
rates that have been enacted or substantively enacted at the reporting date.
OVS S.p.A., Gruppo Coin S.p.A. and C.O.S.I. S.p.A. have joined the tax consolidation scheme.
Relations arising from participating in the tax consolidation scheme are regulated by specific contractual
agreements approved and signed by the member parties.
Exchange rate gains and losses
Foreign exchange transactions are recognised at the current exchange rate at the date of completion of
the transaction. Monetary assets and liabilities denominated in foreign currencies are translated into
euros at the current exchange rate at the reporting date and recognised in the income statement under
financial income and expenses.
Dividends
Dividends are recognised at the date of approval by the general meeting.
Use of estimates
The preparation of the separate financial statements in accordance with the IFRSs requires
management to make estimates and assumptions that affect the reported amounts of assets and
liabilities and the disclosure of contingent assets and liabilities at the reporting date. The final results
may differ from these estimates. Estimates are used to recognise provisions for doubtful accounts,
inventory obsolescence, depreciation and amortisation, impairment of assets, employee benefits,
restructuring provisions, deferred tax assets, other provisions for risk and valuations of derivatives.
Estimates and assumptions are reviewed periodically and the effects of any changes are immediately
OVS Group – Annual Report at 31 January 2015 pg. 129
reflected in the income statement.
Impairment of tangible and intangible assets
Goodwill and the brands are tested annually, and whenever events or circumstances indicate the
possibility of impairment, for recoverability pursuant to IAS 36 - Impairment of Assets. If the
recoverable amount is less than the carrying amount, the asset is written down to its recoverable
amount (defined as the greater of its value in use and its fair value). Verification of the amount requires
subjective judgements to be made, based on information available within the Company and from the
market, as well as past experience. In addition, if potential impairment is identified, it is determined
using evaluation techniques regarded as appropriate. The same verifications of value and the same
evaluation techniques are applied to intangible and tangible assets with a definite useful life when there
are indicators suggesting that recovery of the relative net carrying amount through use might be
difficult. The correct identification of indicators of potential impairment and estimates to determine
this depend on factors that may vary over time, with an effect on the valuations and estimates made by
the Company.
Depreciation and amortisation
Depreciation and amortisation reflect the best estimate of the expected useful life of assets with a finite
life.
This estimate is based on the possibility of using these assets and their capacity to contribute to the
Company's results in future years.
Inventory obsolescence
The Company develops and sells items of clothing that change according to customer taste and trends
in the world fashion. The provision for inventory write-downs therefore reflects estimated expected
impairment of the collections in stock, taking account of the Company's capacity to sell items of
clothing through a range of distribution channels.
Provisions for doubtful accounts
The provision for doubtful accounts reflects the best estimate of losses relating to the portfolio of trade
receivables. This estimate is based on the losses expected by the Company, determined on the basis of
past experience with similar receivables, current and previous receivables falling due, the careful
monitoring of credit quality and projections of economic and market conditions.
Deferred tax assets
Deferred tax assets are booked based on expectations of taxable income in future years for the purpose
of recovering them. The evaluation of expected taxable income for the accounting of deferred tax
assets depends on factors that may vary over time and have significant effects on the recoverability of
the deferred tax assets.
OVS Group – Annual Report at 31 January 2015 pg. 130
Provisions for risks and charges
Provisions representing the risk of a negative outcome are recognised for legal and tax risks. The
amount of provisions recorded in the financial statements in relation to these risks represents the best
estimate to deal with potential risks. This estimate entails the use of assumptions that depend on factors
that might change over time and that might therefore have significant effects compared with the
current estimates used to prepare the financial statements.
Valuation of derivatives
The determination of the fair value of unlisted financial assets, such as derivatives, takes place using
commonly used valuation techniques that require basic assumptions and estimates. These assumptions
may not occur within the timeframes and in the manner envisaged. Estimates of derivatives may
therefore differ from the final figures.

OVS Group – Annual Report at 31 January 2015 pg. 131
ACCOUNTING STANDARDS, AMENDMENTS AND INTERPRETATIONS WITH
EFFECT FROM 1 JANUARY 2014
The new and/or revised standards of the International Accounting Standards Board (IASB) and the
interpretations of the International Financial Reporting Interpretations Committee (IFRIC), the
application of which is mandatory as of financial year 2014, are set out below.
Description Approved at the date of Effective date stipulated by the standard
this document
IFRS 10 - Consolidated financial statements December 2012 Years beginning on or after 1 January 2014
IFRS 11 - Joint Arrangements December 2012 Years beginning on or after 1 January 2014
IFRS 12 - Disclosure of Interests in Other Entities December 2012 Years beginning on or after 1 January 2014
Amendments to IFRS 10, 11 and 12
on Transition Guidance April 2013 Years beginning on or after 1 January 2014
IAS 27 (revised 2011) - Separate Financial Statements December 2012 Years beginning on or after 1 January 2014
IAS 28 (revised 2011) - Associates and Joint Ventures December 2012 Years beginning on or after 1 January 2014
Amendment to IAS 32 - Financial instruments:
Presentation, on offsetting financial assets
and financial liabilities December 2012 Years beginning on or after 1 January 2014
Amendments to IFRS 10 - Consolidated Financial Statements, IFRS 12 and IAS 27
for investment entities November 2013 Years beginning on or after 1 January 2014
Amendments to IAS 36 - Impairment of Assets December 2013 Years beginning on or after 1 January 2014
Amendment to IAS 39 - Financial instruments: Recognition and Measurement, on the novation of derivatives and hedge accounting December 2013 Years beginning on or after 1 January 2014
IFRS 21 - Levies June 2014 Years beginning on or after 1 January 2014
The adoption of accounting standards, amendments and interpretations shown in the above table had
no significant effects on the Company's financial position or results.

OVS Group – Annual Report at 31 January 2015 pg. 132
ACCOUNTING STANDARDS, AMENDMENTS AND INTERPRETATIONS NOT YET
APPLICABLE AND NOT ADOPTED IN ADVANCE BY THE COMPANY
The international accounting standards, interpretations, amendments to existing accounting standards
and interpretations, or specific provisions contained in the standards and interpretations approved by
the IASB, indicating whether they are approved or not approved for adoption in Europe at the
approval date of this document, are set out below:
Description Approved at the date of Effective date stipulated by the standard
this document
Amendment to IAS 19 regarding defined benefit plans No Years starting on or after 1 July 2014
Annual Improvements cycles 2010-2012 and 2011-2013 No Years starting on or after 1 July 2014
Amendment to IAS 16 - Property, Plant and Equipment and IAS 38 - Intangible Assets No Years starting on or after 1 January 2016
Amendment to IFRS 11 - Joint Arrangements on the acquisition of an interest in a joint operation No Years starting on or after 1 January 2016
IFRS 14 - Regulatory Deferral Accounts No Years starting on or after 1 January 2016
IFRS 9 - Financial Instruments: Classification and Measurement No Years starting on or after 1 January 2018
IFRS 15 - Revenue from Contracts with Customers No Years starting on or after 1 January 2017
Amendment to IAS 27
Separate Financial Statements on the equity method No Years starting on or after 1 January 2016
Amendments to IFRS 10 - Consolidated Financial Statements and IAS 28 Investments in Associates and Joint Ventures No Years beginning on or after 1 January 2016
Amendment to IAS 16 - Property, Plant and Equipment and IAS 41 - Agriculture regarding bearer plants No Years starting on or after 1 January 2016
Annual Improvements 2014 No Years starting on or after 1 January 2016
Note that no accounting standards and/or interpretations for which application is mandatory for
periods beginning on or after 31 January 2015 have been applied.
OVS S.p.A. is assessing the effects of applying the above standards; they are currently not regarded as
likely to have an impact.

OVS Group – Annual Report at 31 January 2015 pg. 133
FINANCIAL RISKS
The key risks identified, monitored and, as described below, actively managed by OVS are as follows:
• market risk (exchange rate and interest rate risk);
• credit risk (both in relation to normal business relations with customers and to financial
activities); and
• liquidity risk (involving recoverability of financial resources and access to credit and financial
instruments in general).
OVS aims to achieve balanced management of its financial exposure over time, geared to keeping a
healthy balance of liabilities and assets in order to ensure the kind of flexibility it needs by using
liquidity generated by current assets and relying on bank loans.
Management of financial risks is guided and monitored in a centralized manner. More specifically, the
central financial office is responsible for analyzing and approving expected financial needs, and it
monitors progress and, when necessary, implements appropriate corrective action.
The financial instruments that OVS uses most frequently are the following:
• medium-/long-term financing to cover investments in fixed assets;
• short-term financing, use of lines of credit to finance working capital.
OVS has also employed financial instruments to cover fluctuating interest rate risks, which influenced
expenses related to medium-/long-term financial borrowings and consequently the OVS income
statement, as well as derivatives geared to reducing exchange rate risks related to the US dollar.
The following section provides qualitative and quantitative information on the impact on OVS of
these risks.
Credit risk
Credit risk represents OVS’s exposure to the risk of potential losses arising from default by a
counterparty.
For the period in question, there were no significant concentrations of credit risk, as this risk is
mitigated by the fact that credit exposure is spread over a large number of customers largely located in
Italy.
To reduce the credit risk generally, OVS obtains guarantees in the form of sureties in respect of loans
granted for the supply of goods; at 31 January 2015, the total amount of guarantees was 27.4 million
euros, including 12.9 million euros on overdue loans.

OVS Group – Annual Report at 31 January 2015 pg. 134
Financial assets for trade receivables are recognised net of write-downs calculated on the basis of the
risk of counterparty default, determined by using available information on the solvency of the customer
and taking historical data into account. Positions that are particularly significant, and that are objectively
partially or totally irrecoverable, are written down individually. At 31 January 2015, trade receivables
total 76.3 million euros.
Receivables subject to write-downs total 9.0 million euros at 31 January 2015. Overdue receivables that
are not subject to write-downs, as they do not seem at critical risk of not being recovered, total 28.4
million euros.
The following table breaks down trade receivables at 31 January 2015 by due date, net of write-downs:
(million euros) At 31
January 2015
Not still
overdue
Overdue
within 90 days
Overdue
between 90 to 180
days
Overdue
beyond 180
days
Trade receivables 85.3 47.9 23.0 1.9 12.5
Write-downs (9.0) - - - (9.0)
Net value 76.3 47.9 23.0 1.9 3.5
Liquidity risk
Liquidity risk is the risk that financial resources needed for OVS to remain in operation may be
difficult to recover. The two main factors that determine the liquidity situation of OVS are as follows:
• the resources generated or absorbed by operations and investment;
• the characteristics of expiry and renewal of debt.
OVS’s liquidity needs are monitored by the finance office with an eye to guaranteeing efficient access
to resources and appropriate investment/yield of liquidity.
Management believes that the funds and credit lines currently available, in addition to those generated
by operations, will enable OVS to meet its requirements in respect of investment activities,
management of working capital and the repayment of debt when it becomes due.
The table below breaks down financial liabilities (including trade payables and other payables). More

OVS Group – Annual Report at 31 January 2015 pg. 135
specifically, all flows indicated are non-discounted future nominal cash flows determined using
remaining contractual due dates, regarding both capital expenditures and interest. Financing was
calculated using the contractual payment due date.
(million euros) At 31 January
2015
< 1 year 1 to 5
years
> 5 years Total
Trade payables 390.9 385.3 5.6 - 390.9
Bank debt (*) 758.6 758.6 - - 758.6
Other financial payables 6.8 3.2 3.6 - 6.8
Financial payables to Parent Company 22.3 22.3 - - 22.3
Financial charges to banks (**) 5.4 4.9 0.5 - 5.4
Total 1,184.0 1,174.3 9.7 - 1,184.0
(*) The amount includes the value of deferred interest expenses up to 31 January 2015 not still paid. (**) This value has been calculated analyzing accrued real interest paid since 1 February 2015 to the loan depreciation plan. Furthermore, the aggregate includes the nominal interest value for leasing up to expiry date and the value resulting from future cash flows from derivative contracts that, at the Balance sheet date, had a negative fair value.
Derivatives
A breakdown of OVS derivatives is shown in the table below:
(million euros)
2014
Assets Liabilities
Interest rate swaps – coverage cash flows 0.0 (1.3)
Forward contracts – coverage cash flows 26.4 0.0
Forward contracts – trading 11.1 0.0
Total 37.5 (1.3)
Current values:
Interest rate swaps – coverage cash flows 0.0 (1.3)
Forward contracts – coverage cash flows 26.4 0.0
Forward contracts – trading 10.0 0.0
Total current values 36.4 (1.3)
Non-current values:
Forward contracts – trading 1.1 0.0
Total non-current values 1.1 0.0
OVS Group – Annual Report at 31 January 2015 pg. 136
Market risk
Interest rate risk
OVS uses external financial resources in the form of lending and uses cash from bank accounts.
Changes in market interest rates influence the cost and yield of various forms of financing, with a
consequent effect on the level of financial expenses and proceeds seen by OVS.
To manage these risks, OVS uses interest rate derivatives (interest rate swaps, or IRS) with the aim of
mitigating, under economically acceptable conditions, the potential impact of changes in interest rates
on the income statement.
The derivatives (IRS) in place at 31 January 2015 consist of 1 contract signed in 2011 with a primary
bank that is scheduled to come due in July 2015 to cover fluctuating interest rates on existing loans. As
provided in said contracts, exchanged interest rates are at a fixed average rate of 2.485%.
The major elements of that contract are broken down below:
(thousand euros)
Nominal value Fair value at
Derivatives contracts Date of signing Termination date 31 Jan 2015 31 Jan 2015
Interest rate swap (IRS) 22 July 2011 31 July 2015 105,772 (1,256)
Sensitivity Analysis
OVS exposure to interest rate risk was subject to a sensitivity analysis that shows the impact on the
income statement and balance sheet of a hypothetical shift in market rates of +40 or -40 basis points
compared to the assumed forward rate curve to 31 January 2015. This analysis is based on the
assumption of a generalised and instantaneous change in benchmark interest rates.
Excluding the impact of derivatives on interest rates and the amortised cost of loans, the results of
such a hypothetical, instantaneous and unfavourable (favourable) change in the short-term interest
rates applicable to OVS’s variable-rate financial liabilities are illustrated in the table below:
Change on financial charges effect – P&L effect
(millions of euros) - 40 bps + 40 bps
At 31 January 2015 1.6 (1.6)
OVS Group – Annual Report at 31 January 2015 pg. 137
There are no effects booked on net equity, connected to the only existing IRS.
Exchange rate risk
OVS is exposed to risk resulting from changes in exchange rates, which can affect its business
conducted in currencies other than the euro. Earnings and expenses in other currencies may be
influenced by exchange rate fluctuation, which has impact on margins (economic risk), just as trade
receivables and payables in other currencies may be impacted by the exchange rates employed with
consequent economic impact (transaction risk). Finally, exchange rate fluctuations are also reflected in
the consolidated statements and shareholders’ equity when the figures for subsidiaries are provided in
currencies other than the euro and then converted (translation risk).
The only exchange rate to which OVS is significantly exposed is the EUR/USD, in relation to
purchases in dollars made in the Far East and on other markets in which the dollar is the trading
currency.
Exchange rate fluctuations may result in the realisation or reporting of positive or negative exchange
rate differences. OVS also hedges orders that are highly probable although not purchased, pursuing
the management aim of minimising risk for OVS.
Forward contracts are mainly used to insure against the risk of appreciation in the foreign currency
(US dollar). The following table summarises key information regarding foreign exchange derivatives:
thousand euros operation date maturity notional strike notional fair in USD price in Eur value At 31 Jan 2015 12 May 2014 2 Feb 2015 1.1691 to 16 Jan 2015 to 14 Nov 2016 443,000 to 1.3763 391,860 37.5
During the year in question, the nature and structure of exchange risk exposure and the policies
employed by OVS to hedge against it did not undergo significant changes.
Sensitivity analysis
Sensitivity analysis of exchange rates was based on statement of financial position items (financial
assets and liabilities) rendered in currencies other than the main currency of OVS.
The effects of a 5% fluctuation in either direction of the US dollar-euro exchange rate are provided
below:
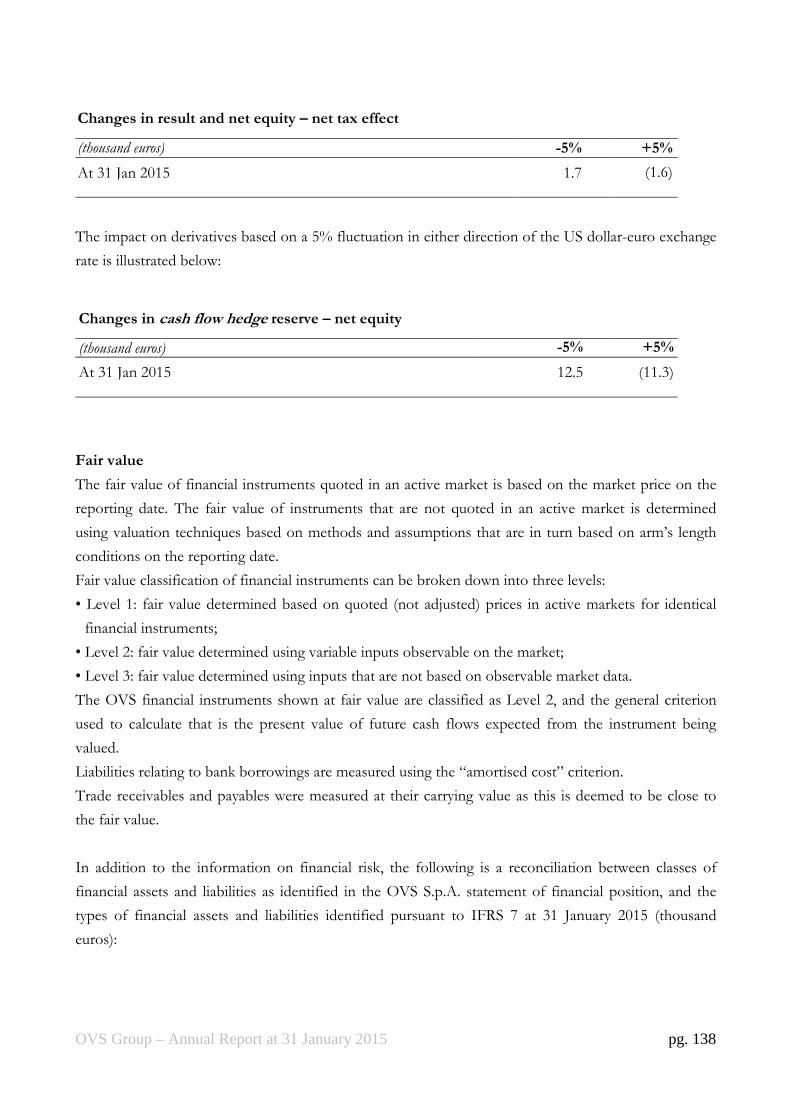
OVS Group – Annual Report at 31 January 2015 pg. 138
Changes in result and net equity – net tax effect
(thousand euros) -5% +5%
At 31 Jan 2015 1.7 (1.6)
The impact on derivatives based on a 5% fluctuation in either direction of the US dollar-euro exchange
rate is illustrated below:
Changes in cash flow hedge reserve – net equity
(thousand euros) -5% +5%
At 31 Jan 2015 12.5 (11.3)
Fair value
The fair value of financial instruments quoted in an active market is based on the market price on the
reporting date. The fair value of instruments that are not quoted in an active market is determined
using valuation techniques based on methods and assumptions that are in turn based on arm’s length
conditions on the reporting date.
Fair value classification of financial instruments can be broken down into three levels:
• Level 1: fair value determined based on quoted (not adjusted) prices in active markets for identical
financial instruments;
• Level 2: fair value determined using variable inputs observable on the market;
• Level 3: fair value determined using inputs that are not based on observable market data.
The OVS financial instruments shown at fair value are classified as Level 2, and the general criterion
used to calculate that is the present value of future cash flows expected from the instrument being
valued.
Liabilities relating to bank borrowings are measured using the “amortised cost” criterion.
Trade receivables and payables were measured at their carrying value as this is deemed to be close to
the fair value.
In addition to the information on financial risk, the following is a reconciliation between classes of
financial assets and liabilities as identified in the OVS S.p.A. statement of financial position, and the
types of financial assets and liabilities identified pursuant to IFRS 7 at 31 January 2015 (thousand
euros):
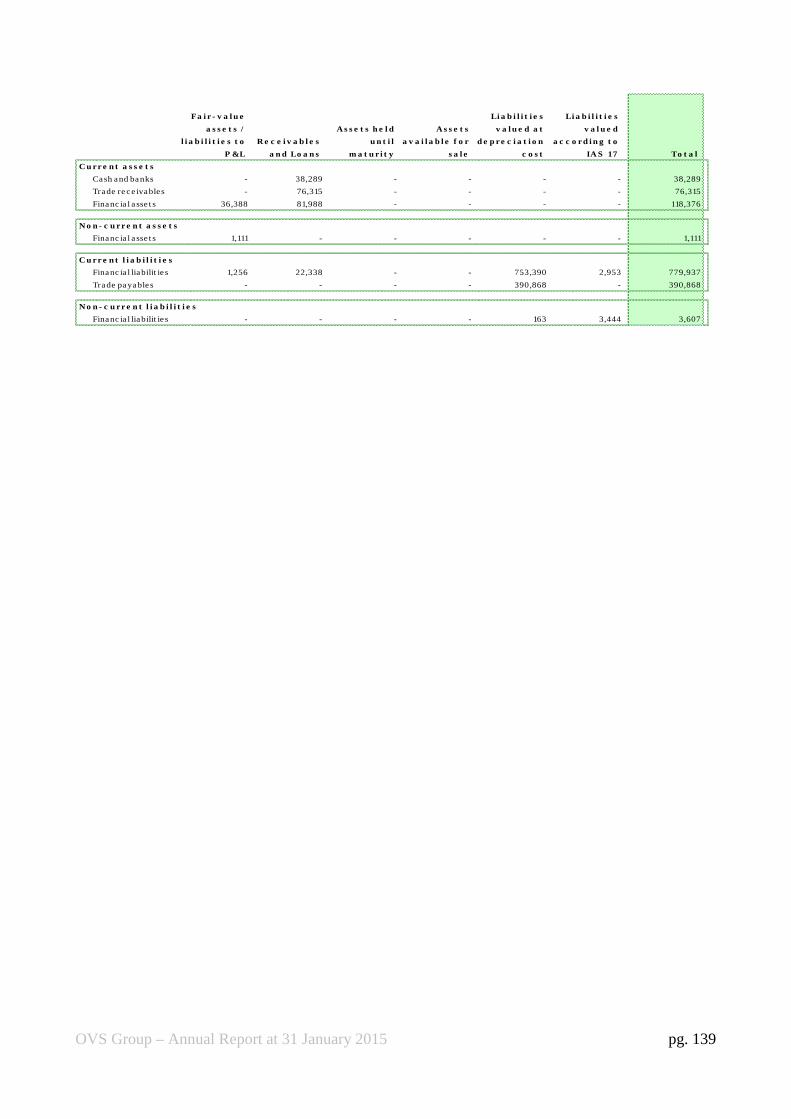
OVS Group – Annual Report at 31 January 2015 pg. 139
C u rr e n t a s s e t s
Cash and banks - 38,289 - - - - 38,289
Trade re ce ivables - 76,315 - - - - 76,315
Financ ia l asse t s 36,388 81,988 - - - - 118,376
N o n - c u rr e n t a s s e t s
Financ ia l asse t s 1,111 - - - - - 1,111
C u rr e n t l i a b i l i t i e s
Financ ia l liabilit ies 1,256 22,338 - - 753,390 2,953 779,937
Trade payables - - - - 390,868 - 390,868
N o n - c u rr e n t l i a b i l i t i e s
Financ ia l liabilit ies - - - - 163 3,444 3,607
Li a b i l i t i e s
v a l u e d a t
d e p re c i a t i o n
c o s t
Li a b i l i t i e s
v a l u e d
a c c o rd i n g t o
IA S 17 To t a l
Fa i r - v a l u e
a s s e t s /
l i a b i l i t i e s t o
P &L
R e c e i v a b l e s
a n d Lo a n s
A s s e t s h e l d
u n t i l
m a t u r i t y
A s s e t s
a v a i l a b l e f o r
s a l e
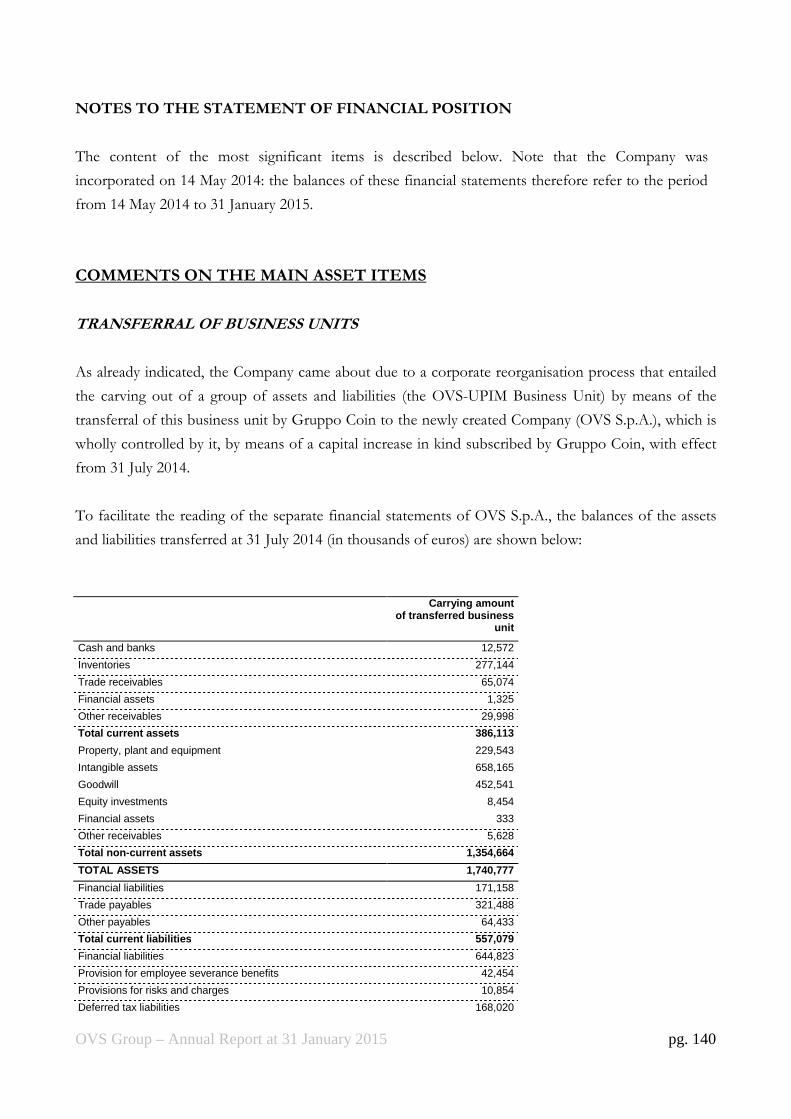
OVS Group – Annual Report at 31 January 2015 pg. 140
NOTES TO THE STATEMENT OF FINANCIAL POSITION
The content of the most significant items is described below. Note that the Company was
incorporated on 14 May 2014: the balances of these financial statements therefore refer to the period
from 14 May 2014 to 31 January 2015.
COMMENTS ON THE MAIN ASSET ITEMS
TRANSFERRAL OF BUSINESS UNITS
As already indicated, the Company came about due to a corporate reorganisation process that entailed
the carving out of a group of assets and liabilities (the OVS-UPIM Business Unit) by means of the
transferral of this business unit by Gruppo Coin to the newly created Company (OVS S.p.A.), which is
wholly controlled by it, by means of a capital increase in kind subscribed by Gruppo Coin, with effect
from 31 July 2014.
To facilitate the reading of the separate financial statements of OVS S.p.A., the balances of the assets
and liabilities transferred at 31 July 2014 (in thousands of euros) are shown below:
Carrying amount
of transferred business unit
Cash and banks 12,572
Inventories 277,144
Trade receivables 65,074
Financial assets 1,325
Other receivables 29,998
Total current assets 386,113
Property, plant and equipment 229,543
Intangible assets 658,165
Goodwill 452,541
Equity investments 8,454
Financial assets 333
Other receivables 5,628
Total non -current assets 1,354,664
TOTAL ASSETS 1,740,777
Financial liabilities 171,158
Trade payables 321,488
Other payables 64,433
Total current liabilities 557,079
Financial liabilities 644,823
Provision for employee severance benefits 42,454
Provisions for risks and charges 10,854
Deferred tax liabilities 168,020

OVS Group – Annual Report at 31 January 2015 pg. 141
Other payables 7,446
Total non -current liabilities 873,597
TOTAL LIABILITIES 1,430,676
SHAREHOLDERS' EQUITY 389,875
TOTAL LIABILITIES AND SHAREHOLDERS' EQUITY 1,820,551
BALANCING RECEIVABLE FROM GRUPPO COIN 79,774
Due to differences in BS items subject to transferral between the reference date for the Transferral
situation (31 January 2015) and the effective Transferral date (31 July 2014), a balancing receivable of
79,774 thousand euros derived from the Transferral and was recognised under "Current financial
assets".
1 Cash and cash equivalents 38,288,592
The balance represents cash and cash equivalents at the reporting date and breaks down as follows (in
thousands of euros):
31.01.2015
1) Bank and postal deposits 32,290
2) Cheques 449
3) Cash on hand 5,550
38,289Total
Cash and cash equivalents consists of cash, bank and postal deposits, checks and cash on hand at the
head office and shops in the direct sales network.
It should also be noted that at 31 January 2015, ordinary current accounts in the amount of 3,650
thousand euros and foreign currency current accounts in the amount of USD16,815 thousand,
corresponding to 14,781 thousand euros, were set up as pledges to secure the Old Loan Agreement
(described in note 11).
2 Trade receivables 76,315,091
The breakdown of trade receivables at 31 January 2015 was as follows (in thousands of euros):
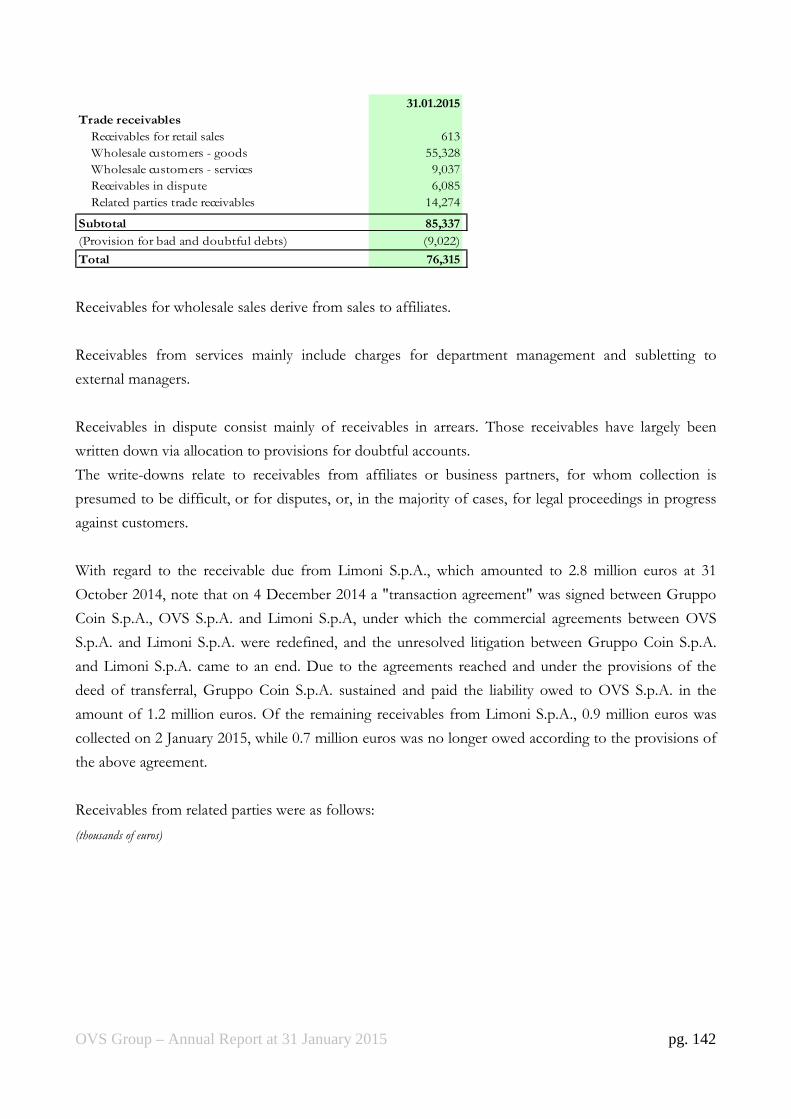
OVS Group – Annual Report at 31 January 2015 pg. 142
31.01.2015
Trade receivables
Receivables for retail sales 613
Wholesale customers - goods 55,328
Wholesale customers - services 9,037
Receivables in dispute 6,085
Related parties trade receivables 14,274
Subtotal 85,337
(Provision for bad and doubtful debts) (9,022)
Total 76,315
Receivables for wholesale sales derive from sales to affiliates.
Receivables from services mainly include charges for department management and subletting to
external managers.
Receivables in dispute consist mainly of receivables in arrears. Those receivables have largely been
written down via allocation to provisions for doubtful accounts.
The write-downs relate to receivables from affiliates or business partners, for whom collection is
presumed to be difficult, or for disputes, or, in the majority of cases, for legal proceedings in progress
against customers.
With regard to the receivable due from Limoni S.p.A., which amounted to 2.8 million euros at 31
October 2014, note that on 4 December 2014 a "transaction agreement" was signed between Gruppo
Coin S.p.A., OVS S.p.A. and Limoni S.p.A, under which the commercial agreements between OVS
S.p.A. and Limoni S.p.A. were redefined, and the unresolved litigation between Gruppo Coin S.p.A.
and Limoni S.p.A. came to an end. Due to the agreements reached and under the provisions of the
deed of transferral, Gruppo Coin S.p.A. sustained and paid the liability owed to OVS S.p.A. in the
amount of 1.2 million euros. Of the remaining receivables from Limoni S.p.A., 0.9 million euros was
collected on 2 January 2015, while 0.7 million euros was no longer owed according to the provisions of
the above agreement.
Receivables from related parties were as follows:
(thousands of euros)
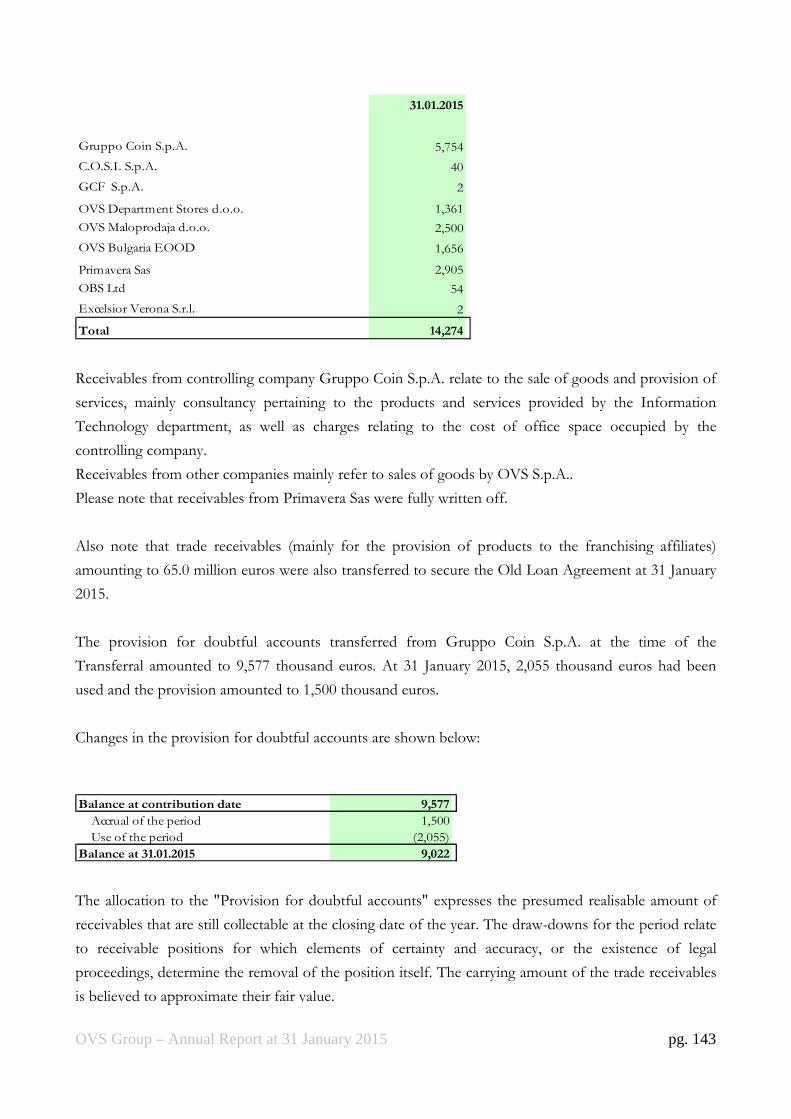
OVS Group – Annual Report at 31 January 2015 pg. 143
31.01.2015
Gruppo Coin S.p.A. 5,754
C.O.S.I. S.p.A. 40
GCF S.p.A. 2
OVS Department Stores d.o.o. 1,361
OVS Maloprodaja d.o.o. 2,500
OVS Bulgaria EOOD 1,656
Primavera Sas 2,905
OBS Ltd 54
Excelsior Verona S.r.l. 2
Total 14,274
Receivables from controlling company Gruppo Coin S.p.A. relate to the sale of goods and provision of
services, mainly consultancy pertaining to the products and services provided by the Information
Technology department, as well as charges relating to the cost of office space occupied by the
controlling company.
Receivables from other companies mainly refer to sales of goods by OVS S.p.A..
Please note that receivables from Primavera Sas were fully written off.
Also note that trade receivables (mainly for the provision of products to the franchising affiliates)
amounting to 65.0 million euros were also transferred to secure the Old Loan Agreement at 31 January
2015.
The provision for doubtful accounts transferred from Gruppo Coin S.p.A. at the time of the
Transferral amounted to 9,577 thousand euros. At 31 January 2015, 2,055 thousand euros had been
used and the provision amounted to 1,500 thousand euros.
Changes in the provision for doubtful accounts are shown below:
Balance at contribution date 9,577
Accrual of the period 1,500
Use of the period (2,055)
Balance at 31.01.2015 9,022
The allocation to the "Provision for doubtful accounts" expresses the presumed realisable amount of
receivables that are still collectable at the closing date of the year. The draw-downs for the period relate
to receivable positions for which elements of certainty and accuracy, or the existence of legal
proceedings, determine the removal of the position itself. The carrying amount of the trade receivables
is believed to approximate their fair value.
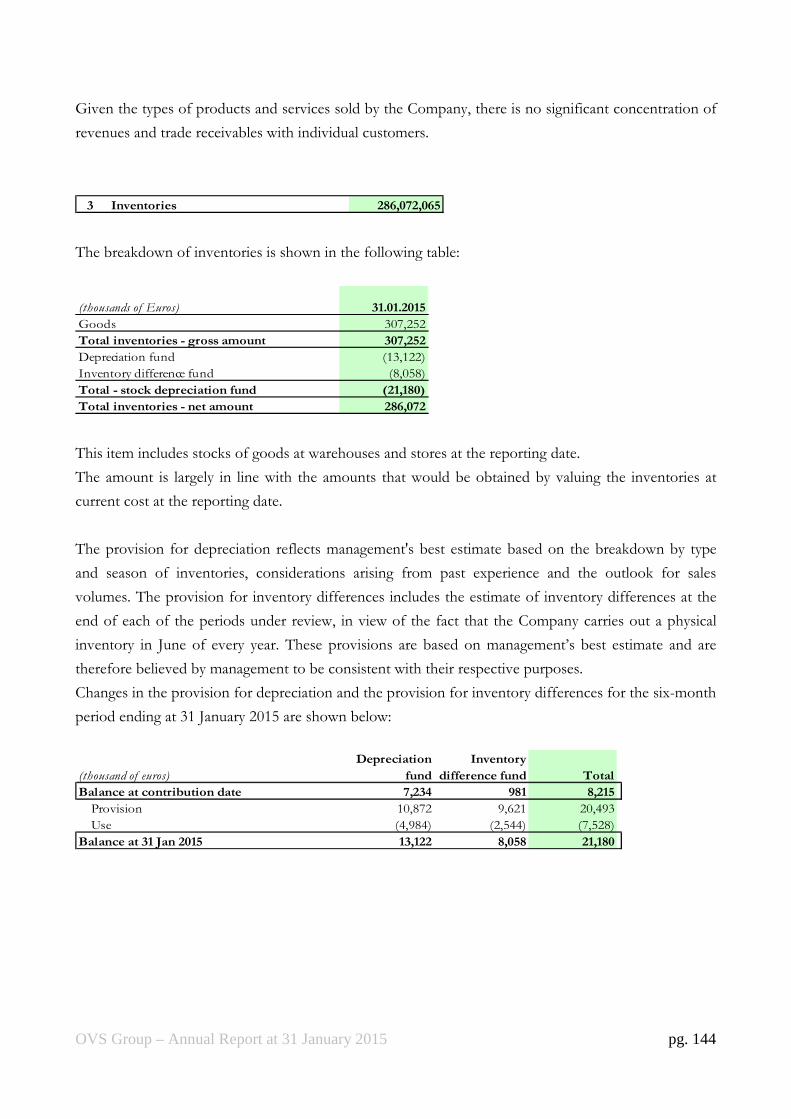
OVS Group – Annual Report at 31 January 2015 pg. 144
Given the types of products and services sold by the Company, there is no significant concentration of
revenues and trade receivables with individual customers.
3 Inventories 286,072,065
The breakdown of inventories is shown in the following table:
(thousands of Euros) 31.01.2015
Goods 307,252
Total inventories - gross amount 307,252
Depreciation fund (13,122)
Inventory difference fund (8,058)
Total - stock depreciation fund (21,180)
Total inventories - net amount 286,072
This item includes stocks of goods at warehouses and stores at the reporting date.
The amount is largely in line with the amounts that would be obtained by valuing the inventories at
current cost at the reporting date.
The provision for depreciation reflects management's best estimate based on the breakdown by type
and season of inventories, considerations arising from past experience and the outlook for sales
volumes. The provision for inventory differences includes the estimate of inventory differences at the
end of each of the periods under review, in view of the fact that the Company carries out a physical
inventory in June of every year. These provisions are based on management’s best estimate and are
therefore believed by management to be consistent with their respective purposes.
Changes in the provision for depreciation and the provision for inventory differences for the six-month
period ending at 31 January 2015 are shown below:
(thousand of euros)
Depreciation
fund
Inventory
difference fund Total
Balance at contribution date 7,234 981 8,215
Provision 10,872 9,621 20,493
Use (4,984) (2,544) (7,528)
Balance at 31 Jan 2015 13,122 8,058 21,180
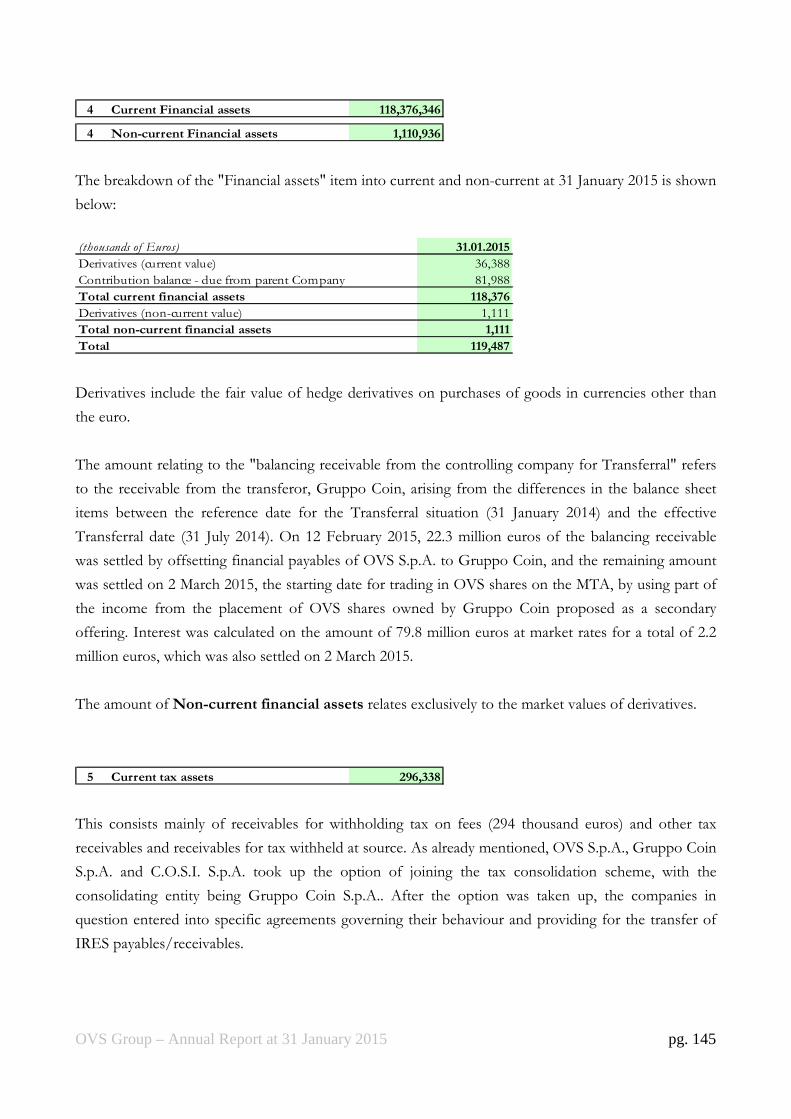
OVS Group – Annual Report at 31 January 2015 pg. 145
4 Current Financial assets 118,376,346 4 Non-current Financial assets 1,110,936
The breakdown of the "Financial assets" item into current and non-current at 31 January 2015 is shown
below:
(thousands of Euros) 31.01.2015
Derivatives (current value) 36,388
Contribution balance - due from parent Company 81,988
Total current financial assets 118,376
Derivatives (non-current value) 1,111
Total non-current financial assets 1,111
Total 119,487
Derivatives include the fair value of hedge derivatives on purchases of goods in currencies other than
the euro.
The amount relating to the "balancing receivable from the controlling company for Transferral" refers
to the receivable from the transferor, Gruppo Coin, arising from the differences in the balance sheet
items between the reference date for the Transferral situation (31 January 2014) and the effective
Transferral date (31 July 2014). On 12 February 2015, 22.3 million euros of the balancing receivable
was settled by offsetting financial payables of OVS S.p.A. to Gruppo Coin, and the remaining amount
was settled on 2 March 2015, the starting date for trading in OVS shares on the MTA, by using part of
the income from the placement of OVS shares owned by Gruppo Coin proposed as a secondary
offering. Interest was calculated on the amount of 79.8 million euros at market rates for a total of 2.2
million euros, which was also settled on 2 March 2015.
The amount of Non-current financial assets relates exclusively to the market values of derivatives.
5 Current tax assets 296,338
This consists mainly of receivables for withholding tax on fees (294 thousand euros) and other tax
receivables and receivables for tax withheld at source. As already mentioned, OVS S.p.A., Gruppo Coin
S.p.A. and C.O.S.I. S.p.A. took up the option of joining the tax consolidation scheme, with the
consolidating entity being Gruppo Coin S.p.A.. After the option was taken up, the companies in
question entered into specific agreements governing their behaviour and providing for the transfer of
IRES payables/receivables.

OVS Group – Annual Report at 31 January 2015 pg. 146
6 Other current receivables 35,519,151
6 Other non-current receivables 2,537,600
Other receivables break down as follows:
(thousands of euros)
31.01.2015
Other receivables 1,541
Insurance receivables 2,597
Other amounts due from employees 649
Accrued income - rents and condominium expenses 20,744
Prepayments - insurance 3,047
Interest on guarantee deposits 20
Prepayments - other 6,921
Total 35,519 Security deposits 2,499
Other receivables 19
Smaller equity investment 20
Total 2,538
The “Other receivables” item mainly relates to receivables from social security entities and advances to
suppliers and forwarding agents.
Receivables from insurance companies mainly consist of an expected disbursement for water damage to
the Genoa stores in 2014 (740 thousand euros), fire damage to the Pontenure warehouse in 2013 (1,129
thousand euros) and earthquake damage to stores in Emilia Romagna in 2012 (630 thousand euros).
The item Deferred income - other primarily includes the prepayments of insurance premiums and
advertising and marketing services for 3,827 thousand euros and the share of the deferred financial fees
(832 thousand euros) incurred to obtain medium-/long-term revolving lines of credit and to obtain
lines of credit described in more detail in the "Financial liabilities" section below. The item also includes
1,759 thousand euros in costs accrued at 31 January 2015 for the listing process. With regard to the
accounting treatment to be applied to these costs, pursuant to IAS 32, following the positive outcome
of the listing process, the ratio between the number of new shares/number of shares post-listing will
determine the percentage of expenses to be registered as a direct reduction in shareholders' equity,
while the remainder is recognised under costs – in respect of the above exposed criteria – in the income
statement and amount to 2.3 million euros for financial year 2014.
The same item includes accrued income (1,091 thousand euros) relating to revenues from partners for
royalties and fees and the recovery of expenses for subletter expenses at sales points; the residual
amount relates primarily to deferred income on utility costs and reimbursement of training costs.
Also note that insurance receivables amounting to 2.6 million euros were transferred to secure the Old
Loan Agreement at 31 January 2015.
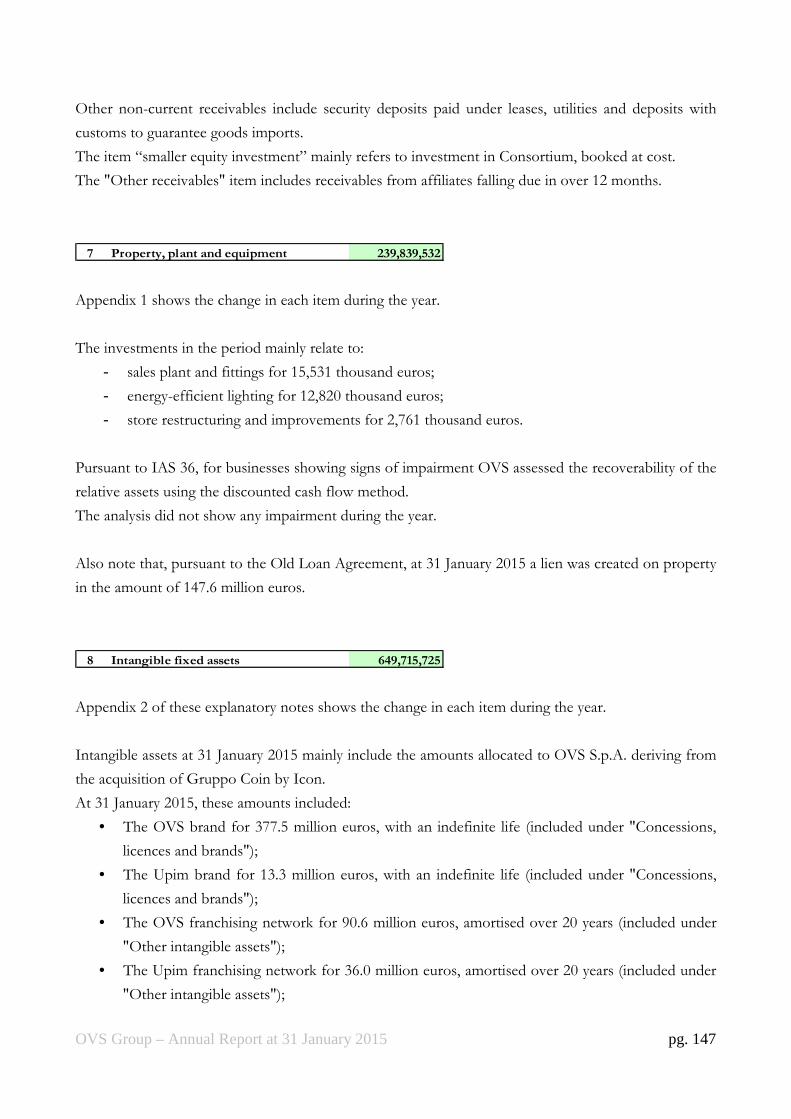
OVS Group – Annual Report at 31 January 2015 pg. 147
Other non-current receivables include security deposits paid under leases, utilities and deposits with
customs to guarantee goods imports.
The item “smaller equity investment” mainly refers to investment in Consortium, booked at cost.
The "Other receivables" item includes receivables from affiliates falling due in over 12 months.
7 Property, plant and equipment 239,839,532
Appendix 1 shows the change in each item during the year.
The investments in the period mainly relate to:
- sales plant and fittings for 15,531 thousand euros;
- energy-efficient lighting for 12,820 thousand euros;
- store restructuring and improvements for 2,761 thousand euros.
Pursuant to IAS 36, for businesses showing signs of impairment OVS assessed the recoverability of the
relative assets using the discounted cash flow method.
The analysis did not show any impairment during the year.
Also note that, pursuant to the Old Loan Agreement, at 31 January 2015 a lien was created on property
in the amount of 147.6 million euros.
8 Intangible fixed assets 649,715,725
Appendix 2 of these explanatory notes shows the change in each item during the year.
Intangible assets at 31 January 2015 mainly include the amounts allocated to OVS S.p.A. deriving from
the acquisition of Gruppo Coin by Icon.
At 31 January 2015, these amounts included:
• The OVS brand for 377.5 million euros, with an indefinite life (included under "Concessions,
licences and brands");
• The Upim brand for 13.3 million euros, with an indefinite life (included under "Concessions,
licences and brands");
• The OVS franchising network for 90.6 million euros, amortised over 20 years (included under
"Other intangible assets");
• The Upim franchising network for 36.0 million euros, amortised over 20 years (included under
"Other intangible assets");

OVS Group – Annual Report at 31 January 2015 pg. 148
• Administrative licences relating to OVS stores, 94.4 million euros, amortised over 40 years
(included under "Concessions, licences and brands");
• Administrative licences relating to Upim stores, 18.2 million euros, amortised over 40 years
(included under "Concessions, licences and brands");
• Administrative licences relating to ex-Bernardi stores, 4.4 million euros, amortised over 40 years
(included under "Concessions, licences and brands").
The brands attributed to the Company are regarded as having an indefinite useful life.
To establish this, a management analysis was performed on all relevant factors (legal, judicial,
contractual, competitive, economic and other) relating to the brands. The conclusion was reached that
there is no foreseeable time limit for the generation of cash inflows for OVS S.p.A..
The recoverability of the assets related to these brands was measured using the discounted cash flow
method, related to CGU in which these brands have been booked. Please see the following section,
"Impairment testing", for the outcome of the assessments carried out.
Note that the useful life of the licences is 40 years.
This was estimated on the basis of historical analyses carried out within the Company.
It should be noted, in this regard, that the time limit placed on the duration of the leases is insignificant.
In fact, there are protections provided to the tenant in market practice and under specific legal
provisions; in addition, a strategy of gradual further expansion of the network is being implemented by
OVS S.p.A., which usually renews leases before they expire naturally. All these factors have resulted
over time in the almost completely successful implementation of the renewal policy. Also note that we
have identified a component of residual value (non-amortised residual value at the end of the useful
life) calculated over 18 monthly rental payments, representing the amount payable by the lessor if the
lease is not renewed for a reason not attributable to OVS S.p.A..
The remainder of the item mainly consists of rights to industrial patents and intellectual property rights
relating to investments in software programs.
Also note that, pursuant to the Old Loan Agreement, at 31 January 2015 a pledge was created on OVS
S.p.A. brands in the amount of 390.8 million euros.
9 Goodwill 452,540,909
The goodwill allocated to OVS mainly relates to the acquisition of Gruppo Coin by Icon on 30 June
2011, for 451,778 thousand euros.
Goodwill was tested for impairment: the results are shown in the "Impairment testing" section below.
OVS Group – Annual Report at 31 January 2015 pg. 149
Impairment testing
Pursuant to IAS 36, OVS S.p.A. verifies the recoverability of intangible assets with an indefinite useful
life (goodwill and brands) at least once a year, or more frequently if there are indicators of impairment,
while for tangible assets and other assets with a finite useful life it does this when there are indicators of
impairment. The recoverable amount of the cash-generating units (CGUs) to which the individual
assets are allocated is verified by calculating their value in use and/or fair value.
a) OVS CGU
Impairment testing was performed by comparing the carrying value (“carrying amount”) of the cash
generating unit (CGU) compared with value in use (“value in use” or “VIU”) of the same.
Note that the carrying amount of the CGU OVS includes goodwill, completely allocated to the same
and amounting to 452.5 million euros, and the OVS brand amounting to 377.5 million euros, both with
indefinite life.
The CGUs identified by management line up with OVS and UPIM operating units that contain the
flow of all services and products provided to customers.
The estimated value in use for the OVS operating unit for the purposes of impairment testing is based
on discounted calculations using forecast data for the OVS CGU, based on the following:
• expected cash flows for the OVS operating unit are extrapolated from the 2015-2017 three-year
business plan drawn up by management. The forecast cash flows for the OVS CGU are based on levels
of growth in sales and EBITDA based on both past income/profit performance and on future
expectations;
• expected future cash flows, calculated over a total period of 30 years, are calculated by applying an
ongoing 2% annual growth rate (“g”) to EBITDA, using the EBITDA of the last year of the plan as a
starting point. Annual investments are estimated on a constant basis based on the final year of the plan
(31.7 million euros), an amount that is considered indicative of the investments needed to maintain the
property in existence. Furthermore, changes to net working capital are calculated as zero as it is
considered reasonable, in light of the specific nature of the business field in which the CGU operates,
to predict that over the long term i) trade receivables and payables and ii) stock will balance out.
• the post-tax discount rate (WACC) used to estimate the current value of cash flows is 7.59% and is
determined based on the following assumptions: i) the risk-free rate used is equivalent to the 1-month
average (at 31 January 2015) of yield on ten-year Italian government bonds (BTP); ii) the equity risk
premium of 5.5% is an average rate in line with both the results of long-term analysis of industrialized
countries and professional practice; iii) the beta coefficient is estimated based on a panel of comparable
listed companies in the retail clothing business; iv) financial debt of 4.34% is estimated by calculating
the 1-month average of the 10-year EurIRS rate with a 300bps spread; and v) a debt/equity ratio used is
calculated using the average of a panel of comparable companies.

OVS Group – Annual Report at 31 January 2015 pg. 150
Based on considerations described above, the VIU of the OVS CGU at 31 January 2015 is 1,469.2
million euros. Based on the VIU of 1,469.2 million euros and the carrying amount (net invested capital)
of OVS CGU of 924.2 million euros, the CGU’s value in use is higher than its carrying value, therefore
there was no impairment to be booked.
b) UPIM CGU
Although no goodwill value was attributed to the UPIM CGU, the Group performed impairment
testing on it, also considering that it includes a value allocated to the brand for an amount equivalent to
€13.3 million, with an indefinite life.
The estimated value in use for the UPIM operating unit for the purposes of impairment testing is based
on discounted calculations using forecast data for the UPIM CGU, based on the following:
• expected cash flows for the UPIM operating unit are extrapolated from the 2015-2017 three-year
business plan drawn up by management. The forecast cash flows for the UPIM CGU are based on
levels of growth in sales and EBITDA based on both past income/profit performance and on future
expectations;
• expected future cash flows, calculated over a total period of 30 years, are calculated by applying an
ongoing 2% annual growth rate (“g”) to EBITDA, using the EBITDA of the last year of the plan as a
starting point. Annual investments are estimated on a constant basis based on the final year of the plan
(8.1 million euros), an amount that is considered indicative of the investments needed to maintain the
property in existence) Furthermore, changes to net working capital are calculated as zero as it is
considered reasonable, in light of the specific nature of the business field in which the CGU operates,
to predict that over the long term i) trade receivables and payables and ii) stock will balance out.
• the post-tax discount rate (WACC) used to estimate the current value of cash flows is 7.59% and is
determined based on the following assumptions: i) the risk-free rate used is equivalent to the 1-month
average (at 31 January 2015) of yield on ten-year Italian government bonds (BTP); ii) the equity risk
premium of 5.5% is an average rate in line with both the results of long-term analysis of industrialized
countries and professional practice; iii) the beta coefficient is estimated based on a panel of comparable
listed companies in the retail clothing business; iv) financial debt of 4.34% is estimated by calculating
the 1-month average of the 10-year EurIRS rate with a 300bps spread; and v) a debt/equity ratio used is
calculated using the average of a panel of comparable companies.
Based on considerations described above, the VIU of the UPIM CGU at 31 January 2015 is 135.6
million euros. Based on the VIU of 135.6 million euros and the carrying amount (net invested capital)
of UPIM CGU of 78.3 million euros, the CGU’s value in use is higher than its carrying value, therefore
there was no impairment to be booked.

OVS Group – Annual Report at 31 January 2015 pg. 151
Impairment testing of store licences
For licences relating to OVS and Upim stores that are indicating impairment, impairment testing was
carried out by calculating value in use for each store.
The key assumptions used to determine the value in use concern the discounting rate and the growth
rate. Specifically, the post-tax discount rate (WACC) used was 7.59% and no growth rate was predicted
for the period following the 2015 budget.
Based on the analysis performed, in the current year the store licences for three stores in the OVS
segment, one store in the Upim segment and one Bernardi store were written down for a total amount
of 3,310 thousand euros.
10 Equity investments 8,852,503
Appendix 4 shows the breakdown of, and changes in, equity investments in subsidiaries and affiliates
during the year.
Key information on equity investments in subsidiaries and affiliates at 31 January 2015 is provided in
Appendix 5.
Due to the losses accruing by subsidiary OVS Department Stores d.o.o. Serbia, OVS S.p.A., in January
2015, ordered a bank transfer of 986 thousand euros. Furthermore, in the context of the assessment of
the recoverability of investments, the Company partially wrote down the equity investment in the
amount of 588 thousand euros.
For additional information on write-downs of equity investments, see note 16 to the item "Provisions
for risks and charges".
11 Current Financial liabilities 779,936,912
11 Non-current Financial liabilities 3,606,774
The breakdown of the "Current financial liabilities" and "Non-current financial liabilities" items at 31
January 2015 is shown below:
(thousands of euros) 31.01.2015
Current bank loans 79,595
Current portion of long-term debt 673,556
Other current financial liabilities 26,786
Total current financial liabilities 779,937
Other non-current financial liabilities 3,607
Total non-current financial liabilities 3,607
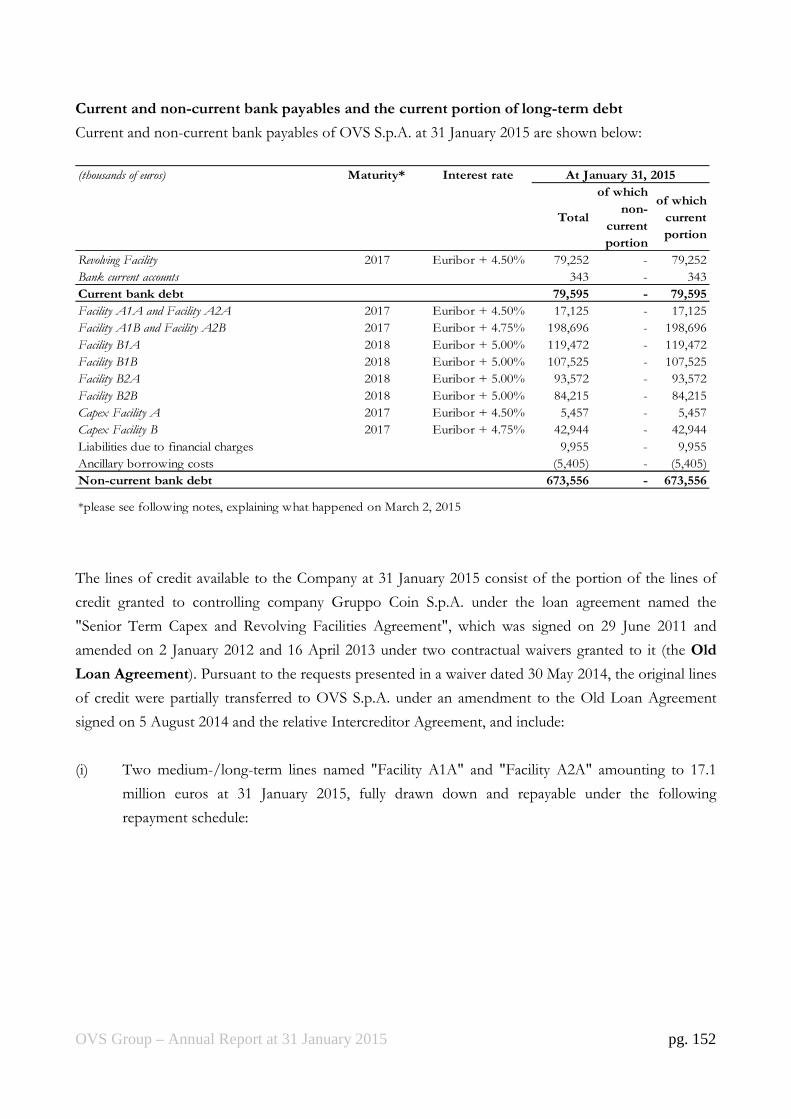
OVS Group – Annual Report at 31 January 2015 pg. 152
Current and non-current bank payables and the current portion of long-term debt
Current and non-current bank payables of OVS S.p.A. at 31 January 2015 are shown below:
(thousands of euros) Maturity* Interest rate
Total
of which
non-
current
portion
of which
current
portion
Revolving Facility 2017 Euribor + 4.50% 79,252 - 79,252
Bank current accounts 343 - 343
Current bank debt 79,595 - 79,595
Facility A1A and Facility A2A 2017 Euribor + 4.50% 17,125 - 17,125
Facility A1B and Facility A2B 2017 Euribor + 4.75% 198,696 - 198,696
Facility B1A 2018 Euribor + 5.00% 119,472 - 119,472
Facility B1B 2018 Euribor + 5.00% 107,525 - 107,525
Facility B2A 2018 Euribor + 5.00% 93,572 - 93,572
Facility B2B 2018 Euribor + 5.00% 84,215 - 84,215
Capex Facility A 2017 Euribor + 4.50% 5,457 - 5,457
Capex Facility B 2017 Euribor + 4.75% 42,944 - 42,944
Liabilities due to financial charges 9,955 - 9,955
Ancillary borrowing costs (5,405) - (5,405)
Non-current bank debt 673,556 - 673,556
*please see following notes, explaining what happened on March 2, 2015
At January 31, 2015
The lines of credit available to the Company at 31 January 2015 consist of the portion of the lines of
credit granted to controlling company Gruppo Coin S.p.A. under the loan agreement named the
"Senior Term Capex and Revolving Facilities Agreement", which was signed on 29 June 2011 and
amended on 2 January 2012 and 16 April 2013 under two contractual waivers granted to it (the Old
Loan Agreement). Pursuant to the requests presented in a waiver dated 30 May 2014, the original lines
of credit were partially transferred to OVS S.p.A. under an amendment to the Old Loan Agreement
signed on 5 August 2014 and the relative Intercreditor Agreement, and include:
(i) Two medium-/long-term lines named "Facility A1A" and "Facility A2A" amounting to 17.1
million euros at 31 January 2015, fully drawn down and repayable under the following
repayment schedule:
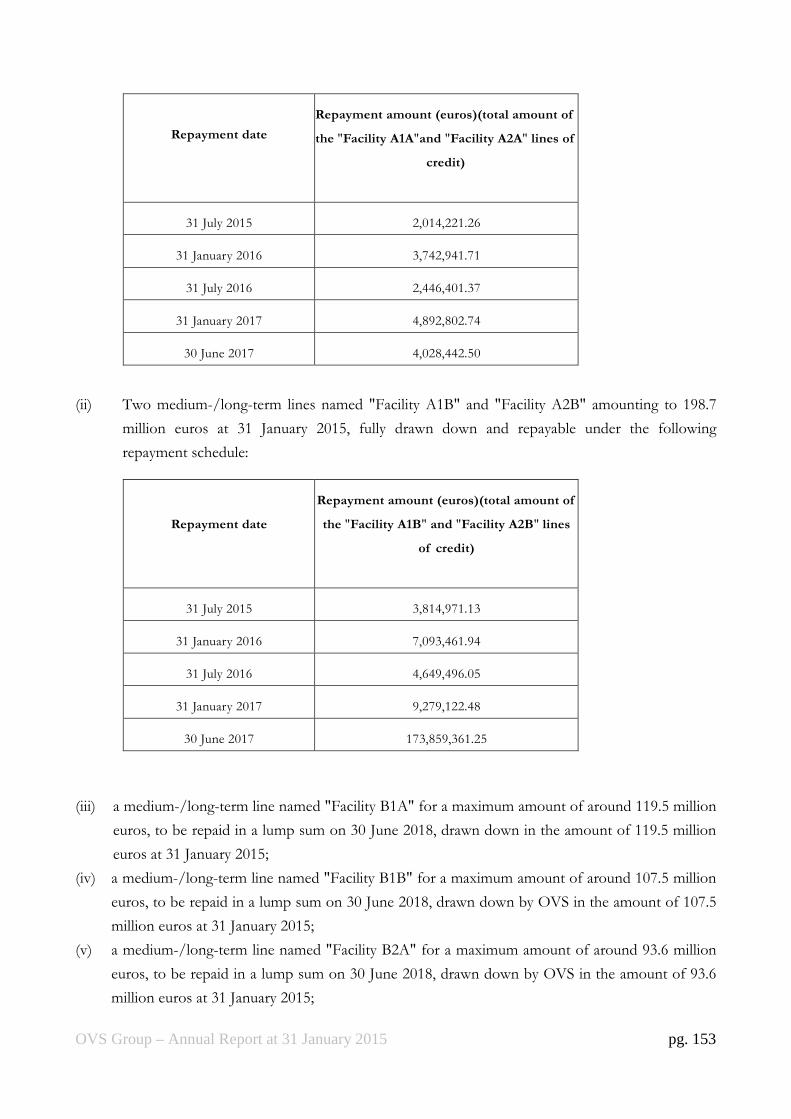
OVS Group – Annual Report at 31 January 2015 pg. 153
Repayment date
Repayment amount (euros)(total amount of
the "Facility A1A"and "Facility A2A" lines of
credit)
31 July 2015 2,014,221.26
31 January 2016 3,742,941.71
31 July 2016 2,446,401.37
31 January 2017 4,892,802.74
30 June 2017 4,028,442.50
(ii) Two medium-/long-term lines named "Facility A1B" and "Facility A2B" amounting to 198.7
million euros at 31 January 2015, fully drawn down and repayable under the following
repayment schedule:
Repayment date
Repayment amount (euros)(total amount of
the "Facility A1B" and "Facility A2B" lines
of credit)
31 July 2015 3,814,971.13
31 January 2016 7,093,461.94
31 July 2016 4,649,496.05
31 January 2017 9,279,122.48
30 June 2017 173,859,361.25
(iii) a medium-/long-term line named "Facility B1A" for a maximum amount of around 119.5 million
euros, to be repaid in a lump sum on 30 June 2018, drawn down in the amount of 119.5 million
euros at 31 January 2015;
(iv) a medium-/long-term line named "Facility B1B" for a maximum amount of around 107.5 million
euros, to be repaid in a lump sum on 30 June 2018, drawn down by OVS in the amount of 107.5
million euros at 31 January 2015;
(v) a medium-/long-term line named "Facility B2A" for a maximum amount of around 93.6 million
euros, to be repaid in a lump sum on 30 June 2018, drawn down by OVS in the amount of 93.6
million euros at 31 January 2015;
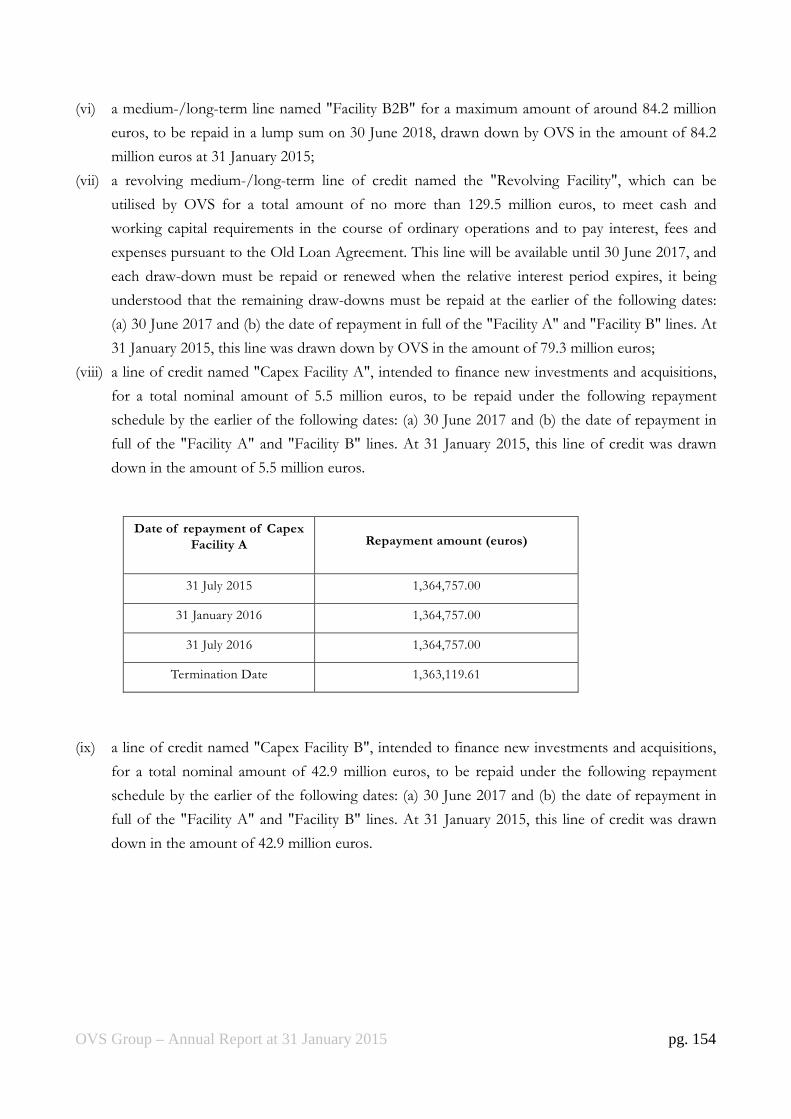
OVS Group – Annual Report at 31 January 2015 pg. 154
(vi) a medium-/long-term line named "Facility B2B" for a maximum amount of around 84.2 million
euros, to be repaid in a lump sum on 30 June 2018, drawn down by OVS in the amount of 84.2
million euros at 31 January 2015;
(vii) a revolving medium-/long-term line of credit named the "Revolving Facility", which can be
utilised by OVS for a total amount of no more than 129.5 million euros, to meet cash and
working capital requirements in the course of ordinary operations and to pay interest, fees and
expenses pursuant to the Old Loan Agreement. This line will be available until 30 June 2017, and
each draw-down must be repaid or renewed when the relative interest period expires, it being
understood that the remaining draw-downs must be repaid at the earlier of the following dates:
(a) 30 June 2017 and (b) the date of repayment in full of the "Facility A" and "Facility B" lines. At
31 January 2015, this line was drawn down by OVS in the amount of 79.3 million euros;
(viii) a line of credit named "Capex Facility A", intended to finance new investments and acquisitions,
for a total nominal amount of 5.5 million euros, to be repaid under the following repayment
schedule by the earlier of the following dates: (a) 30 June 2017 and (b) the date of repayment in
full of the "Facility A" and "Facility B" lines. At 31 January 2015, this line of credit was drawn
down in the amount of 5.5 million euros.
Date of repayment of Capex
Facility A
Repayment amount (euros)
31 July 2015 1,364,757.00
31 January 2016 1,364,757.00
31 July 2016 1,364,757.00
Termination Date 1,363,119.61
(ix) a line of credit named "Capex Facility B", intended to finance new investments and acquisitions,
for a total nominal amount of 42.9 million euros, to be repaid under the following repayment
schedule by the earlier of the following dates: (a) 30 June 2017 and (b) the date of repayment in
full of the "Facility A" and "Facility B" lines. At 31 January 2015, this line of credit was drawn
down in the amount of 42.9 million euros.

OVS Group – Annual Report at 31 January 2015 pg. 155
Date of repayment of Capex
Facility B
Repayment amount (euros)
31 July 2015 1,790,749.49
31 January 2016 1,790,749.49
31 July 2016 1,790,749.49
Termination Date for Capex
Facility
37,571,384.31
At 31 January 2015, these lines of credit were drawn down for a total nominal amount of 748.3 million
euros. The average interest rate on the lines of credit granted to OVS in existence at 31 January 2015 is
5.45%.
Please see the following section, "Exposure to and management of financial risks", for an indication of
the interest rate hedging policy adopted by OVS.
Guarantees and covenants
The amendment of the Old Loan Agreement resulted, inter alia, in some adjustments to the guarantee
structure. Without prejudice to the guarantees issued by controlling company Gruppo Coin under the
contracts signed, on 5 August 2014, OVS signed the following guarantees in relation to the transferred
debt:
1. the issue of a pledge under UK law on the shares of Oriental Buying Services Limited;
2. the assignment as collateral of receivables held by OVS S.p.A. arising from any infra-group
loans of which OVS S.p.A. is the lending party;
3. a lien on certain assets;
4. the assignment as collateral of trade receivables;
5. a pledge on certain intellectual property titles;
6. a pledge on certain current accounts.
With regard to the Old Loan Agreement, you will recall that on 29 June 2011, two loan agreements
governed by UK law, named the "Senior bridge term and revolving facilities agreement" (the BT Loan
Agreement) and the "Senior term, capex and revolving facilities agreement" were stipulated by, inter
alios, Icon 2 S.à r.l. and a banking syndicate (Banca IMI S.p.A., BNP Paribas, Crédit Agricole Corporate
and Investment Bank, HSBC Bank p.l.c., Mediobanca - Banca di Credito Finanziario S.p.A., Natixis

OVS Group – Annual Report at 31 January 2015 pg. 156
S.A. Milan, UBS Limited and UniCredit S.p.A.); Giorgione Investimenti S.p.A., Gruppo Coin S.p.A.,
Oviesse S.p.A., Upim S.r.l., Coin S.p.A., Oviesse Franchising S.p.A. and Oriental Buying Services
Limited also signed up to the agreements by entering into individual accession agreements on 30 June
2011.
On 15 April 2012, the reverse merger of controlling holding companies Icon S.p.A. and Giorgione
Investimenti S.p.A. into Gruppo Coin S.p.A. took effect (the First Merger). On 1 January 2013, the
merger by incorporation of Coin S.p.A., Oviesse S.p.A., Coin Franchising S.p.A., Oviesse Franchising
S.p.A. and Upim S.r.l. into Gruppo Coin S.p.A. took effect (the Second Merger).
At the time of the First Merger and the Second Merger, the necessary adjustments were made to all
commitments, declarations and guarantees formalised at the time of entering into the BT Loan
Agreement and the Loan Agreement. In line with market practice, these clauses were intended to
guarantee repayment of the lines of credit awarded to Gruppo Coin S.p.A. by the banking syndicate.
Specifically, as a result of the First Merger and the Second Merger, Gruppo Coin S.p.A. assumed the
liabilities, payables, obligations, commitments, expenses, encumbrances, debt positions and guarantees
granted of each of the incorporated companies (including the guarantees granted by the incorporated
companies when the loan agreements were entered into). Gruppo Coin S.p.A. therefore issued and, if
appropriate, confirmed, inter alia, the following guarantees to the banking syndicate: (i) a pledge on the
Group's key trademarks, (ii) a pledge on some current accounts, (iii) the assignment as collateral of
receivables arising from insurance policies and trade receivables, (iv) the creation of a lien (pursuant to
article 46 of Legislative Decree 385/93) on corporate assets, and, lastly, (v) an autonomous first-
demand guarantee governed by UK law (a "corporate guarantee"). Declarations were also issued,
commitments assumed and guarantees created to guarantee the loan agreements (including a pledge on
100% of shares of Gruppo Coin S.p.A.) by the companies in the chain of control, i.e., Icon 1 S.A. and
Icon 2 S.à r.l.. The commitments assumed include, in particular, those relating to financial covenants at
consolidated level for Gruppo Coin S.p.A. and its subsidiaries.
The amendment to the Old Loan Agreement did not entail any change to the covenant structure and
thresholds in place, which are all calculated at consolidated level.
Specifically, the financial covenants are calculated on a quarterly basis and relate to interest cover (the
ratio of adjusted EBITDA to adjusted net financial expenses), cash flow cover (the ratio of adjusted
cash flows to adjusted servicing of debt), the leverage ratio (the ratio of net debt, including the financial
exposure of controlling company Icon 2 S.à r.l., to EBITDA), and capital expenditure (the amount of
investments in tangible and intangible assets). Pursuant to the Old Loan Agreement and again at
consolidated level, a contractual obligation also applies, according to which the use of the revolving line
of credit (net of the cash deposited in bank current accounts) must not exceed: (i) 40 million euros for
at least five consecutive business days during the financial year ended 31 January 2015; and (ii) 25
million euros for at least five consecutive business days after the financial year ended 31 January 2015.
The covenants for 2014 were achieved between 22 and 30 December 2014.

OVS Group – Annual Report at 31 January 2015 pg. 157
Change of control clause
According to standard practice, the Old Loan Agreement contains a change of control clause, pursuant
to which, inter alia, (i) loss of ownership (direct or indirect) of an absolute majority of the share capital
of Icon 2 S.à r.l. by BC Partners, or (ii) loss of ownership (direct or indirect) of the share capital of
Gruppo Coin S.p.A. by Icon 2 S.à r.l., would lead to the cancellation and the obligation to immediately
repay the lines of credit granted to Gruppo Coin S.p.A. and to OVS S.p.A. under the Old Loan
Agreement.
New Loan Agreement
As described above, this was extinguished on 2 March 2015, the effective date of the new loan
(hereinafter the "New Loan Agreement"), as indicated in the Report on Operations.
The key conditions of this agreement are as follows.
The New Loan Agreement provides for the granting of a medium-/long-term line of credit of
375,000,000 euros, which, together with the income from the capital increase servicing the global offer,
was intended to repay the pre-existing debt of the Issuer and to pay costs associated with the listing
process (the "Senior Loan"), and a revolving line of credit of 100,000,000 euros that may be drawn
down in different currencies (the "Revolving Line of Credit"), for a total maximum amount of
475,000,000 euros.
The Senior Loan was disbursed on 2 March 2015, as trading of the Company's shares began on the
MTA. On the date that trading of the shares started on the MTA, the Company fully repaid the Old
Loan Agreement (which therefore ceased to be effective), using a portion of the income deriving from
the global offer to reduce OVS Group's gross debt, and the Senior Loan to restructure the remainder:
pursuant to the New Loan Agreement, the Senior Loan must be used, inter alia, to repay fully the debt
arising from the Old Loan Agreement. Therefore, on the date that trading started, financial debt mainly
consisted of the New Loan Agreement.
The applicable interest rate for both the Senior Loan and the Revolving line of credit is equal to the
sum of (i) the margin of 3% per annum (the "Margin") and (ii) the Euribor rate or, if the currency used
is not the euro, the Libor rate (the "Interest"). Interest will be calculated on a quarterly or half-yearly
basis for the Senior Loan, and on a monthly or quarterly or half-yearly basis for the revolving line of
credit (unless otherwise agreed between the parties).
The Margin may decrease or increase according to the ratio of average total net debt to EBITDA (as
contractually specified), calculated on the basis, depending on the case, of the consolidated financial
statements (subject to revision) at 31 January and the consolidated interim report (not subject to
revision) at 31 July, drawn up pursuant to IFRS. Specifically, the New Loan Agreement stipulates that:
• if the ratio is equal to, or greater than 3.00:1, the applicable Margin will be 3.50%;
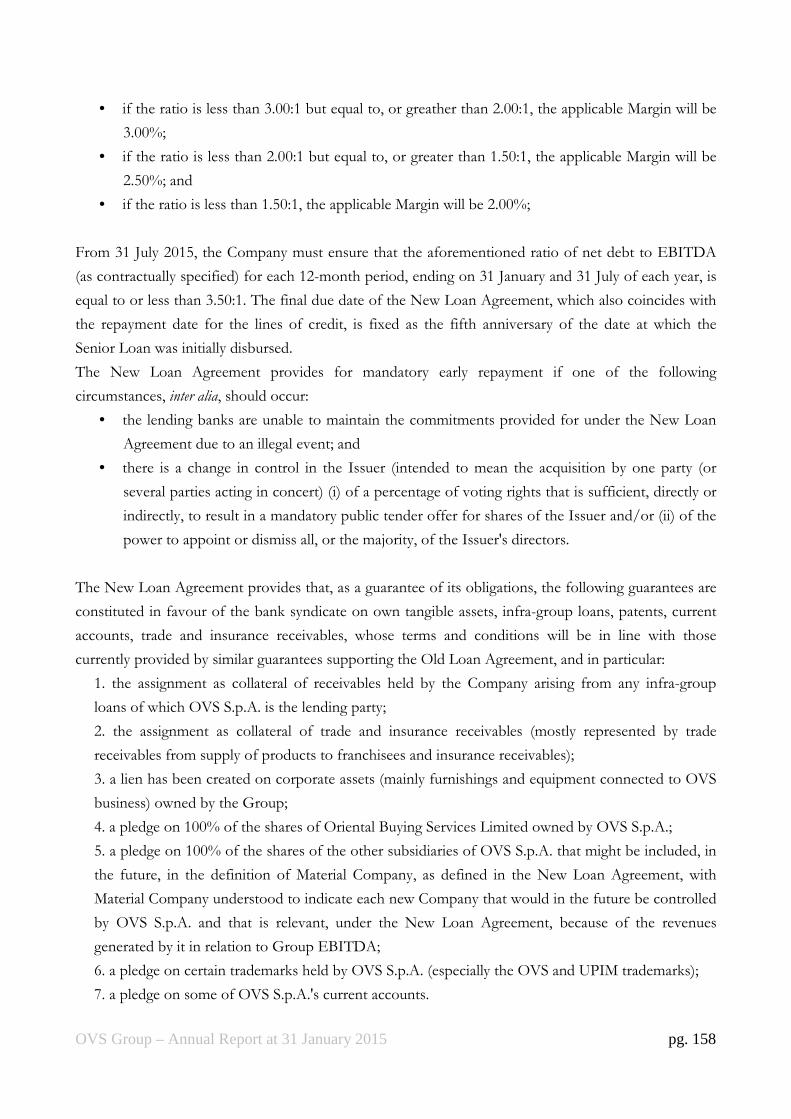
OVS Group – Annual Report at 31 January 2015 pg. 158
• if the ratio is less than 3.00:1 but equal to, or greather than 2.00:1, the applicable Margin will be
3.00%;
• if the ratio is less than 2.00:1 but equal to, or greater than 1.50:1, the applicable Margin will be
2.50%; and
• if the ratio is less than 1.50:1, the applicable Margin will be 2.00%;
From 31 July 2015, the Company must ensure that the aforementioned ratio of net debt to EBITDA
(as contractually specified) for each 12-month period, ending on 31 January and 31 July of each year, is
equal to or less than 3.50:1. The final due date of the New Loan Agreement, which also coincides with
the repayment date for the lines of credit, is fixed as the fifth anniversary of the date at which the
Senior Loan was initially disbursed.
The New Loan Agreement provides for mandatory early repayment if one of the following
circumstances, inter alia, should occur:
• the lending banks are unable to maintain the commitments provided for under the New Loan
Agreement due to an illegal event; and
• there is a change in control in the Issuer (intended to mean the acquisition by one party (or
several parties acting in concert) (i) of a percentage of voting rights that is sufficient, directly or
indirectly, to result in a mandatory public tender offer for shares of the Issuer and/or (ii) of the
power to appoint or dismiss all, or the majority, of the Issuer's directors.
The New Loan Agreement provides that, as a guarantee of its obligations, the following guarantees are
constituted in favour of the bank syndicate on own tangible assets, infra-group loans, patents, current
accounts, trade and insurance receivables, whose terms and conditions will be in line with those
currently provided by similar guarantees supporting the Old Loan Agreement, and in particular:
1. the assignment as collateral of receivables held by the Company arising from any infra-group
loans of which OVS S.p.A. is the lending party;
2. the assignment as collateral of trade and insurance receivables (mostly represented by trade
receivables from supply of products to franchisees and insurance receivables);
3. a lien has been created on corporate assets (mainly furnishings and equipment connected to OVS
business) owned by the Group;
4. a pledge on 100% of the shares of Oriental Buying Services Limited owned by OVS S.p.A.;
5. a pledge on 100% of the shares of the other subsidiaries of OVS S.p.A. that might be included, in
the future, in the definition of Material Company, as defined in the New Loan Agreement, with
Material Company understood to indicate each new Company that would in the future be controlled
by OVS S.p.A. and that is relevant, under the New Loan Agreement, because of the revenues
generated by it in relation to Group EBITDA;
6. a pledge on certain trademarks held by OVS S.p.A. (especially the OVS and UPIM trademarks);
7. a pledge on some of OVS S.p.A.'s current accounts.
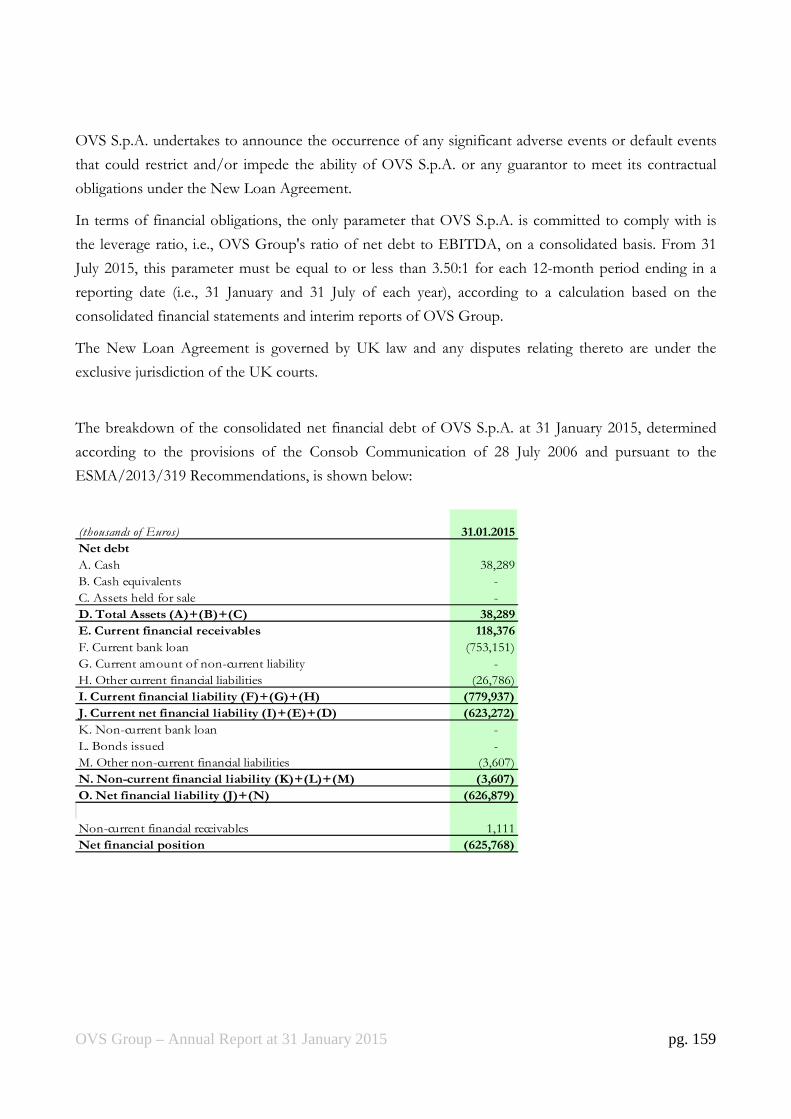
OVS Group – Annual Report at 31 January 2015 pg. 159
OVS S.p.A. undertakes to announce the occurrence of any significant adverse events or default events
that could restrict and/or impede the ability of OVS S.p.A. or any guarantor to meet its contractual
obligations under the New Loan Agreement.
In terms of financial obligations, the only parameter that OVS S.p.A. is committed to comply with is
the leverage ratio, i.e., OVS Group's ratio of net debt to EBITDA, on a consolidated basis. From 31
July 2015, this parameter must be equal to or less than 3.50:1 for each 12-month period ending in a
reporting date (i.e., 31 January and 31 July of each year), according to a calculation based on the
consolidated financial statements and interim reports of OVS Group.
The New Loan Agreement is governed by UK law and any disputes relating thereto are under the
exclusive jurisdiction of the UK courts.
The breakdown of the consolidated net financial debt of OVS S.p.A. at 31 January 2015, determined
according to the provisions of the Consob Communication of 28 July 2006 and pursuant to the
ESMA/2013/319 Recommendations, is shown below:
(thousands of Euros) 31.01.2015
Net debt
A. Cash 38,289
B. Cash equivalents -
C. Assets held for sale -
D. Total Assets (A)+(B)+(C) 38,289
E. Current financial receivables 118,376
F. Current bank loan (753,151)
G. Current amount of non-current liability -
H. Other current financial liabilities (26,786)
I. Current financial liability (F)+(G)+(H) (779,937)
J. Current net financial liability (I)+(E)+(D) (623,272)
K. Non-current bank loan -
L. Bonds issued -
M. Other non-current financial liabilities (3,607)
N. Non-current financial liability (K)+(L)+(M) (3,607)
O. Net financial liability (J)+(N) (626,879)
Non-current financial receivables 1,111
Net financial position (625,768)
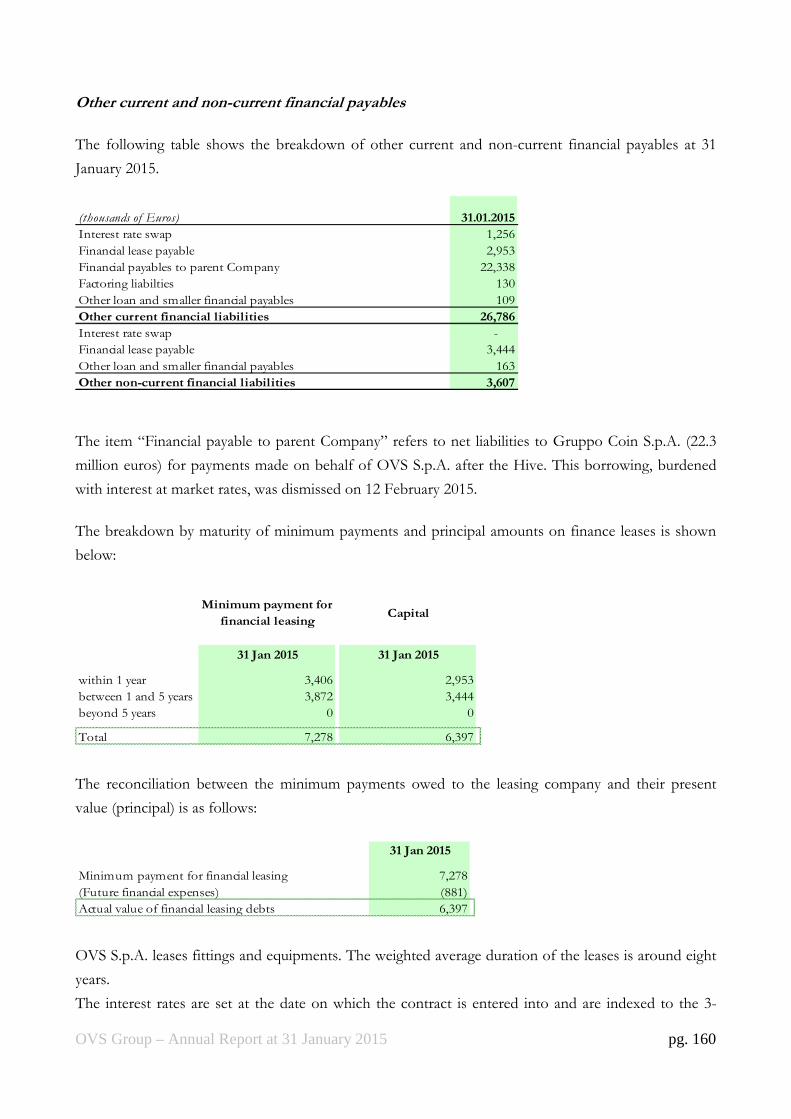
OVS Group – Annual Report at 31 January 2015 pg. 160
Other current and non-current financial payables
The following table shows the breakdown of other current and non-current financial payables at 31
January 2015.
(thousands of Euros) 31.01.2015
Interest rate swap 1,256
Financial lease payable 2,953
Financial payables to parent Company 22,338
Factoring liabilties 130
Other loan and smaller financial payables 109
Other current financial liabilities 26,786
Interest rate swap -
Financial lease payable 3,444
Other loan and smaller financial payables 163
Other non-current financial liabilities 3,607
The item “Financial payable to parent Company” refers to net liabilities to Gruppo Coin S.p.A. (22.3
million euros) for payments made on behalf of OVS S.p.A. after the Hive. This borrowing, burdened
with interest at market rates, was dismissed on 12 February 2015.
The breakdown by maturity of minimum payments and principal amounts on finance leases is shown
below:
31 Jan 2015 31 Jan 2015
within 1 year 3,406 2,953
between 1 and 5 years 3,872 3,444
beyond 5 years 0 0
Total 7,278 6,397
CapitalMinimum payment for
financial leasing
The reconciliation between the minimum payments owed to the leasing company and their present
value (principal) is as follows:
31 Jan 2015
Minimum payment for financial leasing 7,278
(Future financial expenses) (881)
Actual value of financial leasing debts 6,397
OVS S.p.A. leases fittings and equipments. The weighted average duration of the leases is around eight
years.
The interest rates are set at the date on which the contract is entered into and are indexed to the 3-
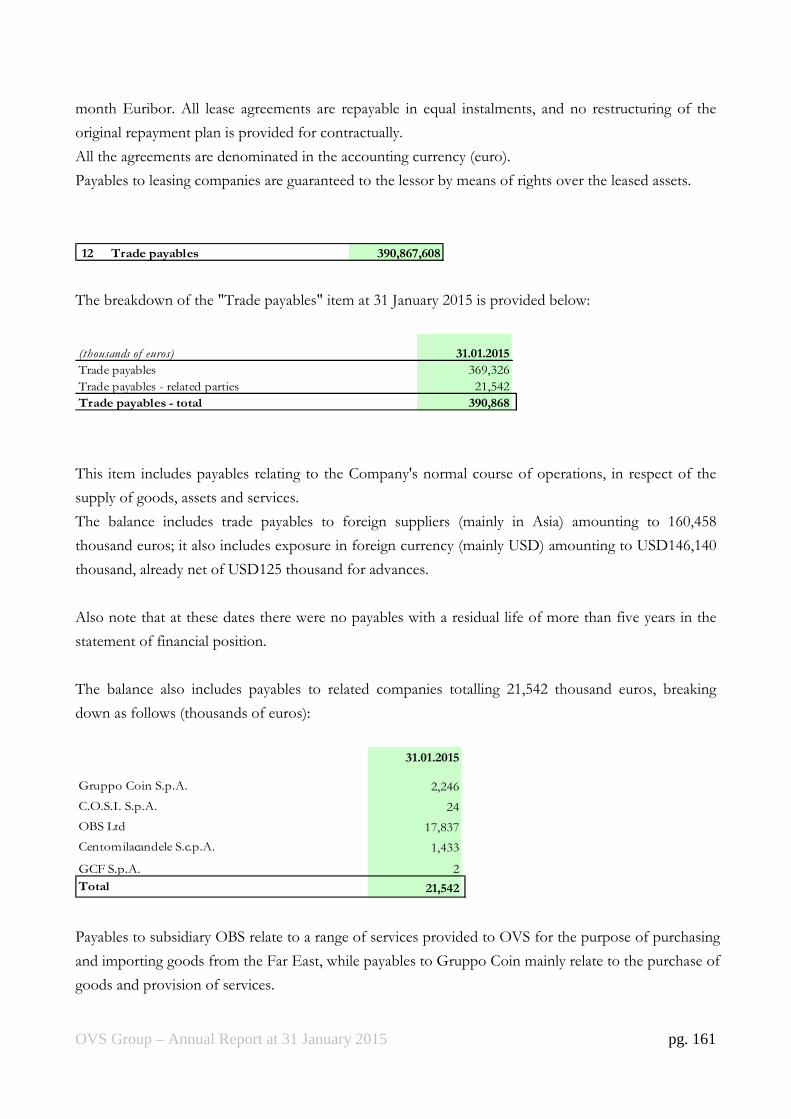
OVS Group – Annual Report at 31 January 2015 pg. 161
month Euribor. All lease agreements are repayable in equal instalments, and no restructuring of the
original repayment plan is provided for contractually.
All the agreements are denominated in the accounting currency (euro).
Payables to leasing companies are guaranteed to the lessor by means of rights over the leased assets.
12 Trade payables 390,867,608
The breakdown of the "Trade payables" item at 31 January 2015 is provided below:
(thousands of euros) 31.01.2015
Trade payables 369,326
Trade payables - related parties 21,542
Trade payables - total 390,868
This item includes payables relating to the Company's normal course of operations, in respect of the
supply of goods, assets and services.
The balance includes trade payables to foreign suppliers (mainly in Asia) amounting to 160,458
thousand euros; it also includes exposure in foreign currency (mainly USD) amounting to USD146,140
thousand, already net of USD125 thousand for advances.
Also note that at these dates there were no payables with a residual life of more than five years in the
statement of financial position.
The balance also includes payables to related companies totalling 21,542 thousand euros, breaking
down as follows (thousands of euros):
31.01.2015
Gruppo Coin S.p.A. 2,246
C.O.S.I. S.p.A. 24
OBS Ltd 17,837
Centomilacandele S.c.p.A. 1,433
GCF S.p.A. 2
Total 21,542
Payables to subsidiary OBS relate to a range of services provided to OVS for the purpose of purchasing
and importing goods from the Far East, while payables to Gruppo Coin mainly relate to the purchase of
goods and provision of services.

OVS Group – Annual Report at 31 January 2015 pg. 162
13 Current tax liabilities 16,410,080
The amount shown represents the payable for IRES and IRAP, calculated on accrued income at 31
January 2015.
As already mentioned, OVS S.p.A., Gruppo Coin S.p.A. and C.O.S.I. S.p.A. took up the option of
joining the tax consolidation scheme, with the consolidating entity being Gruppo Coin S.p.A..
After the option was taken up, the companies in question entered into specific agreements governing
their behaviour and providing for the transfer of IRES payables/receivables.
Pursuant to the above regulation, OVS S.p.A. will transfer to the consolidating company the IRES
owed, in the amount of 11.1 million euros.
14 Other current liabilities 88,026,280
14 Other non-current liabilities 9,396,000
The breakdown of Other payables at 31 January 2015 is as follows:
31.01.2015
Due to employees for holiday leave 6,883
Other amounts due to employees 15,927
Due to Directors and Statutory Auditors 434
Other payables 4,987
Due to Social Security 6,054
VAT payables 34,635
Other tax payables 2,675
Other payables - due to customers 70
Leasing instalment accruals/deferrals 6,639
Utilities accruals and deferrals 2,231
Insurance accruals and deferrals 50
Other accruals and deferrals 7,441
Total other current liabilities 88,026
Straight lining of rental expenses 8,556
Accrued expenses and deferred income 840
Total other non-current liabilities 9,396
Payables to employees relates to benefits accrued and not paid out at 31 January 2015.
Other payables mainly refers to customer advances to book goods and purchases of goods vouchers
for 2,291 thousand euros, down payments received on the sale of the Milan Piazzale Loreto and Padua
business units for 300 thousand euros and to payables to a former Upim S.r.l. supplier for a legal
dispute amounting to 340 thousand euros.
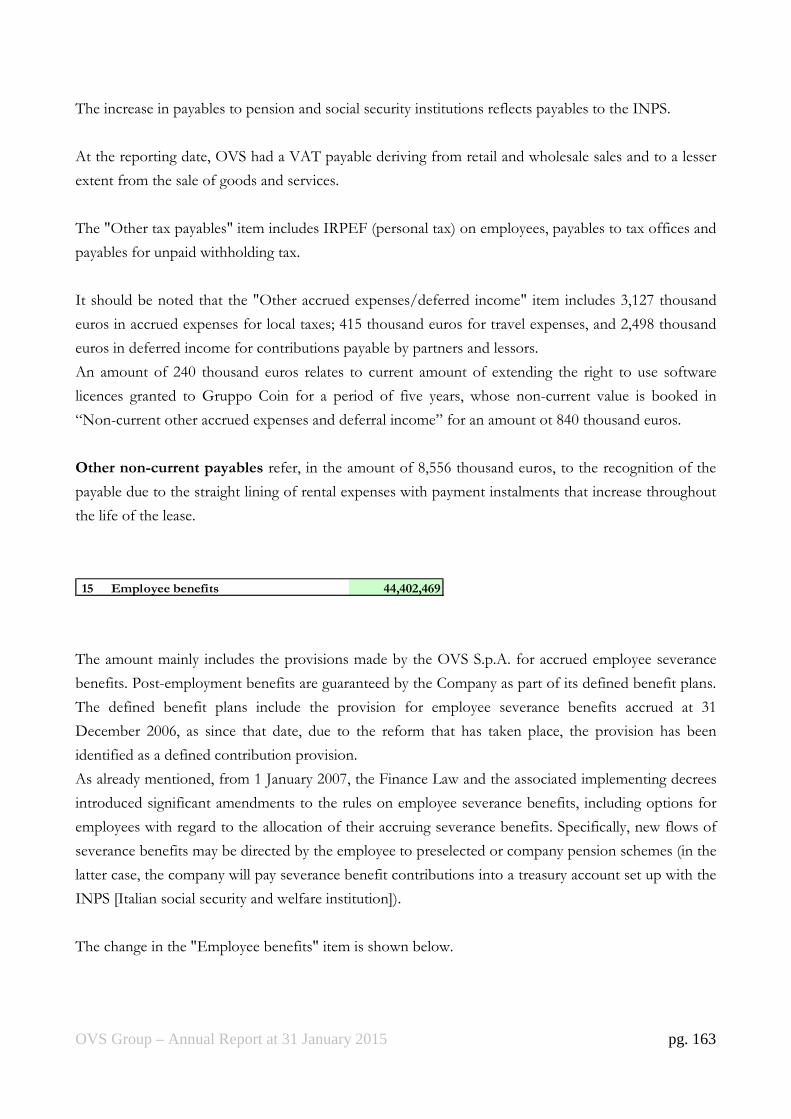
OVS Group – Annual Report at 31 January 2015 pg. 163
The increase in payables to pension and social security institutions reflects payables to the INPS.
At the reporting date, OVS had a VAT payable deriving from retail and wholesale sales and to a lesser
extent from the sale of goods and services.
The "Other tax payables" item includes IRPEF (personal tax) on employees, payables to tax offices and
payables for unpaid withholding tax.
It should be noted that the "Other accrued expenses/deferred income" item includes 3,127 thousand
euros in accrued expenses for local taxes; 415 thousand euros for travel expenses, and 2,498 thousand
euros in deferred income for contributions payable by partners and lessors.
An amount of 240 thousand euros relates to current amount of extending the right to use software
licences granted to Gruppo Coin for a period of five years, whose non-current value is booked in
“Non-current other accrued expenses and deferral income” for an amount ot 840 thousand euros.
Other non-current payables refer, in the amount of 8,556 thousand euros, to the recognition of the
payable due to the straight lining of rental expenses with payment instalments that increase throughout
the life of the lease.
15 Employee benefits 44,402,469
The amount mainly includes the provisions made by the OVS S.p.A. for accrued employee severance
benefits. Post-employment benefits are guaranteed by the Company as part of its defined benefit plans.
The defined benefit plans include the provision for employee severance benefits accrued at 31
December 2006, as since that date, due to the reform that has taken place, the provision has been
identified as a defined contribution provision.
As already mentioned, from 1 January 2007, the Finance Law and the associated implementing decrees
introduced significant amendments to the rules on employee severance benefits, including options for
employees with regard to the allocation of their accruing severance benefits. Specifically, new flows of
severance benefits may be directed by the employee to preselected or company pension schemes (in the
latter case, the company will pay severance benefit contributions into a treasury account set up with the
INPS [Italian social security and welfare institution]).
The change in the "Employee benefits" item is shown below.

OVS Group – Annual Report at 31 January 2015 pg. 164
Value at contribution date 42,454
Increase for the period 186
Actuarial earnings / (losses) 3,706
Contributions / benefits paid (1,944)
Value at the end of the period 44,402
The economic and demographic assumptions used for actuarial evaluation are listed below:
Demographic assumptions:
• for the expectation of death, the IPS55 demographic, broken down by gender;
• for the expectation of disability, the assumptions used by the INPS model for projections to
2010. Expectations are constructed starting with the distribution by age and gender of pensions
in force at 1 January 1987 starting in 1984, 1985 and 1986 relating to personnel in the credit
unit;
• for the age of retirement of the general working population, achievement of the first retirement
requirement applicable for Mandatory General Insurance was assumed;
• for the probability of leaving employment for reasons other than death, based on statistics
provided by the Group, an annual frequency rate of 5.00% was assumed;
• for the probability of early retirement, a year-on-year figure of 3.00% was assumed.
Economic and financial assumptions:
Annual discount rate 1.25%
Annual inflation rate 1.75%
Annual increase in employee severance benefits 2.81%
The iBoxx Eurozone Corporates AA 10+ at the calculation date was used as the benchmark for the
discount rate. This expiry relates to the average remaining period of service at the company of the
employees of Group Companies, weighted with the expected payment.
Sensitivity analysis
As required by the revised version of IAS 19, a sensitivity analysis was carried out on changes in the
key actuarial assumptions included in the calculation model.
The above scenario was used as the baseline scenario; from this, the most significant
assumptions—i.e., the average annual discount rate, the average inflation rate and the turnover
rate—were increased and decreased by one half, one quarter and two percentage points,
respectively. The results obtained are summarised in the following table (millions of euros):
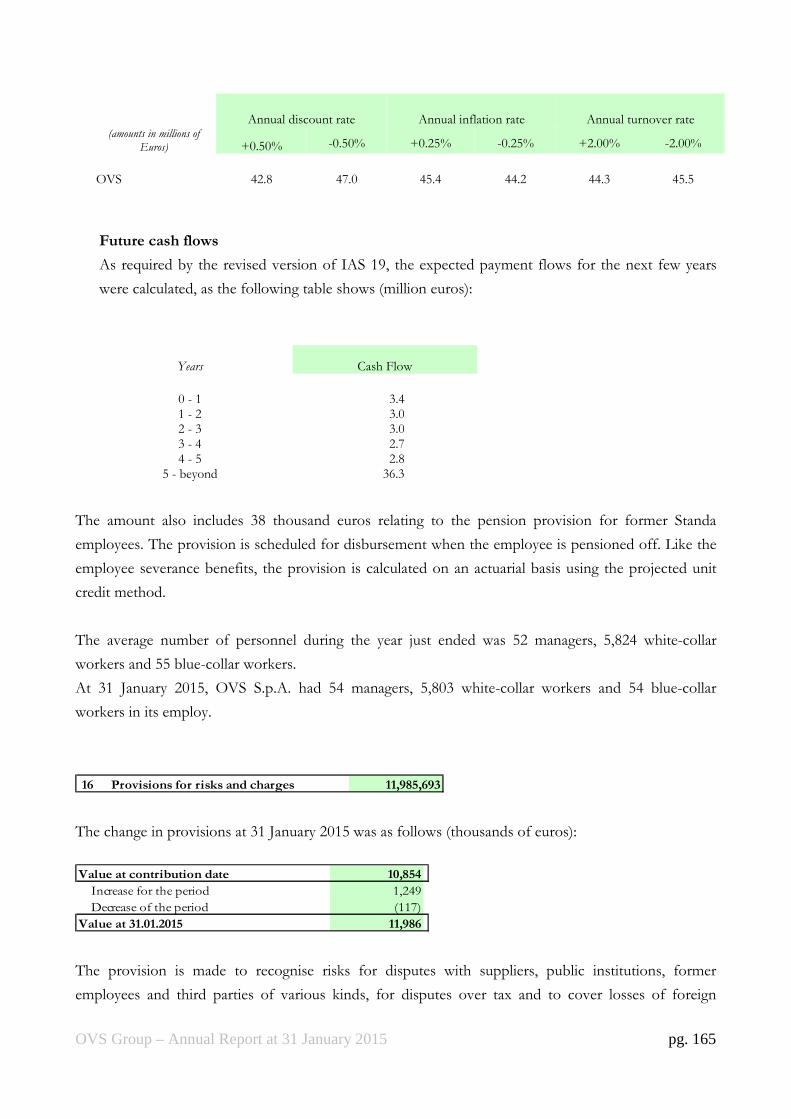
OVS Group – Annual Report at 31 January 2015 pg. 165
Annual discount rate Annual inflation rate Annual turnover rate (amounts in millions of
Euros) +0.50% -0.50% +0.25% -0.25% +2.00% -2.00% OVS 42.8 47.0 45.4 44.2 44.3 45.5
Future cash flows
As required by the revised version of IAS 19, the expected payment flows for the next few years
were calculated, as the following table shows (million euros):
Years Cash Flow
0 - 1 3.4 1 - 2 3.0 2 - 3 3.0 3 - 4 2.7 4 - 5 2.8
5 - beyond 36.3
The amount also includes 38 thousand euros relating to the pension provision for former Standa
employees. The provision is scheduled for disbursement when the employee is pensioned off. Like the
employee severance benefits, the provision is calculated on an actuarial basis using the projected unit
credit method.
The average number of personnel during the year just ended was 52 managers, 5,824 white-collar
workers and 55 blue-collar workers.
At 31 January 2015, OVS S.p.A. had 54 managers, 5,803 white-collar workers and 54 blue-collar
workers in its employ.
16 Provisions for risks and charges 11,985,693
The change in provisions at 31 January 2015 was as follows (thousands of euros):
Value at contribution date 10,854
Increase for the period 1,249
Decrease of the period (117)
Value at 31.01.2015 11,986
The provision is made to recognise risks for disputes with suppliers, public institutions, former
employees and third parties of various kinds, for disputes over tax and to cover losses of foreign

OVS Group – Annual Report at 31 January 2015 pg. 166
subsidiaries.
In particular, the balance at 31 January 2015 includes 2,854 thousand euros related to the foreign
subsidiaries OVS Bulgaria EOOD (1,310 thousand euros), OVS Maloprodaja d.o.o. (1,344 thousand
euros) and OVS Department Stores d.o.o. Serbia (200 thousand euros).
The global provision for the period was 1,249 thousand euros, attributable to the foreign subsidiaries
OVS Maloprodaja d.o.o. (893 thousand euros) and OVS Bulgaria EOOD (356 thousand euros).
The decrease of 117 thousand euros refers to utilisations of previous provisions made for store
restructuring and various legal reasons.
17 Current tax liabilities 168,916,177
The change in the "Deferred tax liabilities" item is shown below:
(thousands of Euros)
Values as at
contribution
date
P&L effect due
to provisions /
releases
Provisions /
releases on
Statement of
Comprehensive
income / (loss)
Balance as at
31.01.2015
Inventory obsolescence provision 2,259 3,565 5,824
Provision for local taxes 88 811 899
Provisions for risks and charges 2,544 (33) 2,511
Write-down of receivables 2,633 (273) 2,360
Tangible and intangible assets (176,674) (2,716) (179,390)
Derivatives on exchange rates - hedge accounting (104) 104 (7,303) (7,303)
Derivatives on exchange rates 642 (642) 0
Severance pension indemnity complying IAS 19 28 (28) 1,019 1,019
Other small items 564 4,600 5,164
Net deferred tax assets/(liabilities) (168,020) 5,388 (6,284) (168,916)
Note that the deferred taxes transferred at the time of Transferral had been calculated using an IRAP
rate of 3.5%, in accordance with Legislative Decree 66/2014; therefore, to calculate deferred taxes at
year-end, the increase in IRAP from 3.5% to 3.9%, after approval of Law 190 of 23 December 2014,
was applied. This adjustment created an increase of 2.3 million euros in deferred taxes.
Deferred tax liabilities related to the higher value of intangible assets in the financial statements were
mainly due to their recognition at fair value according to the acquisition method at the time of the
business combination.

OVS Group – Annual Report at 31 January 2015 pg. 167
SHAREHOLDERS' EQUITY
Shareholders' equity came in at 395.9 million euros.
Details of changes in the items included in shareholders' equity are provided in the relative accounting
schedule.
18 Share capital
At 31 January 2015, the share capital of OVS S.p.A. amounted to 140,000,000 euros, comprising
140,000,000 ordinary shares with no par value.
OVS was incorporated on 14 May 2014 with the name "OVS S.r.l.", with share capital of 10,000 euros.
The extraordinary general meeting of 23 July 2014 resolved to increase the share capital by 139,990,000
euros, from 10,000 euros to 140,000,000 euros, with a premium of 249,885,000 euros, to be paid in
through the Transferral of the OVS-UPIM Business Unit by sole shareholder Gruppo Coin.
With effect from the final instant of 31 July 2014, OVS changed its legal form into a limited company
named "OVS S.p.A.".
Therefore, at the reporting date, the share capital, fully subscribed and paid in, amounted to
140,000,000 euros, represented by 140,000,000 ordinary shares with no par value.
18 Other reserves
The breakdown of other reserves is as follows:
The share premium reserve of 249.9 million euros resulted from the capital increase by OVS S.p.A., as
already mentioned.
There are also other reserves, with a net balance of 16.6 million euros, including the effects of direct
accounting in equity related to actuarial gains/(losses) for employee benefits, negative for 2.7 million
euros, and a positive amount of the cash flow hedge reserve for 19.3 million euros.
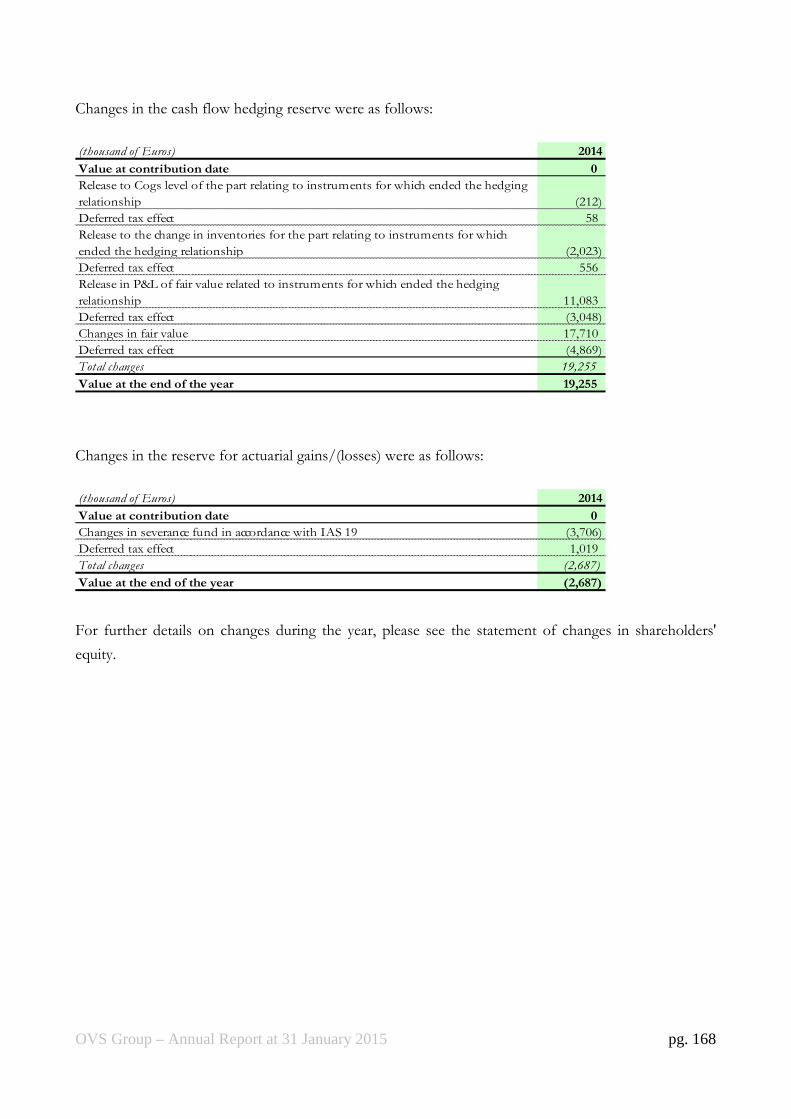
OVS Group – Annual Report at 31 January 2015 pg. 168
Changes in the cash flow hedging reserve were as follows:
(thousand of Euros) 2014
Value at contribution date 0
Release to Cogs level of the part relating to instruments for which ended the hedging
relationship (212)
Deferred tax effect 58
Release to the change in inventories for the part relating to instruments for which
ended the hedging relationship (2,023)
Deferred tax effect 556
Release in P&L of fair value related to instruments for which ended the hedging
relationship 11,083
Deferred tax effect (3,048)
Changes in fair value 17,710
Deferred tax effect (4,869)
Total changes 19,255
Value at the end of the year 19,255
Changes in the reserve for actuarial gains/(losses) were as follows:
(thousand of Euros) 2014
Value at contribution date 0
Changes in severance fund in accordance with IAS 19 (3,706)
Deferred tax effect 1,019
Total changes (2,687)
Value at the end of the year (2,687)
For further details on changes during the year, please see the statement of changes in shareholders'
equity.
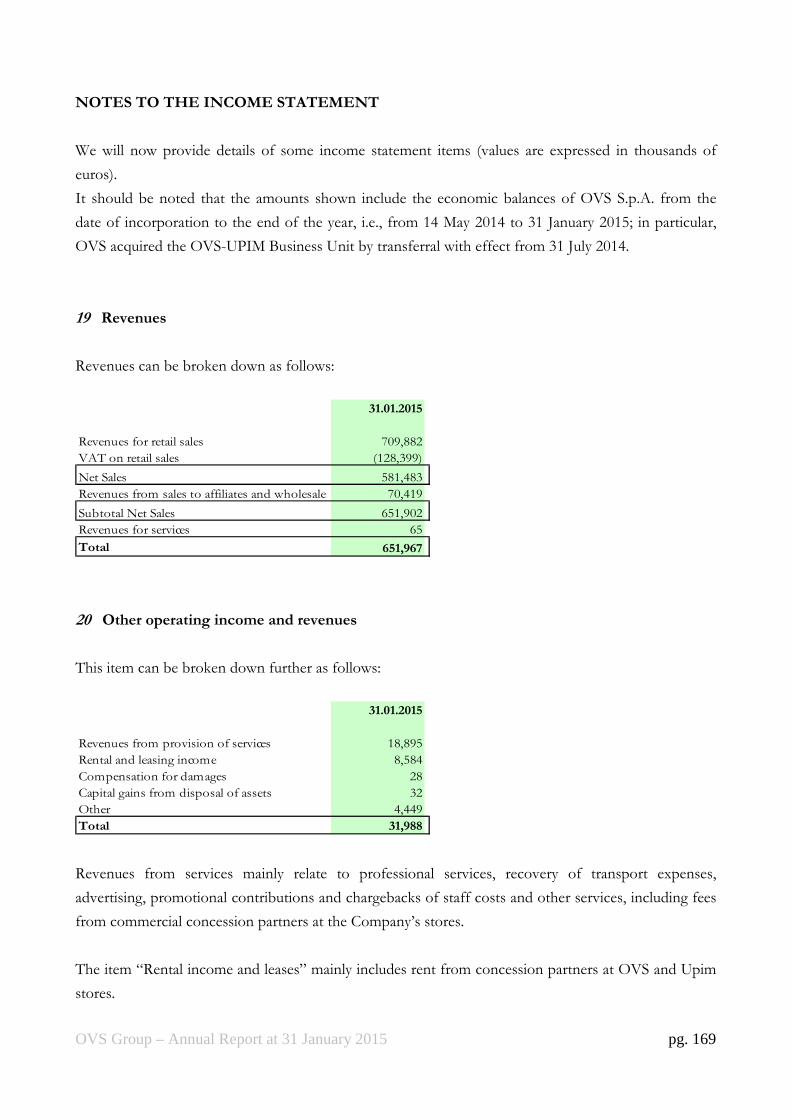
OVS Group – Annual Report at 31 January 2015 pg. 169
NOTES TO THE INCOME STATEMENT
We will now provide details of some income statement items (values are expressed in thousands of
euros).
It should be noted that the amounts shown include the economic balances of OVS S.p.A. from the
date of incorporation to the end of the year, i.e., from 14 May 2014 to 31 January 2015; in particular,
OVS acquired the OVS-UPIM Business Unit by transferral with effect from 31 July 2014.
19 Revenues
Revenues can be broken down as follows:
31.01.2015
Revenues for retail sales 709,882
VAT on retail sales (128,399)
Net Sales 581,483
Revenues from sales to affiliates and wholesale 70,419
Subtotal Net Sales 651,902
Revenues for services 65
Total 651,967
20 Other operating income and revenues
This item can be broken down further as follows:
31.01.2015
Revenues from provision of services 18,895
Rental and leasing income 8,584
Compensation for damages 28
Capital gains from disposal of assets 32
Other 4,449
Total 31,988
Revenues from services mainly relate to professional services, recovery of transport expenses,
advertising, promotional contributions and chargebacks of staff costs and other services, including fees
from commercial concession partners at the Company’s stores.
The item “Rental income and leases” mainly includes rent from concession partners at OVS and Upim
stores.
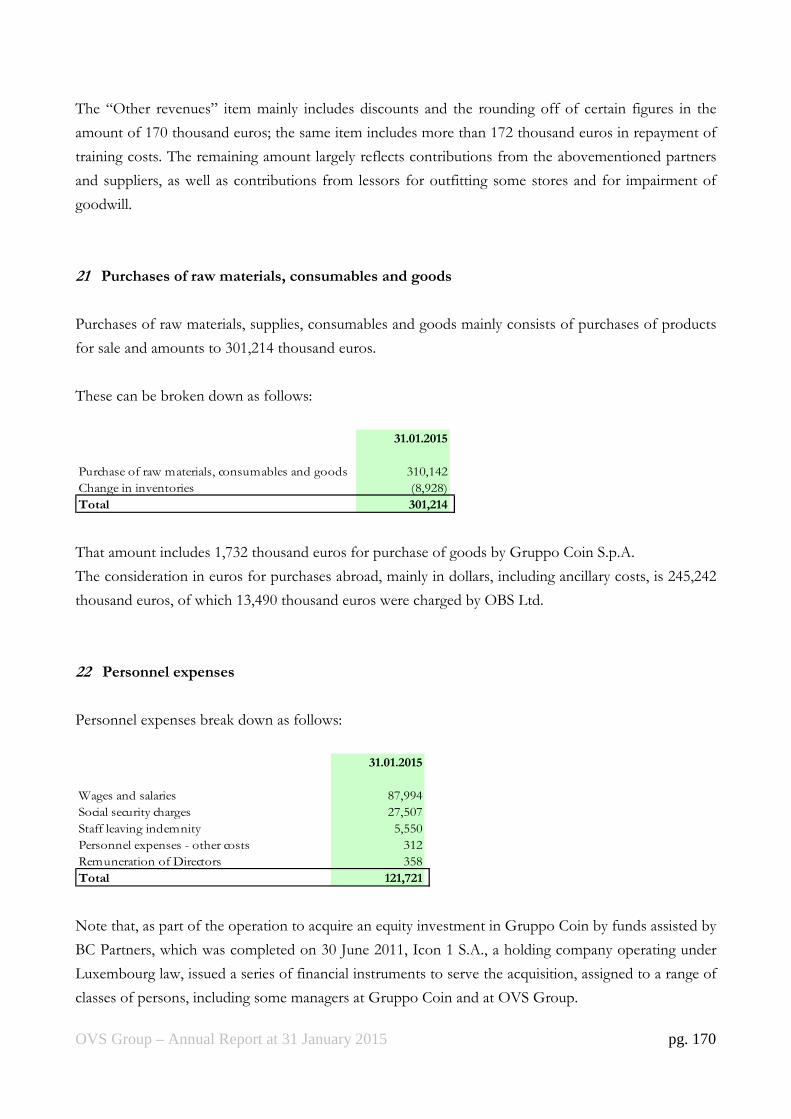
OVS Group – Annual Report at 31 January 2015 pg. 170
The “Other revenues” item mainly includes discounts and the rounding off of certain figures in the
amount of 170 thousand euros; the same item includes more than 172 thousand euros in repayment of
training costs. The remaining amount largely reflects contributions from the abovementioned partners
and suppliers, as well as contributions from lessors for outfitting some stores and for impairment of
goodwill.
21 Purchases of raw materials, consumables and goods
Purchases of raw materials, supplies, consumables and goods mainly consists of purchases of products
for sale and amounts to 301,214 thousand euros.
These can be broken down as follows:
31.01.2015
Purchase of raw materials, consumables and goods 310,142
Change in inventories (8,928)
Total 301,214
That amount includes 1,732 thousand euros for purchase of goods by Gruppo Coin S.p.A.
The consideration in euros for purchases abroad, mainly in dollars, including ancillary costs, is 245,242
thousand euros, of which 13,490 thousand euros were charged by OBS Ltd.
22 Personnel expenses
Personnel expenses break down as follows:
31.01.2015
Wages and salaries 87,994
Social security charges 27,507
Staff leaving indemnity 5,550
Personnel expenses - other costs 312
Remuneration of Directors 358
Total 121,721
Note that, as part of the operation to acquire an equity investment in Gruppo Coin by funds assisted by
BC Partners, which was completed on 30 June 2011, Icon 1 S.A., a holding company operating under
Luxembourg law, issued a series of financial instruments to serve the acquisition, assigned to a range of
classes of persons, including some managers at Gruppo Coin and at OVS Group.
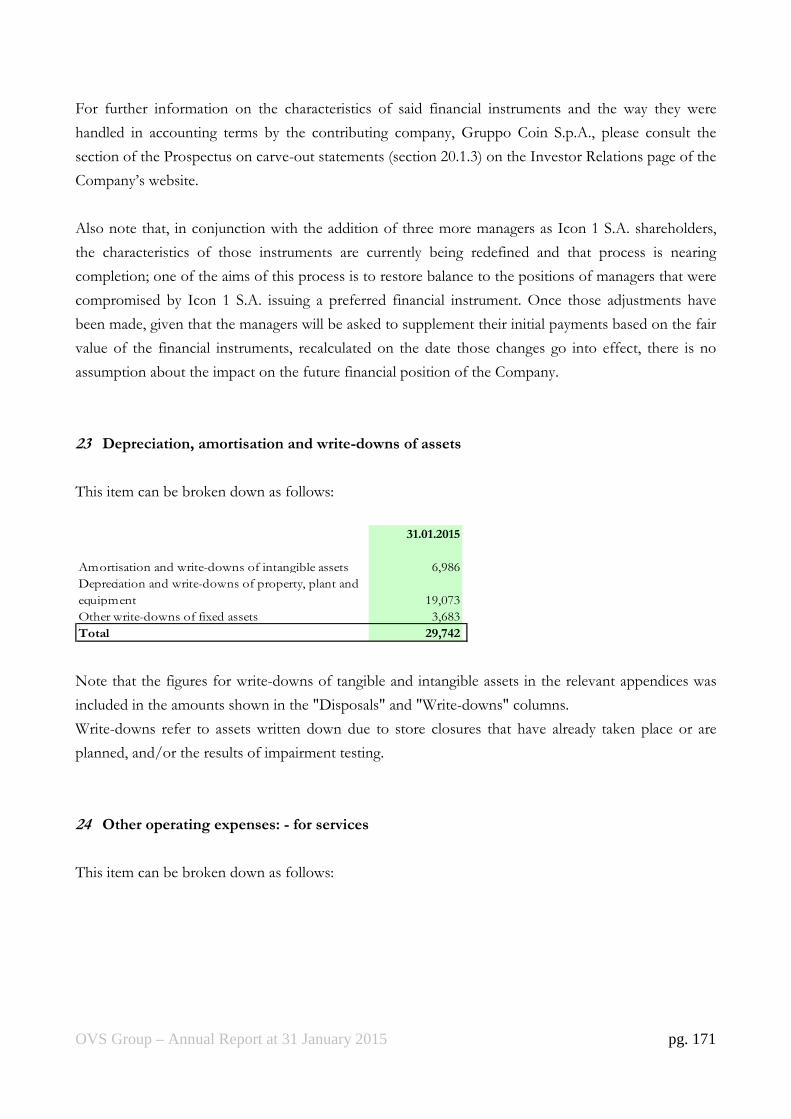
OVS Group – Annual Report at 31 January 2015 pg. 171
For further information on the characteristics of said financial instruments and the way they were
handled in accounting terms by the contributing company, Gruppo Coin S.p.A., please consult the
section of the Prospectus on carve-out statements (section 20.1.3) on the Investor Relations page of the
Company’s website.
Also note that, in conjunction with the addition of three more managers as Icon 1 S.A. shareholders,
the characteristics of those instruments are currently being redefined and that process is nearing
completion; one of the aims of this process is to restore balance to the positions of managers that were
compromised by Icon 1 S.A. issuing a preferred financial instrument. Once those adjustments have
been made, given that the managers will be asked to supplement their initial payments based on the fair
value of the financial instruments, recalculated on the date those changes go into effect, there is no
assumption about the impact on the future financial position of the Company.
23 Depreciation, amortisation and write-downs of assets
This item can be broken down as follows:
31.01.2015
Amortisation and write-downs of intangible assets 6,986
Depreciation and write-downs of property, plant and
equipment 19,073
Other write-downs of fixed assets 3,683
Total 29,742
Note that the figures for write-downs of tangible and intangible assets in the relevant appendices was
included in the amounts shown in the "Disposals" and "Write-downs" columns.
Write-downs refer to assets written down due to store closures that have already taken place or are
planned, and/or the results of impairment testing.
24 Other operating expenses: - for services
This item can be broken down as follows:
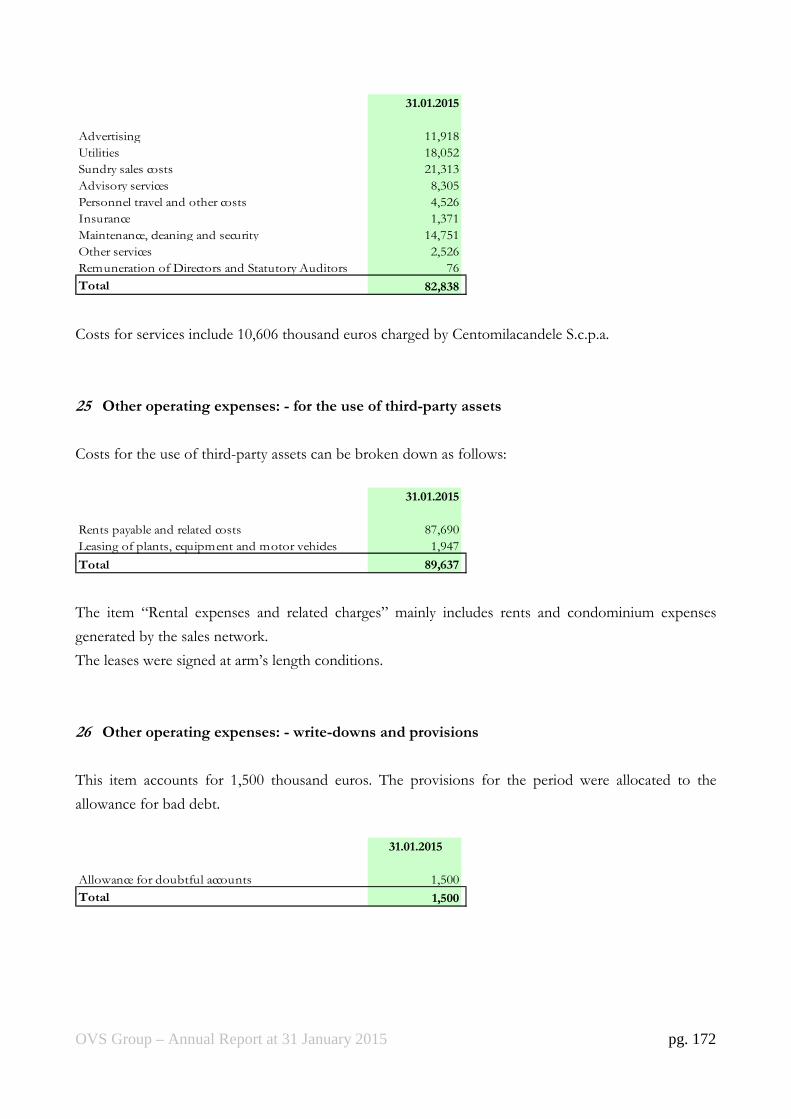
OVS Group – Annual Report at 31 January 2015 pg. 172
31.01.2015
Advertising 11,918
Utilities 18,052
Sundry sales costs 21,313
Advisory services 8,305
Personnel travel and other costs 4,526
Insurance 1,371
Maintenance, cleaning and security 14,751
Other services 2,526
Remuneration of Directors and Statutory Auditors 76
Total 82,838
Costs for services include 10,606 thousand euros charged by Centomilacandele S.c.p.a.
25 Other operating expenses: - for the use of third-party assets
Costs for the use of third-party assets can be broken down as follows:
31.01.2015
Rents payable and related costs 87,690
Leasing of plants, equipment and motor vehicles 1,947
Total 89,637
The item “Rental expenses and related charges” mainly includes rents and condominium expenses
generated by the sales network.
The leases were signed at arm’s length conditions.
26 Other operating expenses: - write-downs and provisions
This item accounts for 1,500 thousand euros. The provisions for the period were allocated to the
allowance for bad debt.
31.01.2015
Allowance for doubtful accounts 1,500
Total 1,500

OVS Group – Annual Report at 31 January 2015 pg. 173
27 Other operating expenses: - other operating charges
Other operating charges break down as follows:
31.01.2015
Other operating charges - material and equipment 3,077
Other operating charges - taxes and duties 4,850
Other operating charges - losses on assets 460
Other operating charges - charitable donations 110
Other operating charges - corporate expenses 160
Other operating costs - other admin. and general costs 524
Other operating costs - other smaller costs 699
Total 9,880
“Other operating charges” include 280 thousand euros for discounts, fines and rounding off of
numbers and 40 thousand euros for discounts on partner goods for customers in relation to specific
events; the item also includes a settlement agreement in the amount of 282 thousand euros with a lessor
and repayment of miscellaneous expenses.
28 Financial income (expenses)
Financial income
31.01.2015
Interest income on bank accounts 6
Miscellaneous financial income 6
Income from parent Company 3,660
Total 3,672
Financial expenses
31.01.2015
Financial charges due to parent Company 1,973
Interest expense on bank accounts 19
Financial charges on loans 43,141
Financial charges due to other financial creditors 265
Interest cost on severance indemnity fund 186
Other financial charges 2,860
Total 48,444
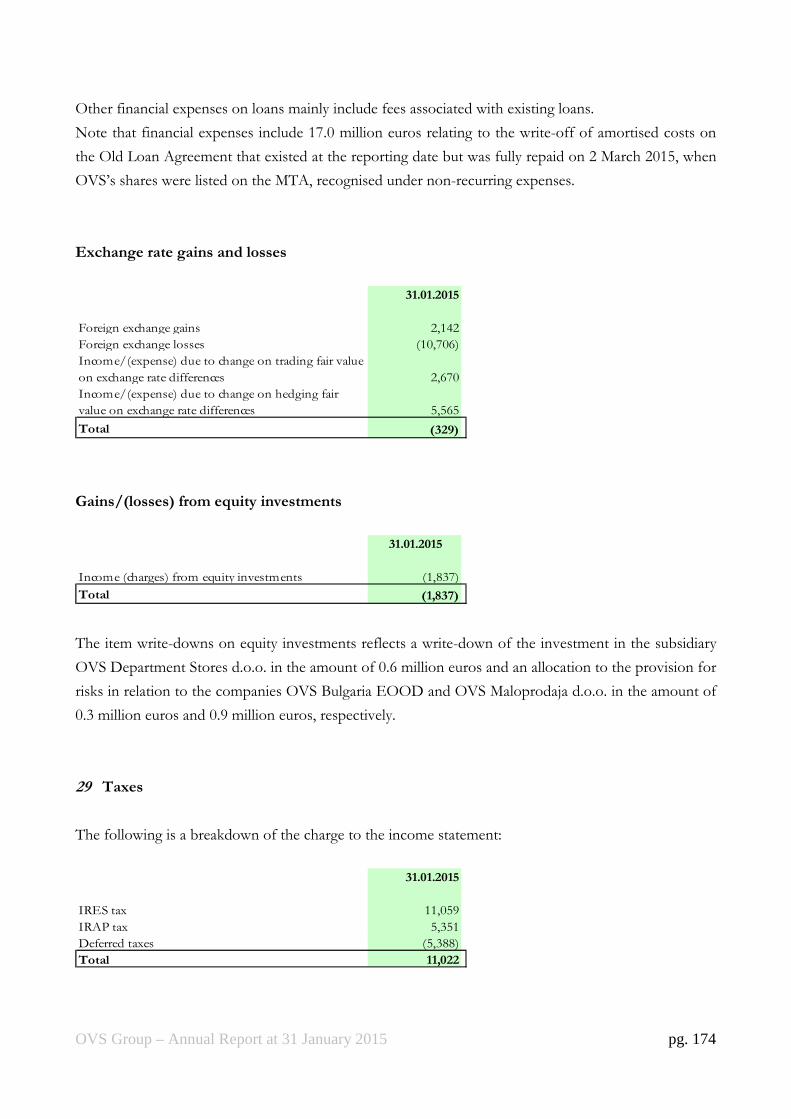
OVS Group – Annual Report at 31 January 2015 pg. 174
Other financial expenses on loans mainly include fees associated with existing loans.
Note that financial expenses include 17.0 million euros relating to the write-off of amortised costs on
the Old Loan Agreement that existed at the reporting date but was fully repaid on 2 March 2015, when
OVS’s shares were listed on the MTA, recognised under non-recurring expenses.
Exchange rate gains and losses
31.01.2015
Foreign exchange gains 2,142
Foreign exchange losses (10,706)
Income/(expense) due to change on trading fair value
on exchange rate differences 2,670
Income/(expense) due to change on hedging fair
value on exchange rate differences 5,565
Total (329)
Gains/(losses) from equity investments
31.01.2015
Income (charges) from equity investments (1,837)
Total (1,837)
The item write-downs on equity investments reflects a write-down of the investment in the subsidiary
OVS Department Stores d.o.o. in the amount of 0.6 million euros and an allocation to the provision for
risks in relation to the companies OVS Bulgaria EOOD and OVS Maloprodaja d.o.o. in the amount of
0.3 million euros and 0.9 million euros, respectively.
29 Taxes
The following is a breakdown of the charge to the income statement:
31.01.2015
IRES tax 11,059
IRAP tax 5,351
Deferred taxes (5,388)
Total 11,022
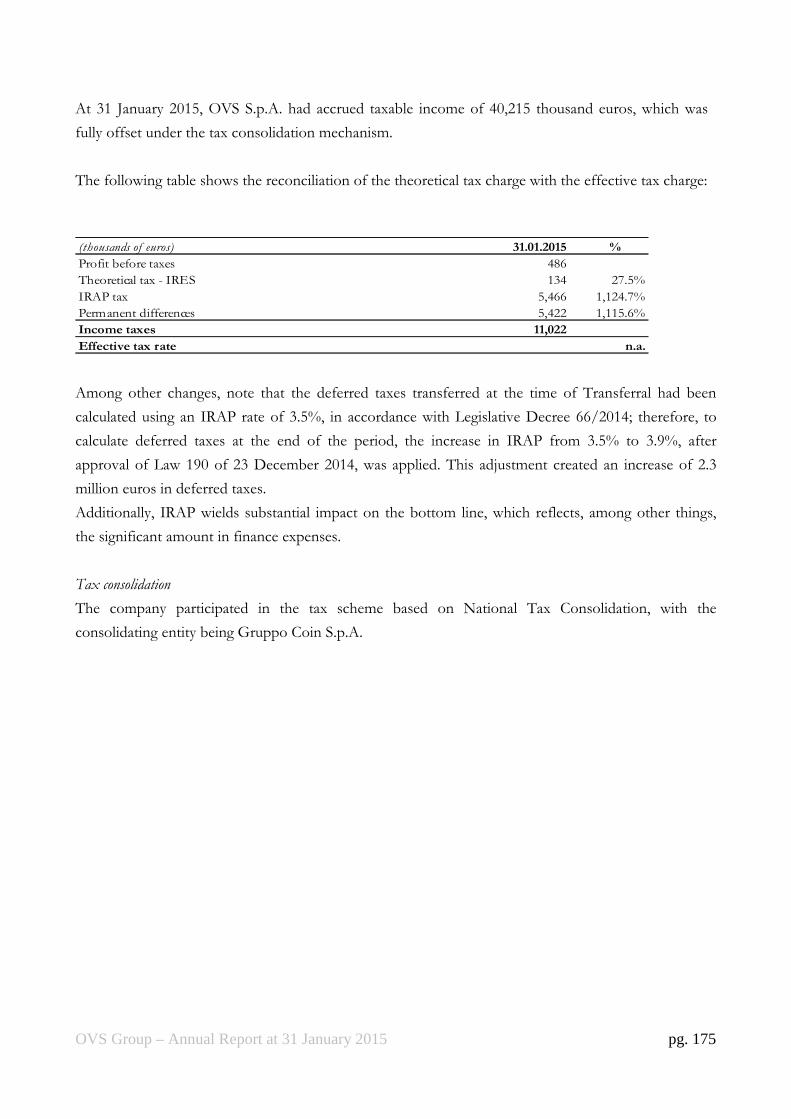
OVS Group – Annual Report at 31 January 2015 pg. 175
At 31 January 2015, OVS S.p.A. had accrued taxable income of 40,215 thousand euros, which was
fully offset under the tax consolidation mechanism.
The following table shows the reconciliation of the theoretical tax charge with the effective tax charge:
(thousands of euros) 31.01.2015 %
Profit before taxes 486
Theoretical tax - IRES 134 27.5%
IRAP tax 5,466 1,124.7%
Permanent differences 5,422 1,115.6%
Income taxes 11,022
Effective tax rate n.a.
Among other changes, note that the deferred taxes transferred at the time of Transferral had been
calculated using an IRAP rate of 3.5%, in accordance with Legislative Decree 66/2014; therefore, to
calculate deferred taxes at the end of the period, the increase in IRAP from 3.5% to 3.9%, after
approval of Law 190 of 23 December 2014, was applied. This adjustment created an increase of 2.3
million euros in deferred taxes.
Additionally, IRAP wields substantial impact on the bottom line, which reflects, among other things,
the significant amount in finance expenses.
Tax consolidation
The company participated in the tax scheme based on National Tax Consolidation, with the
consolidating entity being Gruppo Coin S.p.A.
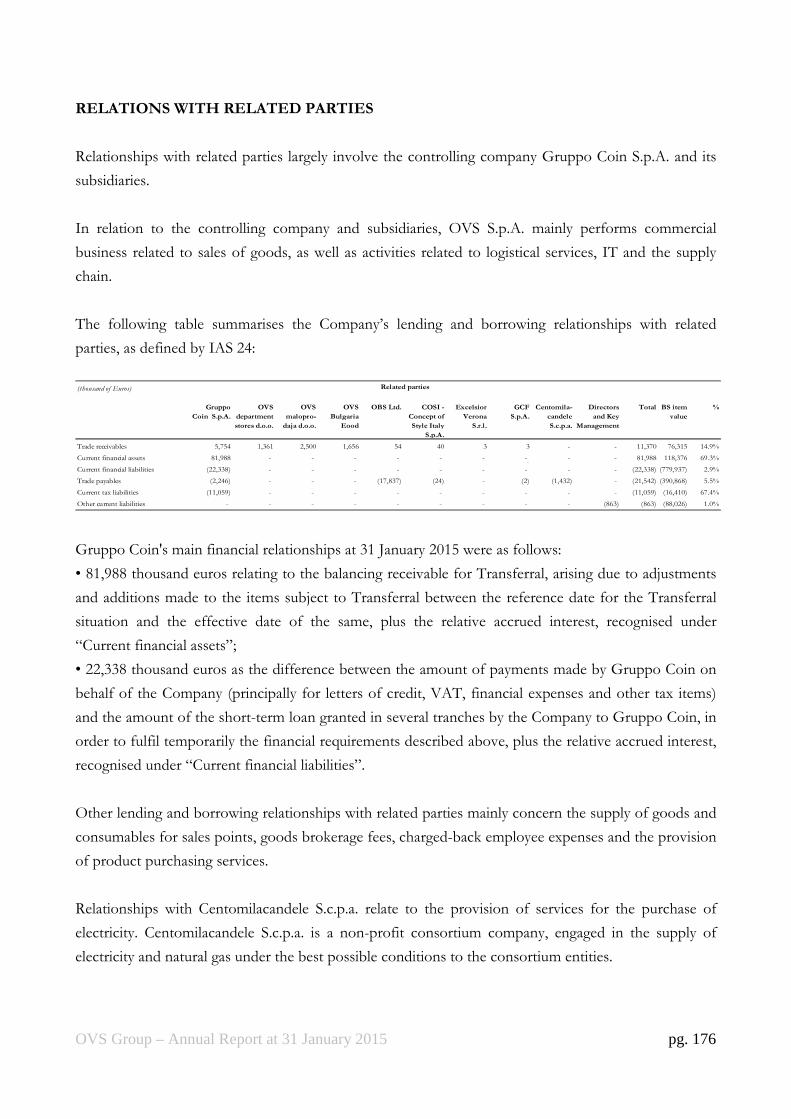
OVS Group – Annual Report at 31 January 2015 pg. 176
RELATIONS WITH RELATED PARTIES
Relationships with related parties largely involve the controlling company Gruppo Coin S.p.A. and its
subsidiaries.
In relation to the controlling company and subsidiaries, OVS S.p.A. mainly performs commercial
business related to sales of goods, as well as activities related to logistical services, IT and the supply
chain.
The following table summarises the Company’s lending and borrowing relationships with related
parties, as defined by IAS 24:
(thousand of Euros)
Gruppo
Coin S.p.A.
OVS
department
stores d.o.o.
OVS
malopro-
daja d.o.o.
OVS
Bulgaria
Eood
OBS Ltd. COSI -
Concept of
Style Italy
S.p.A.
Excelsior
Verona
S.r.l.
GCF
S.p.A.
Centomila-
candele
S.c.p.a.
Directors
and Key
Management
Total BS item
value
%
Trade receivables 5,754 1,361 2,500 1,656 54 40 3 3 - - 11,370 76,315 14.9%
Current financial assets 81,988 - - - - - - - - - 81,988 118,376 69.3%0
Current financial liabilities (22,338) - - - - - - - - - (22,338) (779,937) 2.9%
Trade payables (2,246) - - - (17,837) (24) - (2) (1,432) - (21,542) (390,868) 5.5%
Current tax liabilities (11,059) - - - - - - - - - (11,059) (16,410) 67.4%
Other current liabilities - - - - - - - - - (863) (863) (88,026) 1.0%
Related parties
Gruppo Coin's main financial relationships at 31 January 2015 were as follows:
• 81,988 thousand euros relating to the balancing receivable for Transferral, arising due to adjustments
and additions made to the items subject to Transferral between the reference date for the Transferral
situation and the effective date of the same, plus the relative accrued interest, recognised under
“Current financial assets”;
• 22,338 thousand euros as the difference between the amount of payments made by Gruppo Coin on
behalf of the Company (principally for letters of credit, VAT, financial expenses and other tax items)
and the amount of the short-term loan granted in several tranches by the Company to Gruppo Coin, in
order to fulfil temporarily the financial requirements described above, plus the relative accrued interest,
recognised under “Current financial liabilities”.
Other lending and borrowing relationships with related parties mainly concern the supply of goods and
consumables for sales points, goods brokerage fees, charged-back employee expenses and the provision
of product purchasing services.
Relationships with Centomilacandele S.c.p.a. relate to the provision of services for the purchase of
electricity. Centomilacandele S.c.p.a. is a non-profit consortium company, engaged in the supply of
electricity and natural gas under the best possible conditions to the consortium entities.
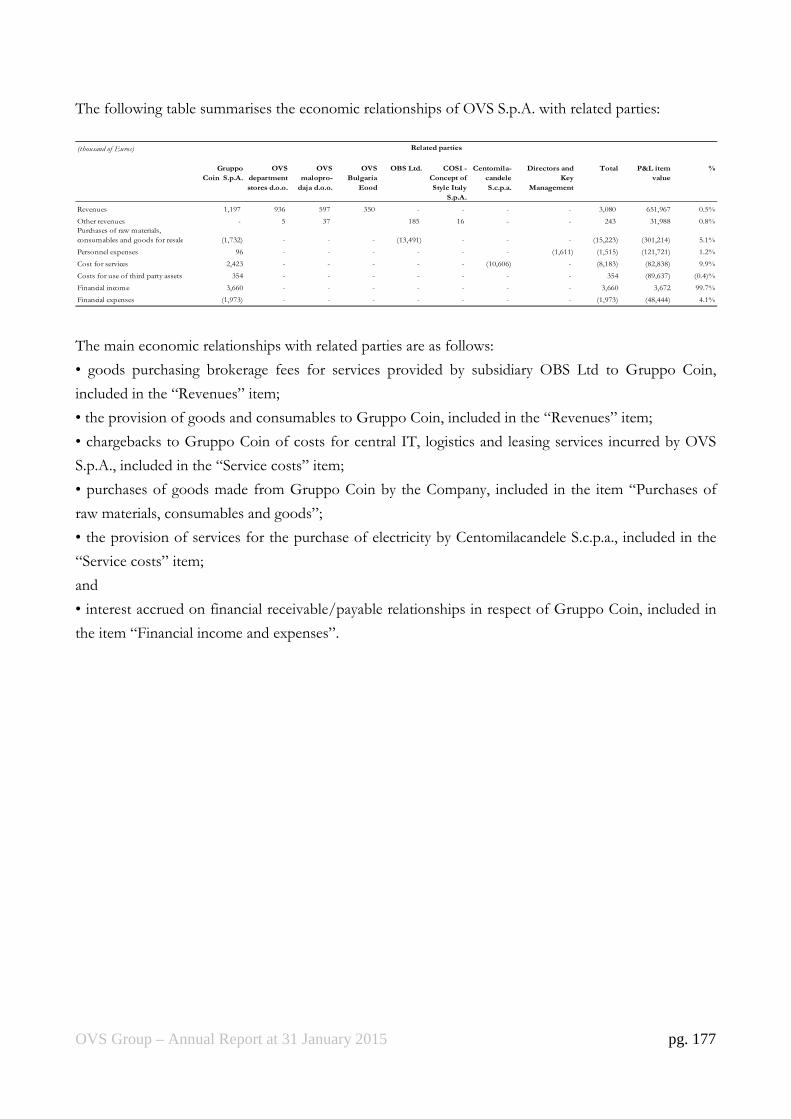
OVS Group – Annual Report at 31 January 2015 pg. 177
The following table summarises the economic relationships of OVS S.p.A. with related parties:
(thousand of Euros)
Gruppo
Coin S.p.A.
OVS
department
stores d.o.o.
OVS
malopro-
daja d.o.o.
OVS
Bulgaria
Eood
OBS Ltd. COSI -
Concept of
Style Italy
S.p.A.
Centomila-
candele
S.c.p.a.
Directors and
Key
Management
Total P&L item
value
%
Revenues 1,197 936 597 350 - - - - 3,080 651,967 0.5%
Other revenues - 5 37 185 16 - - 243 31,988 0.8%
Purchases of raw materials,
consumables and goods for resale (1,732) - - - (13,491) - - - (15,223) (301,214) 5.1%
Personnel expenses 96 - - - - - - (1,611) (1,515) (121,721) 1.2%
Cost for services 2,423 - - - - - (10,606) - (8,183) (82,838) 9.9%
Costs for use of third party assets 354 - - - - - - - 354 (89,637) (0.4)%
Financial income 3,660 - - - - - - - 3,660 3,672 99.7%
Financial expenses (1,973) - - - - - - - (1,973) (48,444) 4.1%
Related parties
The main economic relationships with related parties are as follows:
• goods purchasing brokerage fees for services provided by subsidiary OBS Ltd to Gruppo Coin,
included in the “Revenues” item;
• the provision of goods and consumables to Gruppo Coin, included in the “Revenues” item;
• chargebacks to Gruppo Coin of costs for central IT, logistics and leasing services incurred by OVS
S.p.A., included in the “Service costs” item;
• purchases of goods made from Gruppo Coin by the Company, included in the item “Purchases of
raw materials, consumables and goods”;
• the provision of services for the purchase of electricity by Centomilacandele S.c.p.a., included in the
“Service costs” item;
and
• interest accrued on financial receivable/payable relationships in respect of Gruppo Coin, included in
the item “Financial income and expenses”.

OVS Group – Annual Report at 31 January 2015 pg. 178
Cash flows as per the following chart represent the effective payments and cash received, booked with
related parties, they have not to be intended as changes on the items of the financial statement occurred
during the year 2014.
(thousands of Euros)
Gruppo
Coin S.p.A.
OVS
department
stores d.o.o.
OVS
malopro-
daja d.o.o.
OVS
Bulgaria
Eood
OBS Ltd. Centomila-
candele
S.c.p.a.
Directors
and Key
Management
Total Total cash
flow as per
cash flow
statement %
Cash flow generated/(absorbed) by
changes in working activity (24,380) 1,919 759 179 (4,433) (11,507) (1,387) (38,850) 128,577 (30.2)%
Cash flow generated/(absorbed) by
changes in financing activity 12,572 - - - - - 12,572 (56,483) (22.3)%
Related parties
The transactions listed above took place under arm’s length conditions.

OVS Group – Annual Report at 31 January 2015 pg. 179
OTHER INFORMATION
Contingent liabilities
With reference to the potential liability arising from the Limoni S.p.A. legal dispute described in the
Prospectus, it should be noted that on 4 December 2014 the dispute between the parties concluded as a
result of signing of a settlement agreement.
For more detail please refer to "Trade receivables" above.
Sureties and guarantees granted to third parties
These came to 47,698 thousand euros and were granted on behalf of OVS by banks or insurance
companies, mainly to guarantee Italian leases.
Other commitments
These are commitments for lease payments on stores and warehouses to be settled within the
contractual deadlines, with or without a termination clause. In the vast majority of contracts, this clause
is assumed to cover a period of 12 months. The consequent commitment relates to one year’s rent and
amounts to 156.2 million euros.
Payment to Directors and Statutory auditors
The table below breaks down payments to Directors and Statutory auditors, regarding their respective
functions in OVS S.p.A. :
(thousands of Euros)Directors
Statutory
Auditors
Jan 31, 2015 288 76
Transactions resulting from atypical and/or unusual operations
Pursuant to the Consob Communication of 28 July 2006, there were no atypical and/or unusual
operations as defined in that Communication in year 2014.
Non-recurring events and transactions
Pursuant to the Consob Communication of 28 July 2006, the Company’s 2014 figures reflect non-
recurring expenses of 24,246 thousand euros.
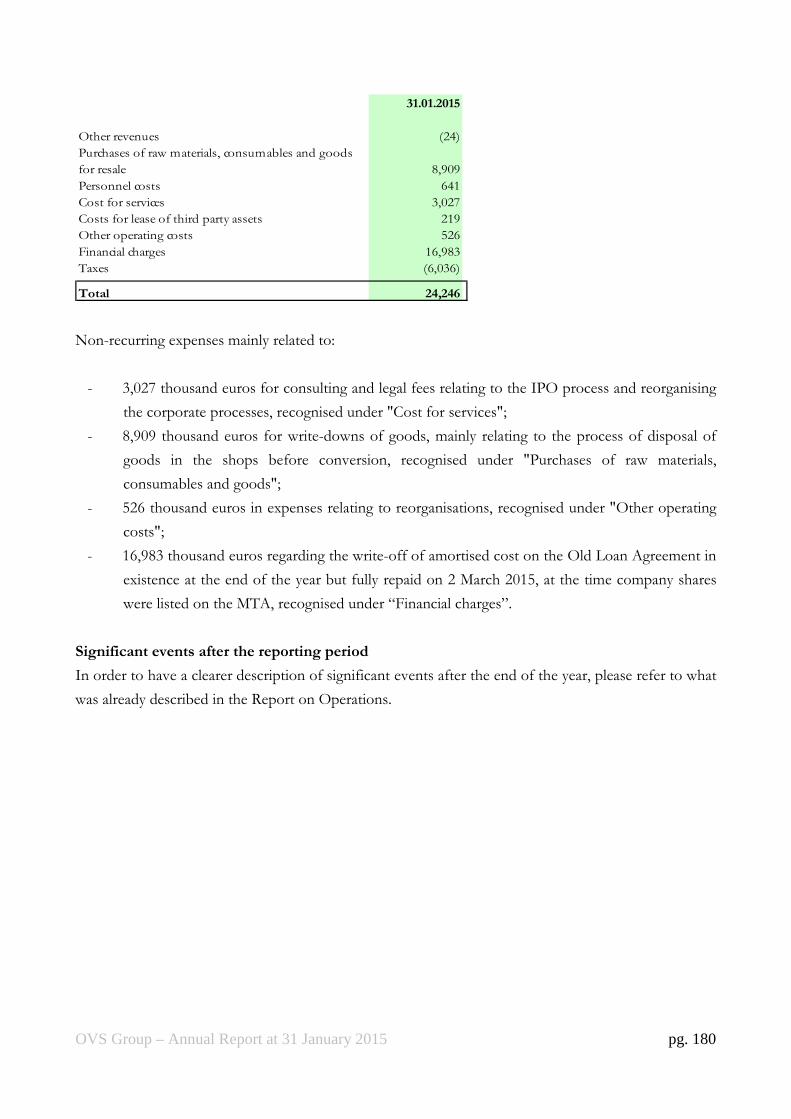
OVS Group – Annual Report at 31 January 2015 pg. 180
31.01.2015
Other revenues (24)
Purchases of raw materials, consumables and goods
for resale 8,909
Personnel costs 641
Cost for services 3,027
Costs for lease of third party assets 219
Other operating costs 526
Financial charges 16,983
Taxes (6,036)
Total 24,246
Non-recurring expenses mainly related to:
- 3,027 thousand euros for consulting and legal fees relating to the IPO process and reorganising
the corporate processes, recognised under "Cost for services";
- 8,909 thousand euros for write-downs of goods, mainly relating to the process of disposal of
goods in the shops before conversion, recognised under "Purchases of raw materials,
consumables and goods";
- 526 thousand euros in expenses relating to reorganisations, recognised under "Other operating
costs";
- 16,983 thousand euros regarding the write-off of amortised cost on the Old Loan Agreement in
existence at the end of the year but fully repaid on 2 March 2015, at the time company shares
were listed on the MTA, recognised under “Financial charges”.
Significant events after the reporting period
In order to have a clearer description of significant events after the end of the year, please refer to what
was already described in the Report on Operations.
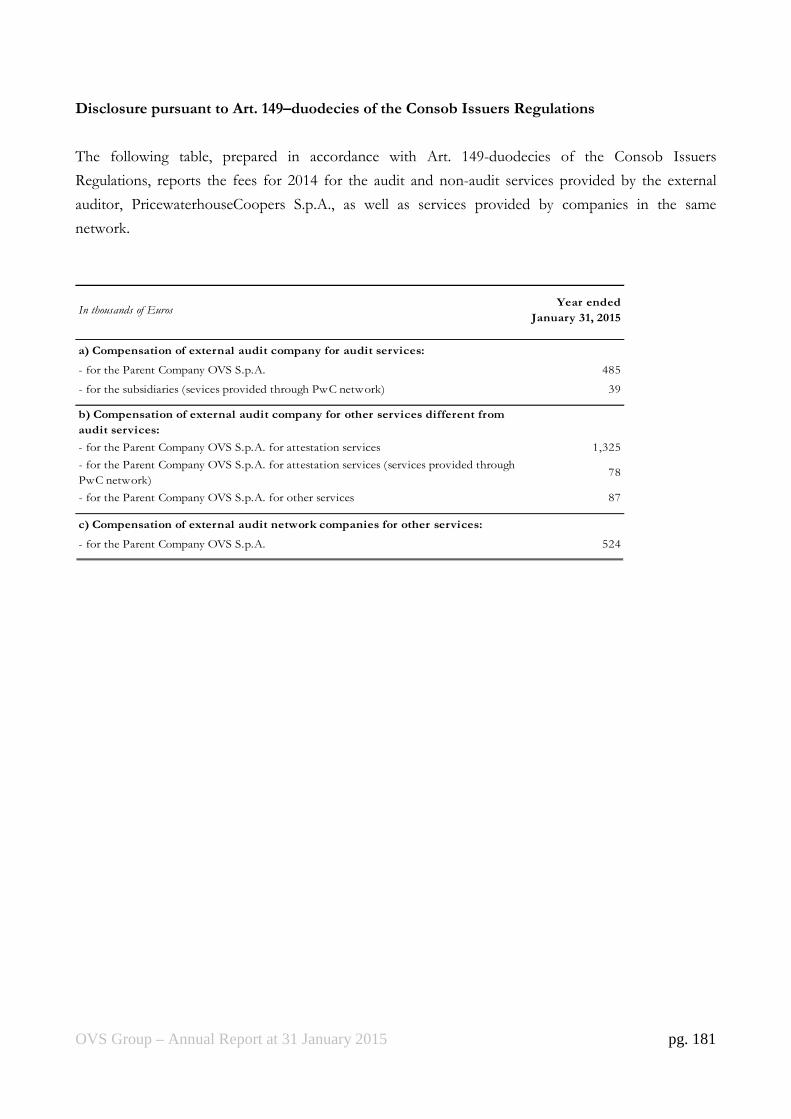
OVS Group – Annual Report at 31 January 2015 pg. 181
Disclosure pursuant to Art. 149–duodecies of the Consob Issuers Regulations
The following table, prepared in accordance with Art. 149-duodecies of the Consob Issuers
Regulations, reports the fees for 2014 for the audit and non-audit services provided by the external
auditor, PricewaterhouseCoopers S.p.A., as well as services provided by companies in the same
network.
In thousands of EurosYear ended
January 31, 2015
a) Compensation of external audit company for audit services:
- for the Parent Company OVS S.p.A. 485
- for the subsidiaries (sevices provided through PwC network) 39
b) Compensation of external audit company for other services different from
audit services:
- for the Parent Company OVS S.p.A. for attestation services 1,325
- for the Parent Company OVS S.p.A. for attestation services (services provided through
PwC network)78
- for the Parent Company OVS S.p.A. for other services 87
c) Compensation of external audit network companies for other services:
- for the Parent Company OVS S.p.A. 524

OVS Group – Annual Report at 31 January 2015 pg. 182
APPENDICES TO THE SEPARATE FINANCIAL STATEMENTS
The following documents contain additional information on the separate financial statements for the
year ended 31 January 2015.
Appendices:
1) Property, plant and equipment at 31 January 2015;
2) Intangible fixed assets at 31 January 2015;
3) Equity investments and financial assets;
4) Breakdown of equity investments;
5) List of equity investments in subsidiary and associate Companies;
6) Schedule of the origin, usability and distributability of the shareholders’ equity items.

OVS Group – Annual Report at 31 January 2015 pg. 183
Appendix 1
Tangible fixed assets
The breakdown of and the changes occurring in these assets during the year were as follows (€ thousands):
AcquisitionsDisposals/
divestments
Amortization/
writedowns
Leasehold improvements
original cost 188,608 2,664 (1,492) 0 189,780
depreciation 0 0 0 0 0
amortization (137,393) 0 1,434 (4,108) (140,067)
Net 51,215 2,664 (58) (4,108) 49,713
Land and buildings
original cost 33,466 97 0 0 33,563
depreciation 0 0 0 0 0
amortization (6,869) 0 0 (357) (7,226)
Net 26,597 97 0 (357) 26,337
Plant and machinery
original cost 257,772 7,236 (2,054) 0 262,954
depreciation 0 0 0 0 0
amortization (184,088) 0 1,809 (5,937) (188,216)
Net 73,684 7,236 (245) (5,937) 74,738
Industrial and commercial equipment
original cost 279,848 21,115 (4,280) 0 296,683
depreciation 0 0 0 0 0
amortization (210,643) 0 4,036 (7,943) (214,550)
Net 69,205 21,115 (244) (7,943) 82,133
Other tangible assets
original cost 54,577 904 (720) 0 54,761
depreciation 0 0 0 0 0
amortization (50,510) 0 404 (728) (50,834)
Net 4,067 904 (316) (728) 3,927
Assets in progress and advances
original cost 4,775 2,098 (3,881) 0 2,992
depreciation 0 0 0 0 0
amortization 0 0 0 0 0
Net 4,775 2,098 (3,881) (1) 0 2,992
Total
original cost 819,046 34,114 (12,427) 0 840,733
depreciation 0 0 0 0 0
amortization (589,503) 0 7,683 (19,073) (600,893)
Net 229,543 34,114 (4,744) (2) (19,073) 239,840
(2) Including 373 thousands of Euros related to write-downs or assets depreciation due to closures of stores during the year.
Contribution
value
Changes occured during the year
As at 31.01.2015
(1) Including 3,881 thousands of Euros of assets in progress as at 31/07/2014, reclassified to the specific asset categories during FY 2014.
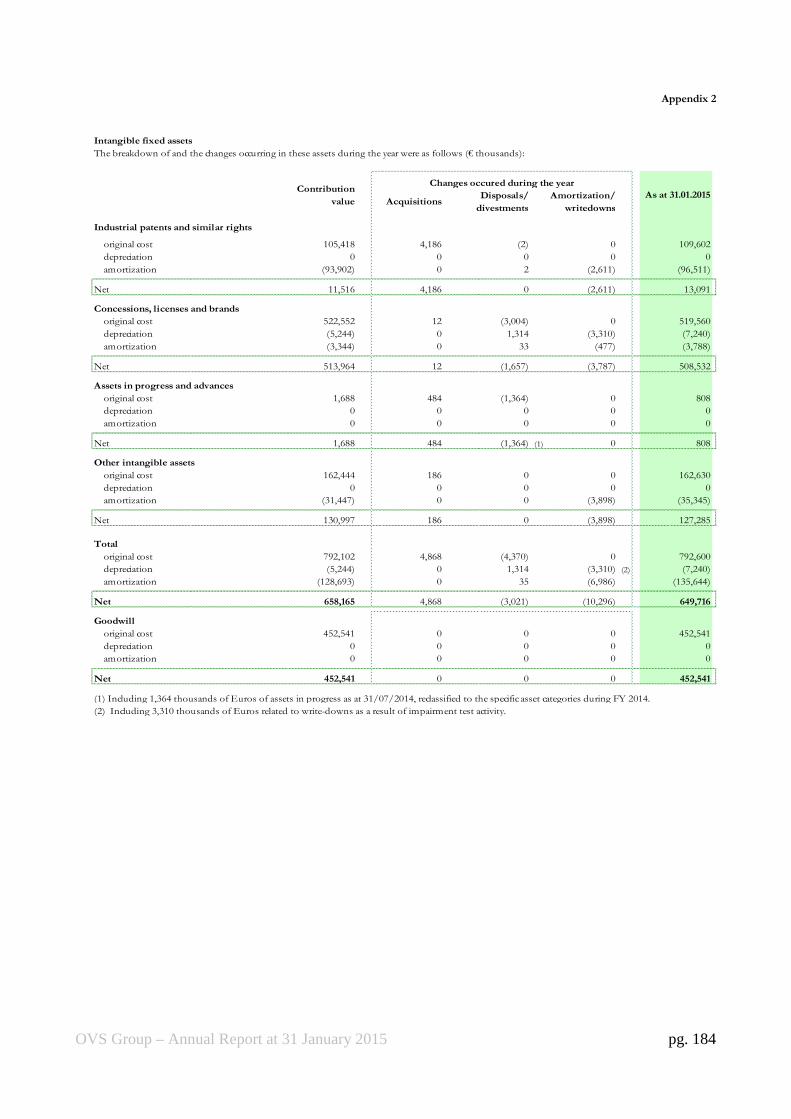
OVS Group – Annual Report at 31 January 2015 pg. 184
Appendix 2
Intangible fixed assets
The breakdown of and the changes occurring in these assets during the year were as follows (€ thousands):
AcquisitionsDisposals/
divestments
Amortization/
writedowns
Industrial patents and similar rights
original cost 105,418 4,186 (2) 0 109,602
depreciation 0 0 0 0 0
amortization (93,902) 0 2 (2,611) (96,511)
Net 11,516 4,186 0 (2,611) 13,091
Concessions, licenses and brands
original cost 522,552 12 (3,004) 0 519,560
depreciation (5,244) 0 1,314 (3,310) (7,240)
amortization (3,344) 0 33 (477) (3,788)
Net 513,964 12 (1,657) (3,787) 508,532
Assets in progress and advances
original cost 1,688 484 (1,364) 0 808
depreciation 0 0 0 0 0
amortization 0 0 0 0 0
Net 1,688 484 (1,364) (1) 0 808
Other intangible assets
original cost 162,444 186 0 0 162,630
depreciation 0 0 0 0 0
amortization (31,447) 0 0 (3,898) (35,345)
Net 130,997 186 0 (3,898) 127,285
Total
original cost 792,102 4,868 (4,370) 0 792,600
depreciation (5,244) 0 1,314 (3,310) (2) (7,240)
amortization (128,693) 0 35 (6,986) (135,644)
Net 658,165 4,868 (3,021) (10,296) 649,716
Goodwill
original cost 452,541 0 0 0 452,541
depreciation 0 0 0 0 0
amortization 0 0 0 0 0
Net 452,541 0 0 0 452,541
Contribution
value
(1) Including 1,364 thousands of Euros of assets in progress as at 31/07/2014, reclassified to the specific asset categories during FY 2014.
(2) Including 3,310 thousands of Euros related to write-downs as a result of impairment test activity.
Changes occured during the year
As at 31.01.2015

OVS Group – Annual Report at 31 January 2015 pg. 185
Appendix 3
Equity investments
The breakdown of and the changes occurring during the year were as follows (€ thousands):
Increases Decreases
Investments in subsidiaries
acquisitions / disposals 8,318 986 0 9,304
revaluations / (writedowns) 0 0 (588) (588)
Net value 8,318 986 (588) 8,716
Investments in associates
acquisitions / disposals 136 0 0 136
revaluations / (writedowns) 0 0 0 0
Net value 136 0 0 136
Total
acquisitions / disposals 8,454 986 0 9,440
revaluations / (writedowns) 0 0 (588) (588)
Net value 8,454 986 (588) 8,852
As at
31.01.2015
Changes occured during the year
Contribution
value

OVS Group – Annual Report at 31 January 2015 pg. 186
Appendix 4
Breakdown of equity investments at Jan 31, 2015
(€ values)
Subsidiary Companies
Oriental Buying Services Ltd 8,226,919 8,226,919 100%
OVS Department Stores d.o.o. 91,349 985,922 (588,000) 489,271 100%
OVS Bulgaria EOOD 0 0 100%
OVS Maloprodaja d.o.o. 0 0 100%
8,318,268 985,922 (588,000) 8,716,190
Associate Company
Centomilacandele S.c.p.A. 136,313 136,313 31.63%
136,313 0 0 136,313
TOTAL VALUES 8,454,581 985,922 (588,000) 8,852,503
Contribution
value Increases Writedowns
As at
31.01.2015 %

OVS Group – Annual Report at 31 January 2015 pg. 187
Appendix 5
List of Equity investments in subsidiary and associate Companies
(€ values)
Name Registered office
ORIENTAL BUYING SERVICES LTD HONG KONG 100 8,226,919 56,419 16,813,446 20,151,602 20,151,602
OVS DEPARTMENT STORES D.O.O. BELGRADE 100 489,271 5,707,215 (845,606) 288,945 288,945
OVS BULGARIA EOOD SOFIA 100 0 10,226 (443,215) (1,310,247) (1,310,247)
OVS MALOPRODAJA D.O.O. ZAGREB 100 0 2,619 (1,295,611) (1,343,909) (1,343,909)
CENTOMILACANDELE S.C.P.A. MILAN 31.63 136,313 300,000 10,412 514,981 162,888
TOTAL VALUES 8,852,503 6,076,479 14,239,426 18,301,371 17,949,278
% interest
held
Net Equity
ownedNet EquityNet resultShare capital
Equity
investment
value

OVS Group – Annual Report at 31 January 2015 pg. 188
Appendix 6
Schedule of the origin, usability and distributability of the shareholders' equity items
(thousands of euros)
AmountPossibility
of use (*)
Amount
available
Share capital 140,000 B -
Legal reserve - B -
Share premium reserve 249,885 A, B, C 249,885
Cash flow hedge reserve 19,255 -
Total 409,140 249,885
(*) A: for share capital increase, B: to cover losses, C: for distribution to shareholders

OVS Group – Annual Report at 31 January 2015 pg. 189
Certification of the separate Financial Statements pursuant to article 81-ter
of Consob Regulation 11971 of 14 May 1999, as subsequently amended and supplemented
1. We, the undersigned, Stefano Beraldo, in his capacity as Chief Executive Officer, and Nicola Perin, in his
capacity as Director responsible for preparing the corporate accounting statements of OVS S.p.A., hereby
declare, also taking account of article 154-bis, paragraphs 3 and 4, of Legislative Decree 58 of 24 February
1998:
• the suitability in relation to characteristics of the Company, and
• the effective application
of the administrative and accounting procedures for the preparation of the separate financial statements for
the period ended 31 January 2015.
2. The CFO (“Manager in charge of the preparation of the company financial reports” as identified by the company’s
articles of association), with the support of a Team composed by internal and external resources, has
assessed the design adequacy and the operational effectiveness of the OVS S.p.A.’s Internal Control System
over Financial Reporting (ICFR), through the set up of a company framework based on the CoSO
framework (Committee of Sponsoring Organizations of the Treadway Commission) and in accordance with
international standards and best practices. According to CFO’s Compliance Program supporting the
declaration, OVS S.p.A. framework is focused on key controls, which should be able to mitigate adequately
the risks over company financial reporting, in accordance with the company risk profile.
3. Moreover:
3.1 the separate financial statements:
a) were prepared in compliance with the international accounting standards recognised by the
European Community pursuant to (EC) Regulation 1606/2002 of the European Parliament and
of the Council of 19 July 2002;
b) correspond to the accounting books and records;
c) are suitable to provide a true and fair representation of the financial position, income and cash
flows performance of the issuer.
3.2 The Report on Operations includes a reliable analysis of the performance and operating results, as
well as the situation, of the issuer, as well as a description of the main risks and uncertainties to which
it is exposed.
Venice – Mestre, 22 April 2015
Stefano Beraldo Nicola Perin
Chief Executive Officer Director responsible for preparing the corporate accounting statements