capitaldrilling · opportunity with bhp billiton in ethiopia. the group’s revenue growth was very...
TRANSCRIPT
CAPITALDRILLINGannual report 2011
01 Corporate Profile
02 Our Global Footprint
04 Financial Highlights
06 Chairman’s Statement
08 Chief Executive Review
11 Chief Financial Officer’s Report
15 Directors’ Profiles
17 Financial Contents
Contents
Capital Drilling LimitedBermuda registered number 34477
Directors
Jamie Boyton Executive Chairman
Brian Rudd Executive Director
David Payne Chief Financial Officer
Tim Read Senior Independent Non-Executive Director
Alex Davidson Independent Non-Executive Director
Craig Burton Non-Executive Director
Company Secretary
David Payne
Registered OfficeCanon’s Court, 22 Victoria Street, Hamilton HM12, Bermuda
Corporate Office 90B Amoy StreetSingapore 069909Tel: +65 6227 9050Fax: +65 6227 9089
Corporate Directory
RegistrarsComputershare Investor Services (Jersey) Limited31 Pier Road, St Helier, Jersey JE4 8PW
AuditorDeloitte & ToucheDeloitte Place Building 2, The Woodlands, 20 Woodlands Drive, Woodmead, 2052, South Africa
BankersBank of Bermuda6 Front Street, Hamilton HM11, Bermuda
Standard Bank (Mauritius) Limited6th Floor, Médine Mews BuildingChaussee Street, Port Louis, Mauritius
Investor RelationsBuchanan107 Cheapside, London, E2CV 6DN
BrokersLiberum Capital LimitedRopemaker Place, Level 12, 25 Ropemaker Street, London, EC2Y 9LY
Canaccord Genuity LimitedCardinal Place, 7th Floor, 80 Victoria Street, London, SWIE 5JL
Websitewww.capdrill.com
Capital Drilling limiteD Annual Report 2011 01
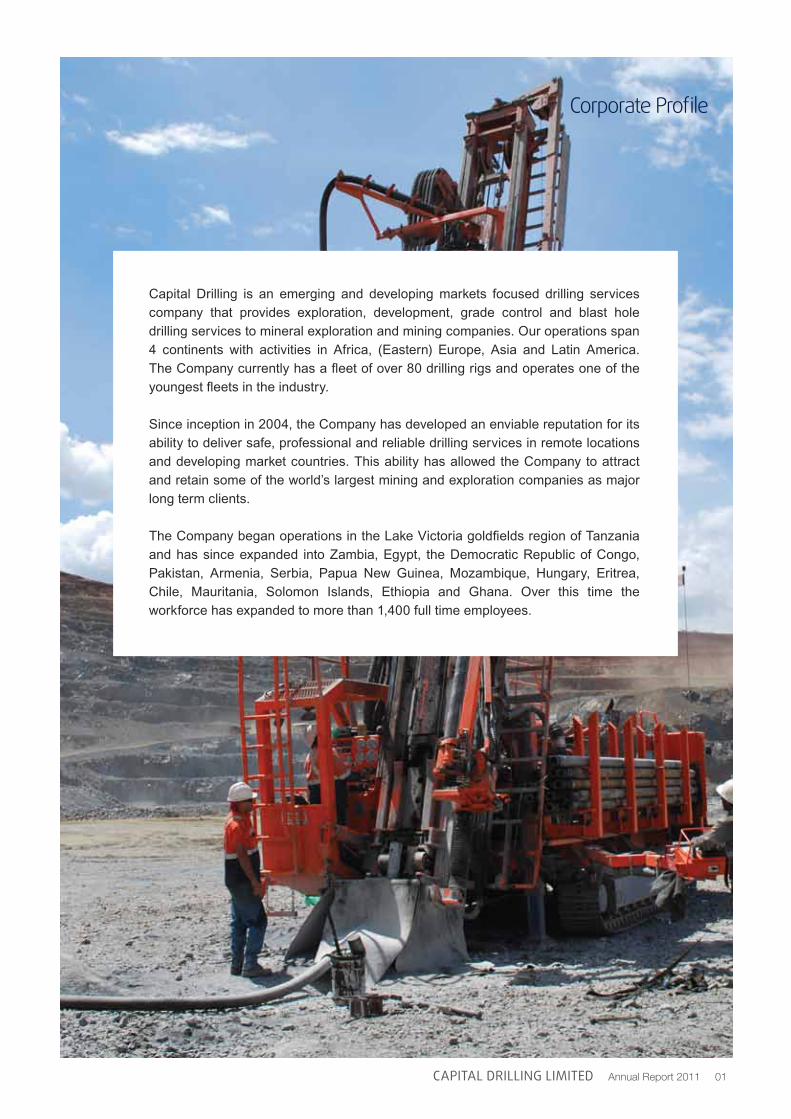
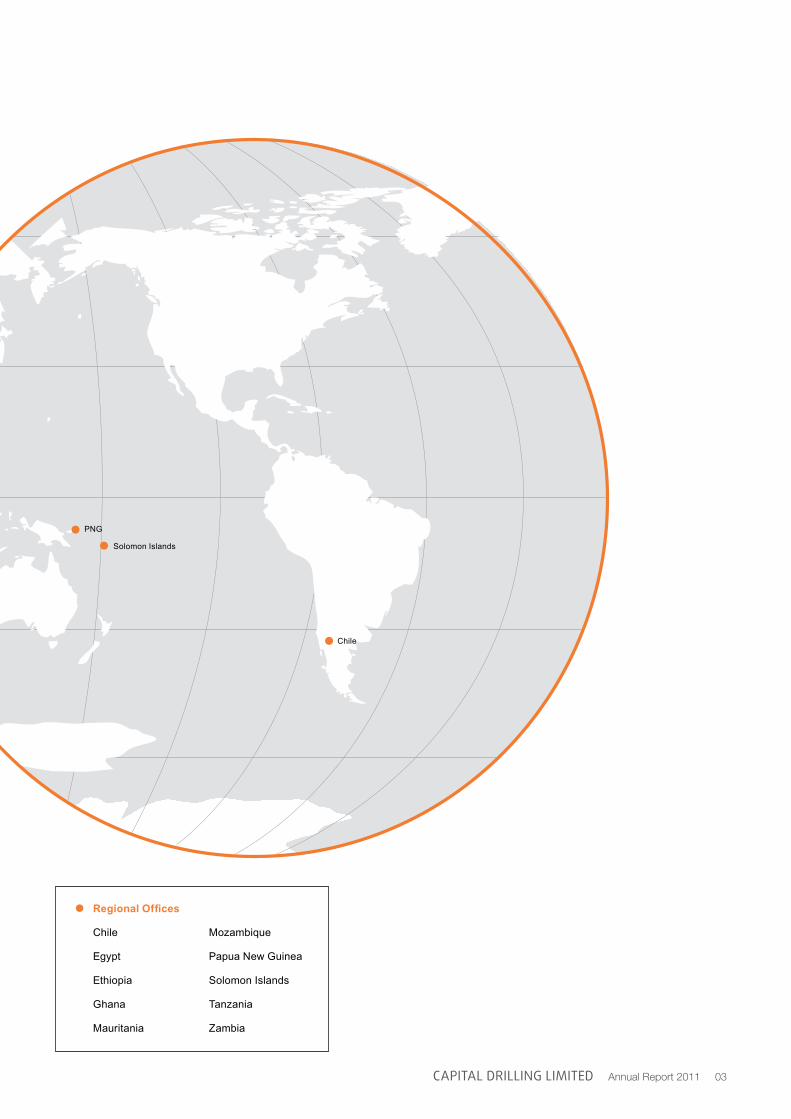
Capital Drilling is an emerging and developing markets focused drilling services company that provides exploration, development, grade control and blast hole drilling services to mineral exploration and mining companies. Our operations span 4 continents with activities in Africa, (Eastern) Europe, Asia and Latin America. The Company currently has a fleet of over 80 drilling rigs and operates one of the youngest fleets in the industry.
Since inception in 2004, the Company has developed an enviable reputation for its ability to deliver safe, professional and reliable drilling services in remote locations and developing market countries. This ability has allowed the Company to attract and retain some of the world’s largest mining and exploration companies as major long term clients.
The Company began operations in the Lake Victoria goldfields region of Tanzania and has since expanded into Zambia, Egypt, the Democratic Republic of Congo, Pakistan, Armenia, Serbia, Papua New Guinea, Mozambique, Hungary, Eritrea, Chile, Mauritania, Solomon Islands, Ethiopia and Ghana. Over this time the workforce has expanded to more than 1,400 full time employees.
Corporate Profile
02 Capital Drilling limiteD Annual Report 2011
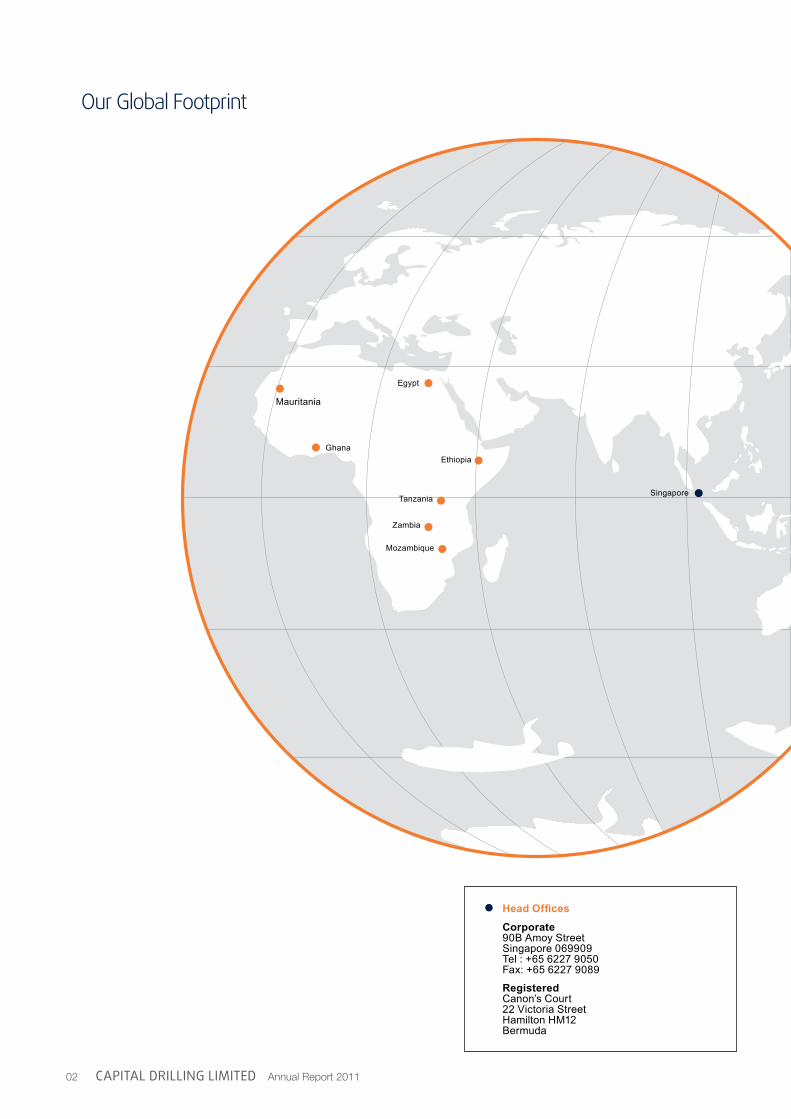
Our Global Footprint
Blast Hole
Head Offices
Corporate90B Amoy StreetSingapore 069909Tel : +65 6227 9050Fax: +65 6227 9089
RegisteredCanon’s Court22 Victoria StreetHamilton HM12Bermuda
Egypt
Mozambique
Singapore
Zambia
Tanzania
Mauritania
GhanaEthiopia
Capital Drilling limiteD Annual Report 2011 03
Chile
Regional Offices
PNG
Solomon Islands
Chile
Egypt
Ethiopia
Ghana
Mauritania
Mozambique
Papua New Guinea
Solomon Islands
Tanzania
Zambia
04 Capital Drilling limiteD Annual Report 2011
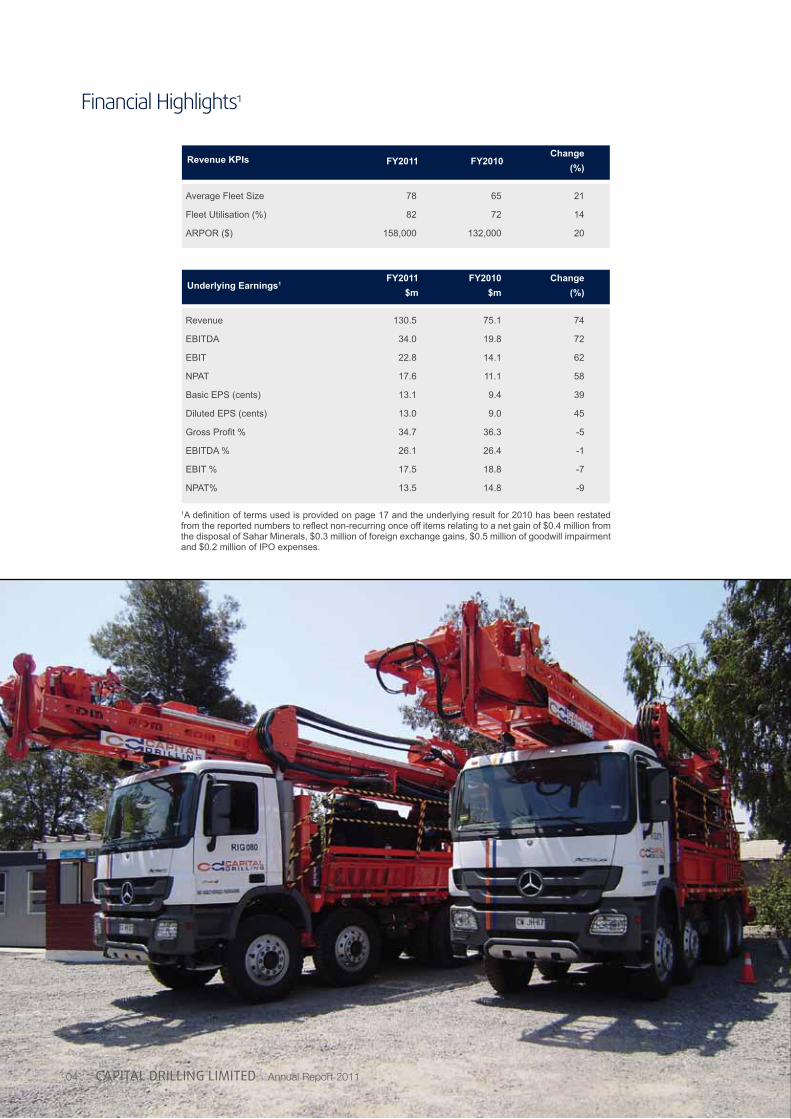
Financial Highlights1
1A definition of terms used is provided on page 17 and the underlying result for 2010 has been restated from the reported numbers to reflect non-recurring once off items relating to a net gain of $0.4 million from the disposal of Sahar Minerals, $0.3 million of foreign exchange gains, $0.5 million of goodwill impairment and $0.2 million of IPO expenses.
Average Fleet Size
Fleet Utilisation (%)
ARPOR ($)
Revenue
EBITDA
EBIT
NPAT
Basic EPS (cents)
Diluted EPS (cents)
Gross Profit %
EBITDA %
EBIT %
NPAT%
78
82
158,000
130.5
34.0
22.8
17.6
13.1
13.0
34.7
26.1
17.5
13.5
65
72
132,000
75.1
19.8
14.1
11.1
9.4
9.0
36.3
26.4
18.8
14.8
21
14
20
74
72
62
58
39
45
-5
-1
-7
-9
FY2011Revenue KPIs
Underlying Earnings1FY2011
$mFY2010
$mChange
(%)
Change (%)
FY2010
Capital Drilling limiteD Annual Report 2011 05
06 Capital Drilling limiteD Annual Report 2011
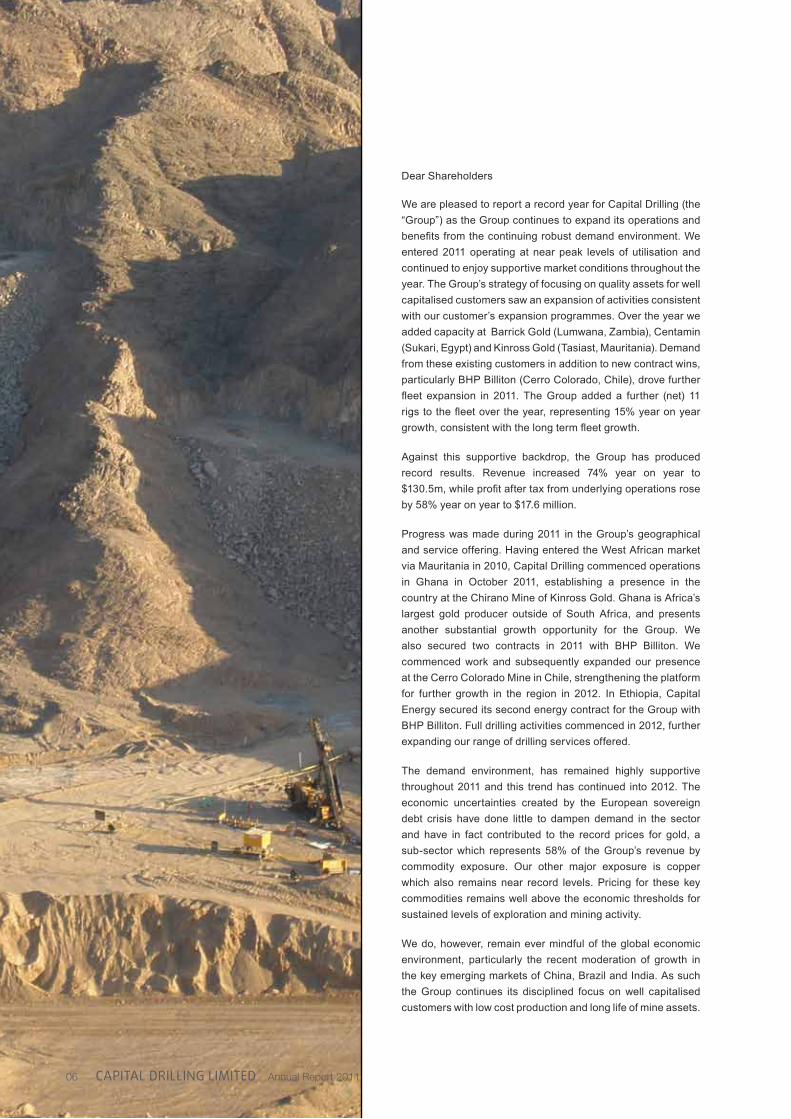
We are pleased to report a record year for Capital Drilling (the “Group”) as the Group continues to expand its operations and benefits from the continuing robust demand environment. We entered 2011 operating at near peak levels of utilisation and continued to enjoy supportive market conditions throughout the year. The Group’s strategy of focusing on quality assets for well capitalised customers saw an expansion of activities consistent with our customer’s expansion programmes. Over the year we added capacity at Barrick Gold (Lumwana, Zambia), Centamin (Sukari, Egypt) and Kinross Gold (Tasiast, Mauritania). Demand from these existing customers in addition to new contract wins, particularly BHP Billiton (Cerro Colorado, Chile), drove further fleet expansion in 2011. The Group added a further (net) 11 rigs to the fleet over the year, representing 15% year on year growth, consistent with the long term fleet growth.
Against this supportive backdrop, the Group has produced record results. Revenue increased 74% year on year to $130.5m, while profit after tax from underlying operations rose by 58% year on year to $17.6 million.
Progress was made during 2011 in the Group’s geographical and service offering. Having entered the West African market via Mauritania in 2010, Capital Drilling commenced operations in Ghana in October 2011, establishing a presence in the country at the Chirano Mine of Kinross Gold. Ghana is Africa’s largest gold producer outside of South Africa, and presents another substantial growth opportunity for the Group. We also secured two contracts in 2011 with BHP Billiton. We commenced work and subsequently expanded our presence at the Cerro Colorado Mine in Chile, strengthening the platform for further growth in the region in 2012. In Ethiopia, Capital Energy secured its second energy contract for the Group with BHP Billiton. Full drilling activities commenced in 2012, further expanding our range of drilling services offered.
The demand environment, has remained highly supportive throughout 2011 and this trend has continued into 2012. The economic uncertainties created by the European sovereign debt crisis have done little to dampen demand in the sector and have in fact contributed to the record prices for gold, a sub-sector which represents 58% of the Group’s revenue by commodity exposure. Our other major exposure is copper which also remains near record levels. Pricing for these key commodities remains well above the economic thresholds for sustained levels of exploration and mining activity.
We do, however, remain ever mindful of the global economic environment, particularly the recent moderation of growth in the key emerging markets of China, Brazil and India. As such the Group continues its disciplined focus on well capitalised customers with low cost production and long life of mine assets.
Dear Shareholders
Capital Drilling limiteD Annual Report 2011 07
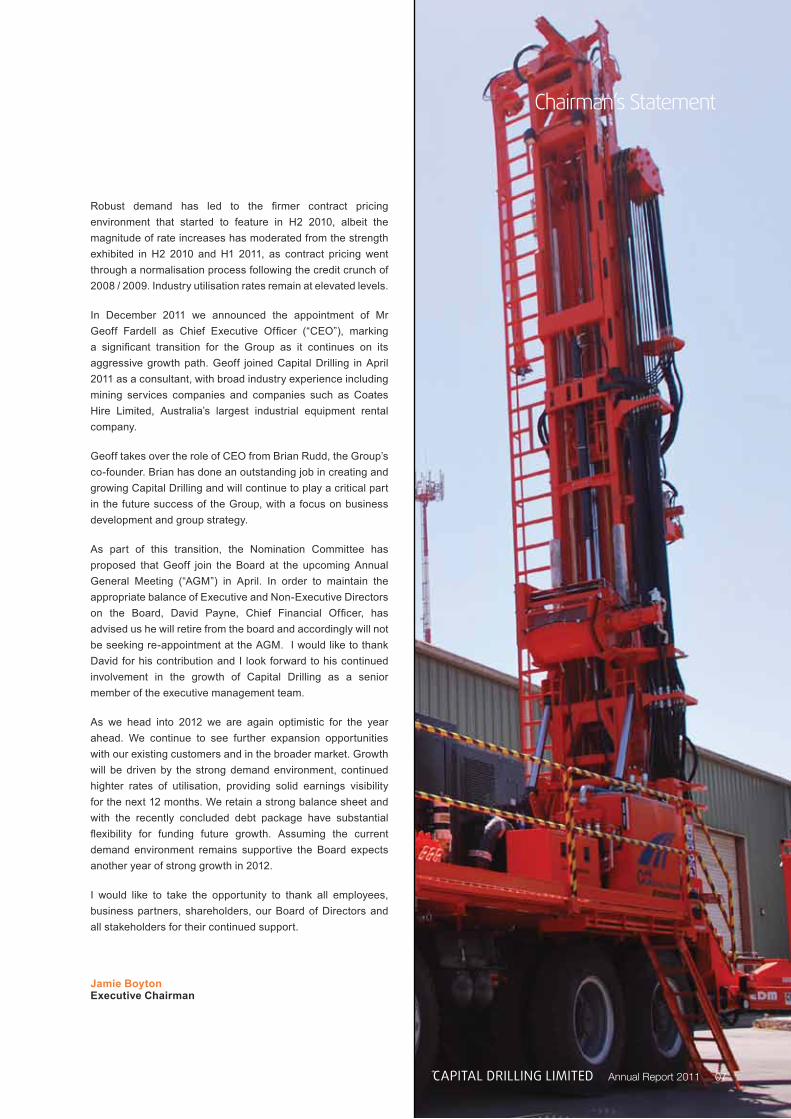
Robust demand has led to the firmer contract pricing environment that started to feature in H2 2010, albeit the magnitude of rate increases has moderated from the strength exhibited in H2 2010 and H1 2011, as contract pricing went through a normalisation process following the credit crunch of 2008 / 2009. Industry utilisation rates remain at elevated levels.
In December 2011 we announced the appointment of Mr Geoff Fardell as Chief Executive Officer (“CEO”), marking a significant transition for the Group as it continues on its aggressive growth path. Geoff joined Capital Drilling in April 2011 as a consultant, with broad industry experience including mining services companies and companies such as Coates Hire Limited, Australia’s largest industrial equipment rental company.
Geoff takes over the role of CEO from Brian Rudd, the Group’s co-founder. Brian has done an outstanding job in creating and growing Capital Drilling and will continue to play a critical part in the future success of the Group, with a focus on business development and group strategy.
As part of this transition, the Nomination Committee has proposed that Geoff join the Board at the upcoming Annual General Meeting (“AGM”) in April. In order to maintain the appropriate balance of Executive and Non-Executive Directors on the Board, David Payne, Chief Financial Officer, has advised us he will retire from the board and accordingly will not be seeking re-appointment at the AGM. I would like to thank David for his contribution and I look forward to his continued involvement in the growth of Capital Drilling as a senior member of the executive management team.
As we head into 2012 we are again optimistic for the year ahead. We continue to see further expansion opportunities with our existing customers and in the broader market. Growth will be driven by the strong demand environment, continued highter rates of utilisation, providing solid earnings visibility for the next 12 months. We retain a strong balance sheet and with the recently concluded debt package have substantial flexibility for funding future growth. Assuming the current demand environment remains supportive the Board expects another year of strong growth in 2012.
I would like to take the opportunity to thank all employees, business partners, shareholders, our Board of Directors and all stakeholders for their continued support.
Jamie Boyton Executive Chairman
Chairman’s Statement
08 Capital Drilling limiteD Annual Report 2011
Chief Executive Officer’s Review
90
80
70
60
50
40
30
20
10
0
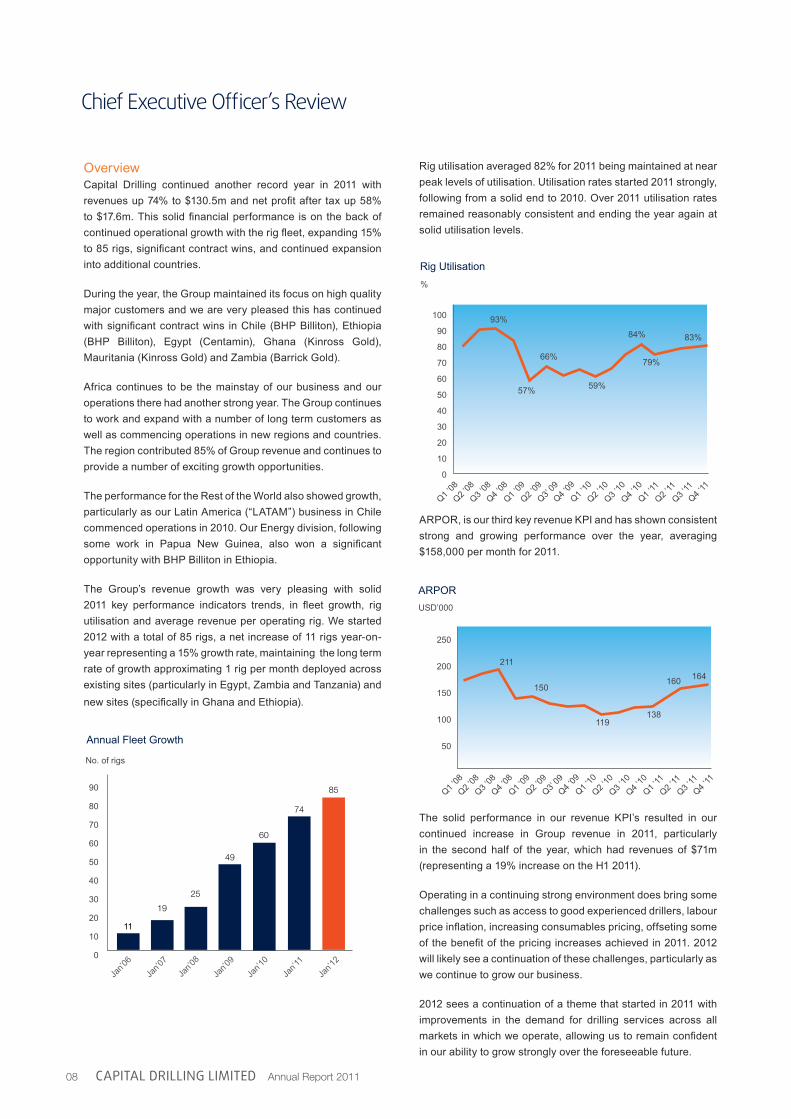
Annual Fleet Growth
Jan’0
6
Jan’0
7Ja
n’08
Jan’0
9
Jan’1
0
Jan’1
1
Jan’1
2
11
19
25
49
60
74
85
No. of rigs
Rig Utilisation
OverviewCapital Drilling continued another record year in 2011 with revenues up 74% to $130.5m and net profit after tax up 58% to $17.6m. This solid financial performance is on the back of continued operational growth with the rig fleet, expanding 15% to 85 rigs, significant contract wins, and continued expansion into additional countries.
During the year, the Group maintained its focus on high quality major customers and we are very pleased this has continued with significant contract wins in Chile (BHP Billiton), Ethiopia (BHP Billiton), Egypt (Centamin), Ghana (Kinross Gold), Mauritania (Kinross Gold) and Zambia (Barrick Gold).
Africa continues to be the mainstay of our business and our operations there had another strong year. The Group continues to work and expand with a number of long term customers as well as commencing operations in new regions and countries. The region contributed 85% of Group revenue and continues to provide a number of exciting growth opportunities.
The performance for the Rest of the World also showed growth, particularly as our Latin America (“LATAM”) business in Chile commenced operations in 2010. Our Energy division, following some work in Papua New Guinea, also won a significant opportunity with BHP Billiton in Ethiopia.
The Group’s revenue growth was very pleasing with solid 2011 key performance indicators trends, in fleet growth, rig utilisation and average revenue per operating rig. We started 2012 with a total of 85 rigs, a net increase of 11 rigs year-on-year representing a 15% growth rate, maintaining the long term rate of growth approximating 1 rig per month deployed across existing sites (particularly in Egypt, Zambia and Tanzania) and new sites (specifically in Ghana and Ethiopia).
Rig utilisation averaged 82% for 2011 being maintained at near peak levels of utilisation. Utilisation rates started 2011 strongly, following from a solid end to 2010. Over 2011 utilisation rates remained reasonably consistent and ending the year again at solid utilisation levels.
ARPOR, is our third key revenue KPI and has shown consistent strong and growing performance over the year, averaging $158,000 per month for 2011.
The solid performance in our revenue KPI’s resulted in our continued increase in Group revenue in 2011, particularly in the second half of the year, which had revenues of $71m (representing a 19% increase on the H1 2011).
Operating in a continuing strong environment does bring some challenges such as access to good experienced drillers, labour price inflation, increasing consumables pricing, offseting some of the benefit of the pricing increases achieved in 2011. 2012 will likely see a continuation of these challenges, particularly as we continue to grow our business.
2012 sees a continuation of a theme that started in 2011 with improvements in the demand for drilling services across all markets in which we operate, allowing us to remain confident in our ability to grow strongly over the foreseeable future.
ARPORUSD’000
100
90
80
70
60
50
40
30
20
10
0
57%
66%
93%
59%
84% 83%
79%
Q1 ‘08
Q2 ‘08
Q3 ‘08
Q4 ‘08
Q1 ‘09
Q2 ‘09
Q3’ 09
Q4 ‘09
Q1 ‘10
Q2 ‘10
Q3 ‘10
Q4 ‘10
Q1 ‘11
Q2 ‘11
Q3 ‘11
Q4 ‘11
%
Q1 ‘08
Q2 ‘08
Q3 ‘08
Q4 ‘08
Q1 ‘09
Q2 ‘09
Q3’ 09
Q4 ‘09
Q1 ‘10
Q2 ‘10
Q3 ‘10
Q4 ‘10
Q1 ‘11
Q2 ‘11
Q3 ‘11
Q4 ‘11
250
200
150
100
50
211
150
119138
160 164
Capital Drilling limiteD Annual Report 2011 09
Chief Executive Officer’s Review
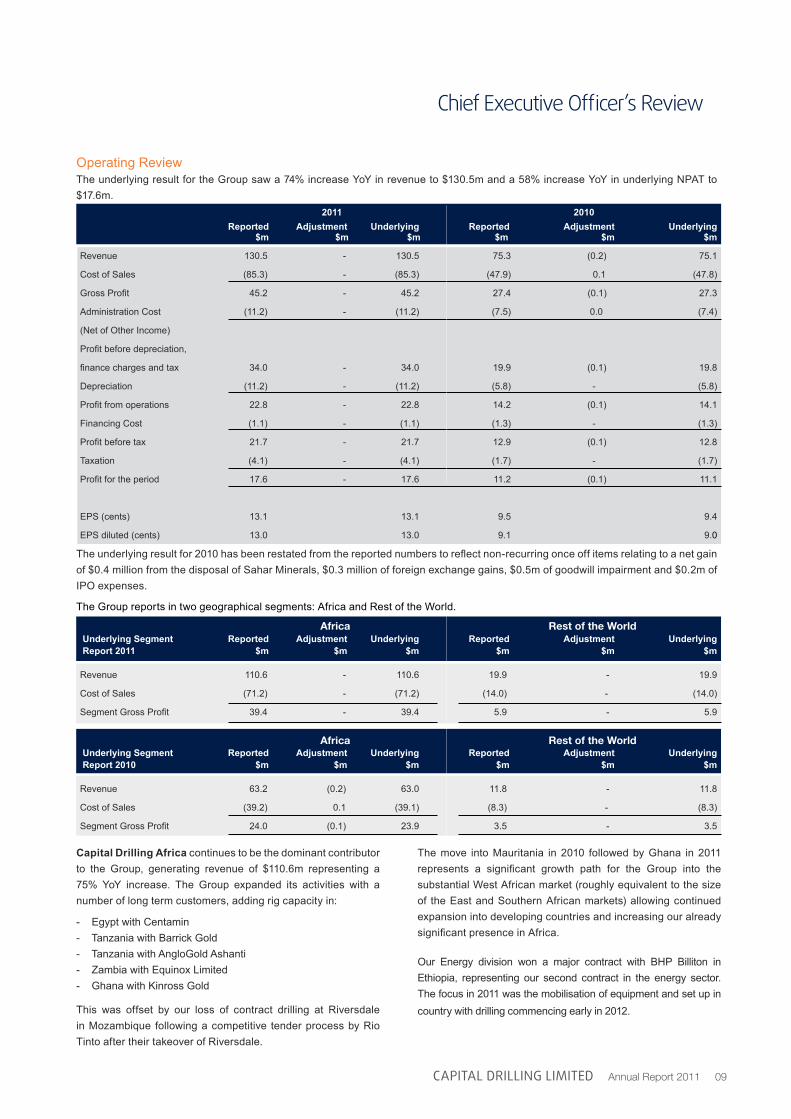
Operating ReviewThe underlying result for the Group saw a 74% increase YoY in revenue to $130.5m and a 58% increase YoY in underlying NPAT to $17.6m.
The underlying result for 2010 has been restated from the reported numbers to reflect non-recurring once off items relating to a net gain of $0.4 million from the disposal of Sahar Minerals, $0.3 million of foreign exchange gains, $0.5m of goodwill impairment and $0.2m of IPO expenses.
The Group reports in two geographical segments: Africa and Rest of the World.
Capital Drilling Africa continues to be the dominant contributor to the Group, generating revenue of $110.6m representing a 75% YoY increase. The Group expanded its activities with a number of long term customers, adding rig capacity in:
- Egypt with Centamin- Tanzania with Barrick Gold- Tanzania with AngloGold Ashanti- Zambia with Equinox Limited- Ghana with Kinross Gold
This was offset by our loss of contract drilling at Riversdale in Mozambique following a competitive tender process by Rio Tinto after their takeover of Riversdale.
The move into Mauritania in 2010 followed by Ghana in 2011 represents a significant growth path for the Group into the substantial West African market (roughly equivalent to the size of the East and Southern African markets) allowing continued expansion into developing countries and increasing our already significant presence in Africa.
Our Energy division won a major contract with BHP Billiton in Ethiopia, representing our second contract in the energy sector. The focus in 2011 was the mobilisation of equipment and set up in country with drilling commencing early in 2012.
Reported Adjustment Underlying Reported Adjustment Underlying $m $m $m $m $m $m
Revenue 130.5 - 130.5 75.3 (0.2) 75.1
Cost of Sales (85.3) - (85.3) (47.9) 0.1 (47.8)
Gross Profit 45.2 - 45.2 27.4 (0.1) 27.3
Administration Cost (11.2) - (11.2) (7.5) 0.0 (7.4)
(Net of Other Income)
Profit before depreciation,
finance charges and tax 34.0 - 34.0 19.9 (0.1) 19.8
Depreciation (11.2) - (11.2) (5.8) - (5.8)
Profit from operations 22.8 - 22.8 14.2 (0.1) 14.1
Financing Cost (1.1) - (1.1) (1.3) - (1.3)
Profit before tax 21.7 - 21.7 12.9 (0.1) 12.8
Taxation (4.1) - (4.1) (1.7) - (1.7)
Profit for the period 17.6 - 17.6 11.2 (0.1) 11.1
EPS (cents) 13.1 13.1 9.5 9.4
EPS diluted (cents) 13.0 13.0 9.1 9.0
2011 2010
africa rest of the World
Underlying Segment Reported Adjustment Underlying Reported Adjustment Underlying Report 2011 $m $m $m $m $m $m
Revenue 110.6 - 110.6 19.9 - 19.9
Cost of Sales (71.2) - (71.2) (14.0) - (14.0)
Segment Gross Profit 39.4 - 39.4 5.9 - 5.9
africa rest of the World
Underlying Segment Reported Adjustment Underlying Reported Adjustment Underlying Report 2010 $m $m $m $m $m $m
Revenue 63.2 (0.2) 63.0 11.8 - 11.8
Cost of Sales (39.2) 0.1 (39.1) (8.3) - (8.3)
Segment Gross Profit 24.0 (0.1) 23.9 3.5 - 3.5
10 Capital Drilling limiteD Annual Report 2011
Our two largest operations in Africa, Egypt and Tanzania again performed well during the year with YoY growth in revenue and EBIT contribution.
Capital Drilling Rest of the World improved YoY with increased revenues (68%) and EBIT (55%) contribution. Our Chile operation performed extremely well on the back of a significant contract win, offset by reduction in work in Asia Pacific with the completion of work for Oil Search and reduction of work in Papua New Guinea for Allied Gold towards the end of 2011 (although work continues into 2012).
Chile performed very well in 2011 after commencing operations in 2010. 2011 saw the completion of work for Polar Star (started in 2010) and the commencement of work for BHP Billiton in Cerro Colorado. Chile won the Group’s first meter based contract with BHP Billiton which performed well during 2011 on the back of high rig utilisation and mechanical availability, together with maintaining a good safety record. LATAM remains one the fastest growth opportunities for our services, in a market contributing over 25% of the worldwide exploration drilling budgets by region.
The year saw a large number of contract wins and continuing challenges which included timely access to equipment, international mobilisation, and a tight labour market to skilled personnel. Whilst this is part and parcel of the business, our team maintains a focus on meeting client commitments in time, on budget and with continued focus on safety.
Business DevelopmentBusiness development in 2011 saw the significant contract wins mentioned above. In addition the Group continues to seek new businesses that have the potential to make meaningful contributions to the Group’s performance.
The Energy sector is one such opportunity and, as mentioned above, we have won our second contract with BHP Billiton and will continue to seek growth opportunities in this area. In addition our Well Force business (started in 2010) which provides directional drilling management services and hires out down hole logging and survey instruments, performed very well during 2011 and we see further opportunities in growing this operation going forward. Cap-Sat, which provides remote communication services to corporate and non-government organisations internationally in remote areas where conventional communication methods are not available or economically feasible, afforded another good contribution for the year. Capital Support Services provides internal and external training and other services. We see these businesses continuing to make positive contributions throughout 2012.
Health & SafetyThe Group maintains a proactive safety culture with focus and commitment to maintaining zero harm. This is supported by a stringent Training and Development program which is being driven at the board level. This has led to a positive reaction of our team
members, not only impacting on their competence levels but also providing a challenging and rewarding working environment for all our employees. It is this culture and commitment which allowed Capital Drilling to recapture our focus after sustaining an impact of 4 LTI’s for 2011. Overall, we are proud of all our current projects achieving significant milestones, some which exceed 1 Million Man-Hours (1,500 days LTI Free).:
- Tanzania - Geita 1,500 days (June 2011)- Mozambique 1,000 days (November 2011)- Egypt 1,000 days (January 2012)- Tanzania - North Mara 1,000 days (January 2012)- Zambia - Lumwana 1,500 days (January 2012)- Tanzania - Mwanza 1,500 days (March 2012)
Maintaining excellence in Health and Safety is a key element to why Capital Drilling has improved its revenue exposure to major mining groups and we will continue to invest in this crucial aspect of our business.
Capital Drilling continues to abide by the ISO artifications it has received (ISO 9001, ISO 14001, OSHAS 18001, and SA 8000, Cultural Accountability) in setting the appropriate standards to which the Group operates. We are very pleased that the Group has maintained its ISO certifications in 2011 with no non-conformances.
OutlookThe Group will continue to pursue its strategy for growth by leveraging our strengths. We intend to maintain a focus on meeting the demands of our existing blue chip customer base and working with them on new opportunities as they arise. Having established operating platforms in both West Africa and LATAM, we aim to develop our position in these fast growth markets through expanding our operations and increasing market share. We also see the opportunity to grow our Energy division in potash and coal seam gas drilling with the number of enquiries continuing to grow. We anticipate growth in all regions of operations with continued high levels of client enquiries and a supportive macro-economic environment.
The recently announced debt refinancing allows us greater capacity and flexibility to deliver on growth opportunities in 2012, as well as providing a robust balance sheet.
It has been very pleasing that 2011 has seen highly supportive market conditions amongst some uncertain economic times in Europe, and with our current work program we see continued demand to position us well for the year ahead. 2012 promises to be another good year for Capital Drilling.
Brian Rudd Executive Director (former Chief Executive Officer)
Geoff Fardell Chief Executive Officer
Chief Executive Officer’s Review
Capital Drilling limiteD Annual Report 2011 11
Chief Financial Officer’s Report
It is pleasing to report that, in 2011, our first full year as a listed entity, the Group generated record revenue and record profits. The Group continued to expand within its existing client base and geographically, entering Ghana and Ethiopia this year. Improving key metrics in average revenue per operating rig and rig utilisation provide a solid base to commence our 2012 financial year.
Whilst the Group benefitted from increased efficiencies, consistent with 2010, the business saw pressure on margins through a tightening labour market and related costs. The increased efficiencies were unable to offset the labour related pressure which resulted in the business generating slightly lower margins, despite record earnings per share. Despite this, the Group moves into 2012 with a continued strong balance sheet and increased capacity for growth through the new recently agreed debt facility. Net earnings increased to $17.6m, or 58% YoY and net equity increased to $79.1m.
Demand for drilling services continues to be strong due to the reported improving conditions in 2010. Consequently, underlying revenue increased to $130.5m or 74% YoY, resulting in record performance. In addition, H2 2011 provided further evidence of the continued demand with revenue up 19% from the previous period in H1 2011. Combined with improving rig utilisation and ARPOR on a larger weighted average fleet, we enter 2012 with high revenue visibility, providing further comfort to the growth prospects within the current client base.
Continued improvements in key revenue metrics were displayed with rig utilisation averaging 82% for the period, up from 72% in 2010 and ARPOR improving 20% YoY to an average of $158,000 per month for the year. In addition, the weighted average fleet expanded by 21%. With utilisation now at peak levels, an improving ARPOR provides evidence of the improving pricing environment and demand in the sector.
Despite efficiencies within the Group, a higher ARPOR, with lower stock and fuel expenses, the strong demand for drilling services resulted in pressure on labour and associated costs which the Group was unable to offset. Combined with a weakening US Dollar, the gross profit margin for the year was 35%. In addition, the change in depreciation methodology to a straight line basis at the beginning of 2011, as advised in 2010 Annual Report, resulted in a higher expense for the period. Despite this, the revenue expansion saw underlying EBIT increase to $22.8m, or 62% YoY.
Despite the fact the Group continues to enjoy a relatively low effective tax rate, 2011 saw an increased effective tax rate from 13% to 19%, which eroded the lower financing costs generating a net profit after tax of $17.6m, up from $11.1m, an improvement of 58% over the previous year.
Underlying diluted earnings per share increased by 45% to 13.0 cents on a weighted average number of shares of 134,986,395, from 9.0 cents on a weighted average number of shares of 122,383,994 shares in 2010.
Statement of Financial PositionAs at 31 December 2011, the Statement of Financial Position showed continued strength and improvement with net equity increasing to $79.1m. This position is a result of improved retained earnings and current assets from a higher revenue base. With a relatively low debt to equity ratio, the business continues to be well placed to capitalise on the strong demand for its services.
The 17% YoY increase in current assets to $56.6m was as a result of expansion of the Group’s inventory to cater for continued growth, combined with higher trade receivables from a larger revenue base. Lower trade payables, despite the large revenue base, resulted in a lower cash position of $7.7m ($0.4m net of overdraft) and thus lower liquidity for the period.
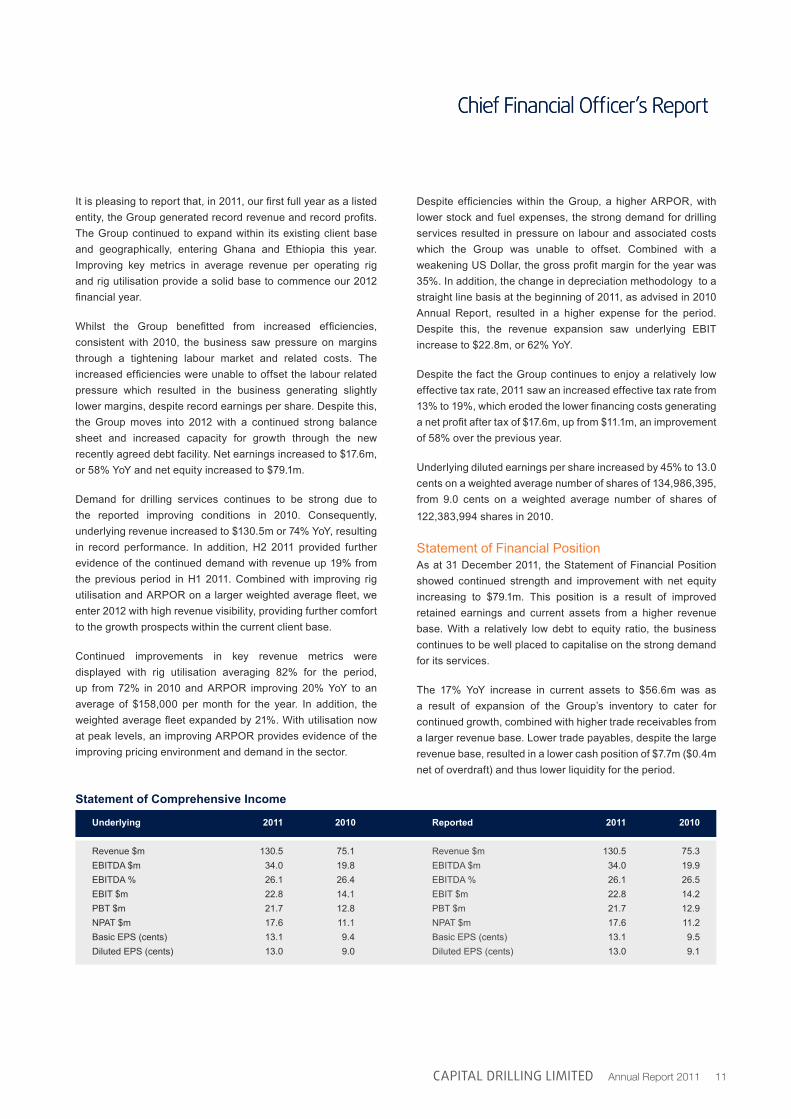
Underlying 2011 2010 Reported 2011 2010
Revenue $m 130.5 75.1 Revenue $m 130.5 75.3EBITDA $m 34.0 19.8 EBITDA $m 34.0 19.9EBITDA % 26.1 26.4 EBITDA % 26.1 26.5EBIT $m 22.8 14.1 EBIT $m 22.8 14.2PBT $m 21.7 12.8 PBT $m 21.7 12.9NPAT $m 17.6 11.1 NPAT $m 17.6 11.2Basic EPS (cents) 13.1 9.4 Basic EPS (cents) 13.1 9.5Diluted EPS (cents) 13.0 9.0 Diluted EPS (cents) 13.0 9.1
Statement of Comprehensive Income
Chief Financial Officer’s Report
12 Capital Drilling limiteD Annual Report 2011
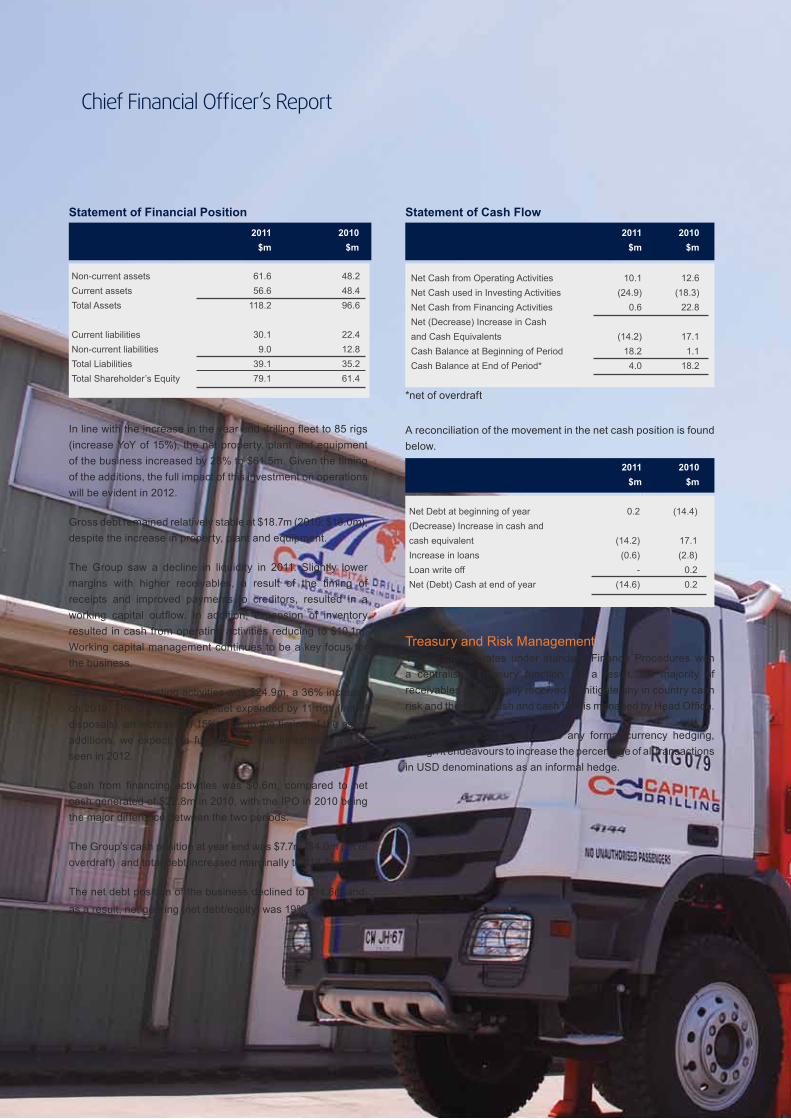
In line with the increase in the year end drilling fleet to 85 rigs (increase YoY of 15%), the net property, plant and equipment of the business increased by 28% to $61.5m. Given the timing of the additions, the full impact of this investment on operations will be evident in 2012.
Gross debt remained relatively stable at $18.7m (2010: $18.0m), despite the increase in property, plant and equipment.
The Group saw a decline in liquidity in 2011. Slightly lower margins with higher receivables, a result of the timing of receipts and improved payments to creditors, resulted in a working capital outflow. In addition, expansion of inventory resulted in cash from operating activities reducing to $10.1m. Working capital management continues to be a key focus for the business.
Cash used in investing activities was $24.9m, a 36% increase on 2010. The Group’s drilling fleet expanded by 11 rigs (net of disposals), an increase of 15%. Due to the timing of the asset additions, we expect the full effect of this investment will be seen in 2012.
Cash from financing activities was $0.6m, compared to net cash generated of $22.8m in 2010, with the IPO in 2010 being the major difference between the two periods.
The Group’s cash position at year end was $7.7m ($4.0m net of overdraft) and total debt increased marginally to $18.7m.
The net debt position of the business declined to $14.6m and, as a result, net gearing (net debt/equity) was 19%.
*net of overdraft
Statement of Cash FlowStatement of Financial Position
Treasury and Risk ManagementThe Group operates under standard Finance Procedures with a centralised Treasury function. As a result, the majority of receivables are centrally received to mitigate any in country cash risk and therefore cash and cash flow is managed by Head Office.
The Group does not undertake any formal currency hedging, though it endeavours to increase the percentage of all transactions in USD denominations as an informal hedge.
Net Cash from Operating ActivitiesNet Cash used in Investing ActivitiesNet Cash from Financing ActivitiesNet (Decrease) Increase in Cash and Cash EquivalentsCash Balance at Beginning of PeriodCash Balance at End of Period*
10.1(24.9)
0.6
(14.2)18.24.0
12.6(18.3)
22.8
17.11.1
18.2
Net Debt at beginning of year(Decrease) Increase in cash andcash equivalentIncrease in loansLoan write offNet (Debt) Cash at end of year
0.2
(14.2)(0.6)
-(14.6)
(14.4)
17.1(2.8)
0.20.2
2011$m
2011$m
2011$m
2010 $m
2010 $m
2010 $m
Non-current assetsCurrent assetsTotal Assets
Current liabilitiesNon-current liabilitiesTotal LiabilitiesTotal Shareholder’s Equity
61.656.6
118.2
30.19.0
39.179.1
48.248.496.6
22.412.835.261.4
A reconciliation of the movement in the net cash position is found below.
Chief Financial Officer’s Report
Capital Drilling limiteD Annual Report 2011 13
Critical Accounting PoliciesThe Financial Statements have been prepared in accordance with IFRS as issued by the International Accounting Standards Board. The principal accounting standards are set out in the Group’s financial statements.
The Financial Statements have been prepared on the historical cost basis and are presented in USD, given the Groups transactions are primarily denominated in US dollars.
Property, Plant and EquipmentThe Group depreciates all fixed assets over their estimated useful lives, less any pre-agreed salvage value. The carrying value of fixed assets are reviewed annually or more frequently if a triggering event occurs.
TaxationA deferred tax asset and liability is recorded in the Statement of Financial Position. In addition, the business will have carried forward tax losses to the value of $2.0m, an increase of $1.3m, from 2010. These tax losses, are expected to be utilised in the forthcoming period (s).
Share Based PaymentsIn 2011, 80,000 options were issued with a vesting period between January 2011 and December 2013. The additional options issued result in a total options issued of 2,600,000. A share based payment expense of $126,300 was recorded.
Subsequent to the above, in January 2012, an additional 3,000,000 options convertible into ordinary shares have been issued to the newly appointed CEO, Mr Geoff Fardell. The options issued by the Company, have an exercise price of £1.02 each and, depending on the fulfilment of certain conditions, are exercisable up to 15 January 2016.
Primary RisksThe Group operates in environments that pose various risk and uncertainties. The primary risks associated with the business are:
Fluctuation in levels of mineral explorationThe Group is highly dependent on the levels of mineral exploration, development and production activity within the markets in which it operates. A reduction in exploration, development and production activities, or in the budgeted expenditure of mining and mineral exploration companies, will cause a decline in the demand for drilling rigs and drilling services.
Key personnel and staff retentionThe Group’s ability to implement a strategy of pursuing expansion opportunities is dependent on the efforts and abilities
of its executive directors and senior managers. In addition, the Group’s operations depend, in part, upon the continued services of certain key employees. If the Group loses the services of any of its existing key personnel without timely and suitable replacements, or is unable to attract and retain new personnel with suitable experience as it grows, the Group’s business, financial condition, results of operations and prospects may be materially and adversely affected. In addition, business may be lost to competitors which members of senior management may join after leaving their positions with the Group.
Currency fluctuationsThe Group receives the majority of its revenues in US dollars. However, some of the Group’s costs are in other currencies in the jurisdictions in which it operates. Foreign currency fluctuations and exchange rate risks between the value of the US dollar and the value of other currencies may increase the cost of the Group’s operations and could adversely affect financial results. As a result, the Group is exposed to currency fluctuations and exchange rate risks. To minimise the Group’s risk, the Group tries to match the currency of operating costs with the currency of revenue.
Operating risksOperations are subject to various risks associated with drilling including, in the case of employees, personal injury and loss of life and, in the Group’s case, damage and destruction to property and equipment, release of hazardous substances to the environment and interruption or suspension of drill site operations due to unsafe drill operations. The occurrence of any of these events could adversely impact the Group’s business, financial condition, results of operations and prospects, lead to legal proceedings and damage the Group’s reputation. In particular, clients are placing an increasing focus on occupational health and safety, and deterioration in the Group’s safety record may result in the loss of key clients.
Business interruptions and weather conditionsSignificant business interruptions as a result of natural disasters, extreme weather conditions, unstable drilling sites, regulatory intervention, delays in necessary approvals and permits or delays in supplies, may reduce the Group’s ability to complete drilling services, resulting in performance delays, increased costs and loss of revenue.
As operations are conducted outdoors, they are generally vulnerable to weather and environmental conditions. The Group operates in a variety of locations, some of which are prone to extreme weather conditions. High rainfall can significantly impact drilling activity, as well as impede the ability to move drilling rigs between drill sites. Accordingly, weather conditions as well as natural disasters may adversity impact the financial performance of the Group.
Chief Financial Officer’s Report
14 Capital Drilling limiteD Annual Report 2011
Chief Financial Officer’s Report
Going Concern BasisThe Group’s business activities, together with the factors likely to affect its future development, performance and position are set out in the Chief Executive Review. The financial position of the Group, its cash flows and liquidity position are also described in from pages 11 to 13. In addition, note 31 of the financial statements include the Group’s objectives, policies and processes for managing its capital; its financial risk management objectives; details of its financial instruments and hedging activities; and its exposure to credit risk and liquidity risk.
As highlighted in note 20 to the financial statements, the Group has borrowings and a debt facility which, together with its clients’ receipts, fund its day to day working capital requirements. Volatile economic conditions may on occasion create uncertainty particularly over (a) the level of demand for the Group’s services; (b) exchange rate fluctuations against the US Dollar and the consequent effect on the Group’s direct costs; and (c) the availability of bank financing in the foreseeable future.
The Group’s forecasts and projections, taking into account potential changes in its performance, show that the Group should be able to operate within the level of its capital structure. The Group has held discussions with its bankers about its future borrowing needs and no matters have been drawn to its attention to suggest that these needs may not be met on acceptable terms.
The directors believe that the Company and the Group have adequate resources to continue in operational existence for the foreseeable future. Thus they continue to adopt the going concern basis of accounting in preparing the annual financial statements.
Cautionary StatementThis Business Review, which comprises the Chairman’s Statement, Chief Executive Review and Chief Financial Officer’s Report, has been prepared solely to provide additional information to shareholders to assess the Group’s strategies and the potential for those strategies to succeed.
The Business Review contains certain forward-looking statements. These statements are made by the directors in good faith based on the information available to them up to the time of their approval of this report and such statements should be treated with caution due to the inherent uncertainties, including both economic and business risk factors, underlying any such forward-looking information.
By order of the Board
David PayneChief Financial Officer
18 March 2012
Capital Drilling limiteD Annual Report 2011 15
Jamie Phillip Boyton
Geoff Fardell
Brian Rudd
Jamie Phillip Boyton, 40 Executive Chairman
Jamie Boyton is Executive Chairman of the Company and was appointed as a director on 1 January 2009. He is responsible for overseeing the Company’s strategic and business development, which includes advising on capital markets requirements and growth opportunities. He was previously an Executive Director and the Head of Asian Equity Syndication and Corporate Broking of Macquarie Securities Limited in Hong Kong from August 2006 to September 2007, where he was responsible for a full range of capital raisings for both private and listed companies across the Asia Pacific region. Prior to this, Jamie was a division director of Macquarie Securities Limited in Hong Kong and a director of ABN AMRO Asia (Hong Kong) between August 2000 and July 2006, where he headed the Hedge Funds Sales for Asia, managing the distribution of a range of Asian financial products into the banks’ global hedge fund client base. Jamie has a Bachelor of Commerce (Accounting and Finance) degree from the University of Western Australia.
Geoff Fardell, 57 Chief Executive Officer (nominated to the Board for approval by shareholders at the AGM scheduled for 26 April 2012)
Geoff Fardell was appointed Chief Executive Officer (“CEO”) on 1 January 2012 and had been the Deputy CEO since July 2011 where he had worked closely with the former CEO, Mr Brian Rudd, on the strategic direction of the Group and other organisation matters. Geoff has a depth of experience in managing emerging companies similar to the size and growth prospects of the Group. He was previously Chief Financial Officer (“CFO”) at Coates Hire Limited, an ASX 200 listed company, Australia’s largest industrial equipment rental company and the twelfth largest in the world at that time. Whilst CFO, he was a key member of the executive team who were responsible for the growth of Coates Hire, which had a market capitalisation of approximately $100 million in 2001 before he joined in early 2002 and expanding to over $1.6 billion in 2007 through the roll out of the company’s corporate strategy. Since the acquisition of Coates Hire by private equity at the start of 2008, Geoff has worked as a consultant to a number of companies in different industries, including mining services. He also has over 20 years experience with companies including TNT, Unisys, Lend Lease and KPMG (formerly Peat Marwick Mitchell). Geoff holds a BA (Economics) degree, and is a qualified Chartered Accountant in both Australia (CA) and Canada (CA), is a qualified Chartered Secretary (ACIS), and is a Member of the Australia Institute of Company Director’s (MAICD).
Brian Rudd, 48 Former Chief Executive Officer
Brian Rudd is one of the founders of the Company and had been the Chief Executive Officer of the Group until 31 December 2011 when he relinquished the CEO appointment and remained as an Executive Director to focus on business development, client relations and corporate strategy. He was appointed as a director on 31 May 2005. As one of the founders of the Company, Brian has been instrumental in the successful establishment and development of the Company since 2005. During his time as CEO, the Group has grown into a substantial business with operations in 10 countries across three continents. Brian has over 27 years of experience in the mining industry in both Australia and Africa. Before establishing the Company, Brian was the operations manager and subsequently, the general manager of Stanley Mining Services (Tanzania) Ltd, a subsidiary of Layne Christensen Co., in East Africa.
Director’s Profile

16 Capital Drilling limiteD Annual Report 2011
David Regan Payne, 40 Chief Financial Officer(due to retire by rotation at the AGM scheduled for 26 April 2012 and will not be seeking re-election)
David Payne is CFO of the Company and was appointed as a director on 23 February 2007. He is responsible for finance, commercial and corporate, legal and compliance, accounting, internal controls and insurance matters within the Group. He was previously the general manager of an Australian national law firm, Raj Lawyers, from August 2002 to August 2005. Prior to this, David worked at Zurich Financial Services Australia as a manager in several divisions between December 1994 to July 2002. David has a Bachelor of Commerce degree from Murdoch University and a Graduate Diploma in Insurance from Deakin University.
Timothy Philip Read, 65 Senior Independent Non-Executive Director
Tim Read is the Senior Independent Non-Executive Director and was appointed on 28 May 2010. He has over 40 years’ experience in the natural resources sector. Tim was president and CEO of Adastra Minerals Inc (TSX and AIM) for 7 years, until its takeover by First Quantum in 2006, where he focused on the strategic direction and operational management of this African junior mining company. Prior to this, Tim was global co-head of mining investment banking at Merrill Lynch where he acted for a number of clients including Anglo American, Placer Dome, Billiton, CVRD, Jiang Xi Copper and Energy Africa. He joined Merrill Lynch in 1995 on its takeover of Smith New Court, where he had acted latterly as a director in the corporate finance department (from 1991) and previously as head of mining stock-broking (from 1988). Prior to this, Tim had many years experience in mining investment analysis for several leading firms of stockbrokers. Tim is now a non-executive director for two other listed minerals companies including Faroe Petroleum plc (AIM) and Metminco Limited (ASX and AIM). He had previously served on the boards of Cumerio SA and Kopane Diamond Developments plc (as Chairman) and Nevoro Inc (as Chairman). Tim also acts as a consultant to a number of minerals companies. He has a BA (Honours) in Economics, is a Fellow of the Chartered Institute of Securities and Investment and a member of the Audit Committee Institute.
Craig Ian Burton, 48 Non-Executive Director
Craig Burton is a Non-Executive Director of the Company and was appointed on 1 January 2009. He is currently also non-executive director of Every Day Mine Services Limited. He is an experienced and active investor in start-up projects and businesses, both publicly listed and private. Over the last 15 years, he has co-founded numerous development companies, with a focus on the resources, oil and gas, mining services and agribusiness sectors. He was a co-founder of two ASX 200 companies, Mirabela Nickel Ltd and Panaoramic Resources Ltd. He has a Bachelor of Laws and Jurisprudence degree from the University of Western Australia and a Diploma in Financial Markets. He is currently a member of the Australian Institute of Company Directors.
Alexander John Davidson, 60 Independent Non-Executive Director
Alex Davidson is an Independent Non-Executive Director and was appointed on 28 May 2010. He has over 30 years’ experience in designing, implementing and managing gold and base metal exploration and acquisition programmes throughout the world. Alex was Executive Vice President, Exploration and Corporate Development at Barrick Gold with responsibility for its international exploration programmes and corporate development activities. Prior to joining Barrick Gold, Alex was Vice President, Exploration for Metall Mining Corporation. In April 2005, he was presented the 2005 A.O. Dufresne Award by the Canadian Institute of Mining, Metallurgy and Petroleum. In 2003, he was named the Prospector of the Year by the Prospectors and Developers Association of Canada. Alex has been a director of a number of London and Toronto listed companies, including Highland Gold and Namakwa Diamonds, and currently serves on the board of six such companies, including Kobex Mineral Inc and Yamana Gold. He received his B.Sc. and his M.Sc. in Economic Geology from McGill University.
David Regan Payne
Timothy Philip Read
Craig Ian Burton
Alexander John Davidson
Directors’ Profile
Financial Contents
18 Corporate Governance Statement
25 Directors’ Remuneration Report
28 Directors’ Responsibilities
29 Report of the Independent Auditors
30 Statements of Comprehensive Income
31 Statements of Financial Position
32 Statements of Changes in Equity
34 Statements of Cash Flows
35 Notes to the Annual Financial Statements
Glossary
ARPOR Average Revenue Per Operating Rig
EBIT Earnings Before Interest and Taxes
EBITDA Earnings Before Interest, Taxes, Depreciation and Amortisation
EPS Earnings Per Share
ETR Effective Tax Rate
HSSE Health, Safety, Social and Environment
KPI Key Performance Indicator
LTI Lost Time Injury
NPAT Net Profi t After Tax
YOY Year On Year
Corporate Governance Statement
18 CAPITAL DRILLING LIMITED Annual Report 2011
Capital Drilling recognises the value and importance of high standards of corporate governance and has put in place a framework appropriate for a smaller quoted company to ensure that such standards are met. The Company is subject to the UK Corporate Governance Code which was issued in June 2010 by the Financial Reporting Council (the “Code’). The Company falls outside the FTSE 350 Share Index and is considered a “smaller quoted company”.
This section of our annual report sets out how the Company has applied the Code in 2011. The Code is available at www.frc.org.uk. Details of the Company’s corporate governance policies and procedures (including the terms of reference of each of its corporate governance committees) can be found on the governance page of the Company’s website at www.capdrill.com.
Statement of compliance with the Combined Code
During the year ended 31 December 2011, the Company has been in compliance with the Code except as explained below.
The Code recommends that at least half the board, excluding the chairman, should comprise of independent non-executive directors. The Code recommends that for smaller quoted companies the board should have at least two independent non-executive directors. The Board considers that Alex Davidson and Tim Read are independent, and so the Company satisfi es the requirements of the Code for smaller quoted companies. The Board does not consider Craig Burton to be independent because of his historic ties and his signifi cant shareholding in the Company.
The Code also recommends that the Chairman of the Board should be independent. The directors do not consider Jamie Boyton to be independent because of his historic ties with the Company, his employment with the Company and his signifi cant shareholding in the Company and so the Company will not satisfy this requirement of the Code. However, in view of his knowledge of the Company and specifi c strategic role within the Company, the Board considers it appropriate at this stage, to maintain Jamie Boyton as Chairman. In addition, the Company has appointed a senior independent director (as described below) to be available to address any queries or concerns from shareholders.
The Code also recommends that the Board should appoint one of its independent non-executive directors to be the senior independent director. The senior independent director should be available to shareholders if they have concerns that contact through the normal channels of chairman, chief executive offi cer or chief fi nancial offi cer has failed to resolve or for which such contact is inappropriate. The Company’s senior independent director is Tim Read.
In accordance with the Code, the Company has established guidelines requiring specifi c matters to be subject to decision by a majority of the full Board including material acquisitions and disposals, investments and capital projects.
The Code recommends that a UK listed company should establish an audit committee, a remuneration committee and a nomination committee. The Company has each of these committees, the terms of reference of which are described in further detail below. In view of the Company’s commitment to health and safety and its desire to minimise any adverse environmental impact of the business, the Board has also established a Health, Safety, Social and Environmental Committee (“HSSE”), details of which are set out below.
Board of directors
The Board comprises:
Executive Directors:Jamie Boyton – Executive Chairman Geoff Fardell – Chief Executive Offi cer (nominated to the board for approval by shareholders at the AGM scheduled for 26 April 2012)Brian Rudd – Executive DirectorDavid Payne – Chief Financial Offi cer (due to retire by rotation at the AGM scheduled for 26 April 2012 and will not be seeking re-election)
Non-Executive Directors:Tim Read – Senior Independent Director Alex Davidson – Independent Director Craig Burton – Non-Independent Director
CAPITAL DRILLING LIMITED Annual Report 2011 19
Corporate Governance Statement
The executive and non-executive directors are satisfi ed that the Company operates an effective board which is collectively responsible for the success of the Company. Together, the executive and non-executive directors bring a broad range of business, commercial and other relevant experience to the Board, which is vital to the management of an expanding company. (Pages 15 and 16 contain descriptions of the background of each director).
The terms and conditions of appointment of the non-executive directors are available for inspection at the Company’s registered offi ce and will also be available at the AGM. Brief details of these terms and conditions are also set out in the Directors’ Remuneration Report.
The Board is satisfi ed that each of the non-executive directors committed suffi cient time during 2011 for the fulfi lment of their duties as directors of the Company. None of the non-executive directors have any confl ict of interest which has not been disclosed to the Board.
The number of Board and Committee meetings eligible for attendance and attended by each of the directors during the year was as follows:
Board meetings*
Audit and Risk Committee meetings*
Remuneration Committee meetings*
Nomination Committee meetings*
HSSE Committee meetings*
Number of meetings held in period 6 3 3 1 2Jamie Boyton 6 – – – –Brian Rudd 6 – – – 2David Payne^ 6 – – – –Tim Read 6 3 3 1 –Alex Davidson 6 3 3 1 2Craig Burton 6 3 3 1 –
* - include meetings held in February 2012 ^ - retiring by rotation and would not be seeking re-election at the Company’s forthcoming AGM. Mr David Payne, who remains as the
CFO of the Company, would be invited to future meetings.
On appointment, and throughout their tenure, directors receive appropriate training and regular presentations are made to the Board by senior management and external advisers.
All directors are authorised to obtain, at the Company’s expense and subject to the Executive Chairman’s approval, independent legal or other professional advice where they consider it necessary. All directors have access to the Company Secretary, who oversees their ongoing training and development needs.
Election and re-election of directors
The Company’s Bye-Laws contain detailed rules for the appointment and retirement of directors. There is a formal procedure in place to select and appoint new directors to the Board. These directors are required to retire at the next AGM, but can offer themselves for re-election by shareholders. All directors are required to submit themselves for re-election at intervals not exceeding three years. The Board has also accepted the recommendation of the Nomination Committee to appoint the Group’s new Chief Executive Offi ce, Mr Geoff Fardell, to the Board at the upcoming Annual General Meeting where Mr David Payne has also indicated his intention to retire from the Board and would not be seeking re-election.
The Board annually evaluates the performance of individual directors, the Board as a whole and its Committees. The evaluation comprises structured interviews led by the Executive Chairman and the Senior Independent Director with the other directors. The performance of the executive and non-executive directors was appraised by the Executive Chairman, taking into account the views of the other directors. Led by the Senior Independent Director, the performance of the Executive Chairman was assessed by the non-executive directors, taking into account the views of the other executive directors.
Corporate Governance Statement
20 CAPITAL DRILLING LIMITED Annual Report 2011
Operation of the Board
The Board meets regularly and 6 meetings (including the Board meeting held in February 2012) were held in 2011. All directors are supplied, in advance of meetings, with appropriate information covering matters which are to be considered. The Executive Chairman also met with the non-executive directors in the absence of the other executive directors.
There is a formal schedule of decisions reserved for the Board. This includes approval of the following: the Group’s strategy; the annual operating plan and budget; the annual and interim fi nancial statements; signifi cant transactions; major capital expenditures; risk management policies; the authority levels vested in management; Board appointments; and remuneration policies. As described below, the review of certain matters is delegated to Board Committees, which make recommendations to the Board in relation to those matters reserved for the Board as a whole.
Audit and Risk Committee
The Audit and Risk Committee comprises Tim Read (chairman), Alex Davidson and Craig Burton.
The profi les of the Audit and Risk Committee members are on page 16 and are considered to have recent and relevant fi nancial experience. The Committee met 3 times in 2011 and had met the external auditors separately on one occasion.
The Committee may, from time to time, invite the Company’s Chief Executive Offi cer and Chief Financial Offi cer to attend its meetings.
The Code recommends that smaller quoted companies have two independent non-executive directors appointed to the Audit and Risk Committee. Tim Read and Alex Davidson are non-executive independent directors and therefore the Company complies with the Code for smaller quoted companies.
The Audit and Risk Committee is primarily concerned with the effectiveness of the Company’s accounting policies and practices, fi nancial reporting and internal controls. It is among other things responsible for:
(i) monitoring the integrity of fi nancial statements, including reviewing the fi nancial statements and signifi cant fi nancial returns to regulators and any formal announcements relating to the Company’s fi nancial performance;
(ii) reviewing the integrity of internal fi nancial control and risk management systems and codes of corporate conduct and ethics;
(iii) making recommendations to the Board regarding the engagement of independent auditors;
(iv) reviewing the plan, scope and results of the annual audit, the independent auditor’s letter of comments and management’s response thereto;
(v) reviewing and approving the internal audit plan and management’s response to the internal audit;
(vi) receiving reports from the internal audit and others relating to risk control;
(vii) approving all audit and non-audit services;
(viii) reviewing policies and procedures with respect to internal accounting and fi nancial controls; and
(ix) reviewing any changes in accounting policy.
CAPITAL DRILLING LIMITED Annual Report 2011 21
Corporate Governance Statement
In 2011, the Audit and Risk Committee:
(i) reviewed the 2011 half-year report and the 2011 annual report and fi nancial statements, in advance of their consideration by the Board, and considered the appropriateness and consistency of application of accounting policies adopted in their preparation and the basis of any major judgements and estimates. As part of this review, the Audit and Risk Committee received a report from the external auditors on their review of the 2011 half-year report and their audit of the 2011 annual report;
(ii) reviewed proposed changes to the Group’s internal controls;
(iii) received a report from the external auditors on, and considered the effectiveness of, the Group’s accounting and internal control systems and monitored the actions taken by management in response;
(iv) considered and agreed the scope of the review to be undertaken by the external auditors on the 2011 half-year report and 2011 annual report;
(v) agreed the fees to be paid to the external auditors for the review of the 2011 half-year report and for the audit of the 2011 annual report;
(vii) received updates from the auditors on new accounting pronouncements, regulation and best practice; and
(vii) reviewed its own effectiveness.
The chairman of the Audit and Risk Committee reported to the Board on its activities after each meeting, identifying relevant matters requiring communication to the Board and recommendations on the steps to be taken.
External auditors
The Audit and Risk Committee is responsible for making recommendations to the Board, to be put to shareholders at the Annual General Meeting, in relation to the appointment, re-appointment and removal of the external auditors, as well as for the approval of their remuneration and their terms of engagement. The Committee has considered the independence of the external auditors and is satisfi ed that independence has been maintained. Following consideration and satisfaction of the performance of the Company’s auditors, the Audit and Risk Committee has recommended to the Board that the external auditors be re-appointed. The Audit and Risk Committee also pre-approves any material permitted non-audit engagements with the Group auditors (of which there were none during the period under review). Regular reports were presented on the fees paid to the external auditors in order to ensure that the relationship between non-audit fees and audit fees was not inappropriate. The Audit and Risk Committee reviewed the external audit plan proposed by the auditors and participated in the review of the quality of the service that they provided. It has also met privately with the external auditors during the year without senior executive management being present.
Internal auditors
The Company did not have a formal internal audit function for the fi nancial year under review. For the fi nancial year under review, the Audit and Risk Committee, having considered the size, complexity of the operations as well as the existing internal control environment, has not recommended the need for an internal audit function. The Company intends to establish an internal audit function and is seeking a suitable candidate to assume this role.
Corporate Governance Statement
22 CAPITAL DRILLING LIMITED Annual Report 2011
Remuneration Committee
The Remuneration Committee comprises Craig Burton (chairman), Tim Read and Alex Davidson.
In respect of smaller quoted companies, the Code recommends that a company’s remuneration committee has at least two independent non-executive directors appointed. Tim Read and Alex Davidson are independent directors and therefore the Company complies with the Code for smaller quoted companies.
The Remuneration Committee sets the remuneration packages for the directors, including basic salary, bonuses and other incentivised compensation payments and awards. It ratifi es policy and framework proposals made by the executive directors in respect of the remuneration for senior executives within the Group. The Remuneration Committee also approves the grant of options under the 2010 Discretionary Share Option Plan. The Remuneration Committee is assisted by the Company Secretary and takes advice as appropriate from external advisers. The Remuneration report is set out on pages 25 to 27.
Nomination Committee
The Nomination Committee comprises Craig Burton (chairman), Tim Read and Alex Davidson.
The Code recommends that the majority of members of the nomination committee should be independent non-executive directors. Tim Read and Alex Davidson are independent non-executive directors and therefore the Company complies with the Code for smaller quoted companies. The Code also recommends that the Chairman or an independent non-executive director chairs the nomination committee. Craig Burton, who is not considered independent, is chairman and so the Company does not meet the requirements of the Code in this respect. However, in view of his experience and knowledge of the industry sector and the Company, the Board considers it appropriate for Craig Burton to be a member and chairman of the Nomination Committee.
The Nomination Committee deals with appointments to the Board, monitors potential confl icts of interest and reviews annually the independence of the non-executive directors. The Nomination Committee is also responsible for proposing candidates for appointment to the Board having regard to the balance and structure of the Board. The Nomination Committee also continues to look to identify further non-executive directors for appointment with the help of external search consultants to bring the composition of the Board in compliance with the Code. In 2011, the Nomination Committee deliberated and considered the appointment of Mr Geoff Fardell as the Group’s new Chief Executive Offi cer from 1 January 2012, and the shift in focus for Mr Brian Rudd towards business development.
Through an external search consultant, Mr Geoff Fardell commenced with the Group as an executive consultant in April 2011 and was appointed Deputy Chief Executive Offer of the Company in July 2011. Details of his profi le can be found on page 15.
Health, Safety, Social and Environment Committee (the “HSSE Committee”)
The Health, Safety, Social and Environment (the “HSSE Committee”) comprises of Alex Davidson (chairman), Brian Rudd and Wayne Healey (General Manager – Capital Support Services). The HSSE Committee is responsible for formulating and recommending to the Board a policy on health, safety, social and environmental issues related to the Group’s operations. In particular, the HSSE Committee focuses on compliance with applicable standards to ensure that an effective system of health, safety, social and environmental standards, procedures and practices is in place at each of the Group’s operations. The HSSE Committee is also responsible for reviewing management’s investigation of incidents or accidents that occur and to assess whether policy improvements are required. While the HSSE Committee is expected to make recommendations, the ultimate responsibility for establishing the Group’s health, safety, social and environmental policies remain with the Board. The terms of reference of the HSSE Committee are available on the Company’s website at www.capdrill.com.
CAPITAL DRILLING LIMITED Annual Report 2011 23
Corporate Governance Statement
Internal Controls
The Company has complied with the Combined Code provisions on internal control having established the procedures necessary to implement the guidance issued in October 2005 (the Turnbull Guidance) and by reporting in accordance with that guidance.
Maintaining a sound system of internal control
The Board conducts a periodic review of the effectiveness of the Group’s system of internal controls.
The Board’s assessment includes a review of the major fi nancial and non-fi nancial risks to the business and the corresponding internal controls. Where weaknesses or opportunities for improvement are identifi ed, clear action plans are put in place and implementation is monitored by senior management and the executive directors.
In instances where the Group is setting up operations in a new country or a new region, appropriate personnel are deployed or recruited and training is conducted to facilitate the integration with Group operational and fi nancial policies.
In addition, there are clear lines of responsibilities for key risk areas such as acquisitions, capital expenditure, compliance, information technology and operations. These lines of responsibilities are continuously monitored by the executive directors and to ensure that the Group’s strategic risk management principles are met.
Reviewing the effectiveness of internal control
The Board has overall responsibility for the Company’s system of internal control and reviewing its effectiveness. The system of internal control is designed to manage rather than eliminate the risk of failure to achieve business objectives. In pursuing these objectives, internal controls can only provide reasonable and not absolute assurance against material misstatement or loss.
In addition to the process of assessment of internal control and the monitoring of the effectiveness of internal fi nancial control by the Audit and Risk Committee, the process used by the Board to review the effectiveness of the system of internal control can be summarised as follows:
(i) Control environment
The Board is committed to maintaining a control-conscious culture across the Group whilst allowing the business streams suffi cient autonomy to manage and develop their businesses. This is communicated to employees by way of regular management meetings and dissemination of updated Group policies. Monthly commercial meetings are also held between the corporate headquarters in Singapore and the respective country managers where weaknesses in internal controls are identifi ed and clear action plans are drawn up.
(ii) Financial reporting
There is a comprehensive system of fi nancial reporting to the Board including comparison to an annual budget prepared in line with the Group’s strategic plan and formally adopted by the Board, rolling forecasts and monthly reporting of fi nancial and operating results. Key performance indicators are continuously monitored by senior management and executive directors.
(ii) Group procedures manual
Responsibility levels are communicated throughout the Group as part of the Group procedures manual, which sets out delegation of authority and authorisation levels and other control procedures, together with accounting and reporting procedures. The manual is updated periodically to take into account changes in the accounting standards, reporting requirements and operational procedures. Senior management is also provided with training and guidance, where necessary, to ensure that the current and future needs of the Group are met.
Corporate Governance Statement
24 CAPITAL DRILLING LIMITED Annual Report 2011
Share dealing policy
The Company has a share dealing policy, which imposes dealing obligations at least as rigorous as those required by the Model Code of the London Stock Exchange Listing Rules. The share dealing policy applies to the directors, persons discharging managerial responsibilities (“PDMR”) identifi ed by the Board and other relevant insider employees of the Group, and their respective connected persons. All employees under the share dealing policy are restricted from dealing in the Company’s shares during close periods or if they are in possession of inside information.
Shareholder relations
The Executive Chairman, Chief Executive Officer and the Chief Financial Officer are the Group’s principal spokesmen with investors, analysts, fund managers, the press and other interested parties. Access is available to the Senior Independent Director and other non-executive directors if this is required. The Board is kept informed about shareholder relations and in particular the Senior Independent Director is kept informed of the views of major shareholders. This is done by a combination of reports to the Board on meetings held and feedback to the Board from the Group’s advisers. The Group holds briefi ng meetings with analysts and institutional shareholders, usually following the half year and fi nal results announcements, to ensure that the investing community receives a balanced and complete view of the Group’s performance and the issues faced by the business.
The Group provides fi nancial statements to all shareholders twice a year when its half year and full year results are announced and provides interim management statements as required. These results and all other stock exchange announcement information are available on the Group’s website www.capdrill.com. Management presentations as well as other information relevant to investors are also available on the website.
All shareholders are given at least 21 working days’ notice of the AGM. It is standard practice for all directors to attend the AGM to which all shareholders are invited and at which they may raise questions to the chairmen of the various committees or the Board generally. The proxy votes for and against each resolution, as well as abstentions (which may be recorded on the proxy form accompanying the notice of AGM) are counted before the AGM commences and are made available to shareholders at the close of the formal business of the meeting. The proxy votes are announced through the stock exchange and posted on the Company’s website shortly after the close of the meeting.
Directors’ Remuneration Report
CAPITAL DRILLING LIMITED Annual Report 2011 25
The Remuneration Committee
The Remuneration Committee comprises Craig Burton (chairman), Tim Read and Alex Davidson.
The Remuneration Committee reviews and determines, on behalf of the Board, the salary and benefi ts packages of the Executive Chairman and the other executive directors. The Remuneration Committee also considers and approves all awards made by the Company to employees under the 2010 Discretionary Share Option Plan. Fees for the non-executive directors are based on their letters of appointment entered into with the Company and reviewed annually by the Board. The Remuneration Committee met three times during the year and all three members attended every meeting.
In determining the executive directors’ remuneration for the year, the Remuneration Committee consulted the Executive Chairman and/or Chief Executive Offi cer as appropriate, save in relation to his own remuneration. No director is involved in deciding his own remuneration. In deciding the executive directors’ remuneration, the Remuneration Committee draws on its members’ experience and knowledge of the industry sector of the Company and also makes use of published reports on directors’ remuneration packages within the same industry, taking into account the size and complexity of the business. The Remuneration Committee also has access to advice from independent external advisers where necessary. During 2011, the Remuneration Committee engaged external remuneration consultants to carry out a provisional assessment of the Company’s remuneration structure.
Remuneration policy
Compensation packages for executive directors are based on their service agreements entered into with the Company. The package for each executive director currently comprises an annual salary. In addition, each executive director is also issued with share options under the 2010 Discretionary Share Option Plan.
In reviewing and setting compensation packages for executive directors, the Remuneration Committee takes into account a wide range of factors, including the Group’s fi nancial performance, market trends and practices, and individual contributions across a range of performance measures, such as health and safety standards, training standards and reducing any negative environmental and social impact of the business.
Annual salary
The Remuneration Committee’s policy is to set the annual salaries of each executive director at levels that refl ect their roles, experience and the practices in the employment market whilst ensuring that they are in line with the pay and employment conditions of other employees within their business units. The remuneration of the executive was as follows:
Salary2011
US$’000
Salary2010
US$’000Executive chairman Jamie Boyton 361 325
Executive directorBrian RuddDavid Payne
402341
392325
Share Option
The 2010 Discretionary Share Option Plan
The 2010 Discretionary Share Option Plan was approved by shareholders on 28 May 2010 and will expire on 6 June 2020 or on such earlier date as the Remuneration Committee may at any time determine. It is designed to motivate directors and senior employees, whilst retaining them in the Company’s employment, by granting options to acquire shares in the Company. The Remuneration Committee regularly considers when and to whom awards should be granted having regard to the importance of retaining and motivating key employees who make a material contribution to the business. The Remuneration Committee does not believe that the share incentive structure raises any environmental, social and governance risks.
Directors’ Remuneration Report
26 CAPITAL DRILLING LIMITED Annual Report 2011
Under the rules of the 2010 Discretionary Share Option Plan, an employee may not receive options in any fi nancial year such that the aggregate market value of the Company’s shares comprised in the options exceeds 200% of his annual salary.
At 31 December 2011, the share options awarded to each director were as follows:
At 1 January
2011 Granted Lapsed Exercised
At 31 December
2011Exercise price £
Date from which
exercisable Expiry dateExecutivechairmanJamie Boyton
150,000150,000150,000
–––
–––
–––
150,000150,000150,000
0.800.800.80
1 January 20121 January 20131 January 2014
31 December 201431 December 201431 December 2014
ExecutivedirectorsBrianRudd
David Payne
150,000150,000150,000
150,000150,000150,000
–––
–––
–––
–––
–––
–––
150,000150,000150,000
150,000150,000150,000
0.800.800.80
0.800.800.80
1 January 20121 January 20131 January 2014
1 January 20121 January 20131 January 2014
31 December 201431 December 201431 December 2014
31 December 201431 December 201431 December 2014
Non-executive directorsAlex Davidson – – – – – – – –
Tim Read – – – – – – – –
Craig Burton – – – – – – – –
Service contracts
The executive directors’ service contracts have no specifi ed term. No director has a service contract containing more than a six months notice period or with pre-determined compensation provisions upon termination exceeding six months’ salary and benefi ts. It is the Company’s policy that, except where prescribed by law, there should be no automatic entitlement to bonuses in the event of an early termination.
External appointments
The Company recognises that executive directors may be invited to become non-executive directors of other companies and that such appointments can broaden their knowledge and experience to the benefi t of the Company and they are entitled to retain any fees earned. Mr Jamie Boyton holds directorships of Sahar Minerals Ltd and Cannon Investment Management. Mr Brian Rudd holds directorship of Sahar Minerals Ltd. None of the other current executive directors held non-executive directorships for which they were remunerated.
Directors’ Remuneration Report
CAPITAL DRILLING LIMITED Annual Report 2011 27
Non-executive directors
Non-executive directors are appointed initially until the fi rst AGM of the Company following appointment when they are required to stand for re-election and, subject to their re-election, thereafter for three years before standing again for re-election.
The non-executive directors entered into letters of appointment with the Company on 28 May 2010 for an initial period of three years commencing, thereafter renewable on the agreement of both the Company and the director. The letters of appointment specify the following termination notice periods and fees:
Notice Period Annual Fee / US$Alex Davidson 3 months 65,000Tim Read 3 months 82,500Craig Burton 3 months 65,000
The annual fees of the non-executive directors were as follow:
Fees2011
US$’000
Fees1
2010US$’000
Total 2011
US$’000Total 2010 US$’000
Non-executive directorsAlex Davidson 65 37 65 37Tim Read 83 47 83 47Craig Burton 65 37 65 37
1 In the period under review, the non-executive directors’ fees are prorated for the number of months appointed
Approval
This report was approved by the Board of Directors on 18 March 2012 and signed on its behalf by:
Craig BurtonRemuneration Committee Chairman
Directors’ Responsibilities
28 CAPITAL DRILLING LIMITED Annual Report 2011
The directors are responsible for preparing this Annual Report, directors’ remuneration report and the fi nancial statements in accordance with applicable laws and regulations.
The directors are required to prepare group fi nancial statements for each fi nancial year giving a true and fair view of the Group’s state of affairs of the end of the year and profi t or loss for the year, in accordance with International Financial Reporting Standards (IFRSs) as issued by the International Accounting Standards Board. The directors have also chosen to prepare the parent company fi nancial statements under IFRSs. The directors must not approve the accounts unless they are satisfi ed that they give a true and fair view of the state of affairs of the company and of the profi t or loss of the company for that period. In preparing these fi nancial statements International Accounting Standard 1 “Presentation of Financial Statements” require the directors to:
properly select and apply accounting policies;
present information, including accounting policies, in a manner that provides relevant, reliable, comparable and understandable information; and
provide additional disclosures when compliance with the specifi c requirements in IFRSs are insuffi cient to enable users to understand the impact of particular transactions, other events and conditions on the entity’s fi nancial position and fi nancial performance; and
make an assessment of the company’s ability to continue as a going concern.
The directors are responsible for keeping proper accounting records that are suffi cient to show and explain the group’s transactions and disclose with reasonable accuracy at any time the fi nancial position of the group. They are also responsible for safeguarding the assets of the group and hence for taking reasonable steps for the prevention and detection of fraud and other irregularities.
The directors are responsible for the maintenance and integrity of the corporate and fi nancial information included on the company’s website.
Directors’ responsibility statement
We confi rm to the best of our knowledge:
1. the fi nancial statements, prepared in accordance with IFRS, give a true and fair view of the assets, liabilities, fi nancial position and profi t or loss of Capital Drilling Limited and the undertakings included in the consolidation taken as a whole; and
2. the management report, which is incorporated into the Chief Executive Review and the Chief Financial Offi cer’s Report, includes a fair review of the development and performance of the business and the position of the group and the undertakings included in the consolidation taken as a whole, together with a description of the principal risks and uncertainties that they face.
By order of the Board
Executive Chairman Chief Financial Offi cerJamie Boyton David Payne18 March 2012
Report of the Independent AuditorsTo the Members of Capital Drilling Limited
CAPITAL DRILLING LIMITED Annual Report 2011 29
We have audited the Group annual fi nancial statements and Company annual fi nancial statements of Capital Drilling Limited, which comprise the consolidated and separate statements of fi nancial position as at 31 December 2011, the consolidated and separate statements of comprehensive income, the consolidated and separate statements of changes in equity and the consolidated and separate statements of cash fl ows for the year then ended, and a summary of signifi cant accounting policies and other explanatory notes, as set out on pages 30 to 72.
Directors’ responsibility for the fi nancial statements The directors are responsible for the preparation and fair presentation of these fi nancial statements in accordance with International Financial Reporting Standards as issued by the International Accounting Standards Board, and for such internal control as the directors determine is necessary to enable the preparation of fi nancial statements that are free from material misstatement, whether due to fraud or error.
Auditor’s responsibility Our responsibility is to express an opinion on these fi nancial statements based on our audit. We conducted our audit in accordance with International Standards on Auditing as issued by the International Auditing and Assurance Standards Board. Those standards require that we comply with ethical requirements and plan and perform the audit to obtain reasonable assurance whether the fi nancial statements are free from material misstatement.
An audit involves performing procedures to obtain audit evidence about the amounts and disclosures in the fi nancial statements. The procedures selected depend on the auditor’s judgment, including the assessment of the risks of material misstatement of the fi nancial statements, whether due to fraud or error. In making those risk assessments, the auditor considers internal control relevant to the entity’s preparation and fair presentation of the fi nancial statements in order to design audit procedures that are appropriate in the circumstances, but not for the purpose of expressing an opinion on the effectiveness of the entity’s internal control.
An audit also includes evaluating the appropriateness of accounting policies used and the reasonableness of signifi cant estimates made by the directors, as well as evaluating the overall fi nancial statement presentation and disclosures. We believe that the audit evidence that we have obtained is suffi cient and appropriate to provide a reasonable basis for our opinion.
Opinion In our opinion, the fi nancial statements fairly presents, in all material respects, the consolidated and separate fi nancial position of Capital Drilling Limited as at 31 December 2011 and its consolidated and separate fi nancial performance and consolidated and separate cash fl ows for the year then ended in accordance with International Financial Reporting Standards as issued by the International Accounting Standards Board.
Matters on which we are required to report by exceptionWe have nothing to report in respect of the following matters:
Under the Listing Rules of the London Stock Exchange, we are required to review:
the director’s statement contained within the business review in relation to going concern; and
the part of the Corporate Governance Statement relating to the Company’s compliance with the nine provisions of the UK corporate governance Code specifi ed for our review.
Deloitte & Touche
Per: A.W. BrownPartner 18 March 2012
Deloitte & ToucheBuilding 2, Deloitte Place, The Woodlands, Woodlands Drive, Woodmead, Johannesburg, Republic of South Africa
National Executive: GG Gelink Chief Executive AE Swiegers Chief Operating Offi cer GM Pinnock Audit DL Kennedy Risk Advisory & Legal Services NB Kader Tax L Geeringh Consulting L Bam Corporate Finance JK Mazzocco Human Resources CR Beukman Finance TJ Brown Chairman of the Board MJ Comber Deputy Chairman of the Board.
A full list of partners and directors is available on request.
Member of Deloitte Touche Tohmatsu Limited
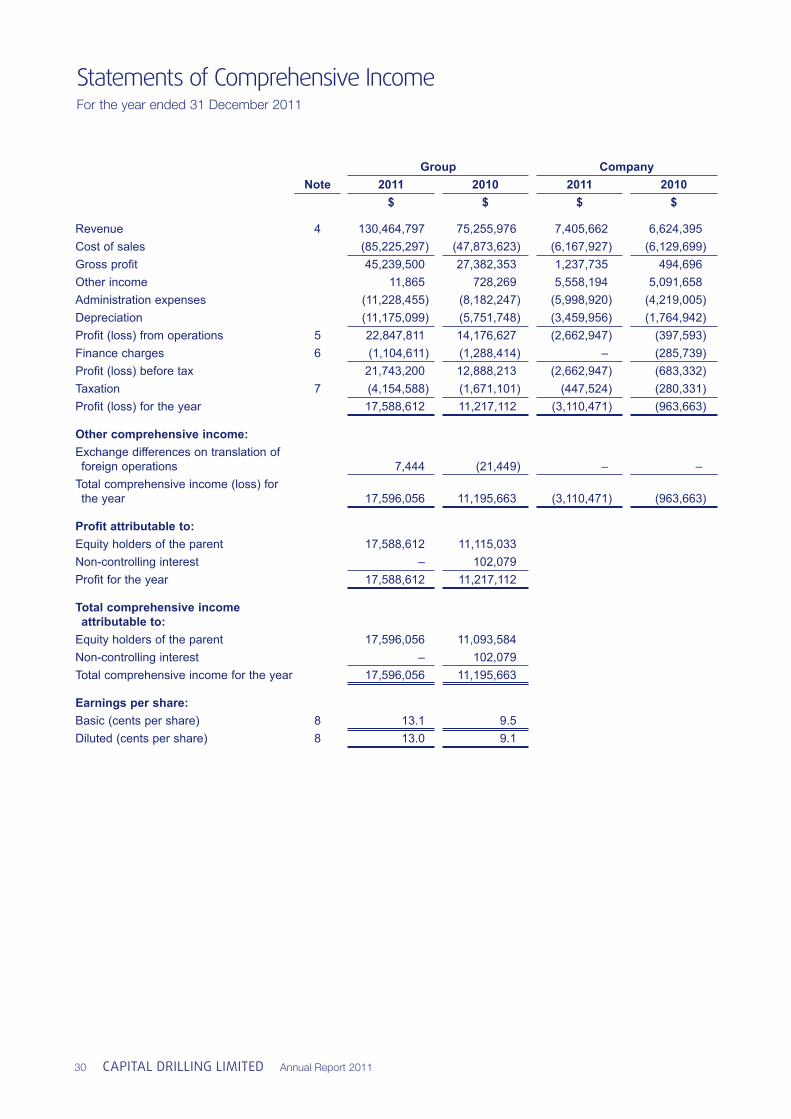
Statements of Comprehensive IncomeFor the year ended 31 December 2011
30 CAPITAL DRILLING LIMITED Annual Report 2011
Group CompanyNote 2011 2010 2011 2010
$ $ $ $
Revenue 4 130,464,797 75,255,976 7,405,662 6,624,395 Cost of sales (85,225,297) (47,873,623) (6,167,927) (6,129,699)Gross profi t 45,239,500 27,382,353 1,237,735 494,696 Other income 11,865 728,269 5,558,194 5,091,658 Administration expenses (11,228,455) (8,182,247) (5,998,920) (4,219,005)Depreciation (11,175,099) (5,751,748) (3,459,956) (1,764,942)Profi t (loss) from operations 5 22,847,811 14,176,627 (2,662,947) (397,593)Finance charges 6 (1,104,611) (1,288,414) – (285,739)Profi t (loss) before tax 21,743,200 12,888,213 (2,662,947) (683,332)Taxation 7 (4,154,588) (1,671,101) (447,524) (280,331)Profi t (loss) for the year 17,588,612 11,217,112 (3,110,471) (963,663)
Other comprehensive income:Exchange differences on translation of foreign operations 7,444 (21,449) – – Total comprehensive income (loss) for the year 17,596,056 11,195,663 (3,110,471) (963,663)
Profi t attributable to:Equity holders of the parent 17,588,612 11,115,033 Non-controlling interest – 102,079 Profi t for the year 17,588,612 11,217,112
Total comprehensive income attributable to:Equity holders of the parent 17,596,056 11,093,584 Non-controlling interest – 102,079 Total comprehensive income for the year 17,596,056 11,195,663
Earnings per share:Basic (cents per share) 8 13.1 9.5 Diluted (cents per share) 8 13.0 9.1
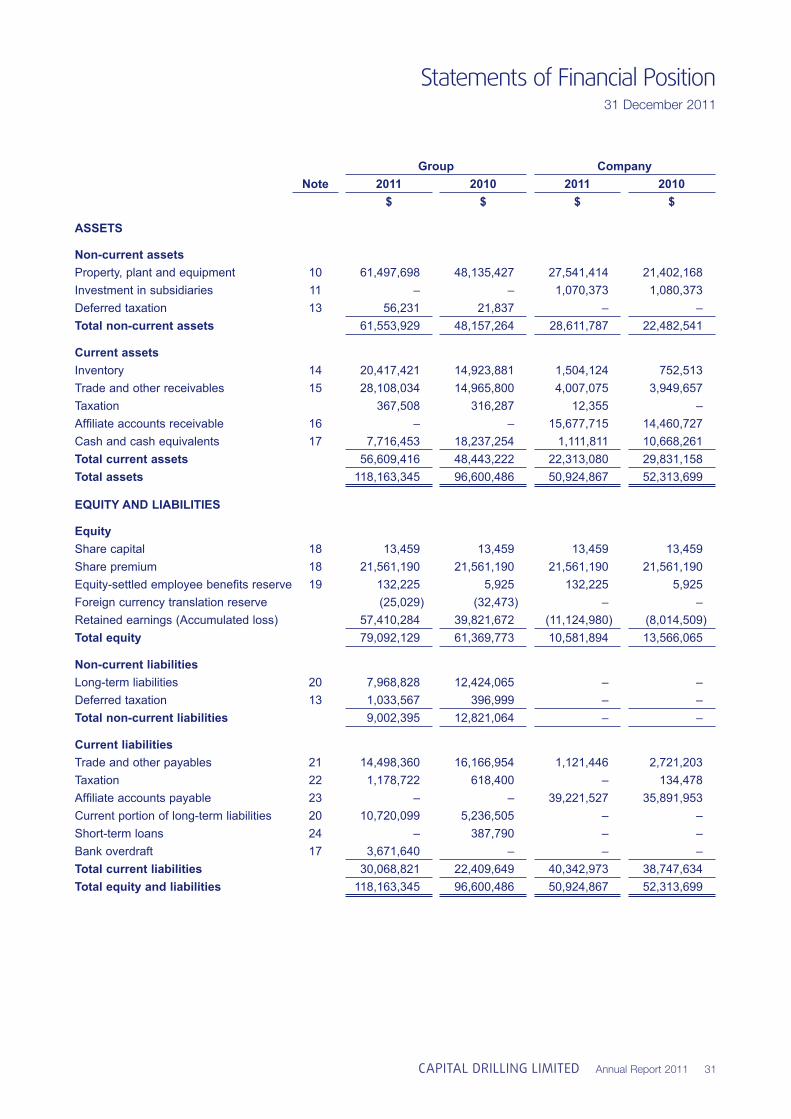
Statements of Financial Position31 December 2011
CAPITAL DRILLING LIMITED Annual Report 2011 31
Group CompanyNote 2011 2010 2011 2010
$ $ $ $
ASSETS
Non-current assetsProperty, plant and equipment 10 61,497,698 48,135,427 27,541,414 21,402,168 Investment in subsidiaries 11 – – 1,070,373 1,080,373 Deferred taxation 13 56,231 21,837 – – Total non-current assets 61,553,929 48,157,264 28,611,787 22,482,541
Current assetsInventory 14 20,417,421 14,923,881 1,504,124 752,513 Trade and other receivables 15 28,108,034 14,965,800 4,007,075 3,949,657 Taxation 367,508 316,287 12,355 – Affi liate accounts receivable 16 – – 15,677,715 14,460,727 Cash and cash equivalents 17 7,716,453 18,237,254 1,111,811 10,668,261 Total current assets 56,609,416 48,443,222 22,313,080 29,831,158 Total assets 118,163,345 96,600,486 50,924,867 52,313,699
EQUITY AND LIABILITIES
EquityShare capital 18 13,459 13,459 13,459 13,459 Share premium 18 21,561,190 21,561,190 21,561,190 21,561,190 Equity-settled employee benefi ts reserve 19 132,225 5,925 132,225 5,925 Foreign currency translation reserve (25,029) (32,473) – – Retained earnings (Accumulated loss) 57,410,284 39,821,672 (11,124,980) (8,014,509)Total equity 79,092,129 61,369,773 10,581,894 13,566,065
Non-current liabilitiesLong-term liabilities 20 7,968,828 12,424,065 – – Deferred taxation 13 1,033,567 396,999 – – Total non-current liabilities 9,002,395 12,821,064 – –
Current liabilitiesTrade and other payables 21 14,498,360 16,166,954 1,121,446 2,721,203 Taxation 22 1,178,722 618,400 – 134,478 Affi liate accounts payable 23 – – 39,221,527 35,891,953 Current portion of long-term liabilities 20 10,720,099 5,236,505 – – Short-term loans 24 – 387,790 – – Bank overdraft 17 3,671,640 – – – Total current liabilities 30,068,821 22,409,649 40,342,973 38,747,634 Total equity and liabilities 118,163,345 96,600,486 50,924,867 52,313,699
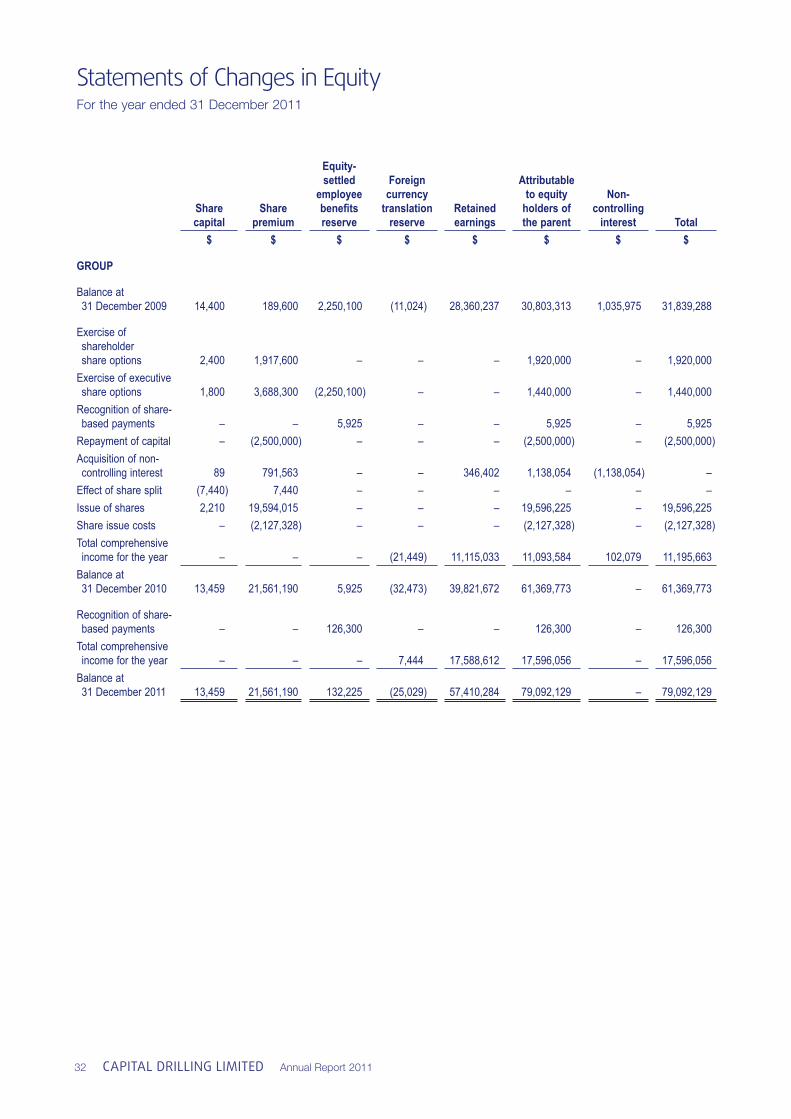
Statements of Changes in EquityFor the year ended 31 December 2011
32 CAPITAL DRILLING LIMITED Annual Report 2011
Share capital
Share premium
Equity-settled
employee benefi ts reserve
Foreign currency
translation reserve
Retained earnings
Attributable to equity
holders ofthe parent
Non-controlling
interest Total$ $ $ $ $ $ $ $
GROUP
Balance at 31 December 2009 14,400 189,600 2,250,100 (11,024) 28,360,237 30,803,313 1,035,975 31,839,288
Exercise of shareholder share options 2,400 1,917,600 – – – 1,920,000 – 1,920,000 Exercise of executive share options 1,800 3,688,300 (2,250,100) – – 1,440,000 – 1,440,000 Recognition of share- based payments – – 5,925 – – 5,925 – 5,925 Repayment of capital – (2,500,000) – – – (2,500,000) – (2,500,000)Acquisition of non- controlling interest 89 791,563 – – 346,402 1,138,054 (1,138,054) – Effect of share split (7,440) 7,440 – – – – – – Issue of shares 2,210 19,594,015 – – – 19,596,225 – 19,596,225 Share issue costs – (2,127,328) – – – (2,127,328) – (2,127,328)Total comprehensive income for the year – – – (21,449) 11,115,033 11,093,584 102,079 11,195,663 Balance at 31 December 2010 13,459 21,561,190 5,925 (32,473) 39,821,672 61,369,773 – 61,369,773
Recognition of share- based payments – – 126,300 – – 126,300 – 126,300 Total comprehensive income for the year – – – 7,444 17,588,612 17,596,056 – 17,596,056 Balance at 31 December 2011 13,459 21,561,190 132,225 (25,029) 57,410,284 79,092,129 – 79,092,129
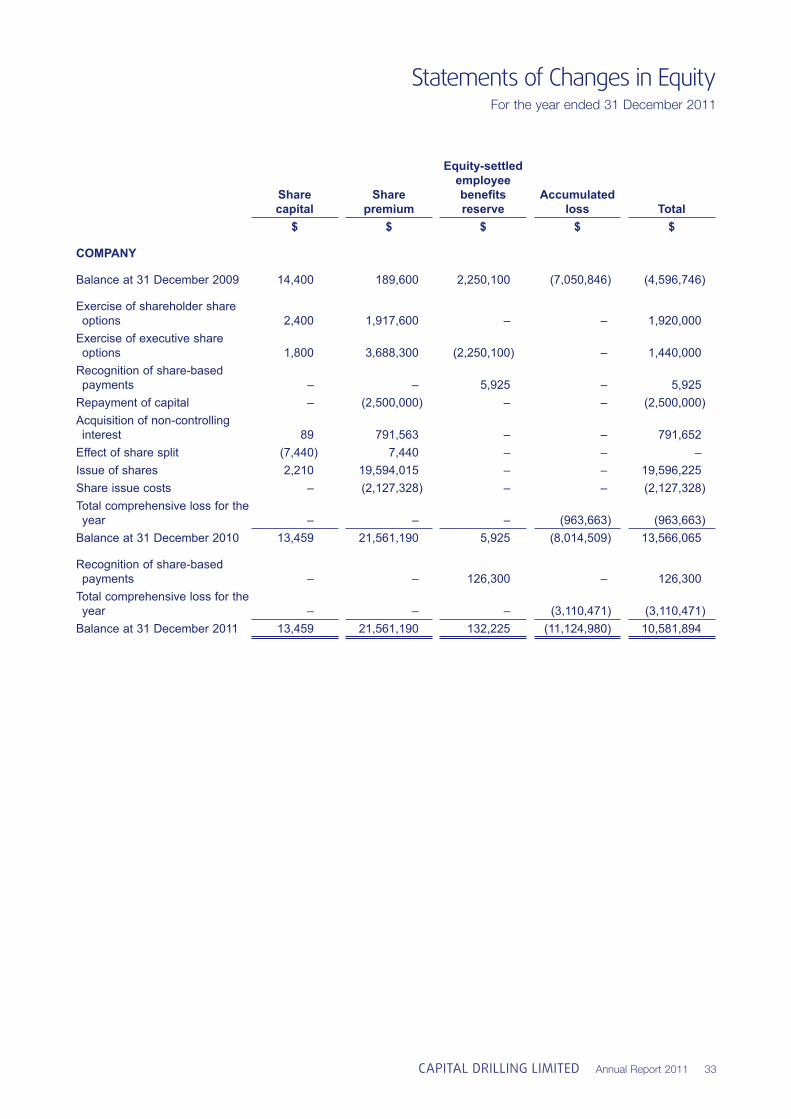
Statements of Changes in EquityFor the year ended 31 December 2011
CAPITAL DRILLING LIMITED Annual Report 2011 33
Share capital
Share premium
Equity-settled employee benefi ts reserve
Accumulated loss Total
$ $ $ $ $
COMPANY
Balance at 31 December 2009 14,400 189,600 2,250,100 (7,050,846) (4,596,746)
Exercise of shareholder share options 2,400 1,917,600 – – 1,920,000 Exercise of executive share options 1,800 3,688,300 (2,250,100) – 1,440,000 Recognition of share-based payments – – 5,925 – 5,925 Repayment of capital – (2,500,000) – – (2,500,000)Acquisition of non-controlling interest 89 791,563 – – 791,652 Effect of share split (7,440) 7,440 – – – Issue of shares 2,210 19,594,015 – – 19,596,225 Share issue costs – (2,127,328) – – (2,127,328)Total comprehensive loss for the year – – – (963,663) (963,663)Balance at 31 December 2010 13,459 21,561,190 5,925 (8,014,509) 13,566,065
Recognition of share-based payments – – 126,300 – 126,300 Total comprehensive loss for the year – – – (3,110,471) (3,110,471)Balance at 31 December 2011 13,459 21,561,190 132,225 (11,124,980) 10,581,894
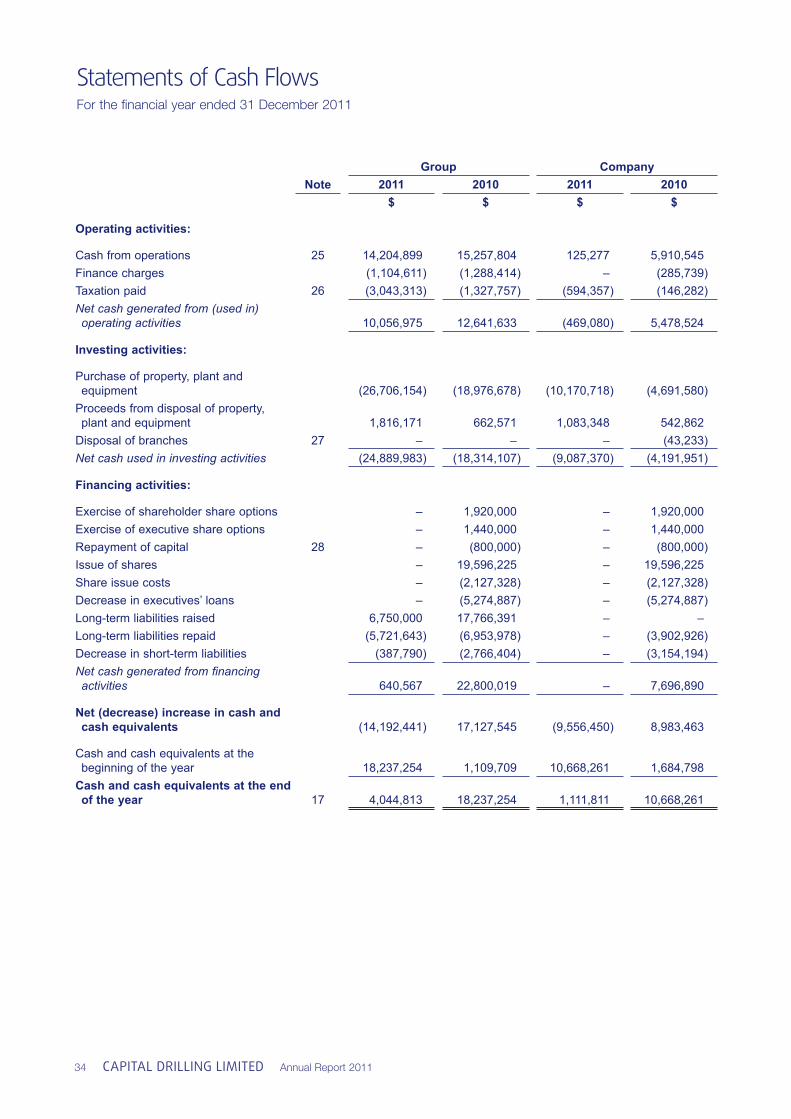
Statements of Cash FlowsFor the fi nancial year ended 31 December 2011
34 CAPITAL DRILLING LIMITED Annual Report 2011
Group CompanyNote 2011 2010 2011 2010
$ $ $ $
Operating activities:
Cash from operations 25 14,204,899 15,257,804 125,277 5,910,545 Finance charges (1,104,611) (1,288,414) – (285,739)Taxation paid 26 (3,043,313) (1,327,757) (594,357) (146,282)Net cash generated from (used in) operating activities 10,056,975 12,641,633 (469,080) 5,478,524
Investing activities:
Purchase of property, plant and equipment (26,706,154) (18,976,678) (10,170,718) (4,691,580)Proceeds from disposal of property, plant and equipment 1,816,171 662,571 1,083,348 542,862 Disposal of branches 27 – – – (43,233)Net cash used in investing activities (24,889,983) (18,314,107) (9,087,370) (4,191,951)
Financing activities:
Exercise of shareholder share options – 1,920,000 – 1,920,000 Exercise of executive share options – 1,440,000 – 1,440,000 Repayment of capital 28 – (800,000) – (800,000)Issue of shares – 19,596,225 – 19,596,225 Share issue costs – (2,127,328) – (2,127,328)Decrease in executives’ loans – (5,274,887) – (5,274,887)Long-term liabilities raised 6,750,000 17,766,391 – – Long-term liabilities repaid (5,721,643) (6,953,978) – (3,902,926)Decrease in short-term liabilities (387,790) (2,766,404) – (3,154,194)Net cash generated from fi nancing activities 640,567 22,800,019 – 7,696,890
Net (decrease) increase in cash and cash equivalents (14,192,441) 17,127,545 (9,556,450) 8,983,463
Cash and cash equivalents at the beginning of the year 18,237,254 1,109,709 10,668,261 1,684,798 Cash and cash equivalents at the end of the year 17 4,044,813 18,237,254 1,111,811 10,668,261
Notes to the Annual Financial StatementsFor the year ended 31 December 2011
CAPITAL DRILLING LIMITED Annual Report 2011 35
1. General information
Capital Drilling Limited (the “Company”) is incorporated in Bermuda. The Company and its subsidiaries (the “Group”) provide drilling services including but not limited to exploration, development, grade control and blast hole drilling services to mineral exploration and mining companies located in emerging and developed markets. The Group also provides some procurement and IT services for mining and mining exploration companies.
During the year ended 31 December 2011, the Group provided drilling services in Chile, Egypt, Eritrea, Ethiopia, Ghana, Mauritania, Mozambique, Papua New Guinea, Tanzania, and Zambia. The Group’s administrative and operations offi ces are located in Singapore and Chile.
2. Adoption of new and revised standards
2.1 Standards and Interpretations adopted with no effect on the fi nancial statements
The following new and revised standards and interpretations issued by the International Accounting Standards Board have been adopted in these fi nancial statements in the current year. Their adoption has not had any signifi cant impact on the amounts reported in these fi nancial statements but may affect the accounting for future transactions or arrangements.
Conceptual Framework for Financial Reporting 2010
IFRS 3 Business Combinations - Amendments resulting from May 2010 Annual Improvements to IFRSs
IFRS 7 Financial Instruments: Disclosures - Amendments resulting from May 2010 Annual Improvements to IFRSs
IAS 1 Presentation of Financial Statements - Amendments resulting from May 2010 Annual Improvements to IFRSs
IAS 24 Related Party Disclosures - Revised defi nition of related parties
IAS 27 Consolidated and Separate Financial Statements - Amendments resulting from May 2010 Annual Improvements to IFRSs
IAS 32 Financial Instruments: Presentation - Amendments relating to classifi cation of rights issues
IAS 34 Interim Financial Reporting - Amendments resulting from May 2010 Annual Improvements to IFRSs
IFRIC 13 Customer Loyalty Programmes - Amendments resulting from May 2010 Annual Improvements to IFRSs
IFRIC 14 IAS 19 – The Limit on a Defi ned Benefi t Asset, Minimum Funding Requirements and their Interaction - November 2009 Amendments with respect to voluntary prepaid contributions
IFRIC 19 Extinguishing Financial Liabilities with Equity Instruments
Notes to the Annual Financial StatementsFor the year ended 31 December 2011
36 CAPITAL DRILLING LIMITED Annual Report 2011
2. Adoption of new and revised standards (continued)
2.2 Standards and Interpretations in issue not yet adopted
At the date of authorisation of these fi nancial statements, other than the standards and interpretations adopted above, the following new and revised standards and interpretations were issued by the International Accounting Standards Board but were not yet effective:
IFRS 1 First-time Adoption of International Financial Reporting Standards 1
IFRS 7 Financial Instruments: Disclosures 1,4,6
IFRS 9 Financial Instruments 6
IFRS 10 Consolidated Financial Statements 4
IFRS 11 Joint Arrangements 4
IFRS 12 Disclosure of Interests in Other Entities 4
IFRS 13 Fair Value Measurement 4
IAS 1 Presentation of Financial Statements 3
IAS 12 Income Taxes 2
IAS 19 Employee Benefi ts 4
IAS 27 Separate Financial Statements 4
IAS 28 Investments in Associates and Joint Ventures 4
IAS 32 Financial Instruments: Presentation 5
1 Effective for annual periods beginning on or after 1 July 2011
2 Effective for annual periods beginning on or after 1 January 2012
3 Effective for annual periods beginning on or after 1 July 2012
4 Effective for annual periods beginning on or after 1 January 2013
5 Effective for annual periods beginning on or after 1 January 2014
6 Effective for annual periods beginning on or after 1 January 2015
The directors anticipate that all the above interpretations will be adopted in the Group’s fi nancial statements for the future fi nancial periods as it becomes effective. The adoption of these standards and interpretations will have no material impact on the fi nancial statements of the Group in the period of initial application.
Notes to the Annual Financial StatementsFor the year ended 31 December 2011
CAPITAL DRILLING LIMITED Annual Report 2011 37
3. Summary of signifi cant accounting policies
Basis of preparation
The fi nancial statements have been prepared on the historical cost basis except for fi nancial instruments which are measured at fair value. Historical cost is generally based on the fair value of the consideration given in exchange for the assets.
The fi nancial statements have been prepared in accordance with International Financial Reporting Standards issued by the International Accounting Standards Board and are presented in United States Dollars since that is the currency in which the majority of the Group’s transactions are denominated. Where additional information have been presented in the current year fi nancial statements, the prior year amounts have been re-presented to be consistent with the presentation in the current year.
The principal accounting policies adopted are set out below.
Going concern
The directors have, at the time of approving the fi nancial statements, a reasonable expectation that the Company and the Group have adequate resources to continue in operational existence for the foreseeable future. Thus they continue to adopt the going concern basis of accounting in preparing the fi nancial statements.
Basis of consolidation
The consolidated fi nancial statements incorporate the fi nancial statements of the Company and entities (including special purpose entities) controlled by the Company (its subsidiaries). Control is achieved where the Company has the power to govern the fi nancial and operating policies of an entity so as to obtain benefi ts from its activities.
Income and expenses of subsidiaries acquired or disposed of during the year are included in the consolidated statement of comprehensive income from the effective date of acquisition and up to the effective date of disposal, as appropriate.
Where necessary, adjustments are made to the fi nancial statements of subsidiaries to bring their accounting policies into line with those used by other members of the Group.
All intra-Group transactions, balances, income and expenses are eliminated in full on consolidation.
Business combinations
The acquisition of subsidiaries is accounted for using the acquisition method. The consideration transferred in a business combination is measured at the aggregate of the fair values, at the date of exchange, of assets given, liabilities incurred or assumed, and equity instruments issued by the Group in exchange for control of the acquiree. Acquisition related costs are generally recognised in profi t or loss as incurred. The acquiree’s identifi able assets, liabilities and contingent liabilities that meet the conditions for recognition under IFRS 3 are recognised at their fair values at the acquisition date, except for deferred tax assets or liabilities recognised in accordance with IAS 12 Income Taxes and non-current assets that are classifi ed as held for sale in accordance with IFRS 5 Non-Current Assets Held for Sale and Discontinued Operations, which are recognised and measured at fair value less costs to sell.
Goodwill arising on acquisition is recognised as an asset and initially measured at cost, being the excess of the costs of the business combination over the Group’s interest in the net fair value of the identifi able assets, liabilities and contingent liabilities recognised. If after reassessment, the Group’s interest in the net fair value of the acquiree’s identifi able assets, liabilities and contingent liabilities exceeds the costs of the business combination, the excess is recognised immediately in profi t or loss.
Notes to the Annual Financial StatementsFor the year ended 31 December 2011
38 CAPITAL DRILLING LIMITED Annual Report 2011
3. Summary of signifi cant accounting policies (continued)
Property, plant and equipment
Property, plant and equipment are stated at historical cost less accumulated depreciation and subsequent impairment losses. Depreciation is charged so as to write-off the cost of assets, less their residual values, over their expected useful lives using the straight-line basis, on the following basis;
Drilling rigs 5 - 12 years Associated drilling equipment 2 - 7 years Vehicles and trucks 4 - 7 years Camp and associated equipment 3 - 5 years
The estimated useful lives, residual values and depreciation method are reviewed at each reporting date, with the effect of any changes in estimate accounted for on a prospective basis.
An item of property, plant and equipment is derecognised upon disposal or when no future economic benefi ts are expected to arise from the continued use of the asset. The gain or loss arising on disposal or retirement of an item of property, plant and equipment is determined as the difference between the sales proceeds and the carrying amount of the asset and is recognised in profi t or loss.
Impairment of tangible assets
At each reporting date, the Group reviews the carrying amounts of its tangible assets to determine whether there is any indication that those assets may be impaired. If any such indication exists, the recoverable amount of the asset is estimated in order to determine the extent of the impairment loss (if any). When it is not possible to estimate the recoverable amount for an individual asset, the recoverable amount is determined for the cash-generating unit to which the asset belongs.
Recoverable amount is the higher of fair value less costs to sell and value in use. In assessing value in use, the estimated future cash fl ows are discounted to their present value using a pre-tax discount rate that refl ects current market assessments of the time value of money and the risks specifi c to the asset for which the estimates of future cash fl ows have not been adjusted.
If the recoverable amount of an asset (or cash-generating unit) is estimated to be less than its carrying amount, the carrying amount of the asset (cash-generating unit) is reduced to its recoverable amount. Impairment losses are recognised as an expense immediately, unless the relevant asset is carried at a revalued amount, in which case the impairment loss is treated as a revaluation decrease.
Where an impairment loss subsequently reverses, the carrying amount of the asset (cash-generating unit) is increased to the revised estimate of its recoverable amount, but so that the increased carrying amount does not exceed the carrying amount that would have been determined had no impairment loss been recognised for the asset (cash-generating unit) in prior years. A reversal of an impairment loss is recognised as income immediately, unless the relevant asset is carried at a revalued amount, in which case the reversal of the impairment loss is treated as a revaluation increase.
Provisions
Provisions are recognised when the Group has a present obligation (legal or constructive) as a result of a past event and it is probable that this will result in an outfl ow of economic benefi ts that can be reliably estimated. Provisions are measured at the directors’ best estimate of the expenditure required to settle the obligation at the reporting date, and are discounted to present value where the effect is material.
Notes to the Annual Financial StatementsFor the year ended 31 December 2011
CAPITAL DRILLING LIMITED Annual Report 2011 39
3. Summary of signifi cant accounting policies (continued)
Cash and cash equivalents
For the purpose of the statement of fi nancial position, cash and cash equivalents comprise cash on hand and deposits held on call with banks. Bank overdrafts are separately disclosed as current liabilities.
For the purpose of the cash fl ow statement, cash and cash equivalents comprise cash on hand and deposits held on call with banks net of bank overdrafts.
Revenue recognition
Revenue is measured at the fair value of the consideration received or receivable. Revenue is reduced for estimated customer returns, rebates and other similar allowances.
Rendering of services
Revenue from a contract to provide services is recognised by reference to the stage of completion of the contract. The stage of completion of the contract is determined as follows:
revenue from drilling contracts is recognised at the contractual drilling rates as the drilling services are delivered and direct expenses are incurred.
revenue from procurement services represent the net revenue earned and is recognised when the services are rendered.
revenue from equipment rental in recognised on a straight line basis over the lease term.
revenue from information technology services is recognised when the services are rendered.
Dividend and interest income
Dividend income from investments is recognised when the shareholder’s right to receive payment has been established (provided that it is probable that the economic benefi ts will fl ow to the Group and the amount of income can be measured reliably).
Interest income from a fi nancial asset is recognised when it is probable that the economic benefi ts will fl ow to the Group and the amount of income can be measured reliably. Interest income is accrued on a time basis, by reference to the principal outstanding and at the effective interest rate applicable, which is the rate that exactly discounts estimated future cash receipts through the expected life of the fi nancial asset to that asset’s net carrying amount on initial recognition.
Foreign currency
The individual fi nancial statements of each Group Company are presented in the currency of the primary economic environment in which it operates (its functional currency). For the purpose of the consolidated fi nancial statements, the results and fi nancial position of each Group Company are expressed in United States Dollars, which is the functional currency of the Company, and the presentation currency for the consolidated fi nancial statements.
In preparing the fi nancial statements of the individual group companies, transactions in currencies other than the entity’s functional currency (foreign currencies) are recognised at the rates of exchange prevailing on the dates of the transactions. At each reporting date, monetary items that are denominated in foreign currencies are retranslated at the rates prevailing at that date. Non-monetary items that are measured in terms of historical cost in a foreign currency are not retranslated.
Notes to the Annual Financial StatementsFor the year ended 31 December 2011
40 CAPITAL DRILLING LIMITED Annual Report 2011
3. Summary of signifi cant accounting policies (continued)
Foreign currency (continued)
Exchange differences are recognised in profi t or loss in the period in which they arise except for:
exchange differences on foreign currency borrowings relating to assets under construction for future productive use, which are included in the cost of those assets when they are regarded as an adjustment to interest costs on those foreign currency borrowings;
exchange differences on transactions entered into to hedge certain foreign currency risks; and
exchange differences on monetary items receivable from or payable to a foreign operation for which settlement is neither planned nor likely to occur (therefore forming part of the net investment in the foreign operation), which are recognised initially in other comprehensive income and reclassifi ed from equity to profi t or loss on repayment of the monetary items.
For the purpose of presenting consolidated fi nancial statements, the assets and liabilities of the Group’s foreign operations are translated into United States Dollars at exchange rates prevailing on the reporting date. Income and expense items are translated at the average exchange rates for the period, unless exchange rates fl uctuate signifi cantly during that period, in which case the exchange rates at the date of transactions are used. Exchange differences arising, if any, are recognised in other comprehensive income and accumulated in equity (attributed to non-controlling interests as appropriate).
Retirement benefi ts
The Group does not have a legal obligation to provide for retirement benefi ts, however each subsidiary makes contributions for retirement benefi ts as per the country’s statutory obligations and charged to profi t and loss as payment falls due.
Taxation
Income tax expense represents the sum of the tax paid and currently payable and deferred tax.
Current tax
The tax currently payable is based on taxable profi t for the year. Taxable profi t differs from profi t as reported in the statement of comprehensive income because it excludes items of income or expense that are taxable or deductible in other years and it further excludes items that are never taxable or tax deductible. The Group’s liability for current tax is calculated using tax rates (and tax laws) that have been enacted or substantively enacted in countries where the Company and subsidiaries operate at the reporting date.
Deferred tax
Deferred tax is recognised on temporary differences between carrying amounts of assets and liabilities in the fi nancial statements and the corresponding tax bases used in the computation of taxable profi t. Deferred tax liabilities are generally recognised for all taxable temporary differences and deferred tax assets are generally recognised for all deductible temporary differences to the extent that it is probable that taxable profi ts will be available against which those deductible temporary differences can be utilised. Such deferred tax assets and liabilities are not recognised if the temporary difference arises from goodwill or from the initial recognition (other than in a business combination) of other assets and liabilities in a transaction that affects neither the taxable profi t nor the accounting profi t.
Deferred tax liabilities are recognised for taxable temporary differences associated with investments in subsidiaries and associates, and interests in joint ventures, except where the Group is able to control the reversal of the temporary difference and it is probable that the temporary difference will not reverse in the foreseeable future. Deferred tax assets arising from deductible temporary differences associated with such investments and interests are only recognised to the extent that it is probable that there will be suffi cient taxable profi ts against which to utilise the benefi ts of the temporary differences and are expected to reverse in the foreseeable future.
Notes to the Annual Financial StatementsFor the year ended 31 December 2011
CAPITAL DRILLING LIMITED Annual Report 2011 41
3. Summary of signifi cant accounting policies (continued)
Deferred tax (continued)
The carrying amounts of deferred tax assets are reviewed at each reporting date and reduced to the extent that it is no longer probable that suffi cient taxable profi ts will be available to allow all or part of the asset to be recovered.
Deferred tax assets and liabilities are measured at the tax rates that are expected to apply in the period in which the liability is settled or the asset realised, based on tax rates (and tax laws) that have been enacted or substantively enacted at the reporting date. The measurement of deferred tax liabilities and assets refl ects the tax consequences that would follow from the manner in which the Group expects, at the reporting date, to recover or settle the carrying amount of its assets and liabilities.
Deferred tax assets and liabilities are offset when their is a legally enforceable right to set off current tax assets against current tax liabilities and when they relate to income taxes levied by the same taxation authority and the Group intends to settle its current tax assets and liabilities on the net basis.
Current and deferred tax for the year
Current and deferred tax are recognised in profi t or loss, except when they relate to items that are recognised in other comprehensive income or directly in equity, in which case, the current and deferred tax are also recognised in other comprehensive income or directly in equity respectively. Where current tax or deferred tax arises from the initial accounting for a business combination, the tax effect is included in the accounting for the business combination.
Inventories
Inventories are stated at the lower of cost and net realisable value. Cost is determined on the weighted average method. Redundant and slow moving stocks are identifi ed and written down to their estimated economic or realisable values. Net realisable value represents the estimated selling price less all estimated costs of completion and costs to be incurred in marketing, selling and distribution.
Borrowing costs
Borrowing costs directly attributable to the acquisition, construction or production of qualifying assets, which are assets that necessarily take a substantial period of time to get ready for their intended use or sale, are added to the cost of those assets, until such time as the assets are substantially ready for their intended use or sale.
To the extent that variable rate borrowings are used to fi nance a qualifying asset and are hedged in an effective cash fl ow hedge of interest rate risk, the effective portion of the derivative is recognised in the other comprehensive income and released to profi t or loss when the qualifying asset impacts profi t or loss. To the extent that fi xed rate borrowings are used to fi nance a qualifying asset and are hedged in an effective fair value hedge of interest rate risk, the capitalised borrowing costs refl ect the hedged interest rate.
Investment income earned on the temporary investment of specifi c borrowings pending their expenditure on qualifying assets is deducted from the borrowing costs eligible for capitalisation.
All other borrowing costs are recognised in profi t or loss in the period in which they are incurred.
Leasing
The Group as lessee
Operating lease payments are recognised as an expense on a straight-line basis over the lease terms, except where another systematic basis is more representative of the time pattern in which economic benefi ts from the leased assets are consumed. Contingent rentals arising under operating leases are recognised as an expense in the period in which they are incurred.
In the event that lease incentives are received to enter into operating leases, such incentives are recognised as a liability. The aggregate benefi t of incentives is recognised as a reduction on rental expense on a straight-line basis, except where another systematic basis is more representative of the time pattern in which economic benefi ts from the leased asset are consumed.
Notes to the Annual Financial StatementsFor the year ended 31 December 2011
42 CAPITAL DRILLING LIMITED Annual Report 2011
3. Summary of signifi cant accounting policies (continued)
Share-based payments
Equity-settled share-based payments to employees and others providing similar services are measured at the fair value of the equity instruments at the grant date.
The fair value determined at the grant date of the equity-settled share-based payments is expensed on a straight-line basis over the vesting period, based on the Group’s estimate of equity instruments that will eventually vest. At each reporting date, the Group revises its estimate of the number of equity instruments expected to vest. The impact of the revision of the original estimates, if any, is recognised in profi t or loss over the remaining vesting period, with a corresponding adjustment to the equity-settled employee benefi ts reserve.
Financial instruments
Financial assets and fi nancial liabilities are recognised when the Group becomes a party to the contractual provisions of the instrument.
Financial assets and fi nancial liabilities are initially measured at fair value. Transaction costs that are directly attributable to the acquisition or issue of fi nancial assets and fi nancial liabilities (other than fi nancial assets and fi nancial liabilities at fair value through profi t or loss) are added to or deducted from the fair value of the fi nancial assets or fi nancial liabilities, as appropriate, on initial recognition. Transaction costs directly attributable to the acquisition of fi nancial assets or fi nancial liabilities at fair value through profi t or loss are recognised immediately in profi t or loss.
Effective interest method
The effective interest method is a method of calculating the amortised cost of a fi nancial asset and of allocating interest income over the relevant period. The effective interest rate is the rate that exactly discounts estimated future cash receipts (including all fees on points paid or received that form an integral part of the effective interest rate, transaction costs and other premiums or discounts) through the expected life of the fi nancial asset, or, where appropriate, a shorter period. Income is recognised on an effective interest basis for debt instruments.
Trade receivables
Trade receivables are stated at their nominal value as reduced by appropriate allowances for estimated irrecoverable amounts.
Derecognition of fi nancial assets
The Group derecognises a fi nancial asset only when the contractual rights to the cash fl ows from the asset expire, or when it transfers the fi nancial asset and substantially all the risks and rewards of ownership of the asset to another entity. If the Group neither transfers nor retains substantially all the risks and rewards of ownership and continues to control the transferred asset, the Group recognises its retained interest in the asset and an associated liability for amounts it may have to pay. If the Group retains substantially all the risks and rewards of ownership of a transferred fi nancial asset, the Group continues to recognise the fi nancial asset and also recognises a collateralised borrowing for the proceeds received.
On derecognition of a fi nancial asset in its entirety, the difference between the asset’s carrying amount and the sum of the consideration received and receivable and the cumulative gain or loss that had been recognised in other comprehensive income and accumulated in equity is recognised in profi t or loss.
Notes to the Annual Financial StatementsFor the year ended 31 December 2011
CAPITAL DRILLING LIMITED Annual Report 2011 43
3. Summary of signifi cant accounting policies (continued)
Derecognition of fi nancial assets (continued)
On derecognition of a fi nancial asset other than in its entirety (e.g. when the Group retains an option to repurchase part of a transferred asset), the Group allocates the previous carrying amount of the fi nancial asset between the part it continues to recognise under continuing involvement, and the part it no longer recognises on the basis of the relative fair values of those parts on the date of the transfer. The difference between the carrying amount allocated to the part that is no longer recognised and the sum of the consideration received for the part no longer recognised and any cumulative gain or loss allocated to it that had been recognised in other comprehensive income is recognised in profi t or loss. A cumulative gain or loss that had been recognised in other comprehensive income is allocated between the part that continues to be recognised and the part that is no longer recognised on the basis of the relative fair values of those parts.
Financial liabilities and equity
Financial liabilities and equity instruments issued by the Group are classifi ed according to the substance of the contractual arrangements entered into and the defi nitions of a fi nancial liability and an equity instrument. An equity instrument is any contract that evidences a residual interest in the assets of the Group after deducting all of its liabilities. The accounting policies adopted for specifi c fi nancial liabilities and equity instruments are set out below.
Other fi nancial liabilities
Other fi nancial liabilities, including borrowings and trade payables, are initially measured at fair value, net of transaction costs. Other fi nancial liabilities are subsequently measured at amortised cost using the effective interest method, with interest expense recognised on an effective yield basis.
Derecognition of fi nancial liabilities
The Group derecognises fi nancial liabilities when, and only when, the Company’s obligations are discharged, cancelled or they expire.
Equity instruments
An equity instruments is any contract that evidences a residual interest in the assets of an entity after deducting all of its liabilities.
Equity instruments are recorded at the proceeds received, net of direct issue costs.
Investments in subsidiaries
Investments in subsidiaries are carried at cost in the stand-alone fi nancial statements of the Company.
Critical accounting judgments and key sources of estimation and uncertainty
In the process of applying the Group’s accounting policies, management has made the following judgements, apart from those involving estimations, which have the most signifi cant effect on the amounts recognised in the fi nancial statements:
Residual value and useful life
The Group depreciates its assets over their estimated useful lives taking into account residual values, which, following the adoption of IAS16 Property, plant and equipment, are re-assessed on an annual basis. The actual lives and residual values of these assets can vary depending on a variety of factors.
Technological innovation, product life cycles and maintenance programmes all impact the useful lives and residual values of the assets. Residual value assessments consider issues such as future market conditions, the remaining life of the asset and projected disposal values.
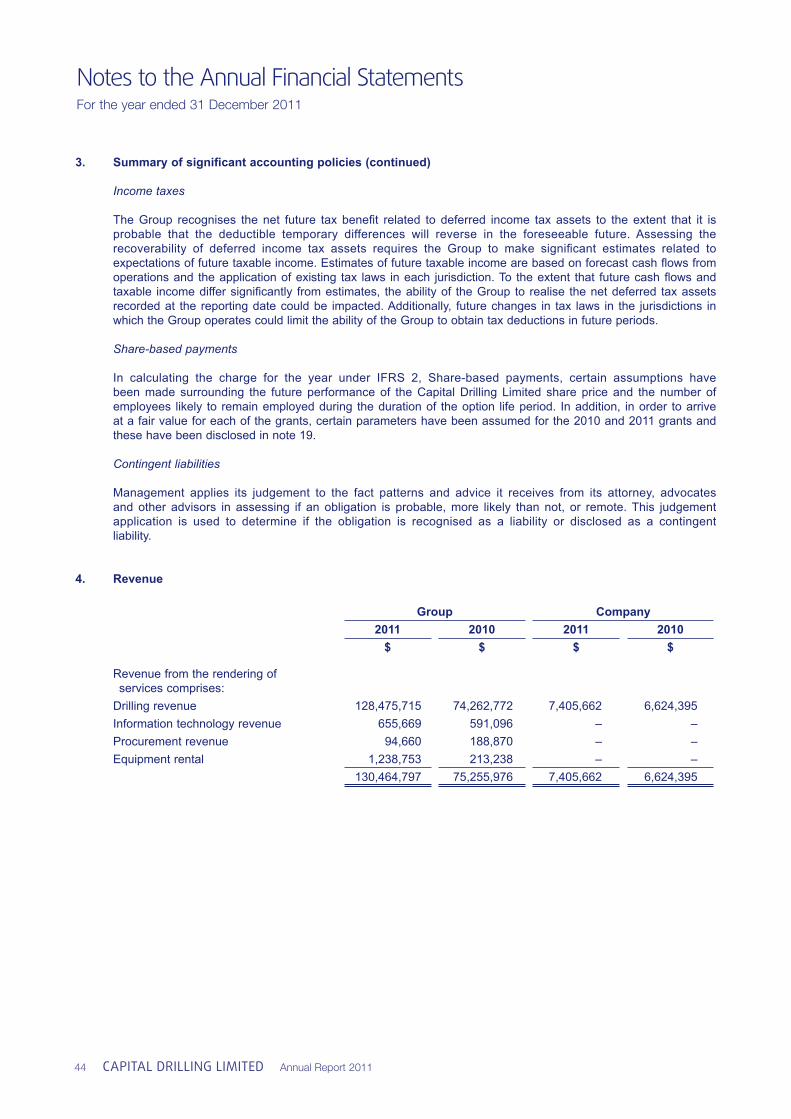
Notes to the Annual Financial StatementsFor the year ended 31 December 2011
44 CAPITAL DRILLING LIMITED Annual Report 2011
3. Summary of signifi cant accounting policies (continued)
Income taxes
The Group recognises the net future tax benefi t related to deferred income tax assets to the extent that it is probable that the deductible temporary differences will reverse in the foreseeable future. Assessing the recoverability of deferred income tax assets requires the Group to make signifi cant estimates related to expectations of future taxable income. Estimates of future taxable income are based on forecast cash fl ows from operations and the application of existing tax laws in each jurisdiction. To the extent that future cash fl ows and taxable income differ signifi cantly from estimates, the ability of the Group to realise the net deferred tax assets recorded at the reporting date could be impacted. Additionally, future changes in tax laws in the jurisdictions in which the Group operates could limit the ability of the Group to obtain tax deductions in future periods.
Share-based payments
In calculating the charge for the year under IFRS 2, Share-based payments, certain assumptions have been made surrounding the future performance of the Capital Drilling Limited share price and the number of employees likely to remain employed during the duration of the option life period. In addition, in order to arrive at a fair value for each of the grants, certain parameters have been assumed for the 2010 and 2011 grants and these have been disclosed in note 19.
Contingent liabilities
Management applies its judgement to the fact patterns and advice it receives from its attorney, advocates and other advisors in assessing if an obligation is probable, more likely than not, or remote. This judgement application is used to determine if the obligation is recognised as a liability or disclosed as a contingent liability.
4. Revenue
Group Company2011 2010 2011 2010
$ $ $ $
Revenue from the rendering of services comprises:Drilling revenue 128,475,715 74,262,772 7,405,662 6,624,395 Information technology revenue 655,669 591,096 – – Procurement revenue 94,660 188,870 – – Equipment rental 1,238,753 213,238 – –
130,464,797 75,255,976 7,405,662 6,624,395
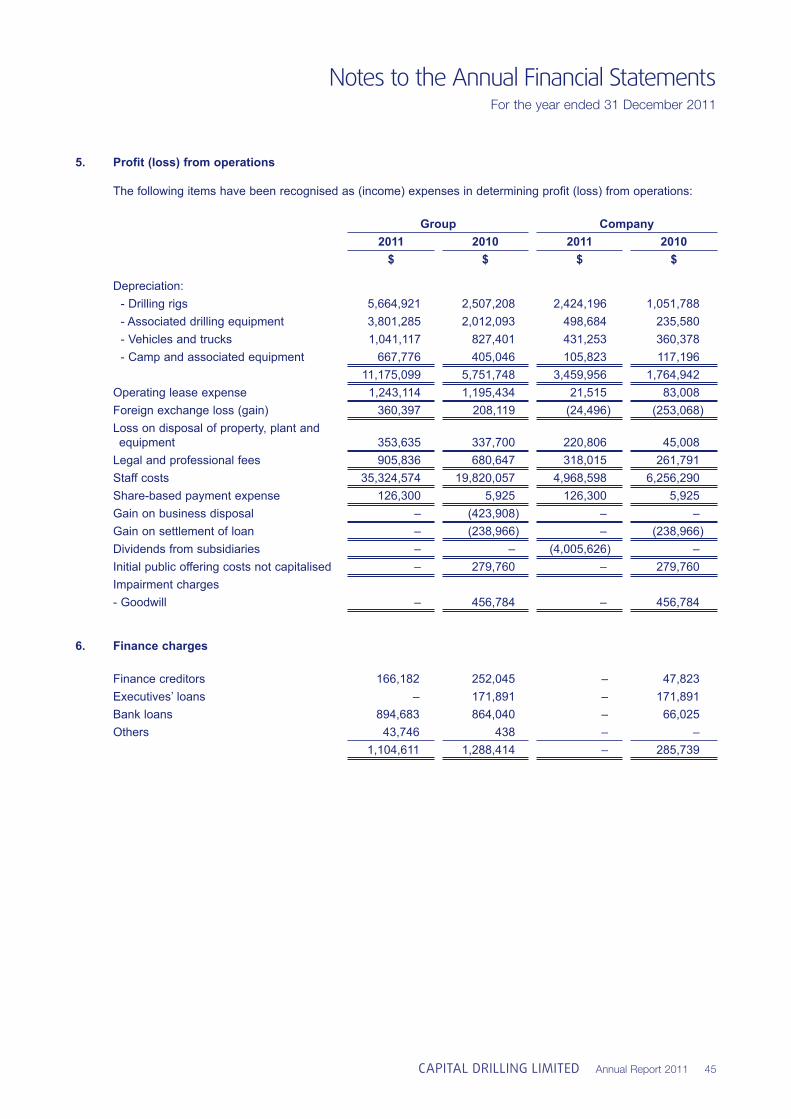
Notes to the Annual Financial StatementsFor the year ended 31 December 2011
CAPITAL DRILLING LIMITED Annual Report 2011 45
5. Profi t (loss) from operations
The following items have been recognised as (income) expenses in determining profi t (loss) from operations:
Group Company2011 2010 2011 2010
$ $ $ $
Depreciation:- Drilling rigs 5,664,921 2,507,208 2,424,196 1,051,788 - Associated drilling equipment 3,801,285 2,012,093 498,684 235,580 - Vehicles and trucks 1,041,117 827,401 431,253 360,378 - Camp and associated equipment 667,776 405,046 105,823 117,196
11,175,099 5,751,748 3,459,956 1,764,942 Operating lease expense 1,243,114 1,195,434 21,515 83,008 Foreign exchange loss (gain) 360,397 208,119 (24,496) (253,068)Loss on disposal of property, plant and equipment 353,635 337,700 220,806 45,008 Legal and professional fees 905,836 680,647 318,015 261,791 Staff costs 35,324,574 19,820,057 4,968,598 6,256,290 Share-based payment expense 126,300 5,925 126,300 5,925 Gain on business disposal – (423,908) – – Gain on settlement of loan – (238,966) – (238,966)Dividends from subsidiaries – – (4,005,626) – Initial public offering costs not capitalised – 279,760 – 279,760 Impairment charges- Goodwill – 456,784 – 456,784
6. Finance charges
Finance creditors 166,182 252,045 – 47,823 Executives’ loans – 171,891 – 171,891 Bank loans 894,683 864,040 – 66,025 Others 43,746 438 – –
1,104,611 1,288,414 – 285,739
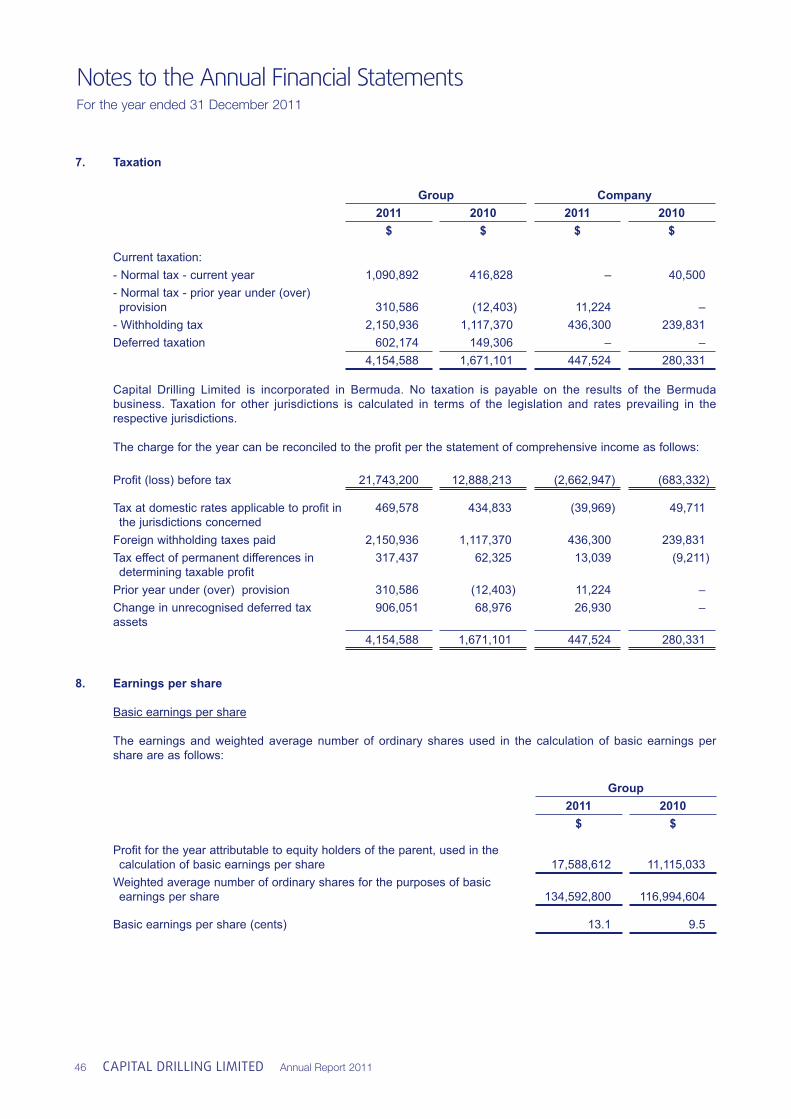
Notes to the Annual Financial StatementsFor the year ended 31 December 2011
46 CAPITAL DRILLING LIMITED Annual Report 2011
7. Taxation
Group Company2011 2010 2011 2010
$ $ $ $
Current taxation:- Normal tax - current year 1,090,892 416,828 – 40,500 - Normal tax - prior year under (over) provision 310,586 (12,403) 11,224 – - Withholding tax 2,150,936 1,117,370 436,300 239,831 Deferred taxation 602,174 149,306 – –
4,154,588 1,671,101 447,524 280,331
Capital Drilling Limited is incorporated in Bermuda. No taxation is payable on the results of the Bermuda business. Taxation for other jurisdictions is calculated in terms of the legislation and rates prevailing in the respective jurisdictions.
The charge for the year can be reconciled to the profi t per the statement of comprehensive income as follows:
Profi t (loss) before tax 21,743,200 12,888,213 (2,662,947) (683,332)
Tax at domestic rates applicable to profi t in the jurisdictions concerned
469,578 434,833 (39,969) 49,711
Foreign withholding taxes paid 2,150,936 1,117,370 436,300 239,831 Tax effect of permanent differences in determining taxable profi t
317,437 62,325 13,039 (9,211)
Prior year under (over) provision 310,586 (12,403) 11,224 – Change in unrecognised deferred tax assets
906,051 68,976 26,930 –
4,154,588 1,671,101 447,524 280,331
8. Earnings per share
Basic earnings per share
The earnings and weighted average number of ordinary shares used in the calculation of basic earnings per share are as follows:
Group2011 2010
$ $
Profi t for the year attributable to equity holders of the parent, used in the calculation of basic earnings per share 17,588,612 11,115,033 Weighted average number of ordinary shares for the purposes of basic earnings per share 134,592,800 116,994,604
Basic earnings per share (cents) 13.1 9.5
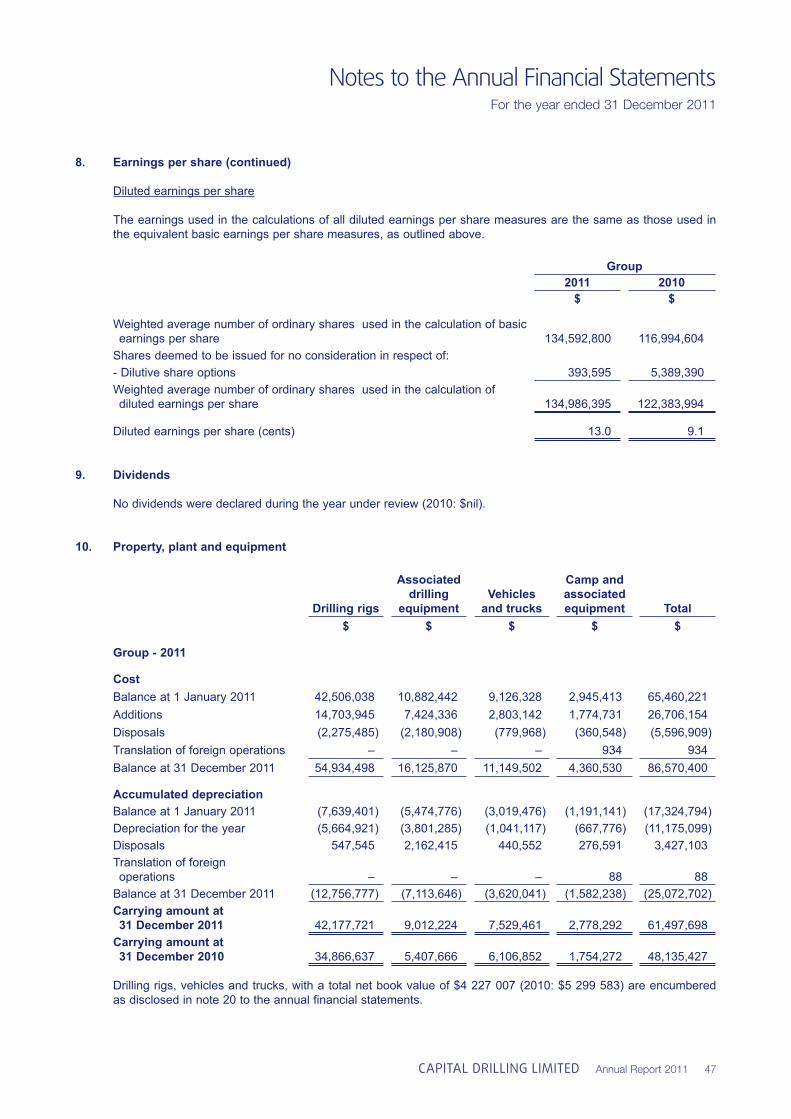
Notes to the Annual Financial StatementsFor the year ended 31 December 2011
CAPITAL DRILLING LIMITED Annual Report 2011 47
8. Earnings per share (continued)
Diluted earnings per share
The earnings used in the calculations of all diluted earnings per share measures are the same as those used in the equivalent basic earnings per share measures, as outlined above.
Group2011 2010
$ $
Weighted average number of ordinary shares used in the calculation of basic earnings per share 134,592,800 116,994,604 Shares deemed to be issued for no consideration in respect of:- Dilutive share options 393,595 5,389,390 Weighted average number of ordinary shares used in the calculation of diluted earnings per share 134,986,395 122,383,994
Diluted earnings per share (cents) 13.0 9.1
9. Dividends
No dividends were declared during the year under review (2010: $nil).
10. Property, plant and equipment
Drilling rigs
Associated drilling
equipmentVehicles
and trucks
Camp and associated equipment Total
$ $ $ $ $
Group - 2011
CostBalance at 1 January 2011 42,506,038 10,882,442 9,126,328 2,945,413 65,460,221 Additions 14,703,945 7,424,336 2,803,142 1,774,731 26,706,154 Disposals (2,275,485) (2,180,908) (779,968) (360,548) (5,596,909)Translation of foreign operations – – – 934 934 Balance at 31 December 2011 54,934,498 16,125,870 11,149,502 4,360,530 86,570,400
Accumulated depreciationBalance at 1 January 2011 (7,639,401) (5,474,776) (3,019,476) (1,191,141) (17,324,794)Depreciation for the year (5,664,921) (3,801,285) (1,041,117) (667,776) (11,175,099)Disposals 547,545 2,162,415 440,552 276,591 3,427,103 Translation of foreign operations – – – 88 88 Balance at 31 December 2011 (12,756,777) (7,113,646) (3,620,041) (1,582,238) (25,072,702)Carrying amount at 31 December 2011 42,177,721 9,012,224 7,529,461 2,778,292 61,497,698 Carrying amount at 31 December 2010 34,866,637 5,407,666 6,106,852 1,754,272 48,135,427
Drilling rigs, vehicles and trucks, with a total net book value of $4 227 007 (2010: $5 299 583) are encumbered as disclosed in note 20 to the annual fi nancial statements.
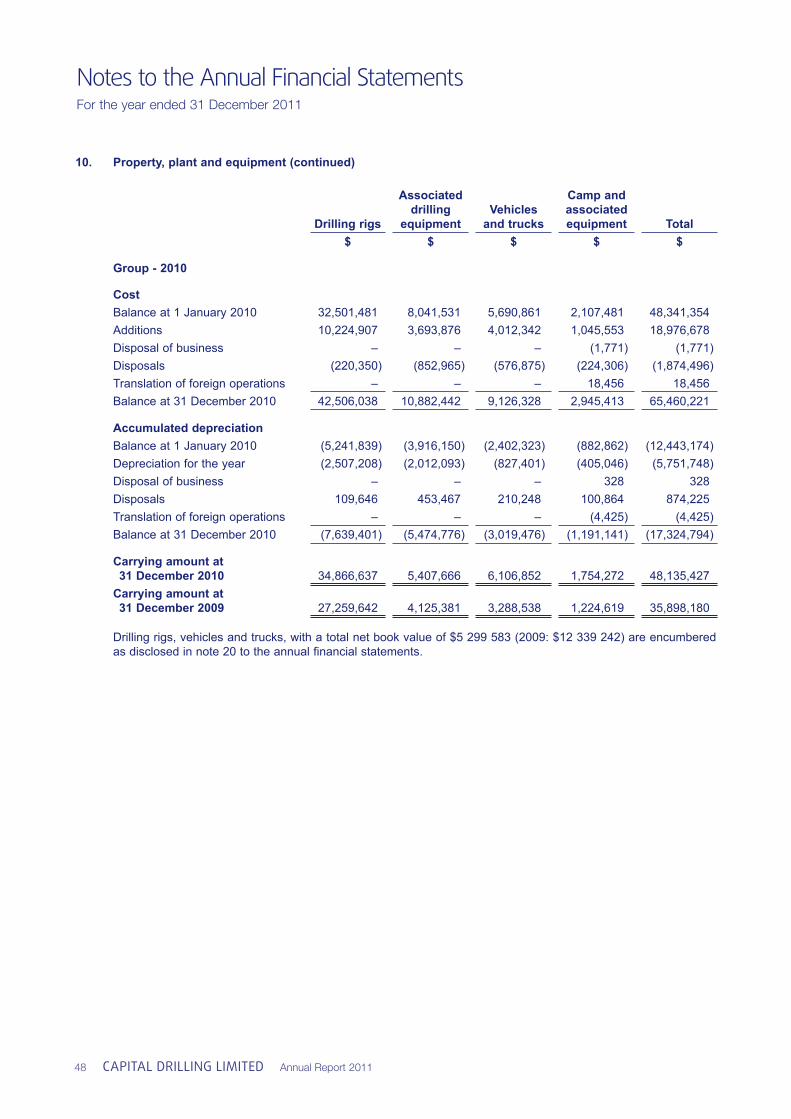
Notes to the Annual Financial StatementsFor the year ended 31 December 2011
48 CAPITAL DRILLING LIMITED Annual Report 2011
10. Property, plant and equipment (continued)
Drilling rigs
Associated drilling
equipmentVehicles
and trucks
Camp and associated equipment Total
$ $ $ $ $
Group - 2010
CostBalance at 1 January 2010 32,501,481 8,041,531 5,690,861 2,107,481 48,341,354 Additions 10,224,907 3,693,876 4,012,342 1,045,553 18,976,678 Disposal of business – – – (1,771) (1,771)Disposals (220,350) (852,965) (576,875) (224,306) (1,874,496)Translation of foreign operations – – – 18,456 18,456 Balance at 31 December 2010 42,506,038 10,882,442 9,126,328 2,945,413 65,460,221
Accumulated depreciationBalance at 1 January 2010 (5,241,839) (3,916,150) (2,402,323) (882,862) (12,443,174)Depreciation for the year (2,507,208) (2,012,093) (827,401) (405,046) (5,751,748)Disposal of business – – – 328 328 Disposals 109,646 453,467 210,248 100,864 874,225 Translation of foreign operations – – – (4,425) (4,425)Balance at 31 December 2010 (7,639,401) (5,474,776) (3,019,476) (1,191,141) (17,324,794)
Carrying amount at 31 December 2010 34,866,637 5,407,666 6,106,852 1,754,272 48,135,427 Carrying amount at 31 December 2009 27,259,642 4,125,381 3,288,538 1,224,619 35,898,180
Drilling rigs, vehicles and trucks, with a total net book value of $5 299 583 (2009: $12 339 242) are encumbered as disclosed in note 20 to the annual fi nancial statements.
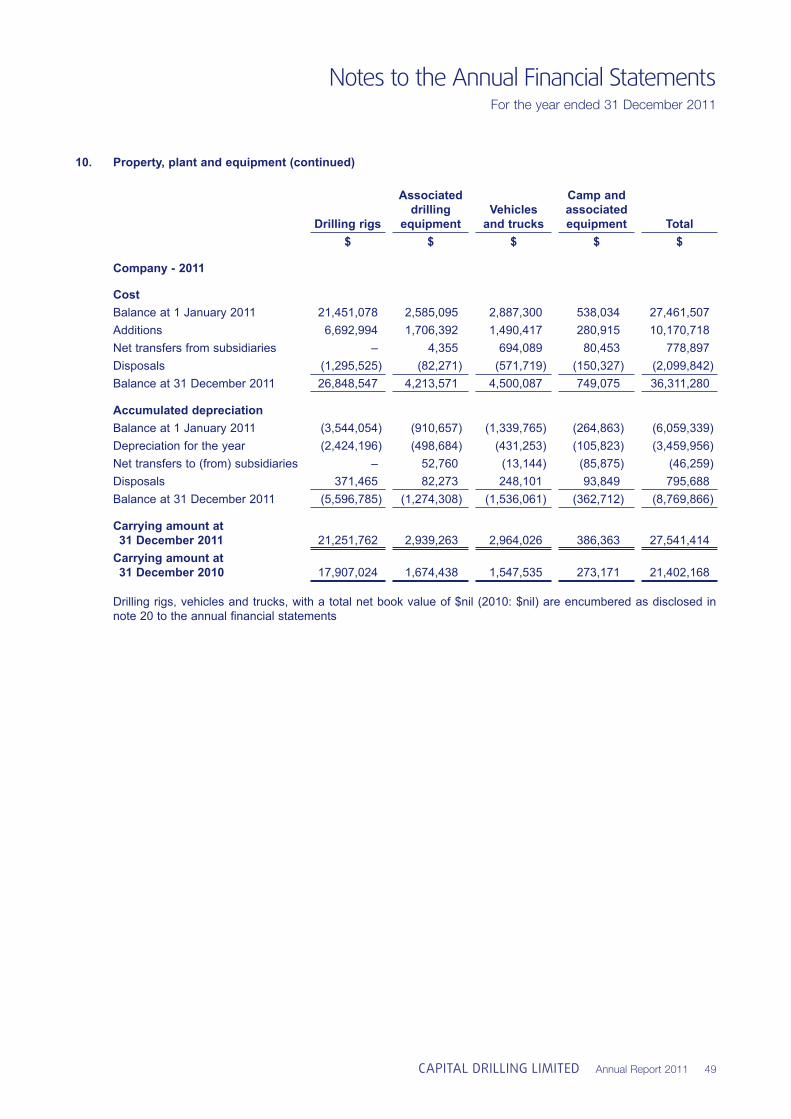
Notes to the Annual Financial StatementsFor the year ended 31 December 2011
CAPITAL DRILLING LIMITED Annual Report 2011 49
10. Property, plant and equipment (continued)
Drilling rigs
Associated drilling
equipmentVehicles
and trucks
Camp and associated equipment Total
$ $ $ $ $
Company - 2011
CostBalance at 1 January 2011 21,451,078 2,585,095 2,887,300 538,034 27,461,507 Additions 6,692,994 1,706,392 1,490,417 280,915 10,170,718 Net transfers from subsidiaries – 4,355 694,089 80,453 778,897 Disposals (1,295,525) (82,271) (571,719) (150,327) (2,099,842)Balance at 31 December 2011 26,848,547 4,213,571 4,500,087 749,075 36,311,280
Accumulated depreciationBalance at 1 January 2011 (3,544,054) (910,657) (1,339,765) (264,863) (6,059,339)Depreciation for the year (2,424,196) (498,684) (431,253) (105,823) (3,459,956)Net transfers to (from) subsidiaries – 52,760 (13,144) (85,875) (46,259)Disposals 371,465 82,273 248,101 93,849 795,688 Balance at 31 December 2011 (5,596,785) (1,274,308) (1,536,061) (362,712) (8,769,866)
Carrying amount at 31 December 2011 21,251,762 2,939,263 2,964,026 386,363 27,541,414 Carrying amount at 31 December 2010 17,907,024 1,674,438 1,547,535 273,171 21,402,168
Drilling rigs, vehicles and trucks, with a total net book value of $nil (2010: $nil) are encumbered as disclosed in note 20 to the annual fi nancial statements
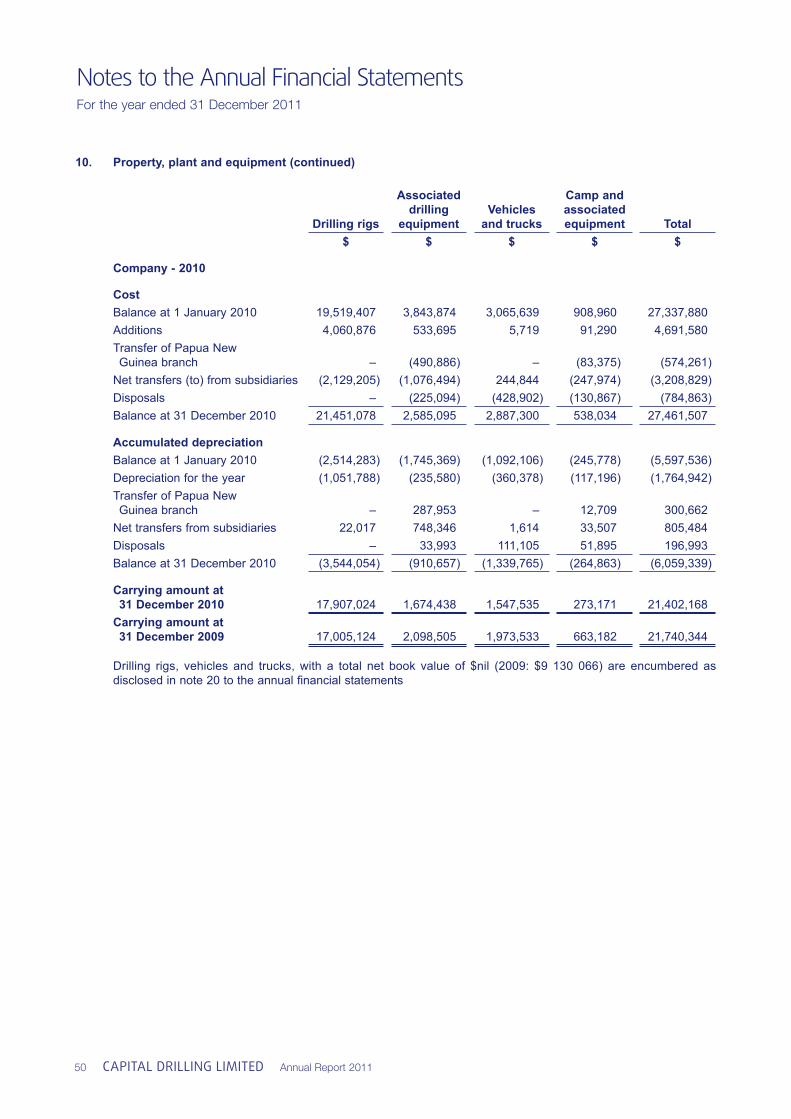
Notes to the Annual Financial StatementsFor the year ended 31 December 2011
50 CAPITAL DRILLING LIMITED Annual Report 2011
10. Property, plant and equipment (continued)
Drilling rigs
Associated drilling
equipmentVehicles
and trucks
Camp and associated equipment Total
$ $ $ $ $
Company - 2010
CostBalance at 1 January 2010 19,519,407 3,843,874 3,065,639 908,960 27,337,880 Additions 4,060,876 533,695 5,719 91,290 4,691,580 Transfer of Papua New Guinea branch – (490,886) – (83,375) (574,261)Net transfers (to) from subsidiaries (2,129,205) (1,076,494) 244,844 (247,974) (3,208,829)Disposals – (225,094) (428,902) (130,867) (784,863)Balance at 31 December 2010 21,451,078 2,585,095 2,887,300 538,034 27,461,507
Accumulated depreciationBalance at 1 January 2010 (2,514,283) (1,745,369) (1,092,106) (245,778) (5,597,536)Depreciation for the year (1,051,788) (235,580) (360,378) (117,196) (1,764,942)Transfer of Papua New Guinea branch – 287,953 – 12,709 300,662 Net transfers from subsidiaries 22,017 748,346 1,614 33,507 805,484 Disposals – 33,993 111,105 51,895 196,993 Balance at 31 December 2010 (3,544,054) (910,657) (1,339,765) (264,863) (6,059,339)
Carrying amount at 31 December 2010 17,907,024 1,674,438 1,547,535 273,171 21,402,168 Carrying amount at 31 December 2009 17,005,124 2,098,505 1,973,533 663,182 21,740,344
Drilling rigs, vehicles and trucks, with a total net book value of $nil (2009: $9 130 066) are encumbered as disclosed in note 20 to the annual fi nancial statements
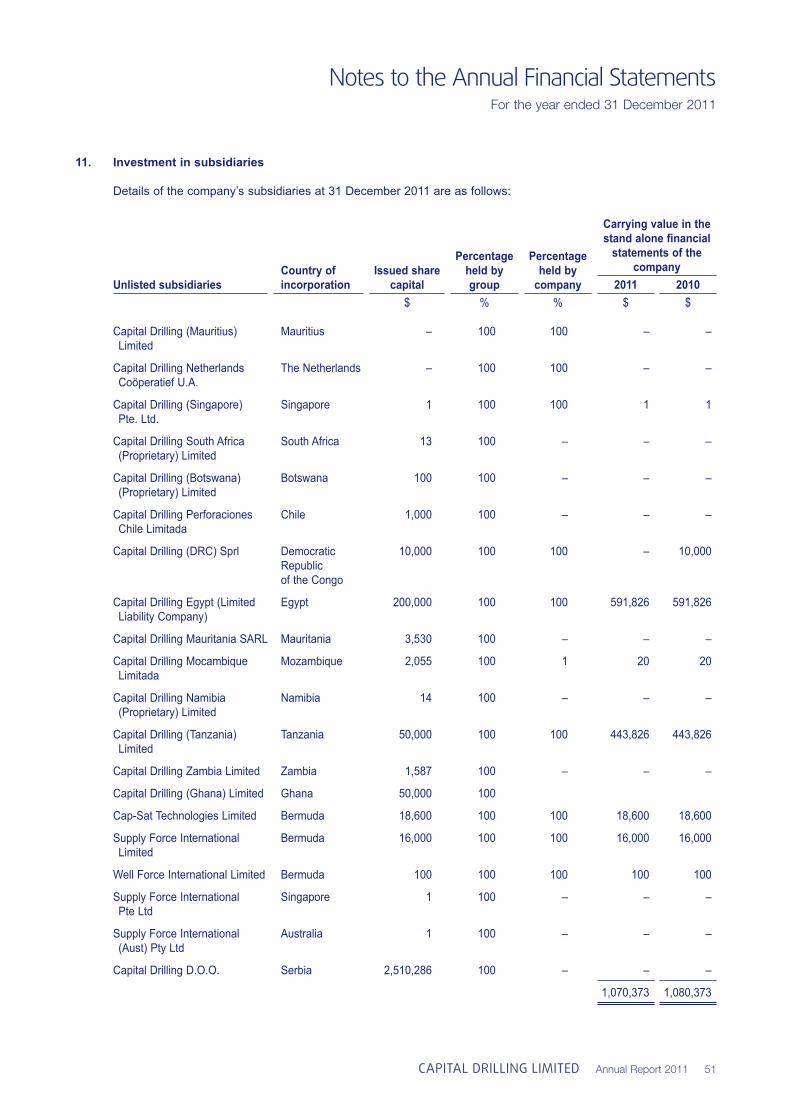
Notes to the Annual Financial StatementsFor the year ended 31 December 2011
CAPITAL DRILLING LIMITED Annual Report 2011 51
11. Investment in subsidiaries
Details of the company’s subsidiaries at 31 December 2011 are as follows:
Unlisted subsidiariesCountry of incorporation
Issued share capital
Percentage held by group
Percentage held by
company
Carrying value in the stand alone fi nancial
statements of the company
2011 2010$ % % $ $
Capital Drilling (Mauritius) Limited
Mauritius – 100 100 – –
Capital Drilling Netherlands Coöperatief U.A.
The Netherlands – 100 100 – –
Capital Drilling (Singapore) Pte. Ltd.
Singapore 1 100 100 1 1
Capital Drilling South Africa (Proprietary) Limited
South Africa 13 100 – – –
Capital Drilling (Botswana) (Proprietary) Limited
Botswana 100 100 – – –
Capital Drilling Perforaciones Chile Limitada
Chile 1,000 100 – – –
Capital Drilling (DRC) Sprl Democratic Republic of the Congo
10,000 100 100 – 10,000
Capital Drilling Egypt (Limited Liability Company)
Egypt 200,000 100 100 591,826 591,826
Capital Drilling Mauritania SARL Mauritania 3,530 100 – – –
Capital Drilling Mocambique Limitada
Mozambique 2,055 100 1 20 20
Capital Drilling Namibia (Proprietary) Limited
Namibia 14 100 – – –
Capital Drilling (Tanzania) Limited
Tanzania 50,000 100 100 443,826 443,826
Capital Drilling Zambia Limited Zambia 1,587 100 – – –
Capital Drilling (Ghana) Limited Ghana 50,000 100
Cap-Sat Technologies Limited Bermuda 18,600 100 100 18,600 18,600
Supply Force International Limited
Bermuda 16,000 100 100 16,000 16,000
Well Force International Limited Bermuda 100 100 100 100 100
Supply Force International Pte Ltd
Singapore 1 100 – – –
Supply Force International (Aust) Pty Ltd
Australia 1 100 – – –
Capital Drilling D.O.O. Serbia 2,510,286 100 – – –
1,070,373 1,080,373
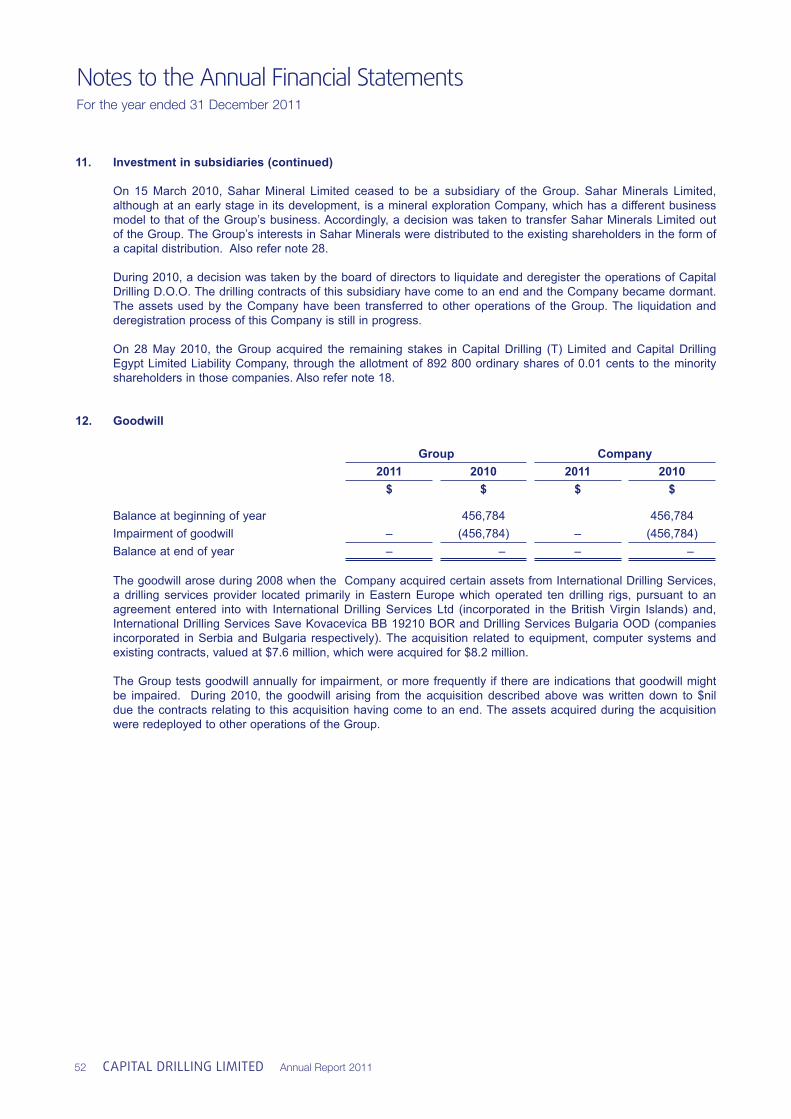
Notes to the Annual Financial StatementsFor the year ended 31 December 2011
52 CAPITAL DRILLING LIMITED Annual Report 2011
11. Investment in subsidiaries (continued)
On 15 March 2010, Sahar Mineral Limited ceased to be a subsidiary of the Group. Sahar Minerals Limited, although at an early stage in its development, is a mineral exploration Company, which has a different business model to that of the Group’s business. Accordingly, a decision was taken to transfer Sahar Minerals Limited out of the Group. The Group’s interests in Sahar Minerals were distributed to the existing shareholders in the form of a capital distribution. Also refer note 28.
During 2010, a decision was taken by the board of directors to liquidate and deregister the operations of Capital Drilling D.O.O. The drilling contracts of this subsidiary have come to an end and the Company became dormant. The assets used by the Company have been transferred to other operations of the Group. The liquidation and deregistration process of this Company is still in progress.
On 28 May 2010, the Group acquired the remaining stakes in Capital Drilling (T) Limited and Capital Drilling Egypt Limited Liability Company, through the allotment of 892 800 ordinary shares of 0.01 cents to the minority shareholders in those companies. Also refer note 18.
12. Goodwill
Group Company2011 2010 2011 2010
$ $ $ $
Balance at beginning of year 456,784 456,784 Impairment of goodwill – (456,784) – (456,784)Balance at end of year – – – –
The goodwill arose during 2008 when the Company acquired certain assets from International Drilling Services, a drilling services provider located primarily in Eastern Europe which operated ten drilling rigs, pursuant to an agreement entered into with International Drilling Services Ltd (incorporated in the British Virgin Islands) and, International Drilling Services Save Kovacevica BB 19210 BOR and Drilling Services Bulgaria OOD (companies incorporated in Serbia and Bulgaria respectively). The acquisition related to equipment, computer systems and existing contracts, valued at $7.6 million, which were acquired for $8.2 million.
The Group tests goodwill annually for impairment, or more frequently if there are indications that goodwill might be impaired. During 2010, the goodwill arising from the acquisition described above was written down to $nil due the contracts relating to this acquisition having come to an end. The assets acquired during the acquisition were redeployed to other operations of the Group.
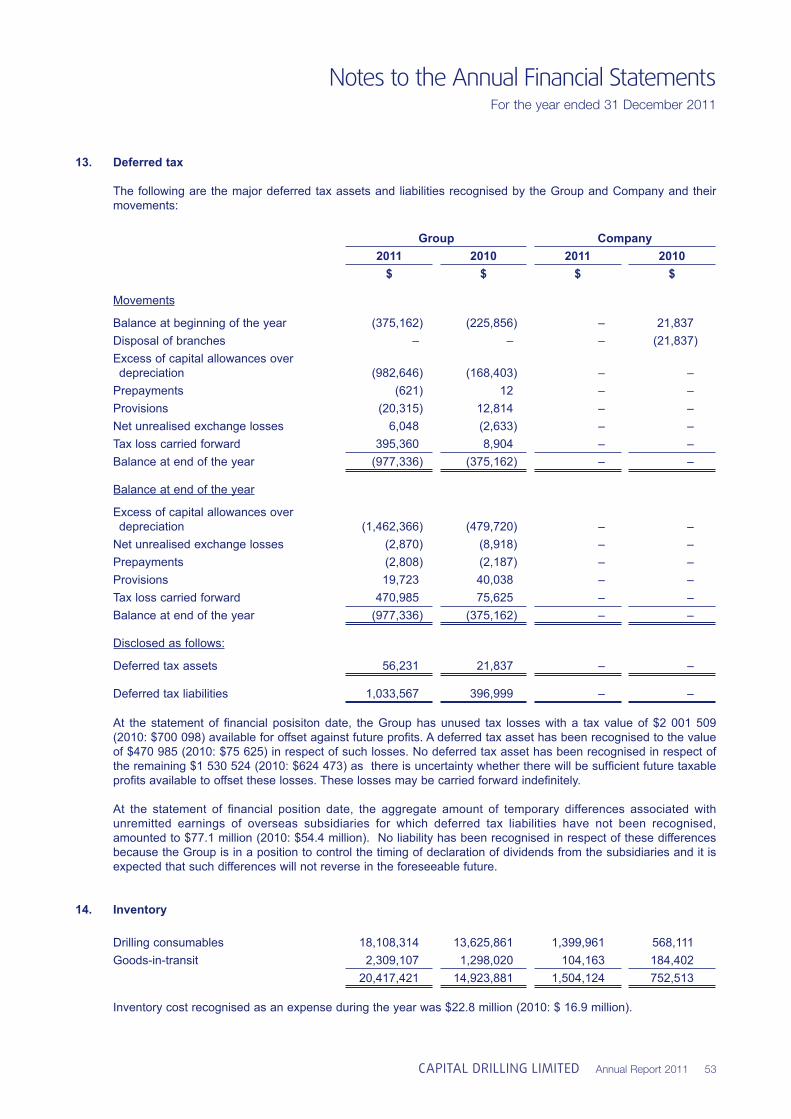
Notes to the Annual Financial StatementsFor the year ended 31 December 2011
CAPITAL DRILLING LIMITED Annual Report 2011 53
13. Deferred tax
The following are the major deferred tax assets and liabilities recognised by the Group and Company and their movements:
Group Company2011 2010 2011 2010
$ $ $ $
Movements
Balance at beginning of the year (375,162) (225,856) – 21,837 Disposal of branches – – – (21,837)Excess of capital allowances over depreciation (982,646) (168,403) – – Prepayments (621) 12 – – Provisions (20,315) 12,814 – – Net unrealised exchange losses 6,048 (2,633) – – Tax loss carried forward 395,360 8,904 – – Balance at end of the year (977,336) (375,162) – –
Balance at end of the year
Excess of capital allowances over depreciation (1,462,366) (479,720) – – Net unrealised exchange losses (2,870) (8,918) – – Prepayments (2,808) (2,187) – – Provisions 19,723 40,038 – – Tax loss carried forward 470,985 75,625 – – Balance at end of the year (977,336) (375,162) – –
Disclosed as follows:
Deferred tax assets 56,231 21,837 – –
Deferred tax liabilities 1,033,567 396,999 – –
At the statement of fi nancial posisiton date, the Group has unused tax losses with a tax value of $2 001 509 (2010: $700 098) available for offset against future profi ts. A deferred tax asset has been recognised to the value of $470 985 (2010: $75 625) in respect of such losses. No deferred tax asset has been recognised in respect of the remaining $1 530 524 (2010: $624 473) as there is uncertainty whether there will be suffi cient future taxable profi ts available to offset these losses. These losses may be carried forward indefi nitely.
At the statement of fi nancial position date, the aggregate amount of temporary differences associated with unremitted earnings of overseas subsidiaries for which deferred tax liabilities have not been recognised, amounted to $77.1 million (2010: $54.4 million). No liability has been recognised in respect of these differences because the Group is in a position to control the timing of declaration of dividends from the subsidiaries and it is expected that such differences will not reverse in the foreseeable future.
14. Inventory
Drilling consumables 18,108,314 13,625,861 1,399,961 568,111 Goods-in-transit 2,309,107 1,298,020 104,163 184,402
20,417,421 14,923,881 1,504,124 752,513
Inventory cost recognised as an expense during the year was $22.8 million (2010: $ 16.9 million).
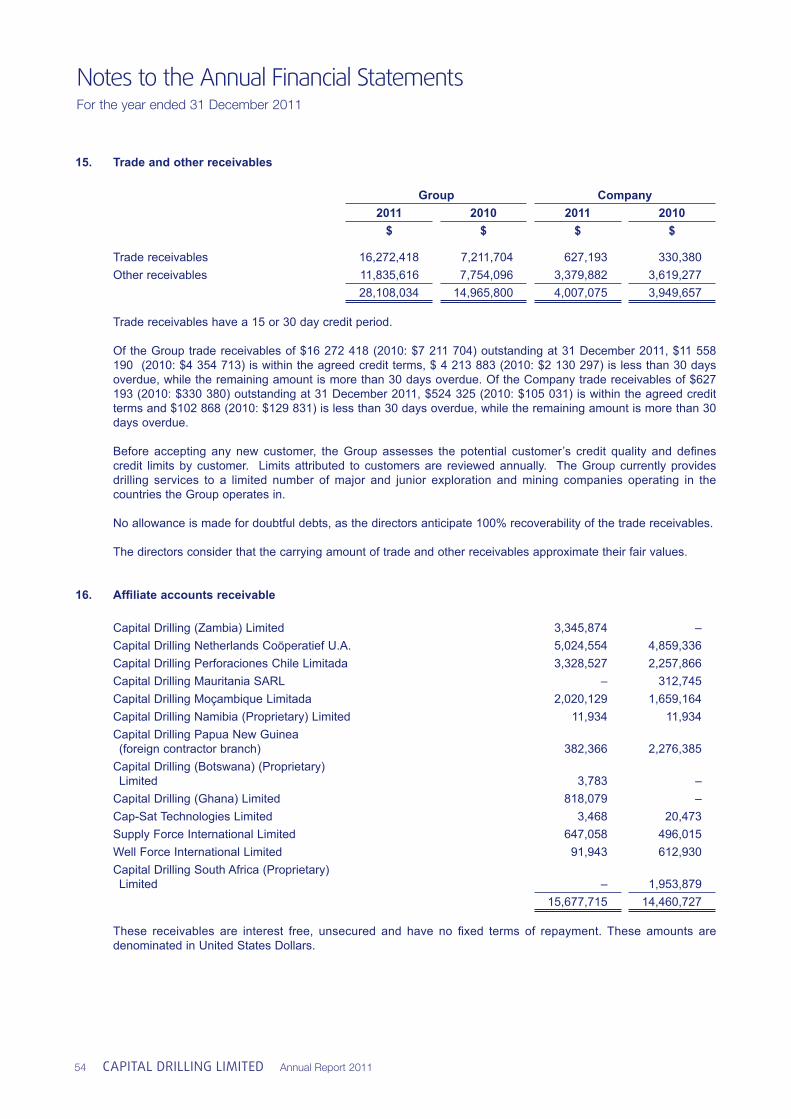
Notes to the Annual Financial StatementsFor the year ended 31 December 2011
54 CAPITAL DRILLING LIMITED Annual Report 2011
15. Trade and other receivables
Group Company2011 2010 2011 2010
$ $ $ $
Trade receivables 16,272,418 7,211,704 627,193 330,380 Other receivables 11,835,616 7,754,096 3,379,882 3,619,277
28,108,034 14,965,800 4,007,075 3,949,657
Trade receivables have a 15 or 30 day credit period.
Of the Group trade receivables of $16 272 418 (2010: $7 211 704) outstanding at 31 December 2011, $11 558 190 (2010: $4 354 713) is within the agreed credit terms, $ 4 213 883 (2010: $2 130 297) is less than 30 days overdue, while the remaining amount is more than 30 days overdue. Of the Company trade receivables of $627 193 (2010: $330 380) outstanding at 31 December 2011, $524 325 (2010: $105 031) is within the agreed credit terms and $102 868 (2010: $129 831) is less than 30 days overdue, while the remaining amount is more than 30 days overdue.
Before accepting any new customer, the Group assesses the potential customer’s credit quality and defi nes credit limits by customer. Limits attributed to customers are reviewed annually. The Group currently provides drilling services to a limited number of major and junior exploration and mining companies operating in the countries the Group operates in.
No allowance is made for doubtful debts, as the directors anticipate 100% recoverability of the trade receivables.
The directors consider that the carrying amount of trade and other receivables approximate their fair values.
16. Affi liate accounts receivable
Capital Drilling (Zambia) Limited 3,345,874 –Capital Drilling Netherlands Coöperatief U.A. 5,024,554 4,859,336 Capital Drilling Perforaciones Chile Limitada 3,328,527 2,257,866 Capital Drilling Mauritania SARL – 312,745 Capital Drilling Moçambique Limitada 2,020,129 1,659,164 Capital Drilling Namibia (Proprietary) Limited 11,934 11,934 Capital Drilling Papua New Guinea (foreign contractor branch) 382,366 2,276,385 Capital Drilling (Botswana) (Proprietary) Limited 3,783 – Capital Drilling (Ghana) Limited 818,079 – Cap-Sat Technologies Limited 3,468 20,473 Supply Force International Limited 647,058 496,015 Well Force International Limited 91,943 612,930 Capital Drilling South Africa (Proprietary) Limited – 1,953,879
15,677,715 14,460,727
These receivables are interest free, unsecured and have no fi xed terms of repayment. These amounts are denominated in United States Dollars.
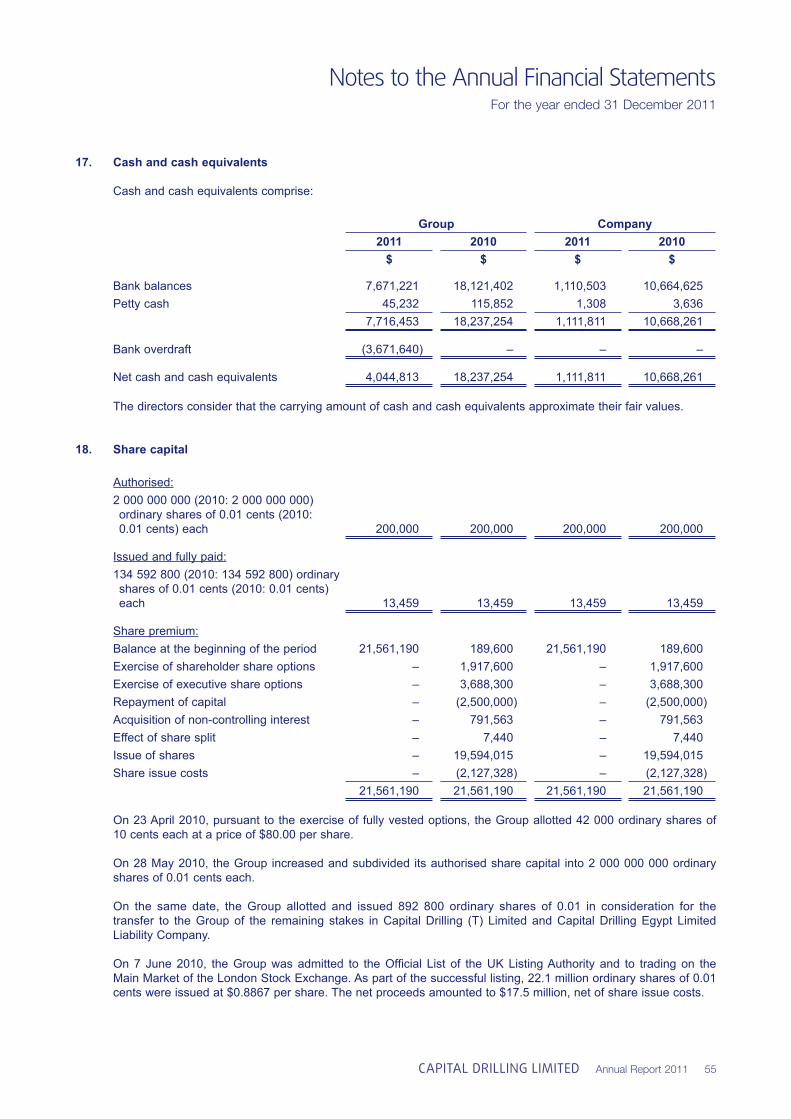
Notes to the Annual Financial StatementsFor the year ended 31 December 2011
CAPITAL DRILLING LIMITED Annual Report 2011 55
17. Cash and cash equivalents
Cash and cash equivalents comprise:
Group Company2011 2010 2011 2010
$ $ $ $
Bank balances 7,671,221 18,121,402 1,110,503 10,664,625 Petty cash 45,232 115,852 1,308 3,636
7,716,453 18,237,254 1,111,811 10,668,261
Bank overdraft (3,671,640) – – –
Net cash and cash equivalents 4,044,813 18,237,254 1,111,811 10,668,261
The directors consider that the carrying amount of cash and cash equivalents approximate their fair values.
18. Share capital
Authorised:2 000 000 000 (2010: 2 000 000 000) ordinary shares of 0.01 cents (2010: 0.01 cents) each 200,000 200,000 200,000 200,000
Issued and fully paid:134 592 800 (2010: 134 592 800) ordinary shares of 0.01 cents (2010: 0.01 cents) each 13,459 13,459 13,459 13,459
Share premium:Balance at the beginning of the period 21,561,190 189,600 21,561,190 189,600 Exercise of shareholder share options – 1,917,600 – 1,917,600 Exercise of executive share options – 3,688,300 – 3,688,300 Repayment of capital – (2,500,000) – (2,500,000)Acquisition of non-controlling interest – 791,563 – 791,563 Effect of share split – 7,440 – 7,440 Issue of shares – 19,594,015 – 19,594,015 Share issue costs – (2,127,328) – (2,127,328)
21,561,190 21,561,190 21,561,190 21,561,190
On 23 April 2010, pursuant to the exercise of fully vested options, the Group allotted 42 000 ordinary shares of 10 cents each at a price of $80.00 per share.
On 28 May 2010, the Group increased and subdivided its authorised share capital into 2 000 000 000 ordinary shares of 0.01 cents each.
On the same date, the Group allotted and issued 892 800 ordinary shares of 0.01 in consideration for the transfer to the Group of the remaining stakes in Capital Drilling (T) Limited and Capital Drilling Egypt Limited Liability Company.
On 7 June 2010, the Group was admitted to the Offi cial List of the UK Listing Authority and to trading on the Main Market of the London Stock Exchange. As part of the successful listing, 22.1 million ordinary shares of 0.01 cents were issued at $0.8867 per share. The net proceeds amounted to $17.5 million, net of share issue costs.
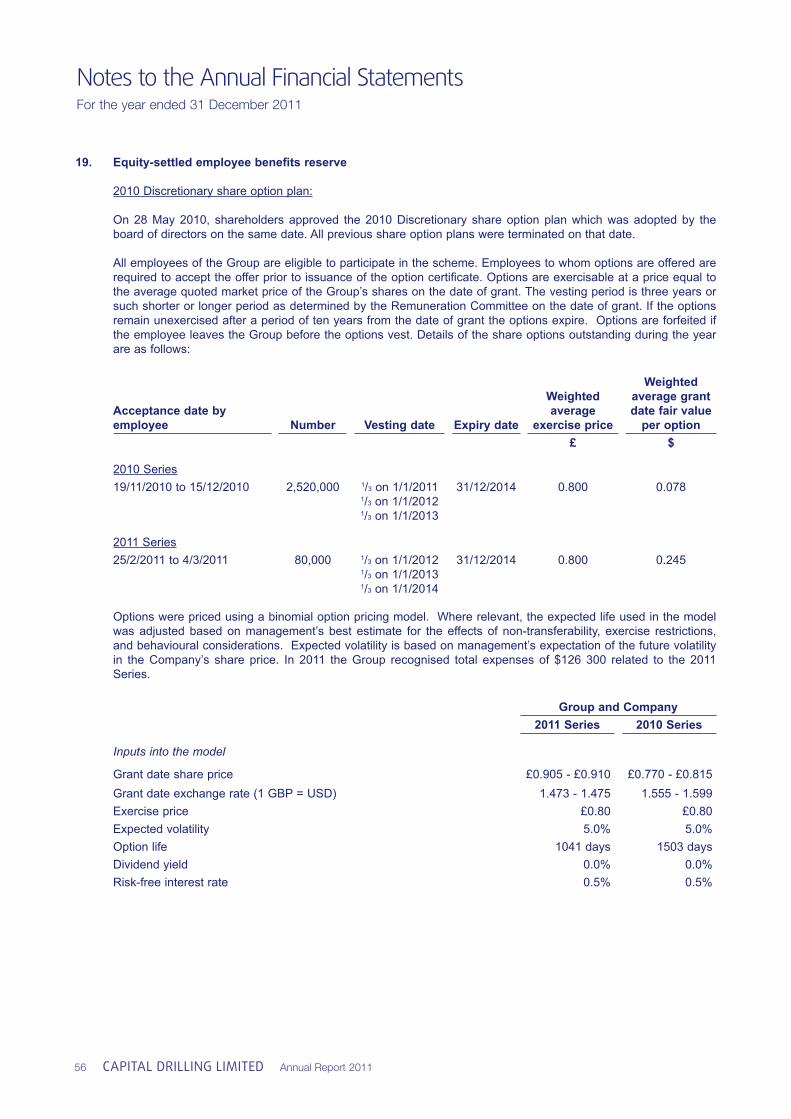
Notes to the Annual Financial StatementsFor the year ended 31 December 2011
56 CAPITAL DRILLING LIMITED Annual Report 2011
19. Equity-settled employee benefi ts reserve
2010 Discretionary share option plan:
On 28 May 2010, shareholders approved the 2010 Discretionary share option plan which was adopted by the board of directors on the same date. All previous share option plans were terminated on that date.
All employees of the Group are eligible to participate in the scheme. Employees to whom options are offered are required to accept the offer prior to issuance of the option certifi cate. Options are exercisable at a price equal to the average quoted market price of the Group’s shares on the date of grant. The vesting period is three years or such shorter or longer period as determined by the Remuneration Committee on the date of grant. If the options remain unexercised after a period of ten years from the date of grant the options expire. Options are forfeited if the employee leaves the Group before the options vest. Details of the share options outstanding during the year are as follows:
Acceptance date by employee Number Vesting date Expiry date
Weighted average
exercise price
Weighted average grant date fair value
per option£ $
2010 Series19/11/2010 to 15/12/2010 2,520,000 1/3 on 1/1/2011
1/3 on 1/1/20121/3 on 1/1/2013
31/12/2014 0.800 0.078
2011 Series25/2/2011 to 4/3/2011 80,000 1/3 on 1/1/2012
1/3 on 1/1/20131/3 on 1/1/2014
31/12/2014 0.800 0.245
Options were priced using a binomial option pricing model. Where relevant, the expected life used in the model was adjusted based on management’s best estimate for the effects of non-transferability, exercise restrictions, and behavioural considerations. Expected volatility is based on management’s expectation of the future volatility in the Company’s share price. In 2011 the Group recognised total expenses of $126 300 related to the 2011 Series.
Group and Company2011 Series 2010 Series
Inputs into the model
Grant date share price £0.905 - £0.910 £0.770 - £0.815Grant date exchange rate (1 GBP = USD) 1.473 - 1.475 1.555 - 1.599Exercise price £0.80 £0.80Expected volatility 5.0% 5.0%Option life 1041 days 1503 daysDividend yield 0.0% 0.0%Risk-free interest rate 0.5% 0.5%
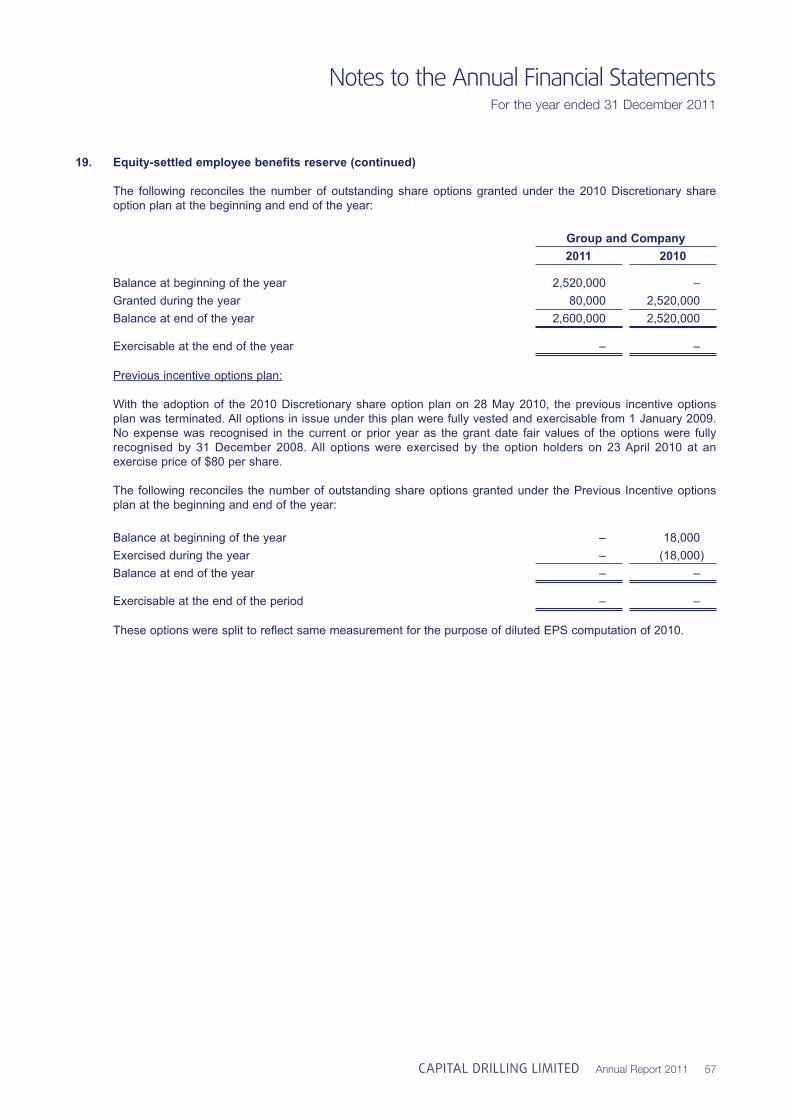
Notes to the Annual Financial StatementsFor the year ended 31 December 2011
CAPITAL DRILLING LIMITED Annual Report 2011 57
19. Equity-settled employee benefi ts reserve (continued)
The following reconciles the number of outstanding share options granted under the 2010 Discretionary share option plan at the beginning and end of the year:
Group and Company2011 2010
Balance at beginning of the year 2,520,000 – Granted during the year 80,000 2,520,000 Balance at end of the year 2,600,000 2,520,000
Exercisable at the end of the year – –
Previous incentive options plan:
With the adoption of the 2010 Discretionary share option plan on 28 May 2010, the previous incentive options plan was terminated. All options in issue under this plan were fully vested and exercisable from 1 January 2009. No expense was recognised in the current or prior year as the grant date fair values of the options were fully recognised by 31 December 2008. All options were exercised by the option holders on 23 April 2010 at an exercise price of $80 per share.
The following reconciles the number of outstanding share options granted under the Previous Incentive options plan at the beginning and end of the year:
Balance at beginning of the year – 18,000 Exercised during the year – (18,000)Balance at end of the year – –
Exercisable at the end of the period – –
These options were split to refl ect same measurement for the purpose of diluted EPS computation of 2010.
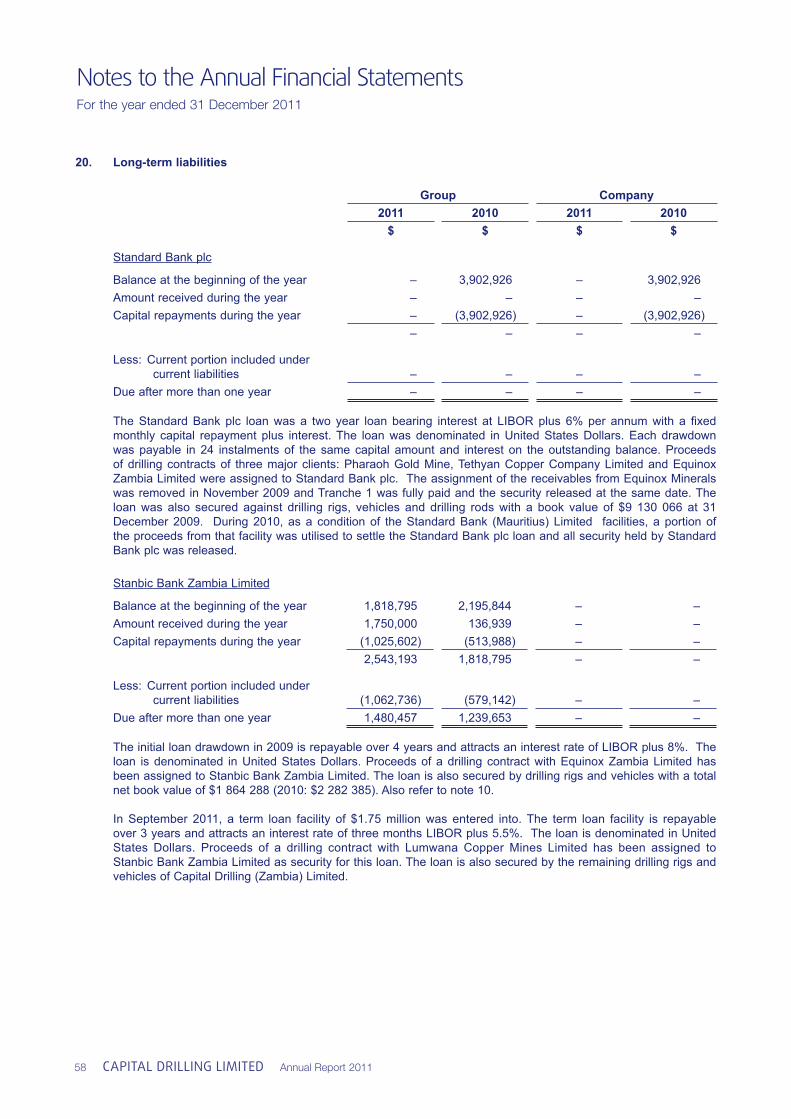
Notes to the Annual Financial StatementsFor the year ended 31 December 2011
58 CAPITAL DRILLING LIMITED Annual Report 2011
20. Long-term liabilities
Group Company2011 2010 2011 2010
$ $ $ $
Standard Bank plc
Balance at the beginning of the year – 3,902,926 – 3,902,926 Amount received during the year – – – – Capital repayments during the year – (3,902,926) – (3,902,926)
– – – –
Less: Current portion included under current liabilities – – – – Due after more than one year – – – –
The Standard Bank plc loan was a two year loan bearing interest at LIBOR plus 6% per annum with a fi xed monthly capital repayment plus interest. The loan was denominated in United States Dollars. Each drawdown was payable in 24 instalments of the same capital amount and interest on the outstanding balance. Proceeds of drilling contracts of three major clients: Pharaoh Gold Mine, Tethyan Copper Company Limited and Equinox Zambia Limited were assigned to Standard Bank plc. The assignment of the receivables from Equinox Minerals was removed in November 2009 and Tranche 1 was fully paid and the security released at the same date. The loan was also secured against drilling rigs, vehicles and drilling rods with a book value of $9 130 066 at 31 December 2009. During 2010, as a condition of the Standard Bank (Mauritius) Limited facilities, a portion of the proceeds from that facility was utilised to settle the Standard Bank plc loan and all security held by Standard Bank plc was released.
Stanbic Bank Zambia Limited
Balance at the beginning of the year 1,818,795 2,195,844 – – Amount received during the year 1,750,000 136,939 – – Capital repayments during the year (1,025,602) (513,988) – –
2,543,193 1,818,795 – –
Less: Current portion included under current liabilities (1,062,736) (579,142) – – Due after more than one year 1,480,457 1,239,653 – –
The initial loan drawdown in 2009 is repayable over 4 years and attracts an interest rate of LIBOR plus 8%. The loan is denominated in United States Dollars. Proceeds of a drilling contract with Equinox Zambia Limited has been assigned to Stanbic Bank Zambia Limited. The loan is also secured by drilling rigs and vehicles with a total net book value of $1 864 288 (2010: $2 282 385). Also refer to note 10.
In September 2011, a term loan facility of $1.75 million was entered into. The term loan facility is repayable over 3 years and attracts an interest rate of three months LIBOR plus 5.5%. The loan is denominated in United States Dollars. Proceeds of a drilling contract with Lumwana Copper Mines Limited has been assigned to Stanbic Bank Zambia Limited as security for this loan. The loan is also secured by the remaining drilling rigs and vehicles of Capital Drilling (Zambia) Limited.
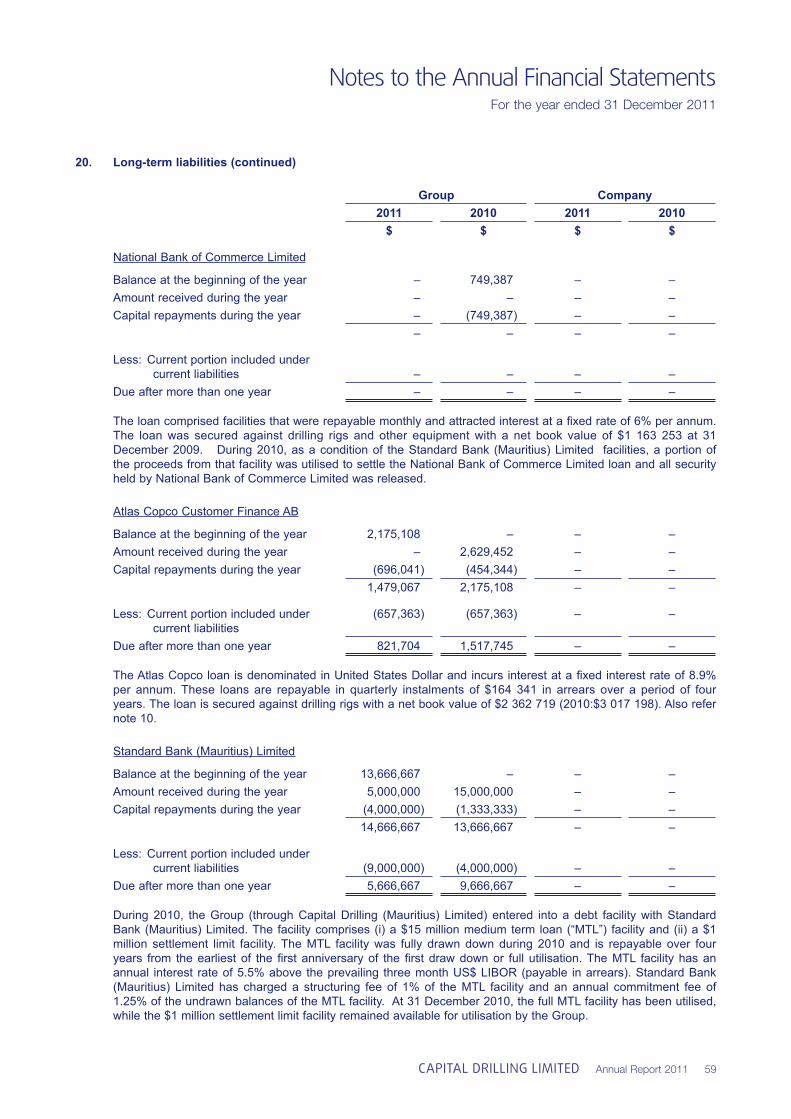
Notes to the Annual Financial StatementsFor the year ended 31 December 2011
CAPITAL DRILLING LIMITED Annual Report 2011 59
20. Long-term liabilities (continued)
Group Company2011 2010 2011 2010
$ $ $ $
National Bank of Commerce Limited
Balance at the beginning of the year – 749,387 – – Amount received during the year – – – – Capital repayments during the year – (749,387) – –
– – – –
Less: Current portion included under current liabilities – – – – Due after more than one year – – – –
The loan comprised facilities that were repayable monthly and attracted interest at a fi xed rate of 6% per annum. The loan was secured against drilling rigs and other equipment with a net book value of $1 163 253 at 31 December 2009. During 2010, as a condition of the Standard Bank (Mauritius) Limited facilities, a portion of the proceeds from that facility was utilised to settle the National Bank of Commerce Limited loan and all security held by National Bank of Commerce Limited was released.
Atlas Copco Customer Finance AB
Balance at the beginning of the year 2,175,108 – – – Amount received during the year – 2,629,452 – – Capital repayments during the year (696,041) (454,344) – –
1,479,067 2,175,108 – –
Less: Current portion included under current liabilities
(657,363) (657,363) – –
Due after more than one year 821,704 1,517,745 – –
The Atlas Copco loan is denominated in United States Dollar and incurs interest at a fi xed interest rate of 8.9% per annum. These loans are repayable in quarterly instalments of $164 341 in arrears over a period of four years. The loan is secured against drilling rigs with a net book value of $2 362 719 (2010:$3 017 198). Also refer note 10.
Standard Bank (Mauritius) Limited
Balance at the beginning of the year 13,666,667 – – – Amount received during the year 5,000,000 15,000,000 – – Capital repayments during the year (4,000,000) (1,333,333) – –
14,666,667 13,666,667 – –
Less: Current portion included under current liabilities (9,000,000) (4,000,000) – – Due after more than one year 5,666,667 9,666,667 – –
During 2010, the Group (through Capital Drilling (Mauritius) Limited) entered into a debt facility with Standard Bank (Mauritius) Limited. The facility comprises (i) a $15 million medium term loan (“MTL”) facility and (ii) a $1 million settlement limit facility. The MTL facility was fully drawn down during 2010 and is repayable over four years from the earliest of the fi rst anniversary of the fi rst draw down or full utilisation. The MTL facility has an annual interest rate of 5.5% above the prevailing three month US$ LIBOR (payable in arrears). Standard Bank (Mauritius) Limited has charged a structuring fee of 1% of the MTL facility and an annual commitment fee of 1.25% of the undrawn balances of the MTL facility. At 31 December 2010, the full MTL facility has been utilised, while the $1 million settlement limit facility remained available for utilisation by the Group.
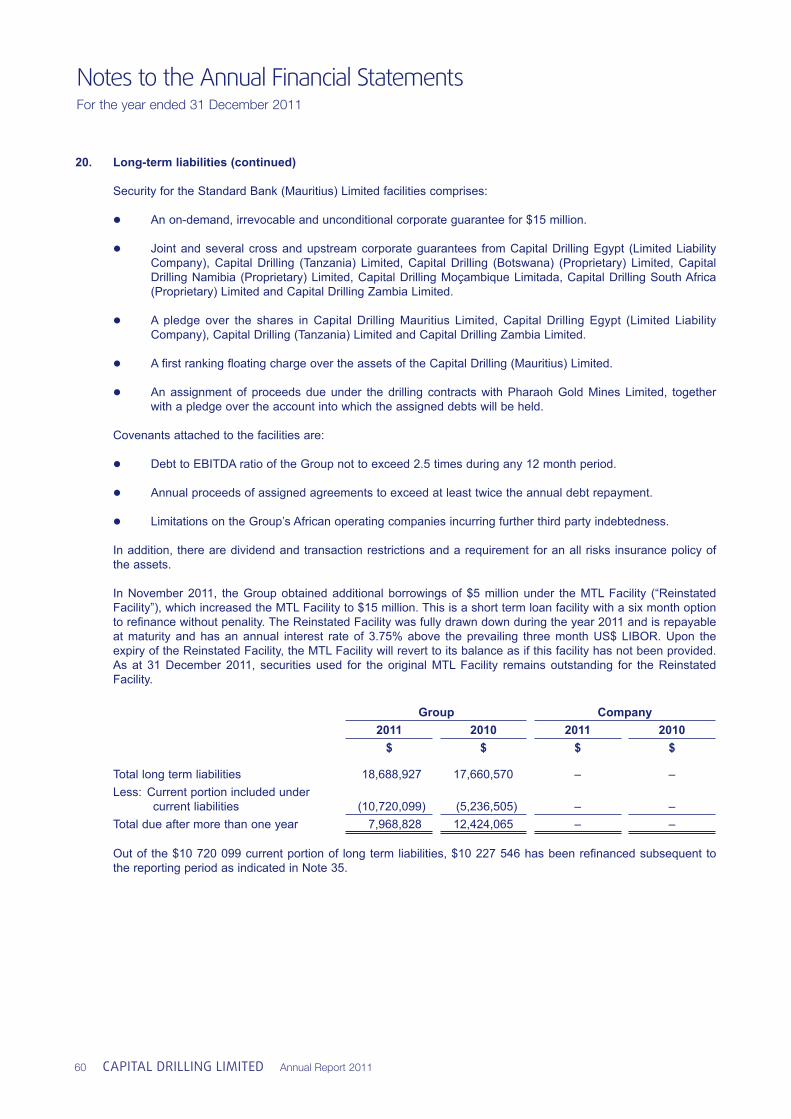
Notes to the Annual Financial StatementsFor the year ended 31 December 2011
60 CAPITAL DRILLING LIMITED Annual Report 2011
20. Long-term liabilities (continued)
Security for the Standard Bank (Mauritius) Limited facilities comprises:
An on-demand, irrevocable and unconditional corporate guarantee for $15 million.
Joint and several cross and upstream corporate guarantees from Capital Drilling Egypt (Limited Liability Company), Capital Drilling (Tanzania) Limited, Capital Drilling (Botswana) (Proprietary) Limited, Capital Drilling Namibia (Proprietary) Limited, Capital Drilling Moçambique Limitada, Capital Drilling South Africa (Proprietary) Limited and Capital Drilling Zambia Limited.
A pledge over the shares in Capital Drilling Mauritius Limited, Capital Drilling Egypt (Limited Liability Company), Capital Drilling (Tanzania) Limited and Capital Drilling Zambia Limited.
A fi rst ranking fl oating charge over the assets of the Capital Drilling (Mauritius) Limited.
An assignment of proceeds due under the drilling contracts with Pharaoh Gold Mines Limited, together with a pledge over the account into which the assigned debts will be held.
Covenants attached to the facilities are:
Debt to EBITDA ratio of the Group not to exceed 2.5 times during any 12 month period.
Annual proceeds of assigned agreements to exceed at least twice the annual debt repayment.
Limitations on the Group’s African operating companies incurring further third party indebtedness.
In addition, there are dividend and transaction restrictions and a requirement for an all risks insurance policy of the assets.
In November 2011, the Group obtained additional borrowings of $5 million under the MTL Facility (“Reinstated Facility”), which increased the MTL Facility to $15 million. This is a short term loan facility with a six month option to refi nance without penality. The Reinstated Facility was fully drawn down during the year 2011 and is repayable at maturity and has an annual interest rate of 3.75% above the prevailing three month US$ LIBOR. Upon the expiry of the Reinstated Facility, the MTL Facility will revert to its balance as if this facility has not been provided. As at 31 December 2011, securities used for the original MTL Facility remains outstanding for the Reinstated Facility.
Group Company2011 2010 2011 2010
$ $ $ $
Total long term liabilities 18,688,927 17,660,570 – – Less: Current portion included under current liabilities (10,720,099) (5,236,505) – – Total due after more than one year 7,968,828 12,424,065 – –
Out of the $10 720 099 current portion of long term liabilities, $10 227 546 has been refi nanced subsequent to the reporting period as indicated in Note 35.
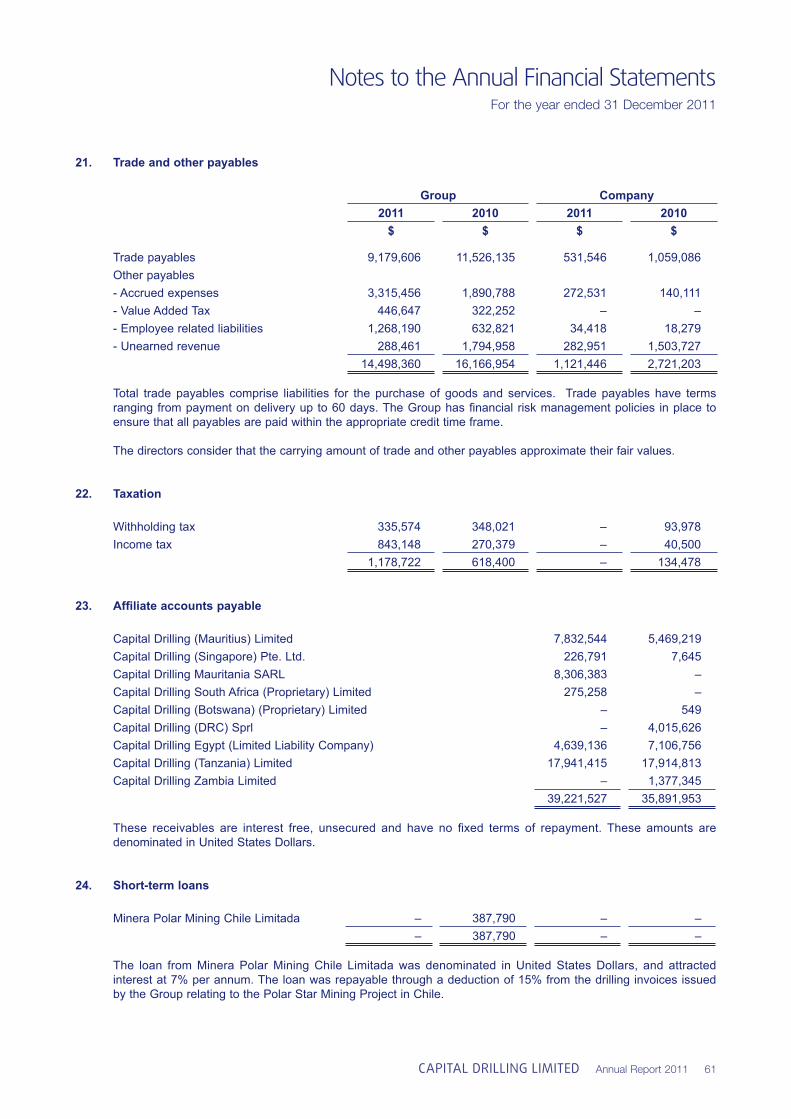
Notes to the Annual Financial StatementsFor the year ended 31 December 2011
CAPITAL DRILLING LIMITED Annual Report 2011 61
21. Trade and other payables
Group Company2011 2010 2011 2010
$ $ $ $
Trade payables 9,179,606 11,526,135 531,546 1,059,086 Other payables- Accrued expenses 3,315,456 1,890,788 272,531 140,111 - Value Added Tax 446,647 322,252 – – - Employee related liabilities 1,268,190 632,821 34,418 18,279 - Unearned revenue 288,461 1,794,958 282,951 1,503,727
14,498,360 16,166,954 1,121,446 2,721,203
Total trade payables comprise liabilities for the purchase of goods and services. Trade payables have terms ranging from payment on delivery up to 60 days. The Group has fi nancial risk management policies in place to ensure that all payables are paid within the appropriate credit time frame.
The directors consider that the carrying amount of trade and other payables approximate their fair values.
22. Taxation
Withholding tax 335,574 348,021 – 93,978 Income tax 843,148 270,379 – 40,500
1,178,722 618,400 – 134,478
23. Affi liate accounts payable
Capital Drilling (Mauritius) Limited 7,832,544 5,469,219 Capital Drilling (Singapore) Pte. Ltd. 226,791 7,645 Capital Drilling Mauritania SARL 8,306,383 – Capital Drilling South Africa (Proprietary) Limited 275,258 – Capital Drilling (Botswana) (Proprietary) Limited – 549 Capital Drilling (DRC) Sprl – 4,015,626 Capital Drilling Egypt (Limited Liability Company) 4,639,136 7,106,756 Capital Drilling (Tanzania) Limited 17,941,415 17,914,813 Capital Drilling Zambia Limited – 1,377,345
39,221,527 35,891,953
These receivables are interest free, unsecured and have no fi xed terms of repayment. These amounts are denominated in United States Dollars.
24. Short-term loans
Minera Polar Mining Chile Limitada – 387,790 – –– 387,790 – –
The loan from Minera Polar Mining Chile Limitada was denominated in United States Dollars, and attracted
interest at 7% per annum. The loan was repayable through a deduction of 15% from the drilling invoices issued by the Group relating to the Polar Star Mining Project in Chile.
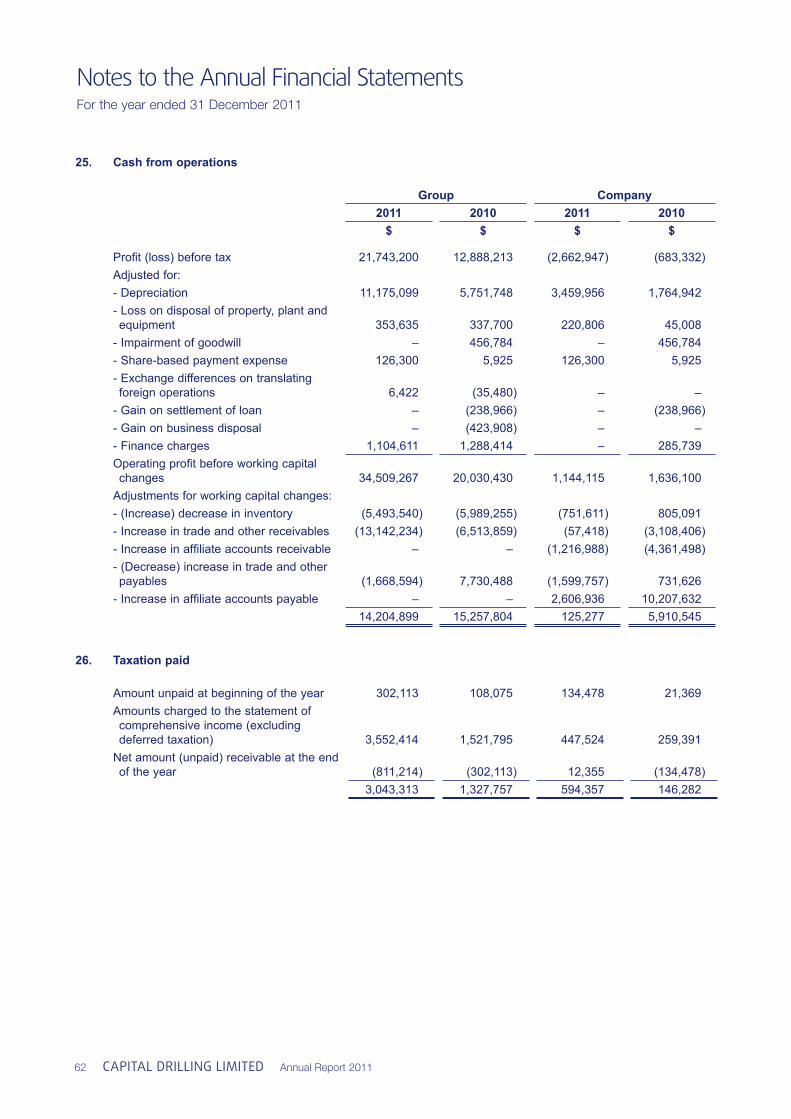
Notes to the Annual Financial StatementsFor the year ended 31 December 2011
62 CAPITAL DRILLING LIMITED Annual Report 2011
25. Cash from operations
Group Company2011 2010 2011 2010
$ $ $ $
Profi t (loss) before tax 21,743,200 12,888,213 (2,662,947) (683,332)Adjusted for:- Depreciation 11,175,099 5,751,748 3,459,956 1,764,942 - Loss on disposal of property, plant and equipment 353,635 337,700 220,806 45,008 - Impairment of goodwill – 456,784 – 456,784 - Share-based payment expense 126,300 5,925 126,300 5,925 - Exchange differences on translating foreign operations 6,422 (35,480) – – - Gain on settlement of loan – (238,966) – (238,966)- Gain on business disposal – (423,908) – – - Finance charges 1,104,611 1,288,414 – 285,739 Operating profi t before working capital changes 34,509,267 20,030,430 1,144,115 1,636,100 Adjustments for working capital changes:- (Increase) decrease in inventory (5,493,540) (5,989,255) (751,611) 805,091 - Increase in trade and other receivables (13,142,234) (6,513,859) (57,418) (3,108,406)- Increase in affi liate accounts receivable – – (1,216,988) (4,361,498)- (Decrease) increase in trade and other payables (1,668,594) 7,730,488 (1,599,757) 731,626 - Increase in affi liate accounts payable – – 2,606,936 10,207,632
14,204,899 15,257,804 125,277 5,910,545
26. Taxation paid
Amount unpaid at beginning of the year 302,113 108,075 134,478 21,369Amounts charged to the statement of comprehensive income (excluding deferred taxation) 3,552,414 1,521,795 447,524 259,391Net amount (unpaid) receivable at the end of the year (811,214) (302,113) 12,355 (134,478)
3,043,313 1,327,757 594,357 146,282
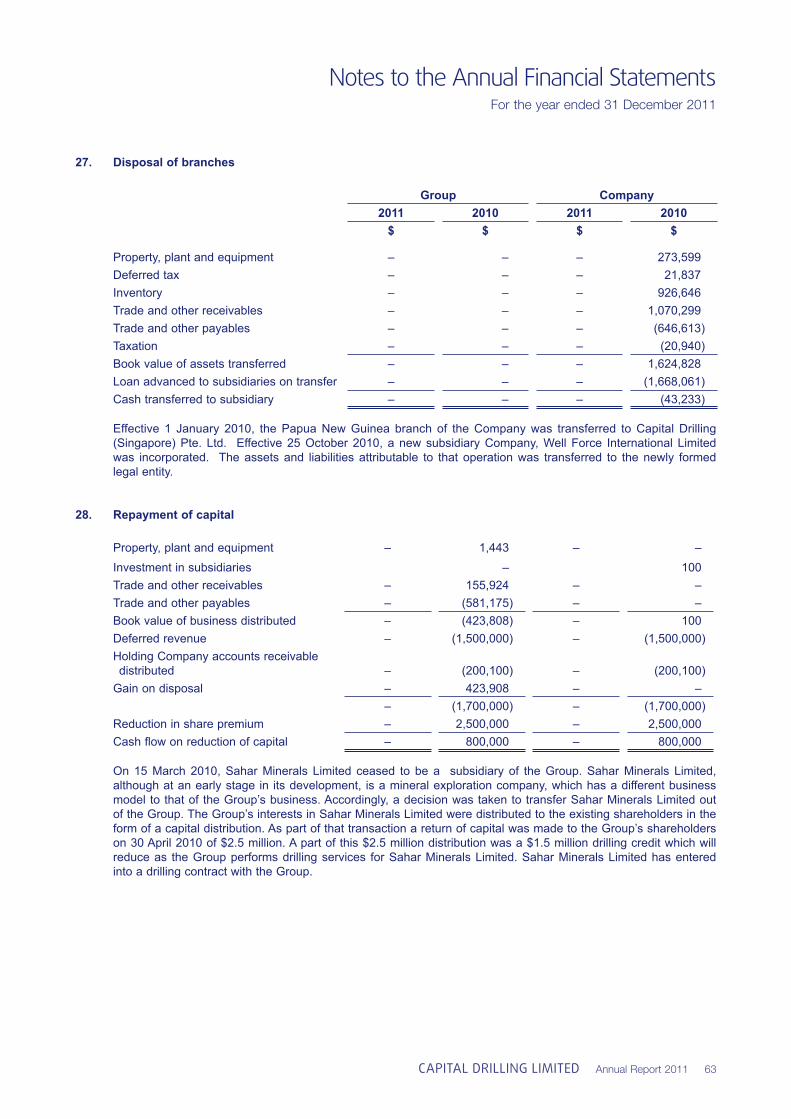
Notes to the Annual Financial StatementsFor the year ended 31 December 2011
CAPITAL DRILLING LIMITED Annual Report 2011 63
27. Disposal of branches
Group Company2011 2010 2011 2010
$ $ $ $
Property, plant and equipment – – – 273,599 Deferred tax – – – 21,837 Inventory – – – 926,646 Trade and other receivables – – – 1,070,299 Trade and other payables – – – (646,613)Taxation – – – (20,940)Book value of assets transferred – – – 1,624,828 Loan advanced to subsidiaries on transfer – – – (1,668,061)Cash transferred to subsidiary – – – (43,233)
Effective 1 January 2010, the Papua New Guinea branch of the Company was transferred to Capital Drilling (Singapore) Pte. Ltd. Effective 25 October 2010, a new subsidiary Company, Well Force International Limited was incorporated. The assets and liabilities attributable to that operation was transferred to the newly formed legal entity.
28. Repayment of capital
Property, plant and equipment – 1,443 – – Investment in subsidiaries – 100 Trade and other receivables – 155,924 – – Trade and other payables – (581,175) – – Book value of business distributed – (423,808) – 100 Deferred revenue – (1,500,000) – (1,500,000)Holding Company accounts receivable distributed – (200,100) – (200,100)Gain on disposal – 423,908 – –
– (1,700,000) – (1,700,000) Reduction in share premium – 2,500,000 – 2,500,000 Cash fl ow on reduction of capital – 800,000 – 800,000
On 15 March 2010, Sahar Minerals Limited ceased to be a subsidiary of the Group. Sahar Minerals Limited, although at an early stage in its development, is a mineral exploration company, which has a different business model to that of the Group’s business. Accordingly, a decision was taken to transfer Sahar Minerals Limited out of the Group. The Group’s interests in Sahar Minerals Limited were distributed to the existing shareholders in the form of a capital distribution. As part of that transaction a return of capital was made to the Group’s shareholders on 30 April 2010 of $2.5 million. A part of this $2.5 million distribution was a $1.5 million drilling credit which will reduce as the Group performs drilling services for Sahar Minerals Limited. Sahar Minerals Limited has entered into a drilling contract with the Group.
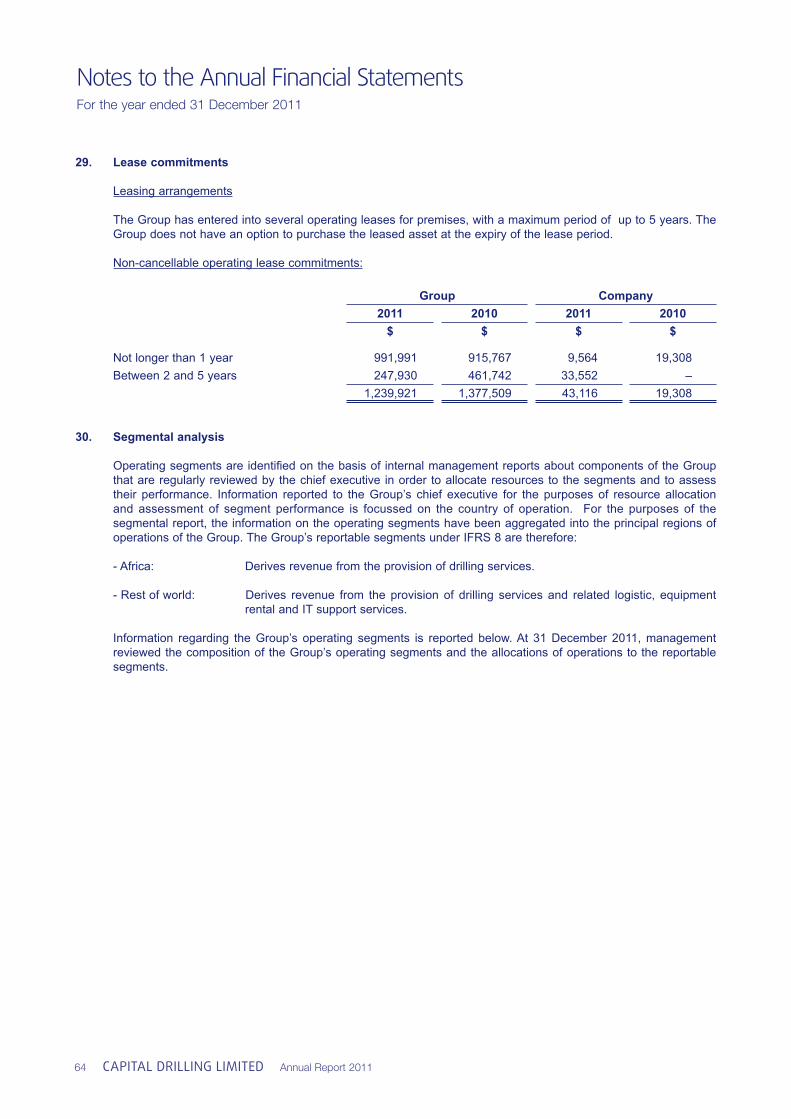
Notes to the Annual Financial StatementsFor the year ended 31 December 2011
64 CAPITAL DRILLING LIMITED Annual Report 2011
29. Lease commitments Leasing arrangements
The Group has entered into several operating leases for premises, with a maximum period of up to 5 years. The Group does not have an option to purchase the leased asset at the expiry of the lease period.
Non-cancellable operating lease commitments:
Group Company2011 2010 2011 2010
$ $ $ $
Not longer than 1 year 991,991 915,767 9,564 19,308 Between 2 and 5 years 247,930 461,742 33,552 –
1,239,921 1,377,509 43,116 19,308
30. Segmental analysis
Operating segments are identifi ed on the basis of internal management reports about components of the Group that are regularly reviewed by the chief executive in order to allocate resources to the segments and to assess their performance. Information reported to the Group’s chief executive for the purposes of resource allocation and assessment of segment performance is focussed on the country of operation. For the purposes of the segmental report, the information on the operating segments have been aggregated into the principal regions of operations of the Group. The Group’s reportable segments under IFRS 8 are therefore:
- Africa: Derives revenue from the provision of drilling services.
- Rest of world: Derives revenue from the provision of drilling services and related logistic, equipment rental and IT support services.
Information regarding the Group’s operating segments is reported below. At 31 December 2011, management reviewed the composition of the Group’s operating segments and the allocations of operations to the reportable segments.
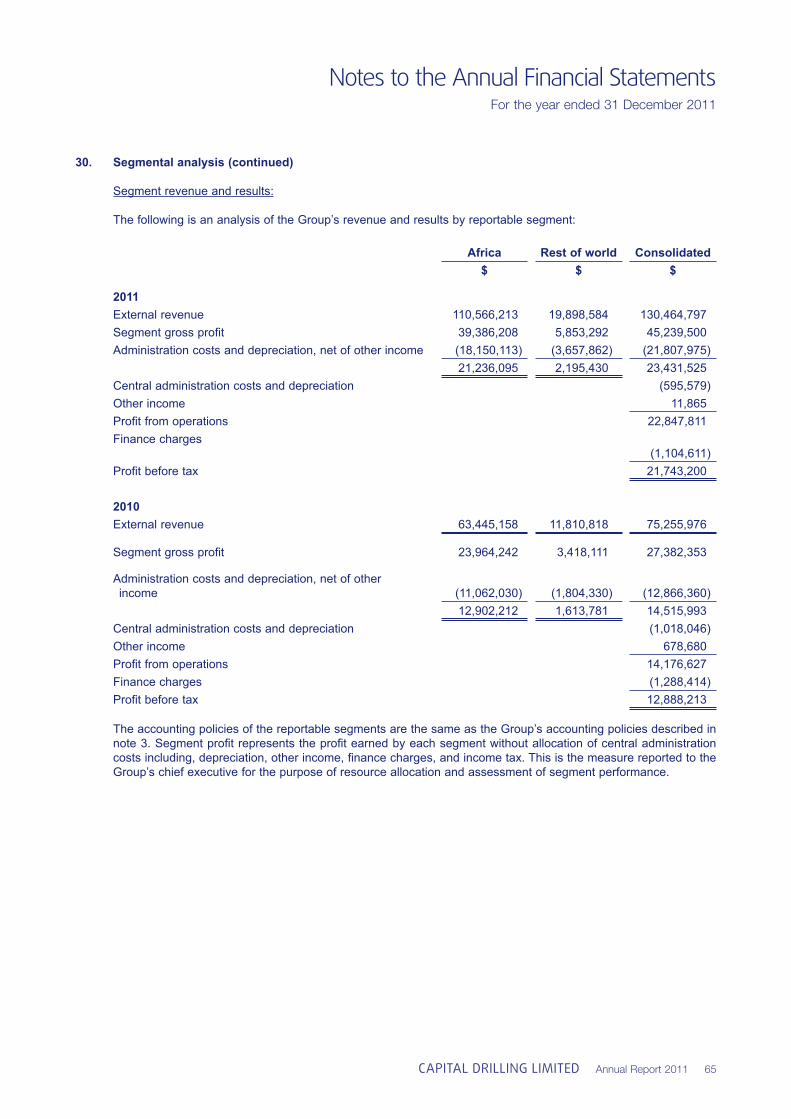
Notes to the Annual Financial StatementsFor the year ended 31 December 2011
CAPITAL DRILLING LIMITED Annual Report 2011 65
30. Segmental analysis (continued) Segment revenue and results:
The following is an analysis of the Group’s revenue and results by reportable segment:
Africa Rest of world Consolidated$ $ $
2011External revenue 110,566,213 19,898,584 130,464,797 Segment gross profi t 39,386,208 5,853,292 45,239,500 Administration costs and depreciation, net of other income (18,150,113) (3,657,862) (21,807,975)
21,236,095 2,195,430 23,431,525 Central administration costs and depreciation (595,579)Other income 11,865 Profi t from operations 22,847,811 Finance charges
(1,104,611)Profi t before tax 21,743,200
2010External revenue 63,445,158 11,810,818 75,255,976
Segment gross profi t 23,964,242 3,418,111 27,382,353
Administration costs and depreciation, net of other income (11,062,030) (1,804,330) (12,866,360)
12,902,212 1,613,781 14,515,993 Central administration costs and depreciation (1,018,046)Other income 678,680 Profi t from operations 14,176,627 Finance charges (1,288,414)Profi t before tax 12,888,213
The accounting policies of the reportable segments are the same as the Group’s accounting policies described in note 3. Segment profi t represents the profi t earned by each segment without allocation of central administration costs including, depreciation, other income, fi nance charges, and income tax. This is the measure reported to the Group’s chief executive for the purpose of resource allocation and assessment of segment performance.
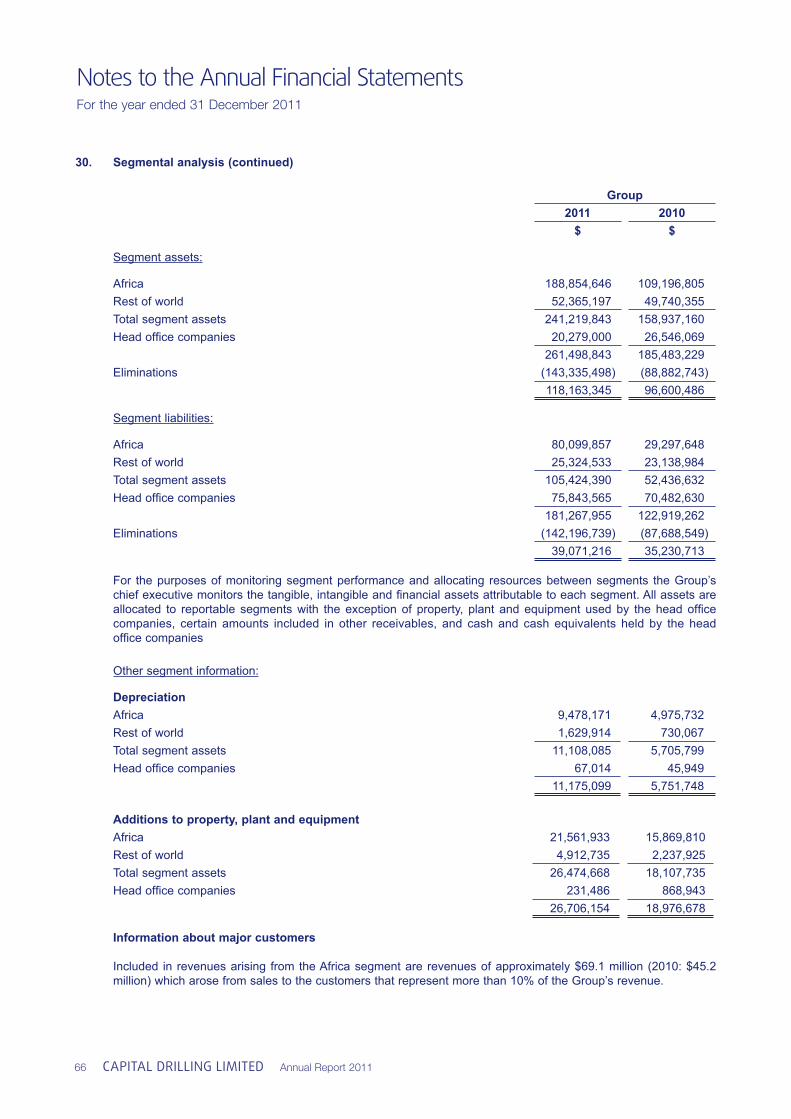
Notes to the Annual Financial StatementsFor the year ended 31 December 2011
66 CAPITAL DRILLING LIMITED Annual Report 2011
30. Segmental analysis (continued)
Group2011 2010
$ $
Segment assets:
Africa 188,854,646 109,196,805 Rest of world 52,365,197 49,740,355 Total segment assets 241,219,843 158,937,160 Head offi ce companies 20,279,000 26,546,069
261,498,843 185,483,229 Eliminations (143,335,498) (88,882,743)
118,163,345 96,600,486
Segment liabilities:
Africa 80,099,857 29,297,648 Rest of world 25,324,533 23,138,984 Total segment assets 105,424,390 52,436,632 Head offi ce companies 75,843,565 70,482,630
181,267,955 122,919,262 Eliminations (142,196,739) (87,688,549)
39,071,216 35,230,713
For the purposes of monitoring segment performance and allocating resources between segments the Group’s chief executive monitors the tangible, intangible and fi nancial assets attributable to each segment. All assets are allocated to reportable segments with the exception of property, plant and equipment used by the head offi ce companies, certain amounts included in other receivables, and cash and cash equivalents held by the head offi ce companies
Other segment information:
DepreciationAfrica 9,478,171 4,975,732 Rest of world 1,629,914 730,067 Total segment assets 11,108,085 5,705,799 Head offi ce companies 67,014 45,949
11,175,099 5,751,748 Additions to property, plant and equipmentAfrica 21,561,933 15,869,810 Rest of world 4,912,735 2,237,925 Total segment assets 26,474,668 18,107,735 Head offi ce companies 231,486 868,943
26,706,154 18,976,678
Information about major customers
Included in revenues arising from the Africa segment are revenues of approximately $69.1 million (2010: $45.2 million) which arose from sales to the customers that represent more than 10% of the Group’s revenue.
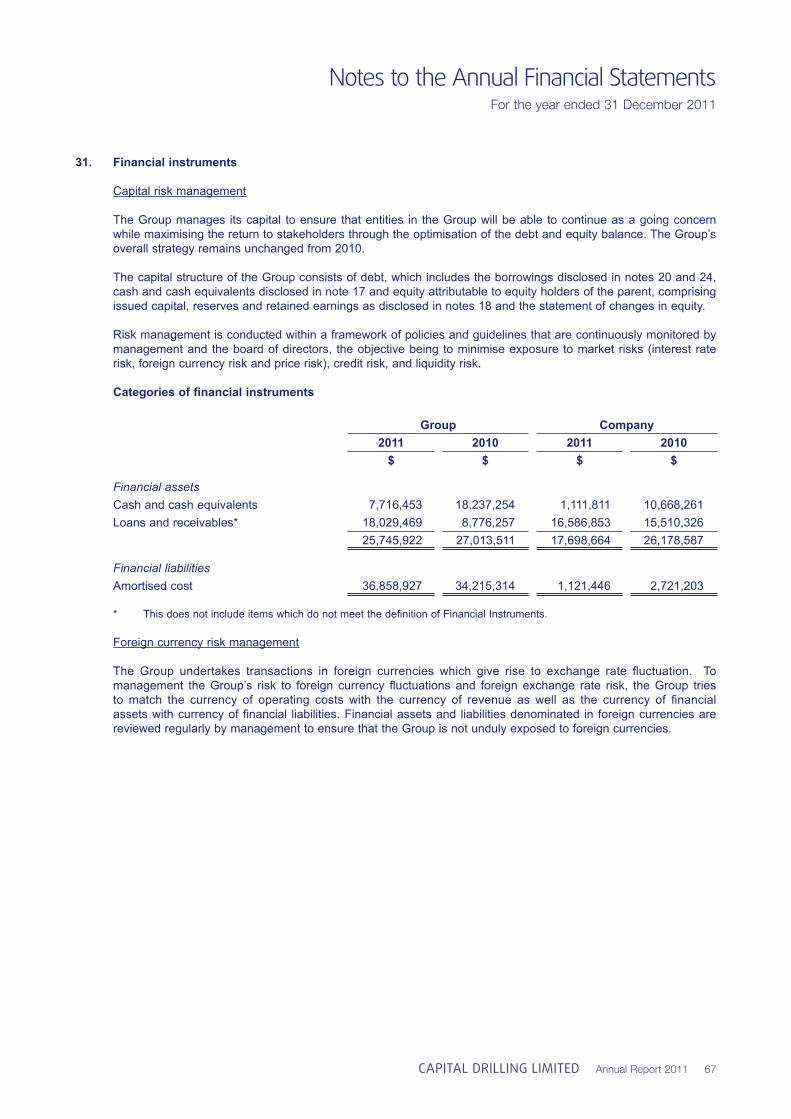
Notes to the Annual Financial StatementsFor the year ended 31 December 2011
CAPITAL DRILLING LIMITED Annual Report 2011 67
31. Financial instruments Capital risk management The Group manages its capital to ensure that entities in the Group will be able to continue as a going concern
while maximising the return to stakeholders through the optimisation of the debt and equity balance. The Group’s overall strategy remains unchanged from 2010.
The capital structure of the Group consists of debt, which includes the borrowings disclosed in notes 20 and 24,
cash and cash equivalents disclosed in note 17 and equity attributable to equity holders of the parent, comprising issued capital, reserves and retained earnings as disclosed in notes 18 and the statement of changes in equity.
Risk management is conducted within a framework of policies and guidelines that are continuously monitored by management and the board of directors, the objective being to minimise exposure to market risks (interest rate risk, foreign currency risk and price risk), credit risk, and liquidity risk.
Categories of fi nancial instruments
Group Company2011 2010 2011 2010
$ $ $ $
Financial assetsCash and cash equivalents 7,716,453 18,237,254 1,111,811 10,668,261 Loans and receivables* 18,029,469 8,776,257 16,586,853 15,510,326
25,745,922 27,013,511 17,698,664 26,178,587
Financial liabilitiesAmortised cost 36,858,927 34,215,314 1,121,446 2,721,203
* This does not include items which do not meet the defi nition of Financial Instruments.
Foreign currency risk management The Group undertakes transactions in foreign currencies which give rise to exchange rate fl uctuation. To
management the Group’s risk to foreign currency fl uctuations and foreign exchange rate risk, the Group tries to match the currency of operating costs with the currency of revenue as well as the currency of fi nancial assets with currency of fi nancial liabilities. Financial assets and liabilities denominated in foreign currencies are reviewed regularly by management to ensure that the Group is not unduly exposed to foreign currencies.
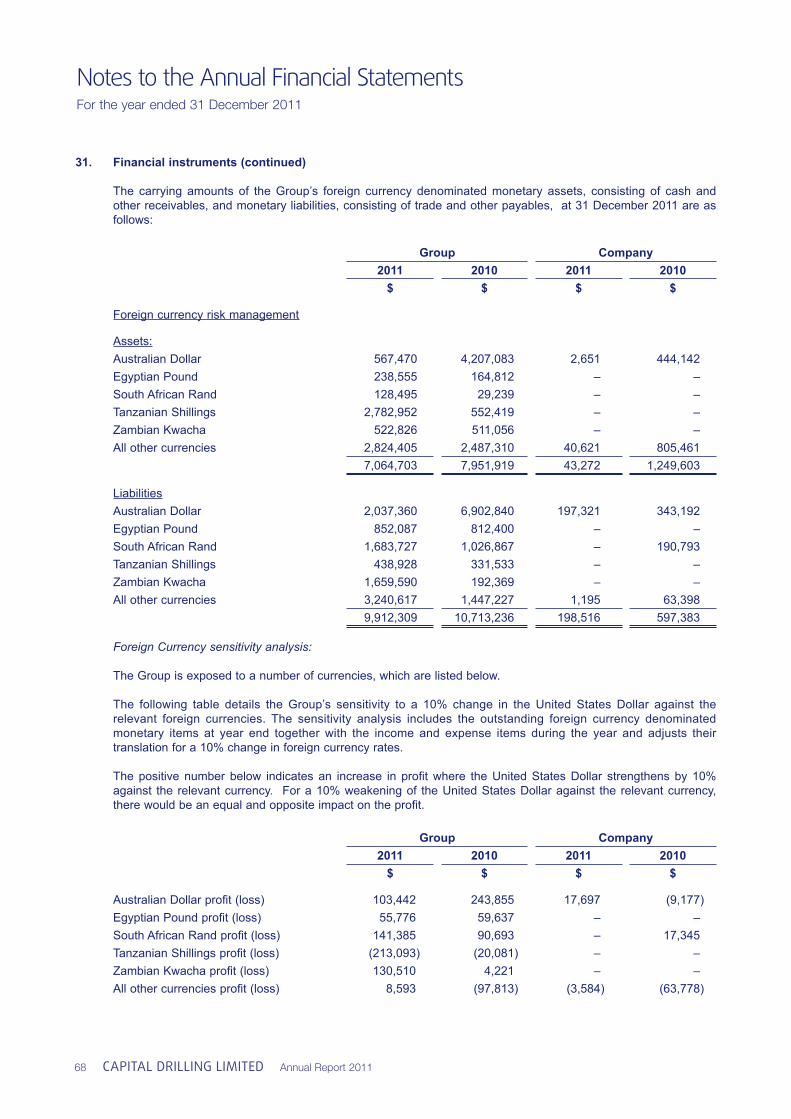
Notes to the Annual Financial StatementsFor the year ended 31 December 2011
68 CAPITAL DRILLING LIMITED Annual Report 2011
31. Financial instruments (continued) The carrying amounts of the Group’s foreign currency denominated monetary assets, consisting of cash and
other receivables, and monetary liabilities, consisting of trade and other payables, at 31 December 2011 are as follows:
Group Company2011 2010 2011 2010
$ $ $ $
Foreign currency risk management
Assets:Australian Dollar 567,470 4,207,083 2,651 444,142 Egyptian Pound 238,555 164,812 – – South African Rand 128,495 29,239 – – Tanzanian Shillings 2,782,952 552,419 – – Zambian Kwacha 522,826 511,056 – – All other currencies 2,824,405 2,487,310 40,621 805,461
7,064,703 7,951,919 43,272 1,249,603
LiabilitiesAustralian Dollar 2,037,360 6,902,840 197,321 343,192 Egyptian Pound 852,087 812,400 – – South African Rand 1,683,727 1,026,867 – 190,793 Tanzanian Shillings 438,928 331,533 – – Zambian Kwacha 1,659,590 192,369 – – All other currencies 3,240,617 1,447,227 1,195 63,398
9,912,309 10,713,236 198,516 597,383
Foreign Currency sensitivity analysis:
The Group is exposed to a number of currencies, which are listed below.
The following table details the Group’s sensitivity to a 10% change in the United States Dollar against the relevant foreign currencies. The sensitivity analysis includes the outstanding foreign currency denominated monetary items at year end together with the income and expense items during the year and adjusts their translation for a 10% change in foreign currency rates.
The positive number below indicates an increase in profi t where the United States Dollar strengthens by 10% against the relevant currency. For a 10% weakening of the United States Dollar against the relevant currency, there would be an equal and opposite impact on the profi t.
Group Company2011 2010 2011 2010
$ $ $ $
Australian Dollar profi t (loss) 103,442 243,855 17,697 (9,177)Egyptian Pound profi t (loss) 55,776 59,637 – – South African Rand profi t (loss) 141,385 90,693 – 17,345 Tanzanian Shillings profi t (loss) (213,093) (20,081) – – Zambian Kwacha profi t (loss) 130,510 4,221 – – All other currencies profi t (loss) 8,593 (97,813) (3,584) (63,778)
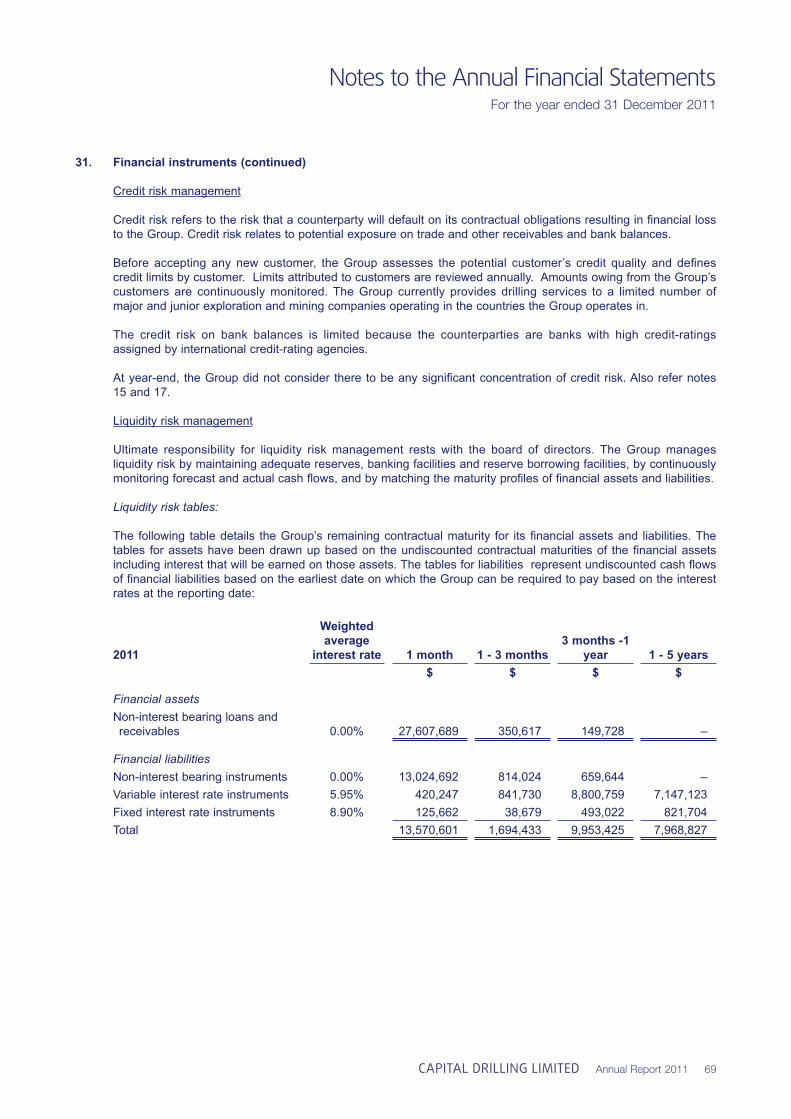
Notes to the Annual Financial StatementsFor the year ended 31 December 2011
CAPITAL DRILLING LIMITED Annual Report 2011 69
31. Financial instruments (continued) Credit risk management Credit risk refers to the risk that a counterparty will default on its contractual obligations resulting in fi nancial loss
to the Group. Credit risk relates to potential exposure on trade and other receivables and bank balances.
Before accepting any new customer, the Group assesses the potential customer’s credit quality and defi nes credit limits by customer. Limits attributed to customers are reviewed annually. Amounts owing from the Group’s customers are continuously monitored. The Group currently provides drilling services to a limited number of major and junior exploration and mining companies operating in the countries the Group operates in.
The credit risk on bank balances is limited because the counterparties are banks with high credit-ratings assigned by international credit-rating agencies.
At year-end, the Group did not consider there to be any signifi cant concentration of credit risk. Also refer notes 15 and 17.
Liquidity risk management Ultimate responsibility for liquidity risk management rests with the board of directors. The Group manages
liquidity risk by maintaining adequate reserves, banking facilities and reserve borrowing facilities, by continuously monitoring forecast and actual cash fl ows, and by matching the maturity profi les of fi nancial assets and liabilities.
Liquidity risk tables:
The following table details the Group’s remaining contractual maturity for its fi nancial assets and liabilities. The tables for assets have been drawn up based on the undiscounted contractual maturities of the fi nancial assets including interest that will be earned on those assets. The tables for liabilities represent undiscounted cash fl ows of fi nancial liabilities based on the earliest date on which the Group can be required to pay based on the interest rates at the reporting date:
2011
Weighted average
interest rate 1 month 1 - 3 months3 months -1
year 1 - 5 years$ $ $ $
Financial assetsNon-interest bearing loans and receivables 0.00% 27,607,689 350,617 149,728 –
Financial liabilitiesNon-interest bearing instruments 0.00% 13,024,692 814,024 659,644 – Variable interest rate instruments 5.95% 420,247 841,730 8,800,759 7,147,123 Fixed interest rate instruments 8.90% 125,662 38,679 493,022 821,704 Total 13,570,601 1,694,433 9,953,425 7,968,827
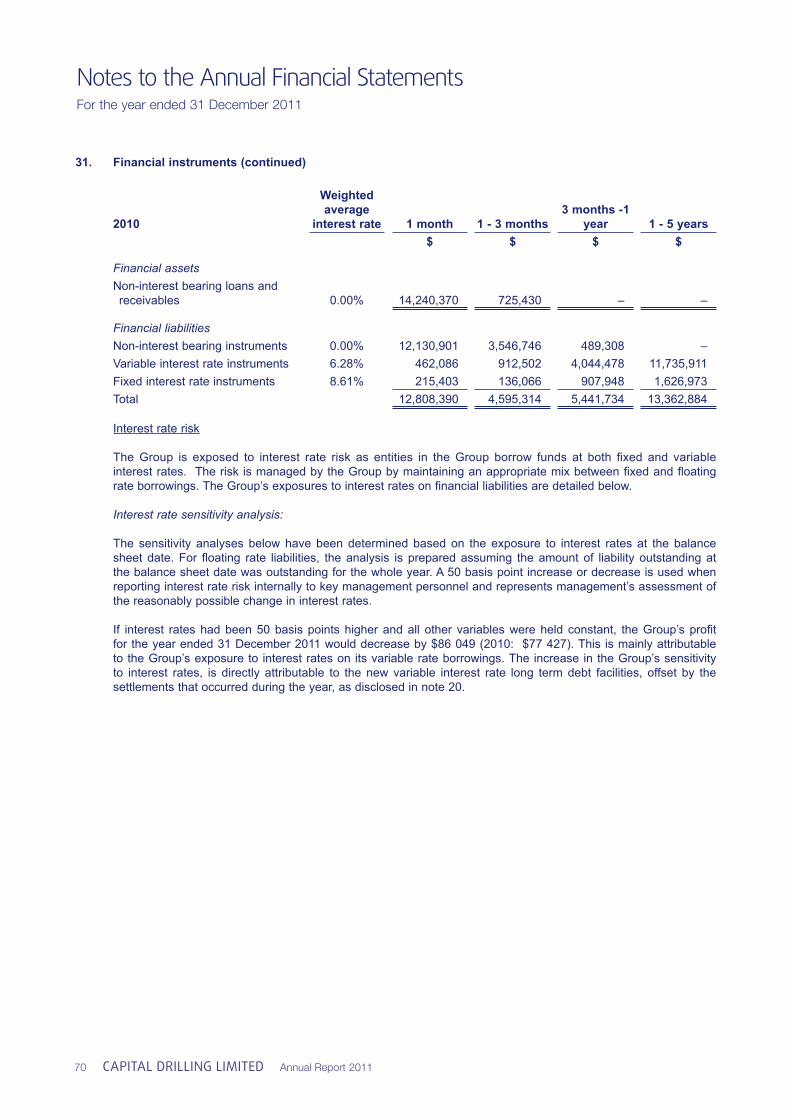
Notes to the Annual Financial StatementsFor the year ended 31 December 2011
70 CAPITAL DRILLING LIMITED Annual Report 2011
31. Financial instruments (continued)
2010
Weighted average
interest rate 1 month 1 - 3 months3 months -1
year 1 - 5 years$ $ $ $
Financial assetsNon-interest bearing loans and receivables 0.00% 14,240,370 725,430 – –
Financial liabilitiesNon-interest bearing instruments 0.00% 12,130,901 3,546,746 489,308 – Variable interest rate instruments 6.28% 462,086 912,502 4,044,478 11,735,911 Fixed interest rate instruments 8.61% 215,403 136,066 907,948 1,626,973 Total 12,808,390 4,595,314 5,441,734 13,362,884
Interest rate risk
The Group is exposed to interest rate risk as entities in the Group borrow funds at both fi xed and variable interest rates. The risk is managed by the Group by maintaining an appropriate mix between fi xed and fl oating rate borrowings. The Group’s exposures to interest rates on fi nancial liabilities are detailed below.
Interest rate sensitivity analysis:
The sensitivity analyses below have been determined based on the exposure to interest rates at the balance sheet date. For fl oating rate liabilities, the analysis is prepared assuming the amount of liability outstanding at the balance sheet date was outstanding for the whole year. A 50 basis point increase or decrease is used when reporting interest rate risk internally to key management personnel and represents management’s assessment of the reasonably possible change in interest rates.
If interest rates had been 50 basis points higher and all other variables were held constant, the Group’s profi t for the year ended 31 December 2011 would decrease by $86 049 (2010: $77 427). This is mainly attributable to the Group’s exposure to interest rates on its variable rate borrowings. The increase in the Group’s sensitivity to interest rates, is directly attributable to the new variable interest rate long term debt facilities, offset by the settlements that occurred during the year, as disclosed in note 20.
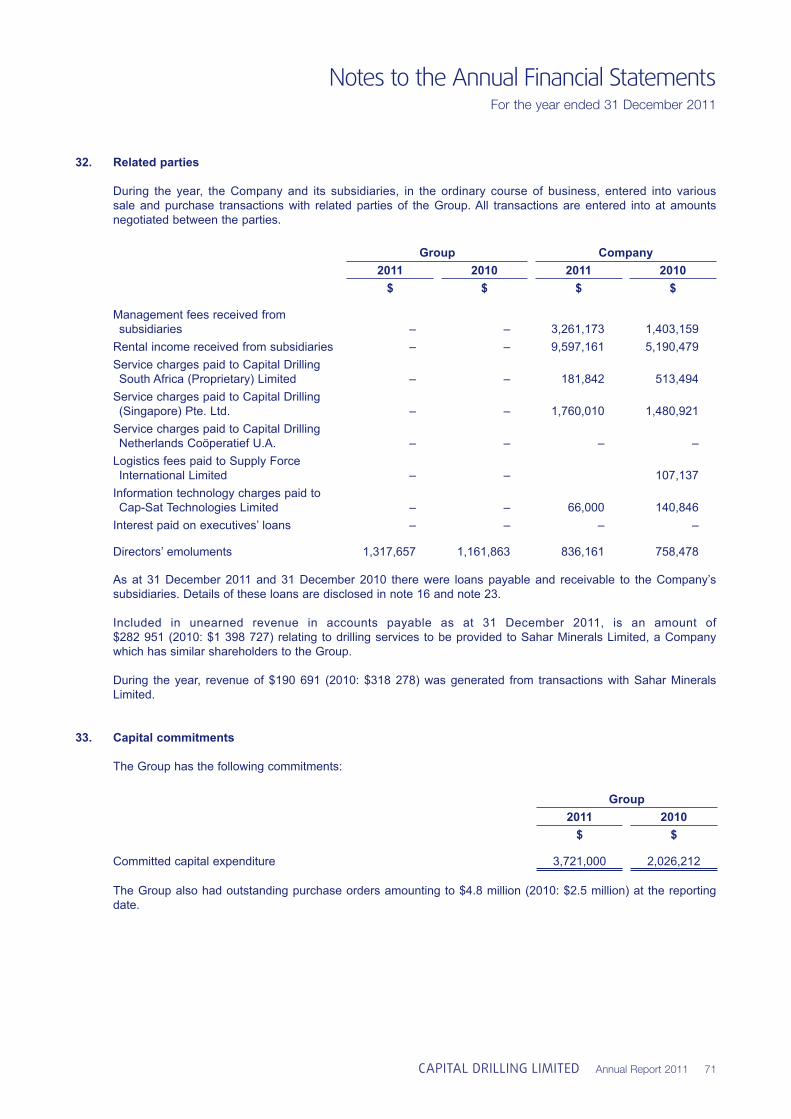
Notes to the Annual Financial StatementsFor the year ended 31 December 2011
CAPITAL DRILLING LIMITED Annual Report 2011 71
32. Related parties
During the year, the Company and its subsidiaries, in the ordinary course of business, entered into various sale and purchase transactions with related parties of the Group. All transactions are entered into at amounts negotiated between the parties.
Group Company2011 2010 2011 2010
$ $ $ $
Management fees received from subsidiaries – – 3,261,173 1,403,159 Rental income received from subsidiaries – – 9,597,161 5,190,479 Service charges paid to Capital Drilling South Africa (Proprietary) Limited – – 181,842 513,494 Service charges paid to Capital Drilling (Singapore) Pte. Ltd. – – 1,760,010 1,480,921 Service charges paid to Capital Drilling Netherlands Coöperatief U.A. – – – – Logistics fees paid to Supply Force International Limited – – 107,137 Information technology charges paid to Cap-Sat Technologies Limited – – 66,000 140,846 Interest paid on executives’ loans – – – –
Directors’ emoluments 1,317,657 1,161,863 836,161 758,478
As at 31 December 2011 and 31 December 2010 there were loans payable and receivable to the Company’s subsidiaries. Details of these loans are disclosed in note 16 and note 23.
Included in unearned revenue in accounts payable as at 31 December 2011, is an amount of $282 951 (2010: $1 398 727) relating to drilling services to be provided to Sahar Minerals Limited, a Company which has similar shareholders to the Group.
During the year, revenue of $190 691 (2010: $318 278) was generated from transactions with Sahar Minerals
Limited.
33. Capital commitments The Group has the following commitments:
Group2011 2010
$ $
Committed capital expenditure 3,721,000 2,026,212
The Group also had outstanding purchase orders amounting to $4.8 million (2010: $2.5 million) at the reporting date.
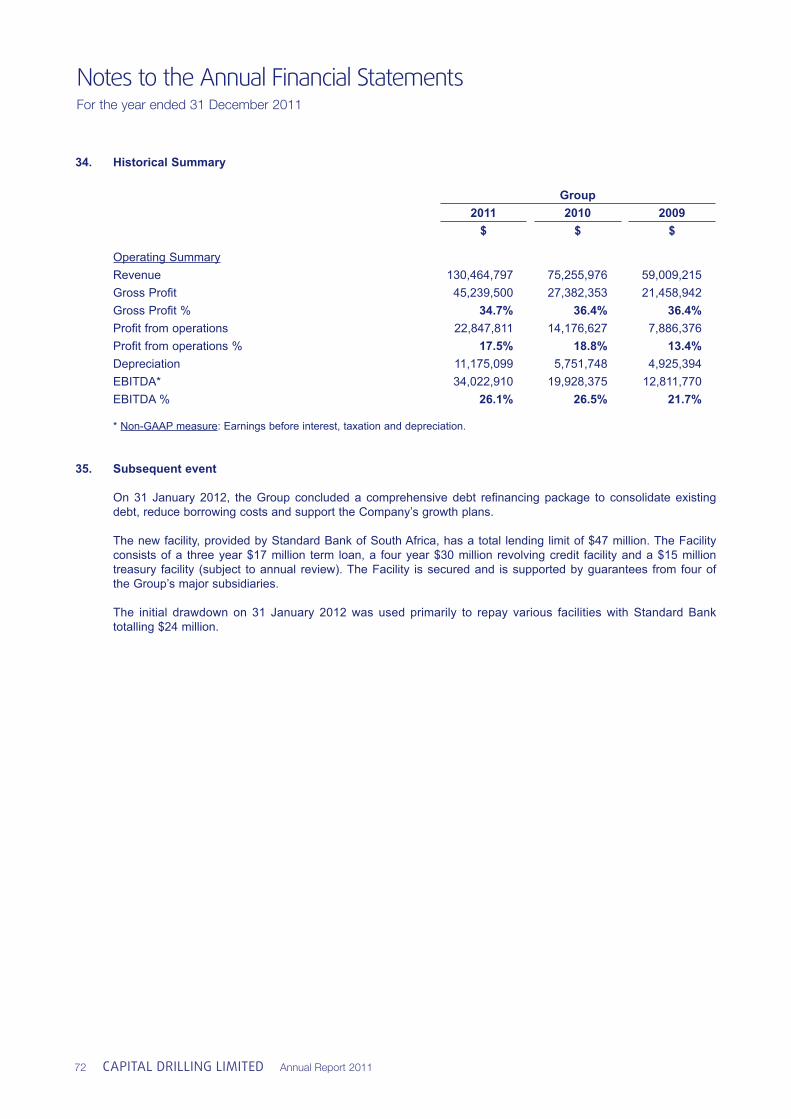
Notes to the Annual Financial StatementsFor the year ended 31 December 2011
72 CAPITAL DRILLING LIMITED Annual Report 2011
34. Historical Summary
Group2011 2010 2009
$ $ $
Operating SummaryRevenue 130,464,797 75,255,976 59,009,215 Gross Profi t 45,239,500 27,382,353 21,458,942 Gross Profi t % 34.7% 36.4% 36.4%Profi t from operations 22,847,811 14,176,627 7,886,376 Profi t from operations % 17.5% 18.8% 13.4%Depreciation 11,175,099 5,751,748 4,925,394 EBITDA* 34,022,910 19,928,375 12,811,770 EBITDA % 26.1% 26.5% 21.7%
* Non-GAAP measure: Earnings before interest, taxation and depreciation.
35. Subsequent event
On 31 January 2012, the Group concluded a comprehensive debt refi nancing package to consolidate existing debt, reduce borrowing costs and support the Company’s growth plans.
The new facility, provided by Standard Bank of South Africa, has a total lending limit of $47 million. The Facility consists of a three year $17 million term loan, a four year $30 million revolving credit facility and a $15 million treasury facility (subject to annual review). The Facility is secured and is supported by guarantees from four of the Group’s major subsidiaries.
The initial drawdown on 31 January 2012 was used primarily to repay various facilities with Standard Bank totalling $24 million.

TEL:63
2783
98
Capital Drilling limiteDCanon’s Court
22 Victoria Street
Hamiliton, HM12
Bermuda