מצגת של powerpointiclgroupv2.s3.amazonaws.com/corporate/wp-content/... · important legal...
TRANSCRIPT
INVESTOR PRESENTATION
IMPORTANT LEGAL NOTES
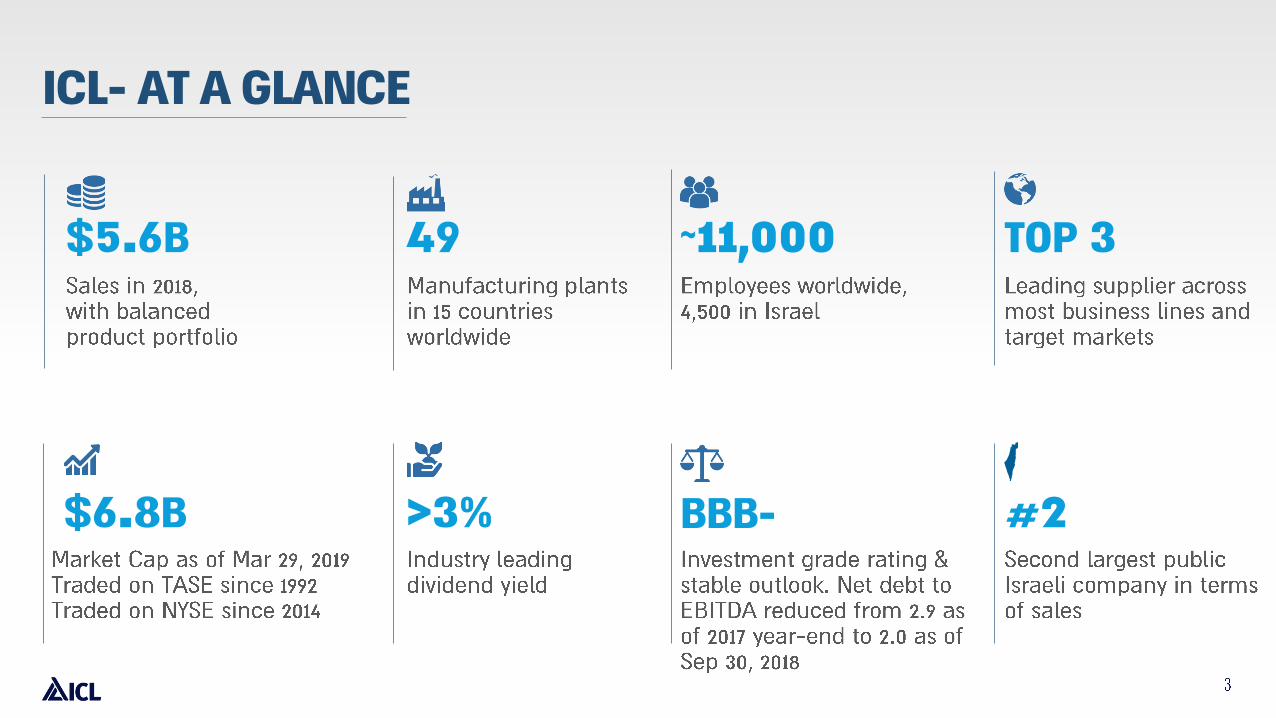
49$5.6B
$6.8B #2
TOP 3~11,000
ICL- AT A GLANCE
<3% BBB-

ICL- 90 YEARS OF HISTORY
Focusing on innovation and
solidifying leadership
2000s -
Establishing & growing operations
in Israel
1920s - 1970s
Consolidating & expanding
globally
1970s - 2014
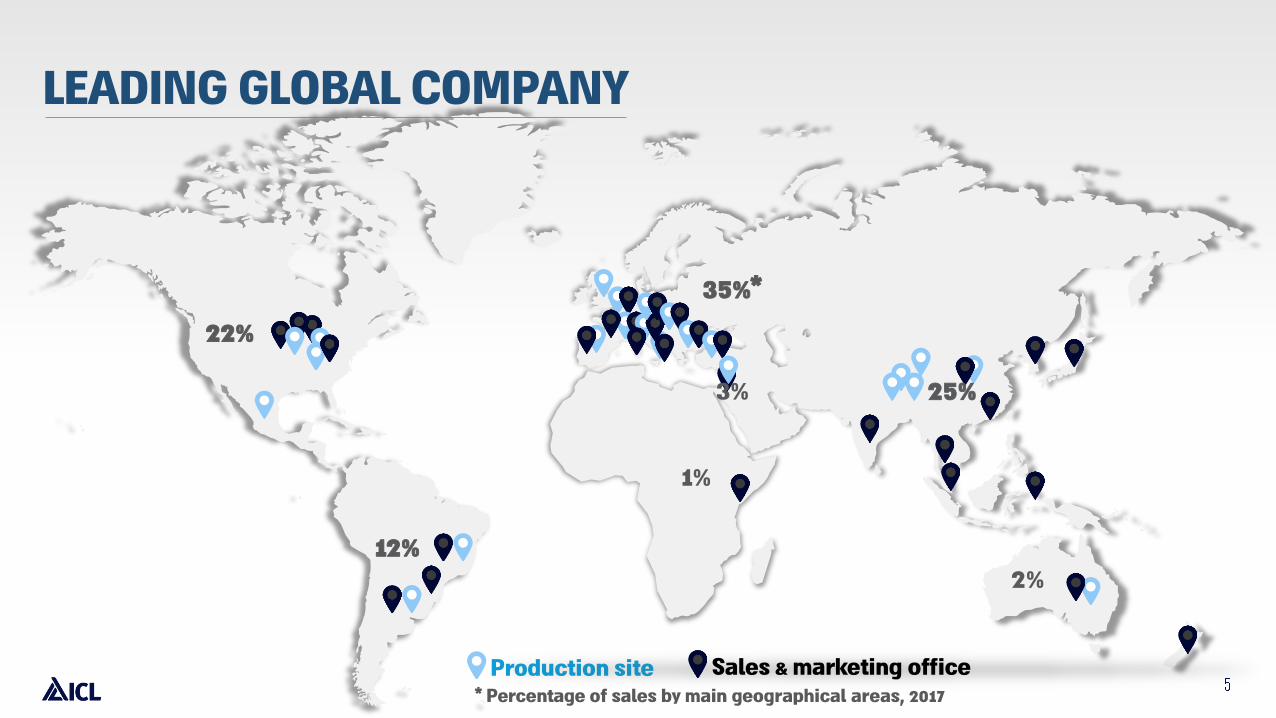
Production site Sales & marketing office
35%*
1%
22%
12%
* Percentage of sales by main geographical areas, 2017
LEADING GLOBAL COMPANY
2%
3% 25%
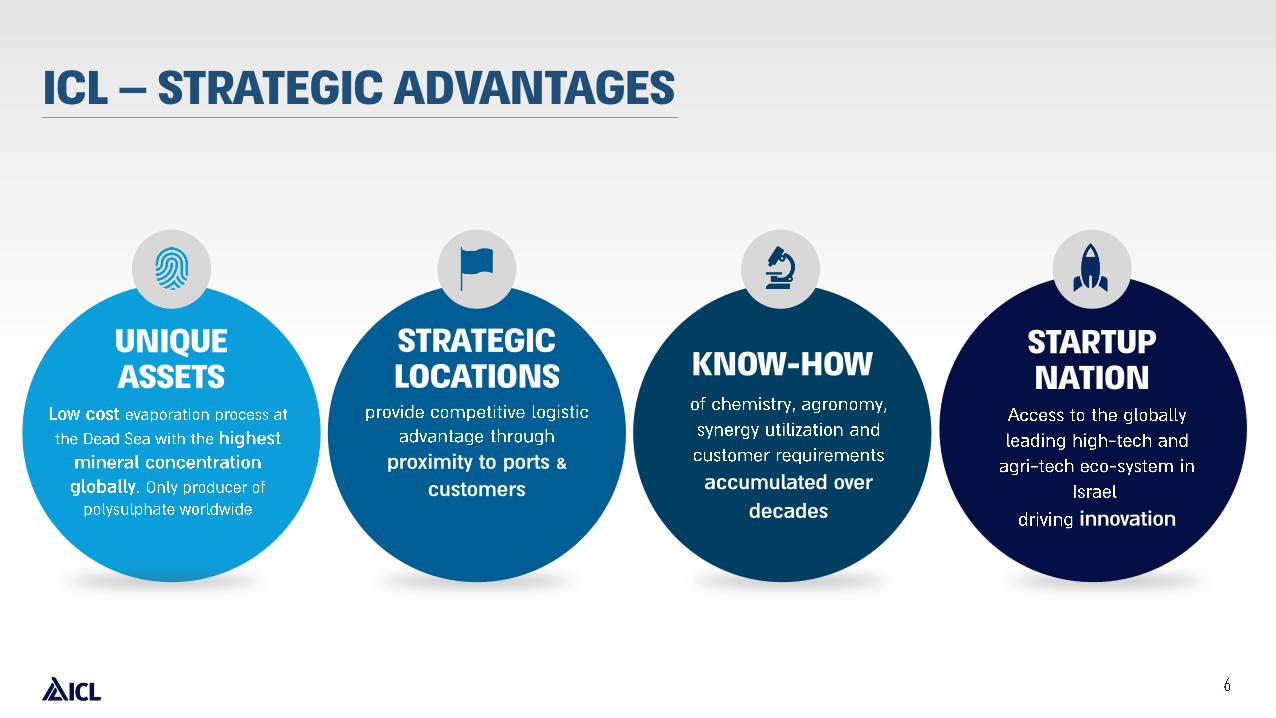
proximity to ports &
customers
STRATEGIC
LOCATIONS
innovation
STARTUP
NATION
accumulated over
decades
KNOW-HOWUNIQUE
ASSETS
ICL – STRATEGIC ADVANTAGES
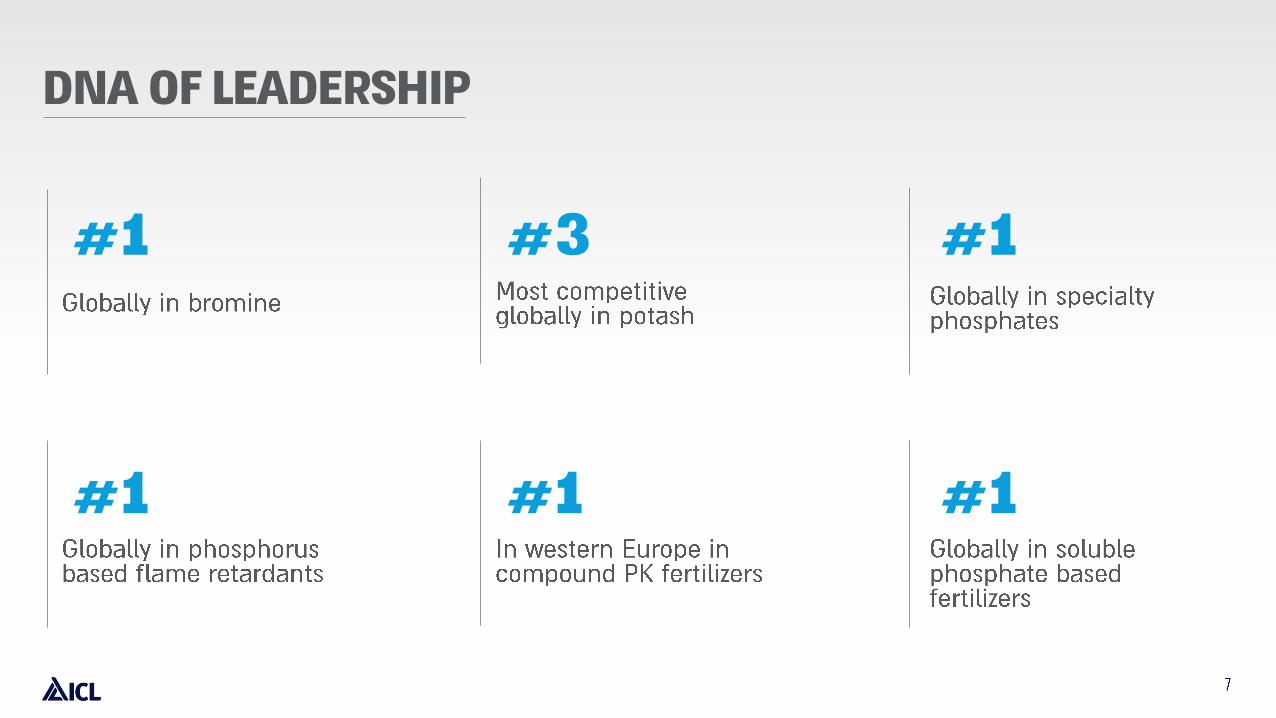
#1
#1
#1
#1
#1
#3
DNA OF LEADERSHIP
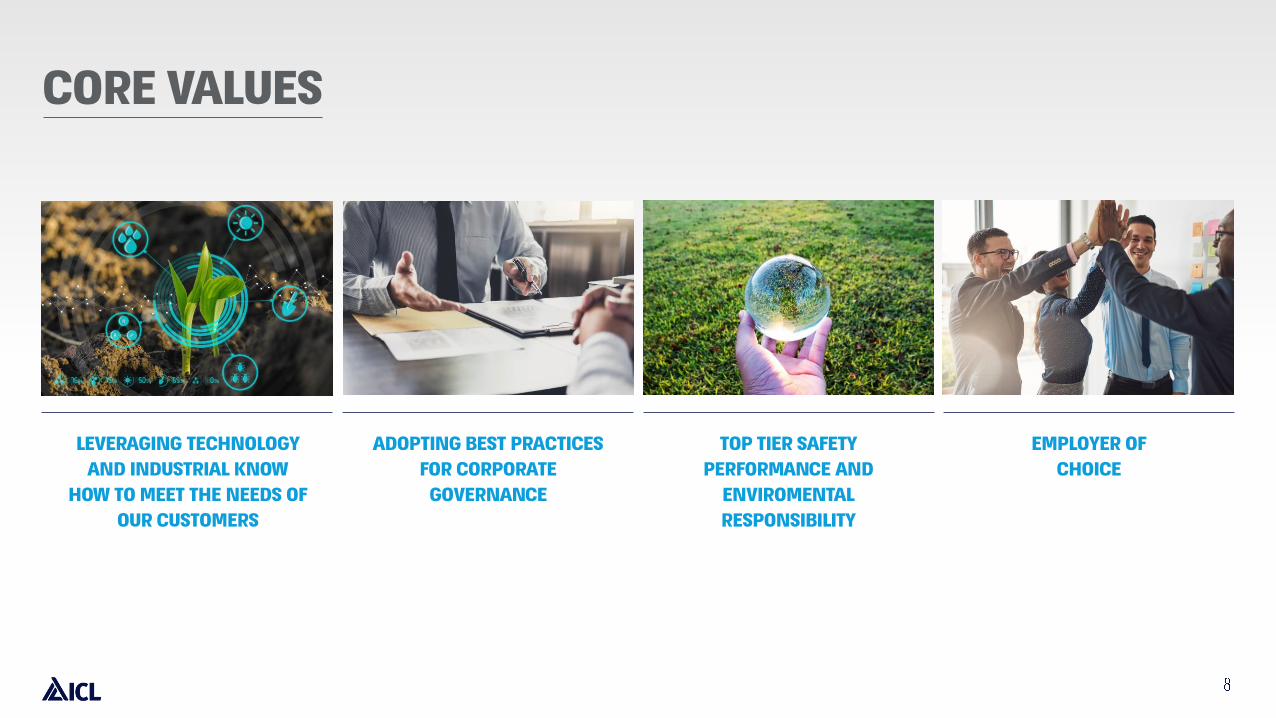
CORE VALUES
TOP TIER SAFETY
PERFORMANCE AND
ENVIROMENTAL
RESPONSIBILITY
EMPLOYER OF
CHOICE
LEVERAGING TECHNOLOGY
AND INDUSTRIAL KNOW
HOW TO MEET THE NEEDS OF
OUR CUSTOMERS
ADOPTING BEST PRACTICES
FOR CORPORATE
GOVERNANCE
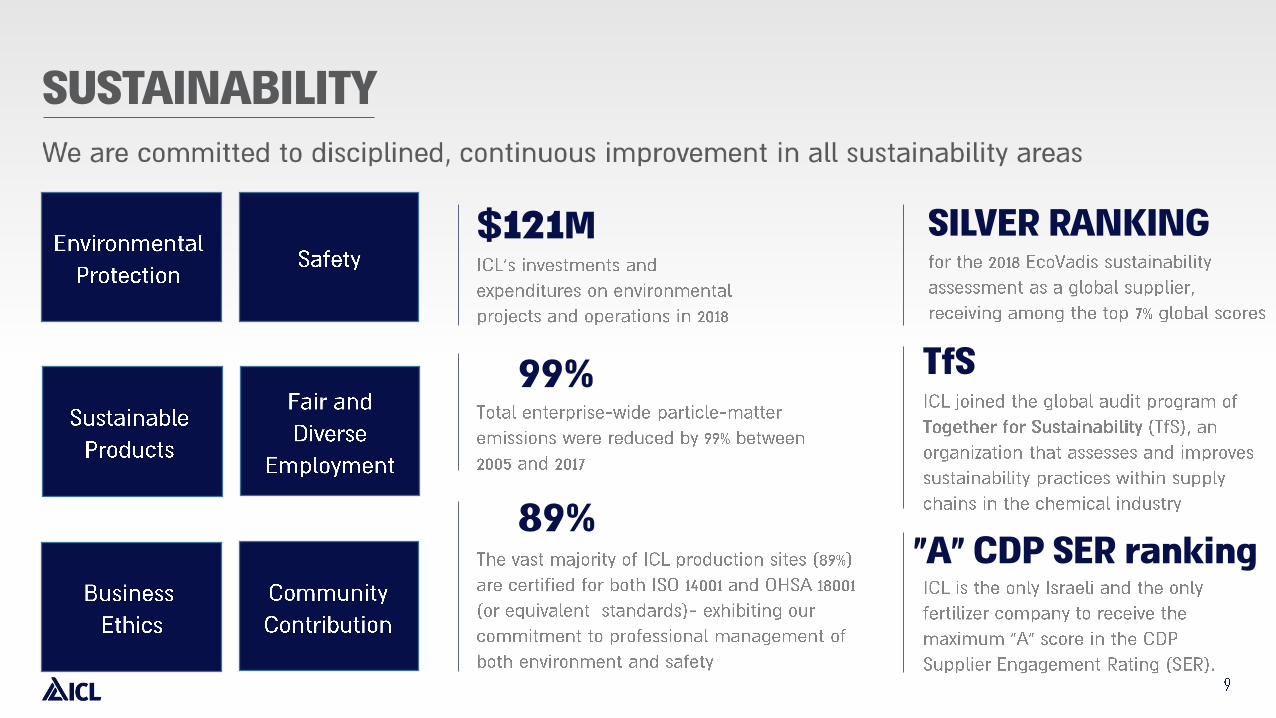
SUSTAINABILITY
99%
$121M
89%
SILVER RANKING
TfS
“A” CDP SER ranking

PRESENT
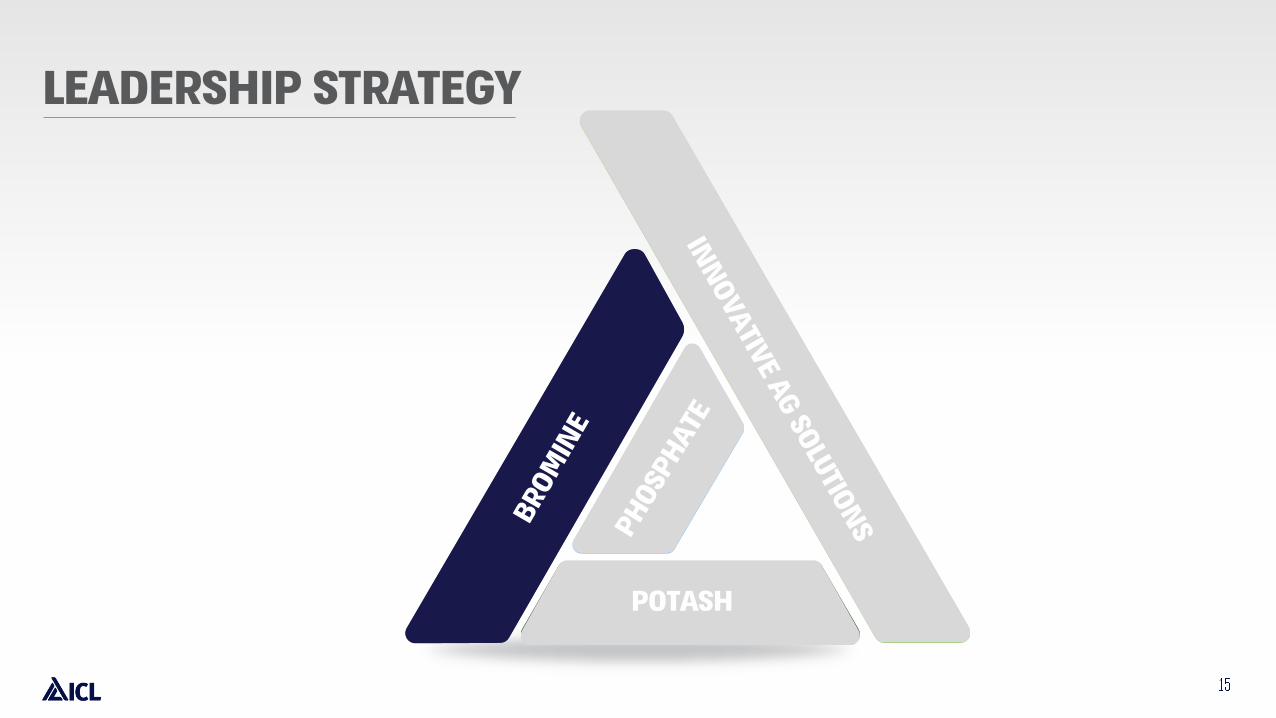
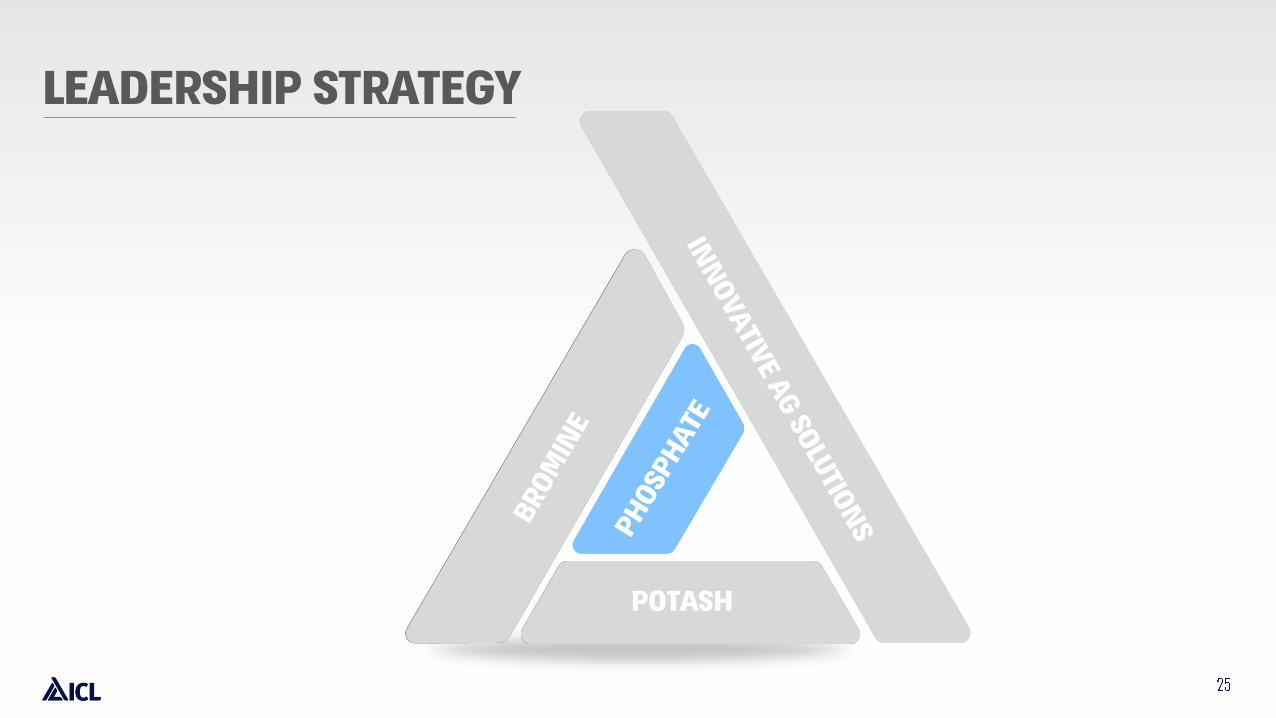
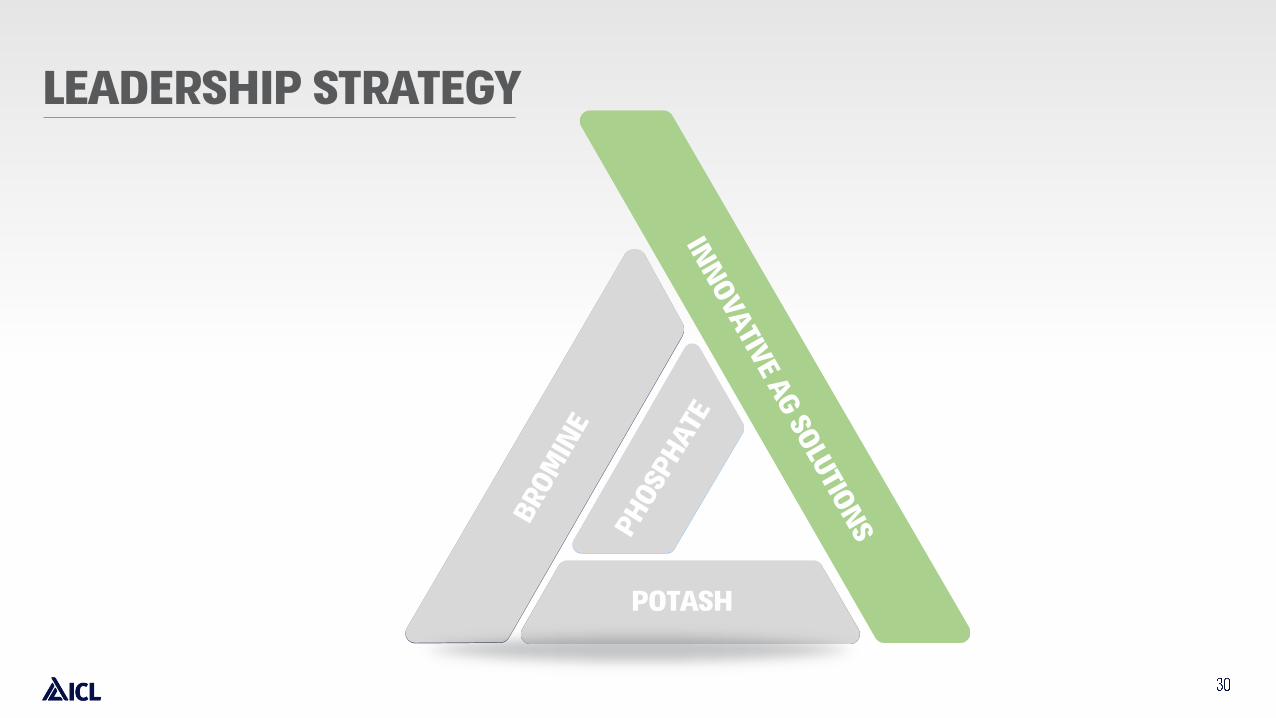
LEADERSHIP STRATEGY
POTASH
IAS
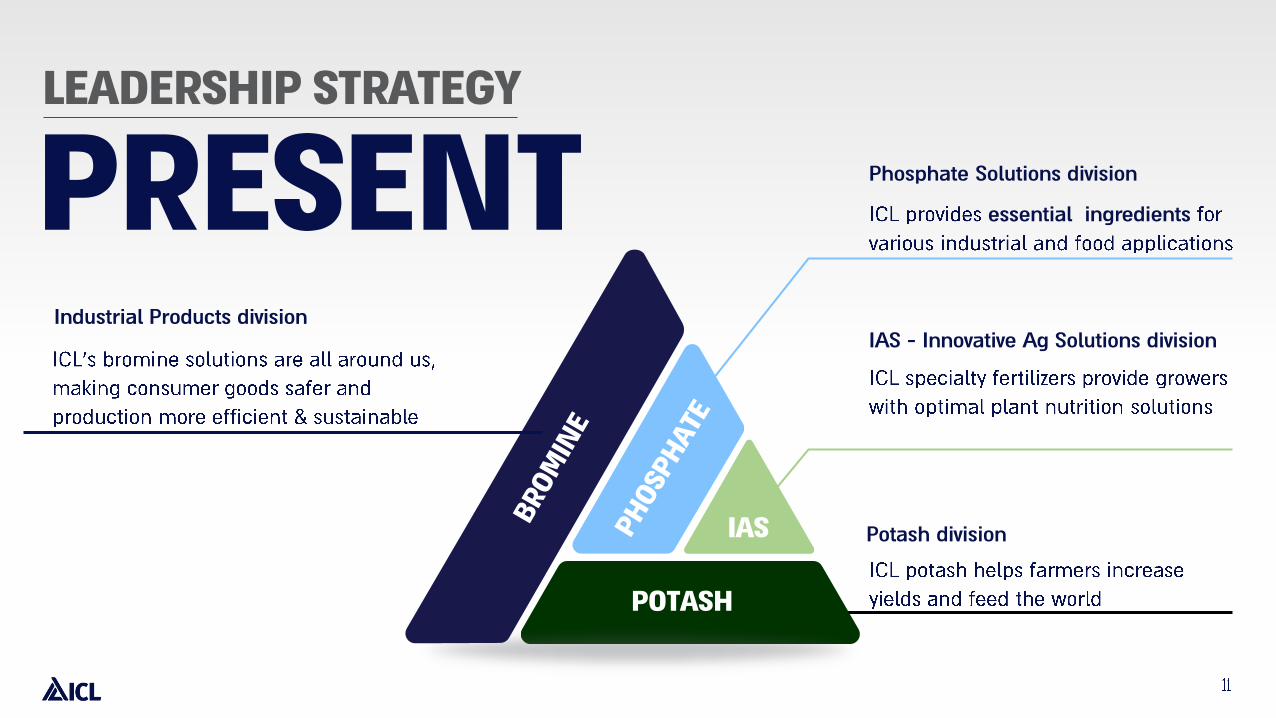
essential ingredients
LEADERSHIP STRATEGY
PRESENTPhosphate Solutions division
Potash division
Industrial Products division
IAS - Innovative Ag Solutions division
POTASH
IAS
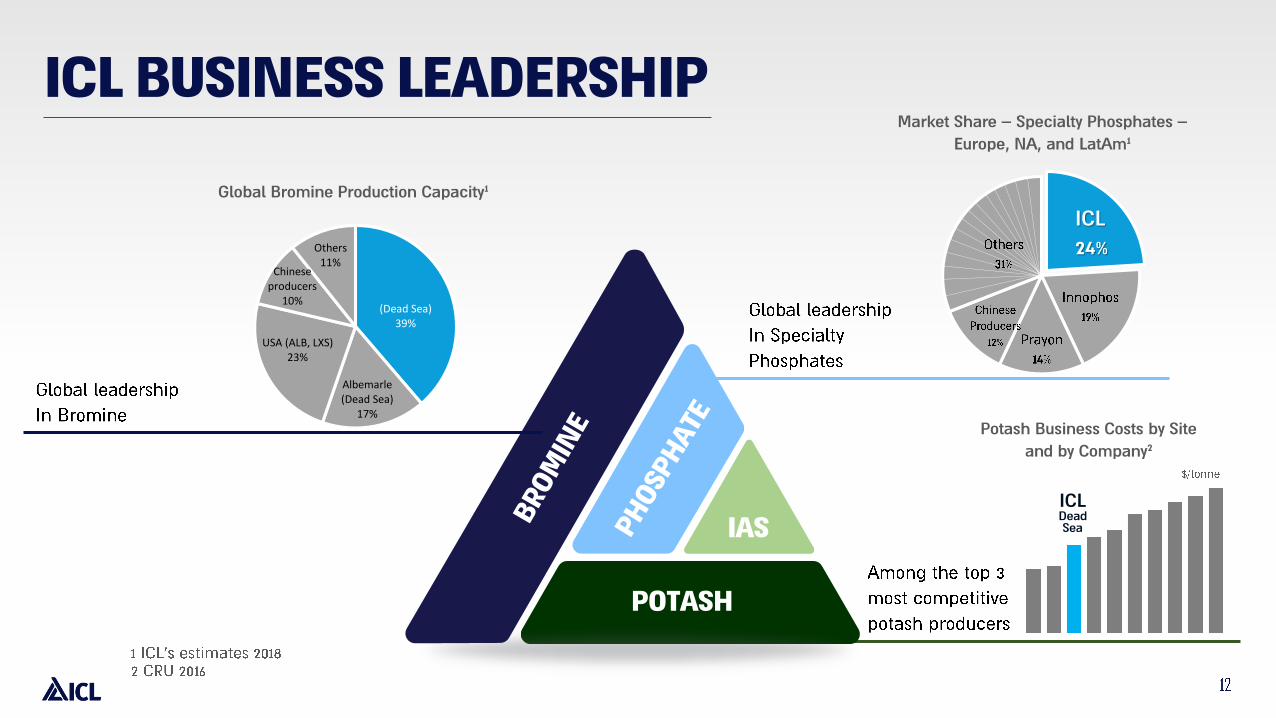
ICL BUSINESS LEADERSHIP
Potash Business Costs by Site
and by Company2
ICL
24%
ICLDead
Sea
Market Share – Specialty Phosphates –
Europe, NA, and LatAm1
ICL
POTASH
IAS
(Dead Sea)39%
Albemarle (Dead Sea)
17%
USA (ALB, LXS)23%
Chinese producers
10%
Others11%
Global Bromine Production Capacity1
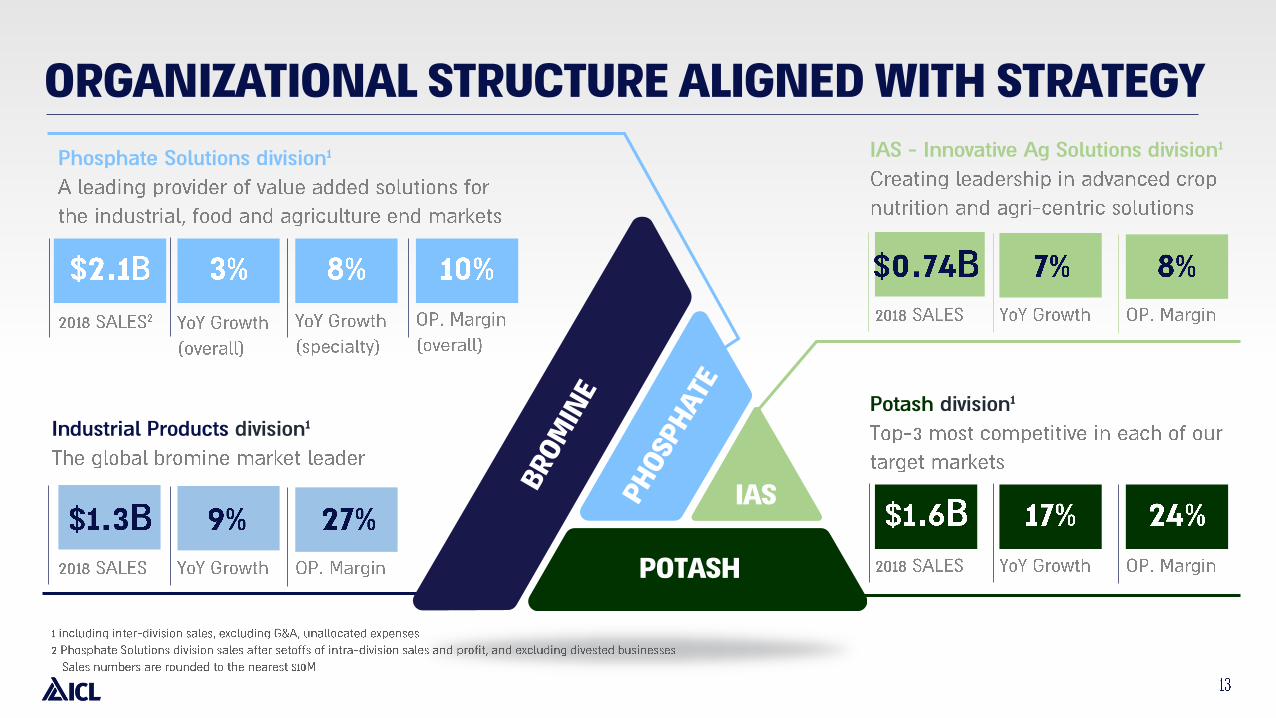
ORGANIZATIONAL STRUCTURE ALIGNED WITH STRATEGY
Phosphate Solutions division1
Potash division1
Industrial Products division1
IAS - Innovative Ag Solutions division1
POTASH
IAS
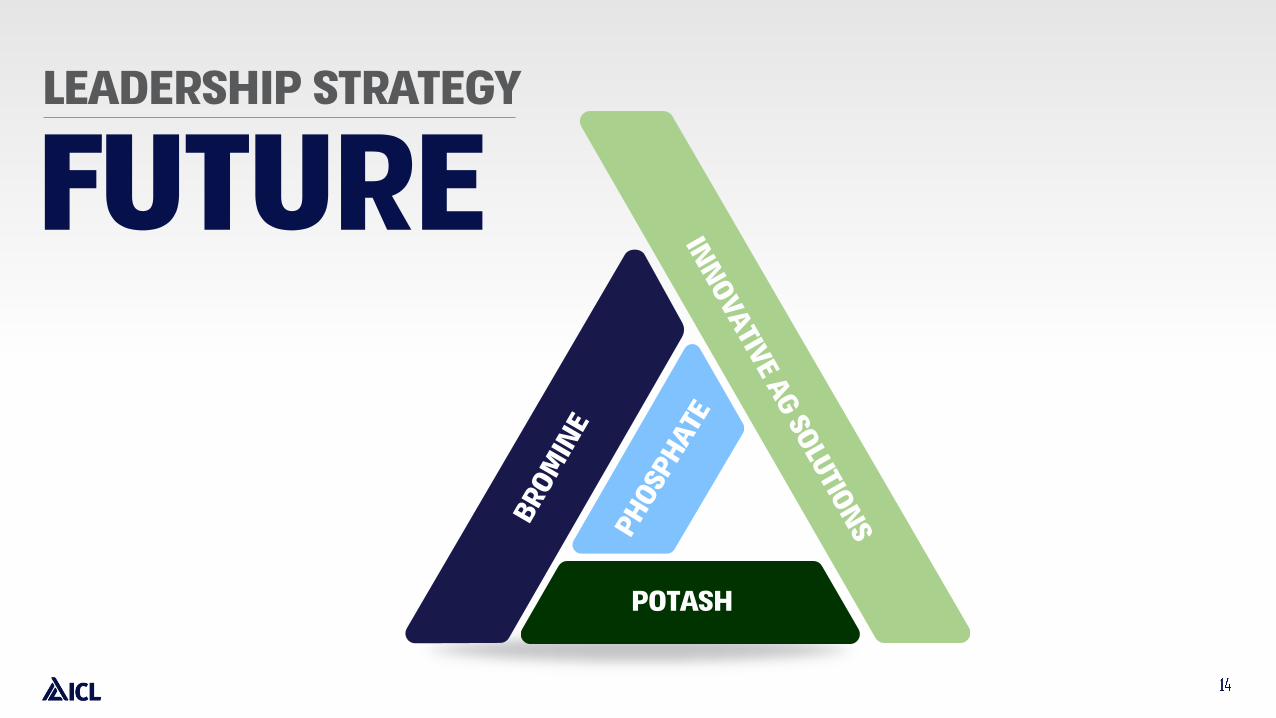
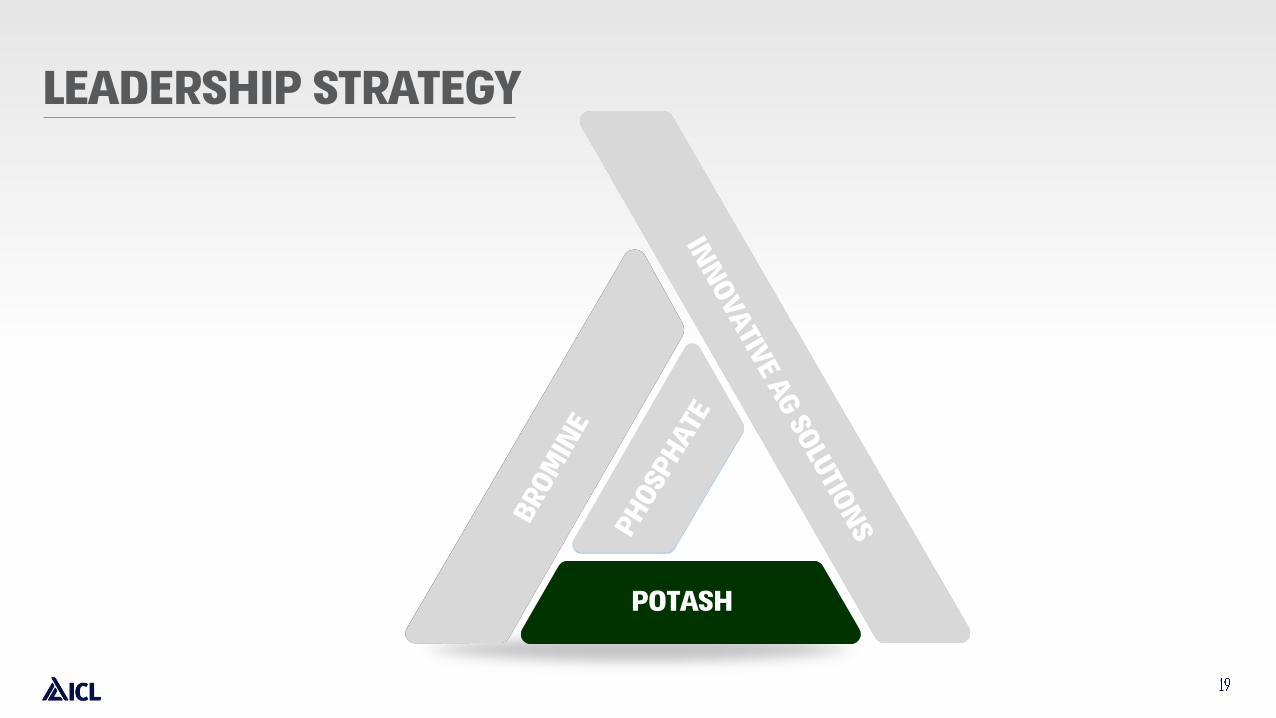
LEADERSHIP STRATEGY
FUTURE
POTASH
LEADERSHIP STRATEGY
POTASH
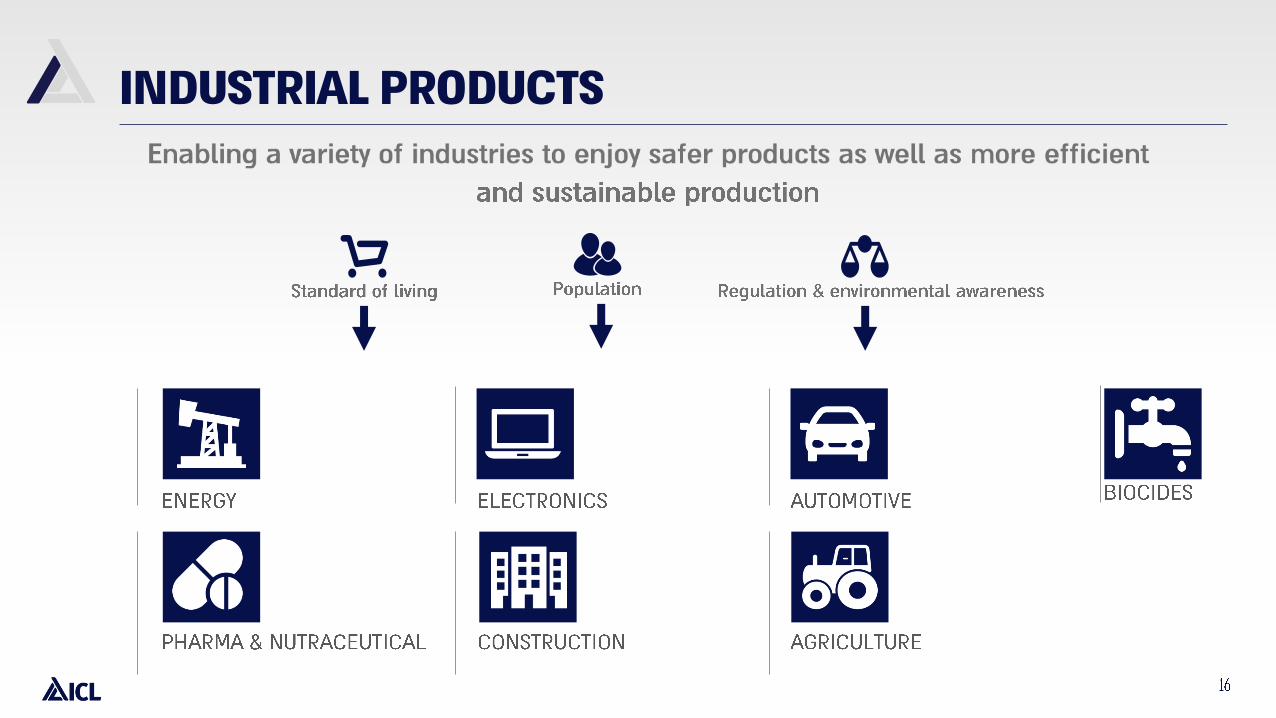
INDUSTRIAL PRODUCTS

THE GLOBAL BROMINE
MARKET LEADER
175K TONNES
NO.1
SOLID LEADERSHIP
240K TONNES
NO.1
BROMINE PRICES
IN CHINA
INDUSTRIAL PRODUCTS
UNIQUE
ADVANTAGE
2,600
3,100
3,600
4,100
4,600
5,100
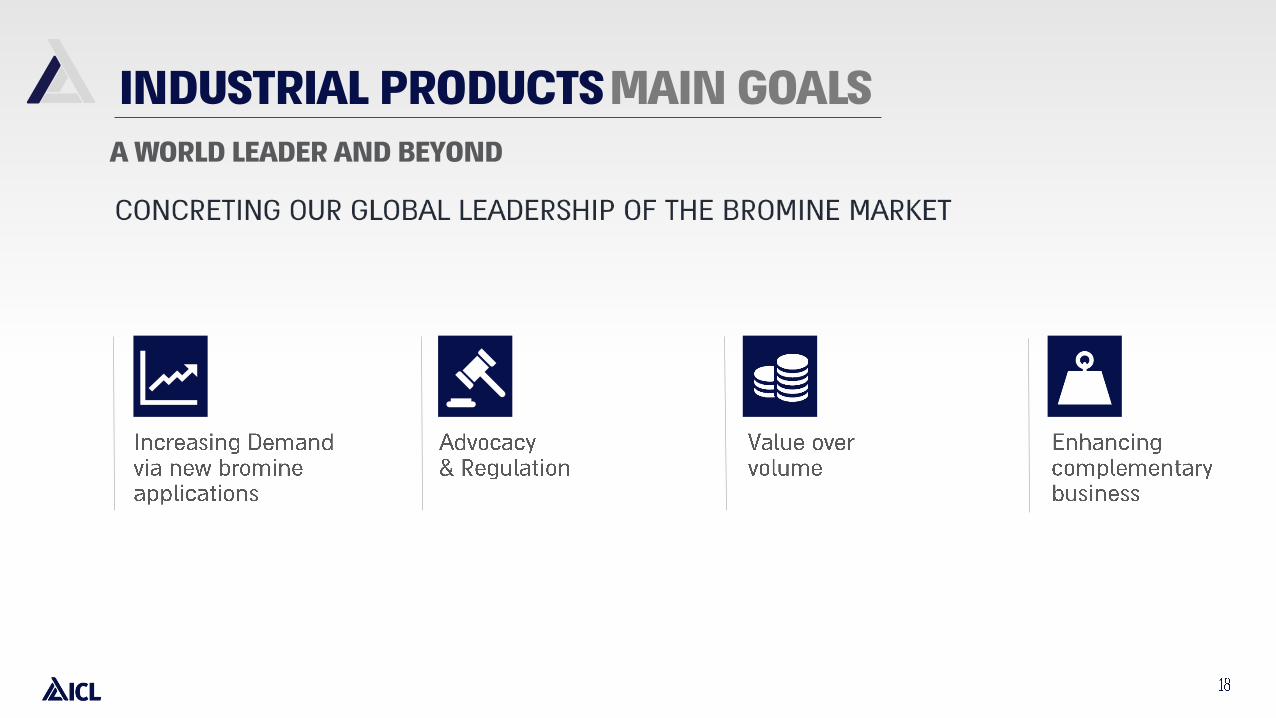
MAIN GOALS
A WORLD LEADER AND BEYOND
INDUSTRIAL PRODUCTS
LEADERSHIP STRATEGY
POTASH
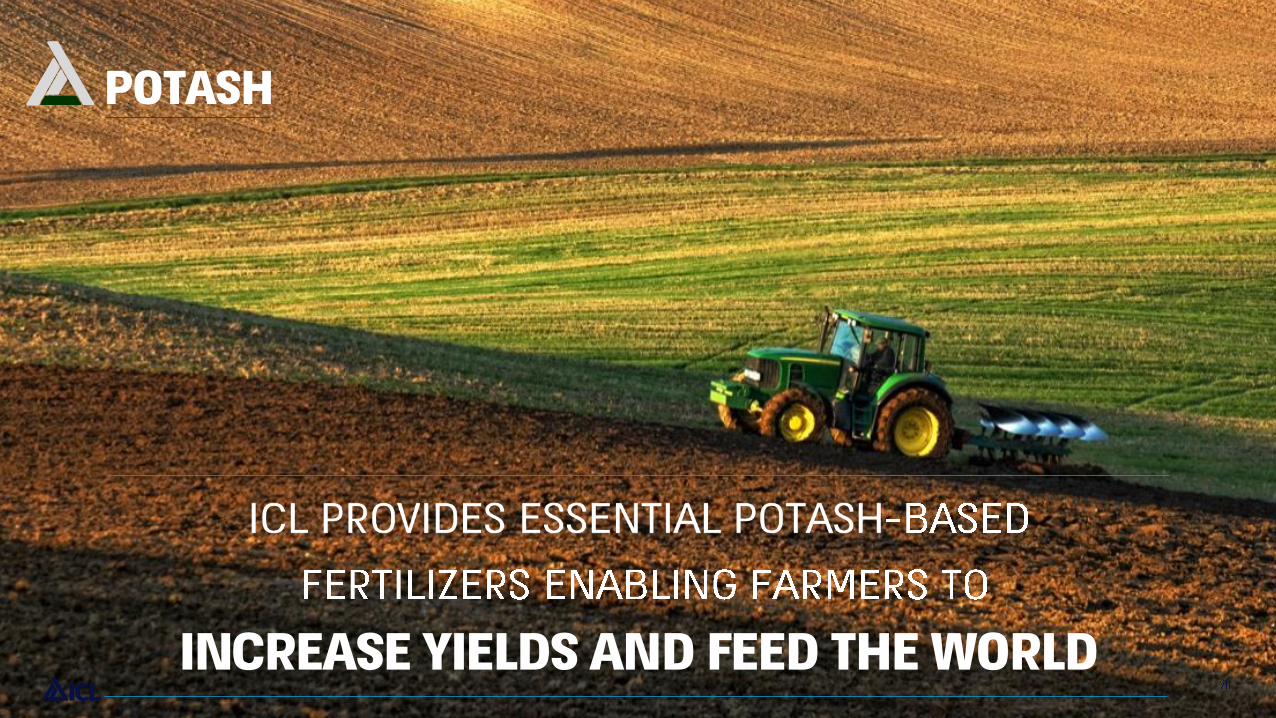
INCREASE YIELDS AND FEED THE WORLD
POTASH
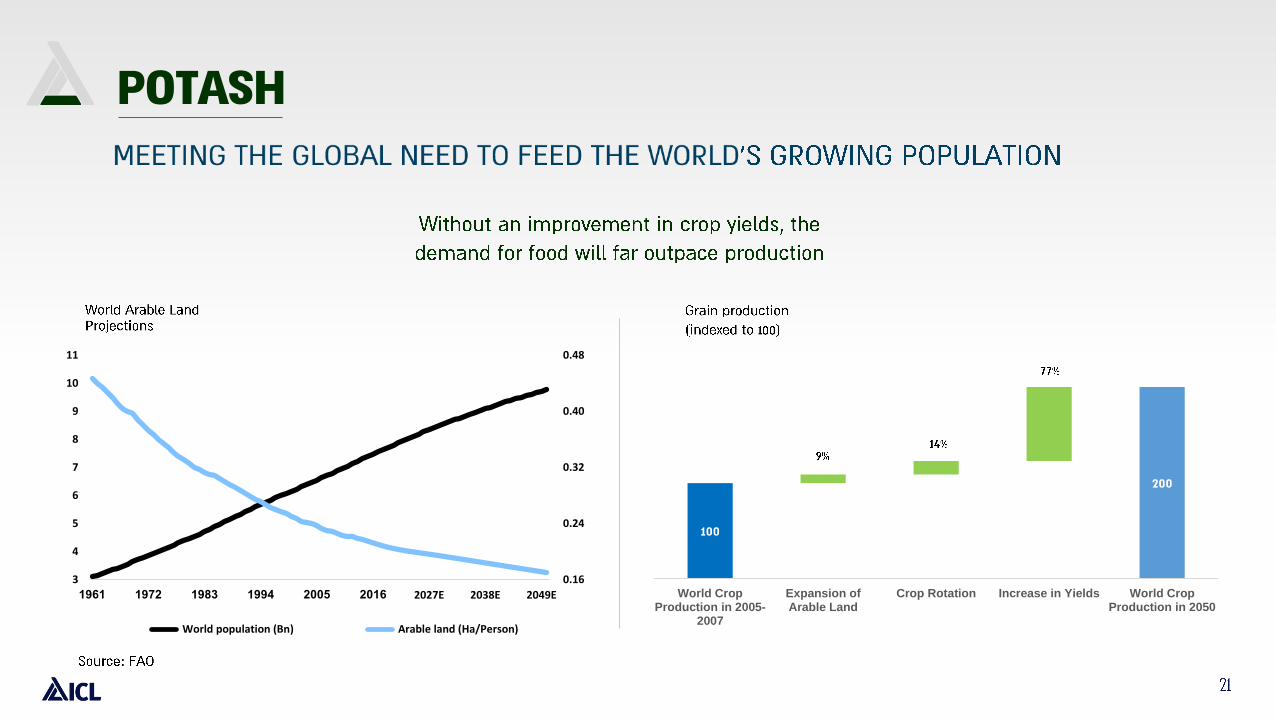
100
200
World CropProduction in 2005-
2007
Expansion ofArable Land
Crop Rotation Increase in Yields World CropProduction in 2050
POTASH
0.16
0.24
0.32
0.40
0.48
3
4
5
6
7
8
9
10
11
1961 1972 1983 1994 2005 2016 2027E 2038E 2049E
World population (Bn) Arable land (Ha/Person)
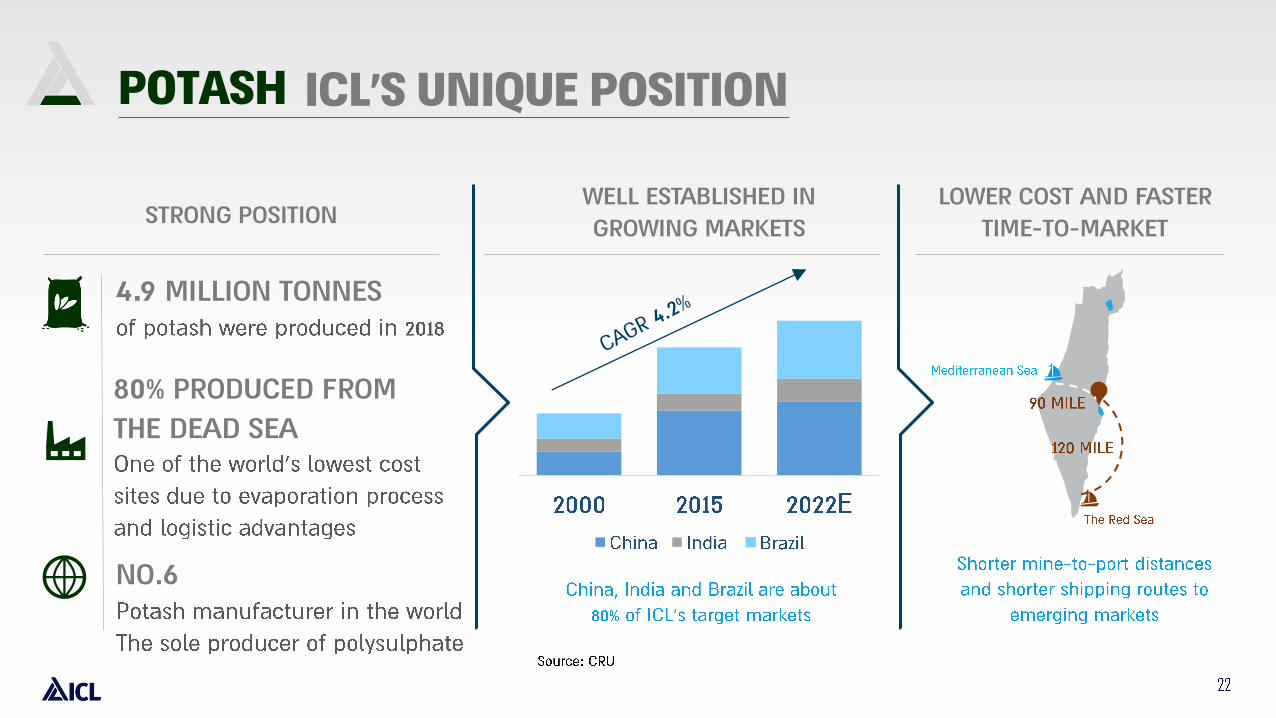
ICL’S UNIQUE POSITION
4.9 MILLION TONNES
STRONG POSITION
POTASH
80% PRODUCED FROM
THE DEAD SEA
WELL ESTABLISHED IN
GROWING MARKETS
LOWER COST AND FASTER
TIME-TO-MARKET
NO.6
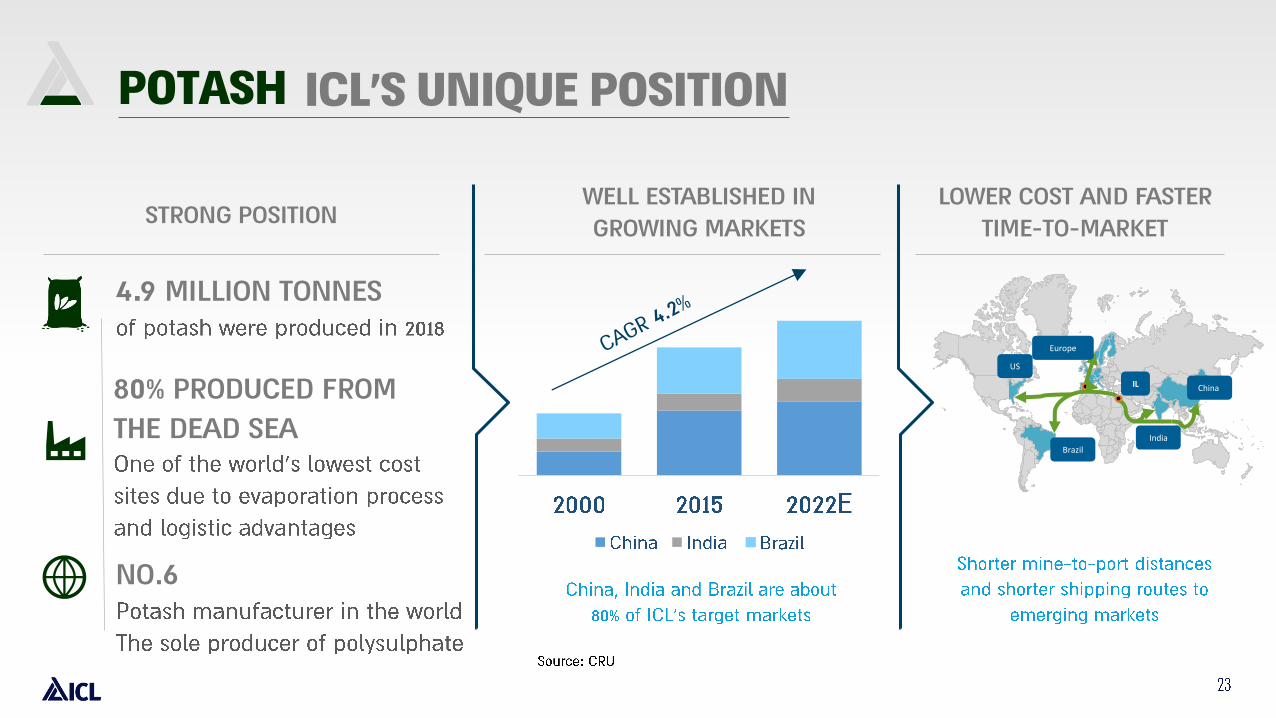
ICL’S UNIQUE POSITION
4.9 MILLION TONNES
STRONG POSITION
POTASH
LOWER COST AND FASTER
TIME-TO-MARKET
China
India
IL
Europe
Brazil
US
WELL ESTABLISHED IN
GROWING MARKETS
80% PRODUCED FROM
THE DEAD SEA
NO.6

POTASH OUR GOALS
TOP-3 5MT
10% 1M
LEADERSHIP STRATEGY
POTASH
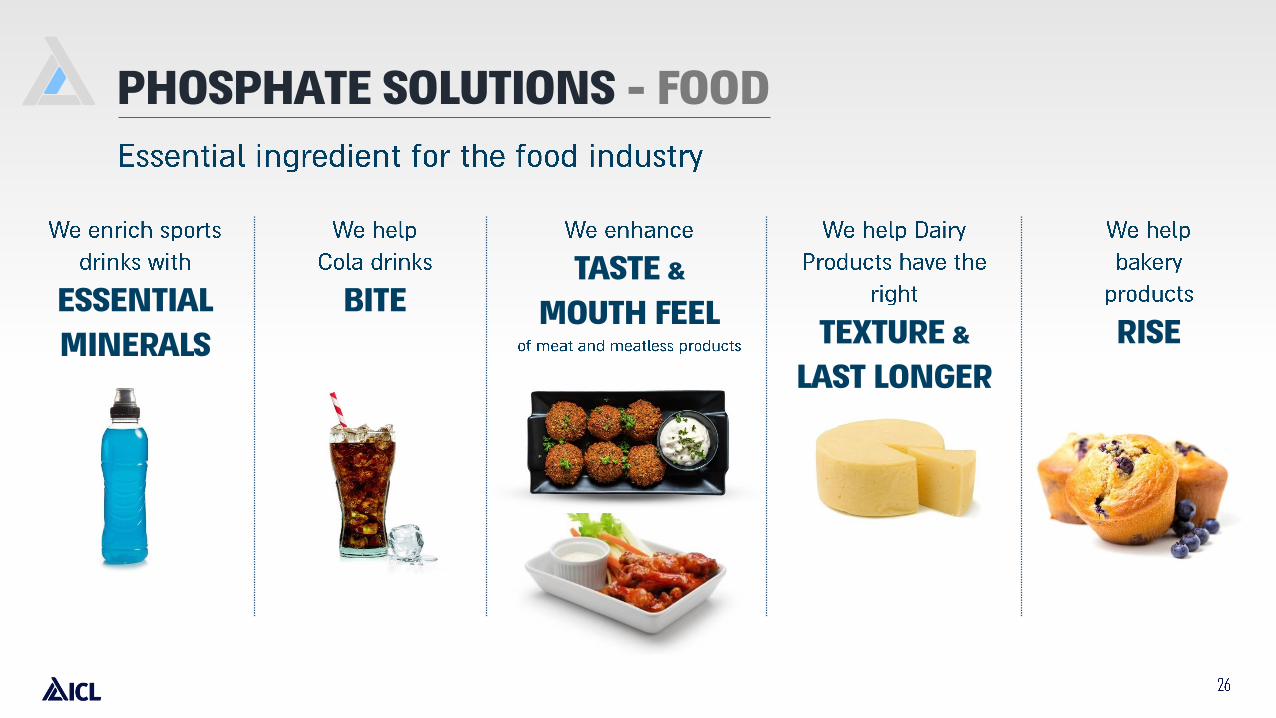
PHOSPHATE SOLUTIONS - FOOD
ESSENTIAL
MINERALS
BITE
TASTE &
MOUTH FEELTEXTURE &
LAST LONGER
RISE
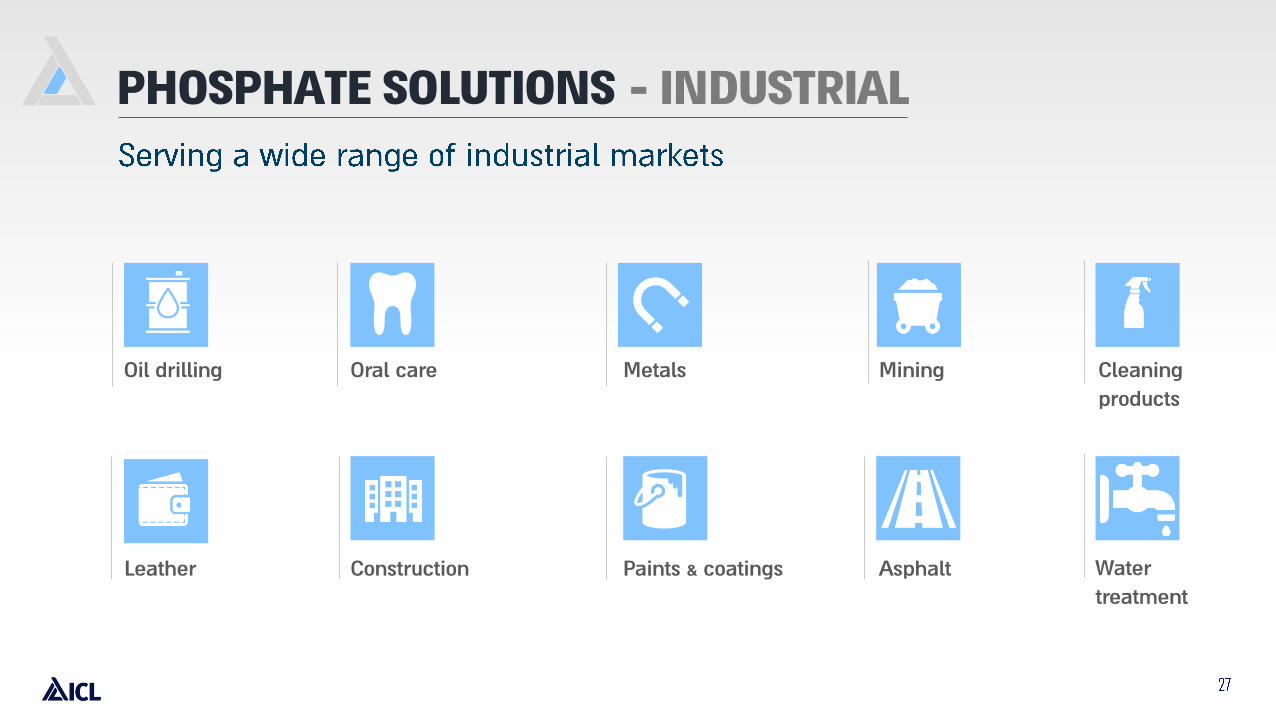
Oil drilling MiningOral care Cleaning
products
Metals
Leather Construction AsphaltPaints & coatings
- INDUSTRIALPHOSPHATE SOLUTIONS
Water
treatment
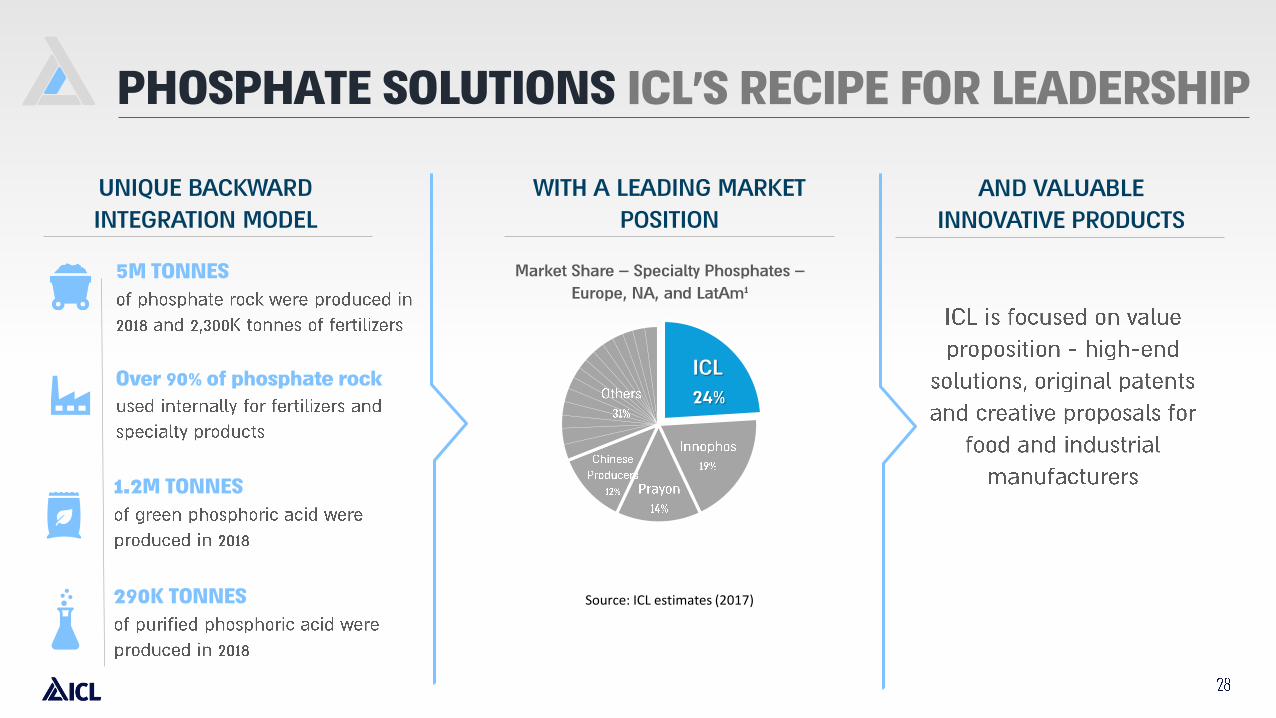
UNIQUE BACKWARD
INTEGRATION MODEL
5M TONNES
Over 90% of phosphate rock
AND VALUABLE
INNOVATIVE PRODUCTS
ICL’S RECIPE FOR LEADERSHIPPHOSPHATE SOLUTIONS
1.2M TONNES
290K TONNES
ICL
24%
WITH A LEADING MARKET
POSITION
Source: ICL estimates (2017)
Market Share – Specialty Phosphates –
Europe, NA, and LatAm1
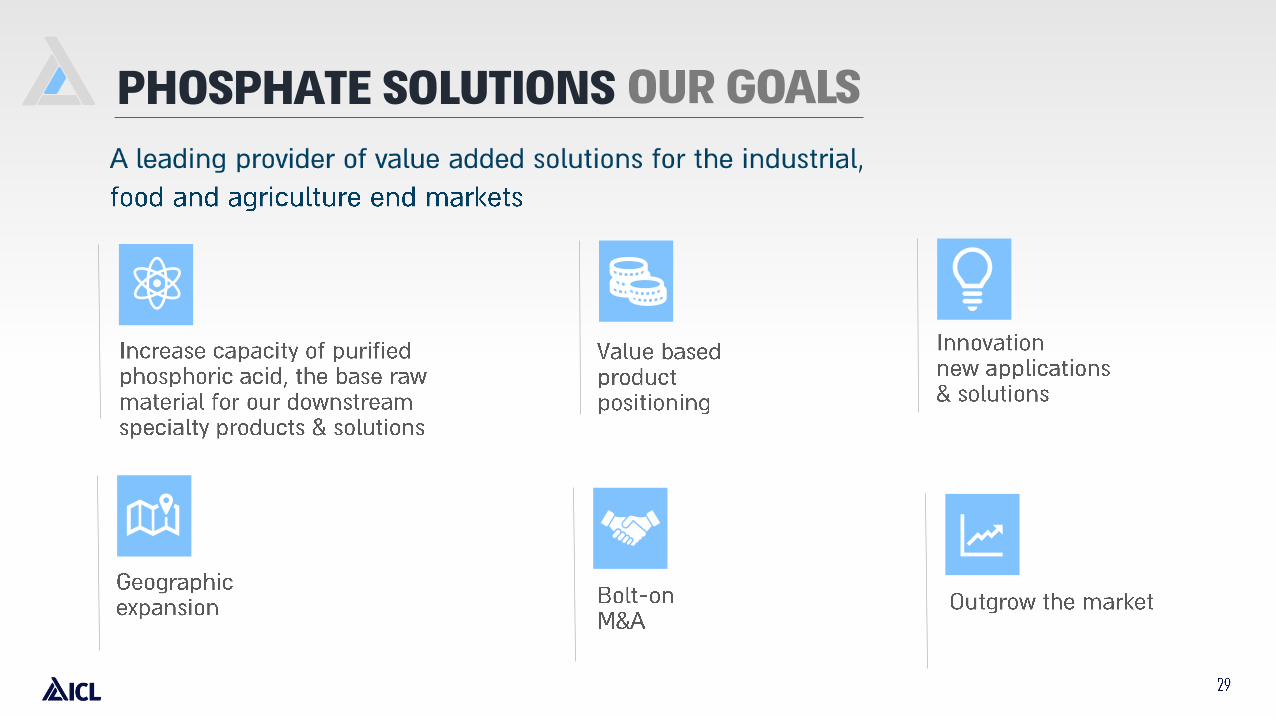
OUR GOALSPHOSPHATE SOLUTIONS
LEADERSHIP STRATEGY
POTASH
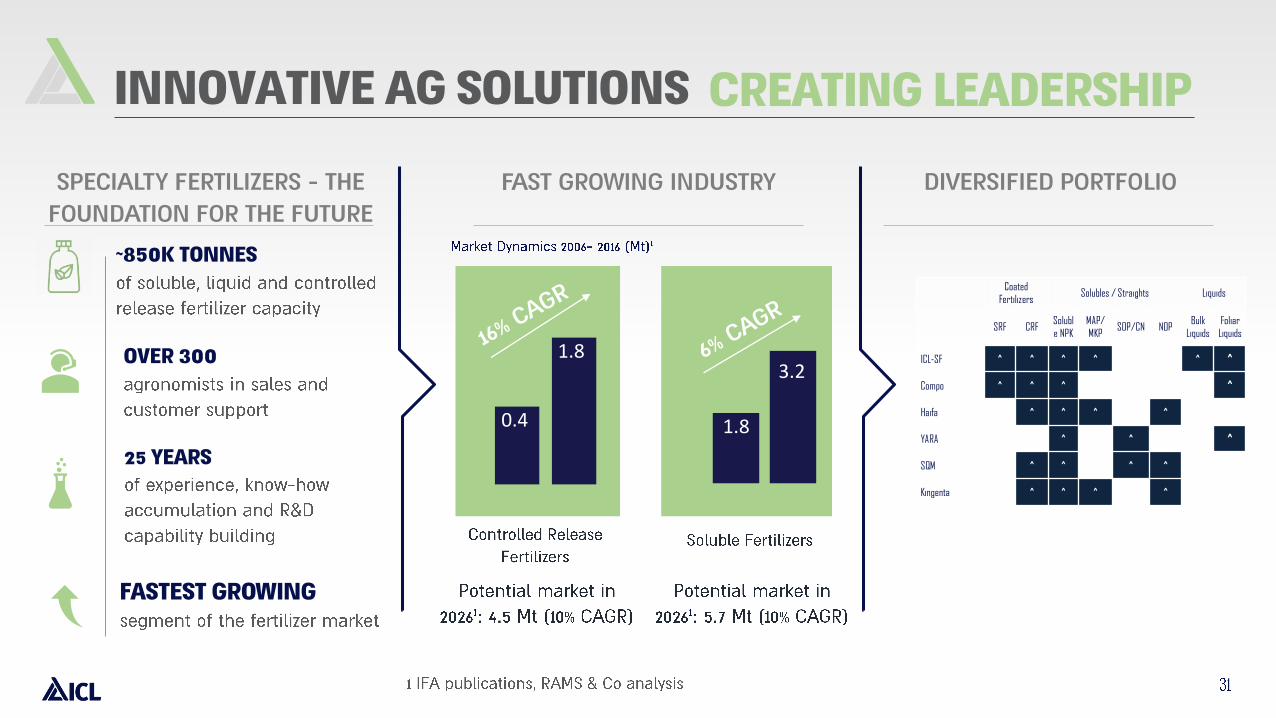
0.4
1.8
FAST GROWING INDUSTRY
1.8
3.2
SPECIALTY FERTILIZERS - THE
FOUNDATION FOR THE FUTURE
~850K TONNES
OVER 300
INNOVATIVE AG SOLUTIONS CREATING LEADERSHIP
FASTEST GROWING
DIVERSIFIED PORTFOLIO
25 YEARS
Coated
FertilizersSolubles / Straights Liquids
SRF CRFSolubl
e NPK
MAP/
MKPSOP/CN NOP
Bulk
Liquids
Foliar
Liquids
ICL-SF ^ ^ ^ ^ ^ ^
Compo ^ ^ ^ ^
Haifa ^ ^ ^ ^
YARA ^ ^ ^
SQM ^ ^ ^ ^
Kingenta ^ ^ ^ ^
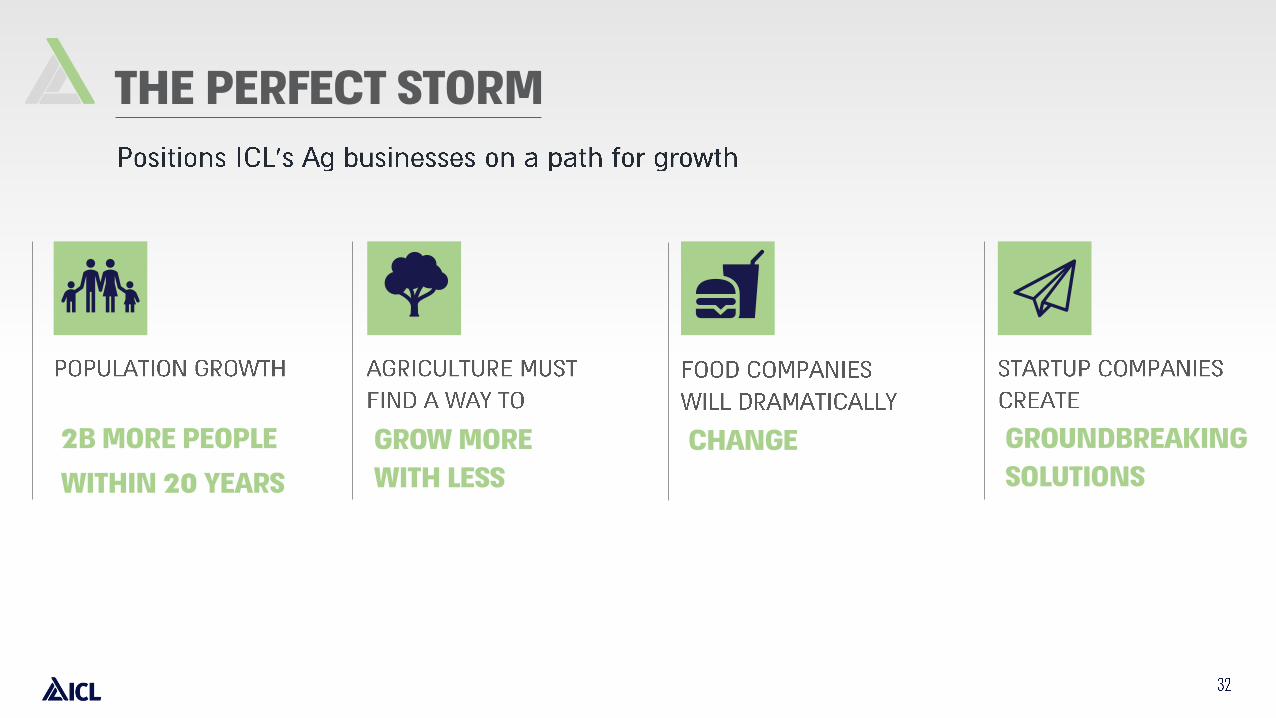
THE PERFECT STORM
CHANGEGROW MORE
WITH LESS
GROUNDBREAKING
SOLUTIONS
2B MORE PEOPLE
WITHIN 20 YEARS
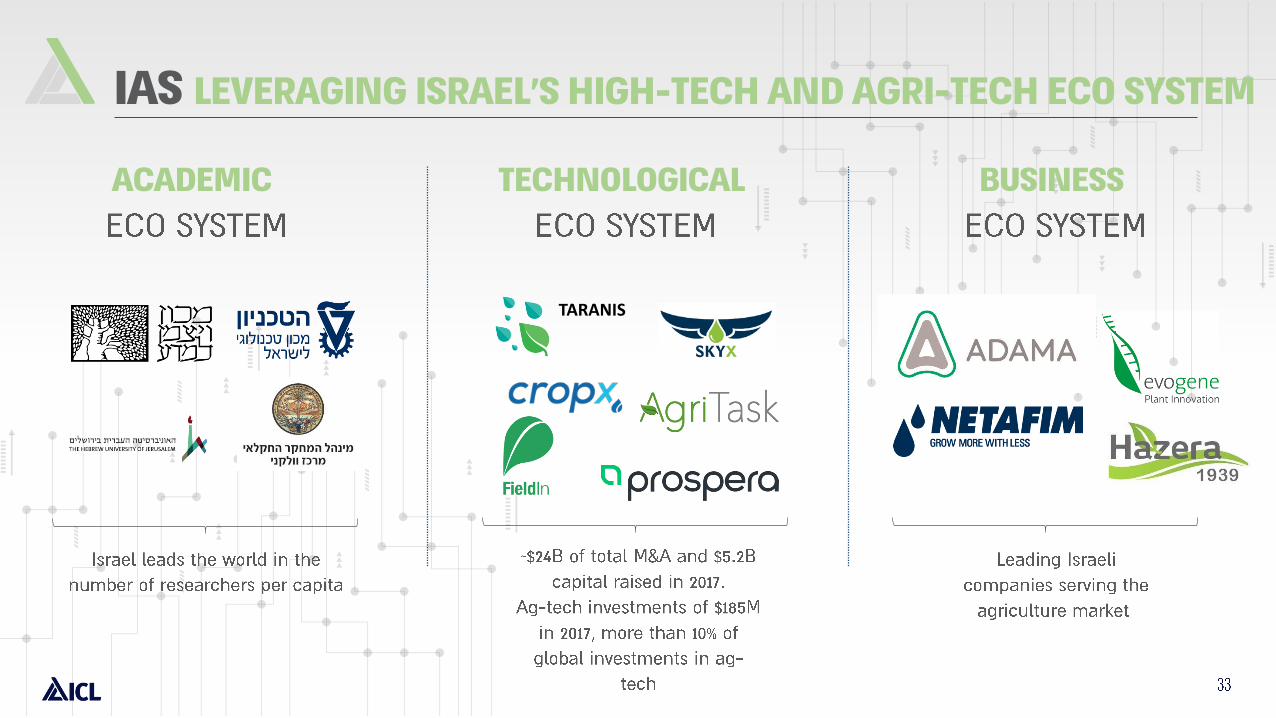
ACADEMIC TECHNOLOGICAL BUSINESS
IAS LEVERAGING ISRAEL'S HIGH-TECH AND AGRI-TECH ECO SYSTEM
TARANIS

ICL AIMS TO OFFER FARMERS
CUTTING-EDGE SOLUTIONS

INNOVATIVE AG SOLUTIONS
UNIQUE R&D CAPABILITIES
GET CLOSER TO GROWER
PORTFOLIO GROWTH
INNOVATION DIGITAL TRANSFORMATION
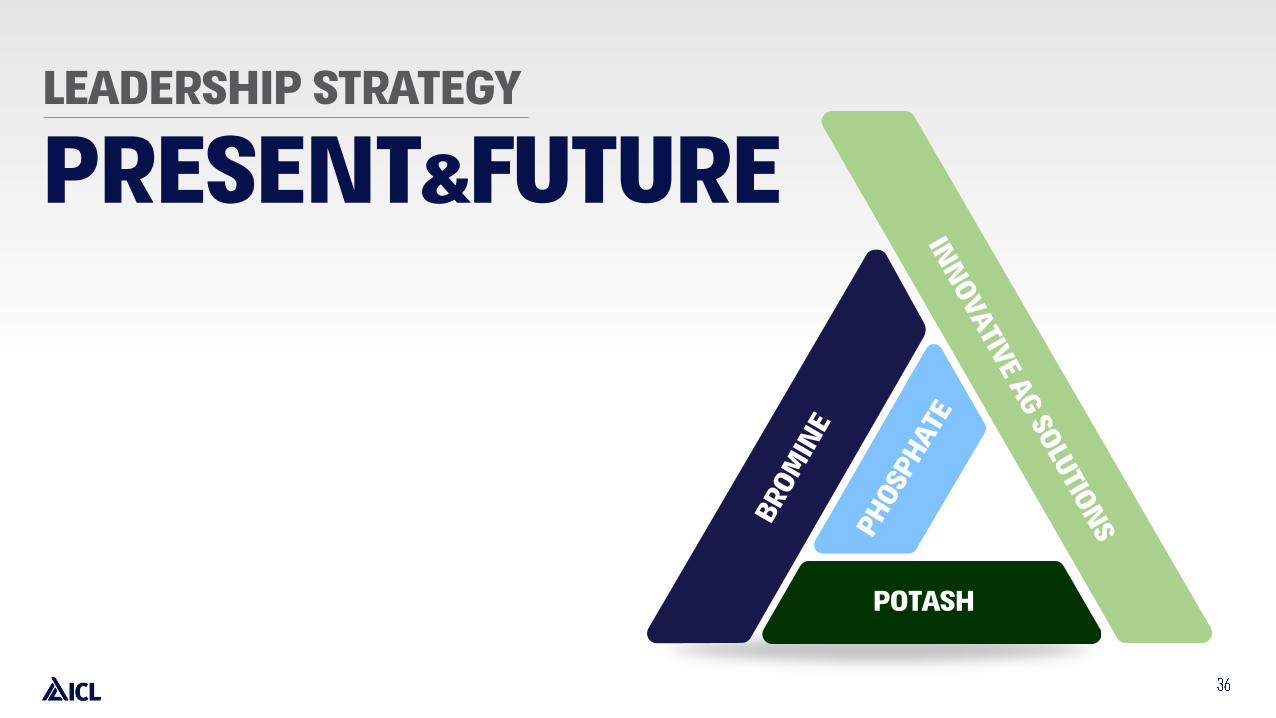
PRESENT&FUTURE
LEADERSHIP STRATEGY
POTASH
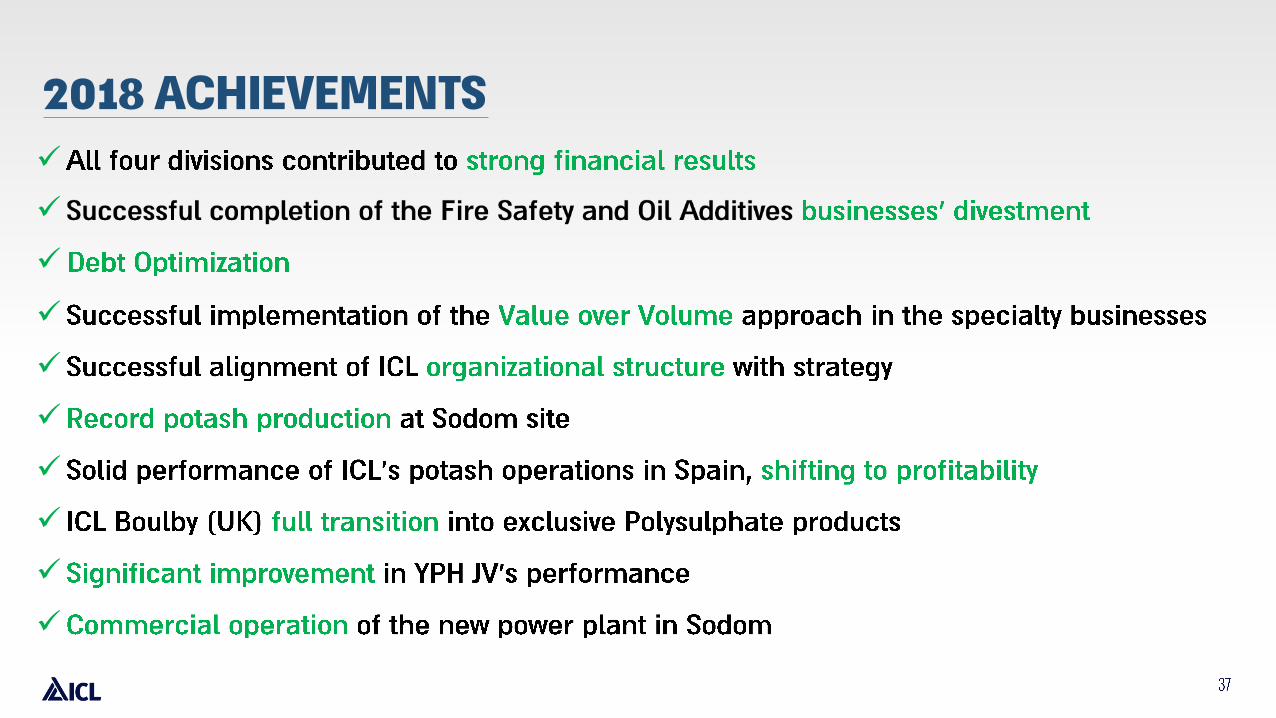
2018 ACHIEVEMENTS
✓
✓
✓
✓
✓
✓
✓
✓
✓
✓
Appendix

Financial Overview
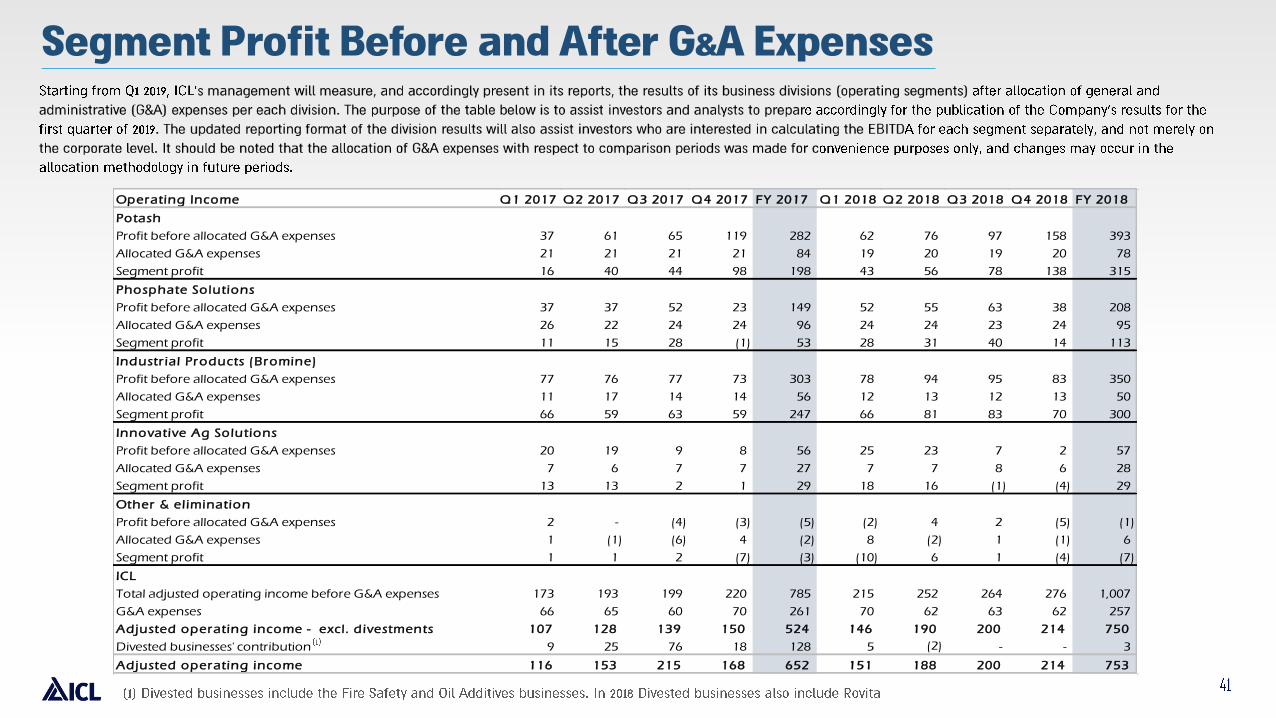
Segment Profit Before and After G&A Expenses
Operating Income Q1 2017 Q2 2017 Q3 2017 Q4 2017 FY 2017 Q1 2018 Q2 2018 Q3 2018 Q4 2018 FY 2018
Potash
Profit before allocated G&A expenses 37 61 65 119 282 62 76 97 158 393
Allocated G&A expenses 21 21 21 21 84 19 20 19 20 78
Segment profit 16 40 44 98 198 43 56 78 138 315
Phosphate Solutions
Profit before allocated G&A expenses 37 37 52 23 149 52 55 63 38 208
Allocated G&A expenses 26 22 24 24 96 24 24 23 24 95
Segment profit 11 15 28 (1) 53 28 31 40 14 113
Industr ial Products (Bromine)
Profit before allocated G&A expenses 77 76 77 73 303 78 94 95 83 350
Allocated G&A expenses 11 17 14 14 56 12 13 12 13 50
Segment profit 66 59 63 59 247 66 81 83 70 300
Innovative Ag Solutions
Profit before allocated G&A expenses 20 19 9 8 56 25 23 7 2 57
Allocated G&A expenses 7 6 7 7 27 7 7 8 6 28
Segment profit 13 13 2 1 29 18 16 (1) (4) 29
Other & elimination
Profit before allocated G&A expenses 2 - (4) (3) (5) (2) 4 2 (5) (1)
Allocated G&A expenses 1 (1) (6) 4 (2) 8 (2) 1 (1) 6
Segment profit 1 1 2 (7) (3) (10) 6 1 (4) (7)
ICL
Total adjusted operating income before G&A expenses 173 193 199 220 785 215 252 264 276 1,007
G&A expenses 66 65 60 70 261 70 62 63 62 257
Adjusted operating income - excl. divestments 107 128 139 150 524 146 190 200 214 750
Divested businesses' contribution 9 25 76 18 128 5 (2) - - 3
Adjusted operating income 116 153 215 168 652 151 188 200 214 753
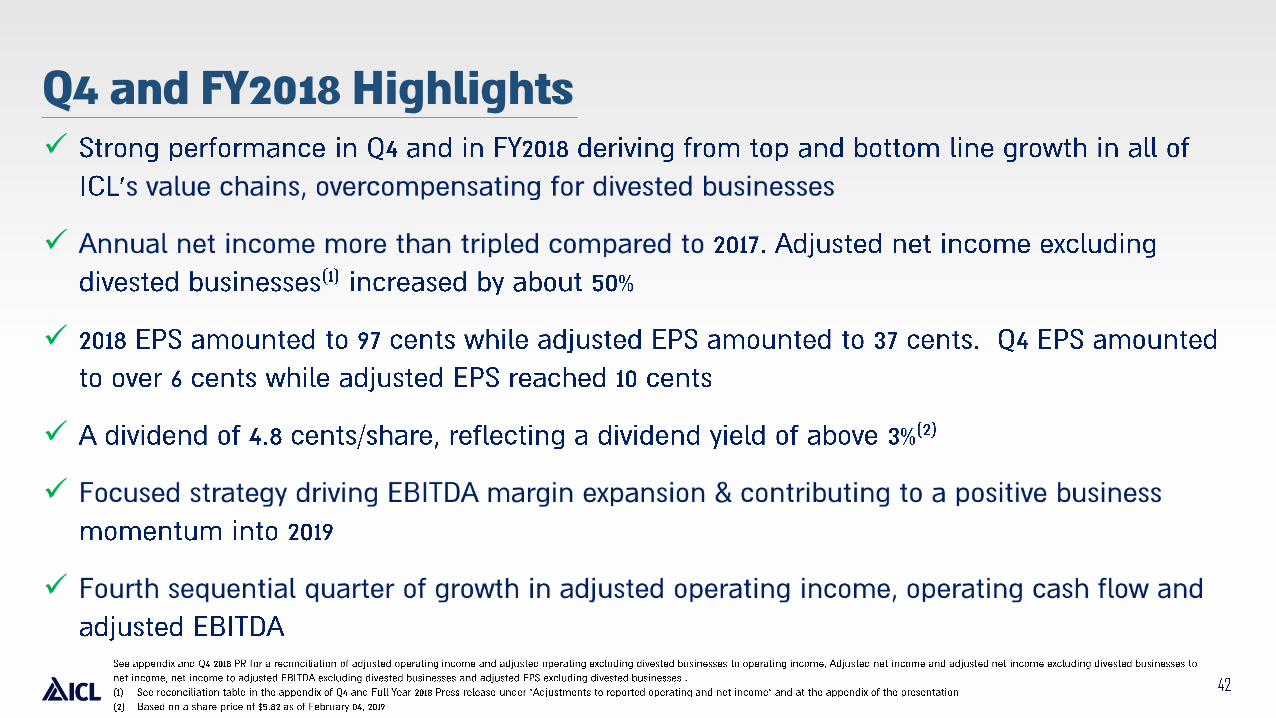
Q4 and FY2018 Highlights
✓
✓
✓
✓
✓
✓

Q4 and Full Year 2018 Results
Summary
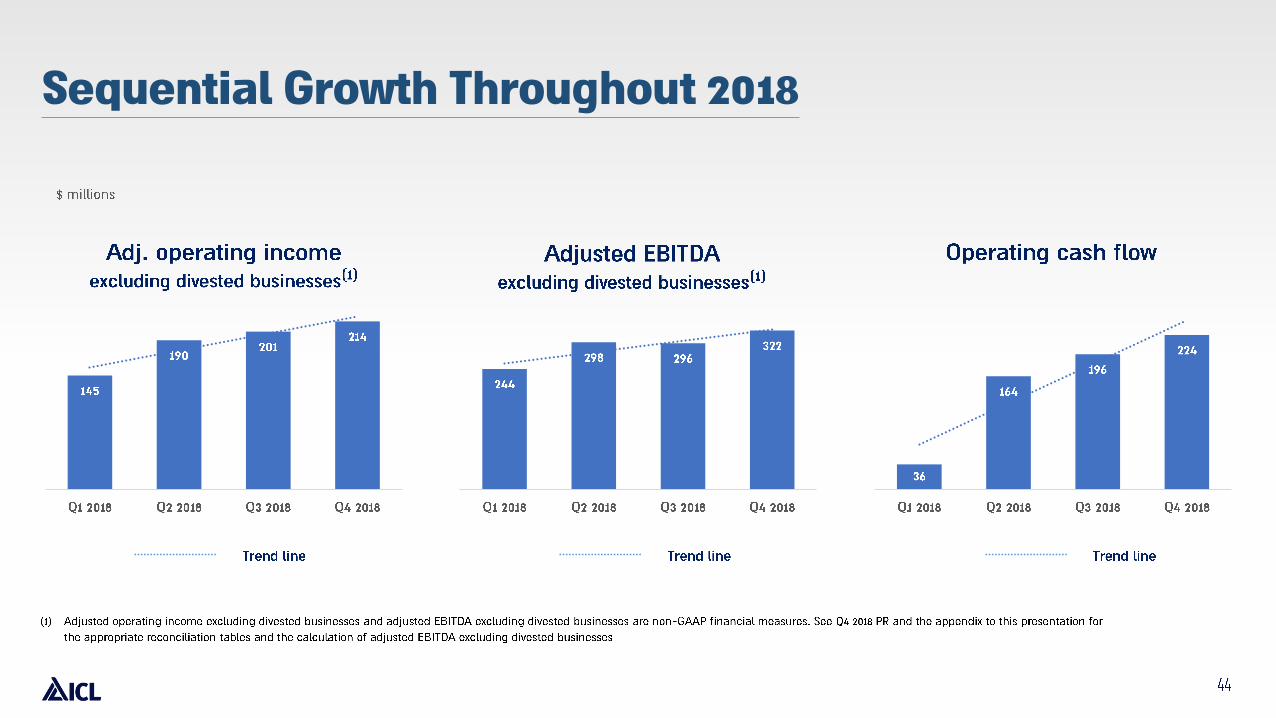
Sequential Growth Throughout 2018

Effective Tax Rate

2019 2020 2021 2022 2023 2024 2025 2026 2038
Successful Optimization of Debt Structure
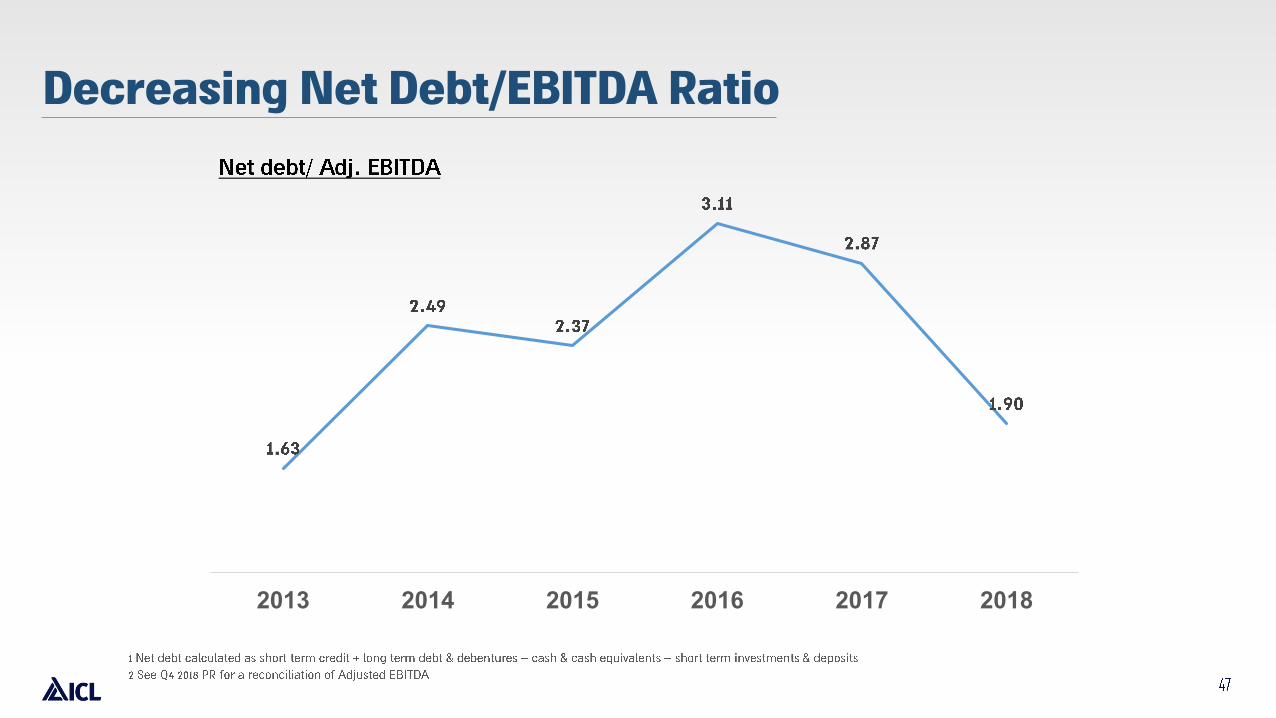
Decreasing Net Debt/EBITDA Ratio
2013 2014 2015 2016 2017 2018
2018 KEY TAKEAWAYS
Industrial Products
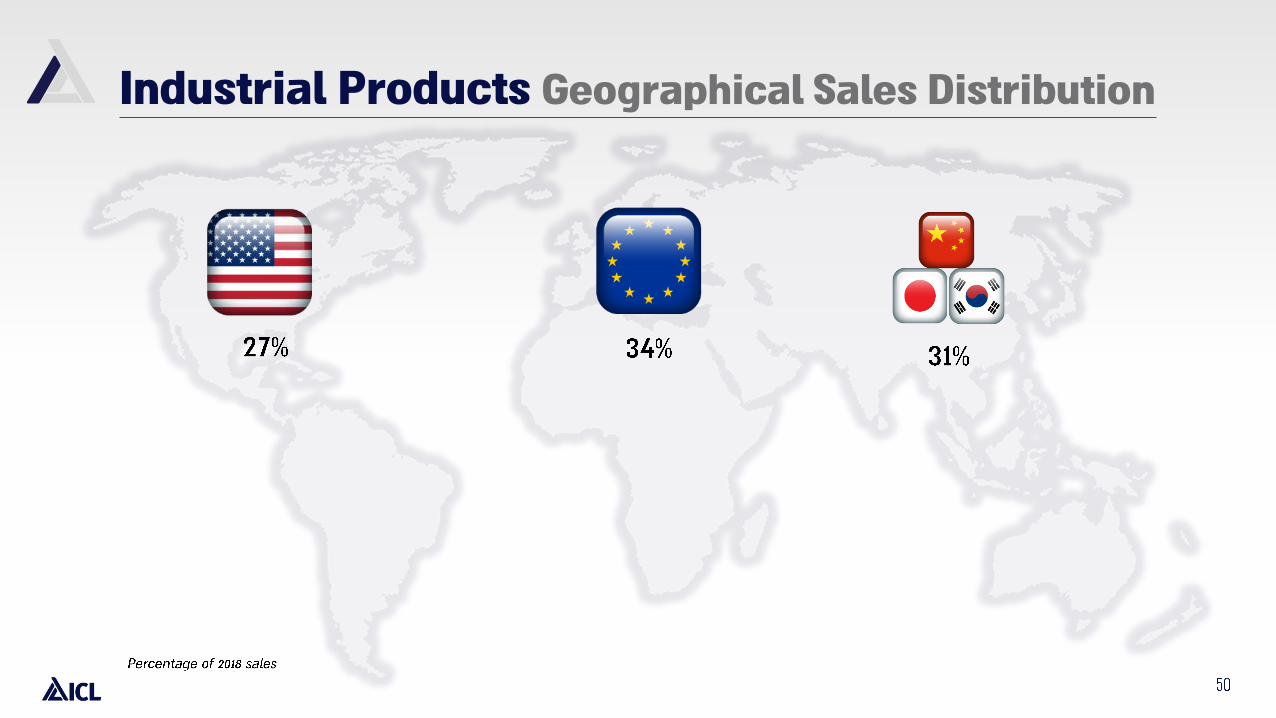
Industrial Products Geographical Sales Distribution

Industrial Products Sales Distribution
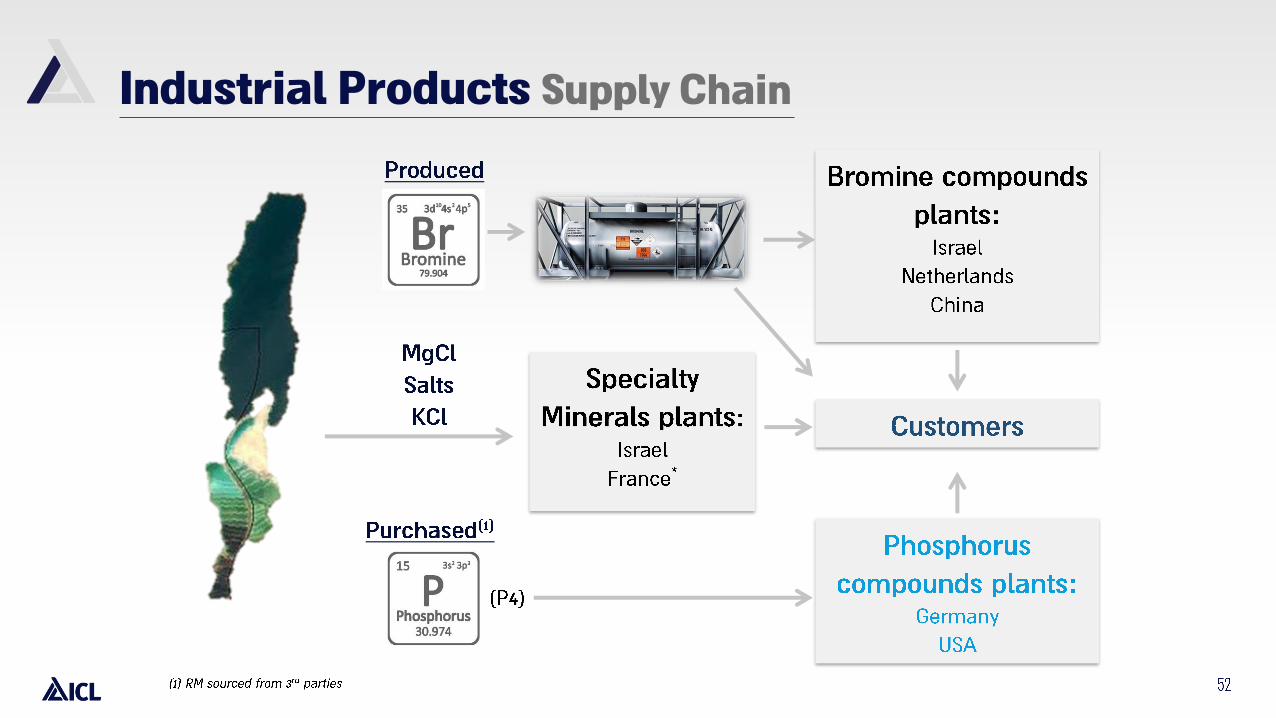
Industrial Products Supply Chain
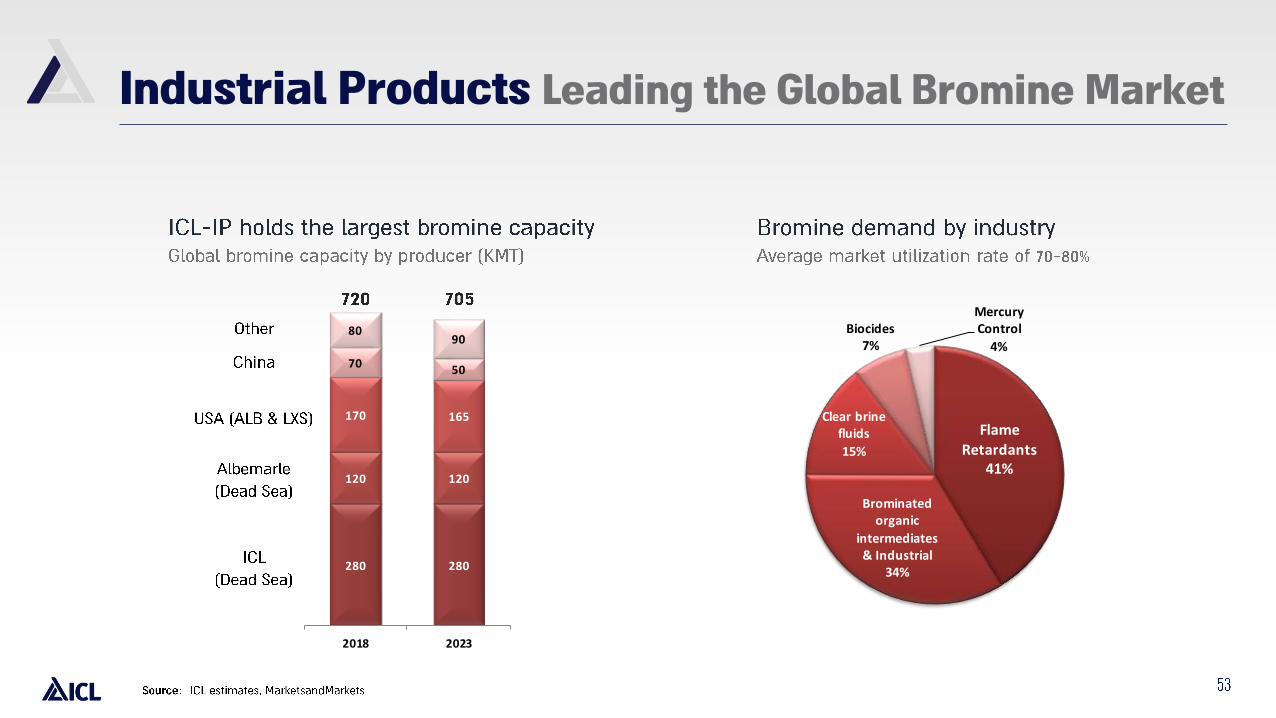
Flame Retardants
41%
Brominated organic
intermediates & Industrial
34%
Clear brine fluids
15%
Biocides7%
Mercury Control
4%
280 280
120 120
170 165
70 50
8090
2018 2023
Industrial Products Leading the Global Bromine Market
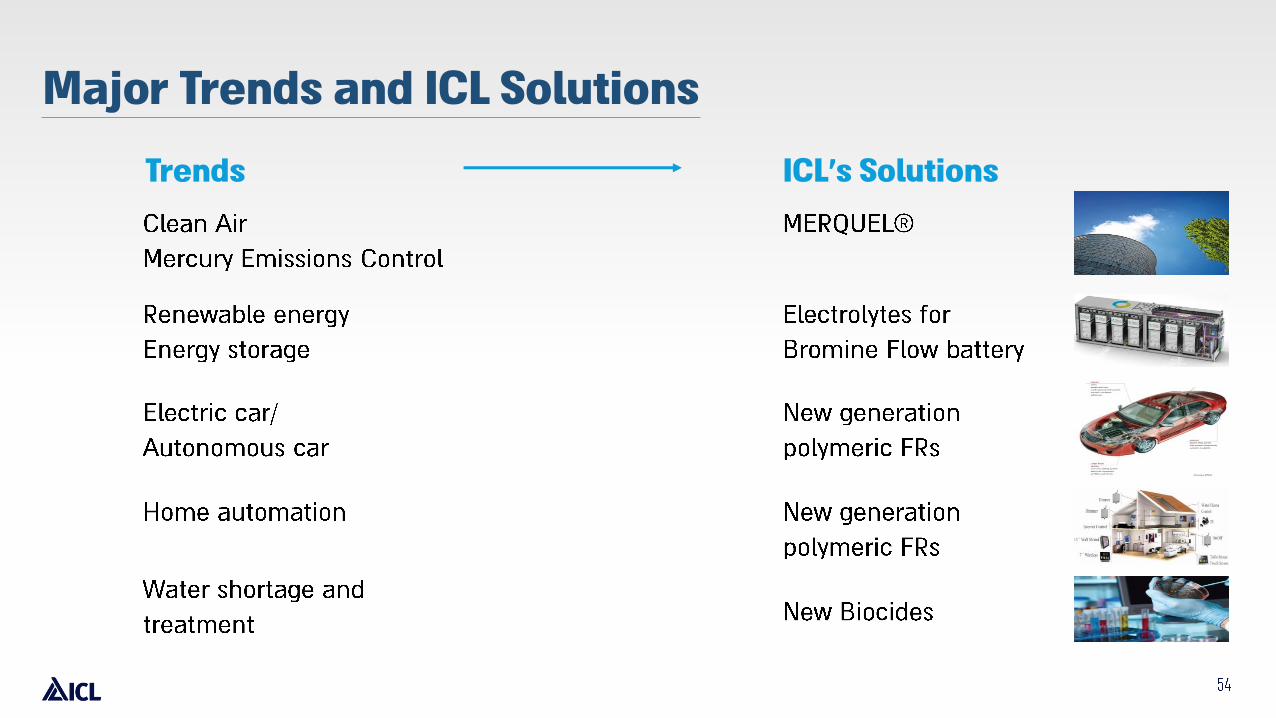
Major Trends and ICL Solutions
Trends ICL’s Solutions
Potash
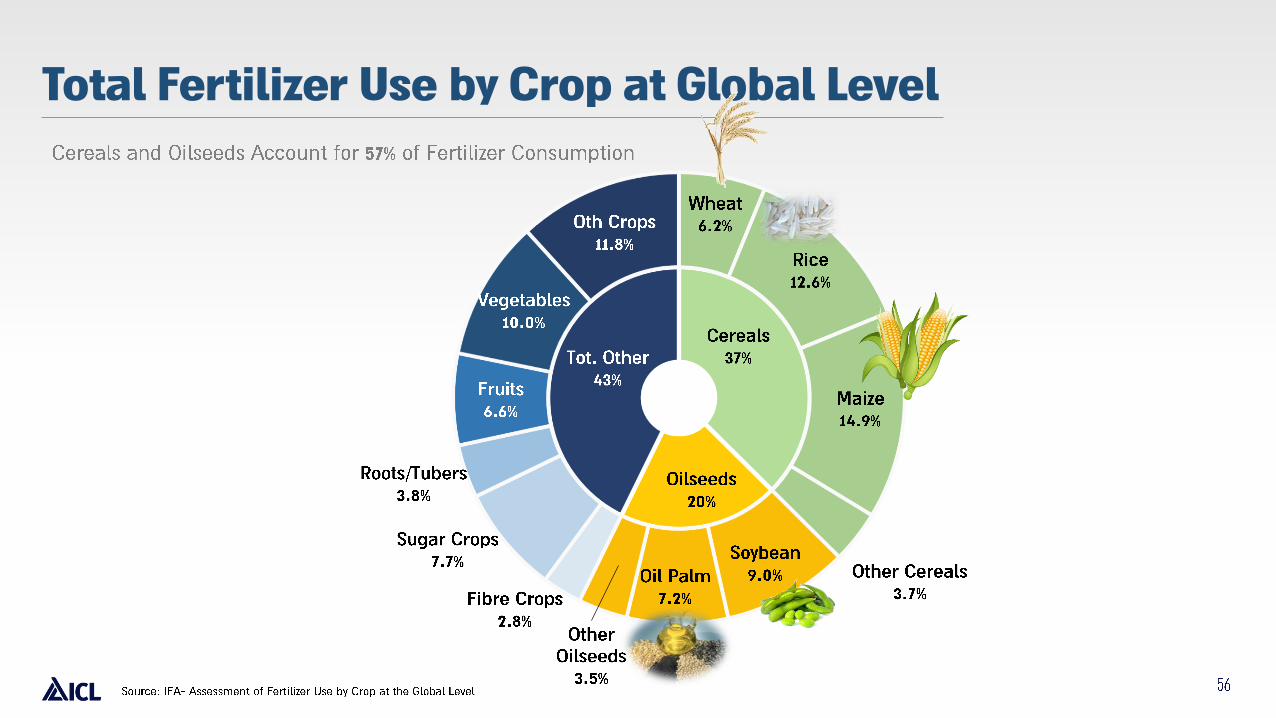
Total Fertilizer Use by Crop at Global Level
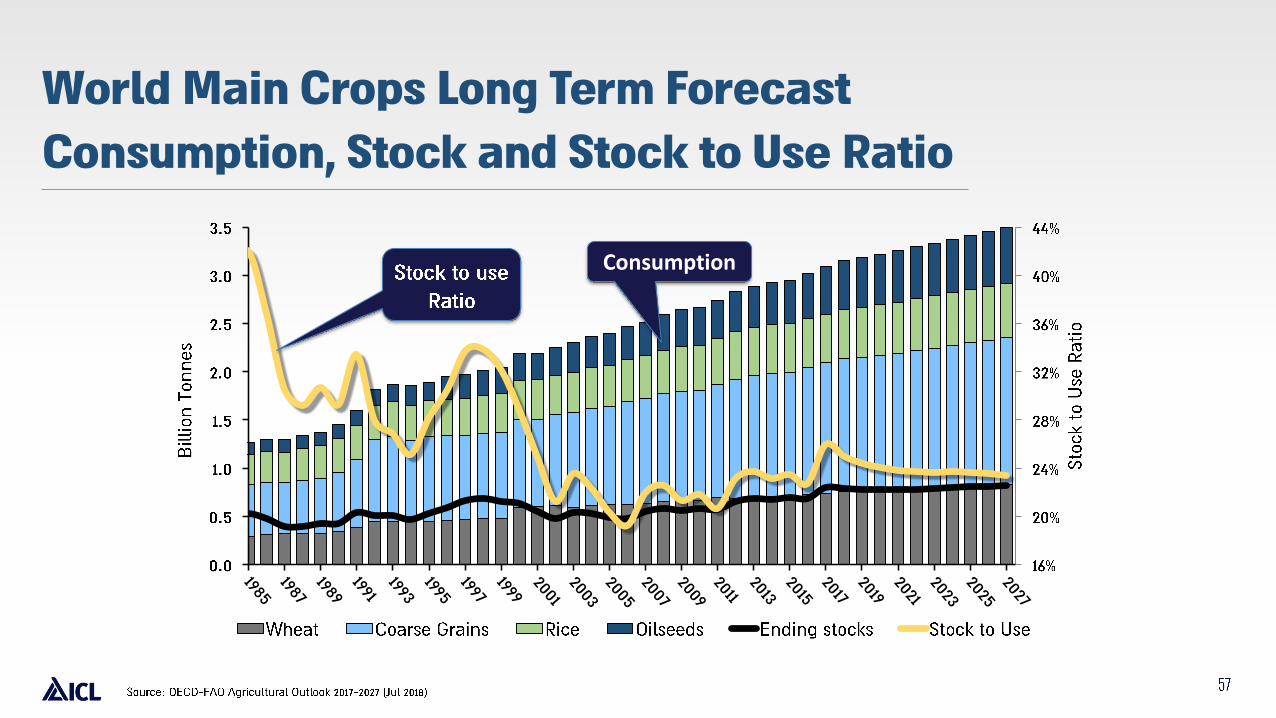
World Main Crops Long Term Forecast
Consumption, Stock and Stock to Use Ratio
Consumption

World Grains Production & Consumption:
Current Stock to Use Ratio

ICL’s Potash Market Share in Fast Growing Markets
10%
25%
25%
16%
20%4%
APC BPC Canpotex ICL Uralkali K+S
5%
20%
23%9%
29%
14%
SQM BPC Uralkali K+S Canpotex ICL
20%
23%
31%
12%
9%5%
Uralkali BPC Canpotex ICL APC Others
India Brazil China
31%
16%13%
23%
15% 2%
Canpotex Uralkali APC BPC ICL K & S
30%
24%2%
19%
12%
13%
Canpotex Uralkali SQM BPC ICL K&S
21%
19%
38%
4%
11%3% 4%
Uralkali BPC Canpotex APC ICL K+S Other
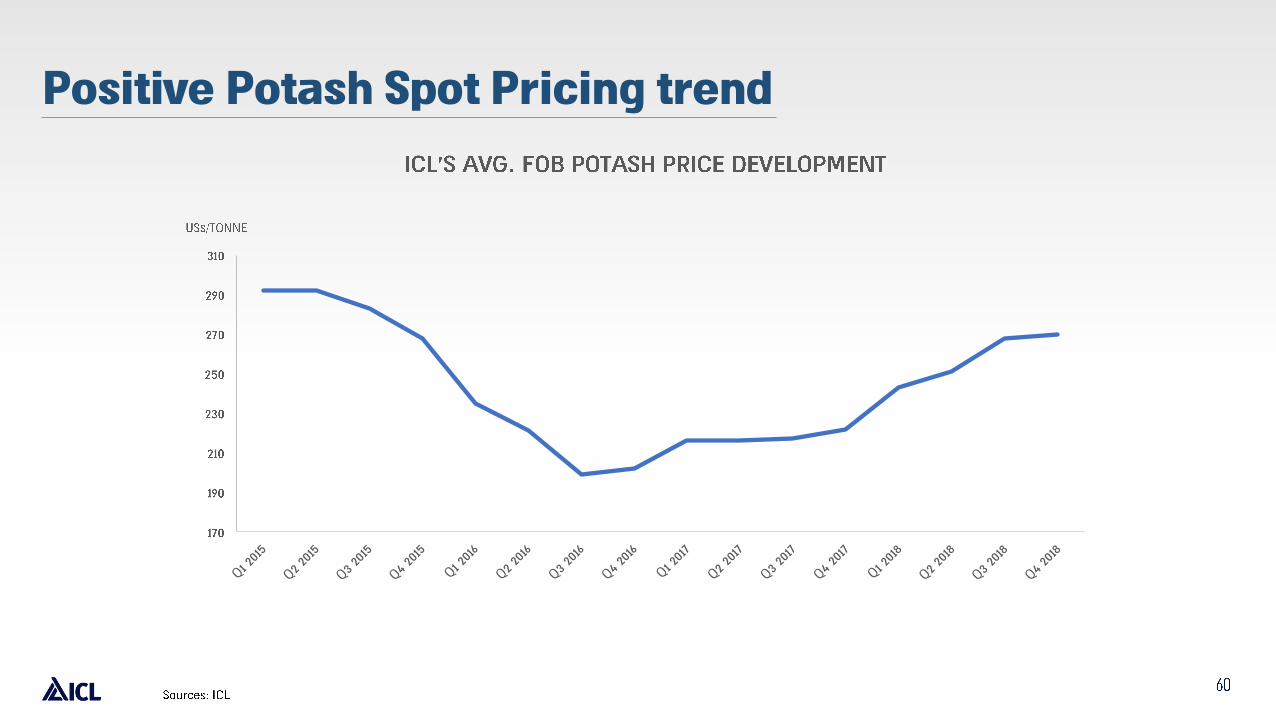
Positive Potash Spot Pricing trend
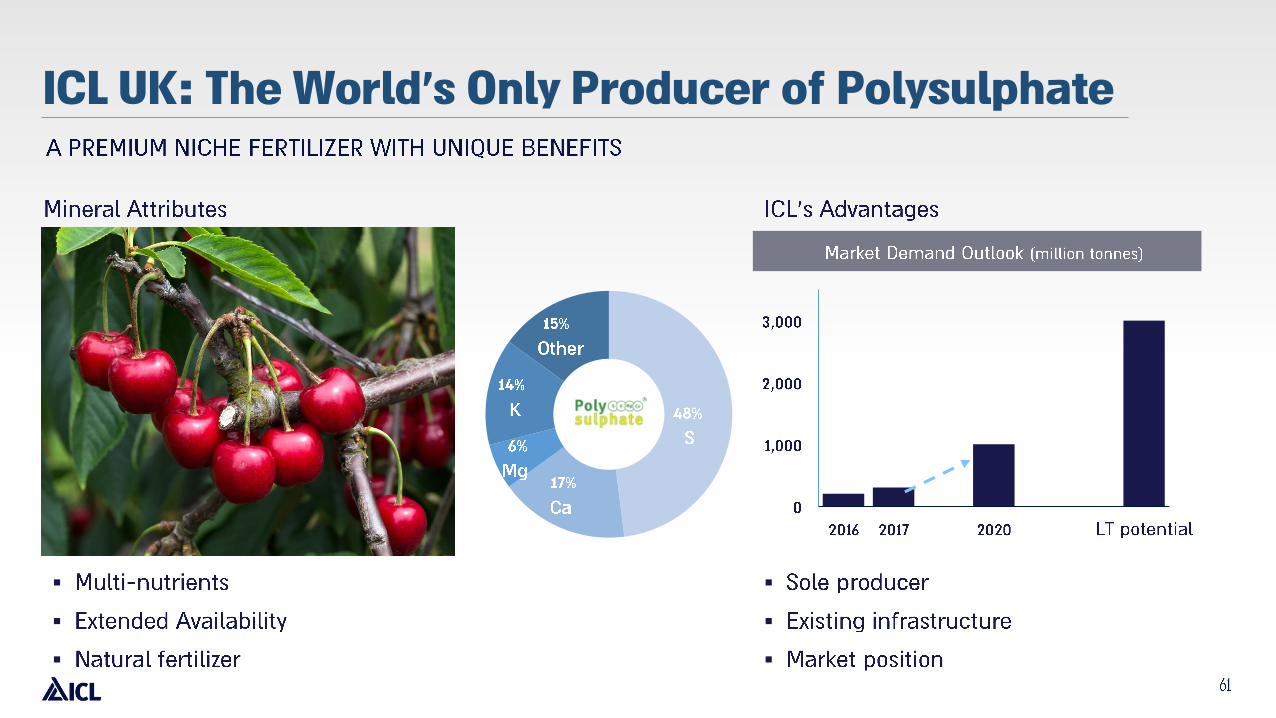
ICL UK: The World’s Only Producer of Polysulphate
▪
▪
▪
▪
▪
▪
Phosphate Solutions

Phosphate Solutions: Backward Integrated Value Chain

Phosphoric Acid Pricing Trends
%
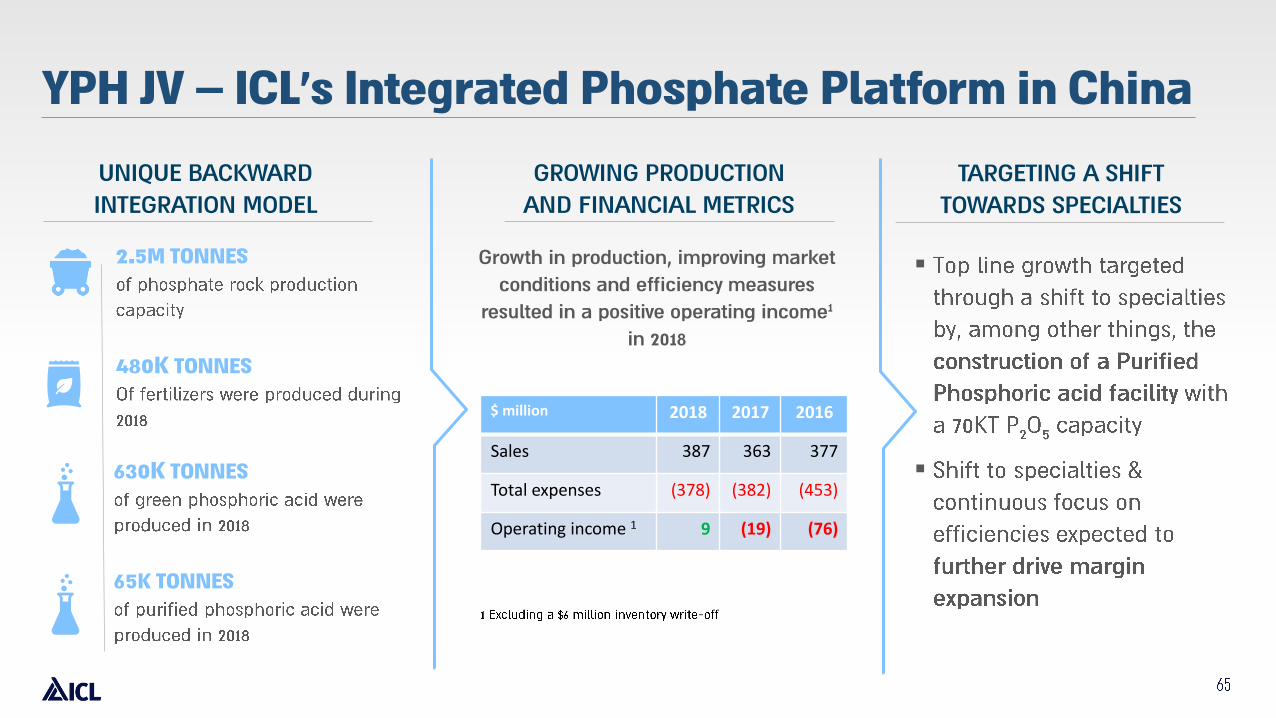
2.5M TONNES
480K TONNES
TARGETING A SHIFT
TOWARDS SPECIALTIES
▪
▪630K TONNES
65K TONNES
Growth in production, improving market
conditions and efficiency measures
resulted in a positive operating income1
in 2018
GROWING PRODUCTION
AND FINANCIAL METRICS
UNIQUE BACKWARD
INTEGRATION MODEL
YPH JV – ICL’s Integrated Phosphate Platform in China
201620172018$ million
377363387Sales
(453)(382)(378)Total expenses
(76)(19)9Operating income 1
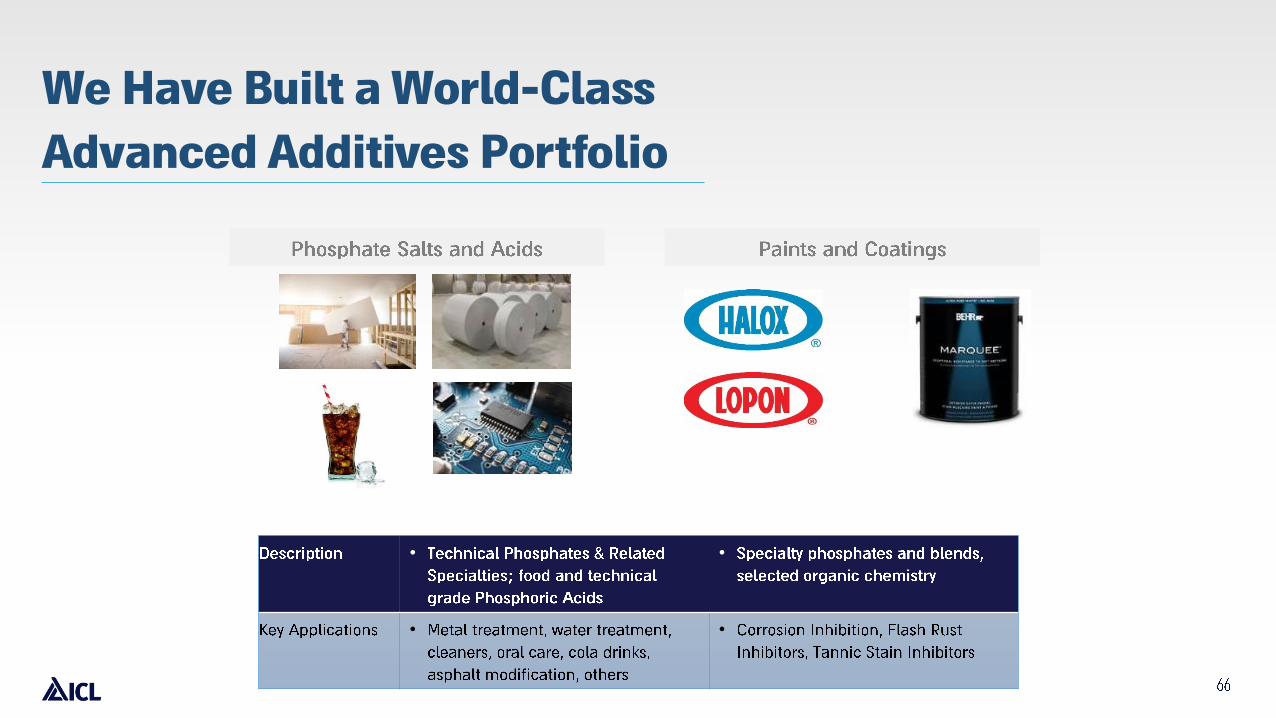
We Have Built a World-Class
Advanced Additives Portfolio
• •
• •
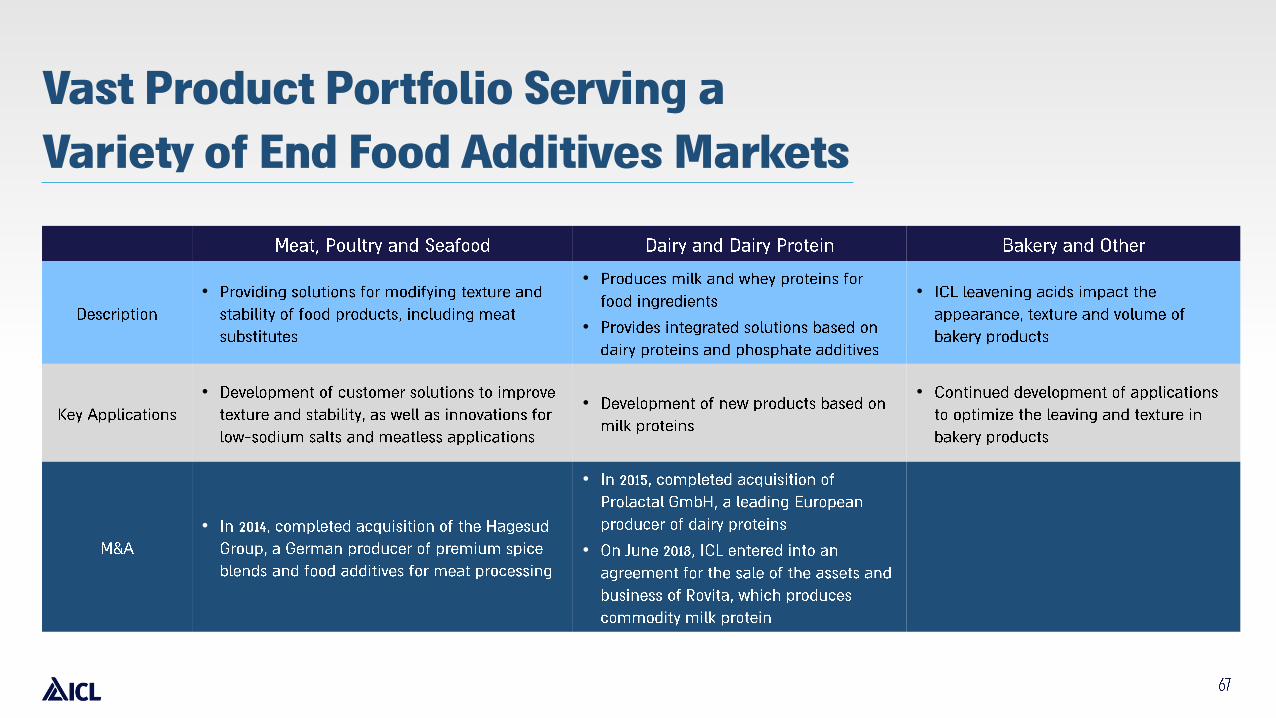
Vast Product Portfolio Serving a
Variety of End Food Additives Markets
••
•
•
••
•
•
•
•
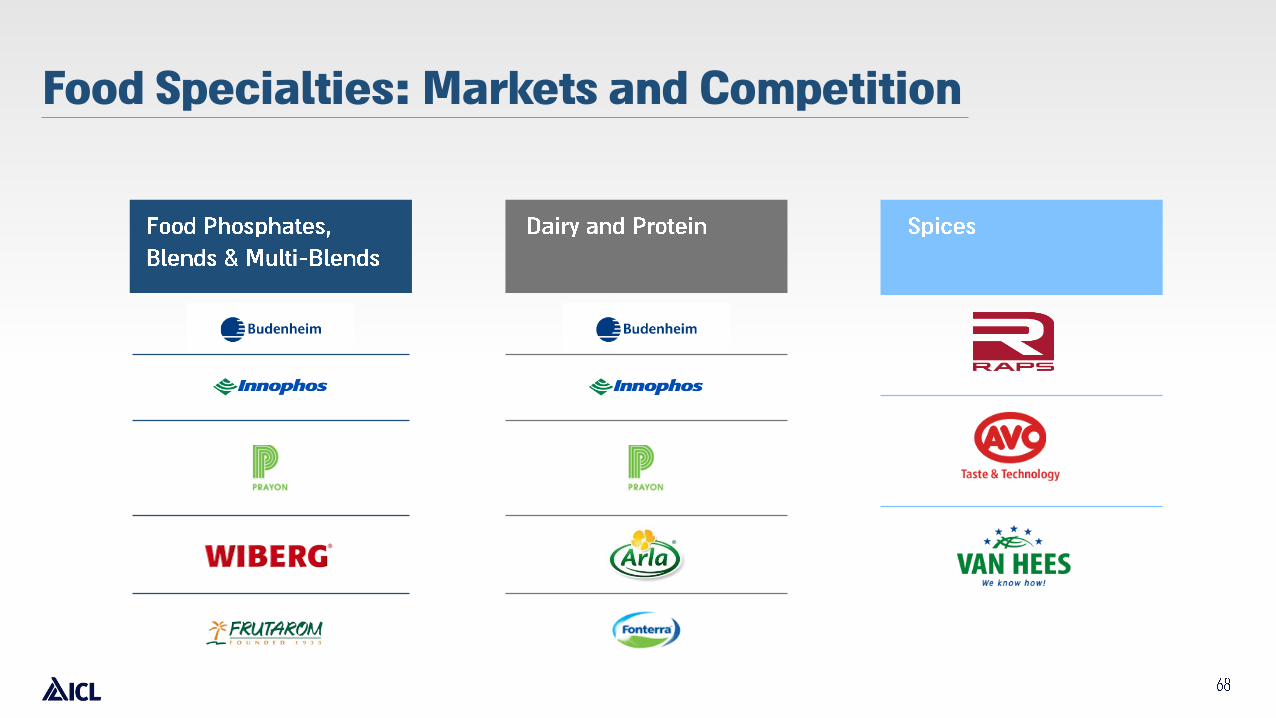
Food Specialties: Markets and Competition
Innovative Ag Solutions

ICL’s Leadership in the Specialty Fertilizers Market
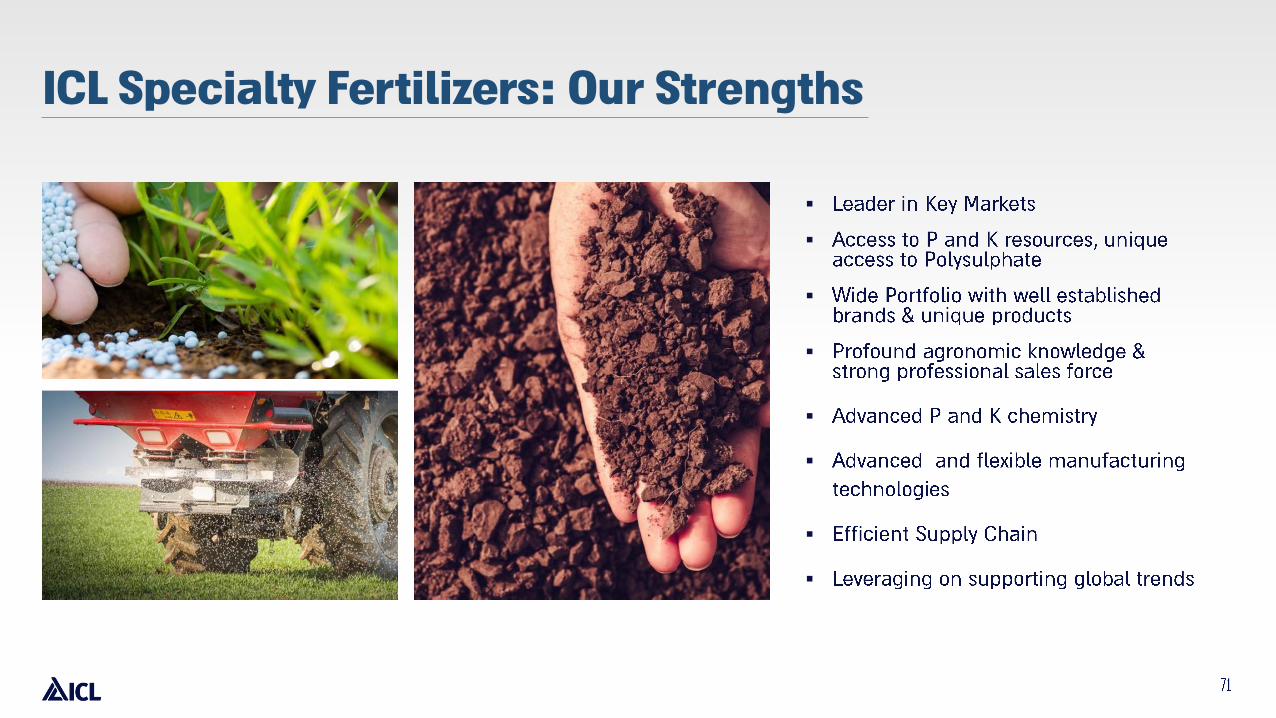
ICL Specialty Fertilizers: Our Strengths
▪
▪
▪
▪
▪
▪
▪
▪
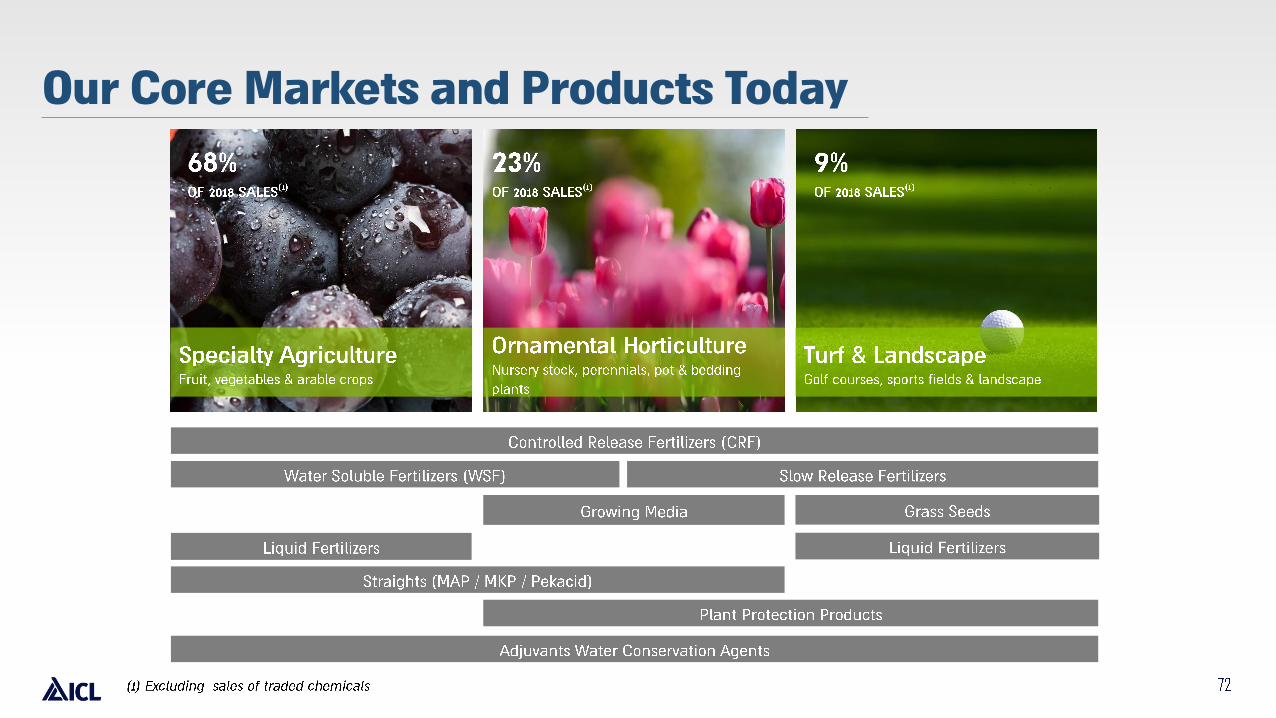
Our Core Markets and Products Today
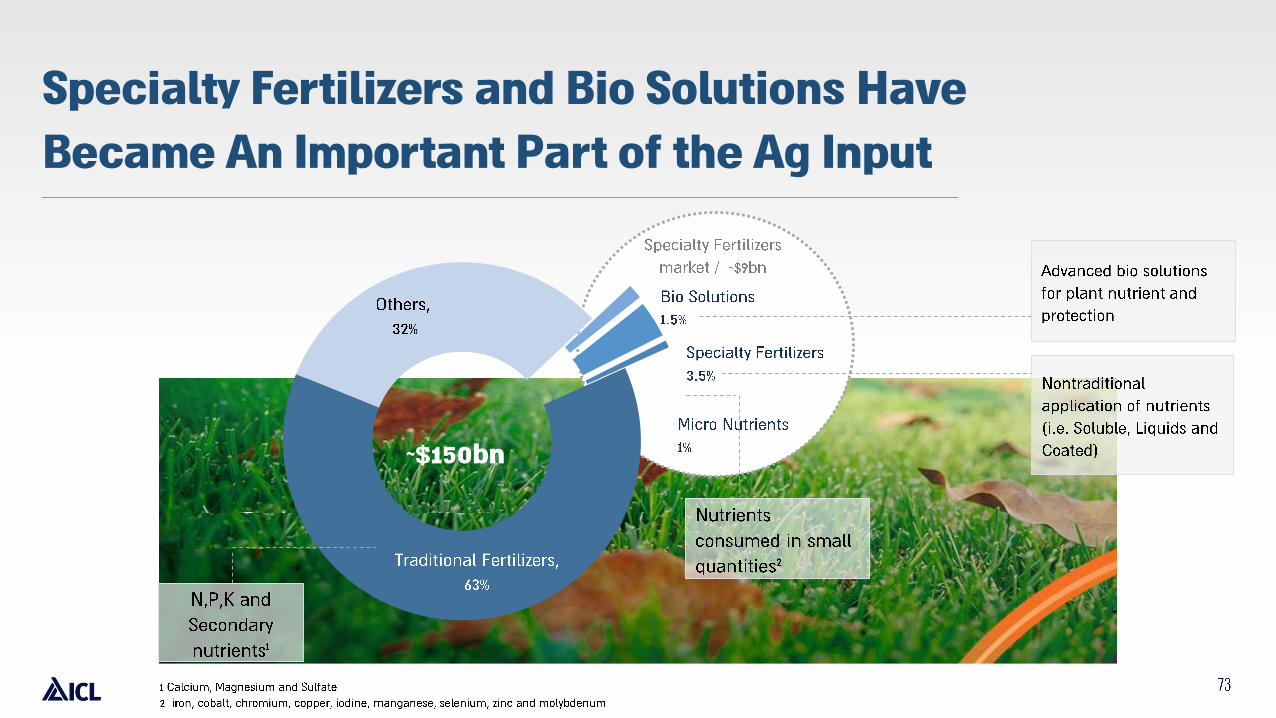
Specialty Fertilizers and Bio Solutions Have
Became An Important Part of the Ag Input
~$150bn

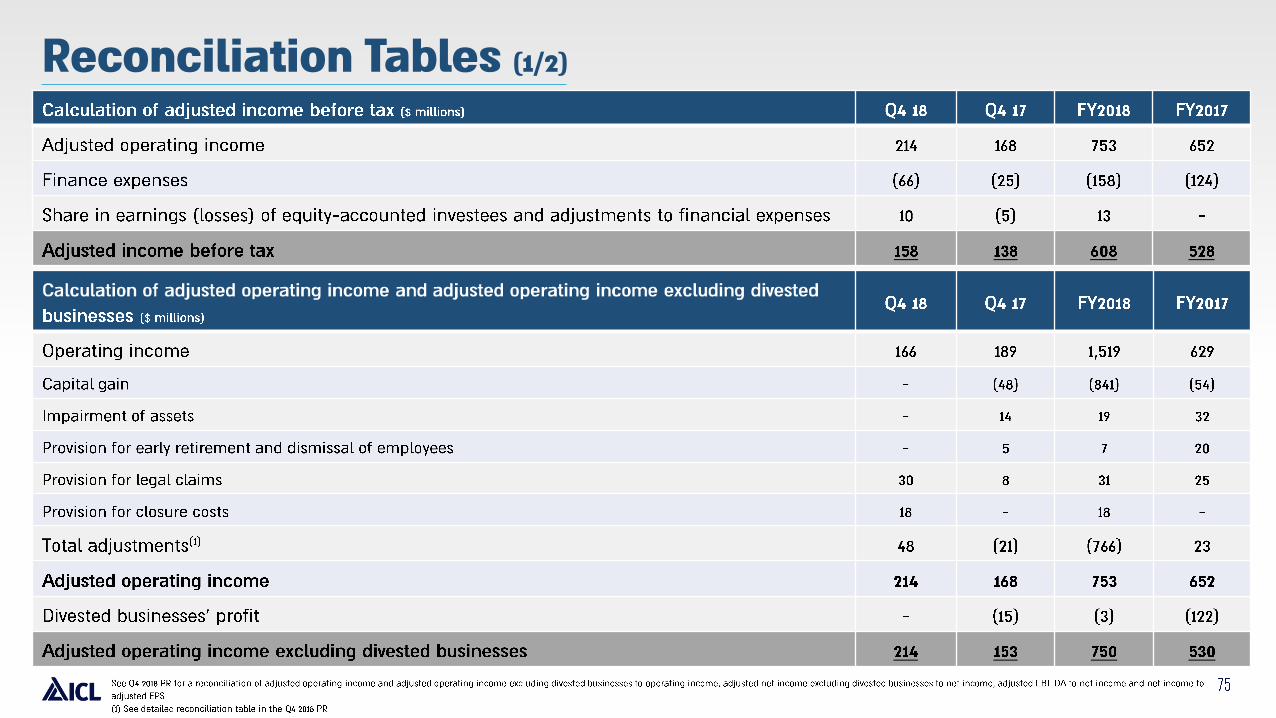
Reconciliation Tables (1/2)
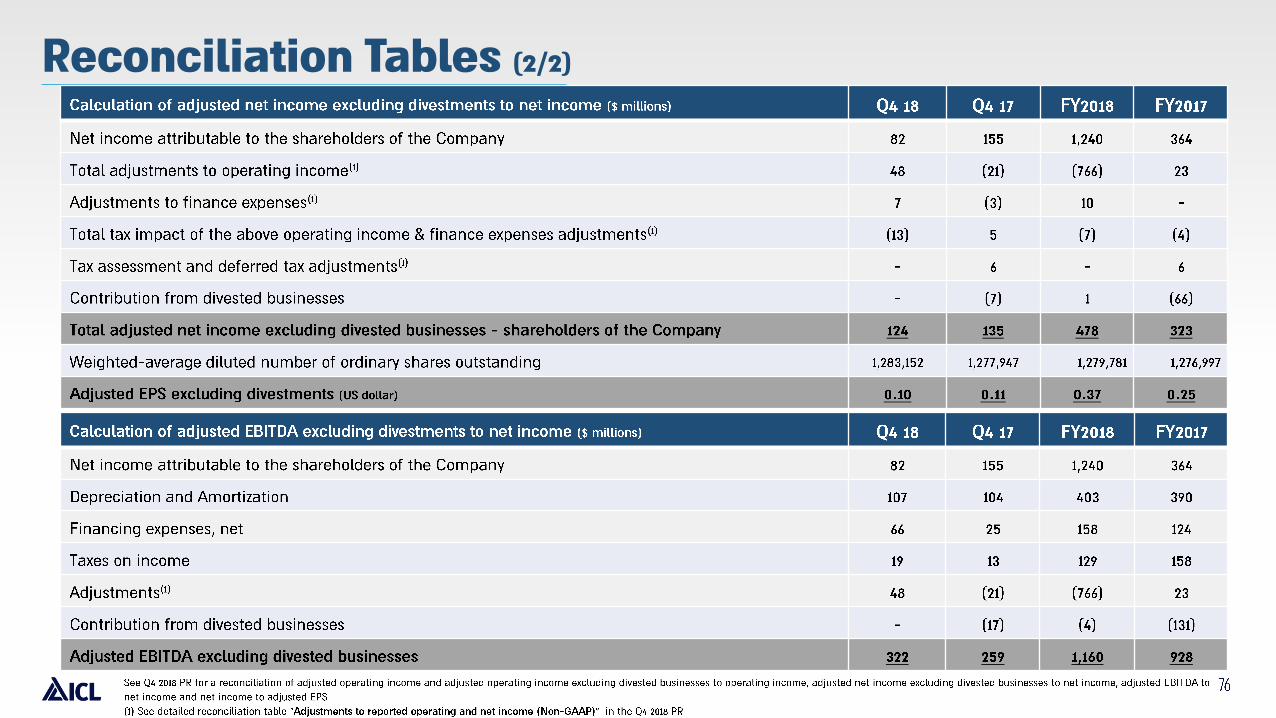
Reconciliation Tables (2/2)