© michel dubois, murali annavaram, per strenstrom all rights reserved chapter 9 simulation methods...
TRANSCRIPT

© Michel Dubois, Murali Annavaram, Per Strenstrom All rights reserved
CHAPTER 9Simulation Methods
• SIMULATION METHODS
• SIMPOINTS
• PARALLEL SIMULATIONS
• NONDETERMINISM

© Michel Dubois, Murali Annavaram, Per Strenstrom All rights reserved
How to study a computer system
Methodologies Construct a hardware prototype Mathematical modeling Simulation

© Michel Dubois, Murali Annavaram, Per Strenstrom All rights reserved
Construct a hardware prototype
Advantages Runs fast
Disadvantages Takes long time to build
- RPM (Rapid Prototyping engine for Multiprocessors) Project @ USC; took a few graduate students several years
Expensive Not flexible
© Michel Dubois, Murali Annavaram, Per Strenstrom All rights reserved
Mathematically model the system
Use analytical modeling Probabilistic Queuing Markov Petri Net
Advantages Very flexible Very quick to develop Runs quickly
Disadvantages Can not capture effects of system details Computer architects are skeptical of models

© Michel Dubois, Murali Annavaram, Per Strenstrom All rights reserved
Simulation
Write a program that mimics system behavior Advantages
Very flexible Relatively quick to develop
Disadvantages Runs slowly (e.g., 30,000 times slower than hardware) Execution-driven simulators are increasingly complex How to manage complexity?
© Michel Dubois, Murali Annavaram, Per Strenstrom All rights reserved
Most popular research method
Simulation is chosen by MOST research projects Why?
Mathematical model is NOT accurate Building prototype is too time-consuming and too expensive for academic
researchers
© Michel Dubois, Murali Annavaram, Per Strenstrom All rights reserved
Computer architecture simulation
Study the characteristics of a complicated computer system with a fixed configuration
Explore design space of a system With an accurate model, we can make changes and see how they will affect a
system

© Michel Dubois, Murali Annavaram, Per Strenstrom All rights reserved
Tool classification
OS code execution System-level (complete system)
- Does simulate behavior of an entire computer system, including OS and user code- Examples:
– Simics– SimOS
User-level- Does NOT simulate OS code- Does emulate system calls- Examples:
– SimpleScalar

© Michel Dubois, Murali Annavaram, Per Strenstrom All rights reserved
Tool classification
Simulation detail Instruction set
- Does simulate the function of instructions- Does NOT model detailed micro-architectural timing- Examples:
– Simics
Micro-architecture- Does clock cycle level simulation- Does speculative, out-of-order multiprocessor timing simulation- May NOT implement functionality of full instruction set or any devices- Examples:
– SimpleScalar
RTL- Does logic gate-level simulation- Examples:
– Synopsis

© Michel Dubois, Murali Annavaram, Per Strenstrom All rights reserved
Tool classification
Simulation input Trace-driven
- Simulator reads a “trace” of inst captured during a previous execution by software/hardware
- Easy to implement, no functional component needed- Large trace size; no branch prediction
Execution-driven- Simulator “runs” the program, generating a trace on-the-fly- More difficult to implement, but has many advantages- Interpreter, direct-execution- Examples:
– Simics, SimpleScalar…

© Michel Dubois, Murali Annavaram, Per Strenstrom All rights reserved
Tools introduction and tutorial
SimpleScalar http://www.simplescalar.com/
Simics http://www.virtutech.com/ https://www.simics.net/
SimWattch WattchCMP

© Michel Dubois, Murali Annavaram, Per Strenstrom All rights reserved
Simulation Bottleneck 1 GHz = 1 Billion Cycles per Second Simulating a second of a future machine execution =
Simulate 1B cycles!! Simulation of 1 cycle of a target = 30,000 cycles on a host 1 second of target simulation = 30,000 seconds on host =
8.3 Hours CPU2K run for a few hours natively Speed much worse when simulating CMP targets!!
12

© Michel Dubois, Murali Annavaram, Per Strenstrom All rights reserved
What to Simulate
Simulating the entire application takes long So simulate a subsection But which subsection
Random Starting point Ending point
How do we know what we selected is good?

© Michel Dubois, Murali Annavaram, Per Strenstrom All rights reserved
Phase behavior: A Visual Illustration with MCF
What is a “phase”? Interval of execution, not necessarily contiguous, during
which a measured program metric (i.e. code flow) is relatively stable
“Phase behavior” in this study Relationship between Extended Instruction Pointers (EIPs)
and Cycles Per Instruction (CPI)
EIPs
time
CPIs
mcf benchmark
M. Annavaram, R. Rakvic, M. Polito, J. Bouguet, R. Hankins, B. Davies. The Fuzzy Correlation between Code and Performance Predictability. In Proceedings of the 37th International Symposium on Microarchitecture, pages 93-104, Dec 2004

© Michel Dubois, Murali Annavaram, Per Strenstrom All rights reserved
Why Correlate Code and Performance?
Improve simulation speed by selective sampling Simulate only few samples per phase
Dynamic optimizations Phase changes may trigger dynamic program optimizations
Reconfigurable/Power aware computing
time
EIPs
CPIs
mcf benchmarkSample 1 Sample 2

© Michel Dubois, Murali Annavaram, Per Strenstrom All rights reserved
Program Phase Identification Must be independent of architecture Must be quick Phases must exist in the dimension we are interested in:
CPI, $Misses, Branch Mispredictions…
16

© Michel Dubois, Murali Annavaram, Per Strenstrom All rights reserved
Basic Block Vectors Use program basic block flow as a mechanism to identify
similarity Control flow similarity program phase similarity
17
B1
B4
B2 B3
2 2 0 2
2 1 1 2
Manhattan Distance = |1 – 2| + |1 – 0| = 2Euclidian Distance = sqrt((1 – 2)2 + (1 – 0)2) = sqrt(2)
B1 B2 B3 B4

© Michel Dubois, Murali Annavaram, Per Strenstrom All rights reserved
Generating BBV Split program into 100M instruction windows For each window compute the BBV Compare similarities in BBV using distance metric Cluster BBVs with minimum distance between themselves
into groups
18

© Michel Dubois, Murali Annavaram, Per Strenstrom All rights reserved
Basic Block Similarity Matrix
Darker the pattern higher the similarity
Timothy Sherwood, Erez Perelman, Greg Hamerly, and Brad Calder. 2002. Automatically characterizing large scale program behavior. SIGOPS Oper. Syst. Rev. 36, 5 (October 2002), 45-57.

© Michel Dubois, Murali Annavaram, Per Strenstrom All rights reserved
Identifying Phases from BBV BBV is very high dimension vector (1 entry per each unique
basic block) Clustering on high dimensions is extremely complex Dimension reduction using random linear projection Cluster using lower order projection vectors using k-means
20

© Michel Dubois, Murali Annavaram, Per Strenstrom All rights reserved
Parallel SimulationsParallel Simulations

© Michel Dubois, Murali Annavaram, Per Strenstrom All rights reserved
Organization Why is parallel simulation critical in future Improving parallel simulation speed using Slack Slacksim: Implementation of our parallel simulator Comparison of Slack Simulation Schemes on SlackSim Conclusion and Future Work

© Michel Dubois, Murali Annavaram, Per Strenstrom All rights reserved
CMP Simulation – A Major Design Bottleneck
Era of CMPs CMPs become mainstream (Intel, AMD, SUN…) Increasing core count
Simulation - a Crucial Tool of Architects Simulate a target design on an existing host system Explore design space Evaluate merit of design changes
Typically, Simulate All Target CMP Cores in a Single Host Thread (Single-threaded CMP simulation) When running the single-threaded simulator on a CMP
host, only one core is utilized Increasing gap between target core count and
simulation speed using one host core

© Michel Dubois, Murali Annavaram, Per Strenstrom All rights reserved
Parallel Simulation Parallel Discrete Event Simulation (PDES)
Conservative- Barrier synchronization- Lookahead
Optimistic (checkpoint and rollback)- Time Warp
WWT and WWT II Multi-processor simulator Conservative quantum-based synchronization Compared to SlackSim
- SlackSim provides higher simulation speed- SlackSim provides new trade-offs between simulation speed and accuracy- Slack is not limited by target architecture’s critical latency

© Michel Dubois, Murali Annavaram, Per Strenstrom All rights reserved
Multithreaded Simulation Schemes Simulate a Subset of Target Cores per Each
Host Thread (Multi-threaded CMP Simulation)
Problem: How to synchronize the interactions between multiple target cores?
Cycle-by-cycle Synchronizes all threads at end of every simulated cycle Simulation more accurate (not necessarily 100%
accurate due to time dilation!) Improves speed compared to single thread But, still suffers from numerous synchronization
overheads and scalability issue
P1P2P3P4
1 5 642 3 End
(a)Simulation Time
Global Time

© Michel Dubois, Murali Annavaram, Per Strenstrom All rights reserved
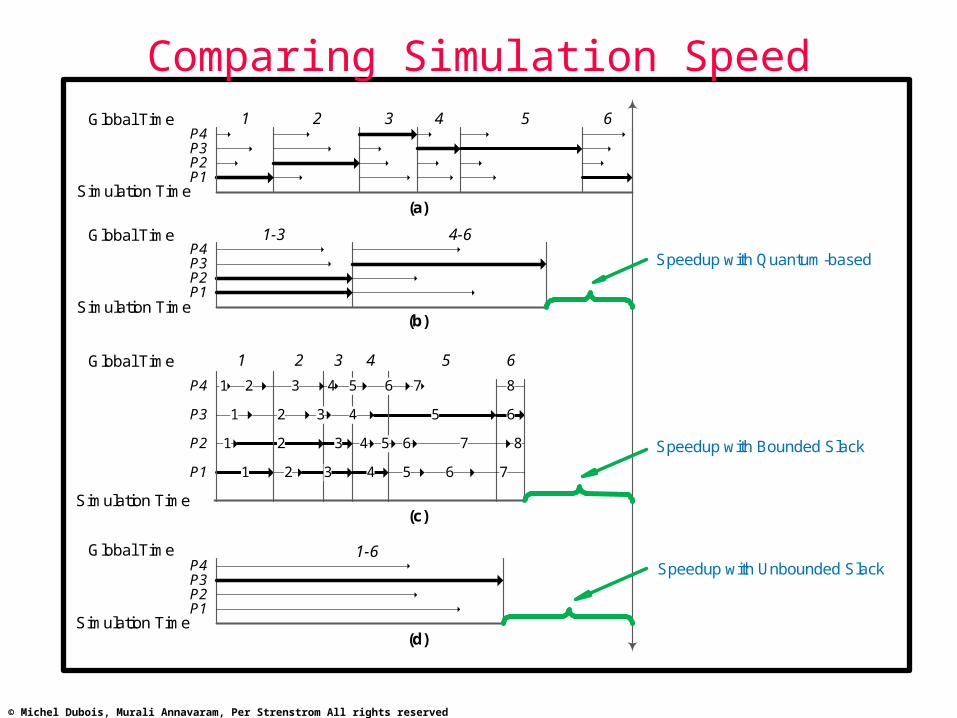
Quantum-based Simulation Schemes
Critical Latency Shortest delay between any two communicating threads (typically L2
cache access latency in CMPs) Quantum-based
Synchronize all threads at end of a few simulated cycles (quantum)
Guarantees cycle-by-cycle equivalent accuracy if quantum is smaller than the shortest delay (critical latency) between two communicating threads
As the communication delays between threads reduces (as is the case in CMPs) quantum size must be reduced
1-3
(b)
P1P2P3P4
4-6 End
Simulation Time
Global Time
© Michel Dubois, Murali Annavaram, Per Strenstrom All rights reserved
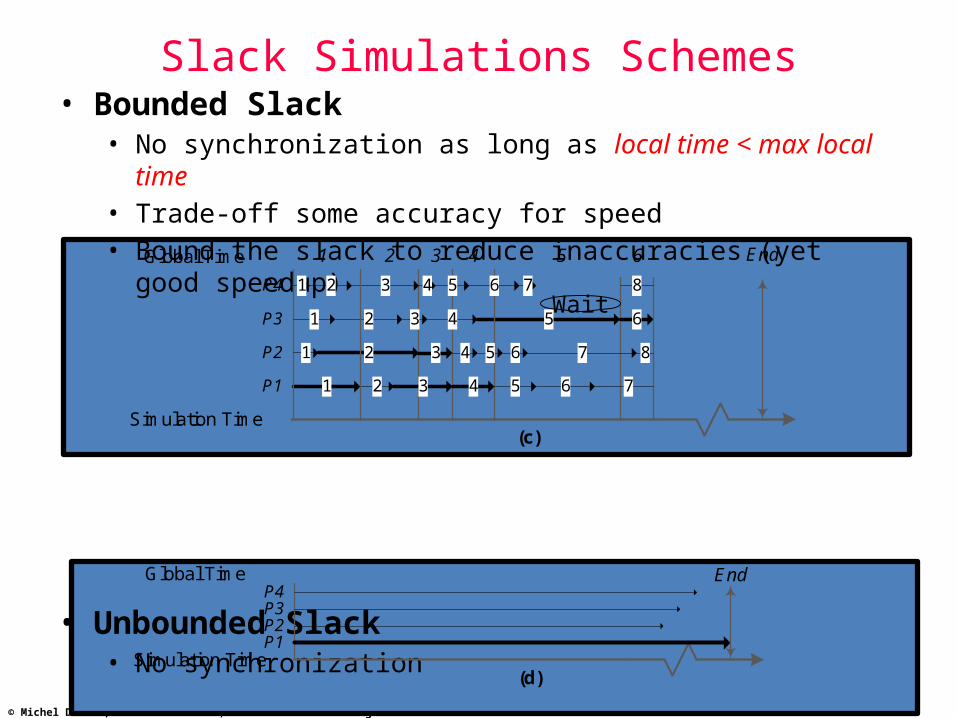
Slack Simulations Schemes• Bounded Slack
• No synchronization as long as local time < max local time
• Trade-off some accuracy for speed• Bound the slack to reduce inaccuracies (yet good
speedup)
• Unbounded Slack• No synchronization
5
1P1
P2
P3
P4
1
1
1 2
2
2
2
3
3
3
3
5
4
4
4
4
4
(c)Simulation Time
321
6 7
5
5
5
6
6
Global Time
6
8
7
8
6
7
End
Simulation Time(d)
P1P2P3P4
EndGlobal Time
Wait
© Michel Dubois, Murali Annavaram, Per Strenstrom All rights reserved
Comparing Simulation Speed
P1P2P3P4
1 5 642 3
(a)
1-3
Simulation Time
(b)
P1P2P3P4
4-6
Simulation Time
Global Time
Global Time
5
1P1
P2
P3
P4
1
1
1 2
2
2
2
3
3
3
3
5
4
4
4
4
4
(c)Simulation Time
321
6 7
5
5
5
6
6
Global Time
6
8
7
8
6
7
(d)
P1P2P3P4
Simulation Time
Global Time 1-6
Speedup with Quantum-based
Speedup with Bounded Slack
Speedup with Unbounded Slack

© Michel Dubois, Murali Annavaram, Per Strenstrom All rights reserved
Simulation Speedup Simulate 8-core target CMP on 2, 4, or 8-core host
CMP Baseline : 8-core target CMP on one host core Average Speedup of Barnes, FFT, LU, and Water-
Nsquared Computed with the Harmonic Mean As host core count increases the gap between the
simulation speed of target cores widens
2 4 80.0
1.0
2.0
3.0
4.0
5.0
6.0
7.0
8.0
CC Q10 S9 S100 SU
Number of host cores
Ave
rage
Spe
edup

April 28, 2003 Mikko Lipasti--University of Wisconsin
Nondeterministic Workloads
Source of nondeterminism: Interrupts (e.g. due to constant disk latency)
O/S scheduling perturbed No longer a scientific controlled
experiment How do we compare performance?
ta
tb
Interrupt
ta
tb
Interrupt tc

April 28, 2003 Mikko Lipasti--University of Wisconsin
Nondeterministic Workloads
Source of nondeterminism: Data races (e.g. RAW becomes WAR)
td observes older version, not from tb IPC not a meaningful metric
Workload-specific high-level measures of work
These suffer from cold start and end effects
tc
td
ta
tb
RAW
tc
td
ta
tb
WAR
te

Mikko H. Lipasti--University of Wisconsin
Spatial Variability
SPECjbb 16 warehouses on 16p PowerPC SMP, 400 ops/wh Study effect of 10% variation in memory latency Same end-to-end work, 40% variation in cycles, instructions
Mikko H. Lipasti--University of Wisconsin
Spatial Variability The problem: variability due to (minor) machine changes
Interrupts, thread synchronization differ in each experiment Result: A different set of instructions retire in every simulation Cannot use conventional performance metrics (e.g. IPC, miss
rates) Must measure work and count cycles per unit of work
Work: transaction, web interaction, database query Modify workload to count work, signal simulator when work
complete
Simulate billions of instructions to overcome cold start and end effects
One solution: statistical simulation [Alameldeen et al., 2003]
Simulate same interval n times with random perturbations n determined by coefficient of variation and desired confidence
interval Problem: for small relative error, n can be very large
Simulate n x billions of instructions per experiment

Mikko H. Lipasti--University of Wisconsin
A Better Solution Eliminate spatial variability
[Lepak, Cain, Lipasti, PACT 2003]
Force each experiment to follow same path Record control “trace” Inject stall time to prevent deviation from trace
Bound sacrifice in fidelity with injected stall time Enable comparisons with single simulation at
each point
Simulate 10s of millions of instructions per experiment
Mikko H. Lipasti--University of Wisconsin
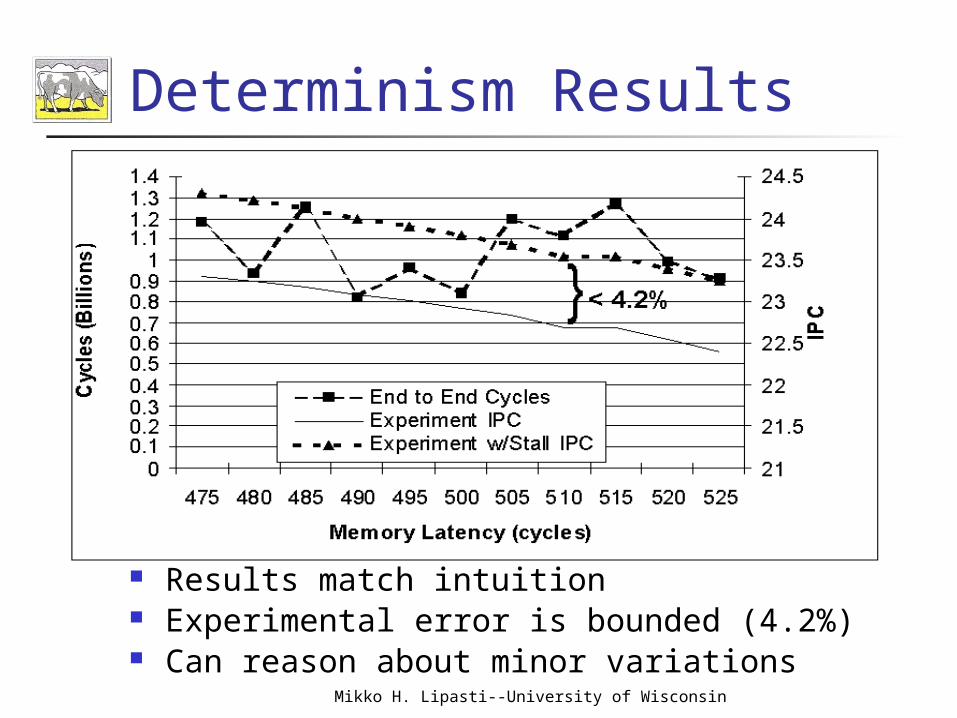
Determinism Results
Results match intuition Experimental error is bounded (4.2%) Can reason about minor variations

Mikko H. Lipasti--University of Wisconsin
Conclusions Spatial variability complicates
multithreaded program performance evaluation
Enforcing determinism enables: Relative comparisons with a single simulation Immunity to start/end effects Use of conventional performance metrics Avoid cumbersome workload-specific setup
Bound error with injected delay
AMD has already adopted determinism

© Michel Dubois, Murali Annavaram, Per Strenstrom All rights reserved
CHAPTER 9Simulation Methods
• SIMULATION METHODS
• SIMPOINTS
• PARALLEL SIMULATIONS
• NONDETERMINISM