“ liquidity, liquidity everywhere but not a drop to drink liquidity, liquidity everywhere and all...
Post on 19-Dec-2015
240 views
TRANSCRIPT
“Liquidity, Liquidity EverywhereBut Not a Drop to Drink
Liquidity, Liquidity Everywhereand all the Banks did Shrink”
With sincere apologies Samuel Coleridge and the Rime of the Ancient Mariner
Professor Michael PalmerPresentation to Schnitzer West, LLC
Seattle, WashingtonSeptember 24, 2008
Quick Bio
• Michael Palmer, Professor of Finance, Leeds School of Business, University of Colorado.
• Education: Ph.D. University of Washington, 1967 (Finance and Macro-economics)
• Visiting Professor Status: Kansai Gaidai University, Osaka, Japan; Jiao Tong University, Shanghai, China; Semester at Sea
• Academic Director: London Seminar in International Finance
Punch Line
• We have experienced an unprecedented freezing of global financial markets which is now affecting real economic activity.– Financial markets are showing some sign of
thawing, but is it too little and too late to avoid a major global slowdown?
Theme #1
• Current financial crisis is not a liquidity crisis!
Liquidity is Not the Issue
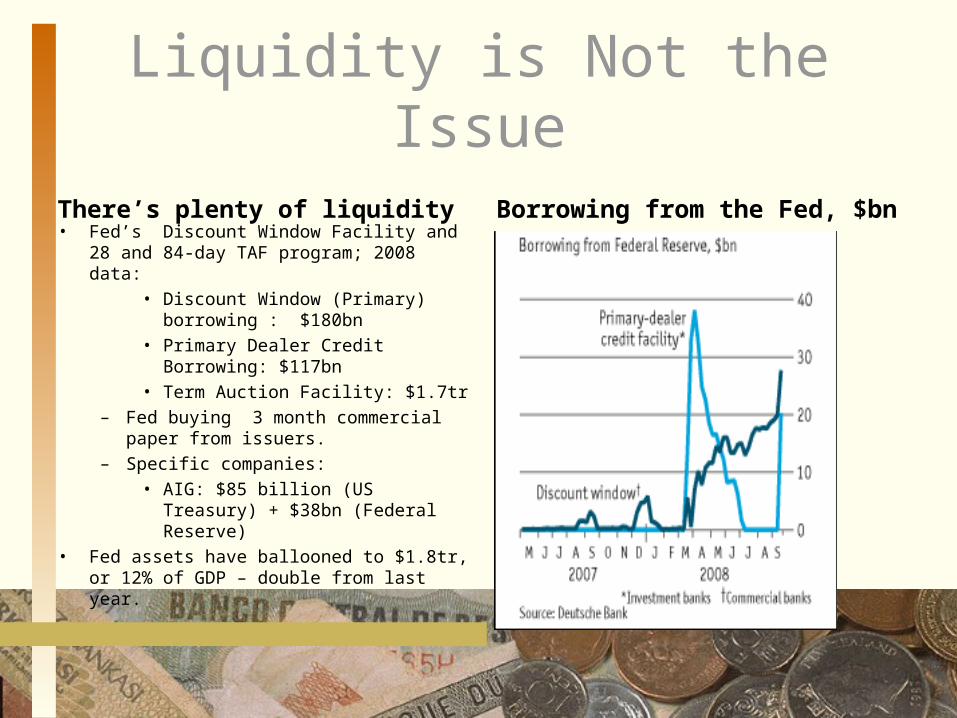
There’s plenty of liquidity• Fed’s Discount Window Facility and 28 and
84-day TAF program; 2008 data:• Discount Window (Primary)
borrowing : $180bn• Primary Dealer Credit Borrowing:
$117bn• Term Auction Facility: $1.7tr
– Fed buying 3 month commercial paper from issuers.
– Specific companies:• AIG: $85 billion (US Treasury) +
$38bn (Federal Reserve)• Fed assets have ballooned to $1.8tr, or 12%
of GDP – double from last year.
Borrowing from the Fed, $bn
Foreign Central Banks and Governments have also Expanded Liquidity
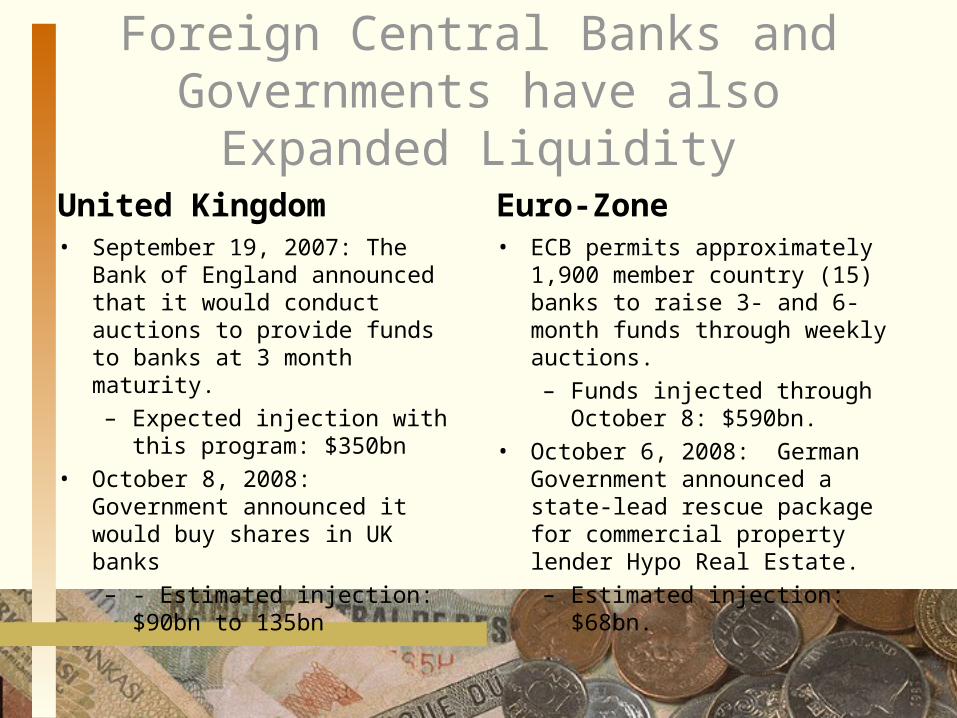
United Kingdom• September 19, 2007: The Bank of
England announced that it would conduct auctions to provide funds to banks at 3 month maturity.
– Expected injection with this program: $350bn
• October 8, 2008: Government announced it would buy shares in UK banks
– - Estimated injection: $90bn to 135bn
Euro-Zone• ECB permits approximately 1,900
member country (15) banks to raise 3- and 6-month funds through weekly auctions.
– Funds injected through October 8: $590bn.
• October 6, 2008: German Government announced a state-lead rescue package for commercial property lender Hypo Real Estate.
– Estimated injection: $68bn.
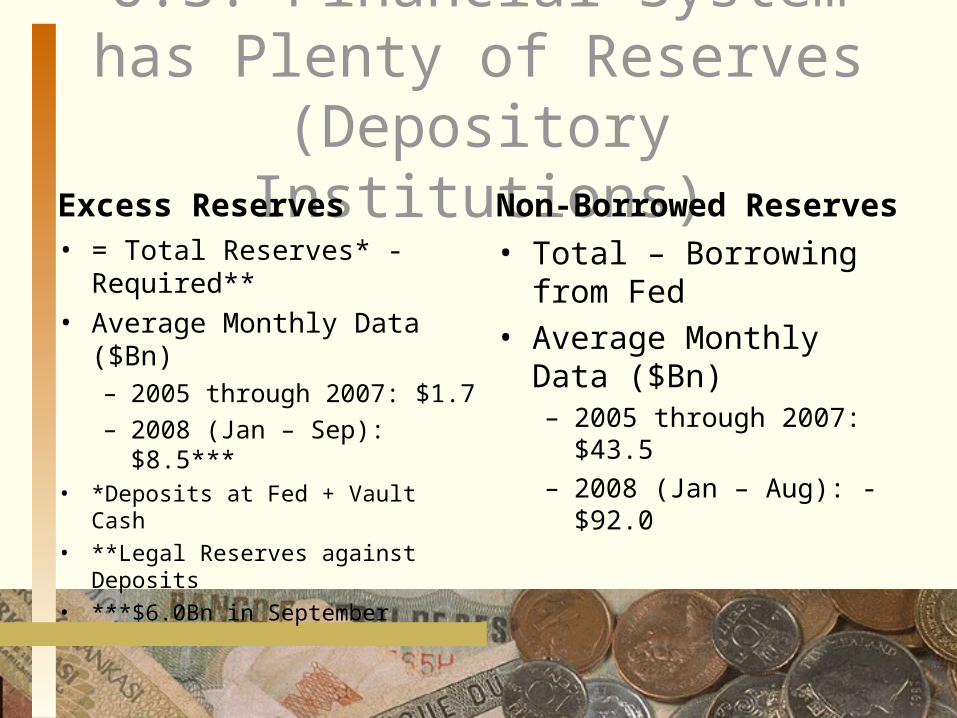
U.S. Financial System has Plenty of Reserves (Depository Institutions)
Excess Reserves• = Total Reserves* - Required**• Average Monthly Data ($Bn)
– 2005 through 2007: $1.7– 2008 (Jan – Sep): $8.5***
• *Deposits at Fed + Vault Cash• **Legal Reserves against Deposits• ***$6.0Bn in September
Non-Borrowed Reserves
• Total – Borrowing from Fed
• Average Monthly Data ($Bn)
– 2005 through 2007: $43.5– 2008 (Jan – Aug): -$92.0
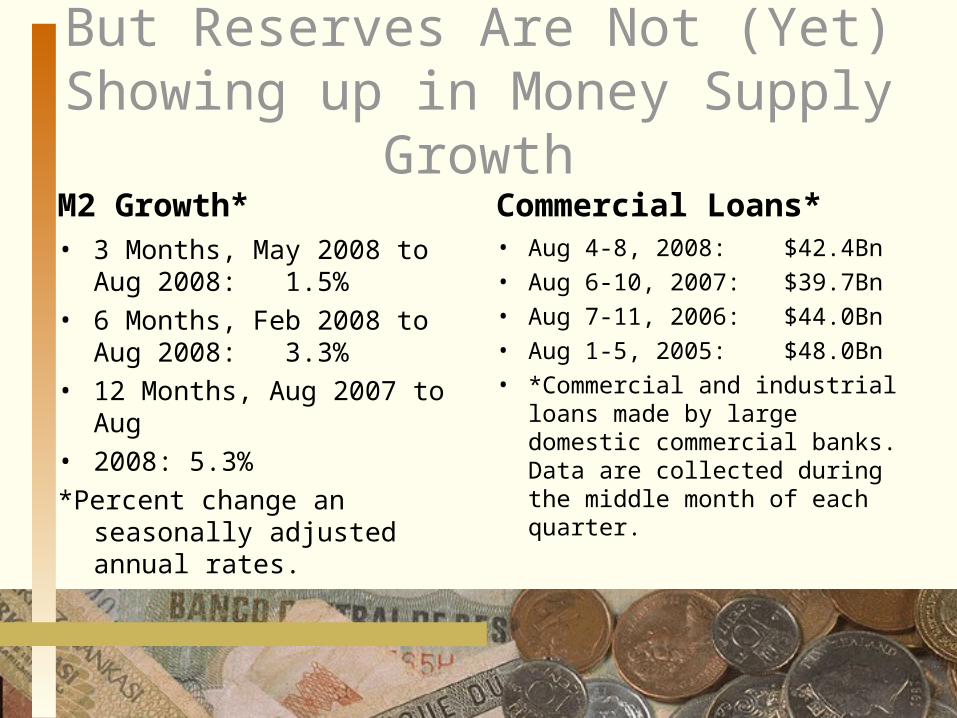
But Reserves Are Not (Yet) Showing up in Money Supply Growth
M2 Growth*• 3 Months, May 2008 to Aug
2008: 1.5%• 6 Months, Feb 2008 to Aug
2008: 3.3%• 12 Months, Aug 2007 to Aug• 2008: 5.3%
*Percent change an seasonally adjusted annual rates.
Commercial Loans*• Aug 4-8, 2008: $42.4Bn• Aug 6-10, 2007: $39.7Bn• Aug 7-11, 2006: $44.0Bn• Aug 1-5, 2005: $48.0Bn• *Commercial and industrial
loans made by large domestic commercial banks. Data are collected during the middle month of each quarter.
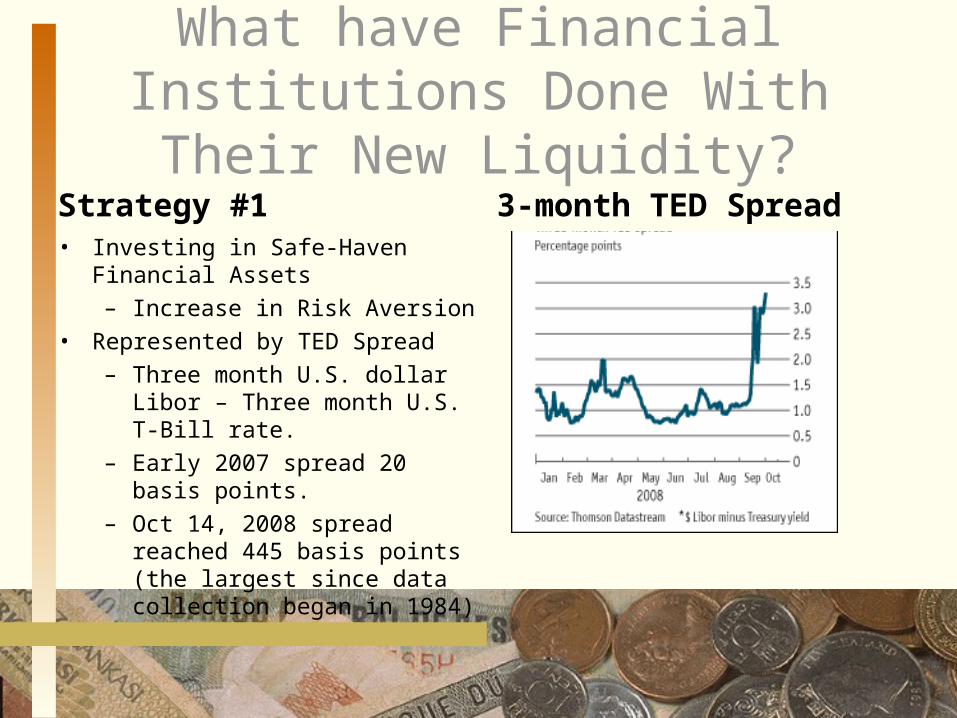
What have Financial Institutions Done With Their New Liquidity?
Strategy #1• Investing in Safe-Haven Financial
Assets– Increase in Risk Aversion
• Represented by TED Spread– Three month U.S. dollar Libor –
Three month U.S. T-Bill rate.– Early 2007 spread 20 basis
points.– Oct 14, 2008 spread reached 445
basis points (the largest since data collection began in 1984)
3-month TED Spread
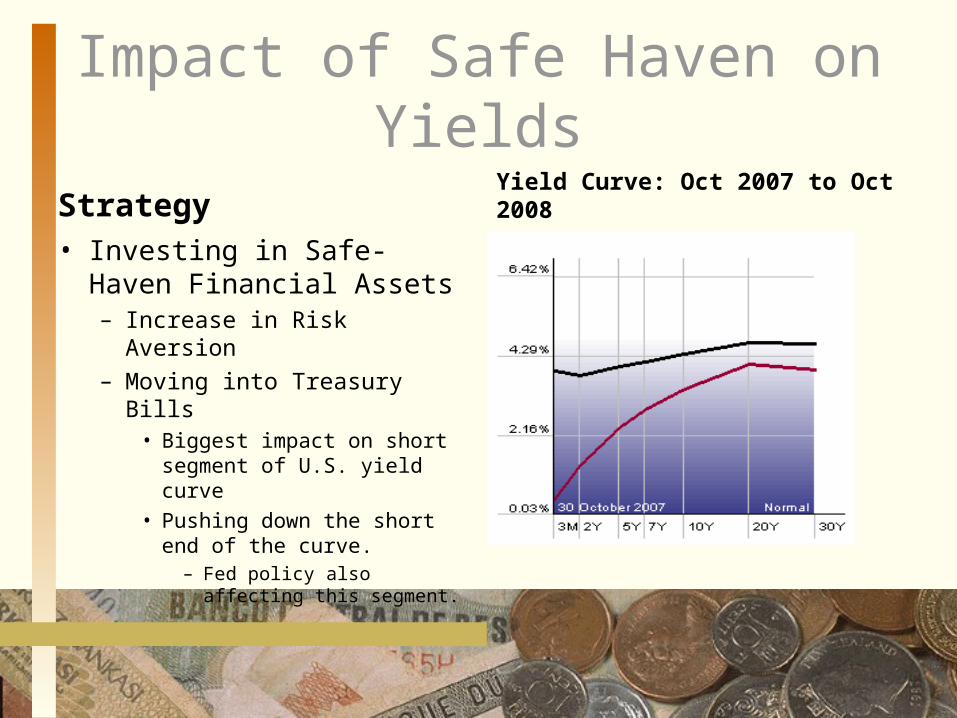
Impact of Safe Haven on Yields
Strategy
• Investing in Safe-Haven Financial Assets
– Increase in Risk Aversion– Moving into Treasury Bills
• Biggest impact on short segment of U.S. yield curve
• Pushing down the short end of the curve.
– Fed policy also affecting this segment.
Yield Curve: Oct 2007 to Oct 2008
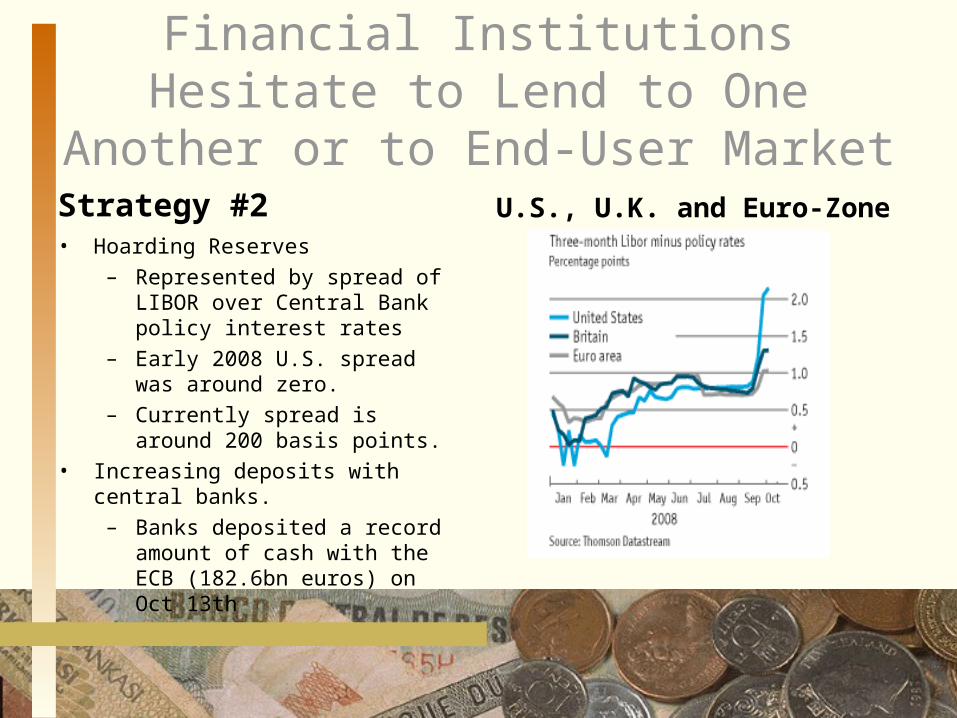
Financial Institutions Hesitate to Lend to One Another or to End-User Market
Strategy #2• Hoarding Reserves
– Represented by spread of LIBOR over Central Bank policy interest rates
– Early 2008 U.S. spread was around zero.
– Currently spread is around 200 basis points.
• Increasing deposits with central banks.– Banks deposited a record amount
of cash with the ECB (182.6bn euros) on Oct 13th
U.S., U.K. and Euro-Zone
Financial Institutions Are Increasing their Deposits with Central Banks
• In addition to investing in safe haven assets, commercial banks are also increasing their deposit holdings at their respective central banks.
• ECB data:– Friday, Oct 10, 2008: Bank deposits with ECB
totaled 154.7Bn euros.– Monday, Oct 14, 2008: Bank deposits with
ECB totaled a record 182.8Bn euros.
Theme #2
• Current financial crisis has little to do with interest rates!
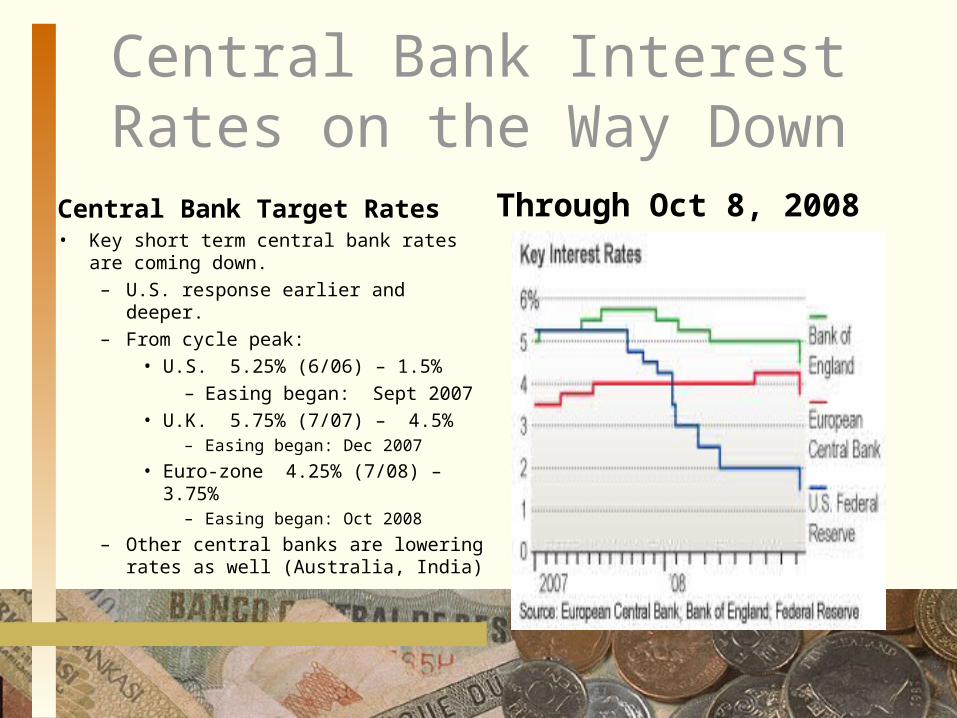
Central Bank Interest Rates on the Way Down
Central Bank Target Rates• Key short term central bank rates are
coming down.– U.S. response earlier and deeper.– From cycle peak:
• U.S. 5.25% (6/06) – 1.5%– Easing began: Sept 2007
• U.K. 5.75% (7/07) – 4.5%– Easing began: Dec 2007
• Euro-zone 4.25% (7/08) – 3.75%– Easing began: Oct 2008
– Other central banks are lowering rates as well (Australia, India)
Through Oct 8, 2008
Are European Central Banks Abandoning their Inflation Targets?
Bank of England– Inflation targeting adopted in
May 1997 and set by Government.
– Current CPI Inflation target: 2.0%
– Current inflation (Oct): 4.7%– Bank of England “seeks to meet
the inflation target by setting an interest rate.”
European Central Bank– Inflation targeting adopted in
1997 through an amendment to original treaty of Rome.
– Inflation target: “Below, but close to, 2% over the medium term.”
– Current CPI inflation (June – Aug): 3.9%
– ECB meets their inflation target through setting an “appropriate level of the key interest rates.”
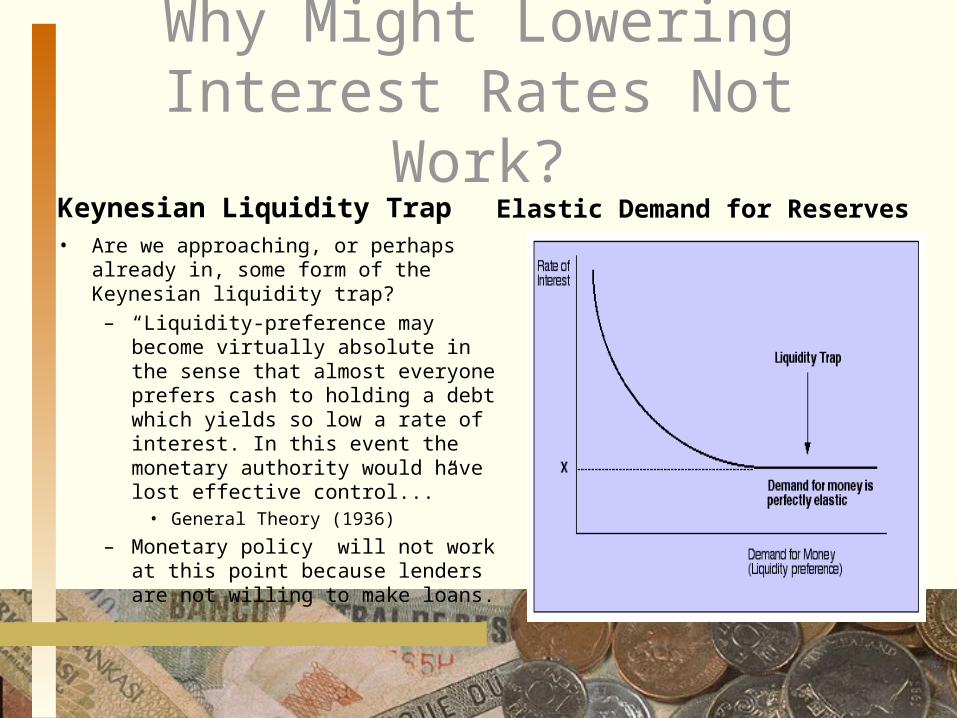
Why Might Lowering Interest Rates Not Work?
Keynesian Liquidity Trap• Are we approaching, or perhaps already in,
some form of the Keynesian liquidity trap?– “Liquidity-preference may become
virtually absolute in the sense that almost everyone prefers cash to holding a debt which yields so low a rate of interest. In this event the monetary authority would have lost effective control...”
• General Theory (1936)
– Monetary policy will not work at this point because lenders are not willing to make loans.
Elastic Demand for Reserves
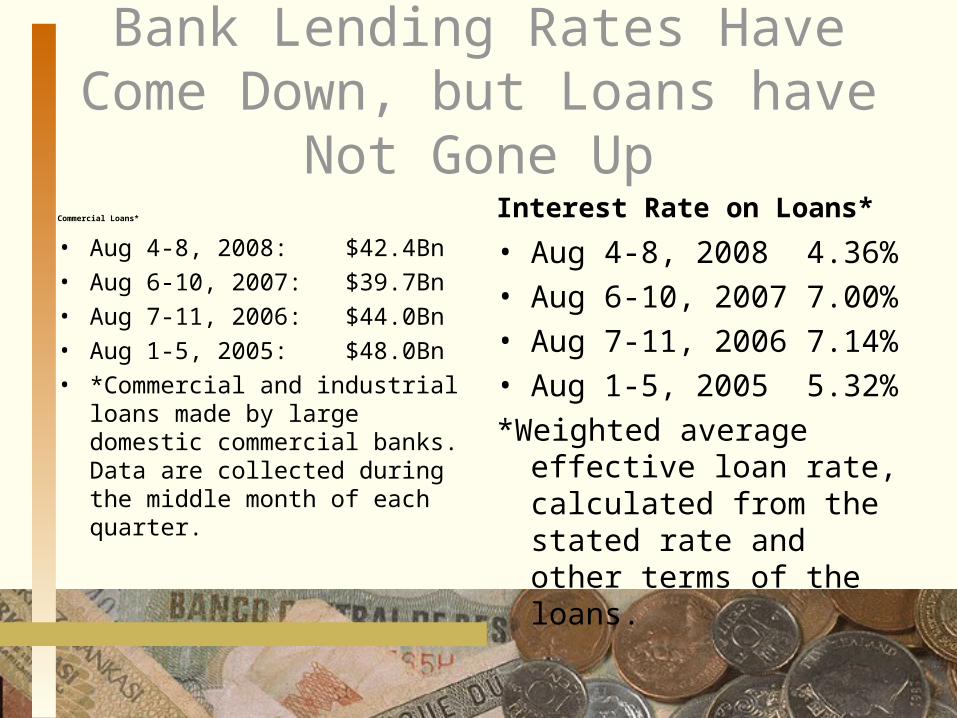
Bank Lending Rates Have Come Down, but Loans have Not Gone Up
Commercial Loans*
• Aug 4-8, 2008: $42.4Bn• Aug 6-10, 2007: $39.7Bn• Aug 7-11, 2006: $44.0Bn• Aug 1-5, 2005: $48.0Bn• *Commercial and industrial
loans made by large domestic commercial banks. Data are collected during the middle month of each quarter.
Interest Rate on Loans*
• Aug 4-8, 20084.36%• Aug 6-10, 2007
7.00%• Aug 7-11, 2006
7.14%• Aug 1-5, 20055.32%
*Weighted average effective loan rate, calculated from the stated rate and other terms of the loans.
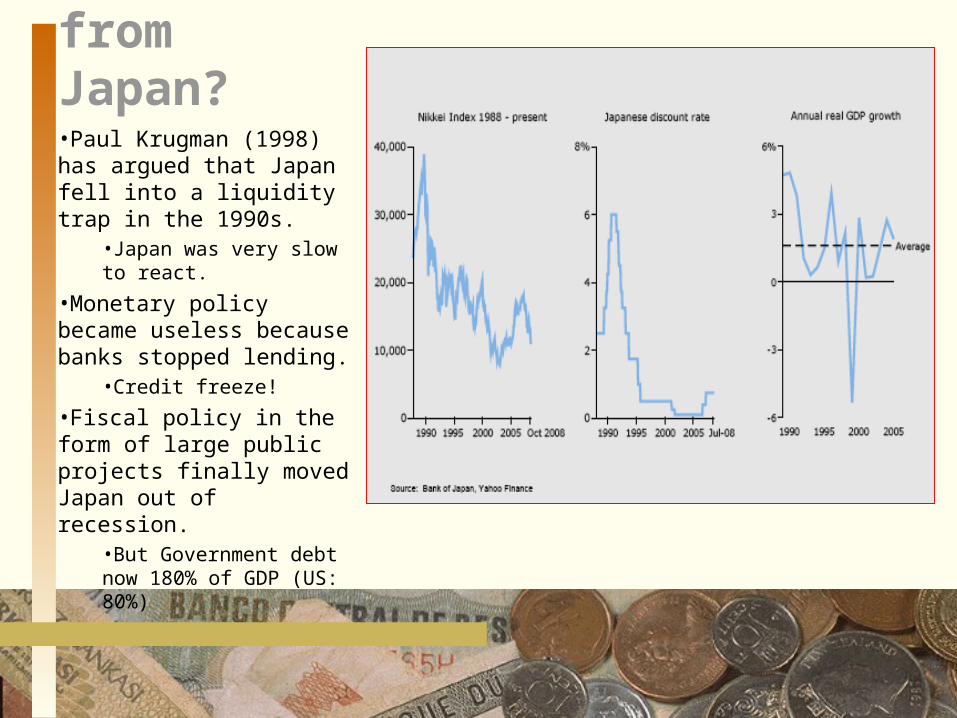
Lessons from Japan?•Paul Krugman (1998) has argued that Japan fell into a liquidity trap in the 1990s.
•Japan was very slow to react.
•Monetary policy became useless because banks stopped lending.
•Credit freeze!
•Fiscal policy in the form of large public projects finally moved Japan out of recession.
•But Government debt now 180% of GDP (US: 80%)
Theme #3
• Authorities seem to be treating the current crisis (in varying degrees) as an liquidity problem.– Fed of New York (Oct 8), announcing an
additional $37.8bn for AIG stated: This new action will help AIG “replenish liquidity…”
• But, the current crisis is about(1) insolvency concerns and a resulting (2) credit freeze!
• It’s really about a loss of confidence.
Interbank Lending is the Problem
• Domestic and interbank lending markets are frozen.– Liquidity is there, but banks have been
reluctant to lend to one another.• Federal funds market.• LIBOR market.
What is LIBOR and why is it Important?
• LIBOR: The London Interbank Offer Rate is the interest rate that large banks charge one another for 10 foreign currency denominated loans (deposits) ranging from overnight out to 12 months.– Set each day in London around noon through the BBA by
a representative panel of commercial banks.– US dollar LIBOR the most important.
• It is estimated that $360tr of financial products worldwide, from mortgages to company loans and derivates, is tied to a LIBOR rate.– Other regional markets have similar interbank rates
(HIBOR, in Hong Kong).
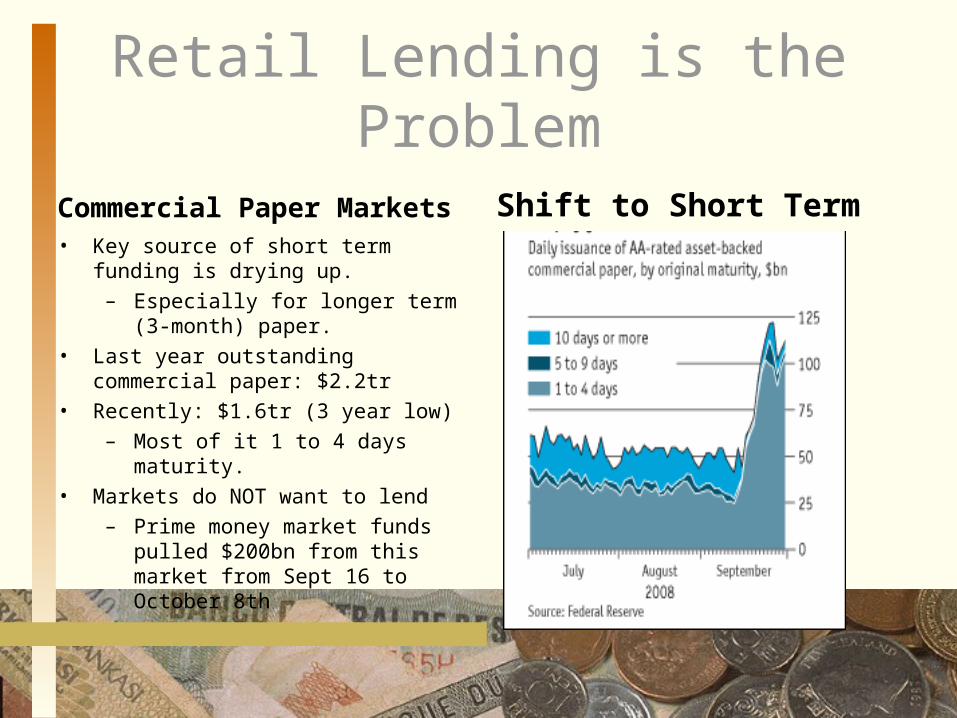
Retail Lending is the Problem
Commercial Paper Markets• Key source of short term funding is
drying up.– Especially for longer term (3-
month) paper.• Last year outstanding commercial
paper: $2.2tr• Recently: $1.6tr (3 year low)
– Most of it 1 to 4 days maturity.• Markets do NOT want to lend
– Prime money market funds pulled $200bn from this market from Sept 16 to October 8th
Shift to Short Term
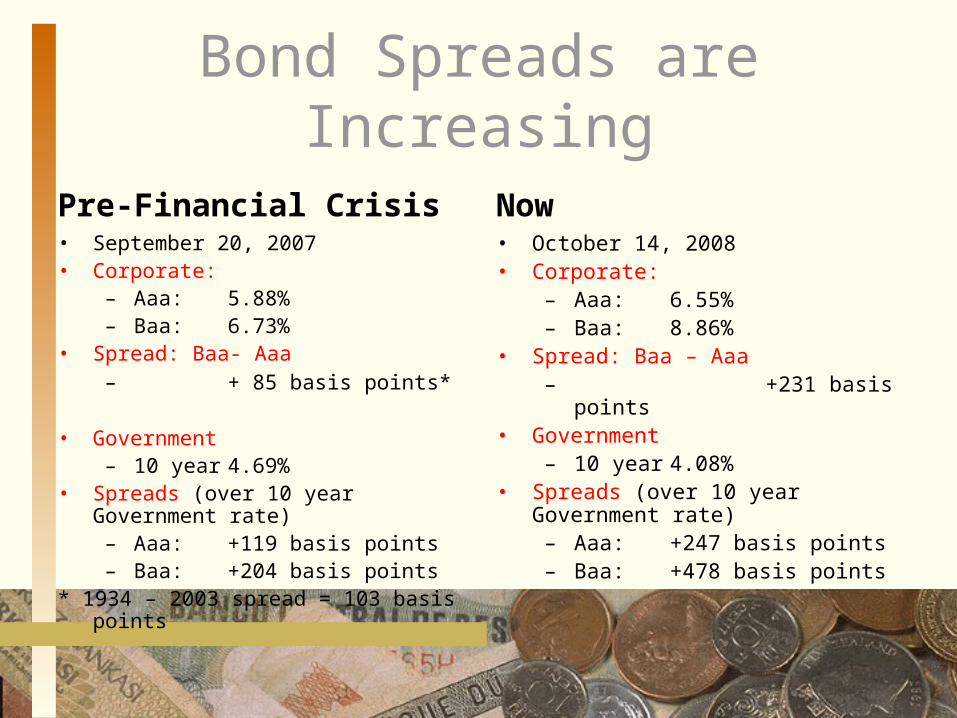
Bond Spreads are Increasing
Pre-Financial Crisis• September 20, 2007• Corporate:
– Aaa: 5.88%– Baa: 6.73%
• Spread: Baa- Aaa– + 85 basis
points*• Government
– 10 year 4.69%• Spreads (over 10 year Government rate)
– Aaa: +119 basis points– Baa: +204 basis points
* 1934 – 2003 spread = 103 basis points
Now• October 14, 2008• Corporate:
– Aaa: 6.55%– Baa: 8.86%
• Spread: Baa – Aaa– +231 basis
points• Government
– 10 year 4.08%• Spreads (over 10 year Government rate)
– Aaa: +247 basis points– Baa: +478 basis points
U.S. Bond Markets• U.S. corporate bond sales were at their lowest September
level since 2000.– September 2008: $11.7bn– September 2007: $32.7bn
• “Corporate borrowing options have dwindles as the investment grade bond market (Baa and above) remained all but closed for a fifth week.” (Bloomberg, Oct 8)
– Companies like Gannett (the largest newspaper company in the U.S.) and Southern have had to forego issuing debt.
– The new issue market is especially troubling for financial firms, which have about $145 billion in fixed- and floating rate debt maturing in the rest of 2008, according to JPMorgan data.
– Overall corporate bond spreads have hit record highs , closing on October 2 at 339 basis points, up from 317 at the start of the month.
Theme #4
• Until we understand the current situation, we cannot offer appropriate and lasting solutions.
Financial Markets• Financial markets work best when participants have
confidence in dealing with one another and with the “value” of the assets they are involved in.
• Today, confidence has broken down.– Confidence regarding the solvency of borrowers.– Confidence regarding the solvency of lenders.– Confidence regarding the “market-values” of financial
assets.– Confidence regarding the “tradability” of financial assets.– Confidence regarding the regulation of markets.– Confidence regarding policy makers.– Etc.
Lack of Confidence
• When confidence breaks down, financial markets cease to function (efficiently).
• Examples:– Interbank market – which has been regarded
as close to risk free- suddenly freezes up.– High investment grade companies are forced
out of the long term bond markets.– High investment grade companies struggle
to raise short term funds.
Will $700Bn Bailout Restore Confidence?
• On Oct 3, Congress passed a $700Bn bailout package.
• In and of itself will this restore confidence? I don’t think so.– Issue: What if “toxic” loans are removed from
the balance sheets of financial institutions?• Will the credit markets “unfreeze?”• Will the interbank market “unlock?”• Will financial institutions continue to seek “safe haven
investments?”
Will The Injection of Government Money into the Equity Position of Banks
Restore Confidence?• U.S. announced that they will inject $250Bn into
banks through the purchase of preferred stock.– What will banks do with these funds?– With this action, combined with the $700bn bailout,
there is the issue of “moral hazard.”• Essentially rewarding bad behavior and setting a precedent
for future bailouts.
• French model: (Oct 20) Announced that they would invest $13.99 billion (in subordinated debt) in the country's six biggest banks by year-end on condition that they increase lending to companies, households and local governments.
Will a More Globally Coordinated Policy Response Restore Confidence?
• Over the last two weeks, central banks have engaged in coordinated policy actions:– Central banks are taking equity positions in their big
banks.– FED, BOE, and ECB all lowered their key short term
target interest rate by 50 basis points.– Central banks have agreed to provide unlimited
dollar funds to financial institutions in Europe and Asia.
• Trying to bring down the overseas dollar rate.– Central banks are lending to corporate borrowers in
their money markets.
Key: Restoring Confidence • How might financial market confidence be
restored?– Greater transparency by all participants, but
especially:• Originators of new financial products.• Risk evaluation services.• Major financial institutions, include government
organizations.• Policy makers.
– Acting as lenders of last resort to end users.– Through globally coordinated action
Theme # 5: Looking at the Big Picture
• What About the Economy?– How Did we Get Where we Are Today?– Where Are we Today?– Where Are we Going?
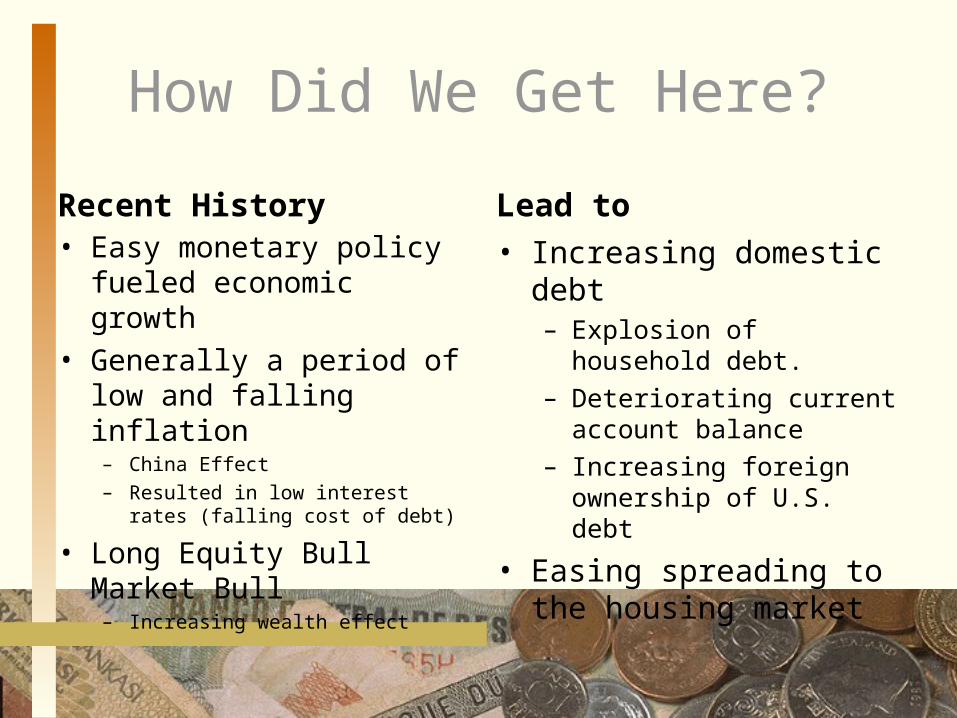
How Did We Get Here?
Recent History• Easy monetary policy
fueled economic growth• Generally a period of low
and falling inflation– China Effect– Resulted in low interest rates
(falling cost of debt)
• Long Equity Bull Market Bull
– Increasing wealth effect
Lead to
• Increasing domestic debt– Explosion of household
debt.– Deteriorating current
account balance– Increasing foreign
ownership of U.S. debt
• Easing spreading to the housing market
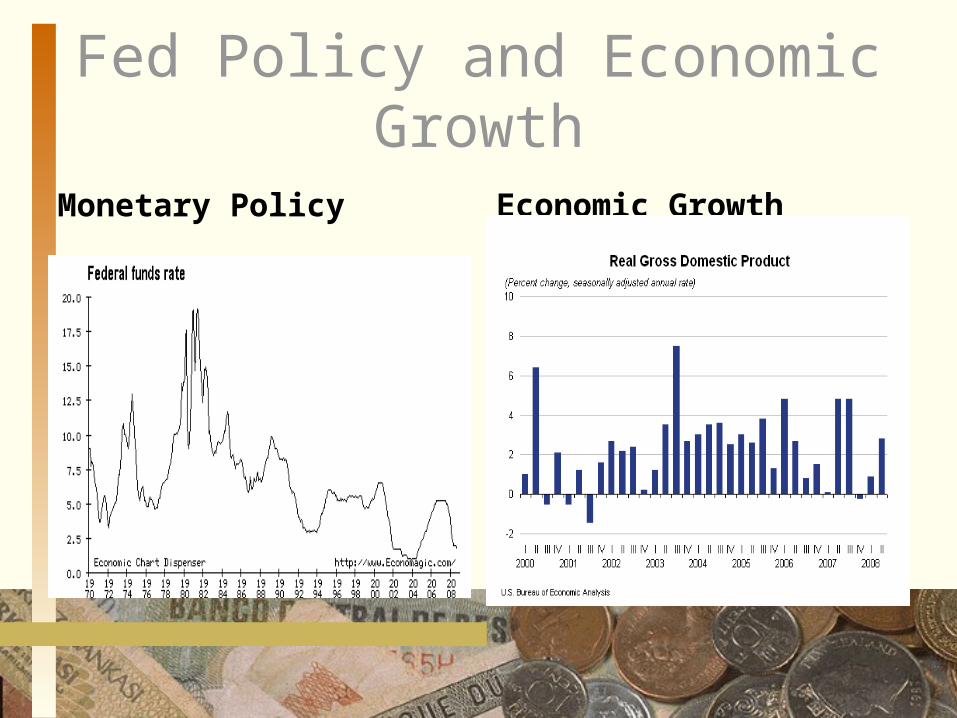
Fed Policy and Economic Growth
Monetary Policy Economic Growth
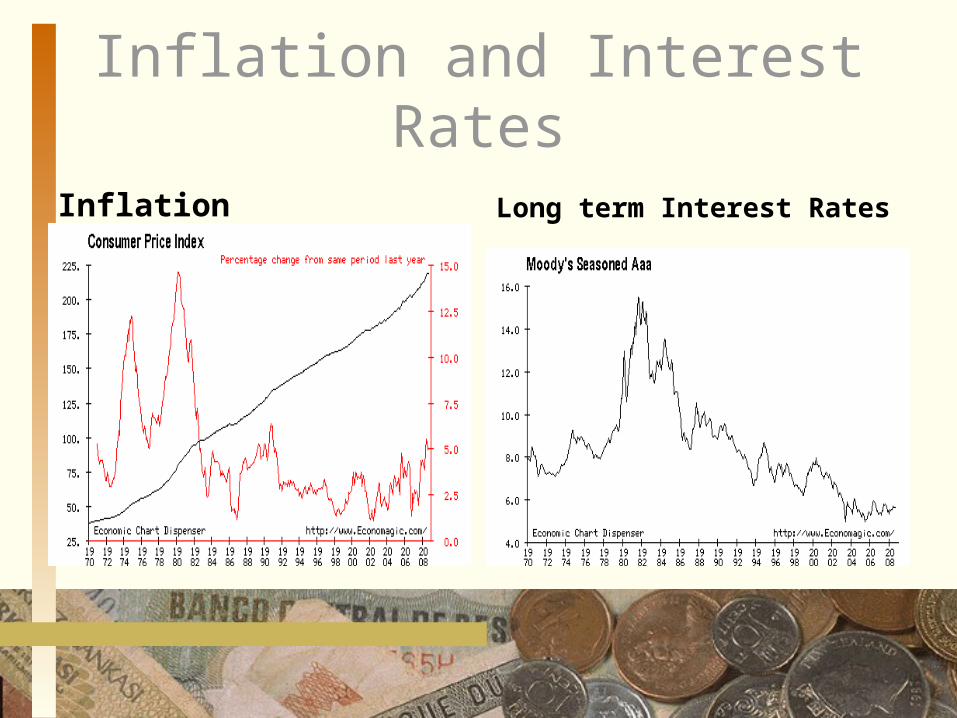
Inflation and Interest Rates
Inflation Long term Interest Rates
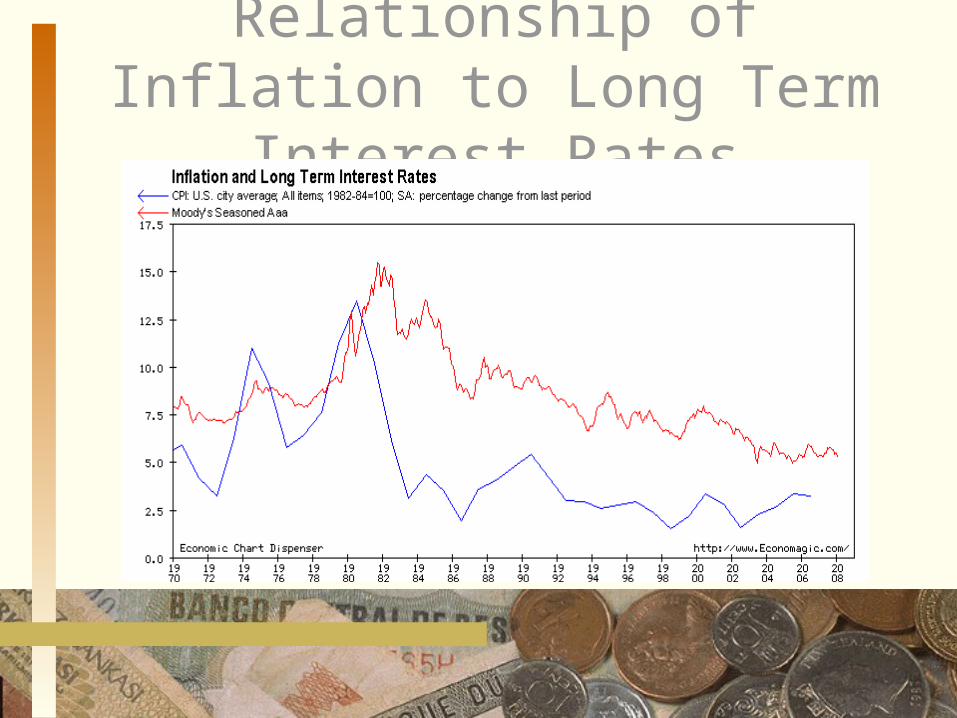
Relationship of Inflation to Long Term Interest Rates
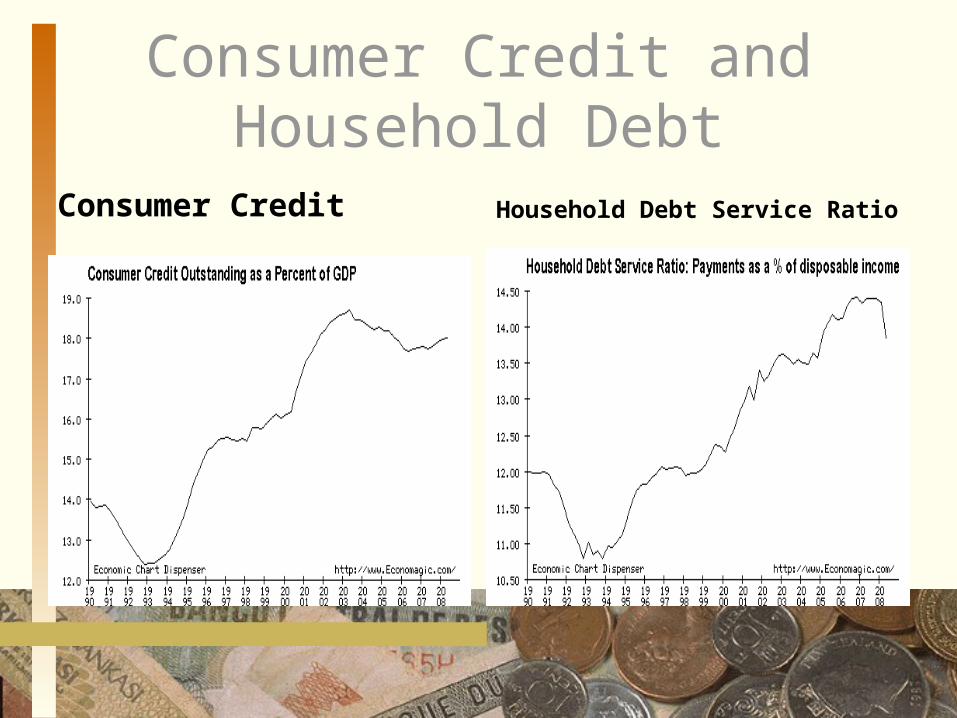
Consumer Credit and Household Debt
Consumer Credit Household Debt Service Ratio
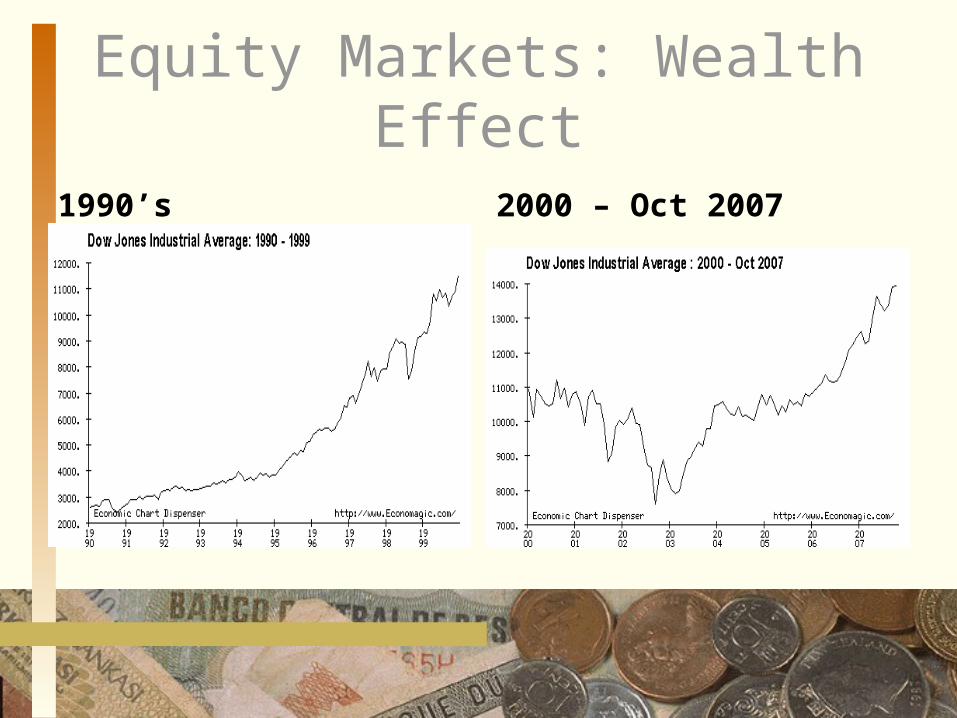
Equity Markets: Wealth Effect
1990’s 2000 – Oct 2007
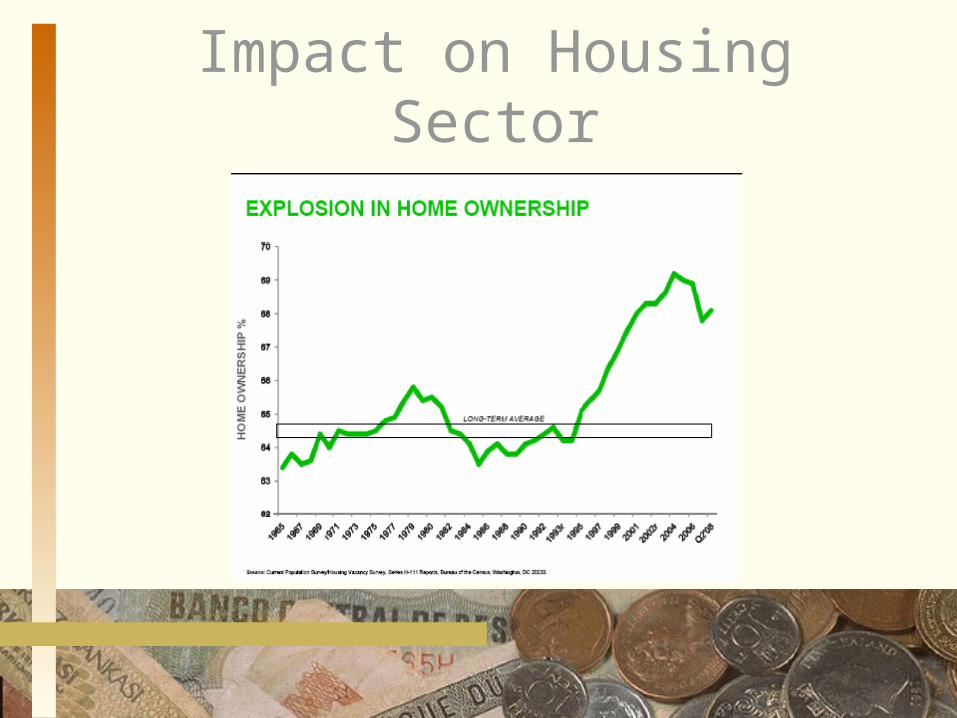
Impact on Housing Sector
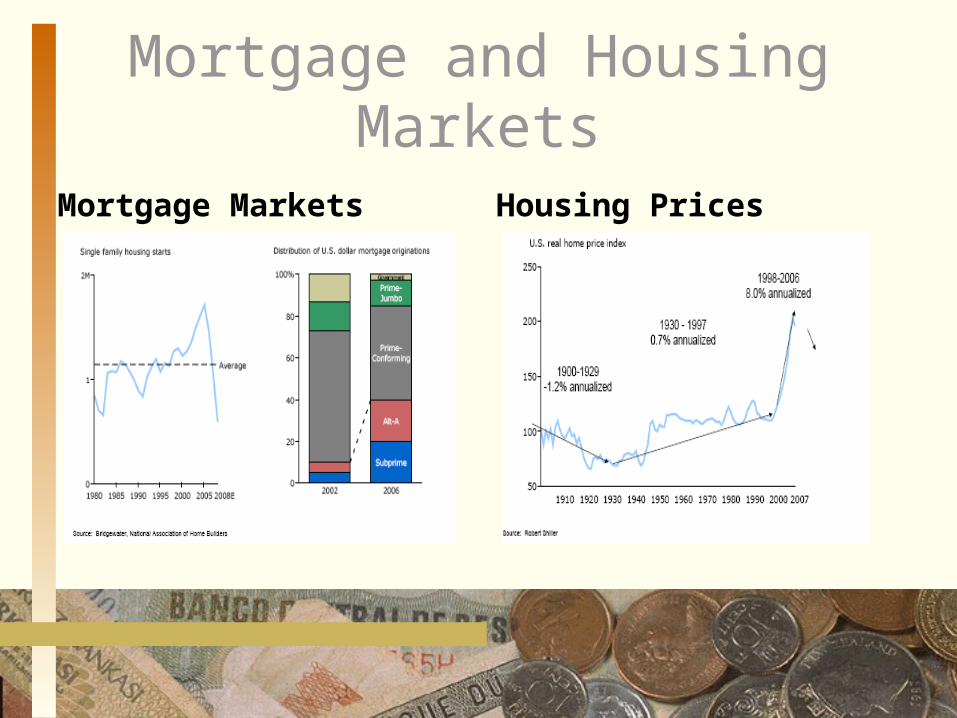
Mortgage and Housing Markets
Mortgage Markets Housing Prices
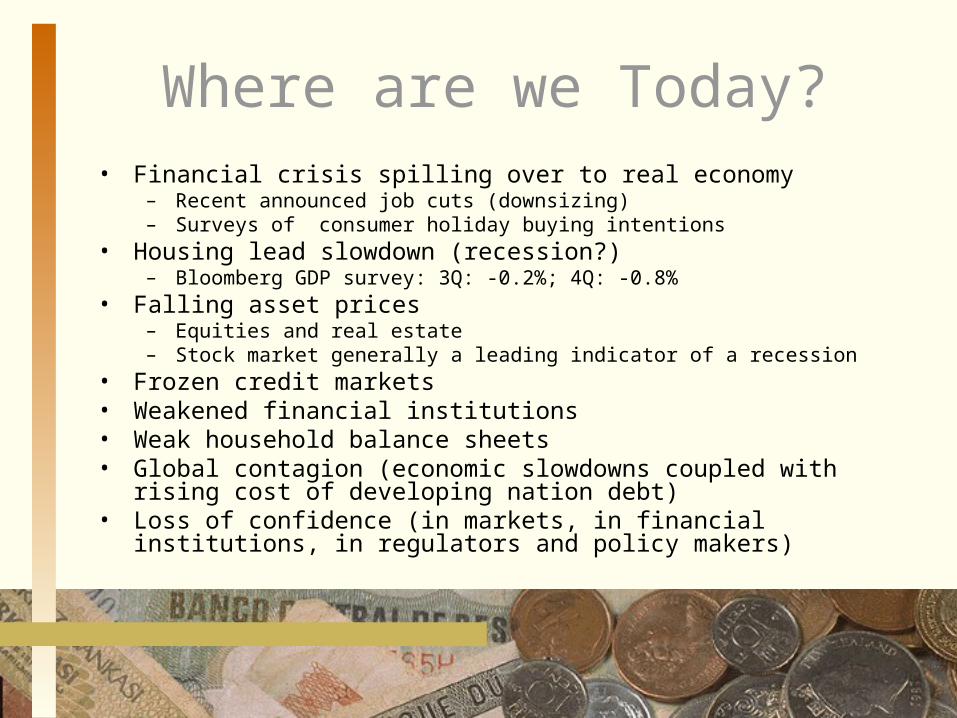
Where are we Today?• Financial crisis spilling over to real economy
– Recent announced job cuts (downsizing)– Surveys of consumer holiday buying intentions
• Housing lead slowdown (recession?)– Bloomberg GDP survey: 3Q: -0.2%; 4Q: -0.8%
• Falling asset prices– Equities and real estate– Stock market generally a leading indicator of a recession
• Frozen credit markets• Weakened financial institutions• Weak household balance sheets• Global contagion (economic slowdowns coupled with rising cost of
developing nation debt)• Loss of confidence (in markets, in financial institutions, in regulators and
policy makers)
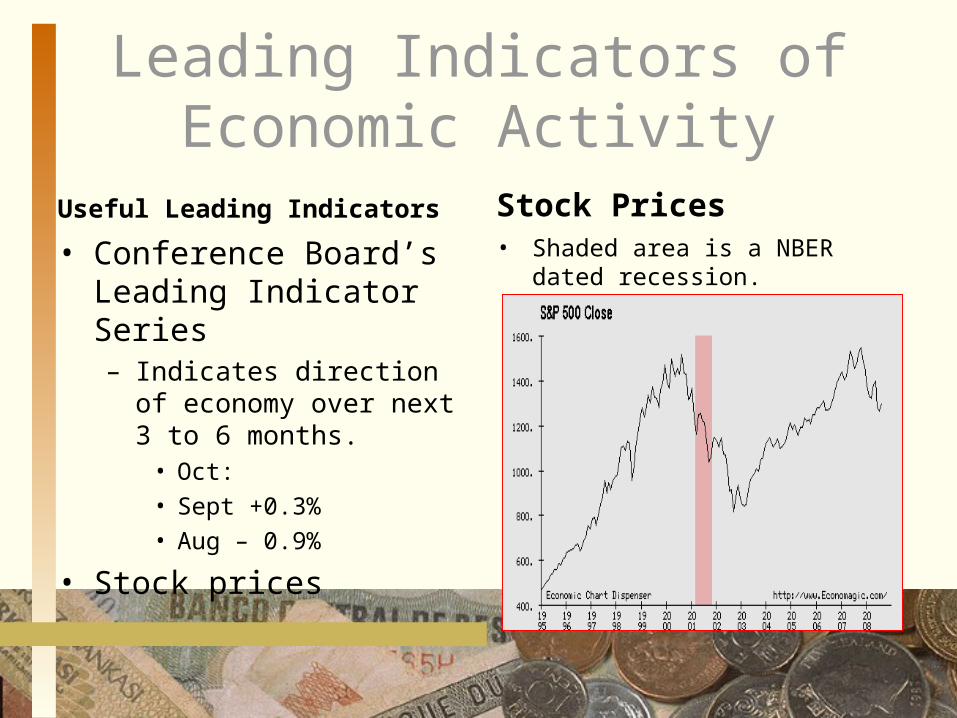
Leading Indicators of Economic Activity
Useful Leading Indicators
• Conference Board’s Leading Indicator Series
– Indicates direction of economy over next 3 to 6 months.
• Oct: • Sept +0.3%• Aug – 0.9%
• Stock prices
Stock Prices• Shaded area is a NBER dated
recession.
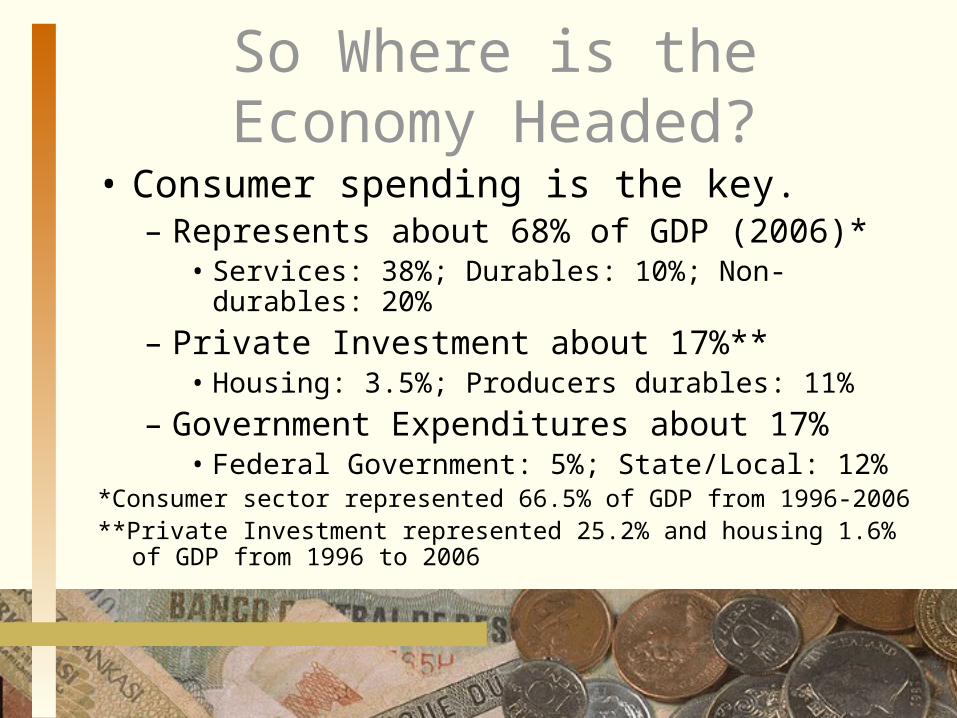
So Where is the Economy Headed?
• Consumer spending is the key.– Represents about 68% of GDP (2006)*
• Services: 38%; Durables: 10%; Non-durables: 20%
– Private Investment about 17%**• Housing: 3.5%; Producers durables: 11%
– Government Expenditures about 17%• Federal Government: 5%; State/Local: 12%
*Consumer sector represented 66.5% of GDP from 1996-2006**Private Investment represented 25.2% and housing 1.6% of GDP from
1996 to 2006
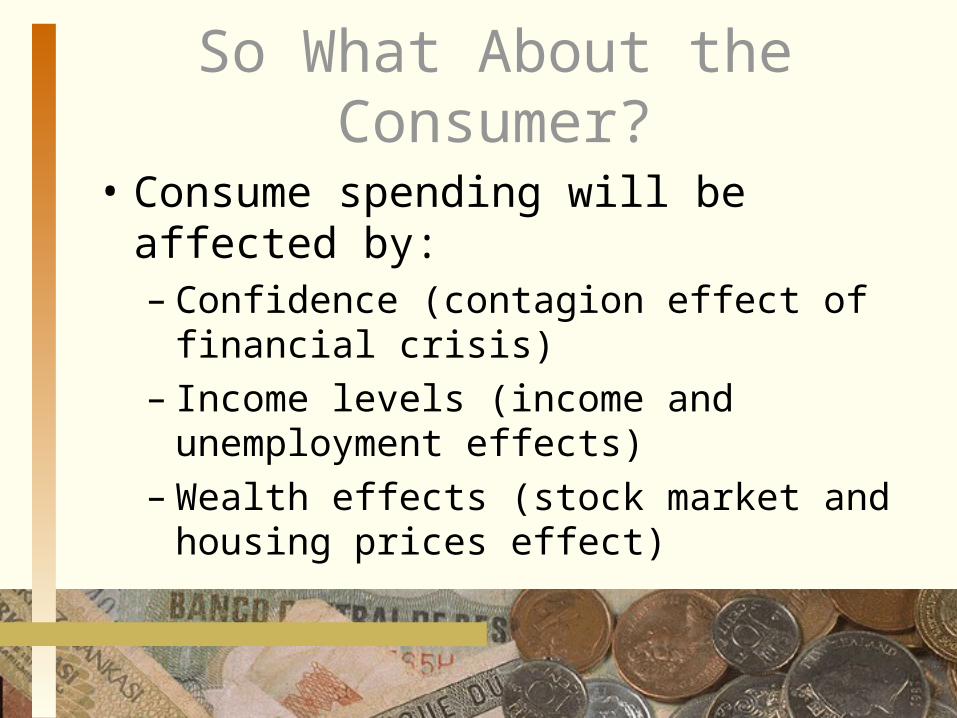
So What About the Consumer?
• Consume spending will be affected by:– Confidence (contagion effect of financial
crisis)– Income levels (income and unemployment
effects)– Wealth effects (stock market and housing
prices effect)
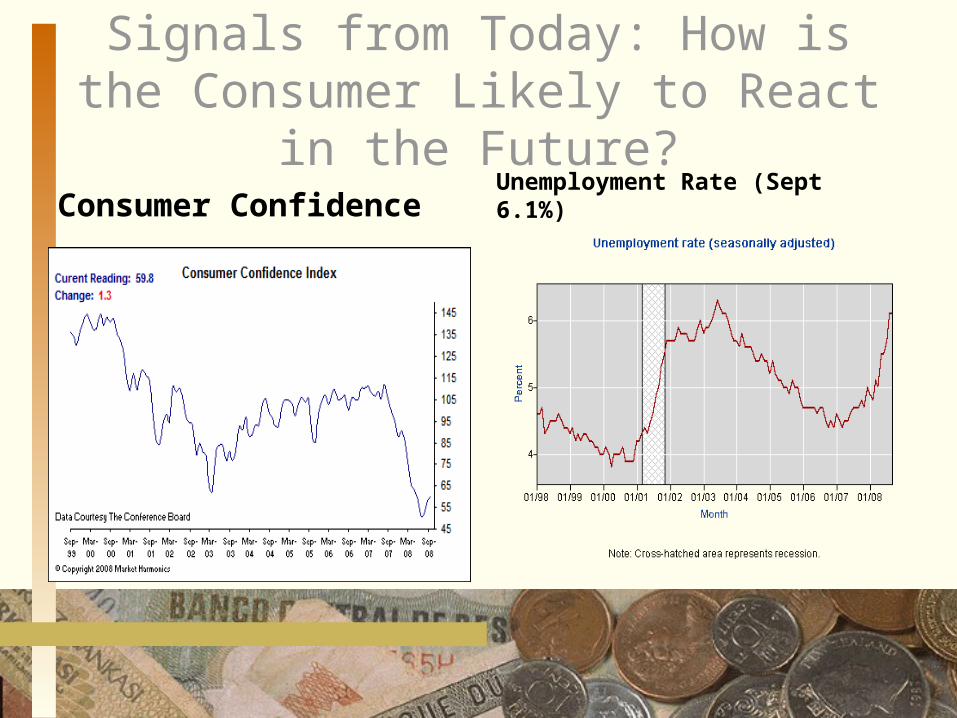
Signals from Today: How is the Consumer Likely to React in the Future?
Consumer Confidence Unemployment Rate (Sept 6.1%)
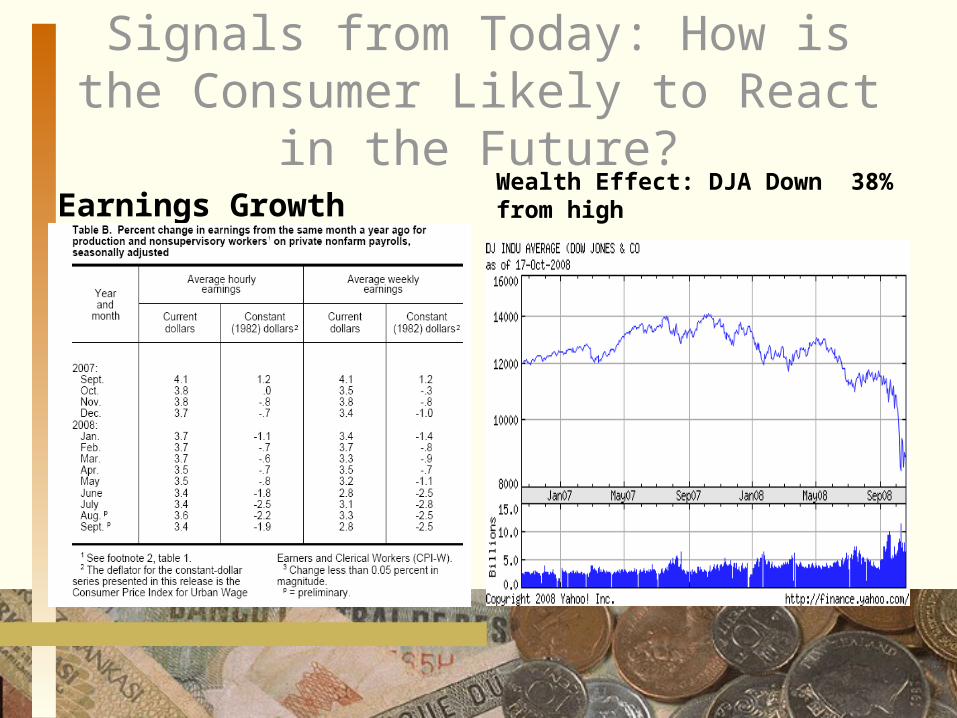
Signals from Today: How is the Consumer Likely to React in the Future?
Earnings GrowthWealth Effect: DJA Down 38% from high
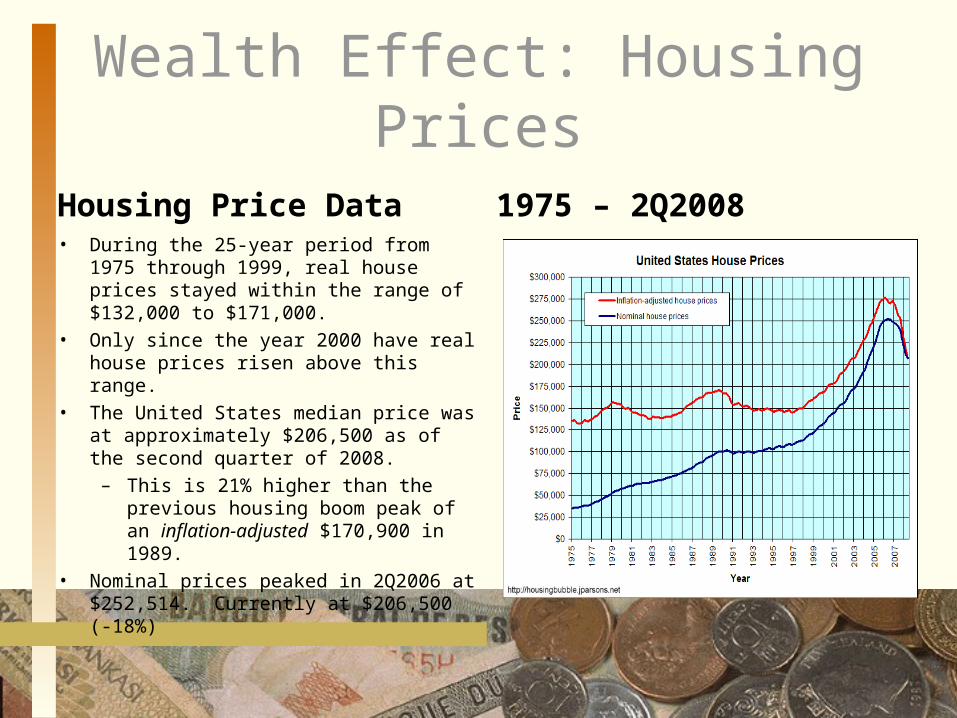
Wealth Effect: Housing Prices
Housing Price Data• During the 25-year period from 1975
through 1999, real house prices stayed within the range of $132,000 to $171,000.
• Only since the year 2000 have real house prices risen above this range.
• The United States median price was at approximately $206,500 as of the second quarter of 2008.
– This is 21% higher than the previous housing boom peak of an inflation-adjusted $170,900 in 1989.
• Nominal prices peaked in 2Q2006 at $252,514. Currently at $206,500 (-18%)
1975 – 2Q2008
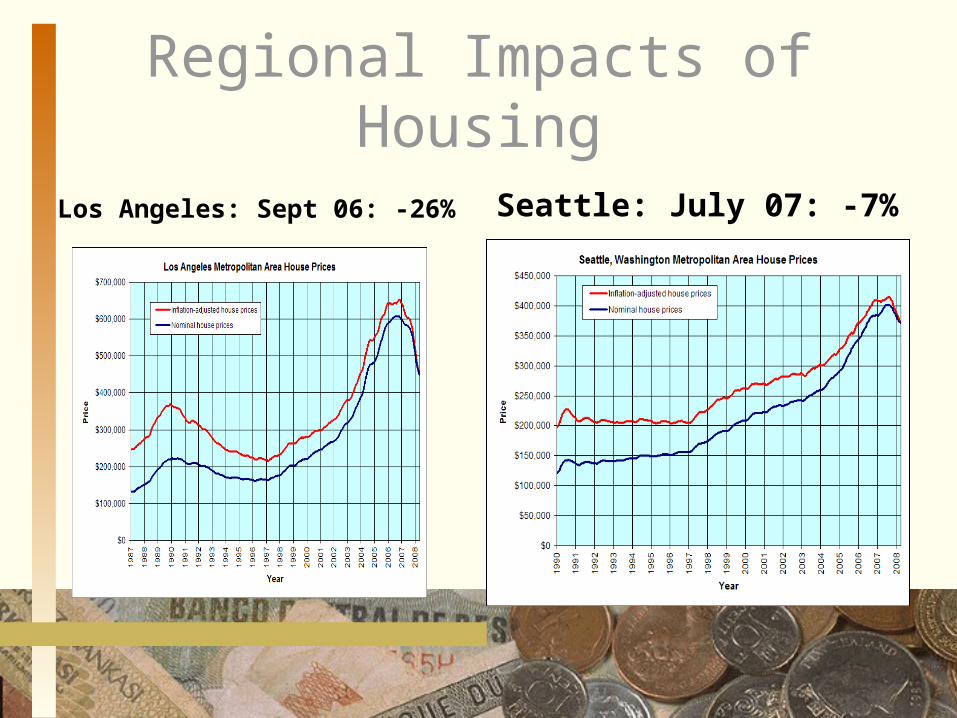
Regional Impacts of Housing
Los Angeles: Sept 06: -26% Seattle: July 07: -7%
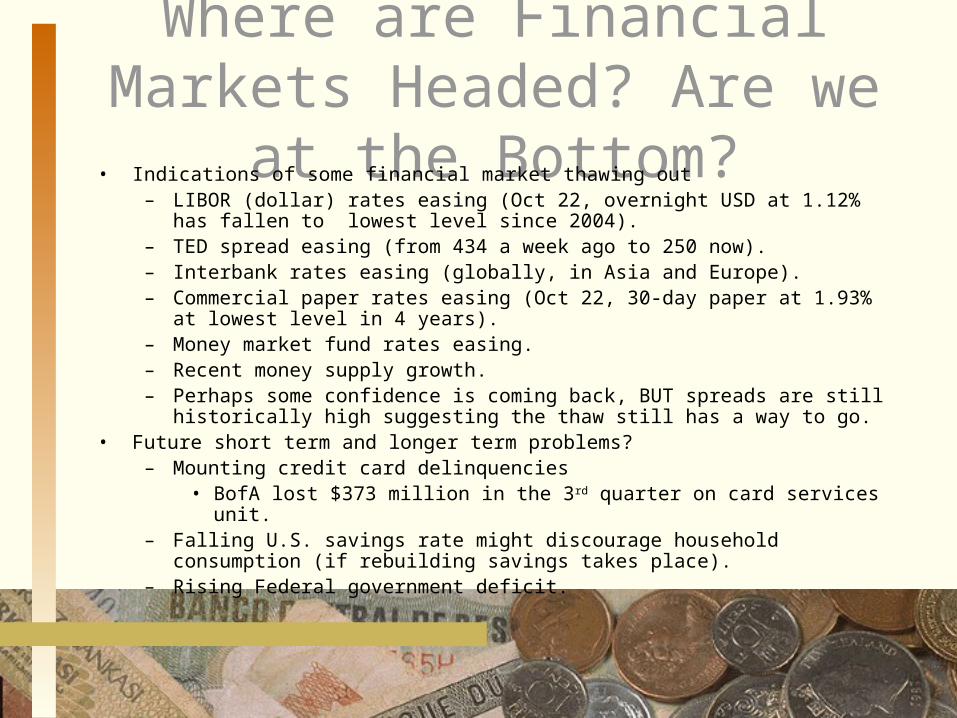
Where are Financial Markets Headed? Are we at the Bottom?
• Indications of some financial market thawing out– LIBOR (dollar) rates easing (Oct 22, overnight USD at 1.12% has fallen to lowest
level since 2004).– TED spread easing (from 434 a week ago to 250 now).– Interbank rates easing (globally, in Asia and Europe).– Commercial paper rates easing (Oct 22, 30-day paper at 1.93% at lowest level in 4
years).– Money market fund rates easing.– Recent money supply growth. – Perhaps some confidence is coming back, BUT spreads are still historically high
suggesting the thaw still has a way to go.• Future short term and longer term problems?
– Mounting credit card delinquencies• BofA lost $373 million in the 3rd quarter on card services unit.
– Falling U.S. savings rate might discourage household consumption (if rebuilding savings takes place).
– Rising Federal government deficit.
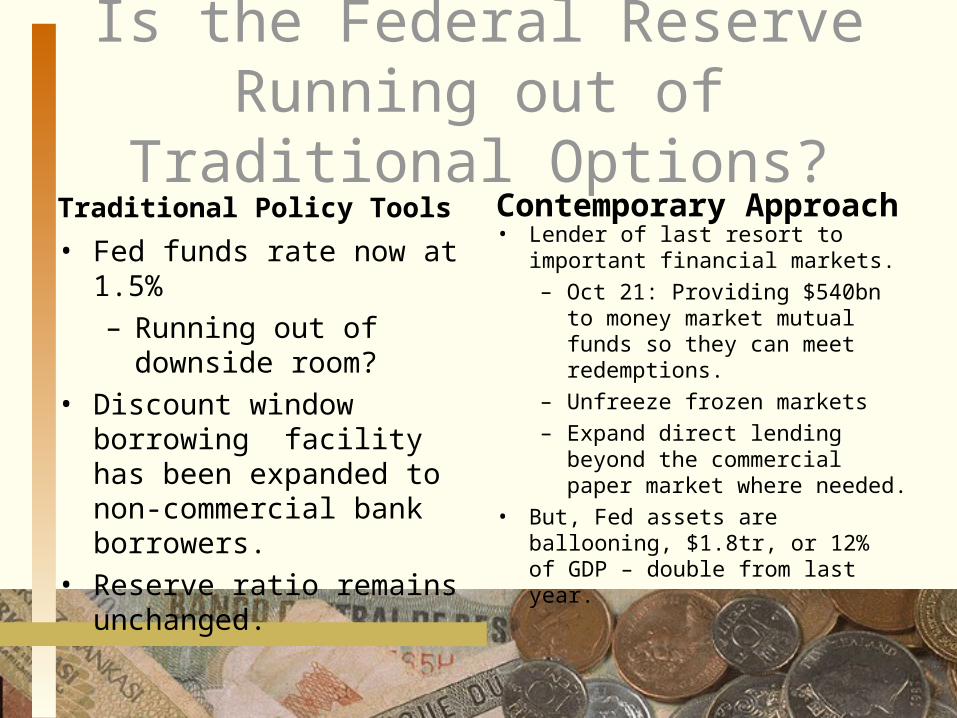
Is the Federal Reserve Running out of Traditional Options?
Traditional Policy Tools• Fed funds rate now at 1.5%
– Running out of downside room?
• Discount window borrowing facility has been expanded to non-commercial bank borrowers.
• Reserve ratio remains unchanged.
Contemporary Approach• Lender of last resort to important
financial markets.– Oct 21: Providing $540bn to
money market mutual funds so they can meet redemptions.
– Unfreeze frozen markets– Expand direct lending beyond
the commercial paper market where needed.
• But, Fed assets are ballooning, $1.8tr, or 12% of GDP – double from last year.
What else Needs to be Done?
Restore Confidence• “Temporary” increase in FDIC
insurance and guarantee of money market mutual funds.
• Global coordination must continue.– Europe has increased deposit
insurance as well.• But, continuation of strong dollar
suggests ongoing global flight to safety is still an issue (next slide).
• Balance all actions against moral hazard issue.
Ongoing Issues• Cleaning up the securitizations and
derivatives markets.– Including educating end users to the
risks involved.
• Revising regulation decisions.– Glass-Steagall– Mark- to-market accounting rules
• Europe easing rules allowing banks to reclassify some assets as long term.
• Examining the response of credit rating agencies.
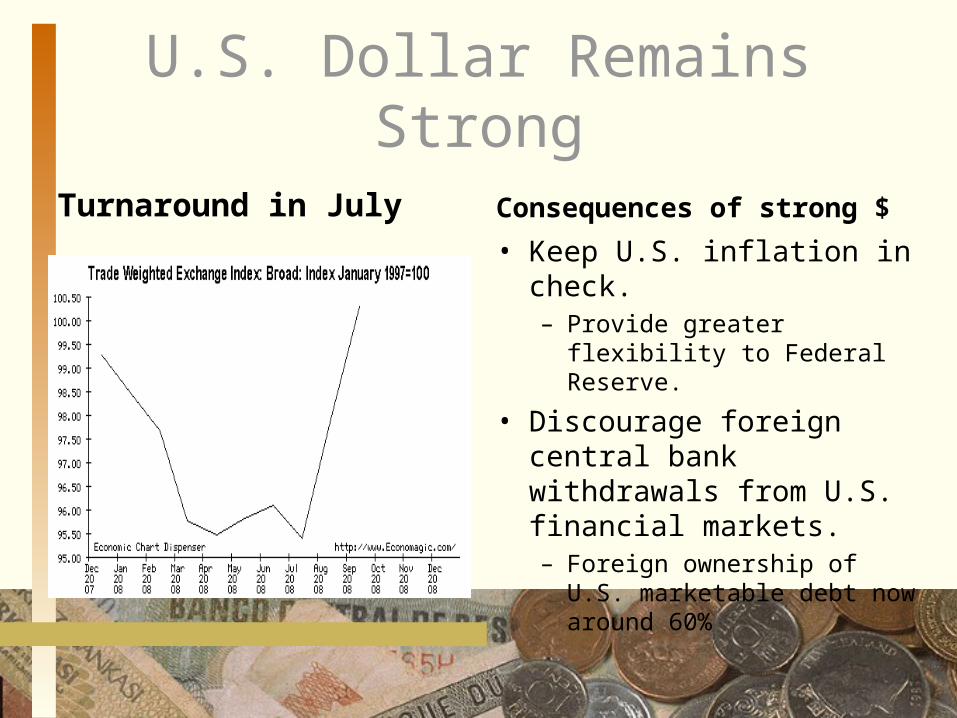
U.S. Dollar Remains Strong
Turnaround in July Consequences of strong $
• Keep U.S. inflation in check.– Provide greater flexibility to
Federal Reserve.
• Discourage foreign central bank withdrawals from U.S. financial markets.
– Foreign ownership of U.S. marketable debt now around 60%
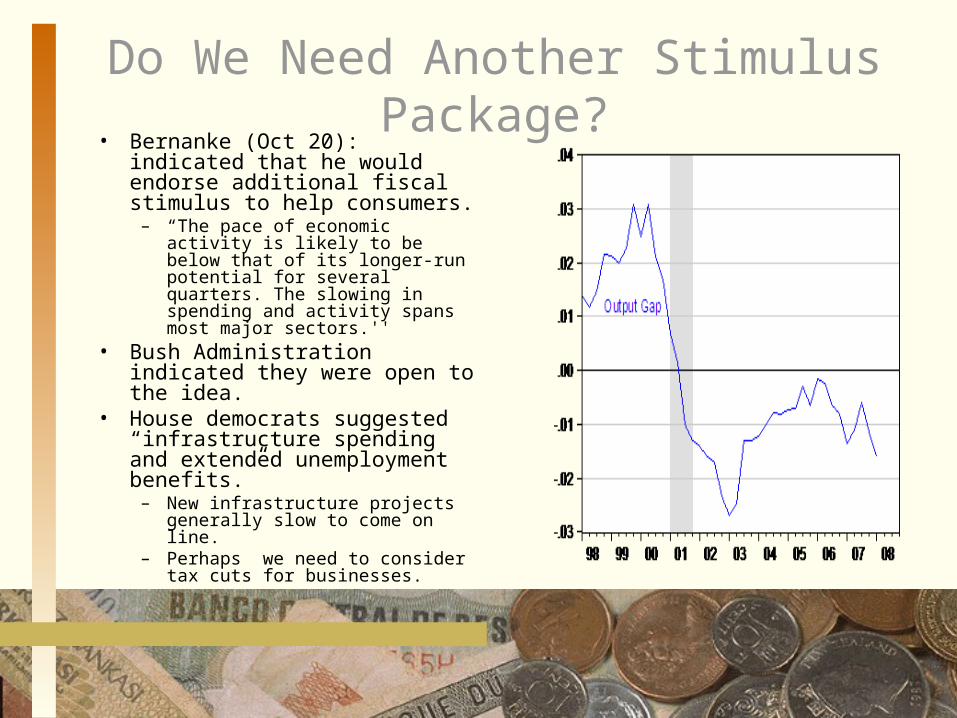
Do We Need Another Stimulus Package?• Bernanke (Oct 20): indicated that
he would endorse additional fiscal stimulus to help consumers.
– “The pace of economic activity is likely to be below that of its longer-run potential for several quarters. The slowing in spending and activity spans most major sectors.''
• Bush Administration indicated they were open to the idea.
• House democrats suggested “infrastructure spending and extended unemployment benefits.”
– New infrastructure projects generally slow to come on line.
– Perhaps we need to consider tax cuts for businesses.
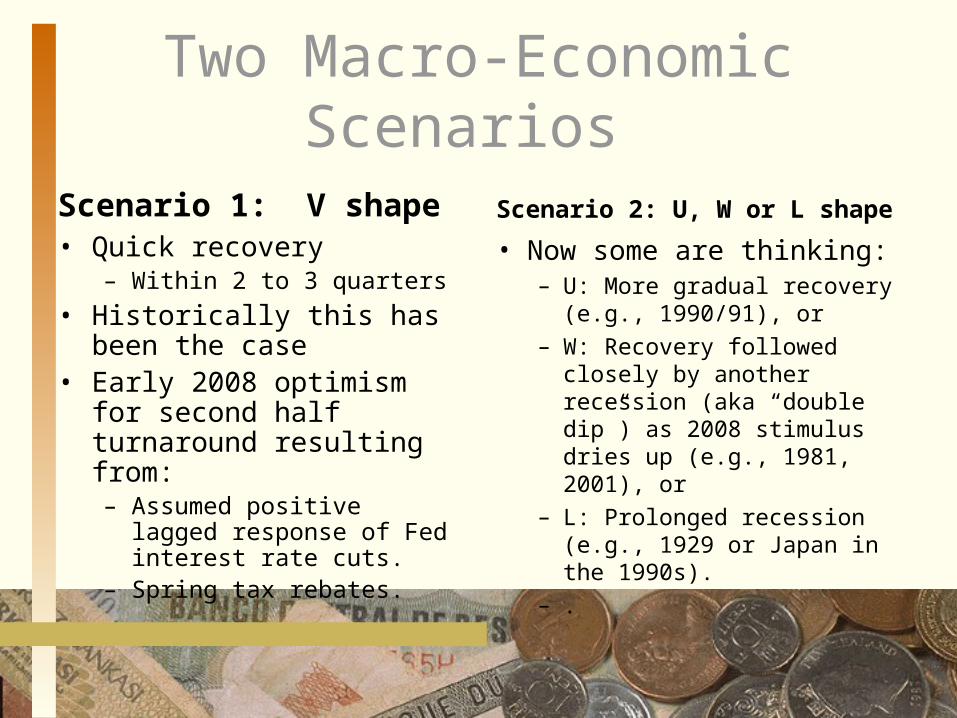
Two Macro-Economic Scenarios
Scenario 1: V shape • Quick recovery
– Within 2 to 3 quarters
• Historically this has been the case
• Early 2008 optimism for second half turnaround resulting from:
– Assumed positive lagged response of Fed interest rate cuts.
– Spring tax rebates.
Scenario 2: U, W or L shape
• Now some are thinking:– U: More gradual recovery
(e.g., 1990/91), or– W: Recovery followed
closely by another recession (aka “double dip”) as 2008 stimulus dries up (e.g., 1981, 2001), or
– L: Prolonged recession (e.g., 1929 or Japan in the 1990s).
– .
U-Shaped Recovery Likely• Caveat: The factors underlying a U-shaped scenario
are notoriously difficult to predict.– Specifically, exactly when and to what degree factors
impacting household and business behavior will kick in and when they will translate into GDP.
• U-Shaped recovery scenario likely based on:– Severity of financial asset bubble collapse– Large debt burdens (household)– Financial market freeze (and its contagion effect on real
economy)– Global reach of current situation (through
trade/business coupling of economies)
Post Scrip: The U.S. Economy and the Rime of the Ancient Mariner
• The mariner’s tale is about a ship (U.S. Economy) which leaves its native harbor. Initially, all goes well and the ship smoothly sails across the seas. However, misfortune strikes as the voyage darkens and the ship is caught in a labyrinth of ice (Credit Crisis; Frozen Capital Markets).
• The ship is lead from ice to uncharted waters (Sub-Prime Mortgage Meltdown and Non-traditional policy responses).
• The mariner eventually hears the voices of two angelic spirits (Ben Bernanke and Henry Paulson) whose conversation reveals that his ship was maneuvered by heavenly forces. When the mariner awakes he finds himself home among familiar landmarks (Hoped for Outcome?)
Questions and Answers and Discussion