Неведрова Нlib.ssga.ru/fulltext/2012/КОНГРЕСС_2012... · web viewrailways, the...
TRANSCRIPT
УДК [528.42:629.433:528.8]+629.783(480)
СЪЕМКА ТРАМВАЙНЫХ ПУТЕЙ В ХЕЛЬСИНКИ С ПОМОЩЬЮ МОБИЛЬНОЙ ЛИДАРНОЙ СИСТЕМЫ
Ханну КорпелаФирма Terrasolid Ltd, Kanavaranta 7 B 28, 00160 Хельсинки, Финляндия, директор по маркетингу и продажам, тел: +358 400 648 391, факс: +358 14 645 002, e-mail: hannu. korpela @ terrasolid . fi
Точное определение положения рельсов является сегодня самой актуальной задачей, которую практически невозможно решить традиционной съемкой. С этой целью фирма Ter-rasolid с 2011г. Стала использовать мобильную лидарную систему для съемки трамвайных путей в Хельсинки. Главная цель проекта заключалась в распределении легко распознаваемых цветных лидарных точек, с которых определяется точное положение рельсов и всех прилегающих к ним конструкций.
На стадии проекта разрабатывались программные модули и среди них модуль для автоматического согласования переездов для контроля дорожных знаков и выделения путей из лазерных точек в виде 3D векторов.
Ключевые слова: мобильная лидарная система, трамвайные рельсы, съемка, сканнер, TerraScan, TerraMatch.
HELSINKI TRAM LINE SURVEY BY MOBILE LiDAR SYSTEM
Hannu KorpelaTerrasolid Ltd, Kanavaranta 7 B 28, 00160 Helsinki, Finland, Marketing and Sales Manager, tel : +358 400 648 391, fax : +358 14 645 002, email: hannu. k o r pe l a @te r r a s o l i d. f i
To survey the accurate xyz-location of rails is a very demanding task and practically impossi-ble in traditional field surveying. Therefore Terrasolid applied in 2011 a mobile LiDAR system to survey the tram license in Helsinki city. The targets of the survey project were to produce well geo-referenced, colored LiDAR points and from those points detect the accurate location of rails and all structures close to the tram lines.
During the project the software modules were developed among others to match automatic the drive passes to control signs and to extract rails as 3D vectors from laser points.
Key words: mobile LiDAR system, tram lines, survey, scanner, TerraScan, TerraMatch.
The Traffic Administration of Helsinki city – the capital of Finland – takes care about the public transportation in Helsinki city. Among bus and metro networks in downtown there is a relative dense tram line network, of which length is total 97 kilo-meters. About 200.000 people use trams daily Today trams with modern wagons are living a renaissance due to their good transportation capacity and the pollution prob-lems of busses.
The Helsinki tram network system was built at the beginning of 1900. Due to narrow streets at that time curves are very tight in many places. This causes turning problems to modern wagons. Today the bottom of wagons should be on a much lower level than earlier, but on the other hand a low bottom can hit ground, if the vertical
87
curves are too tight. Street curbs, platforms and other structures may cause problems as well.
Mobile LiDAR mapping offers an advantageous and fast method to survey the location of the lines and close environment without causing essential harm to the other traffic. The targets of the survey project were as follows:
To survey an exact location of the rails and the electric wires, their holder and conductors above the lines
To survey in 3D objects close to the tram lines such as street curbs, stops and other objects
To search places, where the space between rails and street pavement is too narrow. This information is needed to estimate the magnitude and places, where man must cut street payment to replace current wheels with wider and less noise wheels.
To detect the 3D geometry of rails and deduce then their horizontal and verti-cal components. These components can then be used in redesigning the alignments for renovation.
Terrasolid Ltd from Finland was selected as contractor of the total project. To subcontractor Terrasolid selected 3D Laser Mapping (U.K.), which used their Street Mapper mobile LiDAR system. The system consisted of 2 kHZRiegl scanners and one forward looking oblique camera. The system was installed on the top of a tram wagon to get a higher position compared to a car roof as used normally as a platform. The survey took place from 29th to 31st May.
Due to high buildings and trees satellite visibility and the GPS access is often very poor in urban areas and forest. This results as a poor absolute positioning of the total system. In mobile LiDAR mapping the major errors are the xyz positioning of drive passes.
To correct the xy-errors of drive passes one must have control points on the ground features, which can be identified also from LiDAR points. Therefore small, white signs were painted to the asphalt just before scanning. Then later on they were surveyed by high-precision total-stations. The distance between the locations of signs was in open areas 250 meters. If the visibility was limited, then a 50 meters distance was applied.
For elevation correction airborne LiDAR data was applied. This data was col-lected in previous year by a helicopter LiDAR system. The point density was around 20… 25 points/m2 and the accuracy of height around 3,5 cm. The mobile data was fixed to match airborne data.
All drive passes we categorized according to their accuracy of quality. In the fi-nal product the worst points were removed including as follows:
Points due to stops Points, of which the survey length was longer than 100 m. In mobile mapping
we are mainly interested about points of the street lanes, where the distance from scanners are only some meters. Thinking about their accuracy, the position of the sys-tem is critical. The longer is the distance from the scanner to the target, the more er-ror is caused by the misalignment angles.
88
All overlapping points were rejected after their drive pass quality. Only points from the best quality drive passes at each location was kept.
In the delivery product the mobile and airborne data was merged together. Points from streets and building facades were mobile. Building roofs and other tar-gets further away from the scanner than 100 m were airborne LiDAR.
The LiDAR data was fixed and classified by TerraScan and TerraMatch from Terrasolid. The oblique images were processed by TerraPhoto. Among others during the project until today a new function was developed to detect the control points auto-matic from LiDAR, compare their location to the surveyed points and then solve thexy errors automatic.
The project is still under way. The final deliveries are going to be available in late spring 2012.
About Terrasolid
Terrasolid Ltd. is a Finnish private software company. Today Terrasolid is the worldwide market leader, which develops and sells software for LiDARdata and im-age processing. Terrasolid packages - TerraScan, TerraModeler, TerraMatch and Ter-raPhoto - suit for airborne as well as mobile LiDAR data processing. Experiences about the Helsinki tram line mapping projects in 2011 and the latest news about city modelling texturing will be shown at Terrasolid stand in “Interexpo GEO-Siberia-2012”.
CONTACT
Hannu KorpelaMarketing and Sales ManagerTerrasolid LtdKanavaranta 7 B 2800160 HelsinkiFinlandTel: +358 400 648 391Fax: +358 14 645 002Email: hannu. k o r pe l a @te r r a s o l i d. f i www.terrasolid.fi
© H. Korpela, 2012
89
УДК 528:629.783
ПРОФИЛЬ, ПЛАТФОРМЫ И АЛГОРИТМЫ ДЛЯ OUT- AND INDOOR НАВИГАЦИИ И ОПРЕДЕЛЕНИЯ ПОЛОЖЕНИЯ ОБЪЕКТОВ С ПОМОЩЬЮ МОБИЛЬНЫХ УСТРОЙСТВ НА БАЗЕ GNNS/MEMS ТЕХНОЛОГИЙ
Райнер Ягер Университет прикладных наук Карлсруэ (HSKA), факультет геоматики Института прикладных исследований (IAF), Moltkestrasse 30, D-76133 Karlsruhe, Германия, профессор по спутниковой и математической геодезии, уравниванию и разработке ПО, тел: ++ 49 (0) 721 925 2620, e-mail: reiner . jaeger @ web . de
В статье рассматриваются основные вопросы, касающихся новых методов для государственной оценки автономных мультисенсорных навигационных систем на основе геодезических принципов навигации, начиная с относительных референцных систем и классического подхода к навигации.
Ключевые слова: комплексная out- and indoor навигация, алгоритмы, gnss и mems мультисенсорные навигационные платформы, плечи рычага, сочетание различных сенсорных датчиков, калибровка сенсора в процессе работы, конструкция сенсор-платформа и оптимизация, конструкция корпуса платформы.
PROFIL, PLATTFORMEN UND ALGORITHMEN FÜR DIE PRÄZISE GNSS/MEMS BASIERTE OUT- UND INDOOR-NAVIGATION UND OBJEKT-GEOREFERENZIERUNG MIT MOBILEN ENDGERÄTEN
Reiner JägerKarlsruhe University of Applied Sciences, Faculty of Geomatics, Moltkestrasse 30, D-76133 Karls-ruhe, Professor for Satellite and Mathematical Geodesy, Adjustment, Software development and Surveying. tel: ++ 49 (0) 721 925 2620, e-mail: [email protected]
The target of that paper is – based on geodetic foundations of navigation, starting with the rel-evant reference systems and the classical point of view on navigation – to present the essential top-ics for new methods for the state estimation of autonomous multi-sensor navigation-systems.
Key words: seamless out- and indoor navigation, navigation algorithms, gnss and mems multi-sensor navigation platforms, lever arms, multi-sensor fusion, sensor calibration on the fly, sensor-platform design and optimization, platform-body design.
Abstract
By the further development and new installation of independent GNSS (GPS, GLONASS, GALILEO, COMPASS) with 63 satellites at present, and 127 satellites in 2020, respectively, as well as further IGSO and GEO orbit based regional satellite systems (QZSS, IRNSS, SBAS), precise GNSS-positioning is the motor, and a reli-able component, for innovative developments on navigation in an increasingly mobile society. But only the precise orientation determination by further MEMS (Micro-Electro-Mechanical-Systems) sensor types opens the full potential, and at the same
90
time the mass market, for innovative technologies and applications in satellite na-vigation (SatNav) and mobile IT (MIT) including also navigation systems for indoor areas.
The essential targets and the profile of the new generation of ’smart-sensor-plat-forms’ are the seamless out-/indoor navigation, as well as the geo-referencing of ob-jects using miniaturized MEMS- based low cost sensors, as they are integrated e.g. in smart-phones. As concerns precise indoor-navigation, autonomous platforms and re-spective MEMS sensor-types (e.g. accelerometers, gyroscopes, magnetometers etc.) and algorithms on one side, and infrastructure-based non-autonomous navigation--platforms and algorithms (e.g. based on WLAN) on the other side, are complement-ary parts of present RaD.
With the geodetic core competencies of sensor data modelling, adjustment, reference systems, GNSS, navigation and geoinformatics, geomatics plays as key role in the interdisciplinary RaD topic of precise navigation systems, which is settled in the development of algorithms and the design of multifunctional scalable GNSS/MEMS multisensor-platforms. Here it is referred to the joint RaD project „GNSS-supported low-cost multi-sensor systems for mobile platform-navigation and object-georeferencing“ (www.navka.de ) of the Baden-Württemberg cluster SatNav & Mobile IT (www.galileo-bw.de ). Market potentials are vehicle and ro-botics navigation and geo-referencing taks, traffic system management, integrated telematic systems (ITS), location based services, safety of life and security ser-vices, logistics, object-referencing/-identification, construction and city develop-ment, virtual reality und individual mobility out-and indoor. Above these, there are further applications for small multi-sensor platforms beyond „IT for Mobility and SatNav“.
The target of that paper is – based on geodetic foundations of navigation, start-ing with the relevant reference systems and the classical point of view on navigation – to present the essential topics for new methods for the state estimation of autonom-ous multi-sensor navigation-systems. These are the consideration of a general lever-arm design, robust estimation by redundant sensor platforms, sensor calibration on the fly, etc. Here the contribution gives an entry-point to access the mathematical methods for the parametrization and estimation of the navigation state parameters.
EINLEITUNG
Mit dem Ausbau und der Neueinrichtung politisch unabhängiger GNSS (GPS, GLONASS, GALILEO, COMPASS) ist bei derzeit 63 bzw. 127 Satelliten in 2020 - sowie drei weiteren, mit IGSO- und GEO-Orbits groß-regional beschränkten Satel-litensystemen (QZSS, IRNSS, SBAS) - die präzise Satelliten-Positionierung treiben-der Motor und sichere Bestandskomponente für innovative Navigationsentwick-lungen in einer zunehmend mobilen Gesellschaft.
91

Aber erst die präzise Orientierungsbestimmung mit weiteren Sensortypen er-schließt das Gesamtpotential und zugleich auch den Massenmarkt innovativer Tech-nologien und Anwendungen von Satellitennavigation (SatNav) & Mobile IT, ins-besondere auch Navigationssystementwicklungen für den Indoorbereich.
Die wesentlichen Ziele und das Profil der neuen Generation ’Smart-Sensor-Plat-forms’ sind die nahtlose Out-/Indoor Navigation sowie die Objektgeoreferenzierung mit miniaturisierten MEMS (Micro-Electro-Mechanical-Systems) basierten Low-Cost-Sensoren (Abb. 1, rechts oben), wie sie z.B. in Smartphones (Abb. 1, links un-ten) enthalten sind. In der präzisen Indoornavigation stehen sich die auf entsprechen-de Sensortypen (z.B. Beschleunigungs- und Kreiselsensoren) und Algorithmen ba-sierte autarke und die auf Infrastruktursensoren (z.B. WLAN) beruhende nicht-autar-ke Navigationsplattformen gegenüber.
Mit den geodätischen Kernkompetenzen Sensordatenmodellierung, Bezugssys-teme, GNSS, Navigation und Geoinformatik kommt der Geomatik in der interdiszi-plinären Thematik der präzisen Navigation eine Schlüsselposition zu. Diese besteht in der Entwicklung von Algorithmen und im Design multifunktionaler und skalierbarer GNSS/MEMS Multisensorplattformen. Hierzu wird auch auf das Verbundfor-schungsprojekt „GNSS-gestützte LowCost-Multisensorsysteme zur mobilen Platt-formnavigation und Objektgeoreferenzierung“ (www.navka.de) des Ba-den-Württembergischen Clusters SatNav & Mobile IT (www.galileo-bw.de) ver-wiesen. Basierend auf neuen mathematischen Modellen und Algorithmen entwickelt das FuE-Konsortium aus Industrie, dem IAF der Hochschule Karlsruhe (HSKA) als zentrale Forschungsstelle und dem Forschungspartner HTWG Konstanz die nächste Generation präziser „Hightech-LowCost“-Navigationsplattformen. In algorithmisch tiefer Kopplung von GNSS sowie den Rohdaten verschiedener autarker MEMS Sen-soren entstehen, auch mit Blick auf den Massenmarkt sowie den LowCost-Bereich, unterschiedliche Navigationsplattformtypen.
Typische Marktpotentiale der o.g. Multisensorplattformen sind Fahrzeug-/ Robotiknavigation, Verkehrssystemmanagement in Verbindung mit Integrierten Telematik-Systemen (ITS), ortsbezogene Dienste, Rettungs- und Sicherheitsdienste, Logistik, Objektreferenzierung/-Identifikation, Bau-/Stadtentwicklung, Virtual Real-ity und Individualmobilität. Sie reichen aber auch über „IT for Mobility / SatNav“ hinaus.
Ziel dieses Beitrages ist es, aufbauend auf den geodätischen Grundlagen der Navigation, an vorderer Front die maßgeblichen Bezugssysteme und die Zustands-schätzung für Multisensornavigationssysteme von der mathematischen Modellbil-dung her bzgl. klassischer und neuer Methoden der Schätzung der Navigationszus-tandsparameter zu erschließen.
92
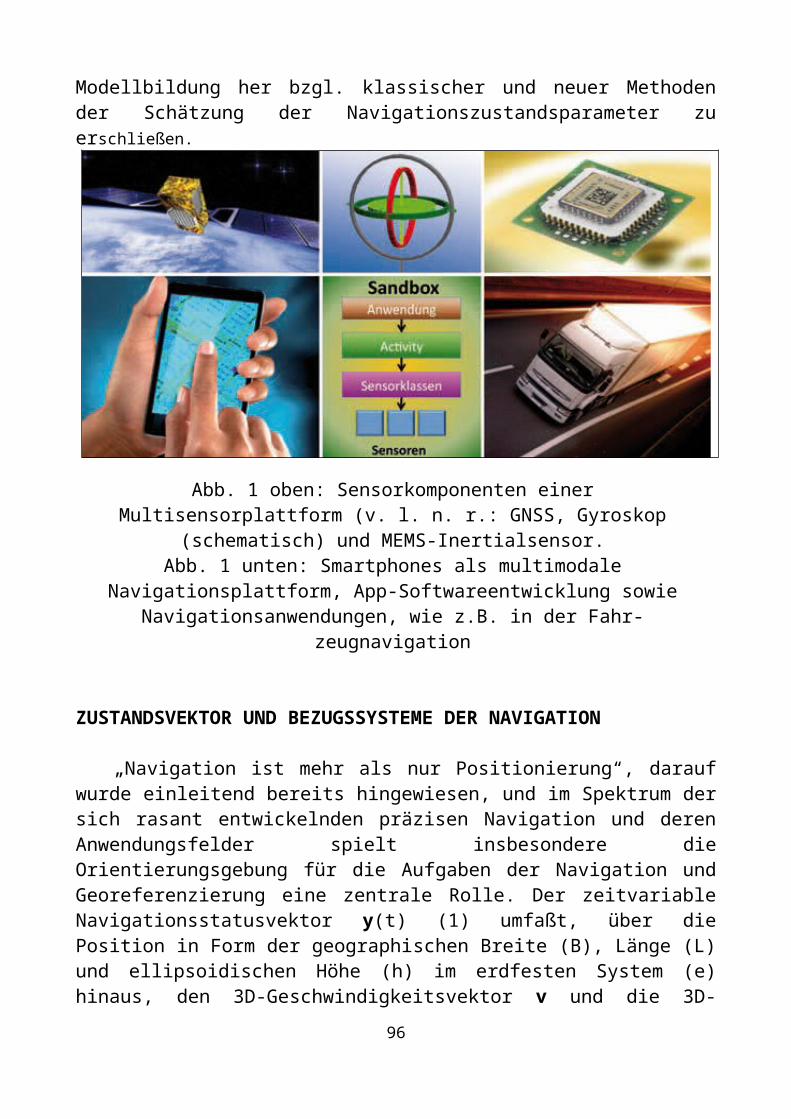
Abb. 1 oben: Sensorkomponenten einer Multisensorplattform (v. l. n. r.: GNSS, Gyroskop (schematisch) und MEMS-Inertialsensor.
Abb. 1 unten: Smartphones als multimodale Navigationsplattform, App-Software-entwicklung sowie Navigationsanwendungen, wie z.B. in der Fahrzeugnavigation
ZUSTANDSVEKTOR UND BEZUGSSYSTEME DER NAVIGATION
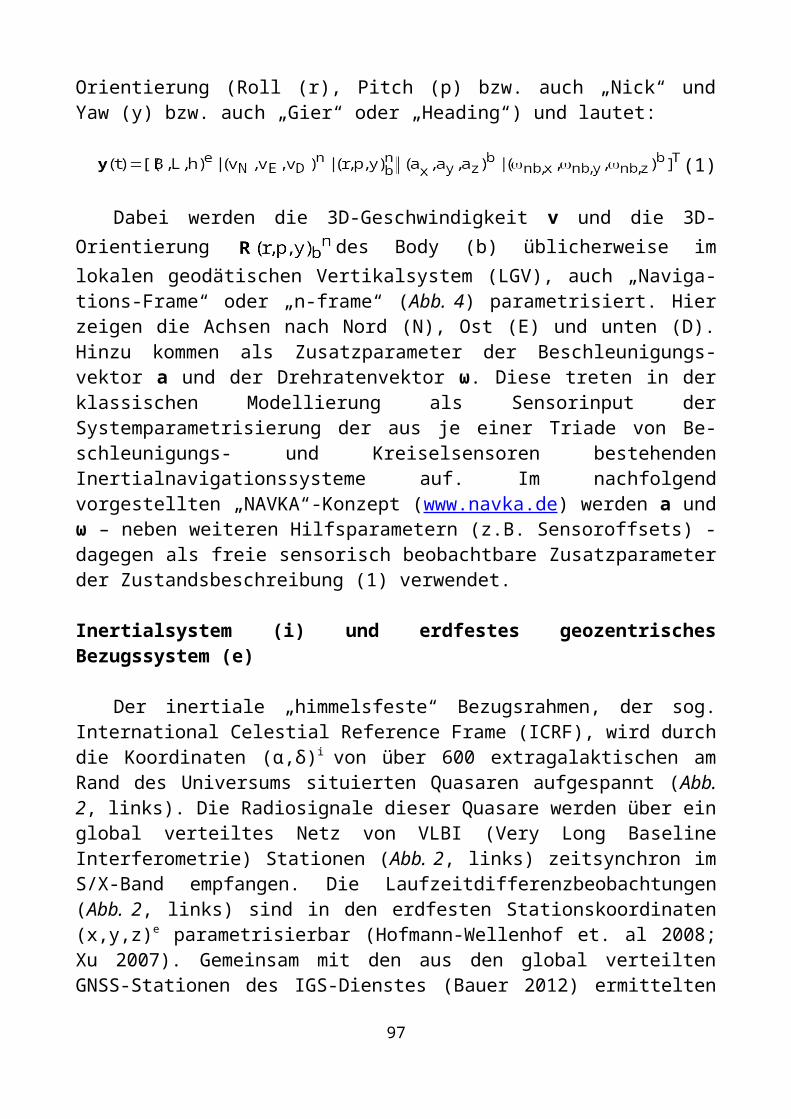
„Navigation ist mehr als nur Positionierung“, darauf wurde einleitend bereits hingewiesen, und im Spektrum der sich rasant entwickelnden präzisen Navigation und deren Anwendungsfelder spielt insbesondere die Orientierungsgebung für die Aufgaben der Navigation und Georeferenzierung eine zentrale Rolle. Der zeitvariable Navigationsstatusvektor y(t) (1) umfaßt, über die Position in Form der geographi-schen Breite (B), Länge (L) und ellipsoidischen Höhe (h) im erdfesten System (e) hinaus, den 3D-Geschwindigkeitsvektor v und die 3D-Orientierung (Roll (r), Pitch (p) bzw. auch „Nick“ und Yaw (y) bzw. auch „Gier“ oder „Heading“) und lautet:
(1)
Dabei werden die 3D-Geschwindigkeit v und die 3D-Orientierung des Body (b) üblicherweise im lokalen geodätischen Vertikalsystem (LGV), auch „Navigations-Frame“ oder „n-frame“ (Abb. 4) parametrisiert. Hier zeigen die Achsen nach Nord (N), Ost (E) und unten (D). Hinzu kommen als Zusatzparameter der Beschleunigungsvektor a und der Drehratenvektor ω. Diese treten in der klassischen Modellierung als Sensorinput der Systemparametrisierung der aus je einer Triade von Beschleunigungs- und Kreiselsensoren bestehenden Inertialnavigationssysteme auf. Im nachfolgend vorgestellten „NAVKA“-Konzept (www.navka.de) werden a und ω
93
– neben weiteren Hilfsparametern (z.B. Sensoroffsets) - dagegen als freie sensorisch beobachtbare Zusatzparameter der Zustandsbeschreibung (1) verwendet.
Inertialsystem (i) und erdfestes geozentrisches Bezugssystem (e)
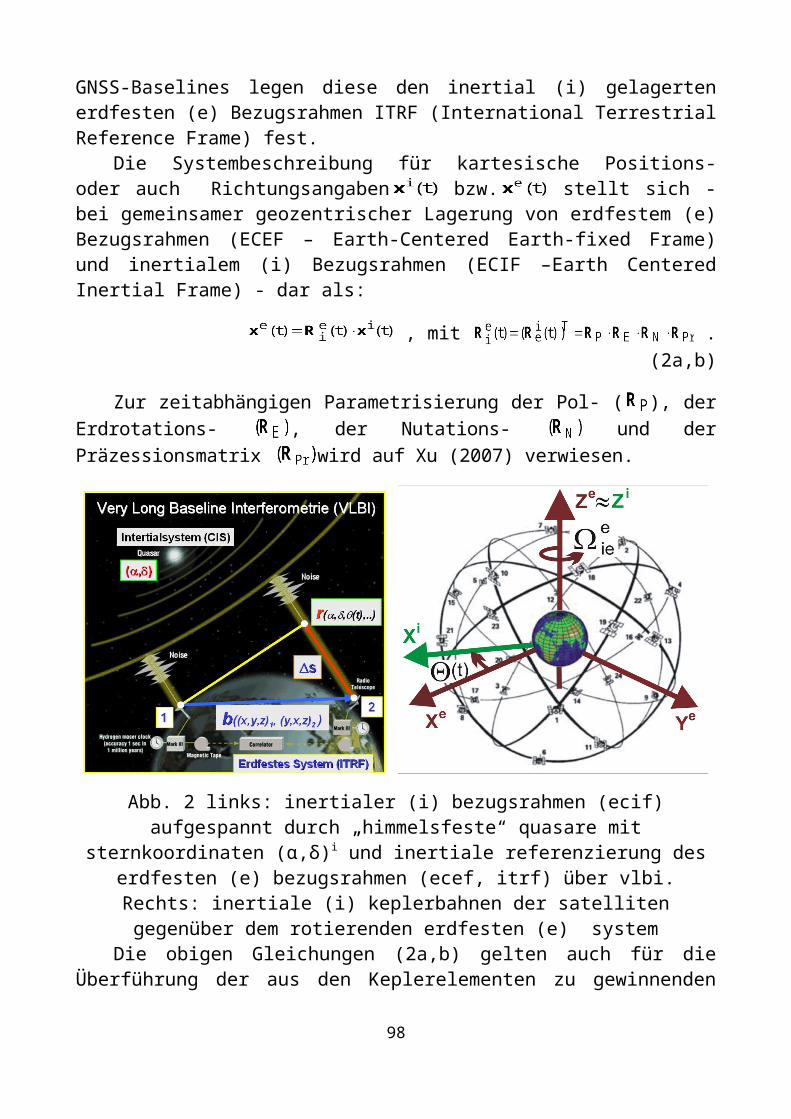
Der inertiale „himmelsfeste“ Bezugsrahmen, der sog. International Celestial Ref-erence Frame (ICRF), wird durch die Koordinaten (α,δ)i von über 600 extragalaktis-chen am Rand des Universums situierten Quasaren aufgespannt (Abb. 2, links). Die Radiosignale dieser Quasare werden über ein global verteiltes Netz von VLBI (Very Long Baseline Interferometrie) Stationen (Abb. 2, links) zeitsynchron im S/X-Band empfangen. Die Laufzeitdifferenzbeobachtungen (Abb. 2, links) sind in den erdfesten Stationskoordinaten (x,y,z)e parametrisierbar (Hofmann-Wellenhof et. al 2008; Xu 2007). Gemeinsam mit den aus den global verteilten GNSS-Stationen des IGS-Dien-stes (Bauer 2012) ermittelten GNSS-Baselines legen diese den inertial (i) gelagerten erdfesten (e) Bezugsrahmen ITRF (International Terrestrial Reference Frame) fest.
Die Systembeschreibung für kartesische Positions- oder auch Richtungsangaben bzw. stellt sich - bei gemeinsamer geozentrischer Lagerung von erdfestem
(e) Bezugsrahmen (ECEF – Earth-Centered Earth-fixed Frame) und inertialem (i) Bezugsrahmen (ECIF –Earth Centered Inertial Frame) - dar als:
, mit . (2a,b)
Zur zeitabhängigen Parametrisierung der Pol- ( ), der Erdrotations- , der Nu-tations- und der Präzessionsmatrix wird auf Xu (2007) verwiesen.
Abb. 2 links: inertialer (i) bezugsrahmen (ecif) aufgespannt durch „himmelsfeste“
quasare mit sternkoordinaten (α,δ)i und inertiale referenzierung des erdfesten (e) be-zugsrahmen (ecef, itrf) über vlbi. Rechts: inertiale (i) keplerbahnen der satelliten
gegenüber dem rotierenden erdfesten (e) system
94
Die obigen Gleichungen (2a,b) gelten auch für die Überführung der aus den Ke-plerelementen zu gewinnenden inertialen (i) Satellitenpositionen (Abb. 2, rechts) in den erdfesten (e) ECEF- bzw. ITRF-Bezug (Abb. 3).
Die mit in der ersten Ableitung von (2b) auftretende 3D-Drehratenmatrix ist im wesentlichen von einer kurzzeitig konstanten Erddrehrate
um die z-Achse geprägt (Abb. 2, rechts). Diese tritt auch als Parameter in der Zustandsbeschreibung (8a,b,c) bzw. (10d) von Inertialnavigationssystemen auf. Die Gleichungen (2a,b) stehen auch am Anfang der Überführung der inertialen (i) Navigationsgleichungen (7a,b) für Beschleunigungssensoren in den erd-festen (e) bzw. den sog. Navigations-Frame (n-frame) (siehe Abb. 3, 4).
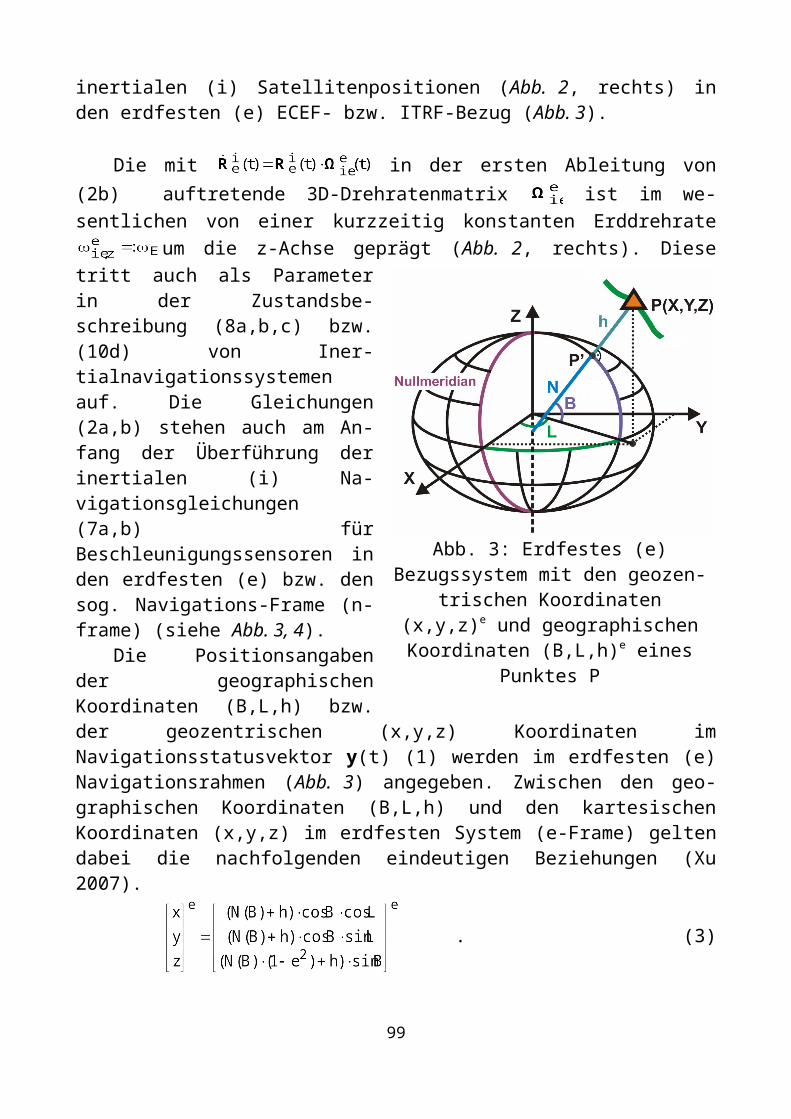
Die Positionsangaben der geogra-phischen Koordinaten (B,L,h) bzw. der geozentrischen (x,y,z) Koordinaten im Navigationsstatusvektor y(t) (1) werden im erdfesten (e) Navigationsrahmen (Abb. 3) angegeben. Zwischen den geo-graphischen Koordinaten (B,L,h) und den kartesischen Koordinaten (x,y,z) im erdfesten System (e-Frame) gelten dabei die nachfolgenden eindeutigen Beziehungen (Xu 2007).
.
(3)
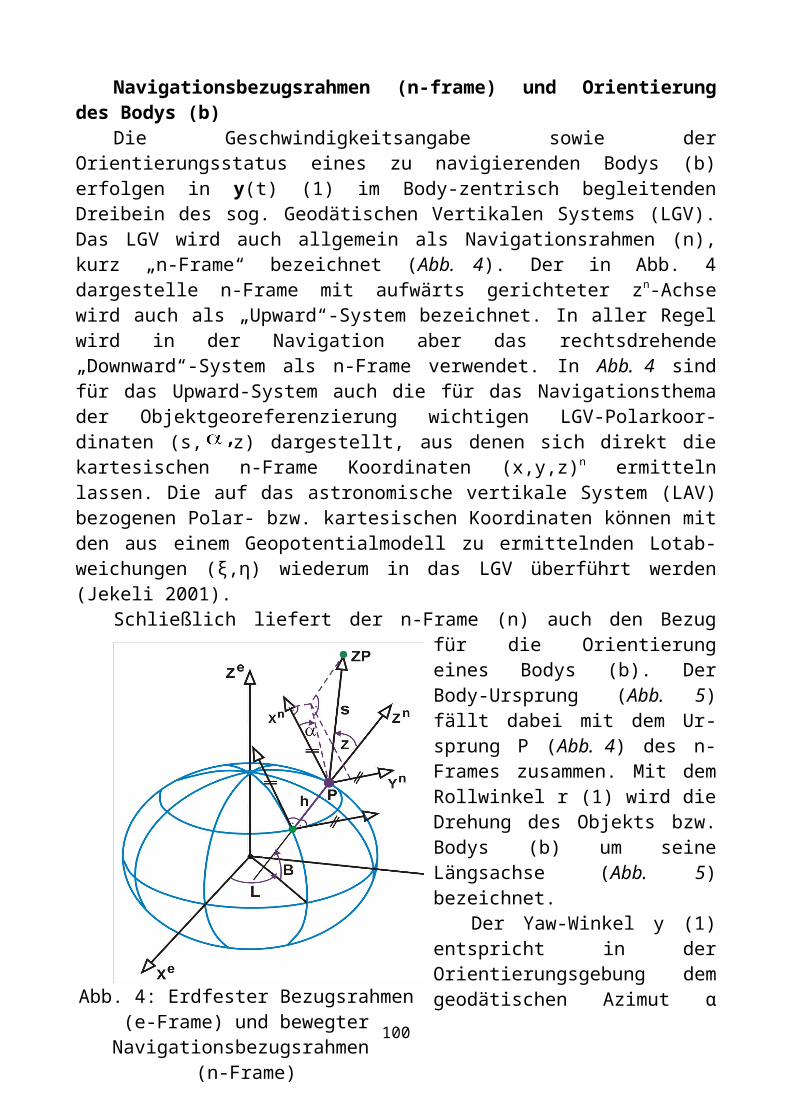
Navigationsbezugsrahmen (n-frame) und Orientierung des Bodys (b)Die Geschwindigkeitsangabe sowie der Orientierungsstatus eines zu navigieren-
den Bodys (b) erfolgen in y(t) (1) im Body-zentrisch begleitenden Dreibein des sog. Geodätischen Vertikalen Systems (LGV). Das LGV wird auch allgemein als Naviga-tionsrahmen (n), kurz „n-Frame“ bezeichnet (Abb. 4). Der in Abb. 4 dargestelle n-Frame mit aufwärts gerichteter zn-Achse wird auch als „Upward“-System bezeichnet. In aller Regel wird in der Navigation aber das rechtsdrehende „Downward“-System als n-Frame verwendet. In Abb. 4 sind für das Upward-System auch die für das Navi-gationsthema der Objektgeoreferenzierung wichtigen LGV-Polarkoordinaten (s, z) dargestellt, aus denen sich direkt die kartesischen n-Frame Koordinaten (x,y,z)n er-mitteln lassen. Die auf das astronomische vertikale System (LAV) bezogenen Polar- bzw. kartesischen Koordinaten können mit den aus einem Geopotentialmodell zu er-mittelnden Lotabweichungen (ξ,η) wiederum in das LGV überführt werden (Jekeli 2001).
Abb. 3: Erdfestes (e) Bezugssystem mit den geozentrischen Koordinaten (x,y,z)e
und geographischen Koordinaten (B,L,h)e
eines Punktes P
95
Schließlich liefert der n-Frame (n) auch den Bezug für die Orientierung eines Bodys (b). Der Body-Ursprung (Abb. 5) fällt dabei mit dem Ursprung P (Abb. 4) des n-Frames zusammen. Mit dem Rollwinkel r (1) wird die Drehung des Objekts bzw. Bodys (b) um seine Längsachse (Abb. 5) beze-ichnet.
Der Yaw-Winkel y (1) entspricht in der Orientierungsgebung dem geodätischen Azimut α (Abb. 4). Der Pitch-Winkel p im Zustandsvek-tor y(t) (1) (Abb. 5) entspricht auch dem Elevationswinkel e, mit e = 90°-z (Abb. 4). Für die Überführung von auf den Nullpunkt des n-Frames be-zogenen Positionsvektoren, Rich-tungsvektors oder auch Zustands- oder Beobachtungsvektoren in den e-Frame gelten die Beziehungen:
bzw.
, mit (4a)
= . (4b)
Die Beziehungen zur Überführung von Positions-, Richtungs-, Zustands- und Sensorbeobachtungsvektoren vom Body- (b) in den n-Frame lauten:
bzw. , mit (5a)
(5b)
Die Gleichungen (4a,b) bilden auch die Grundlage für die Überführung der - vom Inertial-System (i) (7a,b) ausgehend zunächst in den e-frame überführten - Navi-gationszustandsgleichungen vom e-frame in den n-Frame.
Abb. 4: Erdfester Bezugsrahmen (e-Frame) und bewegter Navigationsbezugsrahmen
(n-Frame)
96
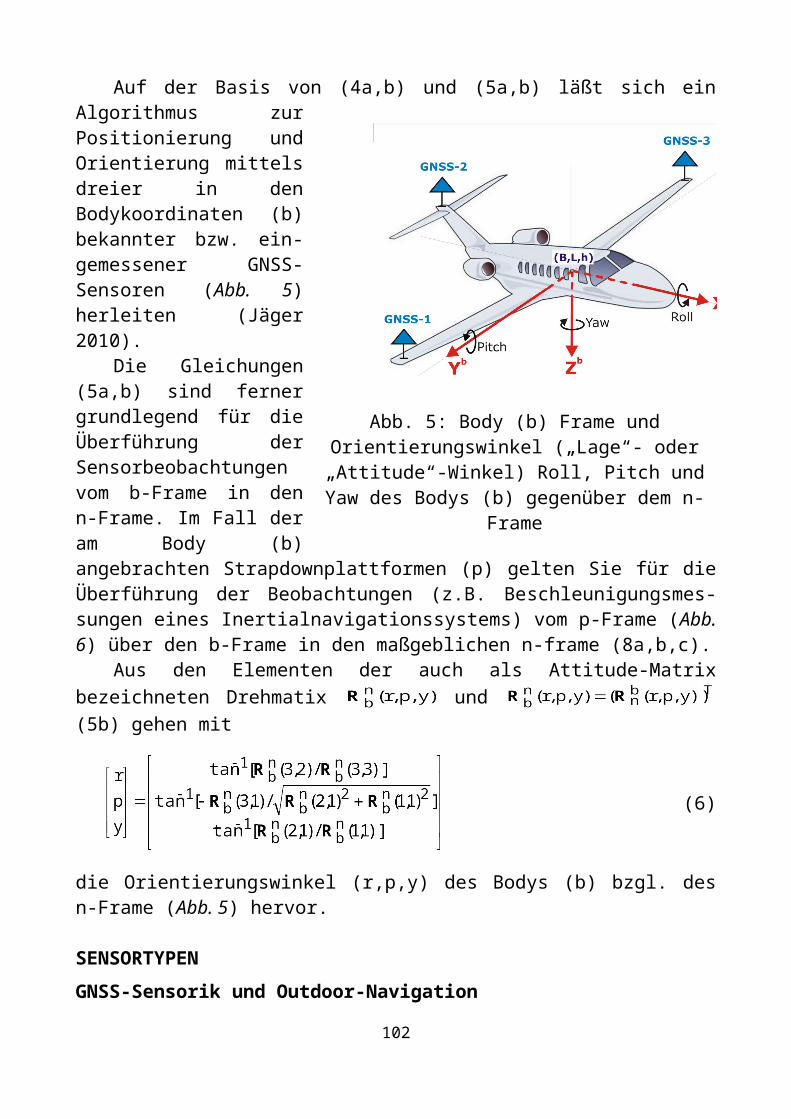
Auf der Basis von (4a,b) und (5a,b) läßt sich ein Algorithmus zur Positionierung und Orientierung mittels dreier in den Bodykoordi-naten (b) bekannter bzw. ein-gemessener GNSS-Sensoren (Abb. 5) herleiten (Jäger 2010).
Die Gleichungen (5a,b) sind ferner grundlegend für die Überführung der Sensor-beobachtungen vom b-Frame in den n-Frame. Im Fall der am Body (b) angebrachten Strapdownplattformen (p) gel-ten Sie für die Überführung der Beobachtungen (z.B. Be-schleunigungsmessungen ei-nes Inertialnavigations-systems) vom p-Frame (Abb. 6) über den b-Frame in den maßgeblichen n-frame (8a,b,c).
Aus den Elementen der auch als Attitude-Matrix bezeichneten Drehmatix und (5b) gehen mit
(6)
die Orientierungswinkel (r,p,y) des Bodys (b) bzgl. des n-Frame (Abb. 5) hervor.
SENSORTYPENGNSS-Sensorik und Outdoor-Navigation
Was die Modellbildung zur präzisen GNSS-Positionierung mittels den aus den Satellitensignalen abzuleitenden GNSS-Rohdaten (Code-, Phasen- und Dopplermes-sungen) anbelangt, so wird auf Xu (2007), Bauer (2011), Hofmann-Wellenhof et al. (2008) und Zwiener and Diekert (2012) verwiesen. Die Referenzierung der Satelliten-bahnen basiert auf dem inertialen ECIF (Abb. 2), die Überführung der hieraus resul-tierenden geozentrischen Satellitenkoordinaten (x,y,z)i ins erdfeste (e) ECEF (x,y,z)e
erfolgt mit (2a,b). In den Modellbildungen der seitens der GNSS-Dienste bereit-gestellten Nutzerdaten stehen sich gegenwärtig die Konzepte der absoluten GNSS-Positionierung (Online Precise Point Positioning (OPPP)) unter Einbindung von Zus-tandsmodelldaten (State-Space-Representation (SSR)) in das GNSS-Processing und die klassische differentielle bzw. relative DGNSS-Positionierung über Beobach-
Abb. 5: Body (b) Frame und Orientierungswinkel („Lage“- oder „Attitude“-Winkel) Roll, Pitch und
Yaw des Bodys (b) gegenüber dem n-Frame
97
tungskorrekturdaten (Observation-Space-Related (OSR)) gegenüber. Für letztere ste-hen die auf regionalen Referenzstationsnetzen basierenden cm-genauen GNSS Dien-ste bereit, für welche exemplarisch die in Deutschland aktiven DGNSS-Dienste SAPOS, AxioNet, SmartNet und VRSNow sowie der seitens des IAF/HSKA mit auf-gebaute Moldawische DGNSS-Dienst MOLDPOS (www.moldpos.eu) genannt seien.
Vier unabhängige kommerzielle GNSS-Dienste - Starfire (NavCom/John Deere), OmniSTAR (Trimble), SeaSTAR (Fugro) und VERIPOS (Veripos) - leisten in globaler Flächendeckung entweder über SSR-Daten oder über OSR-Korrekturen derzeit bereits eine Subdezimeter- bis cm-genaue Positionierung. Für 2020 wird der Status „Global-Cm-Level-Accuracy-Anywhere“ prognostiziert (Takasu 2011).
Die Integration von GNSS in Multisensornavigationssysteme zur Zustandss-chätzung y(t)(1) kann sowohl über die GNSS-Position (B,L,h) im sog. Loose- oder Tight-Coupling oder über die o.g. Rohdaten und unter Nutzung von OSR- oder SSR-Daten im sog. Deep-Coupling erfolgen (Wendel 2004, Zwiener und Diekert 2012, Jäger 2005-2012).
Infrastruktur-basierte und autarke SensorenIn den aufkommenden präzisen Indoornavigations-Systemen und Anwendungen
stehen sich die auf Infrastruktursensoren basierte nicht-autarke präzise Navigation und die auf entsprechenden autarken Sensortypen und Algorithmen basierende au-tarke Navigation gegenüber. Bzgl. Infrastruktursensor-basierter Indoornavigations-Konzepte und Systeme wird auf Sommer und Rosenstiel (2012), Saler und Uhl (2012) sowie Günther und Jöst (2012) verwiesen. Sie setzen das Vorhandensein geo-referenzierter diskreter Landmarks (wie z.B. WLAN-Knoten) bzw. im Falle einer auf Bildverarbeitung basierenden Indoornavigation die Georeferenzierung der Innen-raumtopologie voraus.
In diesem Beitrag werden im weiteren Infrastruktur-autarke Sensortypen (Jäger at. al 2012) und entsprechende mathematische Modellansätze vorgestellt, die sowohl Out- als auch Indoor verwendet werden können. Zu den autarken Sensortypen zählen:
Beschleunigungssensoren (Bezug: Inertialsystem (i). Externe Referenzmodelle zur algorithmischen Modellierung: Geopotenzialmodell des Erdschwerefeldes zur Modellierung von g(x) (7a,b) und (2a,b)).
Gyroskope (Bezug: Inertialsystem (i). Externes Referenzmodell zur algorith-mischen Modellierung: (2a,b)).
Neigungssensoren (Bezug: Erdschwerefeld. Externes Referenzmodell zur al-gorithmischen Modellierung: Geopotenzialmodell des Erdschwerefelds).
Magnetometer, Hilfssensor (Bezug: Erdmagnetfeld. Externes Referenzmodell zur algorithmischen Modellierung: Geopotenzialmodell des Erdmagnetfeldes).
Barometer, Hilfssensor (Bezug: Erdatmosphäre. Externes Referenzmodell zur algorithmischen Modellierung: Erdatmosphärenmodell).
ZUSTANDSSCHÄTZUNG FÜR MULTISENSORPLATTFORMENKlassische Zustandsschätzung und NAVKA-Ansatz
98
Die in den vorigen Kapiteln beschriebenen Bezugssysteme und Übergänge sind nicht nur als Zielsysteme der Georeferenzierung des i.A. aus den Komponenten 3D-Position, 3D-Geschwindigkeit sowie 3D-Orientierung (Roll, Pitch (Nick), Yaw (Gier)) bestehenden Navigationsstatusvektors y(t) (1) relevant. Sie treten auch in der Parametrisierung der Sensor-Beobachtungen auf. Für die Zustandsbeschreibung und in den Beobachtungsgleichungen (8a,b,c) und (10a-f) - beispielsweise im Modell einer Kalmanfilterung (Wendel 2004, Zwiener und Diekert 2012) als einem zur Zu-standsschätzung (1) über Multisensornavigationsplattformen geeigneten mathemati-schen Modell - werden insbesondere die zeitlichen Ableitungen von (2a,b), (4a,b) und (5a,b) relevant.
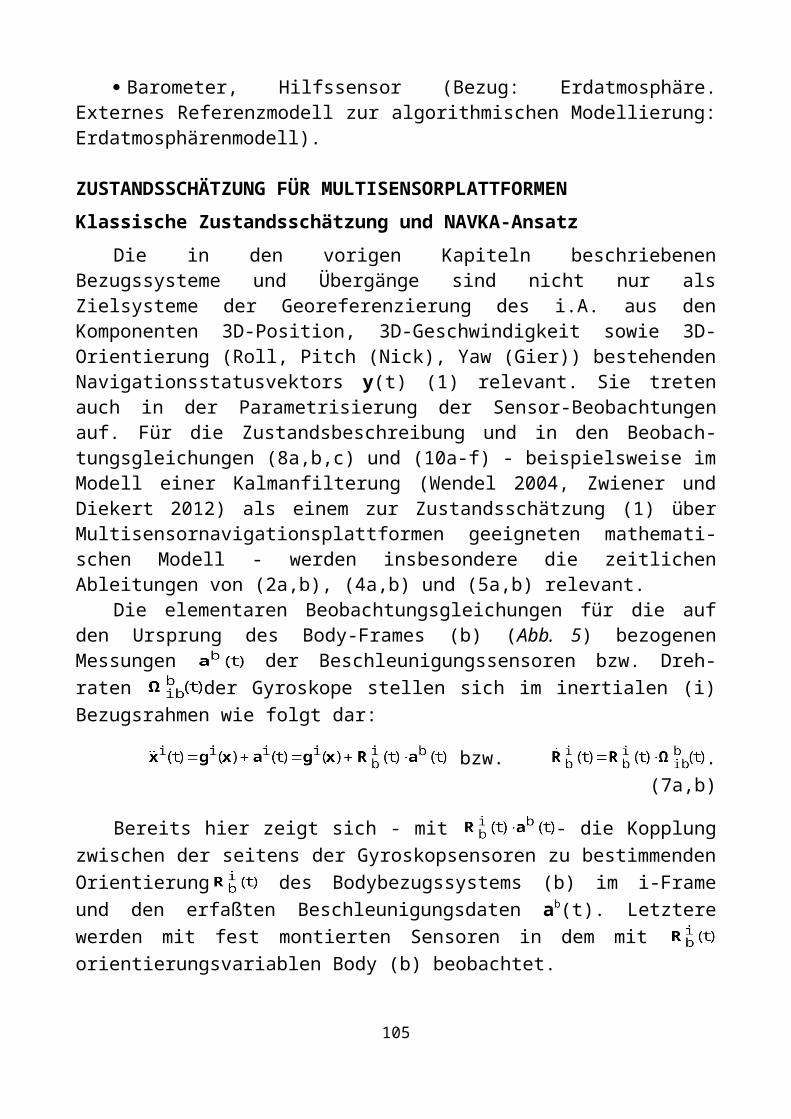
Die elementaren Beobachtungsgleichungen für die auf den Ursprung des Body-Frames (b) (Abb. 5) bezogenen Messungen der Beschleunigungssensoren bzw. Drehraten der Gyroskope stellen sich im inertialen (i) Bezugsrahmen wie folgt dar:
bzw. . (7a,b)
Bereits hier zeigt sich - mit - die Kopplung zwischen der seitens der Gyroskopsensoren zu bestimmenden Orientierung des Bodybezugssystems (b) im i-Frame und den erfaßten Beschleunigungsdaten ab(t). Letztere werden mit fest montierten Sensoren in dem mit orientierungsvariablen Body (b) beobachtet.
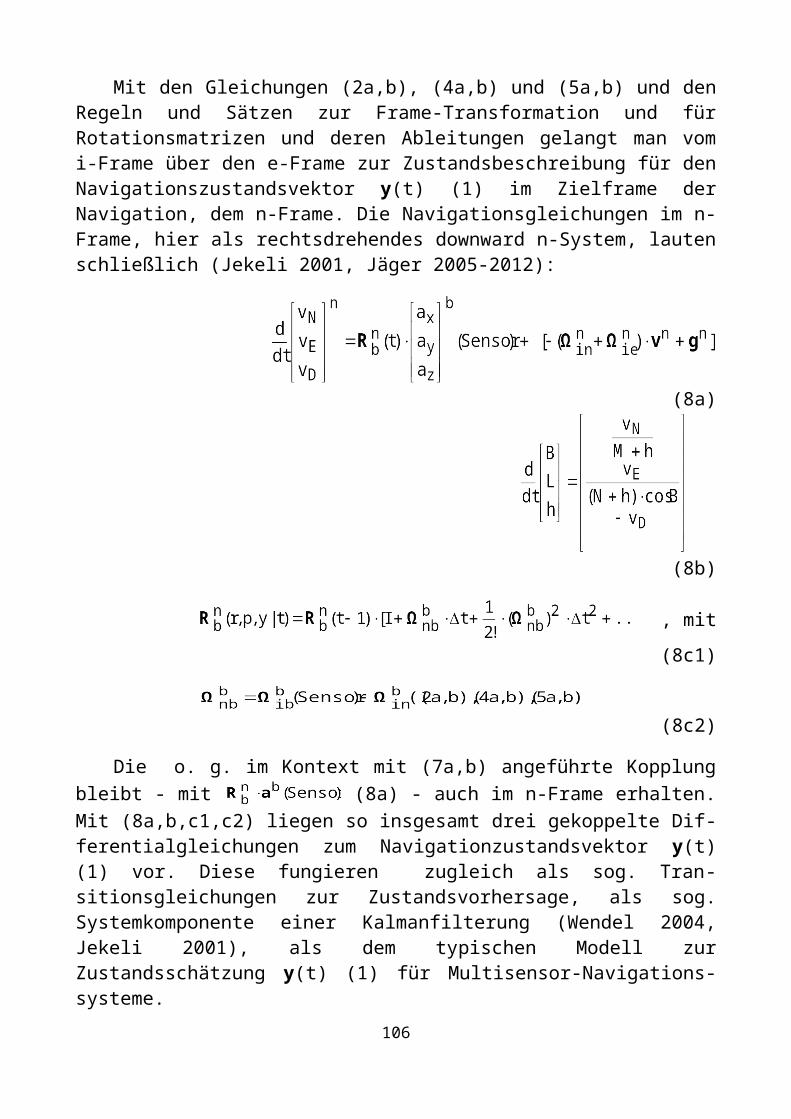
Mit den Gleichungen (2a,b), (4a,b) und (5a,b) und den Regeln und Sätzen zur Frame-Transformation und für Rotationsmatrizen und deren Ableitungen gelangt man vom i-Frame über den e-Frame zur Zustandsbeschreibung für den Navigations-zustandsvektor y(t) (1) im Zielframe der Navigation, dem n-Frame. Die Navigations-gleichungen im n-Frame, hier als rechtsdrehendes downward n-System, lauten schließlich (Jekeli 2001, Jäger 2005-2012):
(8a)
(8b)
, mit (8c1)
(8c2)
Die o. g. im Kontext mit (7a,b) angeführte Kopplung bleibt - mit (8a) - auch im n-Frame erhalten. Mit (8a,b,c1,c2) liegen so insgesamt drei gekoppelte
99
Differentialgleichungen zum Navigationzustandsvektor y(t) (1) vor. Diese fungieren zugleich als sog. Transitionsgleichungen zur Zustandsvorhersage, als sog. System-komponente einer Kalmanfilterung (Wendel 2004, Jekeli 2001), als dem typischen Modell zur Zustandsschätzung y(t) (1) für Multisensor-Navigationssysteme.
Dabei werden in den klassischen Ansätzen die Sensorbeobachtungen - ab(Sen-sor) (8a) und (8c2) – mit zur Zustandsvorhersage von y(t) (1) benutzt. Damit ist dieses Konzept der Kalmanfilter-Modellbildung jedoch fehleranfällig für systematische und grobe Sensordatenfehler (Jäger et al. 2012). Mit den neuen, dem o.g. B.W. Verbundforschungsprojekt gegenständlichen „NAVKA“-Ansätzen, wird dieses Manko behoben, indem in Zustandsbeschreibungen, wie oben (8a,b,c,) keine Sensordaten eingehen. Physikalische Zustandgleichungen wie (8a,b,c) bzw. Vorher-sagemodelle generell werden in NAVKA über y(t) (1) durchweg parametrisch beschrieben. Die Sensordaten treten hier nur in der Komponente der Beobachtungs-gleichungen („Messgleichungen“) der Kalmanfilterung auf und werden dort mit y(t) (1), und gegebenenfalls mit weiteren Hilfsparametern (Zwiener und Diekert 2012, Jäger et al. 2012) parametrisiert.
Die technische Realisierung und der reale Einsatz bzw. die physikalische Mon-tage von Multisensornavigationsplattformen (p) auf Bodys (b) (Abb. 6) machen die Koinzidenz der Koordinatenursprünge von Sensorplattform (p) und den Sensoren (s) auf der Plattform (p) sowie die der Koinzidenz von Plattform (p)- und Bodyursprung (b) - selbst im Sonderfall „Plattform (p) = Body (b)“ - unmöglich. Auch die Paral-lelität der Achsen von Plattform (p), Body (b) und Sensoren (s) kann i. a. weder vo-rausgesetzt werden, noch ist sie - z.B. mit Blick auf ein optimales Sensorplattform- bzw. Plattform-Body-Design - wünschenswert. Die Gleichungen können in der Form (8a,b,c) daher zwar als Transitionsgleichungen für den Navigationszustandsvektor y(t) (1) des Bodys (b) verwendet werden, als Gleichungen für realen Sensorinput können sie aus den zuletzt genannten Hemmnissen aber nicht direkt zur Anwendung kommen. In den Beobachtungsgleichungen realer Sensoren sind daher in jedem Fall zwingend sog. Leverarme (Jekeli, 2001) zu berücksichtigen. Dieses Thema wird im nächsten Abschnitt in allgemeiner Form behandelt.
Leverarm-Modellierung im NAVKA-Konzept Die technische und damit zugleich auch die algorithmische Realisierung von
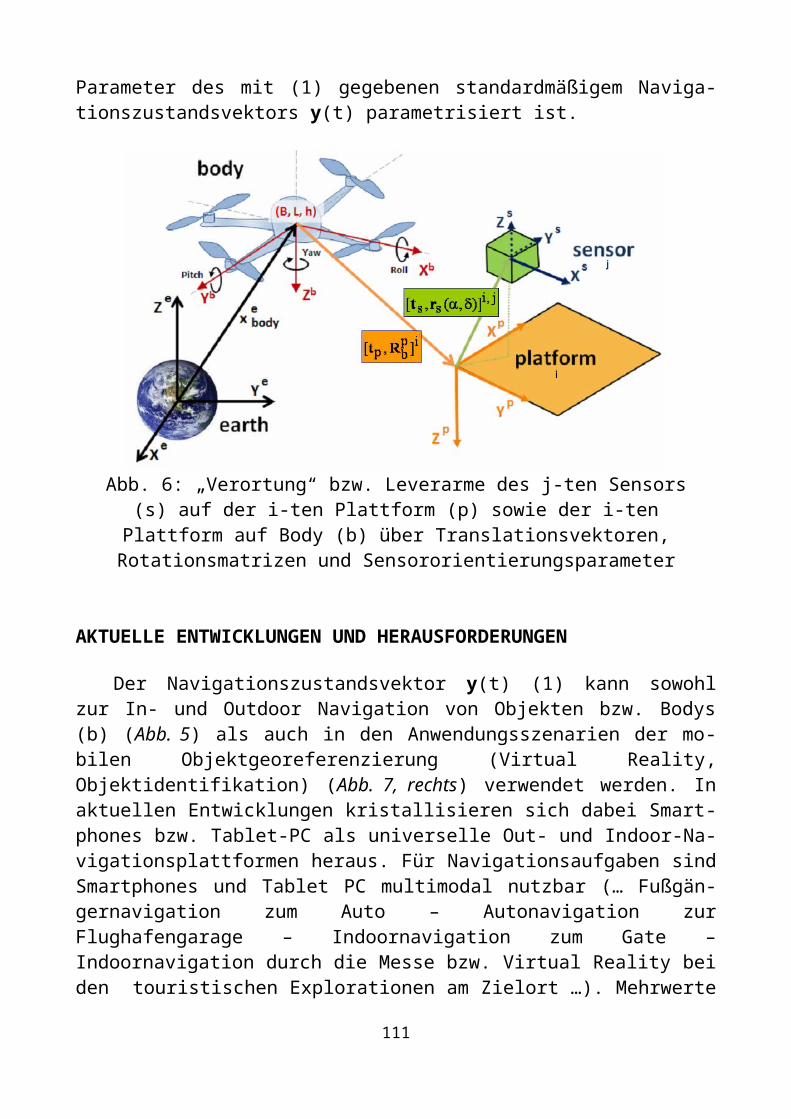
Multisensornavigationsplattformen (p), die relativ zu einem Body (b) montiert sind (Strapdown-Plattformen), sowie das Design der Sensoranordnung (s) auf einer Plat-tform (p) erfordern es, eine „Verortung“ sowohl der Sensoren (s) als auch der Plat-tformen (p) einzuführen. Die entsprechenden Parameter sind als eigene Datenstruk-turen vorzuhalten und sind zugleich auch Bestandteil der Sensorbeobachtungs-gleichungen in Multisensornavigationsalgorithmen. Die „Verortung“ erfolgt, wie in Abb. 6 am Beispiel des Bodys (b) einer Flugdrohne dargestellt, zum einen im Plat-tformkoordinatensystem (p) durch die 5 Parameter der 3D-Position sowie der beiden richtungsgebenden Orientierungsgrößen des j-ten Sensors auf einer i-ten Platt-form . Zum zweiten muß die montagebedingte Position und Orien-
100
tierung der i-ten Plattform (p) im Body-Koordinatensystem (b) durch weitere 6 Para-meter in Form des 3D-Translationsvektors und der 3D-Orientierung der i-ten Plattform algorithmisch behandelt werden. Die Leverarm-Parameter des j-ten Sensors (s) im Koordinatensystem der i-ten Plattform (p) sowie die der i-ten Plat-tform relativ zum Body (b) stellen sich wie folgt dar:
und . (9a,b)
Die Parameter (9b) entfallen, wenn - wie z.B. bei der Fußgängernavigation oder Georeferenzierung mit Smartphones (Bürgy und Diekert 2012) - Plattform (p) und Body (b) koinzidieren. Sie werden aber gleichsam wiederum relevant, wenn das Smartphone als Strapdown-Plattform (p) - z.B. für die Navigation eines Fahrzeuges - verwendet wird. Die 11 Leverarm-Parameter (9a,b) sind daher grundsätzlich Gegen-stand der Parametrisierung der Sensorbeobachtungen von Multisensorplattformen. Dies soll im folgenden am Beispiel der Parametrisierung der Sensordaten eines Be-schleunigungssensors als Komponente eines Multisensorsystems dargestellt werden. Nach Abb. 6 sollen die Navigation und damit die Parametrisierung des Beschleuni-gungssensors in diesem Fall im e-frame erfolgen. Die skalare Beobachtung des j-ten Beschleunigungssensors (s) si,j auf der i-ten Plattform (p) ergibt sich mit der Sen-sororientierung (9a) als Skalarprodukt des Richtungsvektors der Sensororientierung
und dem Beschleunigungsvektor der 3D-Plattformbeobachtung im p-frame. Es gilt:
mit . (10a)
Mit der allgemeinen Transformationsbeziehung
(10b)
erhalten wir die im e-frame parametrisierte Beobachtungsgleichung für die Beschleu-nigungen des Sensors sij als
. (10c)
Die Zustandsgleichungen für den j-ten Beschleunigungssensor (s) auf der i-ten Plattform, si,j lassen sich - ausgehend von (7a) und analog zu (8a) - für das erdfeste System (e) herleiten. Sie lauten dort für einen Beschleunigungssensor si,j (Abb. 6):
. (10d)
Durch Einsetzen von aus (10d,e) in die Sensorbeobachtungsgleichung (10c) werden die Beobachtungsgleichungen in der Beschleunigung im e-frame am Ort des Sensors parametrisiert.
101
(10e)
Die beiden letzten Terme in (10d,e) sind die bekannte Coriolis- sowie die Zen-trifugalbeschleunigung. Die von der Bodyposition ausgehende „Verortung“ des Sen-sors si,j im e-Frame stellt sich mit Leverarm-Parametern (9a,b) dar als:
.(10f)
Das Einsetzen von (10f) sowie der ersten und zweiten zeitlichen Ableitungen von (10f) in die Beobachtungsgleichung (10e) liefert die Parametrisierung der Be-schleunigungssensor-Beobachtung bzgl. Position , Geschwindigkeit und Beschleunigung des Bodys (b) und in Funktion der fixen Leverarm-Parameter (9a,b) (Abb. 6) sowie der Orientierungsparameter und ihrer Ableitungen.
Die Beobachtungsgleichungen weiterer autarker Sensoren in dieser Parametrisierung finden sich in Jäger et. al (2012).
Über die - neben dem Sensor analog auch für den Body geltende – Beschleuni-gungsgleichung (10c) kann wiederum eliminiert und an Stelle von der Be-schleunigungszustandsparameter eingeführt werden. Unter Kopplung an die ent-sprechenden Drehmatrizen kann in transformiert werden, so dass die Sen-sorbeschleunigung (10c) schließlich vollständig durch die Parameter des mit (1) gegebenen standardmäßigem Navigationszustandsvektors y(t) parametrisiert ist.
Abb. 6: „Verortung“ bzw. Leverarme des j-ten Sensors (s) auf der i-ten Plat-tform (p) sowie der i-ten Plattform auf Body (b) über Translationsvektoren, Ro-
tationsmatrizen und Sensororientierungsparameter
102
AKTUELLE ENTWICKLUNGEN UND HERAUSFORDERUNGEN
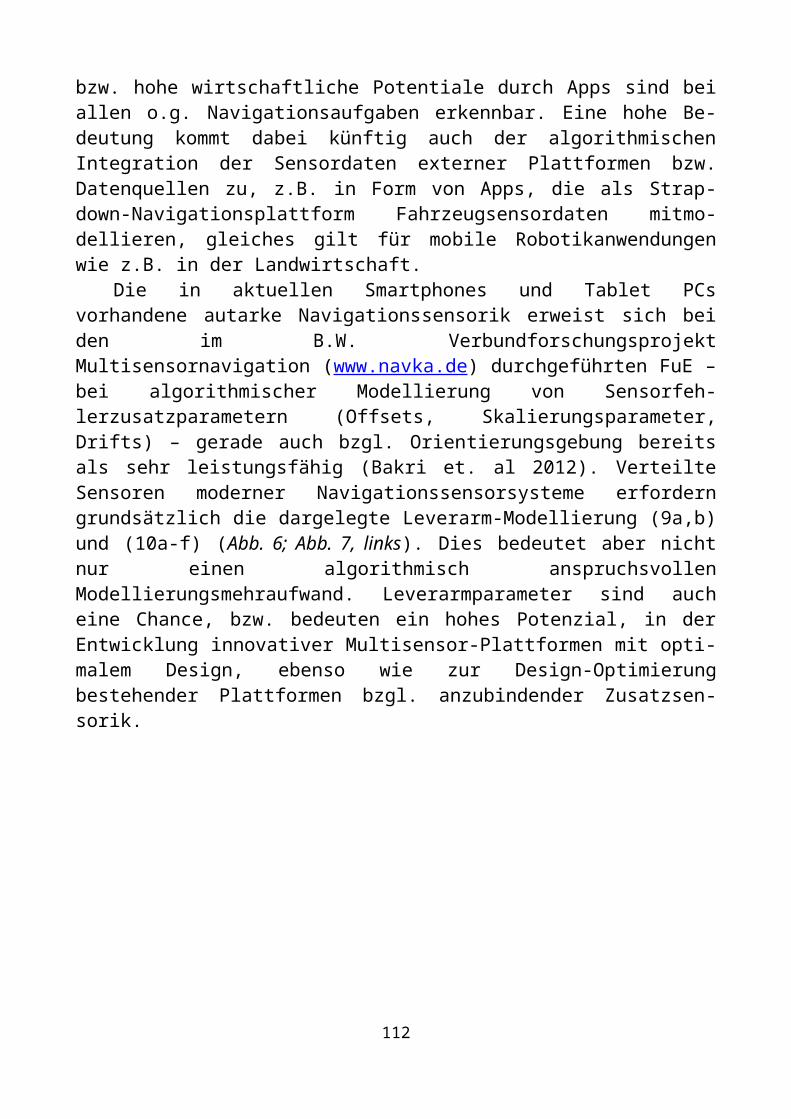
Der Navigationszustandsvektor y(t) (1) kann sowohl zur In- und Outdoor Navi-gation von Objekten bzw. Bodys (b) (Abb. 5) als auch in den Anwendungsszenarien der mobilen Objektgeoreferenzierung (Virtual Reality, Objektidentifikation) (Abb. 7, rechts) verwendet werden. In aktuellen Entwicklungen kristallisieren sich dabei Smartphones bzw. Tablet-PC als universelle Out- und Indoor-Navigationsplattformen heraus. Für Navigationsaufgaben sind Smartphones und Tablet PC multimodal nutzbar (… Fußgängernavigation zum Auto – Autonavigation zur Flughafengarage – Indoornavigation zum Gate – Indoornavigation durch die Messe bzw. Virtual Reality bei den touristischen Explorationen am Zielort …). Mehrwerte bzw. hohe wirtschaft-liche Potentiale durch Apps sind bei allen o.g. Navigationsaufgaben erkennbar. Eine hohe Bedeutung kommt dabei künftig auch der algorithmischen Integration der Sen-sordaten externer Plattformen bzw. Datenquellen zu, z.B. in Form von Apps, die als Strapdown-Navigationsplattform Fahrzeugsensordaten mitmodellieren, gleiches gilt für mobile Robotikanwendungen wie z.B. in der Landwirtschaft.
Die in aktuellen Smartphones und Tablet PCs vorhandene autarke Navigations-sensorik erweist sich bei den im B.W. Verbundforschungsprojekt Multisensornaviga-tion (www.navka.de) durchgeführten FuE – bei algorithmischer Modellierung von Sensorfehlerzusatzparametern (Offsets, Skalierungsparameter, Drifts) – gerade auch bzgl. Orientierungsgebung bereits als sehr leistungsfähig (Bakri et. al 2012). Verteilte Sensoren moderner Navigationssensorsysteme erfordern grundsätzlich die dargelegte Leverarm-Modellierung (9a,b) und (10a-f) (Abb. 6; Abb. 7, links). Dies bedeutet aber nicht nur einen algorithmisch anspruchsvollen Modellierungsmehraufwand. Lever-armparameter sind auch eine Chance, bzw. bedeuten ein hohes Potenzial, in der En-twicklung innovativer Multisensor-Plattformen mit optimalem Design, ebenso wie zur Design-Optimierung bestehender Plattformen bzgl. anzubindender Zusatzsen-sorik.
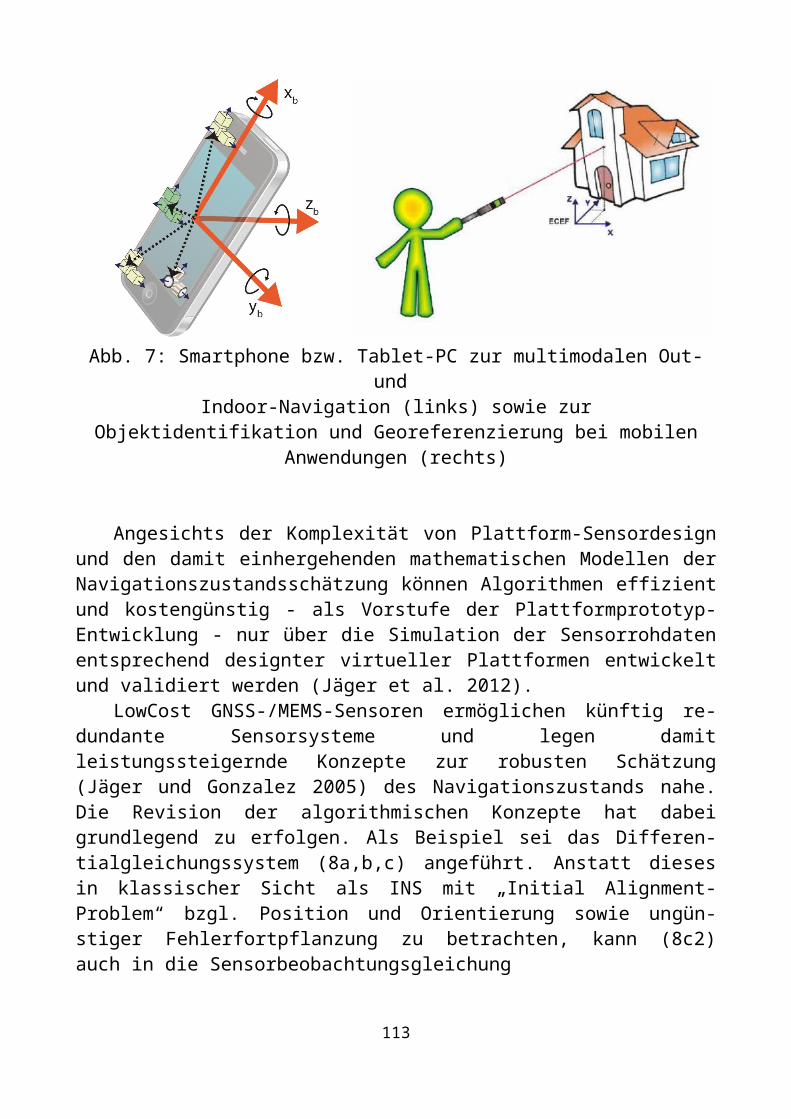
Abb. 7: Smartphone bzw. Tablet-PC zur multimodalen Out- und Indoor-Navigation (links) sowie zur Objektidentifikation und Georeferenzierung
103
bei mobilen Anwendungen (rechts)
Angesichts der Komplexität von Plattform-Sensordesign und den damit einher-gehenden mathematischen Modellen der Navigationszustandsschätzung können Al-gorithmen effizient und kostengünstig - als Vorstufe der Plattform-prototyp-Entwicklung - nur über die Simulation der Sensorrohdaten entsprechend de-signter virtueller Plattformen entwickelt und validiert werden (Jäger et al. 2012).
LowCost GNSS-/MEMS-Sensoren ermöglichen künftig redundante Sensorsys-teme und legen damit leistungssteigernde Konzepte zur robusten Schätzung (Jäger und Gonzalez 2005) des Navigationszustands nahe. Die Revision der algorithmischen Konzepte hat dabei grundlegend zu erfolgen. Als Beispiel sei das Differentialglei-chungssystem (8a,b,c) angeführt. Anstatt dieses in klassischer Sicht als INS mit „Ini-tial Alignment-Problem“ bzgl. Position und Orientierung sowie ungünstiger Fehler-fortpflanzung zu betrachten, kann (8c2) auch in die Sensorbeobachtungsgleichung
(11)
umgeschrieben werden. Ist die Plattform beim „Anzielen“ (Abb. 7, rechts) in Ruhe (= 0), so kann über die Beobachtungsgleichung (11) die Orientierungsbestimmung
direkt erfolgen, so daß die Plattform für Aufgaben der Objektgeoreferenzierung in mobilen Anwendungen bereits auf Basis der Gyroskopsensoren genutzt werden kann. Die faktische Trennung von Positionierungs- und Orientierungsaufgabe erweist sich als Vorteil.
Die notwendige Modellierung zusätzlicher Sensorparameter mündet in Verbindung mit Multisensorik und der Aufgabe der Elimination von Sensordaten-fehlern unter Zuverlässigkeitsaspekten auf robuste Kalman- bzw. alternative Zus-tandsfilterungen in tiefer Kopplung (Deep-Coupling) der Sensorrohdaten. Analog der Entwicklung von Algorithmen zur „Ambiguity-Lösung on the Fly“ bei GNSS besteht in Bezug auf GNSS/MEMS-basierte Multinavigationssensorik gegenwärtig die Her-ausforderung zur Entwicklung mathematischer Modelle der Zustandsschätzung mit „MEMS-Sensorkalibrierung on the Fly“.
Die nahtlose Out- und Indoornavigation birgt sehr hohe Marktpotenziale für künftige Software- und Systementwicklungen. Über diese Entwicklungen hinaus er-strecken sich diese auch auf die weiteren Komponenten der Schaffung, Bereitstellung und der algorithmischen Integration externer Geodateninfrastrukturen (Saler und Uhl 2012). Eine Herausforderung liegt in diesem Bereich auch in der Kombination von autarker und Infrastruktur-basierter Navigationssensorik. Diese Aufgabe erfordert eine weitere algorithmische Integrationsebene z.B. in Form der Zusammenführung von Kalmanfilter- und Partikelfilter.
Bzgl. GNSS bestehen neue Herausforderungen in der tiefen Kopplung der GNSS-Rohdaten zur präzisen multisensorischen GNSS/MEMS-Navigation im LowCost Bereich, insbesondere im Kontext mit SSR-Daten und OPPP. Von Inter-esse für den Massenmarkt (z.B. Smartphones) ist künftig die Ausschöpfung von
104
Linearkombinationen auf drei Frequenzen und Multi-GNSS. Mit der höheren Genauigkeit von Codemessungen z.B. bei GALILEO sind auch Linearkombinatio-nen von Phasen- und Codemessungen relevant. Algorithmen zur DGNSS-Positio-nierung mit OSR-Korrekturen sind für die hochpräzisen LowCost Bereiche, wie kostengünstiges Geomonitoring und smarte RTK-Systeme von Bedeutung. In allen Fällen stehen im Kontext mit LowCost GNSS und der Kombination mit autarken MEMS-Sensoren auch neue Algorithmen zur Ambiguity-Lösung und Cycle-Slip Elimination in Betracht von FuE.
Literaturverzeichnis
Bakri, A., Hoscislwaski, A. und E. Zerr (2012): App-Entwicklung zur Multisen-sornavigation unter Android™. Karlsruhe Geowissenschaftliche Schriften (KGS), Reihe B. Band 7. ISBN 978-3-89063-106-6.
Bauer, M. (2011): Vermessung und Ortung mit Satelliten. 6. Aufl., Wichmann.Bürgy, C. and J. Diekert (2012): Mobile Computing - Neue Potenziale für
präzise Indoor-/Outdoor-Navigation, Objektreferenzierung und Augmented Reality. Karlsruhe Geowissenschaftliche Schriften (KGS), Reihe B, Band 7. ISBN 978-3-89063-106-6.
Günther, C. und M. Jöst (2012): Infrastruktursensorik-basierte Smartphone-Na-vigation für Messen, Shopping-Center und Flughäfen. Karlsruhe Geowissen-schaftliche Schriften (KGS), Reihe B, Band 7. ISBN 978-3-89063-106-6.
Hofmann-Wellenhof, B., Lichtenegger, H. uand E. Walse (2008): GNSS - Global Navigation Satellite Systems 2008: GPS, GLONASS, Galileo, and more: Springer Verlag. Wien.
Jäger, R. and F. Gonzalez (2005): GNSS/GPS/LPS based Online Control and Alarm System (GOCA) - Mathematical Models and Technical Realisation of a Sys-tem for Natural and Geotechnical Deformation Monitoring and Hazard Prevention. ISGDM IAG-Symposium 2005. IAG Series on Geodesy Symposia. Springer Heidel-berg and New York. ISBN 3-540-38595-9. S. 293 – 304.
Jäger, R. (2010): Geodätische FuE-Projekte im Bereich GNSS-Echtzeittechnolo-gien und Mobile IT. Forschung aktuell 2010. Hochschule Karlsruhe Technik und Wirtschaft. ISSN 1613-4958. S. 41-45.
Jäger, R. (2005-2012): Vorlesungsskript zur Navigation. Masterstudiengang Ge-omatics, Fakultät für Geomatik, HSKA.
Jäger, R., Diekert, J., Hoscislawski, A. und J. Zwiener (2012): SIMA – Raw data Simulation Software for the Development and Validation of Algorithms for GNSS and MEMS based Multi-Sensor Navigation Platforms. Paper Presented to the FIG Workshop. Rome, May 2012.
Jekeli, C. (2001): Inertial Navigation Systems with Geodetic Applications. De Gruyter, Berlin, New York.
105
Saler, H. und J. Uhl (2012): Geodatenstrukturen für Indoor-Navigation. Karls-ruhe Geowissenschaftliche Schriften (KGS), Reihe B. Band 7. ISBN 978-3-89063-106-6.
Sommer, J. und W. Rosenstiel (2012): Infrastruktursensor-basierte Navigation. Karlsruhe Geowissenschaftliche Schriften (KGS), Reihe B, Band 7. ISBN 978-3-89063-106-6.
Takasu, T. (2011): Precise Positioning Technologies in „Multi-GNSS-Era“. Pro-ceedings ION GNSS 2011, Portland, Oregon/USA.
Wendel, J. (2004): Integrierte Navigationssysteme. Oldenbourg Verlag. München.
Xu, G. (2007): GPS – Theory, Algorithms and Applications. Springer Verlag.Zwiener, J. and J. Diekert (2012): Multisensorfusion zur autonomen Navigation
und Objektgeoreferenzierung. Karlsruhe Geowissenschaftliche Schriften (KGS), Reihe B. Band 7. ISBN 978-3-89063-106-6.
AcknowledgementThe funding of the Joint Research Project „GNSS/INS and multi-sensor
navigation algorithms and platforms for mobile navigation and object geo-referencing“for three years (2011-2013) by the Ministry of Economics, and the navigation and mobile IT industry of Baden-Württemberg. is gratefully acknowledged.
Biographical Notes Prof. Dr.-Ing. Reiner Jäger Professor for Satellite and Mathematical Geodesy, Adjustment and Software
Development at Karlsruhe University of Applied Sciences (HSKA). Head of the HSKA Laboratory of GNSS and Navigation. Head of the IAF Institute of Geomatics at HSKA. Head of the joint RaD project "GNSS-supported lowcost multisensor systems for mobile platform navigation and object geo-referencing” (www.navka.de).
Honorary Professor at the Siberian State Academy of Geodesy (SSGA)Member FIG Commission 5 WG 5.4 Kinematic Measurements
Contact Prof. Dr.-Ing. Reiner Jäger University of Applied Sciences – Institute of Applied Research (IAF). Moltkestraße 30. 76137 Karlsruhe, GERMANY Tel. +49 (0)721 925-2620 Fax +49 (0)721 925-2591 Email: [email protected]: www.navka.de
© R. Jäger, 2012
106
УДК 528.91
НОВЫЕ ТЕХНОЛОГИИ И ИХ ПЕРСПЕКТИВЫ ДЛЯ ГЕОИНФОРМАТИКИ
Готтфрид КонечныйГанноверский университет им. Лейбница, Nienburger Str.1, D-30167 Ганновер, Германия, засл. профессор, почетный профессор СГГА, тел/факс: 0049-511-762-2483, e-mail: konecny @ ipi . uni - hannover . de
Прогресс геоинформационной технологии зависит от новых технологий, появляющихся в ходе научно-технических разработок. Они открывают новые возможности для дисциплины целым рядом применений:
- ГНСС позиционирование- цифровое изображение- спутниковое изображение- обработка стерео изображения- радарное и лазерное сканирование- достижения компьютерной технологии- технология баз данных- веб-приложения- технология мобильной связиЭти применения делают геоинформатику более эффективной и позволяют решать те
задачи, которые раньше невозможно было решать.
Ключевые слова: геодезическая технология, техническое новшество, позициони-рование, аэрокосмическое изображение, лазеры, закон Мура, базы данных, веб-приложения, мобильная связь.
TECHNOLOGY INNOVATIONS AND THEIR CHALLENGES FOR GEOINFORMATICS
Gottfried KonecnyLeibniz University Hannover, Institute for Photogrammetry and Geoinformation, Nienburger Str.1, D-30167 Hannover, Germany, Emeritus Professor, Honorary Professor of SSGA, office/fax: 0049-511-762-2483, e-mail: [email protected]
107
Progress in geoinformatics technology depends on technological innovations introduced by other scientific and engineering developments. These offer challenges to the discipline in a variety of applications, such as:
- GNSS positioning satellites- digital imaging- satellite imaging- stereo image processing- radar and laser scanning- computer technology advances- data base technology- web applications- mobile communication technologyThese applications make geoinformatics more efficient and they help to complete tasks previ-
ously not possible to undertake.Key words: surveying technology, technical innovation, positioning, aerial imaging, satellite
imaging, lasers, Moore´s Law, data bases, web applications, mobile communication.
1. Introduction
The Surveying and Mapping disciplines are an applied technology. From the very beginning they have used inventions of science and technology for the purpose of measuring and describing the earth´s surface and their objects. Survey instruments, such as the theodolite were not created by surveyors, but by mechanical craftsmen and optical scientists, and photogrammetry would not have come about without the invention of photography and of aerial platforms.
Willem Schermerhorn, Prime Minister of the Netherlands after 1945 and founder of the ITC, which brought photogrammetry to the developing world, said at the 50th Anniversary of the German Society for photogrammetry in 1959: “None of the designers in photogrammetry were survey specialists. They either came to pho-togrammetry from aviation or as engineers and physicists”.
At the 100th Anniversary of the International Society for Photogrammetry and remote Sensing in Vienna in 2010 the economist Franz Radermacher said: “We all stand on the shoulders of giants, who make our progress possible”.
This is a good reason to make a review of the technological innovations of to-day, which offer challenges to geoinformatics by their application.
One of the economists trying to establish a link between technological innova-tion and the economy was Nikolai Dmitrijevich Kondratjev (1892-1938). He stated, that a paradigm change takes place in society every 40 to 60 years, which leads to sudden improvements in technology and its economic consequences. Kondratjev and his followers identified five Kondratjev cycles since the beginning of industrializa-tion around 1780:
- Mechanical weaving, steam ships, coal and iron technology (1780-1850 power)- Railways, the telegraph, cement, photography (1850-1890 transport)- Electrification, chemistry, the automobile, aluminum (1890-1940 flight)
108
- Electronics, television, nuclear power, space technology (1940-1990 automa-tion)
- Information technology, the Internet (1990-2040 communication).In this context it is interesting to compare, which technologies made available
by others are being adapted to geoinformation tasks.
2. Current Technology Innovations with impact on geoinformatics
These techniques are:- GPS-GNSS geopositioning- Digital aerial photography- Satellite imaging covering the globe- Stereo image processing software- Radar and laser scanning- Computer technology advances- Data base technology- Web applications- Mobile communication technology.
2.1 GNSS-GPS satellite positioning
The GNSS positioning technology permits to determine a geometrical figure of the earth with precise coordinates. Combined with gravity observations the physical figure of the earth may be precisely determined. Extending these observations into a time series, earth rotation and crustal motion may be monitored with high precision, fulfilling the scientific tasks of geodesy.
At the technical level GNSS-GPS permits to create a 3 dimensional terrestrial reference frame. For this purpose the International GNSS Service (IGS) has been es-tablished. It is a voluntary service monitoring GPS and GLONASS performance from more than 200 stations distributed over the globe. This permits to create a global framework for high accuracy geocoding of measurement stations. In this manner fiducial stations for continuous observations for each continent (EUREF, SIRGAS) or each country (SAPOS, SWEPOS) may be established. By these it becomes possible to correct the distance dependent systematic signal errors, which are mainly caused by the ionosphere. With a sufficient density of reference stations (CORS), e.g. every 50 km, positioning with 1cm precision may be obtained (and with 10 km spacing a precision of several mm is possible).
It is of interest, that GNSS positioning with 10cm precision is also dynamically possible in aircraft and other moving platforms.
These high accuracies are of course only attainable with rather expensive GNSS phase receivers costing several 10 000$, while the inexpensive code receivers costing no more than several 100$ only yield 10m relative accuracy positions.
109
Nevertheless, augmented accuracy communication satellite systems, such as EGNOS, WAAS and Omnistar may be used in some parts or all over the globe to permit positioning with simple receivers to precisions in the range of several dm to about 5m.
This makes older methods of positioning, such as triangulation or traversing ir-relevant, unless reception of GNSS signals is inhibited due to high buildings, trees or power lines. In that case GNSS receivers must be used in combination with total sta-tions.
2.2 Digital Aerial Imagery
The era of aerial photography on film, initiated during World War I in 1915 has ended. Kodak and Agfa have stopped to deliver new aerial films. Digital cameras were first introduced in the consumer market, but specialized high resolution systems followed. Aerial frame cameras with CCD arrays extended over limited areas became introduced by Intergraph-Zeiss Imaging with the DMC camera or by Microsoft-Vex-cel with the Ultracam camera series. In competition to the frame cameras, CCD line scan cameras have been introduced by Leica with the ADS40 and ADS80 scanners, which had proved successful from space before. Now that both Leica and Intergraph are part of Hexagon, the competition has stopped. Line scanners have probed to be more beneficial for large area orthophoto generation, while aerial frame cameras are preferred for photogrammetric digital line mapping.
In addition to the cameras mentioned, a great number of other manufacturers have provided digital cameras with somewhat less performance. This performance, however, is still far better than that of old film cameras, as independent comparative tests have shown (e.g. by the German Society for Photogrammetry, Remote Sensing and Geoinformation).
Several of these cameras can also be combined for vertical and oblique uses (e.g. Pictometry) applicable for façade inclusion in city modeling.
Even panoramic cameras have been made digital with the Visionmap A3 (Is-rael), which permits to acquire super large frames, enabling 3 times the productivity of standard frame cameras.
2.3 High Resolution Imaging Satellites
The development of satellite technology since Sputnik in 1957 has been very rapid. Landsat 1 became the first remote sensing satellite with a global coverage in 1972 with a ground sample distance GSD of 80m. Spot 1 in 1986 was the first opera-tional mapping satellite with 10m GSD. The Indian satellites IRS 1C and 1D fol-lowed in 1997. In 1999 Ikonos was launched in the USA with 1m GSD. This was fol-lowed by Quickbird in 2002 with 0.6m GSD, in 2007 and 2008 by World View 1 and GeoEye 1 with 0.5m GSD. Even 0.25m GSD satellites have been announced (Geo-Eye 2).
110
What is equally significant, is that this development is not limited to US satel-lites, but that several other nations now launch high resolution satellites with 2.5m GSD or better, such as: Taiwan (Formosat 2,2m GSD in 2004), India (Cartosat 1,2m GSD in 2005; Cartosat 2,1m GSD in 2007), England (Topsat, 2.5m GSD in 2005), Japan (Alos, 2.5m GSD in 2006), Israel (EROS 1B, 1m GSD in 2005), Russia (Resurs DK1,1m GSD in 2006), Korea (Kompsat, 1m GSD in 2006), Thailand (Theos, 2m GSD in 2008), Nigeria (Nigeriasat, 2.5m GSD in 2008), Dubai (Dubaisat, 2.5m GSD in 2009), China (ZY3,2m GSD in 2011).
Another advance was the capability to permit changing view directions from the satellite. Previously SPOT permitted this by a slow movement of a rotable mirror. With new satellites, such as GeoEye fast rotations of the entire satellite are now pos-sible under star tracker control.
High resolution satellite imagery therefore has become competitive with respect to aerial surveys at medium and small scales.
2.4. Stereo Image processing Software
The early attempts of inefficient automatic stereo image processing, limited by computer hardware, carried out at IBM in 1965 (John Sharp) have now led to effi-cient commercial matching software (Trimble-Inpho, Leica-Erdas, Intergraph, SocetSet and Racurs). This software now permits a semi-automatic creation of digital surface models DSM from stereo imagery.
An even more efficient automatic image processing algorithm has been intro-duced by “Pixel Factory” of EADS, and perhaps also by Microsoft-Vexcel Ultramap.
2.5. Radar and Laser Scanning
Laser scanning, which has become operational, is not the first active sensor use for geoinformatics. Since the 1960´s airborne radar has been operated from aircraft. The development of the synthetic aperture radar SAR has improved the radar resolu-tion for use in aircraft (GEMS) and on satellites (TerraSar X and Tandem X). Radar applications are a useful option, in cas meteorological conditions prevent optical imaging. For mapping radar applications are generally limited to small scale. How-ever, interferometric applications have created new possibilities for change detection of the terrain with high accuracy.
Active sensor technology at large scale has been developed in 3 fields using lasers:
- Airborne laser scanning- Terrestrial laser scanning- Mobile laser scanningAirborne laser scanners have succeeded to become an excellent tool for the sur-
vey of digital elevation models with about double the accuracy, which can be ob-tained by photogrammetry from the same flying height.
111
Moreover, in forested terrain, lasers have become successful in penetrating the foliage, so that laser returns can be received generally from the top and the bottom of vegetation, giving the opportunity to derive digital surface models (DSM) for the top of vegetation or buildings and digital terrain models (DTM) relating to the ground surface.
Terrestrial laser scanning has proved itself very suitable for the survey of engi-neering objects and for objects of cultural heritage.
Mobile laser scanning (in combination with optical images from cameras) has become a tool for the survey of street facades and street furniture.
2.6 Computer Technology
Perhaps the most important impact on the development of geoinformation tech-nology has been the growth of computer tools themselves, characterized by what is usually referred to as “Moore´s Law”. Gordon E. Moore, a co-founder of Intel empir-ically described the performance of computers and the miniaturization of its compo-nents (the number and size of transistors). He found in 1965 that computer perfor-mance grew at an exponential rate. This performance continued to grow exponen-tially from 1971 onward to 2011:
In 1971 the first microprocessor, the Intel 4004 was produced with 2250 transis-tors with 10µm PMOS technology;
In 1985 the 386TM microprocessor with 27500 transistors was introduced with 1.5 µm CMOS technology;
In 2007 the CoreTM multicore processor was created with 45nm technology. The Pentium4 Processor now has more than 100 M transistors.In 2011 trigate transistors were introduced again increasing the number of tran-
sistors which can be accommodated per area, reaching 200B transistors per processor.This resulted in a doubling of computer performance every 18 months, which is
predicted to go on until 2013, and from then on every 2 years for at least the next decade.
But of equal importance now is also the speed of networking between comput-ers, which in recent years has doubled every 9 months.
The stages have been: GPRS 114KbpsBluetooth 723Kbps ISDN 0.144 to 1.544 Mbps Ethernet 10Mbps glass fiber 10GbpsDuring the last 10 years the computer performance has increased 60 times, and
the networking capability 4000 times.This means we are able to tackle tasks we could not do 10 years ago.
2.7 Data Base Technology
112
Linked with the capabilities of computer performance are the software aspects of database technology. While computer storage is no more a handicap, faster data access form the data base can now be achieved by indexing.
Geometric representation in 2D, 2.5D or 3D has been developed with line graph-ics, prevalent in CAD systems (Autocad, Microstation). This took care of mapping and design needs.
Analysis capabilities have been added by GIS Systems with relational data bases, which permitted to store geometry with topological relations in 2D (ESRI Ar-cGIS, Oracle Spatial). These GIS systems permitted to establish geodatabases with mapping and analysis capabilities.
The competition for the efficient vendor developed systems comes from the Open Source Community (e.g. GRASS, PostGre).
2.8 Web Technology
Organizations in charge of administering data bases must be concerned to dis-seminate their data content in whole or in part. This has led to the development of geoportals for viewing the data content and for extracting the relevant graphic and non graphic information.
Geoportals will only work efficiently within a fast computer network. Special concern must be given to the access conditions within the network and if charges for data are to be made, there must be an accounting system included.
2.9 Mobile Communication Technology
The latest trend to make interactive graphical and non-graphical information publicly available is through telecommunication networks using smart phones (I-phone) or tablets (I-Pod).
With new data providers, such as Google Earth, Google Maps or Bingmaps such devices have been able to integrate the geoinformation capabilities:
1) A mobile GIS can integrate aerial images and satellite images2) It can display and superimpose available and augmented maps3) It can incorporate address searches and street views4) It can act as navigation device5) It can incorporate 3D views and 3D city models
Conclusion
1) After 134 years of existence of the International Federation of Surveyors and after 101 years of existence of the International Society for Photogrammetry and Re-mote Sensing, and after 52 years of existence of the International Cartographic Asso-
113
ciation geoinformatics is an independent discipline providing spatial information to the society.
2) We need continuous input from sciences and other engineering disciplines, but the continued growth in computer performance guarantees our own continued growth.
3) The society needs our services, which only we can provide because of our professional interest and concern.
What are the problems geoinformatics is facing? These are more sociological than technical in nature:
1) Do we have political support2) Do the laws protect our professional status?3) What esteem do we have in society as engineers?The answer is that we have to get engaged in social, political and ultimately eth-
ical issues.
© G. Konecny, 2012УДК 528.91:614.8
ГЕОИНФОРМАЦИОННЫЕ ТЕХНОЛОГИИ И УПРАВЛЕНИЕ В КРИЗИСНЫХ СИТУАЦИЯХ
Готтфрид КонечныйГанноверский университет им. Лейбница, Nienburger Str.1, D-30167 Ганновер, Германия, засл. профессор, почетный профессор СГГА, тел/факс: 0049-511-762-2483, e-mail: konecny @ ipi . uni - hannover . de
Геоинформационные технологии предлагают превосходные инструментальные средства для решения проблем, связанных со стихийными бедствиям. Бедствия нельзя предотвратить, но они могут быть прогнозируемы, наблюдаемы и оценены. Уже доказана эффективность дистанционного зондирования.
Для решения проблем, связанных с оказанием помощи при стихийных бедствиях, предлагаются две модели:
1. Государственное агентство, имеющее доступ к геоданным, включая своевременные спутниковые изображения, сильную финансовую, техническую и организационную базу.
2. Для стран, не имеющих такую инфраструктуру, отдел ООН по вопросам космического пространства вместе с международными космическими агентствами предлагает быстрый и свободный доступ к данным по оказанию помощи при стихийных бедствиях.
Ключевые слова: стихийные бедствия, чрезвычайные ситуации, наводнения, цунами, космические агентства, спутниковые изображения.
GEOINFORMATION TECHNOLOGIES AND DISASTER MANAGEMENT
Gottfried KonecnyLeibniz University Hannover, Institute for Photogrammetry and Geoinformation, Nienburger Str.1, D-30167 Hannover, Germany, Emeritus Professor, Honorary Professor of SSGA, office/fax: 0049-511-762-2483, e-mail: konecny @ ipi . uni - hannover . de
114
Geoinformation technologies offer excellent tools for problems associated with disasters. Dis-asters are unavoidable, but they may be predicted, monitored and assessed. Satellite remote sensing has proved to be an effective tool.
For the problems associated with disaster relief two models have proved to be effective:1. A national agency, which has access to geodata including timely satellite images and pos-
sesses strong financial, technical and organizational capabilities2. For those countries, which lack such an infrastructure, the United Nations Office of Outer
Space Affairs in liaison with the international space agencies offers voluntary quick data access for disaster relief.
Key words: disasters, emergencies, floods, tsunamis, space agencies, satellite images.
1. Introduction
As a representative of the International Society for Photogrammetry and Remote Sensing I consider myself part of the science oriented and technical geoinformation community, which in other parts of the world is also called geoinformatics or geo-matics. I follow the rapid technological advances and think about opportunities in my professional field to apply these technologies to combat urgent problems of society.
One of these problem areas is disaster management. Natural and human caused disasters frequently occur, and the technologies in my field offer opportunities, not to prevent disasters, but to make their impacts less severe for society.
2. Possible Actors in Disaster Management
Disaster management may rely on scientific information to predict disasters and their possible mitigation, but it is a matter of management activity requiring decisions and the financial, technical and political infrastructure to become effective.
My first encounter as a member of the geoinformation community with disasters was with the floods of the river Oder (Odra), which severely affected the neighboring countries of Poland, the Czech Republic and Germany. At that time flood mitigation was handicapped by the fact, that separate country administrations did not manage a joint action. As members of the European Association of Remote Sensing Laborato-ries EARSeL some Polish, Czech and German representatives met and made a joint proposal to the European Union for a study on how the use of remote sensing could improve the coordination between the countries to predict, monitor, mitigate and as-sess damages of multinational flood in that region. The proposal was considered as excellent, but it was given to the European Joint Research Center for implementation, and we did not become involved. We were not told the reasons for the rejection of our proposal, but we guessed, that we would have needed political power to imple-ment such a proposal, which the scientific community did not have.
Through EARSeL I had a second encounter for disaster management via the Council of Europe as a technical reviewer for the support given to the Russian Emer-gency Ministry EMERCOM. I was impressed by my visits to the Ministry. They had
115
own meteorological monitoring systems using NOAA and Russian meteorological satellites. They had access to detailed map content in digital form from the former Roskartografia. And they conducted impact analyses for possible disaster situations. For mitigation of actual disasters they were directly linked with the Russian Army.
Of interest were also the EMERCOM studies on the frequency of disasters for different regions of the Russian Federation. It was documented, that at least half of the actual disasters in Russia were caused by humans. Another interesting aspect was the issue of training manuals for disaster relief to the public.
To me this appeared to be the ideal model for disaster prediction, preparedness and mitigation for a large country. This is a capability, as history proved, which was not available in the USA during the New Orleans flood and in Japan for the recent Tsunami.
It was interesting to observe, that for the Indian Ocean Tsunami, a few years be-fore, India refused to accept international aid, since it was felt there, that there exist own national capabilities for the mitigation of the disaster. Sri Lanka, Thailand and Indonesia did not have the infrastructure to do it without international help.
This apparently led to the start of international efforts. Germany, for example, financed a sophisticated Tsunami information system for Indonesia. But at UN Con-ferences it was only the Germans, who would talk about it, and not the Indonesians, which most likely could not maintain such a complex system.
But more effective, than bilateral efforts between two countries was the ap-proach via the United Nations. The UN Office for Outer Space Affairs in Vienna has managed to organize a very effective voluntary collaboration with the World´s Space Agencies. When UNOOSA declares a sudden catastrophic event a disaster, then the Space Agencies will target space data acquisition or rapidly prepare image maps for disaster relief.
As one of the earth observation experts at the German Space Agency DLR in Oberpfaffenhofen, Dr. Reinartz, is a Honorary Professor and lecturer at the Univer-sity in Hannover, we are continuously informed about their involvement in aiding disaster relief, such as for the Indian Ocean Tsunami, the New Orleans Flood, the Wenchuan Earthquake in China, the Haiti earthquake, the Fukushima disaster in Japan and others.
3. Conclusion
Both models for disaster relief, at EMERCOM and through UN-OOSA and the International Space Agencies are highly effective. In the first model (EMERCOM) geoinformation technologies are used as an integrated work flow package. This is needed for the entire chain of relief operations in the disaster areas.
The second model (UN-OOSA) concentrates one the globally applicable part of disaster monitoring through timely space data acquisition, which is technologically not accessible to most third world countries.
© G. Konecny, 2012
116
УДК 528.71:77
ПЛАНИРОВАНИЕ АЭРОСЪЁМКИ В ЭПОХУ ЦИФРОВОЙ ФОТОГРАФИИ ИЛИ ОТ ПОПЕРЕЧЕНОГО ПЕРЕКРЫТИЯ К УКЛОНУ ЗДАНИЙ
Юрий Григорьевич РайзманКомпания Visionmap, ул. Менахем Бегин, 7, Рамат-Ган, 52681, Израиль, зам. директора по науке, тел. +972 3 6091042, e-mail: [email protected]
В статье приводится новый подход к планированию аэросъёмки в эпоху цифровой фотографии.
Ключевые слова: аэросъёмка, ортофотоплан, цифровая камера.
FLIGHT PLANNING FOR THE DIGITAL ERA
Yuri RaizmanVisionmap Ltd, 7 Menachem Begin Rd. Ramat-Gan. 52681, Israel, VP EMEA & Chief Scientist, tel. +972 3 6091042, e-mail: [email protected]
The article describes a new approach for flight planning for the digital era.
Key words: aerial survey, orthophoto, digital camera.
In the era of analog aerial surveys, which spanned almost the entire twentieth century, aerial cameras were standardized, as were the sizes of their images1. Parame-ters such as forward and side overlap between images and strips, and the focal length
1 Standard images are 24 x24 cm or 18 x 18 cm. Focal lengths for 24 x 24 cm images are 150, 210 and 300 mm. Focal lengths for 18 x 18 cm images are 70, 100, 140, 200, 250 and 350 mm.
117
of the camera were used to ensure proper aerial survey execution and assure the qual-ity of orthophoto production.
With the introduction and growth of digital aerial surveying in the past decade, however, the situation has changed. A large variety of airborne cameras with differ-ent frame sizes, CCD resolutions and focal lengths of lenses is available in the aerial survey market. As such, a new approach is needed to specify standards and ensure quality.
This article presents an innovative universal approach to aerial survey planning and orthophoto production that is relevant and appropriate for the digital photogram-metry era.
Fig. 1 shows a typical aerial survey flight planning diagram.
Figure 1. Aerial survey flight planning
Variables in the diagram are as follows:
FOV Camera field of view across the flight line, corresponding to W distance on the ground.
2α Permissible orthophoto angle across the flight line, corresponding to Wo distance on the ground. Only this part of the image is used for orthophoto production.
D Distance between flight lines Q Side overlap2λ (not Permissible orthophoto angle along flight line. This angle is specified by
118
shown) forward overlap. From the orthophoto quality point of view, 2λ must be equal to or less than 2α. In practice, 2λ is generally less than 2α.
This scheme, in principle, is valid for all types of cameras, with only parameter values varying with the camera type.
Fig. 2 presents the impact of permissible orthophoto angle on building leaning and occlusion area on orthophoto.
Figure 2. Building leaning and occlusion area on orthophoto
In this diagram:FOV Field of view, generally, 27° - 110°2α Permissible orthophoto angleL1, L2 Occlusion
BL (Building leaning) = tg(α)*100%; 2α2 > 2α1; L2 > L1;
As the diagram illustrates, a larger orthophoto angle results in greater building leaning and more occluded area on the edge of the image. In fact, the permissible an-gle and consequently, the building leaning are the main geometric parameters defin-ing the metric quality and readability of the orthophoto.
In the following discussion, we will take the recommended values for side and forward overlap for analog cameras as a given. Based on experience and standard procedures, cameras with a focal length of 300 mm are recommended for urban areas,
119
while for rural areas, recommended focal length is 150 mm. The forward overlap P in both cases is expected to be 60%. Side overlap Q is set to 25-30% for rural areas and 35-40% for urban areas. The orthophoto is constructed from a part of the image (Wo) that is bounded by cut-lines that pass around the middle of the overlap area.
When comparing between digital cameras, it is preferable to utilize pixels, rather than millimeters or centimeters as the standard unit of measure. A standard image from an analog camera that is scanned with a resolution of 15 microns will have an equivalent frame size of 16,000 by 16,000 pixels. A focal length of 10,000 pixels cor-responds to the 150 mm length for rural areas and 20,000 pixels to the 300 mm focal length for urban areas. The relationship between the permissible orthophoto angle and the overlap is calculated as follows:
[1]
[2]
Where:2α, 2λ - permissible orthophoto angles across and along flight lines, respectivelyQ, P - side and forward overlapsLq, Lp - frame size in pixels across and along the flight lineF - focal length in pixels
Using these formulas, we have calculated the values for permissible orthophoto angle and building leaning for different cameras based on image parameters from the cameras and commonly used side and forward overlap values. The results are shown in Table 1:
Table 1. Orthophoto angle and building leaning for different cameras
Camera A3 UC EAGLE UC-Xp
UC-Xp wa
DMCII 250
ADS 80
RC-30 / RMK-TOP
Focal length (mm) 300 210 80 100 70 112 62.77 150 300Pixel Size (µ) 9 5.2 5.2 6 6 5.6 6.5 15 15Focal length (pix) 33,333 40,385 15,385 16,667 11,667 20,000 9,657 10,000 20,000Frame size cross track (pix) 62,000 20,010 20,010 17,310 17,310 17,216 12,000 16,000 16,000
Frame size along track (pix) 8,000 13,080 13,080 11,310 11,310 14,656 7,530 16,000 16,000
Frame area (Mpix) 496 262 262 196 196 252 90 256 256FOV across track 110° 27.8° 66.1° 54.9° 73.1° 46.6° 63.7° 77.3° 43.6°FOV along track 13.4° 18.4° 46.1° 37.5° 51.7° 40.2° 42.6° 77.3° 43.6°Forward overlap 60% 60% 60% 60% 60% 60% 60% 60% 60%Permissible angle (2λ) 5° 7° 19° 15° 22° 17° 18° 35° 18°Building leaning at λ 5% 6% 17% 14% 19% 15% 16% 32% 16%Side overlap 40% 40% 40% 40% 40% 40% 40% 40% 40%
120
Permissible angle (2α) 80° 17° 43° 35° 48° 29° 41° 51° 27°
Building leaning at α 84% 15% 39% 31% 45% 26% 37% 48% 24%Side overlap 25% 25% 25% 25% 25% 25% 25% 25% 25%Permissible angle (2α) 93° 21° 52° 43° 58° 36° 50° 62° 33°
Building leaning at α 105% 19% 49% 39% 56% 32% 47% 60% 30%The table indicates that for the same forward and side overlap values, the per-
missible orthophoto angles and consequently, building leaning and occluded areas vary greatly among the cameras.
For a standard 60% forward overlap, for instance, building leaning ranges from 5% to 32%. For side overlap of 40%, building leaning ranges between 15% - 84% among the various cameras, with an even greater range of 19% to 105% building leaning for 25% side overlap.
Smaller building leaning indicates that the “usual” orthophoto approaches more closely the "true" orthophoto, resulting in better readability and superior metric qual-ity of the product.
In Table 2, we calculate the side overlaps for the same set of digital cameras us-ing building leaning values of 60% and 24%, which correspond to 25% and 40% side overlap for analog cameras RC-30 and RMK-TOP in the table above.
For building leaning of 24%, the side overlap values for digital cameras vary be-tween 3% and 80%. An aerial survey with building leaning of 60%, which is typical for an open flat-plain area, can be conducted by only three of the cameras, the Vision-Map A3 , RC-30 and RMK-TOP with F = 150 mm. Due to their relatively small fields of view, the other cameras do not allow aerial survey with these parameters.
Table 2. Forward and side overlap according to building leaning
Camera A3 UC EAGLE UC-Xp
UC-Xp wa
DMCII 250 ADS 80
RC-30/RMK-TOP
Focal length (mm) 300 210 80 100 70 112 62.77 150 300
FOV across track 110° 27.8° 66.1° 54.9° 73.1° 46.6° 63.7° 77.3° 43.6°
Required building leaning (urban area)
24% 24% 24% 24% 24% 24% 24% 24% 24%
Permissible angle (2α) 27 27 27 27 27 27 27 27 27
Side overlap 80% 3% 63% 54% 68% 44% 61% 70% 40%
Required building leaning (rural area) 60% 60% 60% 60% 60% 60% 60% 60% 60%
Permissible angle (2α) 62 62 62 62 62 62 62 62 62
121
Side overlap 60% -142% 8% -16% 19% -39% 3% 25% -50%
For each of the cameras we assessed, we created a flight plan for an open area using forward overlap of not less than 60%, side overlap not less than 25%, ground resolution of 25 cm, permissible orthophoto angle of not more than 60° and aircraft ground speed of 250 knots:
Table 3. Flight plan calculation
Camera A3 UC EAGLE DMC II 250
UC-Xp wa
UC-Xp
RC-30/RMK-TOP
ADS80
Focal length (mm) 300 210 80 112 70 100 300 150 62.77
FOV across track 110° 27.8° 66.1° 46.6° 73.1° 54.9° 43.6° 77.3° 63.7°
FPS (frame/sec) 7.40 0.56 0.56 0.59 0.50 0.74 - - -
GSD (m) 25.00 25.00 25.00 25.00 25.00 25.00 25.00 25.00 25.00
Flight altitude (m) 8,333 10,096 3,846 5,000 2,917 4,167 5,000 2,500 2,414
Forward overlap 60% 93% 93% 94% 91% 94% 60% 60% 60%
Side overlap 59% 25% 25% 25% 25% 26% 26% 28% 25%
Permissible angle (2α) 60° 21° 52° 36° 58° 42° 33° 60° 50°
Frame area (sq. km) 63.51 16.36 16.36 15.77 12.24 12.24 16.00 16.00 5.65
Distance between Flight Lines (m) 9,623 3,742 3,752 3,249 3,233 3,199 2,962 2,887 2,251
The elements of Table 3 are calculated as follows:
1. Forward overlap at an affordable frame rate (FPS) and the specified aircraft speed
2. Side overlap and permissible orthophoto angle are linked and depend on the field of view (see Figure 1). Side overlap cannot be less than 25%, while the permis-sible angle of aerial photography cannot be greater than 60°.
As highlighted in red in the table, only three cameras (A3, RC-30 and RMK-TOP) achieve the maximum permissible orthophoto angle of 60°. A fourth camera, UC-XP, came close to reaching this angle.
By placing the same geometric constraints on all aerial surveys, we can accu-rately compare between existing cameras on the market. The following graph sum-marizes the distance between flight lines from Table. 3.
122
Conclusions
Using parameters such as forward and side overlap to specify orthophoto pro-duction is no longer relevant for aerial surveys to be carried out by today's digital or analog cameras. Due to the wide range of frame sizes, focal lengths and CCD resolu-tions, quality and readability are not determined by overlap. By continuing to use these parameters to specify orthophoto production, we condemn ourselves to mea-surements that are inaccurate, and to pour quality and readability of the orthophoto.
To ensure that orthophotos of the same quality will be obtained from various suppliers, permissible orthophoto angle or building leaning parameters should be specified rather than forward and side overlap.
A thorough understanding of the geometric principles of flight planning allows users of orthophoto services to accurately analyze the performance of available cam-eras, compare their performance, and ultimately, make the right choice for each indi-vidual project. This careful assessment will allow users to conserve material re-sources and save time.
© Yu. Raizman, 2012
123
УДК 528.7
OPENPHOTOGRAMMETRY – КОНЦЕПЦИЯ СТРУКТУРЫ ОТКРЫТОЙ СИСТЕМЫ ОБМЕНА РЕЗУЛЬТАТАМИ ИССЛЕДОВАНИЙ С ОТКРЫТЫМ ИСХОДНЫМ КОДОМ
Евгений Левин Мичиганский технологический университет, Институт технологии, 1400 Townsend drive, Хоутон MI 49931, США, зав. кафедрой прикладной геодезии, доктор наук, сертифицированный фотограмметрист, тел.+1 (906)487-2446, e-mail: elevin @ mtu . edu
Гай ХемброффМичиганский технологический университет, Институт технологии, 1400 Townsend drive, Хоутон MI 49931, США, Хоутон, США, зав. кафедрой администрирования компьютерных сетевых систем, профессор, тел.+1 (906)487-3248, e-mail: hembroff @ mtu . edu
В статье описываются структурные и организационные принципы веб-портала для обмена и аппробации фотограмметрических моделей сенсоров. Ученые фотограмметристы всего мира смогут обмениваться результатами своих работ в форме методов и алгоритмов с помощью описываемого портала. Операции системы будут также иметь академические применения в геопространственном образовании.
Ключевые слова: фотограмметрия, модели сенсоров, системная совместимость, киберинфраструктуры.
OPENPHOTOGRAMMETRY – CONCEPT OF OPEN-SOURCE FREE COLLABORATIVE FRAMEWORK
Euegene LevinMichigan Technological University, School of Technology, 1400 Townsend drive, Houghton MI 49931, Chair of Surveying Engineering, Doctor, Certificated Photogrammetrist, tel. +1 (906)487-2446, e-mail: [email protected]
Guy HembroffMichigan Technological University, School of Technology, 1400 Townsend drive, Houghton MI 49931, Chair of Computer Network System Administration, Associate Professor, tel. +1 (906)487-3248, e-mail: [email protected]
The paper describes a design concept of framework and web-portal for photogrammetric sen-sor models exchange and evaluation. Photogrammetric imaging scientists worldwide will be able to share results in form of methods and algorithms via OpenPhotogrammetry. Activity will also impact geospatial education.
Key words: Photogrammetry, Sensor Modeling, Interoperabilty, Cyberinfrstructures.
SUMMARY
In recent years, the field of Geographical Information Sciences has greatly bene-fited from the dramatic increase in amount and availability of high-quality geospatial imagery. However, remotely sensed imagery cannot be immediately integrated into
124
cyberinfrastructures. This is due to fact that raw imagery obtained from satellites, UAVs, and non-metric terrestrial cameras needs to be processed photogrammetrically before further deployment. Typically photogrammetric processing encompasses: sen-sor calibration, georeferncing based on rigorous sensor model or rational polynomi-als, triangualtiuon with ground control densification, rectification and/or orthorectifi-cation, 3D feature and DEM extraction; and requires use of specialized commercial software licenses. Online photogrammetric processing frameworks do not exist. Cur-rent paper describes a structure of free open-source worldwide-opened consortia and geospatial web-portal challenging photogrammetric processing of remotely sensed imagery.
1. INTRODUCTION
Need in timely and interoperable photogrammetric image processing is recog-nized by geospatial science and technology. Some influential research papers [Clark et al, 2005], [Lillesand et al, 2000] recognizes need for changes in geospatial infor-mation science and technology including needs in open-source interoperable research frameworks [Longley 2002]. This indicates that increased geospatial tools interoper-ability will help in geography and other humanity research success.
The most fundamental approach to the development of open and free pho-togrammetric applications for students and researchers is maintained by ISPRS Com-puter Assisted Teaching Contest group [CATCON]. Few of these systems are avail-able for online use, like [OpenDragon] and Learning Digital Photogrammetry [LDP]. However, those systems a) are mostly oriented for teaching and learning rather then research, and thus deploy a fixed set of test-images without the possibility to upload new images; and b) deals mostly with 3D point-clouds generation and remote sensing then with photogrammetric sensor modeling. Image-independent functionality, but in standalone mode, is provided by Insight3D open-source free system [Insight3D]. GRASS GIS (Geographic Resources Analysis Support System) freeware with power-ful remote sensing functionality is used by many academic institutions worldwide [GRASS].
Very interesting web-based project for close-range cases entitled Architectural Photogrammetric Network tools for education [Arpenteur] has multiple capabilities. It was developed deploying the Java Development Kit (JDK) and based on the JAVA virtual machine 5.0 and Java Advanced Imaging (JAI) library. Unfortunately, project has been inactive since 2008. Google Building Maker for Google Sketchup [GBM] represents a very useful example for integration of some photogrammertic data ob-taining functionality into open geospatial system.
The most useful for further developments open-source resources include: Python Photogrammetry Toolbox [PHT], Stereo Photogrammetry Extractor [SPE] and Basic Image Algorithms library [BIAS].
On cyberinfrastructures [NEC] ,[NEC] side one of the most recent NASA col-laborative network developments is a NASA Earth Observing System (EOS) Higher-Education Alliance (NEHEA) GeoBrain project [Chen et al 2011], [Deng and Di,
125
2010] ,[Di 2003]. Development of open-source web-portal can be integrated and be considered as a data obtaining service for such cyberinfrustructures. The challenges of “OpenPhotogrammetry” are:
Accelerate deployment of remotely sensed geospatial datasets in GIS and vir-tual 3D globes driven decision support system by free photogrammetric processing services;
Enable access to photogrammetric imaging research for educational commu-nities and students from many parts of the world where average price around $10,000 [Petrie ]per photogrammetric software license is not affordable;
Simplify communication and collaboration of photogrammetry researchers by deployment of ubiquitous network services such as LinkedIn, Facebook, Google+, etc.
2. PHOTOGRAMMETRIC SENSOR MODELS AND THEIR INTEROPERABLE DESCRIPTION PRINCIPLES
Deploying rigorous photogrammetric sensor modeling allows extracting the most accurate metrics from real-world geospatial images. For the establishing of “OpenPhotogrammetry” the following geospatial imagery types should be considered in general:
1. Images of metric cameras in central projection, allowing carrying out of stan-dard interior orientation procedure with determination of principal point position, known principal focal distance, and sometimes known optical system distortions. That imagery may be acquired from terrestrial, manned/unmanned aerial and satellite platforms.
2. Images of non-metric cameras in the central projection, with unknown interior orientation parameters. Presently the digital still cameras of such non-metric type are widely distributed, especially from small-UAV.
3. The images received by various scanning systems, including space based. Mostly such imagery includes high-resolution satellite observation systems, such as Landsat, Ikonos, QuickBird, Spot etc, and also aerial scanning system such as Leica ADS line scanner
4. Geospatial imagery obtained as result of active scanning system (LIDAR, SAR, InSAR) data processing. Scanning point-clouds and data are obtained from ter-restrial, aerial and satellite platforms.
Typical geometries of geospatial imagery scanners are shown on Fig. 1.
126
Figure 1 Geospatial scanning systems geometries and physical principles [Sabins, 1987]
“OpenPhotogrammetry” will operate objects representing different types of solutions for various sensors listed above. Sensor models for solutions can be separ-ated in two categories: rigorous sensor models operating physical sensor parameters and generic mathematical models. The most popular of generic mathematical models is a rational function model [Di et al 2003]. A rational function is defined as a poly-nomial divided by a polynomial. Functions can be defined for algorithm fitting, with the independent variables being 1, 2, or 3-dimensional. The power of the rational functions can vary for each dimension as well as for the numerator and the denomin-ator. Space Imaging Inc. and Digital Globe Inc. are replacing rigorous model para-meters by rational polynomials coefficients (RPC) for IKONOS and QuickBird satel-lite imagery respectively. However, due to [Toutin,2000], [Grodecki 2001] pro-cessing scanning-type imagery such as IKONOS by means of rational function poly-nomials in practice produces results 4-5 times less accurate than processing based on rigorous geometrical models. Classical central projection model deploying six para-meters of 3 projection coordinates and 3 rotation angles will work well for traditional metric cameras, but will not provide as good of results as for scanning type imagery. Research of sensor models which work for scanning type imagery and provide an ac-curate result is one of the major topics in today’s photogrammetric sensor modelling research. Open Geospatial Consortia [OGC] in compliance with Federal Geospatial Data Committee [FGDC] established multiple interoperable standards including the
127

most important, for “OpenPhotogrammetry” sensor modeling markup language –Sen-sorML [Botts 2005], [Chen et al, 2011].To achieve mentioned above capability inter-operable, incremental and OGC-compliant photogrammetric imaging and sensors de-scriptions. These descriptions should allow geospatial researchers to modify existing sensor models and include their own sensor models into “OpenPhotogrammetry”. Fig. 2 outlines our initial XML-like object-oriented approach to photogrammetric sensor models descriptors.
Figure 2. Sample of approach to photogrammetric sensor models interoperable description.
It is visible from Fig. 2, that the record for any sensor may support several sen-sor models developed by different researchers. Object-oriented structure is very im-portant for establishment in the future knowledge base of sensors and sensor models that will be opened for queries by any free extension of SQL. It is also important to provide efficient parsers of photogrammetric sensor models and to build functionality controlled by an easy-to-use human-machine interface. The purpose of this interface is to allow selection of appropriate sensor model for teaching and/or research pur-poses with execution of ground control points measurements (if any) and accuracy estimation. Preliminary ideas of human-machine interface design are outlined on Fig. 3. When sensor model parameters are found, “OpenPhotogrammetry” software ser-vice will be able to perform image rectification functionality by combining DEM and source image. Given the opportunity to determine the sensor parameters for specific image or satellite scenes, it will be rational to build another functional capability, tar-geted mostly on geospatial students to manipulate with different views of the same terrain by re-sampling of orthoimage.
< image G-Sat> < SensorML Compliant data> Vendor, Owner,Date Uploaded,Time,Date, Auxiliary data < SensorML Compliant data> <sensor Model> <Author> “Student Johnson” <Author> <Model Name> “Affine transformation” <Model Name> <Number and Names of Sensor Parameters> 6, “a0”,”a1”,”a2”,”b0”,”b1”,”b2” <Number and Names of Sensor Parameters> <ModelMath> “Raw=a0+a1*X+a2*Y; “Col = b0+b1*X+b2*Y; <ModelMath> <sensor Model>* * *< image G-Sat>
128
Figure 3. Initial Design of Sensor Model Manipulation Man-Machine Interface.
Initially this learning application is foreseen as working as demonstrated on Fig-ure 4.
Figure 4. Initial design of OpenPhotogrammetry geospatial sensor model learning application
Image OverView
Source Image to Upload (selection) Auxiliary data, Ground Control Points(GCP) X,Y,Z Enter
Measure GCP on Image
Input/Import data from Camera Calibration Report (if exist)
Fiducials/Reseau Measurements.Interior (if exist)
Select Model Type:RigorousRPCDLTCombined
Specific Sensor Model Selection from the list
Computer
Accuracy Estimation Scrolling ListingResiduals, RMS, Error Ellipses. Save
ResultsExport Metadata
OrthoImage View
Select DEM File or permanent elevation
Select SensorType and Model
Pictorial Sensor Scheme
ResampleResult: Synthetic Image of Selected Sensor Model
Save Image and Metadata
129
By means of the learning application, students will be able to generate various synthetic aerial and satellite imagery and learn from hands-on involvement about var-ious sensor models and systems. The research value of the synthetic images and metadata generated by the application is the testing of new algorithms and sensor models. The advantage of synthetic images coupled with metadata is that all their pa-rameters are known and modeled. Use of these images can help in verification of new sensor model methods, algorithms and software by direct comparisons of the results obtained with source data. In general, DEM is needed for learning “OpenPhotogram-metry” tools execution. It can be uploaded from various geospatial data warehouses when available. Otherwise DEM can be extracted from overlapped geospatial images which may require DSM generation mode development.
Multiple research problems have to be resolved in order to proof a feasibility of the outlined “OpenPhotogrammetry” workflow. As for any complex innovation, it is necessary to resolve several contradictory requirements: a) between openness of the system architecture and necessity to avoid breach of imaging vendors copyrights; b) between optimality of the multi-tier architecture and lack of internet connectivity and connection quality compatible with architecture in many developing countries; c) be-tween interoperability and users-capability of photogrammetric algorithms cus-tomization; and finally d) the fundamental contradiction known as “training versus education” [Levin et al, 2010] well known in concern to educational use of the “OpenPhotogrammetry” framework. Initial problem solving ideas are: via credible user-authorization system(ACXML) resolve problem; a) use virtual machines (VM) [Clark et al,2005] analysis technology and desktop VM clones may help to resolve problem; b) automated QA failure protocols and selection options of user-delivered algorithms is one of the possible ways to resolve problem; c) and finally orientation of man-machine interfaces and overall “OpenPhotogrammetry” design on academic and research (rather than production) use will help to resolve, at least partially, prob-lem d). Learning games elements will also be considered. Another problem which has to be resolved is integration of open-source image compression algorithms for the large imaging files transmission. Medical informatics research [L. Rodney Long], [B.Read] demonstrates some open-source solutions which can be deployed in geospa-tial domain. The following paper sections outline foreseeable solutions to the stated above problems.
3. OPEN-SOURSE SOFTWARE AS “OPENPHOTOGRAMMETRY” SERVICE
Recent years demonstrated great potential of social networks as efficient collab-orative environments capable to even to catalyze revolutions such as “Arab spring”. Samples of efficiently functioning collaborative environments include: NSF Earth Cube[NEC], NASA Earth Exchange[NEX], NASA World Wind[WorldWind], Google Earth[ GE] and other virtual globes [Elvidge and Tuttle 2008]. Facebook, Google+, DropBox and ICloud become a standard way of communication and data exchange worldwide. Specifically LinkedIn [LIN] professional social network al-
130
ready has 220 geospatial and 145 remote sensing related working groups. For being compliant with such ubiqiotous collaborative networks and cyberinfrastructures ”OpenPhotogrammetry” from system architecture standpoint should be implemented as service bus or as it is depicted on Fig. 5. ”Openphotogrammetry” system architec-ture comprises the following components:
Sensor Modeling – to deploy and append interoperable sensor models and georeferencing of raw geospatial data;
Learning/Teaching – for teaching and orthorectifying imagery with plug-ins to OpenGIS and collaborative virtual globes;
Feature Extraction – for overlapped geospatial imaging orientation, 3D fea-ture collection and DEM generation;
OpenAT – for densification of the ground control by analytical triangulation.
“OpenPhotogrammetry” is foreseen as an open-source development within multi-tier client-server and standalone software architectures. Any photogrammetry or geospatial imaging specialist/researcher in the world will be able to contribute new sensor-models and custom processing algorithms for “OpenPhotogrammetry”. Fi-nally “OpenPhotogrammetry” will be seamlessly integrated as a sub-framework into ubiquitous network collaboration tool with capability to execute “OpenPhotogram-metry” related activities even from smart phones.
Figure 5. “OpenPhotogrammetry” system architecture
131
4. SOME ASPECTS OF “OPENPHOTOGRAMMETRY” SYSTEM ADMINISTRATING
To promote integration and consistency, our “OpenPhotogrammetry” architec-ture will inhibit open-source software plugins that we develop to coincide the appli-cation programming interfaces (APIs) of image repositories such as GoogleEarth, NASA Earth Exchange, NASA World Wind, etc. We will develop and enforce secu-rity in a standardized manner to control access of images (e.g. public versus confiden-tial), along with the ability to log or track application's usage.
Plugin Development:We plan to develop a Java image processing program for “OpenPhotogramme-
try” will run either online as an applet or can also be downloaded. It will support all the major photogrammetric image types, such as Tiff,JPG,MrSID and will run on mainstream operating systems, such as Microsoft Windows, Mac OS, and Linux. It will also support multithreading, so image file reading and processing can be com-pleted in conjunction with other tasks. This developed plugins will make it possible to pre-processe geospatial imagery for being integrated into collaborative environ-ments such as Google Earth(via KML/KMZ) and NASA Open Wind(via Java). Im-age zoom capabilities and transformations such as scaling, rotation, and flipping will also be attributes of this software. The “OpenPhotogrammetry” software will be cre-ated using an Java built editor and Java compiler and customized to each image repository. End-users will use their Java-enabled Internet browser, as a client; to con-nect to the “OpenPhotogrammetry” server and either download or run online the ap-plet that we have developed. Once this has been completed, users will be able to con-duct photogrammetric processing and collaborate over an open-source platform.
Security and Logging Enforcement To maintain security and logging of who has access to images accessed on the
“OPENPHOTOGRAMMETRY” system, we plan to integrate the XACML [OASIS-XACML] standard within the proposed architecture. XACML is a security stan-dard for XML data and will serve as a flexible and sound security solution within our open-sourced environment.
XACML ArchitectureThe “OpenPhotogrammetry” XACML architecture will consists of the following
entities:PEP - Policy Enforcement Point◦ Responsible for enforcing policies based on authentication of users and their
respective authorization to access information/services. The PEP describes who/what/when/where is being accessed to the PDP for a confirm/deny response.
PDP - Policy Decision Point◦ Responsible for making admission control and policy decisions in response to
the request from the PEP in regards to the policy store.132
PIP - Policy Information Point◦ A storage point of the policies that will be accessed by the PDP when making
a decision.
Decision MechanismThe XACML PDP has three main contexts. The three are policies, requests and
responses. All three of these are classified in XML format.
The rule evaluations used within the PDP is the most critical part of the “OpenPho-togrammetry”‘s XACML architecture. This request will be matched against policies in place. This request consists of attributes which describe the event to be evaluated, Sub-ject, Resource, Action, (optionally) environment. For example, if a user should have ac-cess view and make changed to confidential image, policies created regarding this user's attributes (e.g. name, rank, employment, status, etc.) would acknowledge these attributes and make a decision based on matching user's credentials and attributes to those associ-ated with the image or metadata. The response from such a request will have a variety of values as seen in Fig. 6. We have classified the response to three values. The first two are self-explanatory, while the third classifies requests that do not correspond to the pol-icy. This is useful for testing purposes and design.
Figure 6. Rule table
SAMLSecurity Assertion Markup Language (SAML) [OASIS-SAML] is an XML
standard for exchanging authentication and authorization data between entities. It consists of a precise syntax and processing semantics in the form of assertions, usu-ally based on categories such as role-based access control (RBAC), which contain statements that are used to make access control decisions. SAML assertions and pro-tocol messages are encoded in XML and are embedded in other structures for trans-port, such as HTTP POST request or XML-encoded SOAP messages. End-users will be assigned SAML attributes based on their affiliation and rank to verify their access to confidential information.
133
Application FlowWhen the application is launched, the end user will be directed to a web page
that we have developed and requesting their login credentials. The user will then en-ter their username and password which and verified with the backend of the software. Based on their attributes, they will be only able to access to what they are permitted. The current system has two mains sections, the user interface which consists of the website and the back end of the PDP. The front end and back end the use were cho-sen carefully and with consideration.
The front end of choice was PHP. This was because we wanted to be able to produce a dynamic web site. PHP provides for many security features including built in functions for one-way hashing and other encryption algorithms. PHP also includes a system for transparent cookie encryption. All these features and functions are part of essentially setting up and maintaining a secure web environment.
The back end will be Java-based. Java was chosen because of its platform inde-pendence and currently available frameworks. This framework was implemented to allow for the correspondence between PHP and a PDP. The user interface is used to interface with the user and the “OpenPhotogrammetry” image and metadata reposi-tory. It can read and write request XML files. This allows for dynamic on-the-fly re-quests to be formed and be prepared to be sent to the PDP. This system uses a system call to interface with the Java backend. Then the XML response returned from the backend will be processed.
LoggingThere are many areas throughout the application that actions are logged into the
database for auditing. This is to provide a necessary means of keeping track of access to the system and the information and images that reside on the “OpenPhotogramme-try”'s design. The following actions are currently planned to be logged:
◦ Logging in◦ Incorrect Password◦ Meta-data access ◦ Image access ◦ User Access
5. CONCLUSION
Success in “OpenPhotogrammetry” development will beneficial for researchers of ISPRS, FIG and many other research communities. Multi-year “OpenPhotogram-metry” research and development effort has potential of being forward-looking, inte-grative and transformative. “OpenPhotogrammetry” opens opportunity for fruitful in-ternational collaborations.
References
134
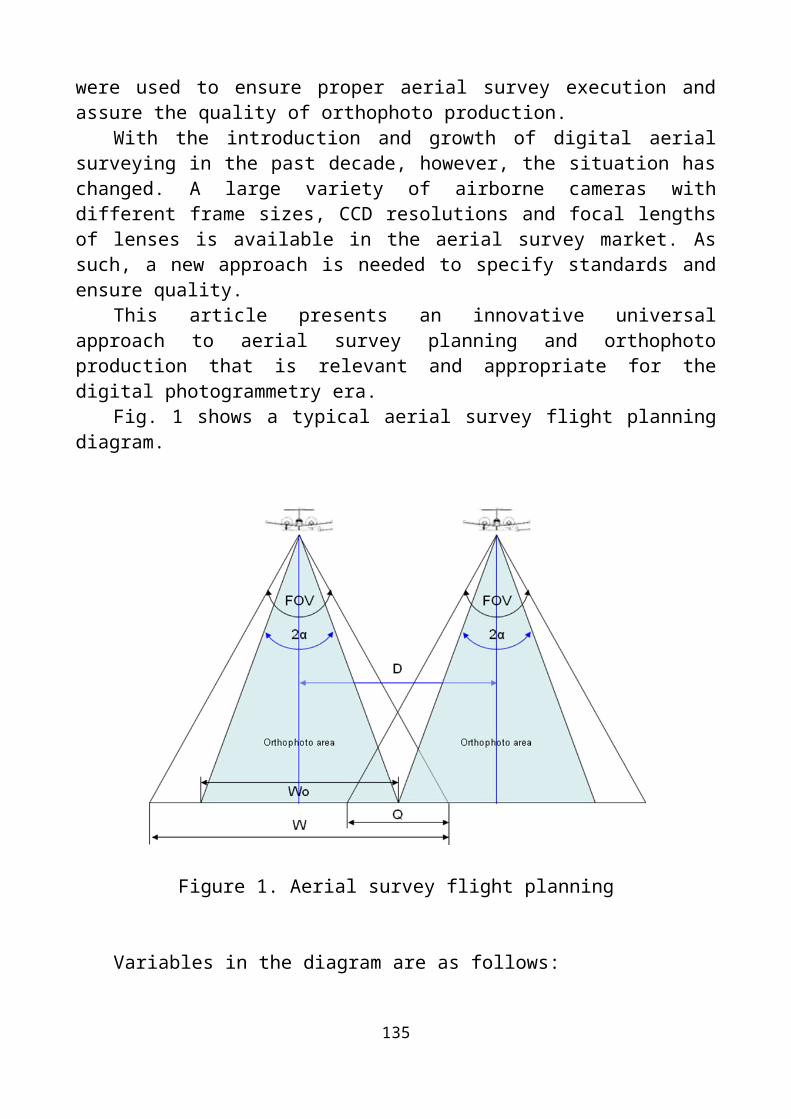
[Arpenteur] ARchitectural Photogrammetric Network Tools for EdUcation and Research: http://sudek.esil.univmed.fr/arpenteur/spip/spip.php?rubrique7, accessed February 2012
[Botts 2005 ] Botts, M. OpenGIS® Sensor Model Language (SensorML). OGC 05-086. Open Geospatial Consortium Inc. http://portal.opengeospatial.org/files/?arti-fact_id=12606
[BIAS] Basic Image Algorithms library: http://mip.informatik.uni-kiel.de/~wwwadmin/Software/Doc/BIAS/html/index.html , accessed February 2012
[CATCON] Computer Assisted Teaching CONtest, http://www.isprs.org/educa-tion/software.aspx , accessed February 2012
[Chen et al, 2011]N. Chen, Z. Chen, L. Di, and J. Gong, “An efficient method for near real-time on-demand retrieval of remote sensing observations,” IEEE J. Sel. Topics Appl. Earth Observ. Remote Sens. (JSTARS), vol. 4, no.3, pp. 615–625, Sep. 2011.
[Clark et al,2005] C. Clark, K. Fraser, S. Hand, J. G. Hansen, E. Jul,C. Limpach, I. Pratt, and A. War eld. Live Migration of Virtual Machines. In Proceedings of the 2nd
ACM/USENIX Symposium on Networked Systems Design and Implementation (NSDI), Boston, MA, May 2005.
[Deng and Di, 2010] Deng, M., and L. Di, Facilitating Data-intensive Research and Education in Earth Science - A Geospatial Web Service Approach. LAP LAM-BERT Academic Publishing GmbH & Co. KG, Saarbrьcken, Germany. ISBN: 978-3-8383-9714-6.
[Di et al 2003] Di, K., R. Ma, and R. Li, 2003. Rational functions and potential for rigorous sensor model recovery, Photogrammetric Engineering & Remote Sens-ing, 69(1): pp. 33–41.
[Di 2005] L. Di “A Framework for Developing Web-Service-Based Intelligent Geospatial Knowledge Systems,” Journal of Geographic Information Sciences. Vol. 11, no 1, pp. 24-28.
[Di 2004] L. Di, GeoBrain-A Web Services based Geospatial Knowledge Build-ing System. Proceedings of NASA Earth Science Technology Conference 2004. June 22-24, 2004. Palo Alto, CA, USA (8 pages. CD-ROM).
[Elvidge and Tuttle, 2008] , C.D. Elvidge, B.T. Tuttle “HOW VIRTUAL GLOBES ARE REVOLUTIONIZING EARTH OBSERVATION DATA ACCESS AND INTEGRATION”, The International Archives of the Photogrammetry, Remote Sensing and Spatial Information Sciences. Vol. XXXVII. Part B6a. pp 137-140, Bei-jing 2008
[GBM] Google Building Maker - http://sketchup.google.com/3dwh/building-maker.html, accessed February 2012
[GRASS] GRASS GIS (Geographic Resources Analysis Support System): http://grass.fbk.eu/, accessed February 2012
[Grodecki, 2001] Grodecki, J., 2001. Ikonos stereo feature extraction – RPC ap-proach. Proceedings of the ASPRS Annual Conference, St. Louis, 23–27 April, un-paginated CD-ROM.
[Insight3D] Free photogrammetric 3D modeling open-source software: http://in-sight3d.sourceforge.net/, last accessed January 2012
135
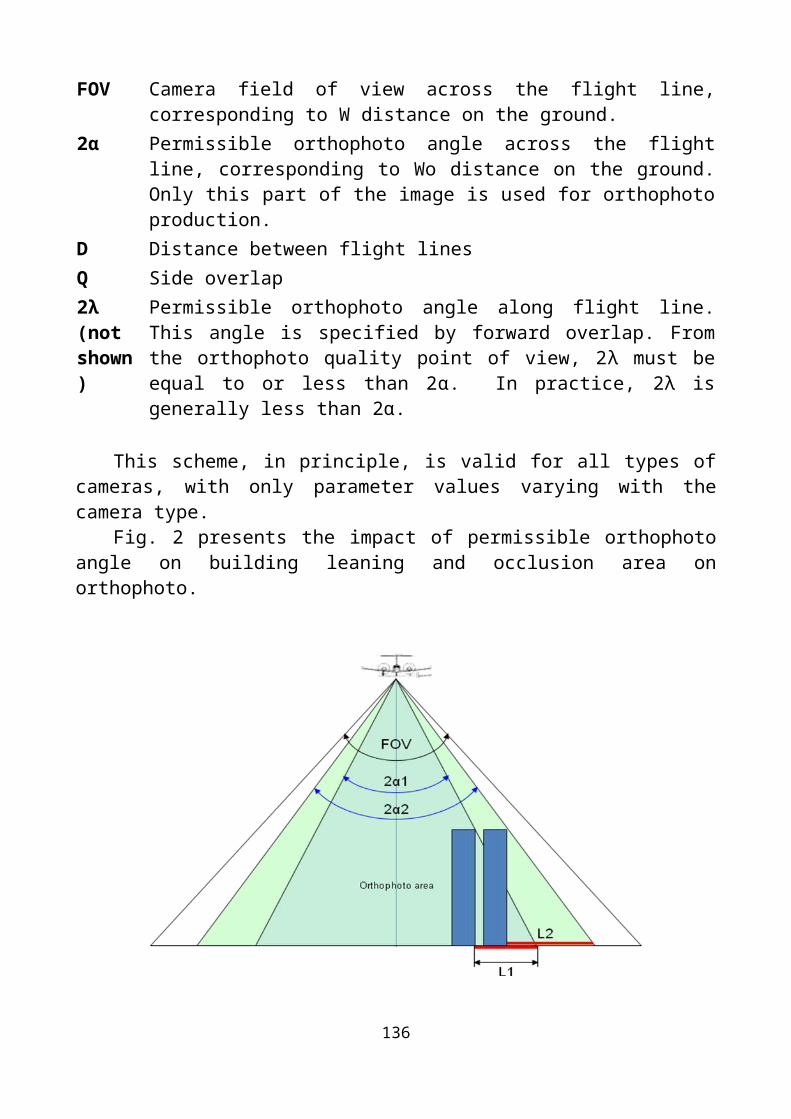
[LDP] Learning Digital Photogrammetry web-site: http://ldipinter2.plan.aau.dk/, accessed January 2012.
[Levin et al, 2010] E. Levin, R. Liimakka, A. Leick, “Implementing a New Geospatial Educational Paradigm at Michigan Tech” Surveying and Land Informa-tion Systems, Vol.70, No 4, pp 211-216, Dec 2010
[Lillesand et al, 2000] Lillesand T., Olsen T., Gage J., McEnany P., ”New para-digm, new approaches: restructuring geo-spatial information education and training in a traditional research university settings.” International Archives of Photogramme-try and Remote Sensing, Vol. XXXIII, Part B6, Amsterdam 2000.
[Longley, 2002] LONGLEY, P.A., 2002, Geographical information systems: Will developments in urban remote sensing and GIS lead to ‘better’ urban geogra-phy? Progress in Human Geography, 26, pp. 231–239.
[B. Read] Berkeley Researchers Develop Technology for Sending Medical Im-ages Via Cellphones http://chronicle.com/blogs/wiredcampus/berkeley-researchers-develop-technology-for-sending-medical-images-via-cellphones/3891 , accessed March 2012
[L. Rodney Long] Transmission of Medical Images over Wide Area Networks: http://www.nlm.nih.gov/research/visible/vhp_conf/long/vh96.htm , accessed March 2012
[LIN] http://www.linkedin.com/groupsDirectory?results=&sik=1330223055536[NASA OpenSource ] http://ti.arc.nasa.gov/opensource/, accessed March 2012[NEC] http://www.nsf.gov/geo/earthcube/ , accessed March 2012[NEX] https://c3.nasa.gov/nex/ , accessed March 2012[OASIS-XACML] OASIS Standard. “Extensible Access Control Markup Lan-
guage (XACML), Version 2.0”. United States. 1 Feb 2005[OASIS-SAML] OASIS Standard. “Assertions and Protocols for the OASIS Se-
curity Assertion Markup Language (SAML), V2.0”. United States. 15 Mar 2005[OGC] http://www.opengeospatial.org/, accessed March 2012[OpenDragon] OpenDragon project web-page http://www.open-dragon.org/
open_object.html, accessed February 2012[PHT] Python Photogrammetry Toolbox http://www.arc-team.com/wiki/
doku.php?id=open_software_ppt-gui, accessed January 2012[Petrie] Dr. Gordon Petrie Web-Links Database available online at: http://
web2.ges.gla.ac.uk/~gpetrie/linksdb.html, accessed February 2012 [SPE] StereoPhotogrammetry Extractor : https://launchpad.net/stereophoto [Toutin, 2000] Thierry Toutin and Philip Cheng, “Demystification of
IKONOS,” GIM Magazine, no 3, pp. 3-12, 2000[WorldWind] http://goworldwind.org/features/
© E. Levin, G. Hembroff, 2012
УДК 528.91
136
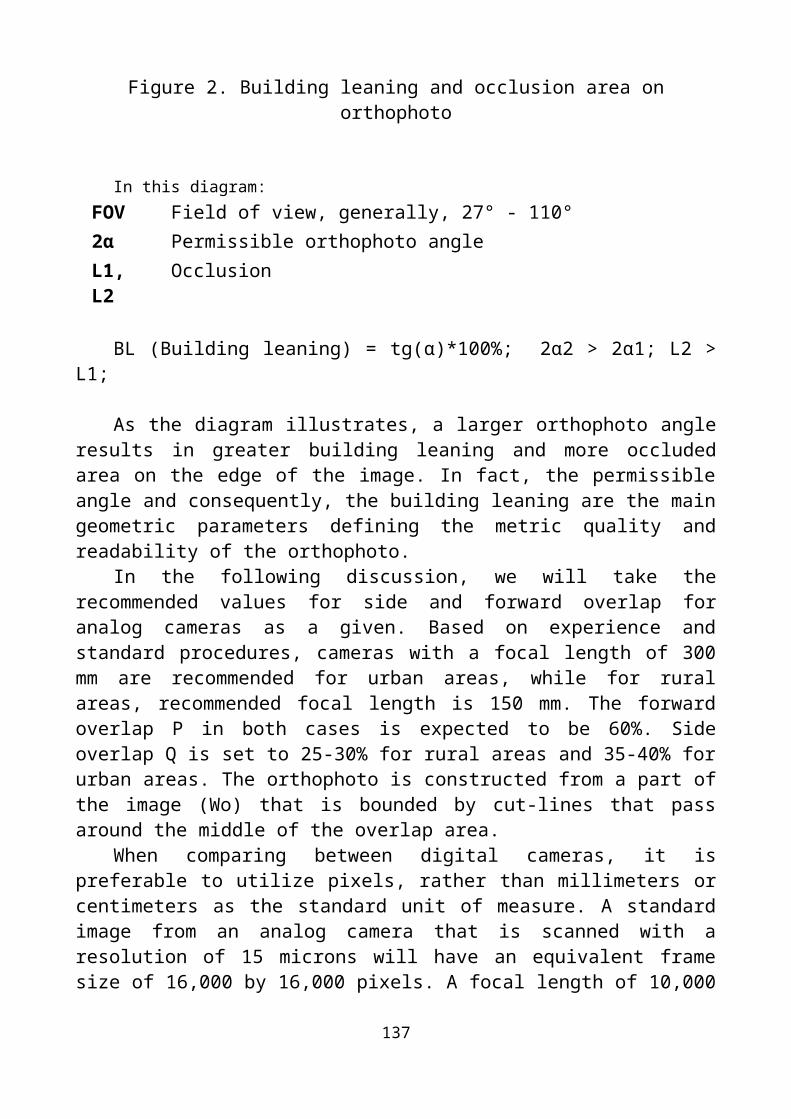
ДИНАМИЧНЫЕ ГИС И ЦЕННОСТЬ ГЕОДАННЫХ
Ирина Ветцель Intergraph Security, Government & Infrastructure (SG&I), CH-9435, Хеербругг, Швейцария, региональный менеджер направления по работе с геоданными в Восточной Европе, тел: +41 71 727 40 17, мобильный: +41 79 826 50 84, факс: +41 71 727 46 91, e-mail: iryna . wetzel @ intergraph . com
Компания ERDAS вместе с компанией Intergraph входит в группу компаний Hexagon AB, Швеция. Основной фокус Hexagon направлен на поставку полезной информации, используя технологии дизайна, измерений и визуализации.
Ключевые слова: динамичные ГИС, геоданные, серверные технологии, взаимная интеграция геоданных, стандарты OGS и ISO.
THE DYNAMIC GIS AND THE VALUE OF GEOSPATIAL
Iryna WetzelIntergraph Security, Government & Infrastructure (SG&I), CH-9435 Heerbrugg, Switzerland, Geospatial Regional Manager Eastern Europe, tel: +41 71 727 40 17, mobile: +41 79 826 50 84, fax: +41 71 727 46 91, e-mail: [email protected]
.Together, Leica Geosystems, Intergraph and ERDAS provide hardware and software tools to
form the Dynamic GIS, from capturing, managing, sharing, and delivering data to transforming vec-tor, raster, and terrain information and securely delivering integrated information products. An inte-grated geospatial system, the Dynamic GIS is able to translate change, on the fly, into actionable in-formation.
Key words: dynamic GIS, geospatial information, location-specific data, server technologies, data fusion, standards Open Geospatial Consortium (OGC®) and International Organization for Standardization (ISO).
The Hexagon group of companies provides a multitude of software, including enterprise engineering software, geospatially powered software, surveying and con-struction software and dimensional metrology software packages.
Intergraph® is the global provider of engineering and geospatial software that enables customers to visualize complex data. Businesses and governments rely on In-tergraph’s industry-specific software to organize vast amounts of data and infuse the world with intelligence to make processes and infrastructures better, safer and smarter. The company’s software and services empower customers to build and oper-ate more efficient plants and ships, create intelligent maps and protect critical infra-structure and millions of people around the world. Intergraph Security, Government & Infrastructure (SG&I) provides geospatially powered solutions to the public safety and security, defense and intelligence, government, transportation, photogrammetry, utilities and communications industries. Intergraph Process, Power & Marine (PP&M) provides enterprise engineering software for the design, construction and operation of plants, ships and offshore facilities.
137
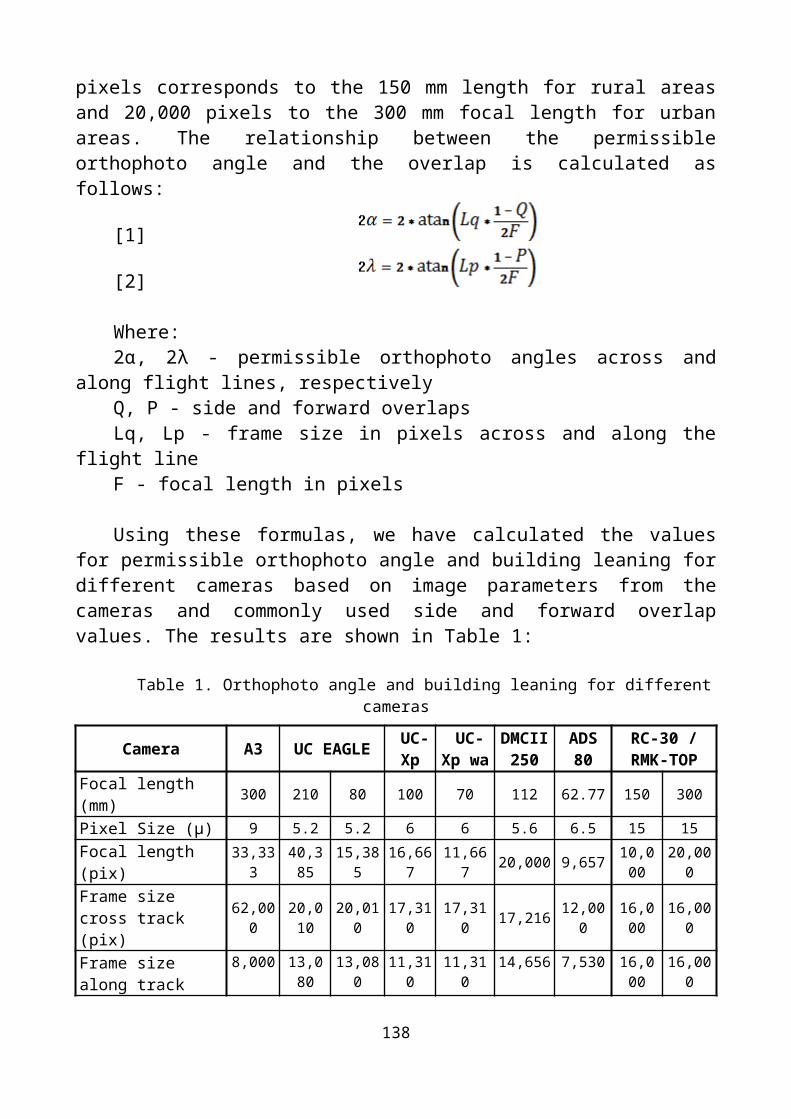
ERDAS creates geospatial business systems that transform our earth's data into business information, enabling individuals, businesses and public agencies to quickly access, manage, process and share that information from anywhere. Using secure geospatial information, ERDAS solutions improve employee, customer and partner visibility to information, enabling them to respond faster and collaborate better.ER-DAS offers a broad range of geospatial information technology software, delivering solutions in image exploitation, processing, visualization and data management. ER-DAS’ solution set include automated capabilities and functionality built into the sys-tem, visualization and delivery, vector editing and topology and Web services, to name a few.
Information about the earth, or geospatial information, is increasingly being used to drive critical decisions in organizations of all sizes. Snapshots of geography can be captured from airborne, orbital, terrestrial, or hand sensors and saved as a per-manent record of events happening on the earth’s surface. When the earth changes, the ability to understand these changes and rapidly share this information can be criti-cal. Integrating geospatial information with the other forms of data an organization maintains adds immense value. In time-critical situations, frequent updates are not enough. As search engines have drastically improved, the ability to find information has advanced from merely quick to instantaneous. Moreover, the advent of blogs and social networking sites has made it easier to publish, share, and view information as events are occurring. Individuals have the ability to do more than just report coordi-nates or capture an image – eyewitnesses now provide live feeds of event-specific, time-specific, and location-specific information about our changing world.
We can sense the real world around us – from space, the air, and the ground. With advances in technology, we can also make sense of captured data with clever al-gorithms for data fusion, feature extraction, and integration with business intelli-gence. Storage, database, and server technologies now support the handling of large volumes of data, making it possible to natively use geospatial data in its raw form and leverage the depth of information available in all these sources. Advances in mobile computing and technology extend the use of geographic data and information, em-powering billions of individuals to be publishers and users of location-specific data and information. Cloud-enabling geospatial applications and platforms further extend the reach of these tools to users beyond the traditional GIS, remote sensing, and pho-togrammetric arenas. With standards from organizations like the Open Geospatial Consortium (OGC®) and International Organization for Standardization (ISO), we now have the means to achieve true interoperability across domains to provide a com-mon language for understanding our earth. Combining the strengths of Intergraph, ERDAS, and Leica Geosystems technologies, Hexagon now offers the industry’s most comprehensive set of geospatial solutions, aligning all the vehicles necessary to make the Dynamic GIS a reality by completely connecting sensors to software and software to solutions (through specific vertical market services) ultimately provides a means to protect lives, infrastructure (property), and society. Leica Geosystems' and Z/I Imaging's technology capture terabytes of imagery that can be used to create and extract valuable geographic information. ERDAS has a legacy of pioneering in image
138
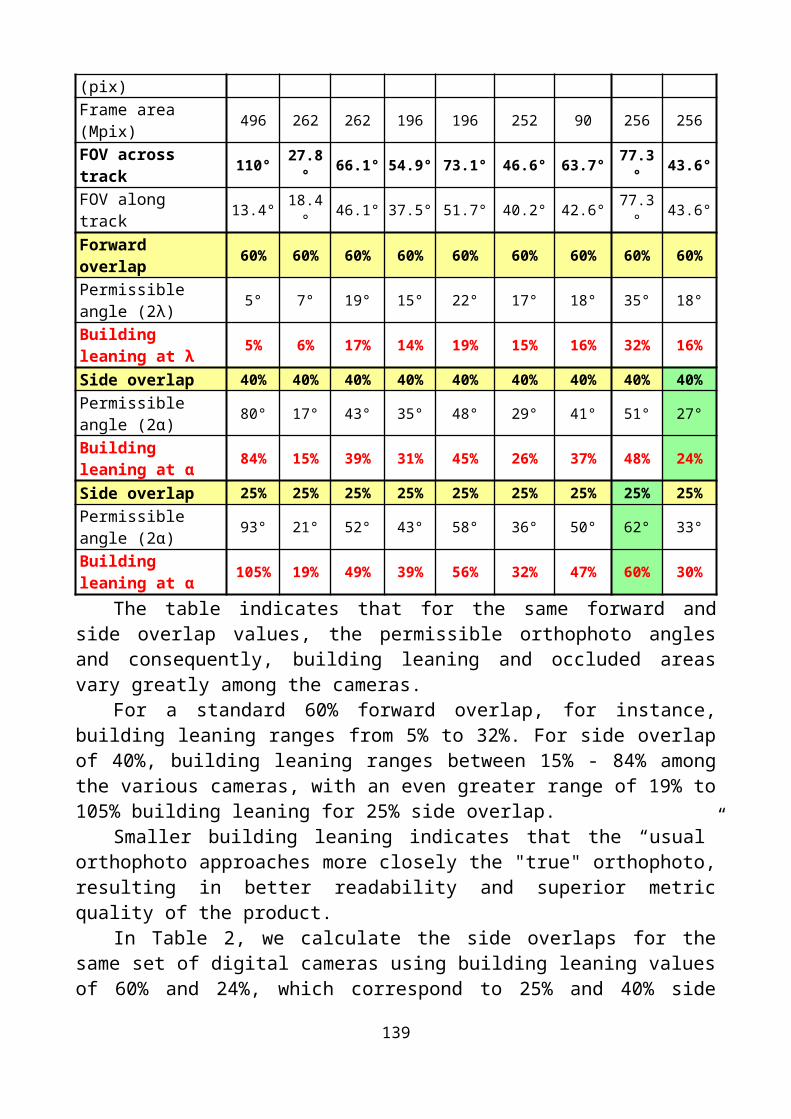
processing and raster handling, maximizing the pixel. Intergraph built a vector-based strategy to build land bases and databases of geospatial intelligence and provides dif-ferentiated and vertically-focused software solutions to core industries that use geospatial data. The Dynamic GIS supports the complete geospatial information life-cycle.
ДИНАМИЧНЫЕ ГИС И ЦЕННОСТЬ ГЕОДАННЫХ
Технологии Hexagon позволяют пользователям создавать, управлять и обмениваться полезной информацией - основы для принятия быстрых, продуманных решений управленческого уровня за счет использования данных из самых различных источников. Hexagon AB это концерн, разрабатывающий высокие технологии, в которых занято порядка 2000 разработчиков и имеет 2100 зарегистрированных и активных патентов. Продажи осуществляются в 170 странах. Развивающиеся рынки составляют 30 процентов от всех продаж.
Интегрированные системы геопространственных данных – или динамичные ГИС системы – способны транслировать изменения на лету в полезную информацию. Эти системы предусматривают наличие в одной технологической цепочке бортовых систем для сбора данных в комбинации с программными продуктами для их последующей обработки и управления ними.
Информация о земной поверхности или геопространственная информация все чаще и в большей мере используется как основа для принятия критически важных решений в организациях любого уровня. Регулярный сбор и регистрация данных дистанционного зондирования, полученных с сенсоров воздушного и орбитального базирования, наземных систем или датчиков, позволяют фиксировать информацию об изменяющихся объектах местности и протекающих на ней процессах. Такие изменения могут происходить чрезвычайно быстро, поэтому наличие актуальных данных, а также скорость и эффективность предоставления доступа к ним со стороны пользователей становится все более критичными. Возможность интеграции пространственной информации с другими видами семантических, описательных и иллюстративных данных внутри организации придает им неоценимое значение за счет обеспечения информационной полноты процесса принятия решений.
В жестко ограниченных по времени критических ситуациях, частая актуализация информации недостаточна. Современные поисковые машин и выполняют задачи поиска уже не просто быстро, а мгновенно. Кроме этого, появление блогов и социальных сетей облегчили публикацию, обмен и просмотр информации о событиях.
Изменения должны быть быстро зафиксированы на снимках, переданы заказчику и скомбинированы с другими данным по событию представляя её максимально информативную картину.
Возрастающий спрос на смежные приложения увеличивает ценность растровых и векторных данных. ГИС, инженерные приложения, фотограмметрия и ДЗЗ могут только частично в силу своей природы
139
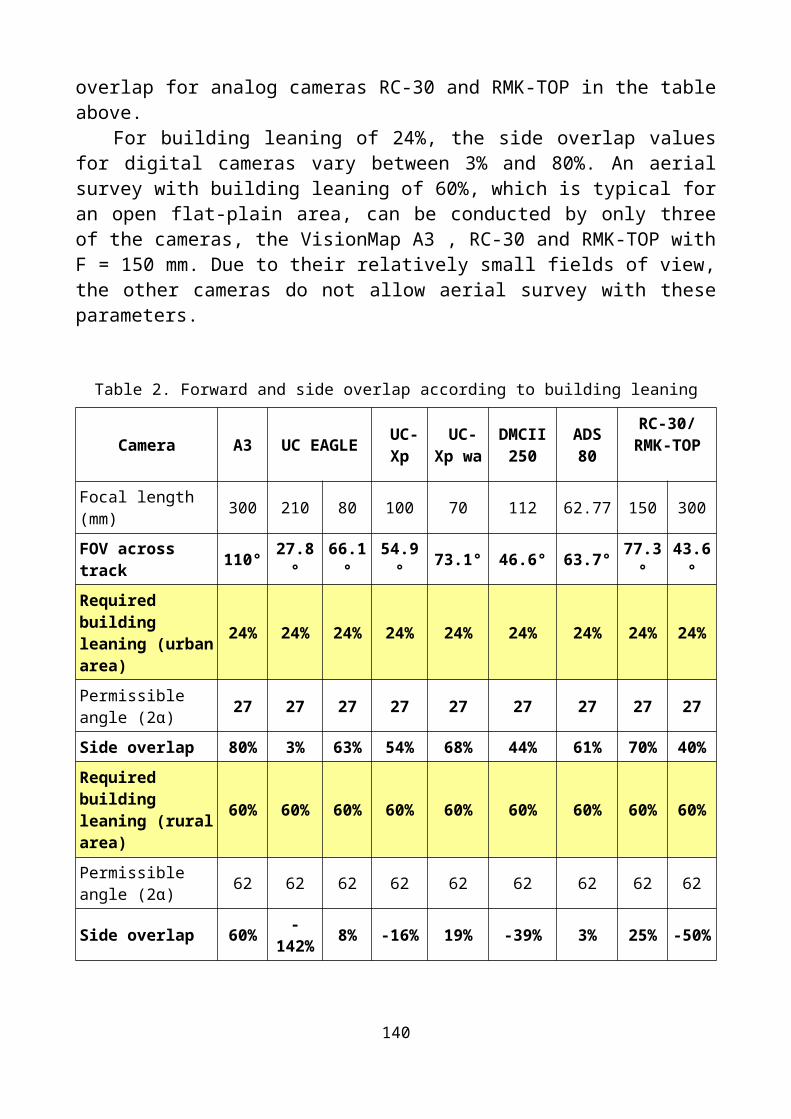
разобраться в происходящем в данном месте. Сохраняя различные виды данных с различной степенью точности, различного масштаба, в несовместимых схемах данных для работы в различных несогласуемым между собой приложениях, уменьшает эффективность их использования.
С развитием технологий, мы можем лучше понять данные, используя умные алгоритмы для слияния данных, выделения по признакам, а также интегрируя данные в бизнес-аналитику. Хранилища, базы данных и серверные технологии поддерживают обработку больших объемов данных, что делает возможным использовать данные в их исконных форматах, таким образом максимально приблизиться к использованию всей глубины источника данных.
Облака точек позволяют еще больше расширить круг пользователей за пределами традиционных ГИС, дистанционного зондирования и фотограмметрии. Благодаря стандартам, таким как Open Geospatial Consortium (OGC ®) и Международной организации по стандартизации (ISO), появились средства для достижения истинного взаимодействия между доменами, чтобы обеспечить общий язык для понимания происходящего на нашей земле.
© I. Wetzel, 2012
140