© kantar retail walmart annual shopper review january 2015
TRANSCRIPT

© Kantar Retail
Walmart Annual Shopper Review
January 2015

© Kantar Retail
2
501 Boylston Street, Suite 6101, Boston, MA 02116
(617) 912- 2828
No part of this material may be reproduced or transmitted in any form or by any means, electronic or mechanical, including photography, recording, or any information storage and retrieval system now known or to be invented, without the express written permission of Kantar Retail.
The printing of any copies for back up is also strictly prohibited.
DisclaimersThe analyses and conclusions presented in this seminar represent the opinions of Kantar Retail. The views expressed do not necessarily reflect the views of the management of the retailer(s) under discussion.
This seminar is not endorsed or otherwise supported by the management of any of the companies covered during the course of the workshop or within the following slides.
Copyright © 2015 Kantar Retail. All Rights Reserved.

© Kantar Retail
‒ Shoppers’ preference for Walmart’s core format continues to decline. Shoppers are visiting the Supercenter less frequently and spending slightly less on each trip, even as they feel they are on relatively steady financial footing overall. As the Walmart shopper base shifts younger and toward smaller households, finding new ways to engage shoppers and to drive traffic—especially beyond edible grocery trips—will be essential.
‒ Perceptions of Walmart’s value proposition remain consistent. Seeking out low prices and finding good deals continue to be the top priorities of Walmart’s core shopper. However, as shoppers also value pleasant shopping experiences, the retailer has ground to make up in specific areas, such as the quality of its fresh assortment as well as its ability to execute basic aspects of the in-store experience such as maintaining in-stock position.
‒ Neighborhood Market penetration is growing, but the format still needs work. The expansion of the Neighborhood Market (NM) footprint provides a valuable opportunity to win shoppers’ increasingly smaller and more frequent trips. But that will require clarifying the value proposition for NM, which right now is a stock-up destination for shoppers. In addition, the high rate of cross-shopping between NM and the Supercenter highlights the potential for cannibalization between the formats, rather than new sales.
Executive Summary: Walmart Shopper Review3
Source: Kantar Retail analysis January 2015
© Kantar Retail
‒ Amazon’s penetration among Walmart’s core shoppers creates a significant competitive threat. Not only is Amazon the top retailer cross-shopped by regular Walmart shoppers, but Walmart shoppers also are more likely to frequent Amazon.com than they are to regularly visit Walmart.com. Creating a shopping experience on Walmart.com that drives frequency and reach will be key.
‒ Shoppers’ engagement with mobile emphasizes the opportunities for engagement. Mobile is starting to change the nature of interactions between shoppers and retailers. The reach of Walmart’s mobile Savings Catcher tool, which launched in summer 2014 and had an almost immediate impact on the depth of the retailer’s relationships with its shoppers, is a prime example. Shopper marketing will need to reconsider the significance of this tool in the years ahead.
Executive Summary: Walmart Shopper Review4
Source: Kantar Retail analysis January 2015

© Kantar Retail
Shopper Penetration– Penetration by banner, channel
– Demographic profile
Shopper Motivations– Financial concerns
– Spending intentions
– Reasons to shop less
– Shopping priorities
Shopping Behaviors in Store– Trips, trip type, and baskets: Supercenters, Neighborhood Market
– Where else Walmart shoppers shop
Brand Position: Price, Assortment, Experience, Access– Value demands and perceived price leadership
– Perceptions of the Walmart shopping experience
Digital Interactions– Mobile engagement
– Savings Catcher
Table of Contents5
January 2015

© Kantar Retail
Penetration at the Walmart Supercenter continues to slowly decline, even as the retailer adds new stores. Shopper traffic to Neighborhood Market (NM) and Walmart.com is increasing as the retailer is making concurrent investments in these developing vehicles.
Shopper Penetration6
Sources: Kantar Retail analysis; store visits; website January 2015
Meanwhile, the profile of the Supercenter and Discount shopper continues to shift. While the regular Walmart shopper still largely skews lower income and larger household, the total shopper base is becoming younger and higher income. In addition, likely in part because the base is getting younger, smaller households are making up a bigger share of Walmart’s base—which will influence what they look for in a one-stop stock-up trip.
The NM shopper is distinctive: younger, more urban, and more ethnically diverse than the Supercenter’s shopper base. In a shift versus previous years, this shopper base’s degree of affluence is now the same as the Supercenters—skewing mid- to low-income (i.e., less than $50,000 a year)—instead of skewing slightly higher income. This shift may influence the types of products sought in store.
Walmart.com’s shopper is also different: the base is younger and more likely to have children at home versus the Supercenter’s core shopper base, making it a particularly attractive audience. Contrary to popular stereotypes, this audience is not more affluent than Walmart’s store shoppers—suggesting that low prices play a key consideration for both Walmart’s digital and store audiences.

© Kantar Retail
Penetration is softening across many channels, as many shoppers curb the number of retailers they shop. The notable exception is the value and quick-trip convenience-oriented value discount channel.
Weekly Shopper Penetration Rate Wanes7
Source: Kantar Retail ShopperScape®, October 2009, 2010, 2011, 2012, 2013, and 2014January 2015
Weekly Shoppers, by Channel2009–2014
PPD
Supermarkets +1.3
Convenience stores -2.3
Mass channel -0.3
Drug stores +0.4
Value discounters/dollar stores +3.2
Warehouse clubs -1.0
Percent of Households Shopping Channel at Least Weekly

© Kantar Retail
Shopper penetration at Walmart’s core big boxes continues to decline, losing 7 percentage points between 2007 and 2014—as Amazon nearly doubled its penetration. Meanwhile, Neighborhood Market’s expansion is boosting its share.
Walmart’s Core Formats Lose Share8
Source: Kantar Retail ShopperScape® , January 2007–September 2014January 2015
Percent Shopped Walmart during Past Four Weeks, by Format
Amazon.com
*Analysis for Neighborhood Market is limited to states in which Neighborhood Market had a presence as of January 2014
© Kantar Retail
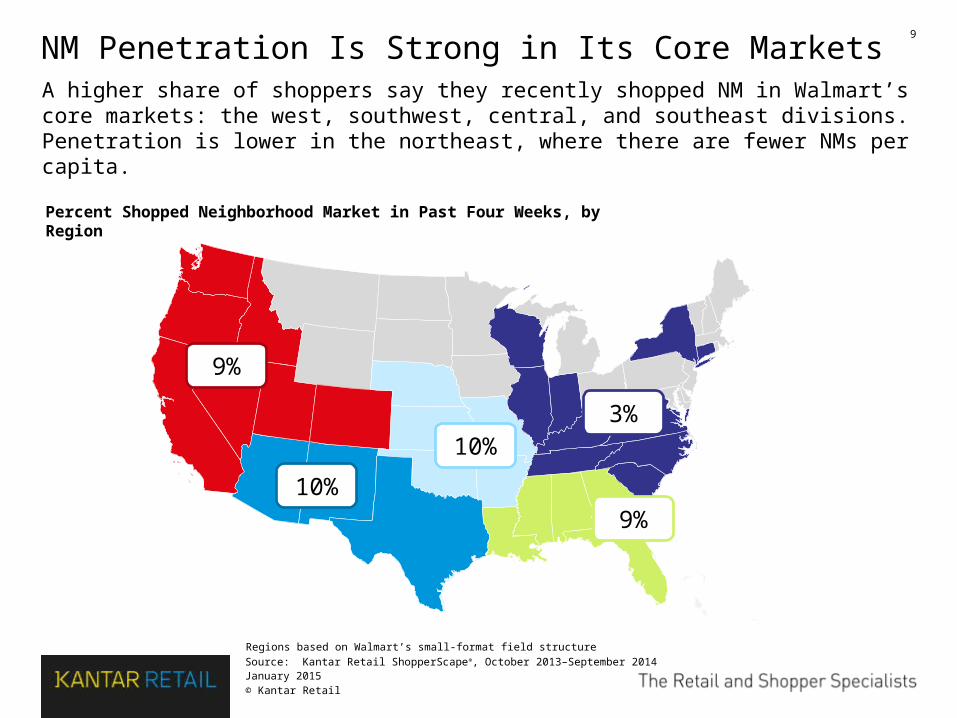
A higher share of shoppers say they recently shopped NM in Walmart’s core markets: the west, southwest, central, and southeast divisions. Penetration is lower in the northeast, where there are fewer NMs per capita.
NM Penetration Is Strong in Its Core Markets9
Source: Kantar Retail ShopperScape®, October 2013–September 2014January 2015
Percent Shopped Neighborhood Market in Past Four Weeks, by Region
9%
10%
10%
3%
9%
Regions based on Walmart’s small-format field structure

© Kantar Retail
Walmart’s core shopper is now younger and higher income, and lives in a more densely populated area than five years ago. These shoppers also have smaller households.
Big-Box Shopper Profile Continues to Change10
Source: Kantar Retail ShopperScape®, July–September 2009, 2013, and 2014January 2015
Demographic Profile of Monthly Walmart/WMSC Shoppers
Note: Bolding/shading highlighting indicates significant difference between time periods noted (95% confidence level)
All Shoppers Monthly Walmart/WMSC Shoppers PPT Difference Q3 ‘14 Q3 ‘14 Q3 ‘13 Q3 ‘09 ‘14–’13 ‘14–’09
Sample Size 12,211 6,417 6,531 6,965
Annual HH Income
<$25K 25% 27% 27% 28% 0.5 -1.0$25K–$49.9K 25% 28% 28% 29% -0.4 -1.1$50K–$74.9K 18% 18% 18% 18% 0.1 -0.1$75K–$99.9K 11% 10% 11% 11% -0.3 -0.8$100K+ 21% 17% 17% 14% 0.0 3.0
Kids in HH Children under 19 at home 24% 28% 28% 30% -0.1 -2.0
Generation
Generation Y (born 1982 to 2002) 18% 17% 17% 9% 0.5 8.0Generation X (born 1965 to 1981) 31% 31% 31% 32% 0.2 -0.8Baby Boomers (born 1946 to 1964) 38% 40% 39% 37% 0.8 2.7Seniors (born before 1946) 13% 12% 14% 22% -1.5 -9.9
Hispanic Yes 12% 12% 12% 11% -0.4 1.3
Household Size1 member 27% 24% 19% 24% 5.3 0.52 members 34% 34% 36% 34% -2.0 0.13+ members 39% 42% 45% 42% -3.3 -0.6
Home OwnershipOwn or are buying 63% 63% 64% 66% -1.1 -2.9Rent 28% 27% 27% 27% 0.3 0.6Live with relatives (in their home) 7% 7% 6% 4% 1.0 3.0
Market Size
<100k 10% 15% 18% 19% -3.0 -4.9100k–499k 15% 19% 19% 19% -0.5 -0.2500k–1,999k 21% 23% 23% 25% +0.6 +1.52m + 53% 43% 41% 38% +2.0 +5.6

© Kantar Retail
Walmart SC Walmart NM
Sample Size 27,556 3,201
Annual HH Income
<$25k 27% 28%
$25k–$49.9k 28% 26%
$50k–$74.9k 18% 18%
$75k–$99.9k 11% 11%
$100k+ 16% 17%
Locale*
Rural 18% 8%
Small Town 22% 12%
Large Town 13% 14%
Suburban 36% 47%
Urban/City 11% 20%
Kids in HHYes 27% 28%
No 73% 72%
Generation*
Gen Y 18% 23%
Gen X 31% 33%
Boomers 38% 33%
Seniors 13% 11%
Race/Ethnicity
White Non-Hispanic 66% 52%
Black Non-Hispanic 13% 16%
Hispanic 14% 22%
NM’s shopper base has begun to align more with the Supercenter base over time, particularly as NM’s base skews more lower income. But shoppers are more likely to live in denser markets, aligning with the strength of the stores in suburban and urban markets so far.
NM Shoppers Still Differ From the Supercenters11
Source: Kantar Retail ShopperScape®, January–September 2014January 2015
Demographic Profile of Past Four-Week Shoppers
NM shoppers also are more likely to be younger as well as to be Hispanic or African American. *See appendix for definitionsNote: Analysis limited to states in which NMKT was present as of January 2014Note: Highlighting indicates significant difference between column percentages (95% confidence level)
© Kantar Retail
Walmart/WMSC Walmart.com
Sample Size 22,836 4,296
Annual HH Income
<$25k 27% 27%
$25k-$49.9k 27% 28%
$50k-$74.9k 18% 18%
$75k-$99.9k 11% 11%
$100k+ 17% 16%
Locale*
Rural 18% 17%
Small Town 22% 21%
Large Town 12% 13%
Suburban 37% 34%
Urban/City 11% 15%
Kids in HHYes 26% 30%
No 74% 70%
Generation*
Gen Y 18% 19%
Gen X 31% 34%
Boomers 39% 38%
Seniors 12% 9%
Race/Ethnicity
White Non-Hispanic 68% 66%
Black Non-Hispanic 12% 15%
Hispanic 13% 12%
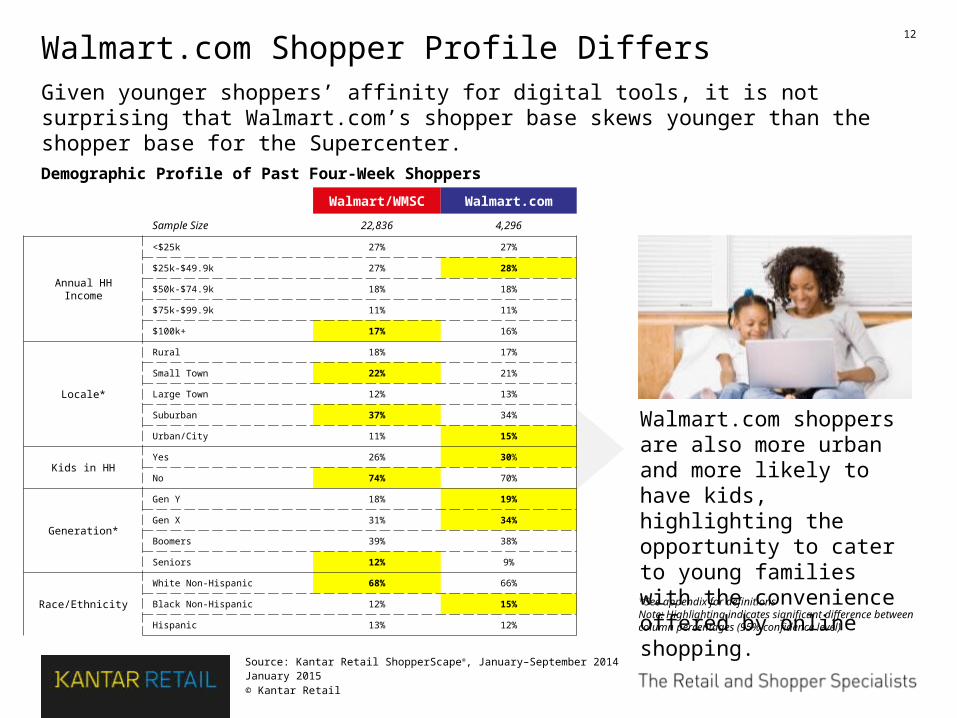
Given younger shoppers’ affinity for digital tools, it is not surprising that Walmart.com’s shopper base skews younger than the shopper base for the Supercenter.
Walmart.com Shopper Profile Differs12
Source: Kantar Retail ShopperScape®, January–September 2014January 2015
Demographic Profile of Past Four-Week Shoppers
Walmart.com shoppers are also more urban and more likely to have kids, highlighting the opportunity to cater to young families with the convenience offered by online shopping. *See appendix for definitionsNote: Highlighting indicates significant difference between column percentages (95% confidence level)

© Kantar Retail
Shopper Penetration– Penetration by banner, channel
– Demographic profile
Shopper Motivations– Financial concerns
– Spending intentions
– Reasons to shop less
– Shopping priorities
Shopping Behaviors in Store– Trips, trip type, and baskets: Supercenters, Neighborhood Market
– Where else Walmart shoppers shop
Brand Position: Price, Assortment, Experience, Access– Value demands and perceived price leadership
– Perceptions of the Walmart shopping experience
Digital Interactions– Mobile engagement
– Savings Catcher
Table of Contents13
January 2015

© Kantar Retail
A strengthening job market throughout the year, and falling gas prices to end it, has bolstered shoppers’ financial positions overall. But rising prices elsewhere are pressuring Walmart shoppers’ ability to spend, and shoppers’ growing tendency to shop less in general are cutting into Walmart’s traffic.
Shopper Motivations14
Sources: Kantar Retail analysis; store visitsJanuary 2015
• Walmart shoppers feel their financial health is about the same as it was last year, though some feel their income positions have strengthened.
• Still, a higher share of shoppers is shopping Walmart less often, largely a result of shopping less overall. In addition, Walmart’s core low-income shoppers’ capacity to spend is still being challenged by rising prices and household essentials spending.
• As shoppers seek out shopping experiences that are worth their time, priorities around product quality, assortment, and in-stocks are now more important than they were five years ago; conversely, one-stop shopping is less important.

© Kantar Retail
Note: Shading indicates significant year-to-year difference (90% CL)
Q3 2013 Q3 2014Job security
Much better/somewhat better off 20% 21%No change from last year 62% 64%Somewhat worse/much worse off 18% 15%
Household Income level Much better/somewhat better off 28% 30%No change from last year 47% 49%Somewhat worse/much worse off 24% 21%
Credit card debt Much better/somewhat better off 26% 25%No change from last year 56% 57%Somewhat worse/much worse off 18% 18%
Monthly mortgage/car payments Much better/somewhat better off 22% 20%No change from last year 66% 68%Somewhat worse/much worse off 12% 11%
Worth of investments Much better/somewhat better off 26% 26%No change from last year 57% 60%Somewhat worse/much worse off 16% 13%
Value of home Much better/somewhat better off 28% 29%No change from last year 58% 61%Somewhat worse/much worse off 14% 10%
Across metrics, Walmart shoppers largely feel their financial health is about the same as last year, though their confidence in their income levels has improved.
Walmart Shoppers’ Financial Health Is Steady15
Source: Kantar Retail ShopperScape®, July-September 2013 and July-September 2014January 2015
Household Financial Health of Walmart Shoppers
Measured across a range of factors, significantly more shoppers than last year feel their financial health has stayed about the same. However, a higher share feels better about income levels, likely a result of the stronger job market.

© Kantar Retail
Walmart shoppers’ spending intentions are gaining traction over time, in line with all shoppers. A majority aim to hold spending steady, while nearly one-third are still curbing their budgets—indicating that value appeals are still very important.
16
Overall, Spending Plans Have Improved
Near-Term Spending Plans: Percent Planning to Spend More/About the Same
vs. Same Time Last Year (three-month moving average)
Near-Term Spending Plans vs. Same Time Last Year: Q3 2014
January 2015
Source: Kantar Retail ShopperScape®, January 2009–September 2014 and July-September 2014
Note: No significant differences between all shoppers and Walmart shoppers (90% confidence level)

© Kantar Retail
Note: Shading indicates significant year-to-year difference (90% CL)
Of the nearly one-third of Walmart shoppers planning to spend less, Have Not households’ spending on essentials such as food and fuel is more likely to limit those shoppers’ ability to spend at retail; conversely, Haves are simply looking to save more.
Top Reasons Leading Those to Spend Less
Have Nots* Haves*
Not as much left over after buying food/HH essentials 52% 39%
HH income not keeping up with rising prices 46% 30%
Trying to simplify my life by buying fewer things 34% 36%
Trying to reduce/pay down credit card balances/debt 31% 35%
Saving more in general 27% 35%
Concerns about present economic conditions 30% 28%
HH income is lower vs. last year 28% 26%
Just have fewer needs this year than I did a year ago 24% 25%
Spending more on gasoline 26% 17%
Concerns about economic conditions 6 to 12 months from now 22% 22%
Spending more on healthcare 22% 20%
Spending more on home heating/cooling costs 23% 14%
Walmart Shoppers’ Reasons for Spending Less at Retail(among past four-week Walmart/WMSC shoppers who said they planned to spend less at retail in the coming month vs. the same time a year ago)
*”Have Nots” are those with an annual household income of less than $60k; “Haves” are those with an annual household income of $60k+.
Source: Kantar Retail ShopperScape®, September 2014
January 2015
17

© Kantar Retail
An overall pullback in shopping is driving shoppers to visit Walmart less frequently. Other key reasons also involve shoppers looking for a more “pleasant” or “convenient” experience.
18
One-in-Five Is Visiting Walmart Less Often
Shopping Frequency at Walmart/WMSC Compared with Same Time a Year Ago
Reasons for Shopping Less Often at Walmart/Walmart Supercenter
January 2015
Source: Kantar Retail ShopperScape® May 2013 and May 2014
May 2013
May 2014
Just shopping less in general 40% 44%
Other retailers offer more pleasant shopping experience
28% 21%
Shopping other retailers more conveniently located 25% 20%
Can find better overall value at other retailers 22% 18%
Doing more shopping at supermarkets 20% 20%
Shopping more at retailers where can get in and out quickly
18% 15%
Doing more shopping at Target/SuperTarget 18% 16%
Doing more shopping at dollar stores 14% 14%
Doing more shopping at online-only retailers 13% 12%
Dividing shopping between more stores; doing less one-stop shopping
12% 10%
Doing more shopping at warehouse clubs 9% 10%
Note: Shading indicates significant year-to-year difference (90% CL)

© Kantar Retail
Compared with their attitudes just after the recession, Walmart shoppers are now more focused on product quality, assortment, and availability in Walmart’s core categories.
19
Walmart Shoppers’ Priorities Have Shifted
January 2015
Source: Kantar Retail ShopperScape®, Feb/May/Aug 2009 and Feb/May/Aug 2014
Largest Changes in Reasons for Store Choice for Food/Groceries and HBC: 2014 vs. 2009(among past four-week Walmart/WMSC shoppers)
Less Important vs. 5 Years Ago
Convenient location
Ability to one-stop shop
Open 24 hours
More Important vs. 5 Years Ago
In-stock on items I want
High quality fresh foods
More brands I like
Less Important vs. 5 Years Ago
Convenient location
Better value
Ability to one-stop shop
More Important vs. 5 Years Ago
High quality products
Broad selection of preferred products
Broad selection of brands
Food/Groceries HBC Products
© Kantar Retail
Shopper Penetration– Penetration by banner, channel
– Demographic profile
Shopper Motivations– Financial concerns
– Spending intentions
– Reasons to shop less
– Shopping priorities
Shopping Behaviors in Store– Trips, trip type, and baskets: Supercenters, Neighborhood Market
– Where else Walmart shoppers shop
Brand Position: Price, Assortment, Experience, Access– Value demands and perceived price leadership
– Perceptions of the Walmart shopping experience
Digital Interactions– Mobile engagement
– Savings Catcher
Table of Contents20
January 2015

© Kantar Retail
Walmart’s grip on the stock-up trip is strong. But as its shopper penetration erodes and customer traffic wanes, it has seen flat to declining comps for most of 2014 and 2013. Lifting comps will depend on targeting specific areas of improvement in the Walmart shopping experience.
Shopping Behaviors21
Source: Kantar Retail analysis; store visitsJanuary 2015
• Edible grocery remains a powerful trip driver for the Supercenter. Walmart’s efforts to improve its fresh proposition with shoppers will be an important tool in boosting the frequency and basket size of these trips.
• NM also threatens to cannibalize the Supercenter’s position, given its popularity as a stock-up destination and high cross-shopping rates in areas where NM is present. Honing NM’s assortment and messaging will be key to help differentiate the format’s proposition.
• Amazon continues to represent a formidable competitor to Walmart. Walmart.com has opportunity to increase both its reach and visit frequency with Walmart shoppers.

© Kantar Retail
Shoppers’ average monthly trips to Walmart discount and supercenter stores ticked up in 2014. While this reverses the recent trend for Walmart, it is in line with overall trends in the channel. This rate is still behind NM shoppers, as they visit the store roughly six times a month.
Trips to Walmart Pick Up Slightly This Year22
Source: Kantar Retail ShopperScape®, Feb/May/Aug/Nov 2010 , 2011, 2012, 2013, and 2014January 2015
Average Number of Trips per Month*
Comparatively, NM shoppers
now report making an
average of 5.9 trips per month.
Note: *Self-reported
© Kantar Retail
Conversion Rate
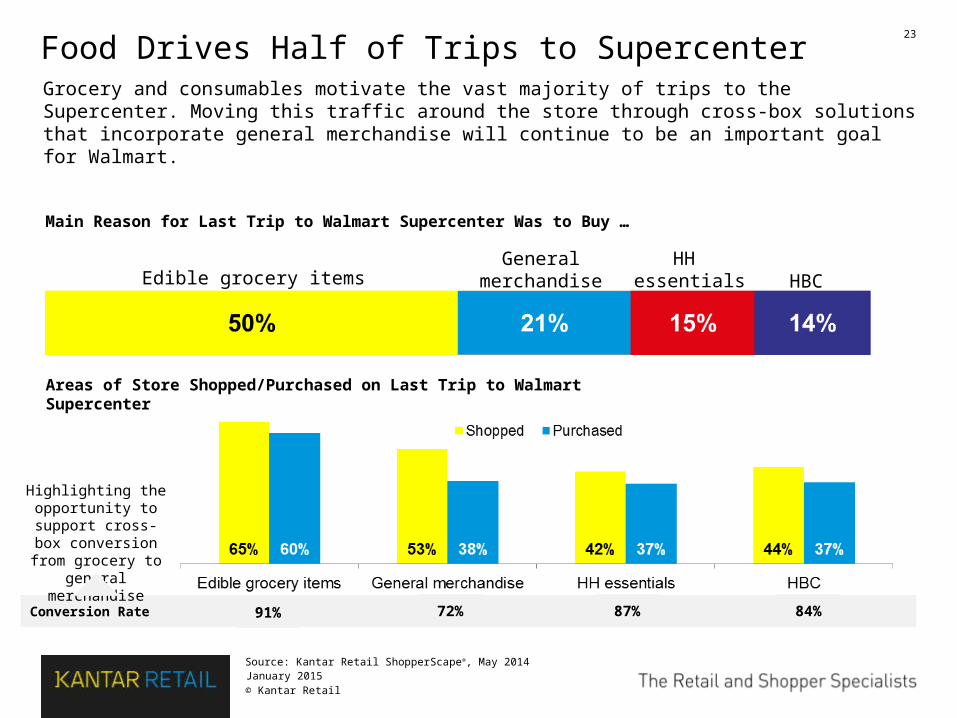
Grocery and consumables motivate the vast majority of trips to the Supercenter. Moving this traffic around the store through cross-box solutions that incorporate general merchandise will continue to be an important goal for Walmart.
Food Drives Half of Trips to Supercenter23
Source: Kantar Retail ShopperScape®, May 2014January 2015
Main Reason for Last Trip to Walmart Supercenter Was to Buy …
Edible grocery itemsHH
essentials HBCGeneral
merchandise
Areas of Store Shopped/Purchased on Last Trip to Walmart Supercenter
91% 84%87%72%
Highlighting the opportunity to support cross-box conversion
from grocery to general merchandise
© Kantar Retail
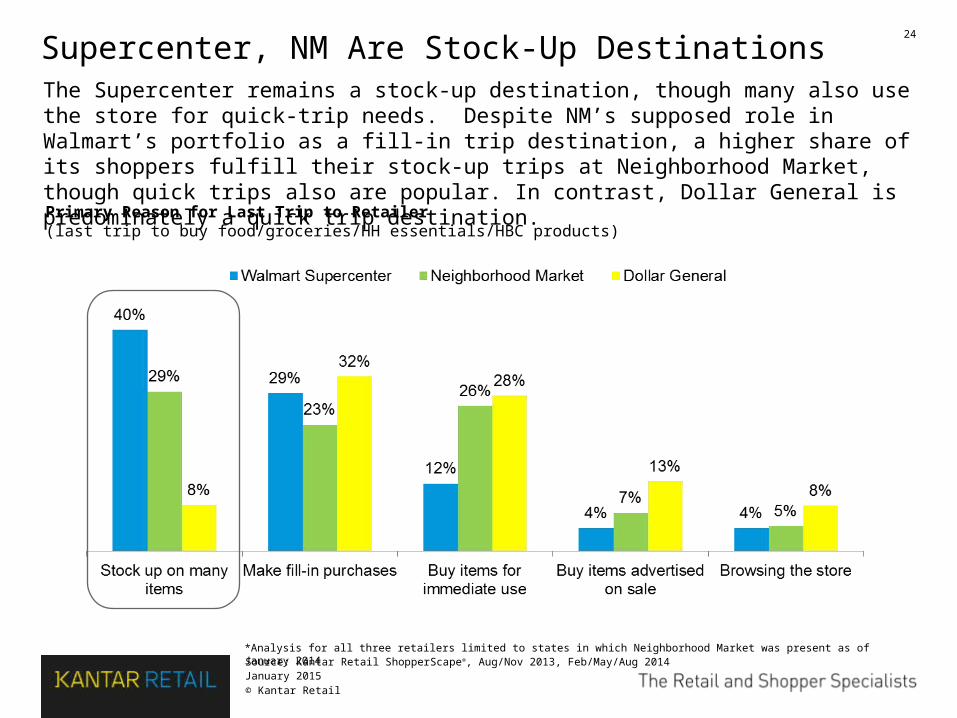
The Supercenter remains a stock-up destination, though many also use the store for quick-trip needs. Despite NM’s supposed role in Walmart’s portfolio as a fill-in trip destination, a higher share of its shoppers fulfill their stock-up trips at Neighborhood Market, though quick trips also are popular. In contrast, Dollar General is predominately a quick trip destination.
Supercenter, NM Are Stock-Up Destinations24
Source: Kantar Retail ShopperScape®, Aug/Nov 2013, Feb/May/Aug 2014January 2015
Primary Reason for Last Trip to Retailer(last trip to buy food/groceries/HH essentials/HBC products)
*Analysis for all three retailers limited to states in which Neighborhood Market was present as of January 2014
© Kantar Retail
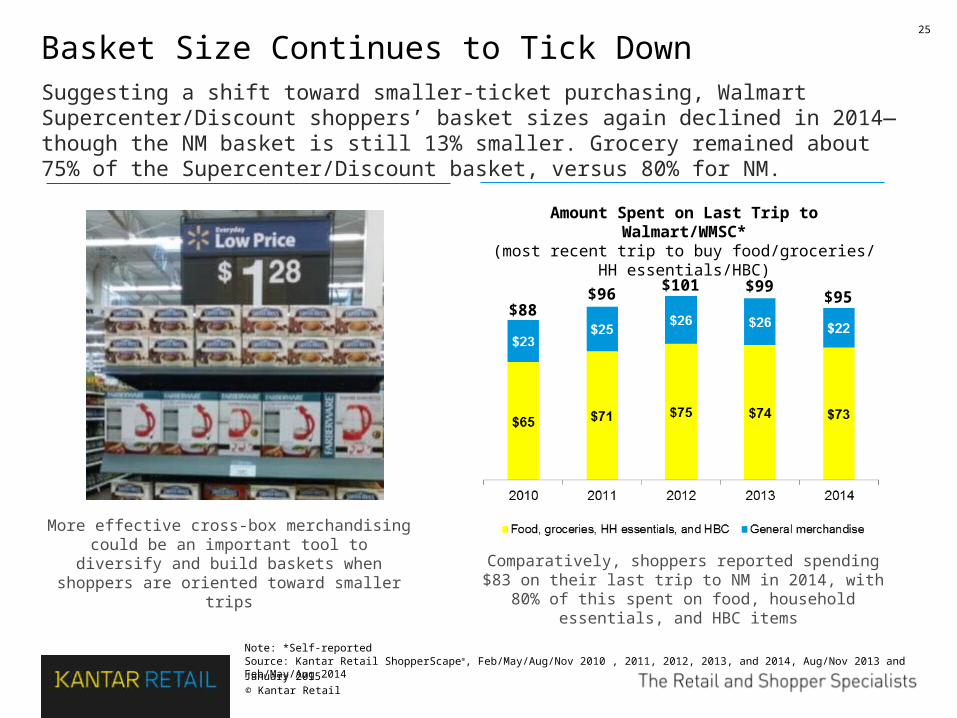
Suggesting a shift toward smaller-ticket purchasing, Walmart Supercenter/Discount shoppers’ basket sizes again declined in 2014—though the NM basket is still 13% smaller. Grocery remained about 75% of the Supercenter/Discount basket, versus 80% for NM.
Basket Size Continues to Tick Down
January 2015
Source: Kantar Retail ShopperScape®, Feb/May/Aug/Nov 2010 , 2011, 2012, 2013, and 2014, Aug/Nov 2013 and Feb/May/Aug 2014
25
More effective cross-box merchandising could be an important tool to diversify and build baskets
when shoppers are oriented toward smaller trips
Amount Spent on Last Trip to Walmart/WMSC*(most recent trip to buy food/groceries/
HH essentials/HBC)
Note: *Self-reported
Comparatively, shoppers reported spending $83 on their last trip to NM in 2014, with 80% of this spent on food,
household essentials, and HBC items
$88$96
$101 $99$95
© Kantar Retail
Note: Shading indicates significant difference between column percentages (95% confidence level)
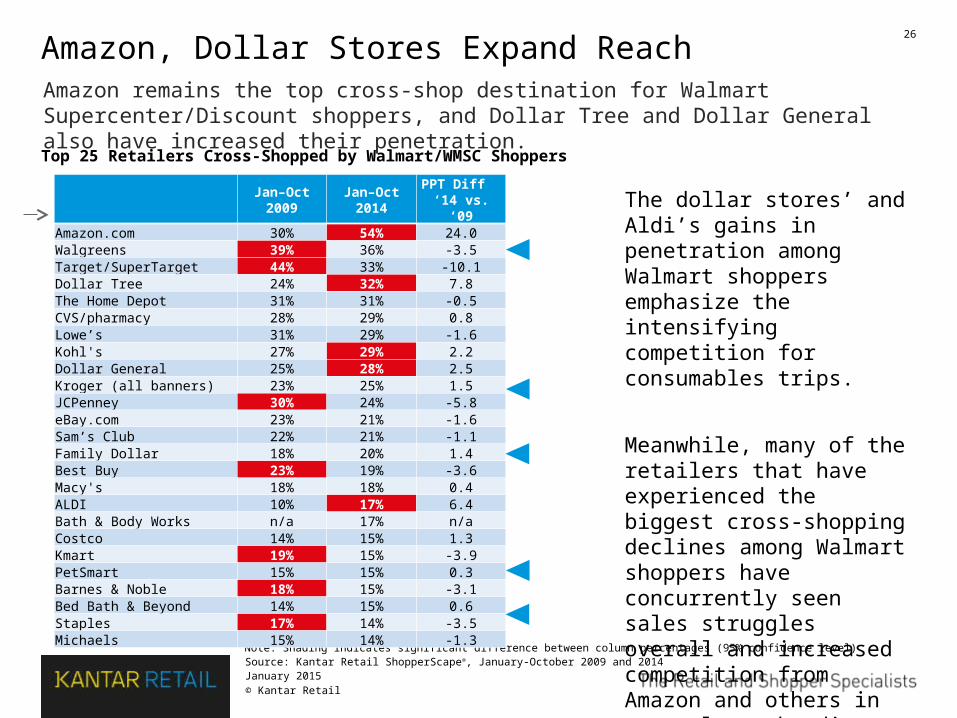
Amazon remains the top cross-shop destination for Walmart Supercenter/Discount shoppers, and Dollar Tree and Dollar General also have increased their penetration.
Amazon, Dollar Stores Expand Reach26
Source: Kantar Retail ShopperScape®, January-October 2009 and 2014January 2015
Top 25 Retailers Cross-Shopped by Walmart/WMSC Shoppers
The dollar stores’ and Aldi’s gains in penetration among Walmart shoppers emphasize the intensifying competition for consumables trips.
Meanwhile, many of the retailers that have experienced the biggest cross-shopping declines among Walmart shoppers have concurrently seen sales struggles overall and increased competition from Amazon and others in general merchandise categories.
Jan–Oct 2009 Jan–Oct 2014
PPT Diff ‘14 vs. ‘09
Amazon.com 30% 54% 24.0Walgreens 39% 36% -3.5Target/SuperTarget 44% 33% -10.1Dollar Tree 24% 32% 7.8The Home Depot 31% 31% -0.5CVS/pharmacy 28% 29% 0.8Lowe’s 31% 29% -1.6Kohl's 27% 29% 2.2Dollar General 25% 28% 2.5Kroger (all banners) 23% 25% 1.5JCPenney 30% 24% -5.8eBay.com 23% 21% -1.6Sam’s Club 22% 21% -1.1Family Dollar 18% 20% 1.4Best Buy 23% 19% -3.6Macy's 18% 18% 0.4ALDI 10% 17% 6.4Bath & Body Works n/a 17% n/aCostco 14% 15% 1.3Kmart 19% 15% -3.9PetSmart 15% 15% 0.3Barnes & Noble 18% 15% -3.1Bed Bath & Beyond 14% 15% 0.6Staples 17% 14% -3.5Michaels 15% 14% -1.3

© Kantar Retail
Amazon has nearly three times the online penetration with Walmart shoppers than Walmart.com does. And Walmart shoppers are hooked: one in five shop Amazon weekly, twice the number who shop Walmart.com that often. Driving reach and frequency are two key concerns for Walmart.com.
27
For Walmart.com, Amazon Is a Big Challenge
Top 10 Online Retailers Shopped by Walmart Shoppers
Walmart Shoppers Shopping Frequency
January 2015
Source: Kantar Retail ShopperScape®, September 2013–August 2014
1 Amazon.com 54%
2 eBay.com 21%
3 Walmart.com 19%
4 Kohls.com 9%
5 BestBuy.com 9%
6 JCPenney.com 9%
7 Target.com 8%
8 BarnesandNoble.com 7%
9 Macys.com 7%
10 HomeDepot.com 7%

© Kantar Retail
Note: Regions based on Walmart’s small-format field structure. Including grocery, Walmart, and club competitors
NM shoppers’ cross-shopping patterns highlight regional competition for grocery dollars—as well as the potential for NM to cannibalize the Supercenter. For instance, in the central division, nearly every NM shopper also shops the Supercenter.
For NM, Regional Grocers Present a Challenge28
Source: Kantar Retail ShopperScape®, October 2013-September 2014January 2015
Top Grocery Retailers Also Shopped by Neighborhood Market Shoppers, by Region
West
Walmart/WMSC 60%
Costco 49%
Safeway 34%
Albertsons 32%
Trader Joe’s 31%
WinCo Foods 25%
Southwest
Walmart/WMSC 76%*
Albertsons 34%
Sam’s Club 30%
Costco 25%
Sprouts 25%
H-E-B 22%
Northeast
Walmart/WMSC 65%
ALDI 29%
Kroger 27%
Sam’s Club 26%
Food Lion 20%
Whole Foods 19%
Central
Walmart/WMSC 85%
Sam’s Club 33%
ALDI 28%
Whole Foods 14%
Hy-Vee 12%
Dillons 11%
Southeast
Walmart/WMSC 77%
Publix 69%
Winn-Dixie 42%
Sam’s Club 28%
ALDI 24%
Save-A-Lot 18%*Read as: 76% of Neighborhood Market shoppers also shopped at the Supercenter.
Whole Foods and other specialty grocers (Sprouts, Trader Joe’s) notably have a solid cross-shop with NMKT shoppers across regions

© Kantar Retail
Shopper Penetration– Penetration by banner, channel
– Demographic profile
Shopper Motivations– Financial concerns
– Spending intentions
– Reasons to shop less
– Shopping priorities
Shopping Behaviors in Store– Trips, trip type, and baskets: Supercenters, Neighborhood Market
– Where else Walmart shoppers shop
Brand Position: Price, Assortment, Experience, Access– Value demands and perceived price leadership
– Perceptions of the Walmart shopping experience
Digital Interactions– Mobile engagement
– Savings Catcher
Table of Contents29
January 2015

© Kantar Retail
Price, Assortment, Experience, Access
Brand Position 30
Sources: Kantar Retail analysis; store visitsJanuary 2015
Walmart continues to emphasize its low price promise to its value-conscious shopper base—as these demands are still of primary importance. However, the retailer also recognizes that assortment, experience, and access are also very important—raising the strategic importance of these dimensions. The retailer is working to fix its immediate problems as well as to enable more solutions to meet shoppers’ rising demands.
•Shoppers’ perceptions of Walmart’s price position is strong, though supermarkets contend for value perceptions in fresh, and to a lesser extent non-perishable grocery.
•Assortment and experience dimensions of the trip have the opportunity to improve, including opinions of in-stocks, food selection, and store service.

© Kantar Retail
Spending less is the top priority for Walmart shoppers, and it matters more to them. Notably, having fun also is more important to Walmart shoppers, and having a stress-free experience ranks just behind value considerations.
Value Matters Most to Walmart Shoppers31
Source: Kantar Retail ShopperScape®, January–October 2014January 2015
What Matters to Shoppers(% ranking factor among top four most important when shopping)
Arrows indicate a significant difference between Walmart shoppers and all shoppers (95% confidence level)

© Kantar Retail
Impressions of Walmart’s price leadership are positive and relatively strong across categories. The exception is fresh grocery, where supermarkets far outpace Walmart. Shoppers also are divided on non-perishable grocery, where as many feel Walmart leads, as do supermarkets.
Walmart Has Price Leadership, Mostly32
Source: Kantar Retail ShopperScape®, November 2014January 2015
Type of Retailer Viewed as Price Leader, by Category(among all primary HH shoppers)
Shoppers’ perceptions of supermarkets’ fresh price proposition are much higher

© Kantar Retail
Experience
Walmart’s price promises largely measure up, but its efforts to improve in-stocks and to tailor assortment will be important to meet shoppers’ expectations. Also, not many agree that Walmart is a “pleasant” place to shop.
Clear Room for Improvement in Experience33
Source: Kantar Retail ShopperScape®, May 2014January 2015
Ideal Grocery/HH Essential/HBC Shopping Experience vs. Shopping Experience at Walmart(among past four-week Walmart/WMSC shoppers)
Price Assortment and Access

© Kantar Retail
Shopper Penetration– Penetration by banner, channel
– Demographic profile
Shopper Motivations– Financial concerns
– Spending intentions
– Reasons to shop less
– Shopping priorities
Shopping Behaviors in Store– Trips, trip type, and baskets: Supercenters, Neighborhood Market
– Where else Walmart shoppers shop
Brand Position: Price, Assortment, Experience, Access– Value demands and perceived price leadership
– Perceptions of the Walmart shopping experience
Digital Interactions– Mobile engagement
– Savings Catcher
Table of Contents34

© Kantar Retail
As how shoppers interact change, so to must Walmart’s means of engaging them. In particular, mobile devices are becoming the interface of these exchanges, as using these devices to search for coupons or research assortment options is becoming increasingly popular—especially among Walmart’s base.
Digital Interactions35
Sources: Kantar Retail analysis; store visitsJanuary 2015
• Walmart’s rollout of Savings Catcher, its digital price-matching tool—as well as the program’s quick uptake by shoppers—highlights the willingness of shoppers to take part in mobile and its ability to drive relationships with shoppers in the store.
• Even as Walmart increases its investments in digital, the retailer still has opportunity to build its reach, as its mobile connection with shoppers lags behind competitors such as Amazon and Target. Investments in mobile will be a key means to integrate digital into the established Walmart shopping experience and to reach increasingly connected shoppers.

© Kantar Retail
Walmart shoppers are more likely to engage in a range of activities on smartphones, particularly when it comes to savings- and assortment-oriented features.
Walmart Shoppers Highly Engaged via Mobile36
Source: Kantar Retail ShopperScape®, March 2014January 2015
Activities Engaged in on Smartphone during Past Six Months(among smartphone owners) Index: Walmart
Shoppers vs. Total
111
110
110
107
104
121
104
111
105
108
100
108
100
Note: Green indices indicate significantly greater vs. all shoppers (95% confidence level)

© Kantar Retail
When it comes to interacting with its own shoppers via its mobile app, Walmart trails Amazon, Target, and Costco. About half of its shoppers who use the app used it in-store, however, indicating the opportunity for suppliers to support in-store mobile integration efforts.
But Walmart Itself Can Improve Engagement37
Source: Kantar Retail ShopperScape®, January 2014January 2015
34%
24%
19%
15% 15% 14%13%
11%
8% 7%
n/a
16%
9%
7% 7% 6% 6%
3% 4% 3%
Amazon Target Costco CVS Walmart Walgreens Best Buy Sam's Club Home Depot Lowe's
Used app Used app IN RETAILER STORE
Percent of Retailers’ Past Four-Week Shoppers Who Used Retailer Apps in Past Few Months(among smartphone owners)

© Kantar Retail
Walmart shoppers rank access to promotions their top priority for mobile app features, with tools that make the store experience easier—such as item location, geo-targeted deals, and lists—not far behind. Accordingly, Walmart advertised such deal features on its app this past holiday.
Savings Features Are Top Mobile Priority38
Source: Kantar Retail ShopperScape®, January 2014January 2015
What Shoppers Would Like to Be Able to Do on Walmart App In-Store(among Walmart shoppers who own a smartphone)
Note: Gen Y Walmart shoppers significantly more likely to want every feature vs. all Walmart shoppers (95% confidence level)

© Kantar Retail
A month after this digital ad match tool rolled out nationally, Savings Catcher had already garnered widespread awareness, and even higher awareness among Walmart shoppers.
Savings Catcher Tool Is Catching On39
Source: Kantar Retail ShopperScape®, September 2014, Kantar Retail store visitsJanuary 2015
Awareness of Walmart’s Saving Catcher Tool(% of shoppers who are aware of Savings Catcher)
*Recent shoppers are those who have shopped Walmart/WMSC during the past four weeks; regular shoppers are those who say they usually shop Walmart/WMSC every month

© Kantar Retail
About one in five Walmart shoppers have already used Savings Catcher; that figure jumps to two in five among those who are aware of the tool. Walmart’s Gen X and “Have” shoppers are most likely to have used Savings Catcher.
Young, Affluent Shoppers More Likely to Use Tool40
Source: Kantar Retail ShopperScape®, September 2014January 2015
Percent of Walmart Shoppers Who Have Used Savings Catcher, by Cohort
*Have Nots have an annual HH income of less than $60k; Haves have an annual HH income of $60+
Walmart recently reported that 81% of the Savings Catcher receipts came through mobile devices, indicating that this program is driving usage of Walmart’s mobile app.

© Kantar Retail
41
Insert document footerInsert date and year
For further information please refer to www.kantarretail.com
Contact:Laura KennedyPrincipal Analyst [email protected]+1 617 912 2851
Rachel McGuirePrincipal [email protected]+1 614 355 4036
www.kantarretailiQ.com kantarretail

© Kantar Retail
42
Generational Cohorts Gen Y: Born 1982–2002 (note: ShopperScape® surveys heads of household 18+, so Gen Y respondents in ShopperScape® are
18 to 32 years old in 2014) Gen X: Born 1965 to 1981 (33 to 49 years old in 2014) Boomers: Born 1946 to 1964 (50 to 68 years old in 2014) Seniors: Born in 1945 or earlier (69 or older in 2014)
Haves & Have-Nots Haves: Annual HH Income > $60,000 Have-Nots: Annual HH Income $60,000+
Locale Rural: I have to drive more than 10 miles to do even basic shopping (such as for groceries) Small Town: I live in or near a town where I can do all or most of my everyday shopping (such as for groceries) and shopping
for some special purchases (such as a television or dress apparel), but I have to travel to a larger city to have more than a couple of options for shopping for special purchases
Large Town: I live in or near a large town where I do all or most of my shopping, both for everyday needs and special purchases, but the town is not immediately next to a major metropolitan area
Suburban: I live in a community surrounding a major metropolitan area that contains many retail shopping options, including multiple grocery stores, shopping centers, etc.
Urban/City: I live in a densely populated neighborhood where I primarily/exclusively walk or use public transportation/cabs to do my everyday shopping (such as for groceries)
Appendix: ShopperScape® Key Definitions