© josé m. viedma marti, 2003. i c the 6th world congress on intellectual capital and innovation....
TRANSCRIPT

© José M. Viedma Marti, 2003.
iC
The 6th World Congress on The 6th World Congress on
Intellectual Capital and Innovation.Intellectual Capital and Innovation.January 15-17, 2003January 15-17, 2003
Josep Ma. ViedmaProfessor of Business Administration at the Polytechnic University of Catalonia
and President of Intellectual Capital Management Systems
CICBS: Cities’ Intellectual Capital Benchmarking CICBS: Cities’ Intellectual Capital Benchmarking SystemSystemA methodology and a framework for measuring
and managing intellectual capital of cities.
A practical aplication in the city of Mataró.
http://intellectualcapitalmanagementsystems.com

© José M. Viedma Marti, 2003.
iC
The ContextThe Context
In the past, the vision, objectives, and goals of cities have been determined mainly by considering tangible assets as the main factors of a city’s prosperity.
In the knowledge economy, the role of intangible assets in wealth creation has become fundamental
As a result a framework of intangible assets that allows navigation from the present reality to the future vision has become an urgent need for all cities.

© José M. Viedma Marti, 2003.
iC
Two parts of the paper
1st. Part. -Development of CICBS a specific methodology and a framework for measuring and managing the intellectual capital of cities.
2nd.Part. -Practical application of CICBS in the city of Mataró.
-Providing some details of the first cities’ intellectual capital report

© José M. Viedma Marti, 2003.
iC
1st. Part
The government of cities in the information society
Important questions for city governments:
Which facilities must be offered by city governments if the city is to be the most attractive place in which to live?
How can innovative companies be attracted to the city?
How to foster entrepreneurship?
Which organisational structures are required?
How the city be transformed to face new technological changes successfully?

© José M. Viedma Marti, 2003.
iC
1st. Part
The government of cities in the information society
The new success formula will combine:
New technologies (microprocessor-based products).
Transportation (the Internet and broadband telecommunications).
Labour (the mix of office-goers, telecommuters, ‘road warriors’, and ‘corporate gypsies’).
Infrastructure (virtual organisations)

© José M. Viedma Marti, 2003.
iC
1st. Part
Measurement and management of cities’ intellectual capital: The state of the art.
Microeconomic perspective.
Macroeconomic perspective.
Skandia Navigator (Edvinson)
Balanced Scorecard (Kaplan)
Dublin a world class e-city (Chamber of Commerce)
National Intellectual Capital Index: Intellectual capital Development in he Arab Region (Bontis)
Invest in Sweden: Report 2002 (Rembe)
The intellectual capital of the State of Israel (Pasher).

© José M. Viedma Marti, 2003.
iC
Cities’ specific Intellectual Capital Model
Microcluster Nº1 Microcluster Nº2 Microcluster Nº3 Microcluster Nº X
Cities’ general Intellectual Capital Model
Segmentdemand
Output
Products and services
Processes
Core competencies
Professional core competencies
Vision
Segmentdemand
Output
Products and services
Processes
Core competencies
Professional core competencies
Vision
Segmentdemand
Output
Products and services
Processes
Core competencies
Professional core competencies
Vision
Segmentdemand
Output
Products and services
Processes
Core competencies
Professional core competencies
Vision
Segmentdemand
Output
Products and services
Processes
Core competencies
Professional core competencies
Vision
Segmentdemand
Output
Products and services
Processes
Core competencies
Professional core competencies
Vision
Segmentdemand
Output
Products and services
Processes
Core competencies
Professional core competencies
Vision
Segmentdemand
Output
Products and services
Processes
Core competencies
Professional core competencies
Vision
Core competencies
Vision
Process Capital
Renewal & Development Capital
Financial Capital
Market CapitalHuman Capital
Past
Present
Future
Core activities
Indicators
IC Categories
1
5
2
3
4
Core competencies
Vision
Process Capital
Renewal & Development Capital
Financial Capital
Market CapitalHuman Capital
Past
Present
Future
Core activities
Indicators
IC Categories
11
55
22
33
44
1st. Part
CICBS City’s Intellectual Capital Benchmarking System

© José M. Viedma Marti, 2003.
iC
Core competencies
Vision
Process Capital
Renewal & Development Capital
Financial Capital
Market CapitalHuman Capital
Past
Present
Future
Core activities
Indicators
IC Categories
1
5
2
3
4
Core competencies
Vision
Process Capital
Renewal & Development Capital
Financial Capital
Market CapitalHuman Capital
Past
Present
Future
Core activities
Indicators
IC Categories
11
55
22
33
44
Benchmarking
Core competencies
Vision
Process Capital
Renewal & Development Capital
Financial Capital
Market CapitalHuman Capital
Past
Present
Future
Core activities
Indicators
IC Categories
11
55
22
33
44
Mataró Treviso
1. Creating the vision.
2. Identifying the core activities needed to realize the vision .
3. Identifying the core competencies needed to realize the core activities .
4. Identifying the indicators for each core activity and each core competence.
5. Assembling the indicators into different intellectual capital categories .
1st. Part
Cities’ general Intellectual Capital Model (CGICM)Common and general knowledge - an intellectual capital platform - that strengthens the
existing microclusters of a city and nurtures the building of new ones.

© José M. Viedma Marti, 2003.
iC
1st. PartCGICM. Intellectual Capital Categories
HUMAN CAPITAL.
Tacit knowledge (knowledge, wisdom, expertise, intuition and the like) of individuals to realize city task and goals.
PROCESS CAPITAL.
Structural intellectual assets (information systems, software, databases, laboratories, organisational structure, management systems) which sustain and amplify the output of human capital.
MARKET CAPITAL.
Market assets (customer-city loyalty, strategic customers satisfaction, value of brands and so on) embedded in a city’s relationship with the national and international market.
RENEWAL AND DEVELOPMENT CAPITAL.
Renewal and development assets (investment in research and development, patents, trademarks, start-up companies and the like) aimed to the exploitation of cities competitive strength in future markets

© José M. Viedma Marti, 2003.
iC
1st. PartCities’ specific Intellectual Capital Model
(CSICM)
Segment
demand
Output
Products and services
Processes
Core competencies
Professional core competencies
Vision
Segment
demand
Output
Products and services
Processes
Core competencies
Professional core competencies
Vision
Microcluster Nº1Homologous Microcluster Nº1
Best World reference cityCity A City B
Benchmarking
Benchmarking
Benchmarking
Benchmarking
Benchmarking
Benchmarking
Benchmarking
Draws inspiration from ICBS (Viedma)

© José M. Viedma Marti, 2003.
iC
1st. PartCities’ specific Intellectual Capital Model
(CSICM)
Vision
History (Narrative description)
Present situation (Narrative description)
Microcluster Nº 1
Factors Content of the factors
Indicators andsources of
information
-Classification of the different types of demand
-Segment demand evaluation
-For each type of demand, functions and attributes of products and services
-Value chain activities and competencies for each type of demand.
-Core competencies for each value chain within each type of demand.
-Core professional competencies for each valuechain within each type of demand.
- The microcluster we would like to have in the future
Professional corecompetencies
Segmentdemand
Output
Products andservices
Processes
Corecompetencies
Soft data
Hard data
Soft data
Soft data
Soft and
Soft and
Soft data
hard data
hard data
Customer
need
Identified
Customer
need
Satisfied
Innovation Operations
Core activitiesCore competencies
Core activitiesCore competencies
ServiceMarketMakeDevelopDesign
Customer
need
Identified
Customer
need
Satisfied
Innovation Operations
Core activitiesCore competencies
Core activitiesCore competencies
ServiceMarketMakeDevelopDesign
Customer
need
Identified
Customer
need
Satisfied
Innovation Operations
Core activitiesCore competencies
Core activitiesCore competencies
ServiceMarketMakeDevelopDesign
Customer
need
Identified
Customer
need
Satisfied
Innovation Operations
Core activitiesCore competencies
Core activitiesCore competencies
ServiceMarketMakeDevelopDesign

© José M. Viedma Marti, 2003.
iC
2nd. Part
Practical application in the city of Mataró.
ICMM project (Intellectual Capital Management of the city of Mataró).
ICMM project objectives:
1) To finalize and coordinate the different initiatives of Mataró in orientating the city towards the information and the knowledge society.
2)To have a strategic planning navigation framework in the intangibles domain.

© José M. Viedma Marti, 2003.
iC
2nd. Part
The City of Mataró. Located in the north-east of Spain. 104.880 inhabitants and 22,6 square kilometres. 28 kilometres north of Barcelona. Part of the metropolitan region of Barcelona. Capital of the Maresme region (300.000 inhabitants, 397 square kilometres). Area of high economic and tourist development.

© José M. Viedma Marti, 2003.
iC
2nd. Part
Antecedents of the ICMM project.
Macro projects
Institutions
Master plan for the Information Society in Mataró 1999.
Mataró, knowledge city, January 2002.
New Institutions created and Institutions strengthened.
Tecnocampus Mataró.IMPEM
PUMSA
EUPM
CETEMMSA
© José M. Viedma Marti, 2003.
iC
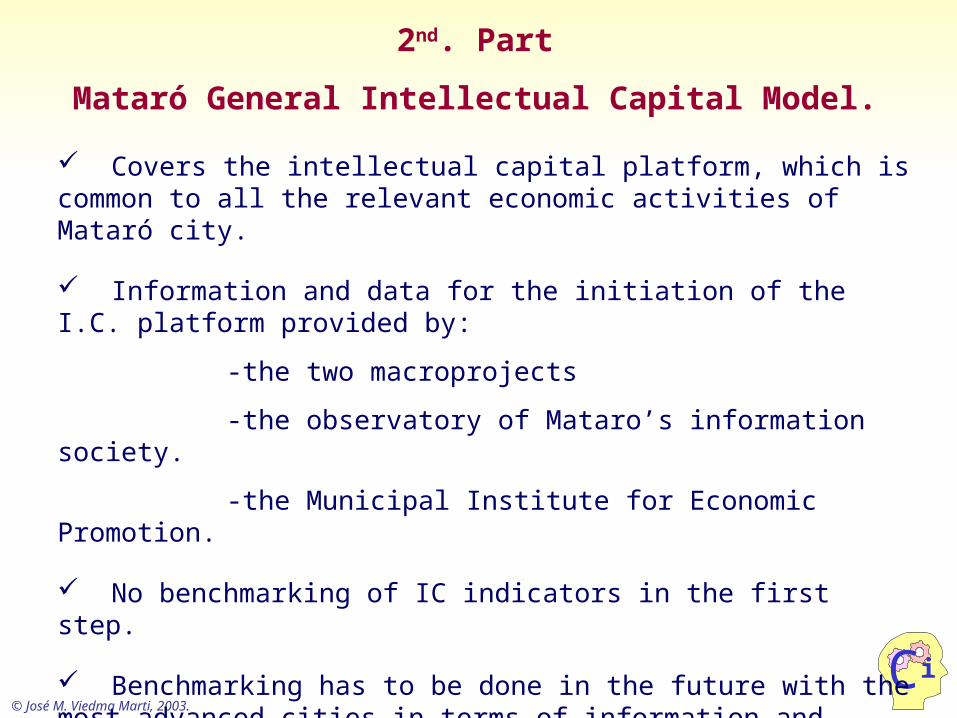
2nd. Part
Mataró General Intellectual Capital Model.
Covers the intellectual capital platform, which is common to all the relevant economic activities of Mataró city.
Information and data for the initiation of the I.C. platform provided by:
-the two macroprojects
-the observatory of Mataro’s information society.
-the Municipal Institute for Economic Promotion.
No benchmarking of IC indicators in the first step.
Benchmarking has to be done in the future with the most advanced cities in terms of information and telecommunications technologies and knowledge management.
© José M. Viedma Marti, 2003.
iC
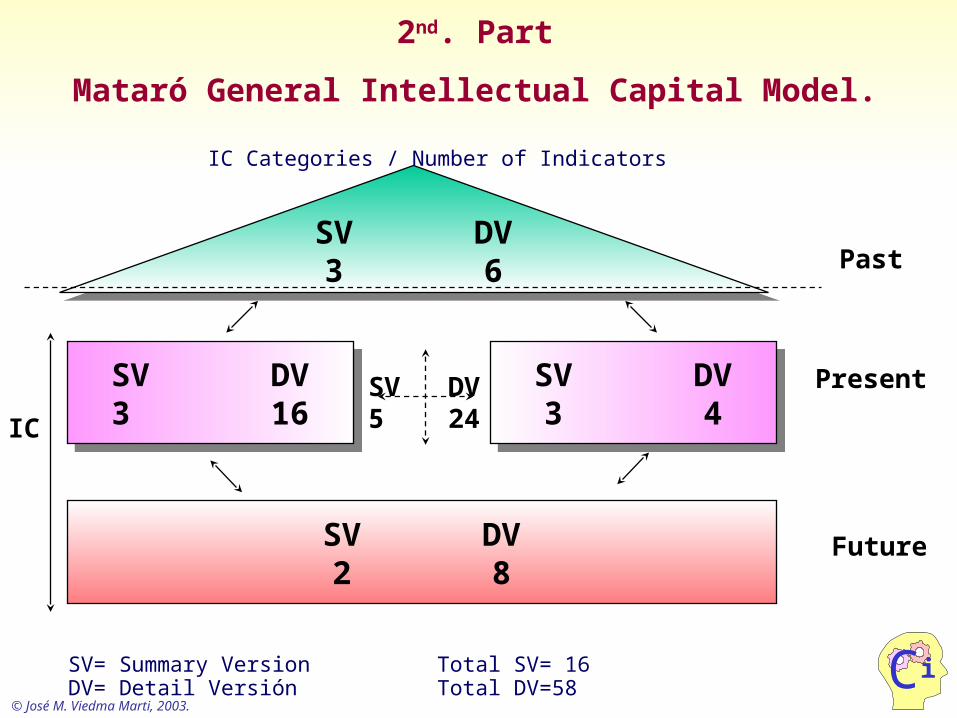
SV DV3 16
SV DV3 16
SV DV2 8
SV DV3 6
SV DV3 6
SV DV3 4
SV DV3 4
SV DV5 24
Past
Present
Future
IC
2nd. Part
Mataró General Intellectual Capital Model.
IC Categories / Number of Indicators
SV= Summary Version Total SV= 16DV= Detail Versión Total DV=58

© José M. Viedma Marti, 2003.
iC
2nd. Part
Mataró General Intellectual Capital Balance Sheet.
Mataró General Intellectual Capital Balance sheet
PERIOD VALUE MEASURE UNIT
FINANCIAL CAPITALGDP (market prices) 1991 817,81 1996 1064,06 Millions of eurosHousehold's disposable income 1991 6.022,7 1996 8.550,6 euros per capitaGDP per capita 1991 8058 1996 10430 euros
HUMAN CAPITAL
University/College + secondary studies 1991 17,14% 1996 22,1% PercentageHabitual internet users october-1998 11% september 2001 27,9% PercentagePercentage of qualified workers 1991 26,50% PercentageActivity rate 1991 56,98% 1996 55,67% PercentageGini Index 1989 0,387 1994 0,368 Index
PROCESS CAPITAL
Service sector development PercentageSalaried workers in the high knowledge sector (%) 1st quater 2002 37,7% PercentagePercentage of firms with internet connection october-1998 24,1% september 2001 66,7% Percentage
MARKET CAPITAL
Self-containment 1991 79,53% 1996 72,28% PercentageSelf-sufficiency 1991 81,91% 1996 75,93% PercentageExports/imports ratio 2000 0,68 Ratio
RENOVATION CAPITAL
Youth rate 1996 16,99% 1 january 2002 14,21% PercentageNew firms registered for taxation 1997 1r quater 2002 3.382 Firms
PREVIOUS VALUE
PREVIOUS PERIOD DIVISIONS
CICBS
iC

© José M. Viedma Marti, 2003.
iC
2nd. Part
Mataró General Intellectual Capital Balance Sheet.
Mataró General Intellectual Capital Balance sheet. Human Capital detail
HUMAN CAPITAL
University/College + secondary studies 1991 17,14% 1996 22,1% PercentageContinous education (adult participation rate)Illiteracy rate 1991 6,34% 1996 4,73% PercentageHabitual computer users october-1998 nd september 2001 43,7% PercentageHabitual internet users october-1998 11% september 2001 27,9% PercentageLife expectancy 1999-1995 79,65 2001-1997 80,12 YearsPercentage of qualified workers 1991 26,50% PercentageActivity rate 1991 56,98% 1996 55,67% PercentageActivity rate. Men 1991 71,71% 1996 68,87% PercentageActivity rate. Women 1991 43,11% 1996 43,14% PercentageActivity rate. Young. 15-24 1991 61,17% 1996 53,82% PercentageActivity rate. Adults. 25-54 1991 1996 PercentageActivity rate. Adults. 55-64 1991 1996 PercentageLibrary visits 2000 280.040 PeopleCultural entities and organizations 1999 189 2000 203 Number of entitiesCinema capacity /1000 inInhabitants 1999 36,82 2001 32,91 Seats / 1.000 inhab.Theatre capacity/1000 inInhabitants 1999 7,78 2001 7,52 Seats / 1.000 inhab.Cultural entities/ 1000 Inhabitants 1999 1,80 2000 1,92 Entities / 1.000 inhab.Abstencions rate over the total electoral roll 1996 21,16% marzo 2000 33,7% PercentageGini Index 1989 0,387 1994 0,368 IndexPeople receiving poverty subsidy 1999 296 2002 236 PeopleRegistered unemployment rate PercentageFemale unemployment rate Percentage
PREVIOUS PERIOD PERIODDIVISIONS VALUE MEASURE UNIT
PREVIOUS VALUE
CICBS

© José M. Viedma Marti, 2003.
iC
2nd. Part
Mataró Specific Intellectual Capital Model.
Identification of the relevant microclusters.
The microclusters identified were the following:
-Textile (knitwear) (23% of the working population)
- Construction.
- Retail trade.
- Education and training.
Evaluation of the CSIC model factors and criteria through ad hoc questionnaires to experts and companies.
In the best world city microcluster, evaluation of the homologous factors and criteria using the same questionnaires.
Comparison of the corresponding results (Benchmarking).
Reliability indexes or accuracy level indexes.

© José M. Viedma Marti, 2003.
iC
2nd. Part
Mataró Specific Intellectual Capital Balance Sheet.
Factors Mataró Treviso
Employees per firm 10 9 8 7 6 5 4 3 2 1 1 2 3 4 5 6 7 8 9 10
1 a 5 2 15 a 10 2 1
10 a 25 3 325 a 50 2 450 a 100 1 1100 o > 1 1
Accuracy level 82% 50%Demand type 10 9 8 7 6 5 4 3 2 1 1 2 3 4 5 6 7 8 9 10
Final consumer 1 2Distributors 2 4
Departamental Stores 2 1Other textile producers 2 1
Own stores 1 2Multibrand stores 3 2Accuracy level 80% 50%
Products and services 10 9 8 7 6 5 4 3 2 1 1 2 3 4 5 6 7 8 9 10Quality 7 8Price 6 9
Fashion 6 9Accuracy level 70% 50%
Mataró Treviso

© José M. Viedma Marti, 2003.
iC
2nd. Part
Mataró Specific Intellectual Capital Balance Sheet.
Factors Mataró Treviso
Innovation 10 9 8 7 6 5 4 3 2 1 1 2 3 4 5 6 7 8 9 10In the product 7 9In the process 6 8
Accuracy level 80% 50%Processes 10 9 8 7 6 5 4 3 2 1 1 2 3 4 5 6 7 8 9 10Spinning 2 0Finishing 1 0Design 5 8
Wearing 5 2Marketing and distribution 4 8
Accuracy level 80% 50%Product type 10 9 8 7 6 5 4 3 2 1 1 2 3 4 5 6 7 8 9 10
Men's underwear 1 0Women's underwear 1 0
Men´s outwear 2 8Women´s outwear 3 9
Children 2 2Sport 1 1
Accuracy level 76% 50%
Mataró Treviso
© José M. Viedma Marti, 2003.
iC
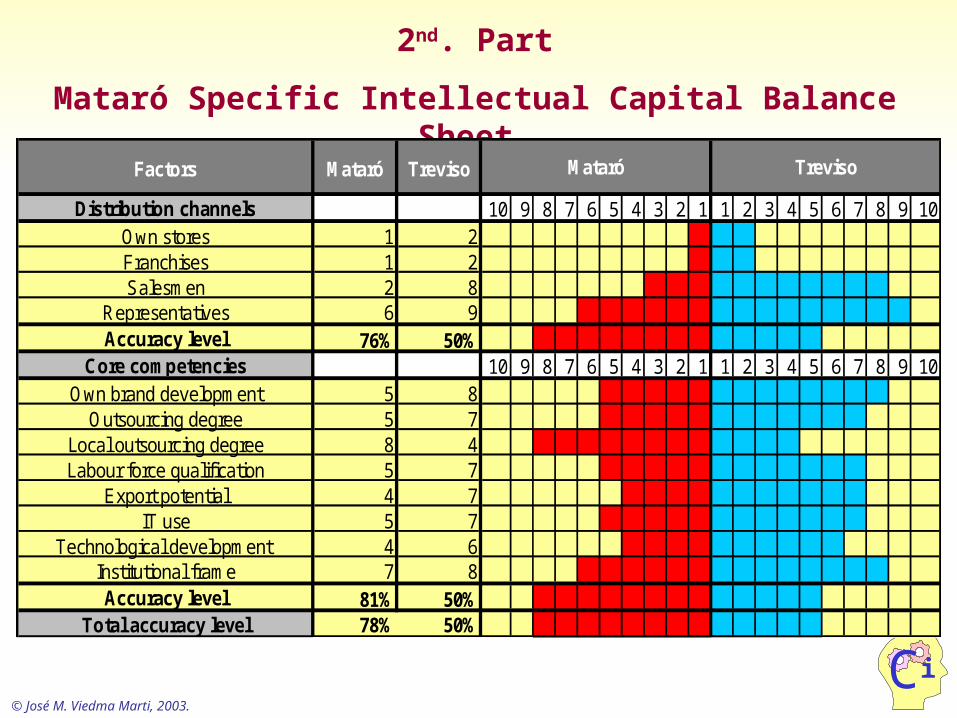
2nd. Part
Mataró Specific Intellectual Capital Balance Sheet.
Factors Mataró Treviso
Distribution channels 10 9 8 7 6 5 4 3 2 1 1 2 3 4 5 6 7 8 9 10Own stores 1 2Franchises 1 2Salesmen 2 8
Representatives 6 9Accuracy level 76% 50%
Core competencies 10 9 8 7 6 5 4 3 2 1 1 2 3 4 5 6 7 8 9 10Own brand development 5 8
Outsourcing degree 5 7Local outsourcing degree 8 4Labour force qualification 5 7
Export potential 4 7IT use 5 7
Technological development 4 6Institutional frame 7 8Accuracy level 81% 50%
Total accuracy level 78% 50%
Mataró Treviso

© José M. Viedma Marti, 2003.
iC
In the past, the vision, objectives and goals of cities have been determined mainly by considering tangible assets as the main factors of a city’s prosperity.
In the knowledge economy the role of intangible assets in wealth creation has become fundamental.
As a result some local communities have initiated strategic plans to develop new information technology and collective knowledge.
However these plans all lack coordination and continuity.
More significantly, they lack an intangible assets framework that allows navigation from the present situation to the future vision of the city.
Conclusions

© José M. Viedma Marti, 2003.
iC
To fill this gap the present paper has presented a model and a framework especially developed for measuring and managing the intellectual capital of cities (CICBS)
City’s Intellectual Capital Model has two different approaches. The first one covers all economic activities of the city. The second one deals specifically with each relevant economic microcluster. Both approaches use benchmarking techniques.
The paper also deals with the practical application of CICBS to the city of Mataró.
In presenting this pioneering effort it is hoped that new productive research on managing intangibles in municipalities will be encouraged.
Conclusions
Thanks for listening