, i f°- ed 152 144 sp 012 518
TRANSCRIPT

f...., ,..
I
. ,-
P
.SP 012 518F°- ED
A
152 144. 1
1 AUTHOR Veiss,-Iris R.; Place, Car01 . .
1`. TfT!.2 1977 rational siirvey of Science, Mathematics and
1 -Social.Studies Education; Implications for TeacherEducation. '
INSTITUTION Research Triangle Inst., Durham, N.C.1 'SPONS'AGENCY National Science Foundatiob, Ileshingtop, D.C..
. PUB,-DATE Mar 78 'NOTE. 19p.; Paper presented at the Annual Meeting of the .,
i
. . .o, Aserican Educational RessarctAssociatiOn (Toronto-AL'am », 'i Canada, Maroh 27-31, 1978).
cl r
DOCOUT RIMINI!
EDRS PRICE . ,p40.83 MC-81.67 Plus Postage. .
DESCRIPSORS Data Andlysis; *Blesentary Secondary. Education;.*mathematics Instruction; *National Surveys; *Science
, Instruction; *Social Studies; *Teacher Educati9n
-issnActThe National Survey of' Science, Mathematics, and
Social Studies Education was conducted in the spring of 1977 as partof the - National. Science, comprehensive need assessmentprogram. The:survey utilized a national probability supple of,districts,, schools, and teachers. Approxiaately 10,000 teachers,-princ4also/superintendenis, and state and local supervisors were 1,
included' in the sample. Response rates ranged from-72-4ercent.fotloCal supOvisorS to 90 peicent for state, supervisors. A- 'ajarpurpose-of the survey was to.prowide the National Science Foundationwith the accurate andup-to-date information needed to saki_ decisions
-About future funding of curriculum development and teacher educationF. actiWities. The sample design, and procedures used in instrusent
-development and datd collection aredescribed-in section, -one.,Selected results are presentedin section two, and sectionthiebdisCisses some of the isplications of these results"fortOachei-education, such as teacher characteristiCs, sources of iifO,rmation,the use'of_vatious instructional materials and, technigte04 and areasin which teachers need additional assistance. (iuthot/MJD)-
*****************************4r**************************4!***********v,
'.... * Reproductions supplied by BDRS are the best that can be made *.
-30, from the original document.*******Ai *e********************************************************
r1,
, / ,
1 \,,
I
1,

RESEARCH TRIANGLE INSTITUTE,
Printed' In Ti. S .A.
1977 NATIONAL SURVEIL OF SCIENCE, MATHEMATICS, .
/AND SOCIAL STUDIES EDUCATION:
,IMPLICATIONS FOR TEACHER EDUCATION
U.S. DEPARTMENT' OF HEALTH.EDUCATION t WELFARE
N4IIONAL INSTITUTE OFEDUCATION
THIS DOCUMENT HAS BEEN REPRO-DUCED EXACTLY AS RECEIVED FROMTHE PERSON OR ORGANIZATION ORIGIN-ATING IT POINTS OF VIEW OR OPINIONSSTATED DO NOT NECESSARILY REPRE-SENT OFFICIAL NATIONAL INSTITUTE OFEDUCATION POSITION OR POLICY
by
Iris R. Weiss
Carol, Place
si
,
et
'American Educational gesearch ssociation
1978 Annual Meeting
March 27-31, 1938
Toronto, Canada
8E881014 18
2
RESEARCH TR IA.NGLE PA R-K, NO,RTH CA RdLINiA 27709
' ..../ .,."PERMISSION TO REPRODUCE THIS
MATERIAL HAS BEEN GRANTED BY
r
`1.0 THE EDUCATIONAL RESOURCES'INFORMATION CENTER (ERIC, ANDTHE. ERIC SYSTEM
CONTRACTORS** °

. \ 7-
.;
tPART I. INTRODUCTION'.
A. Background°and Purpose of the StudY
Since the mid-1950's,'-the.National Science Foundation (NSF) has sups
ported a variety of attempts to improve icience,'mathematicS, and social ,
science education at the pry- college level. As' part of its course content
liMprovvient program, NSF funded the development of such curriculum "materials'
as PSSC -Physics, BSCS Biology, SMSG"MathiMatics., and Man: A Course of
Study, to name just a few. NSF has also sponsored -a large number of work.:
institutes and conferences aimed at increasing the subject matter
competency of teacHers, and assisting teachers in implementing variouscur-
riculum materials. However. very'little is known akput the impact of these
activities. Most studies of the extent of use of the NSF-supported curric-
u'laihave been' local in nature, or they haVe suffered from major design
fgavis which cast doutts on the results. Consequently, NF curriculum- evel-
opment and teacher education efforts have been conducted in 4the absence of
reliable data about the needs of teacheA and students. \ .
' A majoriwurpose of this large-scale National "Survey of Science, Mathe-.
_matids, and Social Studies Education was to provide NSF with thaccurate-
and up=tO-date information needed'to-make.rational decisions about future '.
fundi1g of curriculum development and teacher.education activities. This.
survey:is part of a large-scale needs essessmentsUpportad by NSF; the other
aspects of the needs assessment include a series of case studies and a compre-)
hensive review .of the literature. -While the survey covers abroad ange of
topics, including course offerings, curriculum usage, teaching techniques,
and-teacher,education needs, this paperfocusason particular issues which Ns
have implications for 'teacher education.!
Theesample.design, and the procedures Used"in 4nstrument>development
acid data collection are described inthe following sections; selected results.
: ,are presented in Part II, while Par) III discusses somedf the implications
of these'results for teacher education. ). . -, , ..
4
'1
\
3
,

r,
B.' Sample Design ._, ,
! The National Survey of Science, Mathematics and Social Studies Educa-.
. tion utilized, a nati6nal probability sample of districts, schools and teach-.
ers. The sample was'designed so that national'estimates of Gurricu'um
. usage, course offerings and enrollments, and classroom practices could *be
made from the sample data. The tampledesign also ensured that estimates
could be-made for various Subpopulations such as'those in a particular:
region or paz-ticular t4fpe.if coMMunity.
A probability sample requires that every member 'of the population being
sampled must have a`known positive chance of being selected. The sample
design' for this survey ensured that every 'superintendent, science, mathemat-,
'its and 'social studijsuPerviSor, principal, and'teacR40- of science,-mathe-
matics and Social studies in grades K -12 in the 50 states and-the District of
- Columbia had a chance of being selected. ,
. 4
The samples of superintemdents, supervisors, principals, 'and'teachers.
to,be crtacted in this 'survey were,selected using a multistage stratified
cluste4 design. A sarle ofapproximately 400 public schooldistricils was.
selected from 102 priAary sampling units (PSU1s) consisting of stanaard
%.metropolftan statistical areas, counties, and groups OfVoll4guous counties.
In each district,,, one school With at least one of the grades ..10 -12: and one
\\ : school with at least one of the grades 7-9 were selected.,, /A a subSample_of
two of the- four 'districts in each, sample PSU four additional schools Were
selected --.two with grades-included in the grade ranue,4-6 and two With
grades in the K=3 grade range.
All superintendents in the sample districts were asked to compqe4 9 '
brief questionnaires. The superintendent was also asked.to.proVide the .t%_
names of the district K-6 and 7-12 science, mathematics, and social studies'
supervisors (or other persOns who could answer questions about district '4.',°e,.s,. -
programs in these subject areas); all of these supervisors were askedto., i° =o-
/
_. -''complete questionnaires. -., ..,it
-.,, .. .. -0 ....t
The principal of each sample school was asked to complete a-question'-:
naire and to provide a list of the 'school's stience: mathematiii and social°:' °
studies teachers and the number of classes of each subject thexteacher ,,
taught. These lists were used to select 6 telchers (2 science, 2*.Olhemat7 .--;. 4
o
.
2
4.
ft .. .I
S ics, and ,2 social studies) from each 7-9 and 10-12 sample school as well as a/. .
particular class to be studied in depth. The teacher lists frOm K-3 and 4-6,,
sample schools were used to select 3 teachers per .sch41 and a particularl
. Subject <and class, if applicable) to be studied in'depth.
C. Instrument Development
An initial review of the research literature was conducted to locate .
previous studies of K-12 science, mathematics and social studies education
and.to-identify important variables. A preliminary set of research quesins
and data sources was developed, submitted to NSF, and revised based on NSF'
feedback. Questionnaire items which could be used to answer these research
questions were written (or in some cases items appearing in earlier studies
, were revised) andreiminary drafts of the Oestiorraires were prepared.
Preliminary drafts of the questionnaires were reviewed by NSF, by 18
tonsultants with expertise in science, mathematicS,.and social studies
edudation and by representatives of a number of professional organizations
including the American Association for the:Advancement of Science, the
American, Psychological Association, the.Social Studies,tducation Cqnsortium,
the Educational Products Information Exchange and the national associations...,
of both state supervisors and local distrit supemiisors of science, mathemat-.
ics and Social studies education. The questionnaires were reyised based on
feedback from the various reviewers, approved by the Committee On Evaluation
__and Information Systems (CEIS) of the Council of Chief State School Officers
and by the Office-df-Management and Budget.
D. Data Collection
The Chief State School Officers in the sttes with sample schools were--
asked for permission to contact sample districts in their states. District
superintendents were subsequently c ontacted, and once they had granted
permission, questionnaires,were mailed to,sample members.
Folloig-up-activities used to increase the response. rate included the.
use of Thank-You/Reminder postcards. The resulting response rates were 90
percent for state supervisors, 73 percent for superintendents, 72 percent -
for district supervisors, 84 percent for princips, and 76 percent for,
teachers:
3
53.

a
PART II.- RESULTS
A. Teacher Characteristics ..- .,
Teacherswere asked to indicatethe number of years they hemp taught,
including 19767.77 as to full.year even though' the data .were collectedAuring. . . .0 ,that year. The average amount of teaching
i
experience was 11.5 years;,-and'
-, the averages for teachers in the 12 subject/grade ran categories of inter-.
est in this study (K-3, 4-6, 7-9, and 10-12 science, ma emetics, and social. ....,
- ; studies) are quite similar. ' -..
.
. -14 expected, very few elementary\teachers are male, and the proportion
of male teachers increases with grade. Only 4,percent.of K-3 teachers are
male; the figures are 25 percent for grades 4-6, 9 percent for grades 7-9,
and 75 percent fo'r grades 10-12. On the whole, di ferences among the three .
4
subject areas areminor.. .
.
, . . .
,Sizable numbers of teachers-have earned one o:r_more degrees.beyond thee
bachelor's; with-percentages ranging from 29 percent for K-3 teachers to 561
. .
percent for 10-12 teachers (see Table 1):. In addition, many teachers have
taken courses for college credit in recent years. As shown in Table ,2 more
than 40 percent of all science, mathematics, andsOci studies teachers
have taken a course for. college creditin 1976 or 1977. -0
To protide additional background information about science, mathematics,% ,
.'and social studies teachers, sample teacherere atked'about their.qua)ifi-..
cationt for teaching. Elementary teachers riteB their qualifications for
teachng.each of 4 sqbjects--math, science, %ociaLstudies, and reading;,
these results are shown in Table 3. Nearly,two-thirds ofelementary teachers
feel- "very well qualified" toteich reading. The corresponding figures for
mathematics,; social studies, and. science are 49 percent, 39 percent, and 22
percent, respectively. At'the other end of the scale, 16 percent if elemen-,
tary teachers feel "not well qualified" td teadh science, cOmpared o6
perdent/or fewer in each of the other three areas.', .
Asshown id Table 4, most secondary science, mathematics, and social
studieseteachers teach all of their courses within asingl subject area;
th'd percentages are 76 percent for graded 7-9 and 85 percent for, grades
10712,;
.The.sample'secondary teachers were asked to ilidicateif they are,c T
.%4 ,
d '
$

sy
Table 1: Percent' of leachers Receiving a Degree Beyondthe Bachelo' s., by Subject and. Grade Range
GradeRange
Mathematics Science Social Studies Total.
' '. qtliss
Yes. No 1 ng
- .
Yes
. MissNo ing Yes
_ * 'Miss--
No ing\
Yes
, Miss-No ing.
K -3 34 , 66 1 28' 725i 0 0 23 76 1- 29 .71 1
4-6 34 64. 2 30 70 1 33 66 1 32 .66 1
.7 -9' 45 0 '55 0 50 50, 0 . 51 48 '1 48 51, 0
10 -12 55 '.45 0 54 44 2 58 41 11 1 56 43 1
Sample N , 1672 ' 1679 1478 4829La
Table 2. Ywr of Last Course tot" 'Callege Credit,.63f Subject and Grade Range
r'.
GradeRange
Mathematics:'.
Science.
Social Studies,
Total
Oilior .
tó.19761. Miss-
1976 1977 ing'
Prior .
to 1976- Miss-1976 1977 i ing -
.
,Priorto 1976- Miss-
1976 .1977 ing.
,
Prior, .--
to 197q: Miss-1976 1977 ) ing
,.
K73
4-6
7-9
1012
56 42 2
50 47' 3 ,
63 36 1 ,
55. 42 3 ,
47 49 4 .
4& 51 . ,i
56 44 .1
56 42 3
S,.48 50. 2
52 44 4
51 48 2
56 '42 2
51 47 4
.49 47 '3
- .57 42 1
56 42 2
Sample N .
.
.
1672 .
.
.
.
1679i -"
I
1478 . .
'1
'
.,
-1 4829
e
0 4
f.

<7
Table 3. Elementary Teachers'. Perceptions ofTheir Qualifications to Teach Each Subject
SubjectNot Well
Qualified,
Matbematics 4
, Science 16
.0. Social Studies 5
Reading .3
Sample N = 467 )
Percent of TeachersAdequately' Very WellQualified Qualified
46 49
60 22
,54. 39
32 63
Missing
2
1
2
Table 4. Percent of Secondary Stience,\ athematics and.SoCial StudiesTeachers Teaching' Various Combination of Subjects, by Grade Range
Subjects TaughtGrade Range
7-9 10-12,Total
Mathematics Only
Stiene,nly (
Social Studies Only Nilm
Mathematics and Science Only4 4
Mathematics and Social;Studies Only
Science and Social Studies Only
Mathematics, SciencesAnd SOcialik-.Studies Only
4
Other Combinations of Subjects
28
r.24 27
24. 31
3
1
19
5
0
2
0
8
28
25
. 27
4.
1
1
0
14
4
Sample N 3162
4,
6
8
4

teaching any courses 'that ey do not' eel adequately qualified to teach
and, if so, to Specify the courses. Thirteen percent of secondary science
teachers are currently teaching one or more courses for which they feel
inadequately qualified, compared to 12 percent of social studies teachers
and 8 percent'of mathematics teachers. The majority of the teachers listed
courses,in the'ir sample subjeCt area; for example, most of the science
teachers who indicated they are Anadequately qualified'to teach one or.more
courses were referring to courses within science, The problem of teaching
"out of field" is apparently a problem within each major subject area rather,
than:across subject areas.
B. Time Spent in Science, Mathematics, Social Studies and ReadingInstruction
Each elementary teacher was asked to write in the approximate number of
minutes typically spent teaching mathematics, science, social studies and
reading. The average number,f minutes per day typically spent in K-3 and
4-6 instruction in each subject i shown in Table 5; to facilitate compari-
sons among the 'subject areas only teachers who teach all *our of these-.
Subjects to one class of students were included in these analyses. Note.
Table 5. Average Number of Minutes per'day Spent Teaching EachSubject in Self-Contained Classes, by Grade Range'
-Subject
Grade RangeTotal
AverageNumber ofMindtes
K-3 .-
Average. '
Number ofMinute's
4-6Average
Number-ofMinutes
Mathematics !KC 51 4 44
Science 17 28 20
Social.Studies 21' 34 25'
Reading ° 95 66 86
Sample N 467 302 -769
. 'Only teac ers who indicated they teach mathematics, science,, social studies,
jand readin to one class of students were included in these analyses.
.
7
9

that in each grade level, the amount of time spent is greatest for reading,0
followed by mathematics, then social itudieS and finally science: -Hbwdver,-
the difference betWeen reading and the other subjects decreases froM K-3 t
4-6 because the amount of time spent on reading decreases and the nt of
time spent on each of the other subjectsincreades.
C. Federally Funded Curriculum Materials
One measure of the impact of the federal curriculum development efforts
is'the extent of useof these materials. The survey found that by far the
most extensive usage of federally funded.curriculum materials'is in science
in grades 7-12; a total of 60 percent of th e districts are: using at least
one of these materials, with 41 percent using more than one. Usage in
elementary science and elementary and secondary social studies is'lower (33
percent, 25 percent and'24 percent, respectively). At both the K-6-'and 7-12
grade levels, district usage of any federally funded mathematicscurriculum .
materials per-se:is below the 10 percent level. However, it should be noted.
I that, as was intended, many of the:innovative ideasintroduced in thefeder-
ally Nfunded materials have now been,incorporated into the commercially A
available textbooks which are being used in many districts. .
/'
As mentioned earlier, NSF has sponsored a variety of teacher education
activities during the last 20 years., The urvey found that many more science .
and mathematics.
teachers,thansocial stUdi s teachers have participated in
one_or more NSF-funded'workshops, institu es,---or conferences. Also,..
the
level of participation generally increase with increasinglgradelevel.,
While fewer than 10 percent of elementar school teacheri or soctal studies
tefthers have attended any of'these NSF- ponsoredaqtivities; more than
one-third of all high school mathematic teachers and almost half of all
high school science teachers have parfl ipgted in at least one such activ--,
ity!
a. Teacher Needs for Assistance
sTeachersere given a list of ar as and Asked to specify for each
whethdr: (1) they.do not usuallynee assistance, (2) they would like\'
`assistan ce from'a resource person (e g., a coordinator, a consultant, or
.another-teacher) but .receive little r none, or ,(3) they would,like assist-,
ance and receive, adequate assistance Table 6 summarizes the data by indi-,
O

`-
. 7 . 0
Table b. Percent of Teachers With Varying Numbers of Areas In WhichThey Need Assistance, by Sub and Grade Range .
Need for Assistance
SubjectiGrad:'Range 0 Areas1: 4
AreAs
.Total 23
25
30
21
26
42
48
-41
55
45
Mathematics
K-3
4-6
'7-9
10-12
Sciencer
K- 3
4-6
25
. 17
32
32
CL.,
7-9 '-ii- 43
10-1r 17 ,. 34A/44,
Social Studies
K-3 33 35
4-6' 23 , Vs
7-9 22 46
10-12 22 I_ -39
5 orMore Areas
32
27
26
23'
29
3
i45
37
35
° 26
36
29
.374
3
1
3
1
0
10
642
0
5
3
2
1This.includes all teachers who omitted 6 or more parts of the question.
cating thelreakdown of teachers_who would like assistance but receive
litfle.o none in,varying numbers of areas. Twenty-three percent of the. .
teachers 'did not indicate a need for additional apistance iniapy of the
areas; 42 percent specified from 1 to 4 areas, while 32 percent indicated a
need for additional assistance in 5 or more areas. ?
The complete results for individual -areas of need are presented,in
Table 7for all science, mathematics, and social studies teachers. Note
that'more than 75 percent Of science, Mathematics, and socidl_studies teach-.
9
11

, U
S
Table Science, Mathematics and, Social StudiesTeacherS' Needs for Assistance
,
. .
.
P "\
4D, 0
-
,
-, Do Not,.
Do Not ReceiveNeed - Adequate
Asiistance'Aisistance
0
ReceiveAdequate
AssistanceMiss-ing
.. , -
. .
Establishing instructional' ,
objectives ,.
Lesson planning
Learning new teaching methods'.
Obtaining information aboutinstructional materials .
Obtaining subject matterInformation
f
r--IMplementing discovery!,inquiry approach
i:
Using manipulative or- hands-dn materials ,
4, ``.
Maintaining equipment
//' working with small grdups .
of students . ,--
1'
Maintaining discipline
Articulating instruction acrossgrade levels ,'
e-N
.
-
,
.
-
70 ,,
83
34
.
30 -
ao
47,
. -,48
'62
,
.
.
60
82.
,rr' ,
57
'
.
.
I.
.
,
.
i
,
-
%
15
9
43 ,
.
43 '
.
28
36
33-
19t.,
29
8
29 :
.
.
'
';.
-
.
. 11
5-
18,- .'
24
48
.
12
'14
'$14
,
6
6
,,,'
8'
-
.
.
4
- -4
4
4
5
,
.5
s 5
4
.
''
3
,
'6
ers do not usually need assistance in lesson planning; ctially teaching4
lessons, and maintaining discipline. , These results were -quite consistent
,/across the 12 grade range/subject categories examined in this study (K-3, .
4-6, 7-9 and' 10-12 science, mathematics, and:socia; studies).
What are the greatest needs? Very few teachers (about one-third) feel
able,to learn 'new teaching methods and to.obtain informAtion about instisuc-,
:0°0/al-materials withoutassistance from a subject matter resource ,person.
While some teachers indicated they are getting assistance, more pan 40 .-.
percent belie*veithey.are not rece;Ong_adequate assistance in each of these
areas..
12 '06

.,
Many of the federally funded curriculum development projects, as well
as some of the more recent commercially developed materials,'depend.upon a
discovery or inquiry approach. However, fewer than half O-a-Al science,
matOematfAand,socialostudies teachers feel they are competent-in this
area without assistance from a coordina4pr or other resource person. 7hirtY-.
six percent indicated they'would like assistance but receive little or none;
only. 12 pei.cent would like assistance and eel they are receiving adequate
assistance. Similarly, approximately h f of these teachers feel inadequate
to the task of ping manipalatives ,or ands-On materialewithout utside
assistancebut'only 14 percent feel they are g4tting the necessarS, help.
Other areas` where sizable numbers of teachers feel the need for more
assistance than they are currently receiving include Working with small
groups of students (29 percent), articulating instruction across grade -
levels (29 percent), and obtaining subject matter information (28 percent)
The latter area appears to be a greater problem-in elementary science and in
elementary and secondary social studies than in mathematics or secondary
,science,
E. Sources of Information. Used by Teachers
Teachers were also given a list of possible sources of Wormetion
about new developMents in education and were asked_to rate the utility of
each. .The results showed that many science, mathematics, and social-studies
teachers rellon other teachers Or information;, approximately haff,of them
,rate this source "very useful" while most of the others consider teachers
"somewhat useful." Other partidularly veluablOources of information for0
teachers include journals and other professional publications (especially. .
'for teachers in the higher grades), college colirses, antrfor elementary
'teachers, local in-service programs. Pri,Acipa/s,,loCal subAct'speciOists,
federally sponsored workshops, meetings of pOfeSsi.onal organizations4 and4-
publishers and sales representatives are also considered useful sourcis.of/
'information by qdite a few teachers,-While the majority of teachers radii'
teacher union meetings and state depatment personnel as "not useful."
F. I'nstructionaT Materiels and Techniques'
The textbook continues to play a central role in science, matheMaitcs,
and social studies classes. With the exception of K-3 science and social
O

studies, virtually all science, mathematicS'and'social studies classes use
published textbooks or programs.' While most classes use a singlw,textbook
or program, approximately one-third use multiple textbooks. In most districts,
teacheer committees and individualt rs are heavily involved'in selecting
the textbooks to be used. In man cases pfincipals, s'Lperintendepts and
district-wide supervisors are also involved in thesedecisions. Very few
districts involve students, parents or school board-tiembers td any great
extent in the extbook selection process.
Lectur and discussion are the predominant techniques used in science,
mathematics, and social studies classes. Discussion occurs "just about,
daily" in half or more of these classes. Approximately two-thirds of the.
classes in each -subject, have lecture once a week or more, with many of these. . ,
having lectures "just about daily."
Sdience and'social studies classes are generally more likely than
mathematics classes41
to.use alternative activities such as library work, .* .
student projects, field trips, and guest Speakers. Similarly, films,.film-.
strips, film loops, slides, tapes, md records are more frequently used, in
science and social studies classes thin in mathematics classes. On the,
other hand`, individual assignmenti, chalkboard work,,and tests occur more
9 frequently in .mathematics classes than in social studies or science classes.
Televised instruction, programmed instruction, computer-assisted instruction,f ,
and contracts are rarely used iriftly of the three subjects. Finally, simula-
tion icti ities (e.g., role-play, debates, panels) are common in ;social
0'
=.
studies t rare in science and mathematics.
Prilicipals were -asked about the availability of various types of equip-,.
ment and teachers were asked about the actual use of these. The results
showed that some types of equipment are available in0
many schools, but Aref-
used.in-relatively,few classes. For example, while more than three-foUrthsJ.
of elementary schools have microscopes', only 28 percentof the K-3 science
classes ant 56 per' nt of the 4-6 science classes ever make use of them:
Similarly, whilp app oXimately half of all schools with grades 7-9 have
hand-held-calculators, only 16 perceht of 7;9 science classes and 11 percent
'Approximately one-third of K-3 sdience and social studies clAsses use.
no-published textbook or program. ,
_
4,
S
*
5
. .
of 7-9 mathematics claSses use calculators. As a final example, whi e'36
percent Of 10-12 schooli"have computers or computer terminals, onl per-'
cent of 10-12 science classes and 16 percent of 10-12 mathematics classes
ever uses,them.. .
The use of "hands-On" or manipulative materials is most requent in /
science -classes, with 48 percent of the classes using them least once/a
week,compaAd to 38 percent of mathematics classes and 24 ercent of social
studies classes. However, even in science approximately/one out of lour
classes use manipulattves less than once a month.
In science classes,'the use of manipulatives in reases with increas
grade level. Meter hicks and rulers are frequent y.used at-a grade
levels, while living Plants and animals are freq ently used 1'1 the 1 er
grades, and balances and scales are frequently Sed ibe higher wades.
Interestingly,- science teachers who have atte deck one or more NSF sponsored
activities are considerably more likely tha other science teachers to use. -
manipulative materials in their classes. his is not the-case for mathemat-
ics or social studies fe'scheri.
In mathematics, use of manipulatives is more common in the lower grades.
Games and puzzles, activitycards or kits, and numeration and place,value.
.-. manipulatives such as rods and blocks.are frequently usecOIR1 grades K-6. At/
__all grade'levels, nonrmetric measurement tools,are more frequently used than
metric measurement tools. In soc al'studies, use of manipulatives is again
-4 more common inthe lower grades,4/ith maps, charts,, and globes being used.
. quite freq0ently.
Science ,and mathematic's tachers were asked about the use of,the metric
system in their classes. As shown'in Table 4, use of metric' concepts in-:
creases with. grade level.in science classes;.approximately 90,percet2f the
77,9 and 10-12 science clas es make use of the metric system. In mathemat-. i- . .
ics, on the other, hand, u e is higher in the lower grades; by grades 10-12
Ally 56 percent off mathematics classes use metric concepts., In addition,. A.
mathematics Ilasses ,are ore'rikely to use the metric system, only in aJ 1
special unit, while science classes'are more likely to introduce the con-
tepts in'a special unit and then use them'throughout the course./
13
15
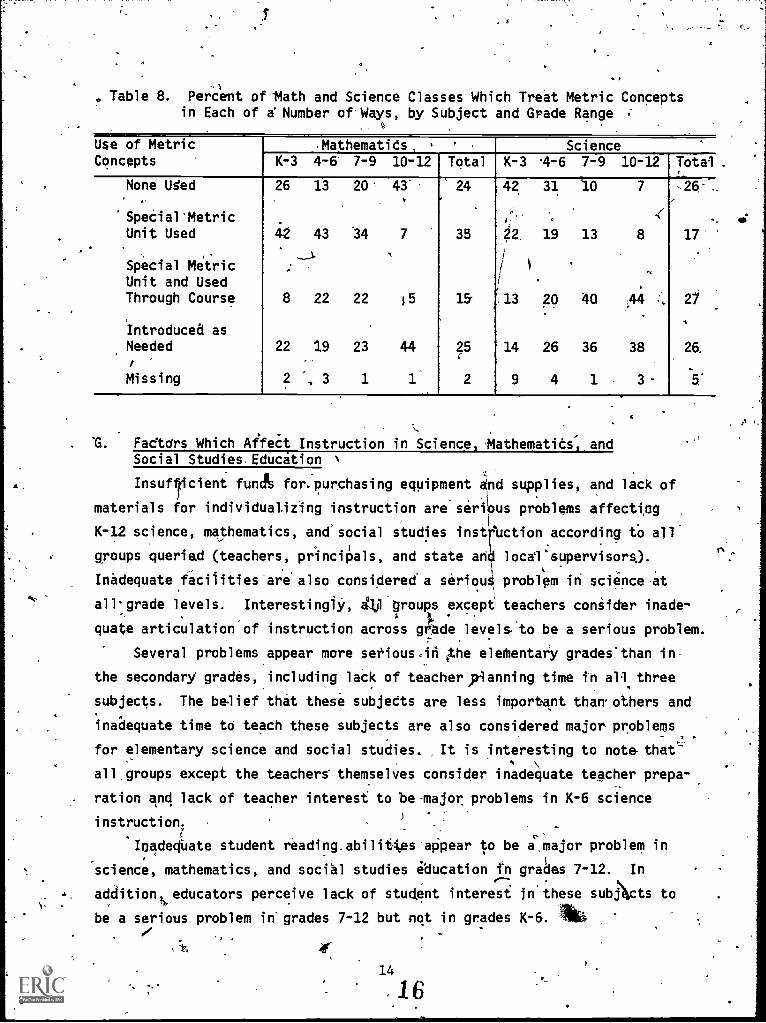
. Table 8. Perdkvnt of "Math and Science Classes Which Treat Metric Conceptsin Each of a Number of Ways, by Subject and Grade Range
Use of MetricConcepts K-3
None Used
'Special MetricUnit Used
Special MetricUnit and UsedThrough Course
Introduced as
NeededI
Missing
26
42
8
22
Mathematids,4-6 7-9 10-12
13 20 43'
43 34 7
22 22 15
19 23 44
2 , 3 1
Total K-3
24
35
15
25
2
42
ry
22_
/
I
.13
14
9
Science4-6 7-9 10-12 Total
31 10 7 ,26-
19 13 8 17
20 40
26 36 38 26,
4 1 3-
. . .
. Fadtors Which Affect Instruction in Science, Mathematids, andSocial Studies,Educition N
Insufficient fund for.purchasing equipment end supplies, and lack ofdmaterials for individualizing instruction are serious problems affecting
K-12 science, mathematics, and'social studies instqUction according to all
gyoups queried (teachers, principals, and state an local'supervisors).
Inadequatefaciiities'are'also considered a seriou problpm in science-at.
all-grade levels. Interestingly, AA groups except teachers consider inade-
quate articulation of instruction across grade levels to be a serious problem.
Several problems appear more seMous.iti the elementary grades than in
the secondary grades, including lick of teacher Manning time tn all three
subjects. The belief that these subjects are less important thank others and
inadequate time to teach these subjects are also considered major problems.
for elementary science and social studies. It is interesting to note that-\
allgroups except the teachers themselves consider inadequate teacher prepa-
ration and lack of teacher interest to be major problems in K-6 science'instruction.
. !_
Inadequate student reading,abilitAes appear to be a,major problem in
science, mathematics, and social studies education fn grades 7-12. In
addition educators perceive lack of student interest in'these subActs to
be a serious problem in'grades 7-12 but not in gr. ades K-6. llit4

5-",r
'PART IMPLICATIONS FOR TEACHER EDUCATION---:-
Thresults 0?C-th1977 National Survey of Science, MatheMatics, and, .
Social Studfe4,EducatiOn:can be used by those responsible for teacher educa-
tion in making decisions,abOut pre-service and in-service programs. For
.example, current certification"rgOirements often allow a secondary teacher
to become certified in 'a single subjeCt, suCh as biology, with only
exposure to other areas of science. The survey found that, while the sci=
ence teacher does not often. teach mathematics or social studies, the biology
,teacher quiteoften teaches a.section of chemistry or physics. Teacher.-
certification 'departments should take note-of the fact that approximately'10
percept bfthe,secondary.science, mathematics, and social studies teachers
feel'i adequately prepared to teach one or more of the subjects within their
disci ine that they are currently teaching. Given the reality that many
teachers will haVe to teach more than 'one subject within a discipline, a
restr/ucturing of teacher certification course (or competency) requirements
may/be in order.
Mathematics educators may be concerned about the data related to use of,
the metric Vystem. The majority of 10-12 mathematics teachers.indicated1
.
hat.metric measurement tools are "not needed" in their classes, and more.
::.. a
,
Kan 40 percent of the 10-12 mathematics classes never use metric concepts.
/ In contrast, almost'all of the 1Q -12 science classes make use of the metric
,-system. . ,,
.
,., f .
Science educators will be distressed to see-that despite.tii many
,,efforts to Strengthen elementary science education, science continues to
"receive considerOly less - emphasis than other subjects in the elementary. -
school classroom. The average number of minutes spent in science instruc-
tion in self-contained K-6 classes is less than half that spent on mathe--
matics and less than one-fourth that spent on reading., Elementary teachers'
perceptions about their qualifications forteaching the various subjects are.
consistent with. the amount of time tha#t is generally spent in instruction in
A
s.
.re
'15
17I
a

j
4
s.
S.
C'
these areas, yith the percentof teachers feeling "not well qualified!' to
teach science considerably greater than for reading, mathematics or socialT ZIP
studies. Science educators may also be concerned that, 'while the useof1
manipulatives is (here widespread in science than in mathematics orsociai,
studies, 9 percent of the science classes never use manipulative mate= +Y4
,..
rials and another 14 percent do so less than once a month.
Educators interested in all three°of these subjects may be concerned
about the lack of change in classroom instruction in recent years. While.
many educators recommend the use of a diversity of materials and .teaching
techniques, most classes still use a single textbook, and lecture and-
cussion continue asktpe dOminarit techniques.
In addition to inferring needs from the data related to classroom .
5ractites, teacher educatorS can look directly at the.needs perceived dy
teachei.s. Sizable numbers of teachers of each+subject expres;ed a need for
additional assistance in several aspects instruction, most notably.learn-.,
ing new teaching tethods, obtaining information about instructional mate--, .
rials, implementing the discovery/inquiry approach, and using hands-on
materials.
How can teachers obtain the necessary, assistance? listoricallY, the
primary emphasisin'teacher education has been pre-service preparation of
teachers. However, the findings of this urvey and other studies show that
a reordering of priorities may be ecessary. Teacher turnover rates have
decli ed to the point where therave age teacher has been teaching for moreA
than a years. ThUs, there is 'often a very long period of,time between
initial training and certification and, retirement from the profession.
Regardless of the strength of their pre-service preparation, teachers can be4
expected to develop professional needs during the course of their careers,,
and it is essential that a system be 'developed to help teachers meet these
needs.
According to the resultsOf this study, cofleges and universities have
the opportunity to attempt to meet the needs of a large number of practicing j.
teachers. More than 40 percent of the K-12 science, mathematics, and social-
studies teachers have taken a course for college credit during the last two
years.° Whether this is due to the desire for professional growth on the
i8

part of many.teachers, or is primarily a reflection of,teacher renewal
,
requirements, the fact remains that the teachers are there, to be reached.
1 ,,,I4e findings.-of this study can be used to structge courses which have a
kfgker likelihood of improving instruction in sciencevmatlpmatics, and
social studies.'N
4
"
9
t,
1111
Ike
17
,0*
1
?.