* for those free of cancer at beginning of age interval. source: devcan: probability of developing...
TRANSCRIPT


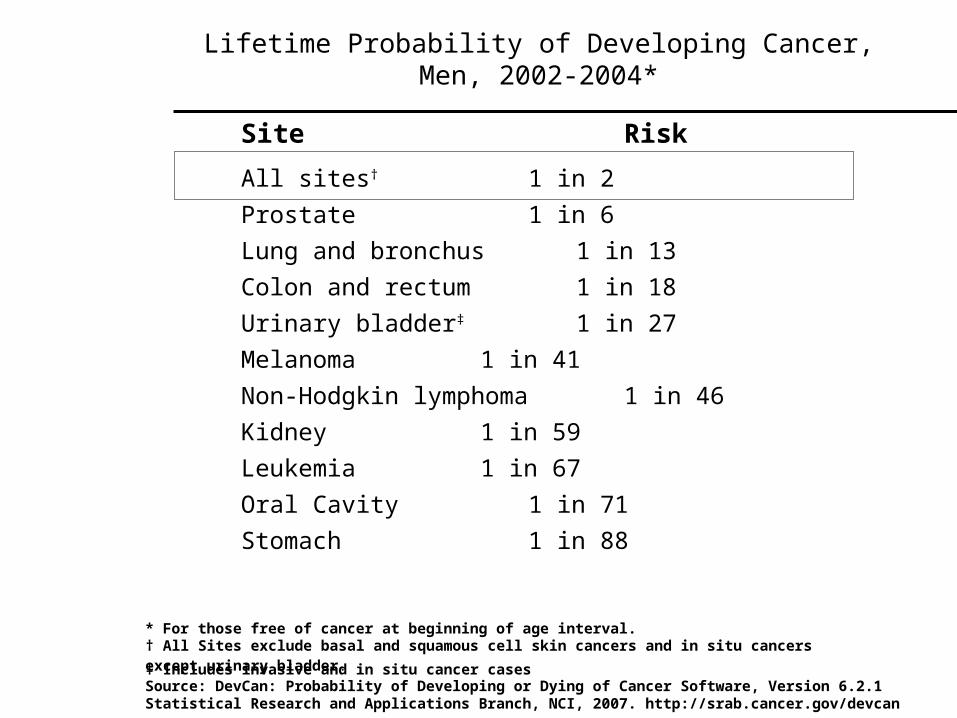
* For those free of cancer at beginning of age interval.
Source: DevCan: Probability of Developing or Dying of Cancer Software, Version 6.2.1 Statistical Research and Applications Branch, NCI, 2007. http://srab.cancer.gov/devcan
Lifetime Probability of Developing Cancer, Men, 2002-2004*
† All Sites exclude basal and squamous cell skin cancers and in situ cancers except urinary bladder .
Site Risk
All sites† 1 in 2
Prostate 1 in 6
Lung and bronchus 1 in 13
Colon and rectum 1 in 18
Urinary bladder‡ 1 in 27
Melanoma 1 in 41
Non-Hodgkin lymphoma 1 in 46
Kidney 1 in 59
Leukemia 1 in 67
Oral Cavity 1 in 71
Stomach 1 in 88
‡ Includes invasive and in situ cancer cases

Lifetime Probability of Developing Cancer, Women, US, 2002-2004*
Site Risk
All sites† 1 in 3
Breast 1 in 8
Lung & bronchus 1 in 16
Colon & rectum 1 in 19
Uterine corpus 1 in 41
Non-Hodgkin lymphoma 1 in 53
Melanoma 1 in 61
Ovary 1 in 71
Pancreas 1 in 76
Urinary bladder‡ 1 in 85
Uterine cervix 1 in 142
Source: DevCan: Probability of Developing or Dying of Cancer Software, Version 6.2.1 Statistical Research and Applications Branch, NCI, 2007. http://srab.cancer.gov/devcan
* For those free of cancer at beginning of age interval. † All Sites exclude basal and squamous cell skin cancers and in situ cancers except urinary bladder .‡ Includes invasive and in situ cancer cases

All Sites 67 57 10
Breast (female) 90 78 12
Colon 66 55 11
Esophagus 18 11 7
Leukemia 51 40 11
Non-Hodgkin lymphoma 65 56 9
Oral cavity 62 41 21
Prostate 99 95 4
Rectum 66 58 8
Urinary bladder 81 65 16
Uterine cervix 74 66 8
Uterine corpus 86 61 25
Cancer Survival*(%) by Race,1996-2003
*5-year relative survival rates based on cancer patients diagnosed from 1996 to 2003 and followed through 2004. Source: Surveillance, Epidemiology, and End Results Program, 1975-2004, Division of Cancer Control andPopulation Sciences, National Cancer Institute, 2007.
Site WhiteAbsolute Difference
AfricanAmerican

Trends in Five-year Relative Survival (%)* Rates, US, 1975-2003
*5-year relative survival rates based on follow up of patients through 2004. Source: Surveillance, Epidemiology, and End Results Program, 1975-2004, Division of Cancer Control andPopulation Sciences, National Cancer Institute, 2007.
Site 1975-1977 1984-1986 1996-2003
• All sites 50 5466
• Breast (female) 75 7989
• Colon 51 5965
• Leukemia 35 4250
• Lung and bronchus 13 1316
• Melanoma 82 8792
• Non-Hodgkin lymphoma 48 5364
• Ovary 37 40 45
• Pancreas 2 3 5
• Prostate 69 7699
• Rectum 49 5766
• Urinary bladder 74 7881


Cancer Death Rates* in Children 0-14 Years by Sex, US, 2000-2004
*Per 100,000, age-adjusted to the 2000 US standard population.ONS = Other nervous systemSource: Surveillance, Epidemiology, and End Results Program, 1975-2004, Division of Cancer Control and Population Sciences, National Cancer Institute, 2007.
Site Male Female Total
All sites 2.7 2.3 2.5
Leukemia 0.9 0.7 0.8
Acute Lymphocytic 0.4 0.3 0.4
Brain/ONS 0.8 0.7 0.7
Non-Hodgkin lymphoma 0.1 0.1 0.1
Soft tissue 0.1 0.1 0.1
Bone and Joint 0.1 0.1 0.1
Kidney and Renal pelvis 0.1 0.1 0.1


CELL DIVISIONCELL DIVISION
DNA Synthesis –
Duplication of chromosomes
DNA Synthesis –
Duplication of chromosomes
• Growth after division
• The time when cells differentiate
• Longest phase
• Growth after division
• The time when cells differentiate
• Longest phase
Growth, preparing for division
Growth, preparing for division
DivisionDivision• Growth after
division
• The time when cells differentiate
• Longest phase
• Growth after division
• The time when cells differentiate
• Longest phase
Division stops when the cell reaches it’s function
Division stops when the cell reaches it’s function


CELLULAR REPRODUCTIONCELLULAR REPRODUCTION STEM CELLSTEM CELL
Normal, fully differentiated cells with special functions, fixed life span and slow (or no)
growth.
Normal, fully differentiated cells with special functions, fixed life span and slow (or no)
growth.

CANCER REPRODUCTIONCANCER REPRODUCTION
Continuous reproduction of poorly differentiated highly malignant cancer cells.
Continuous reproduction of poorly differentiated highly malignant cancer cells.
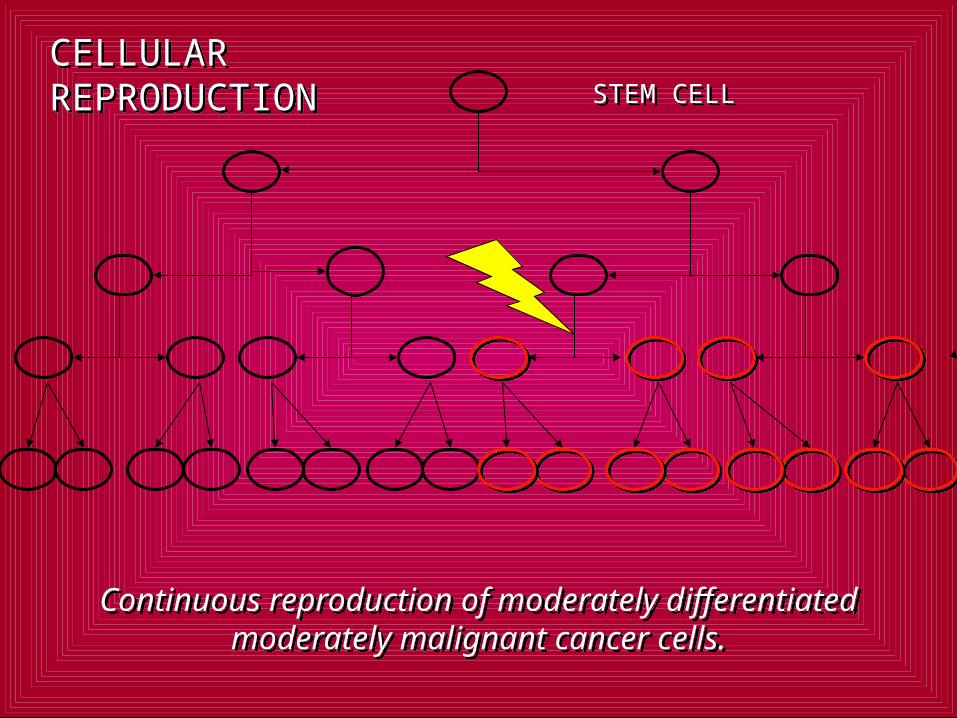
CELLULAR REPRODUCTIONCELLULAR REPRODUCTION STEM CELLSTEM CELL
Continuous reproduction of moderately differentiated moderately malignant cancer
cells.
Continuous reproduction of moderately differentiated moderately malignant cancer
cells.

CELLULAR REPRODUCTIONCELLULAR REPRODUCTION STEM CELLSTEM CELL
Continuous reproduction of well differentiated low malignant cancer cells.
Continuous reproduction of well differentiated low malignant cancer cells.


• Chemicals• Viruses• X-rays• Radioactive Materials
ENVIRONMENT
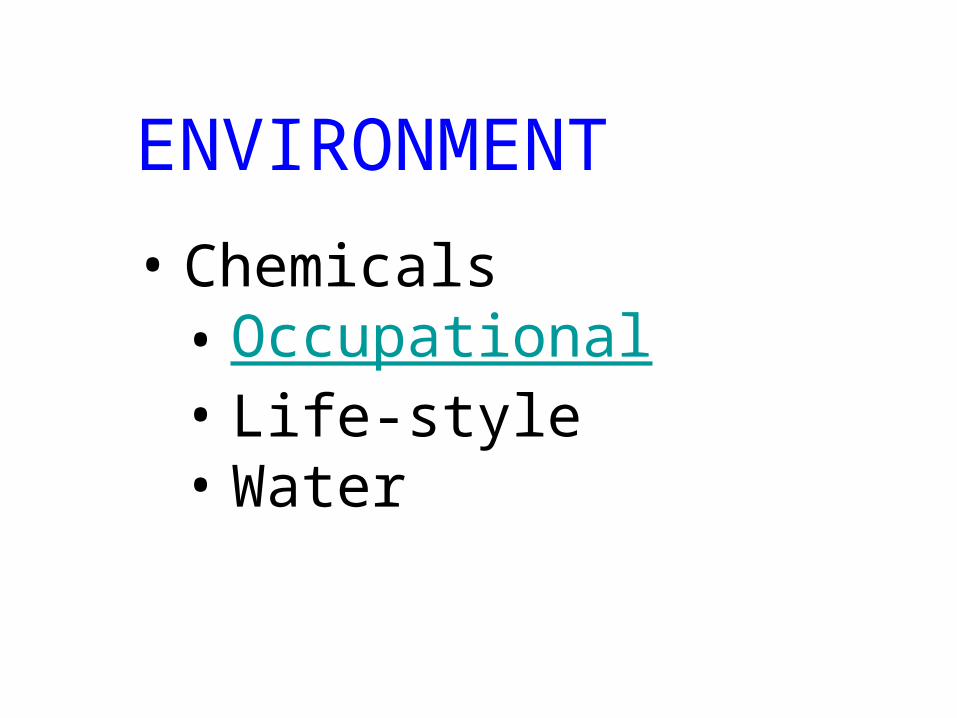
• Chemicals• Occupational• Life-style• Water
ENVIRONMENT

• Chemicals• Occupational• Life-style
• Smoking• Dietary
ENVIRONMENT

• Dietary• Smoked, pickled, cured• High in nitrates• Cooked at high temps• High Fat
ENVIRONMENT

• Chemicals• Occupational• Life-style• Water
ENVIRONMENT

• Viruses• Papovirsuses• Adenoviruses• Herpesviruses• B-type viruses• C-type Viruses
ENVIRONMENT


• Chemicals• Viruses• X-rays• Radioactive Materials• Oxidative Stress
ENVIRONMENT

• Diseases• Immune System defects
GENETICS

• Breast • 1 in 5 vs. 1 in 12
• Stomach • Colon
• 20x• Uterine • Prostate • Lung
GENETICS

• Diseases• Xeroderma pigmentosum • Franconi's Anemia • Bloom's Syndrome • Garner's Syndrome • Ataxia Telangiectasia
GENETICS


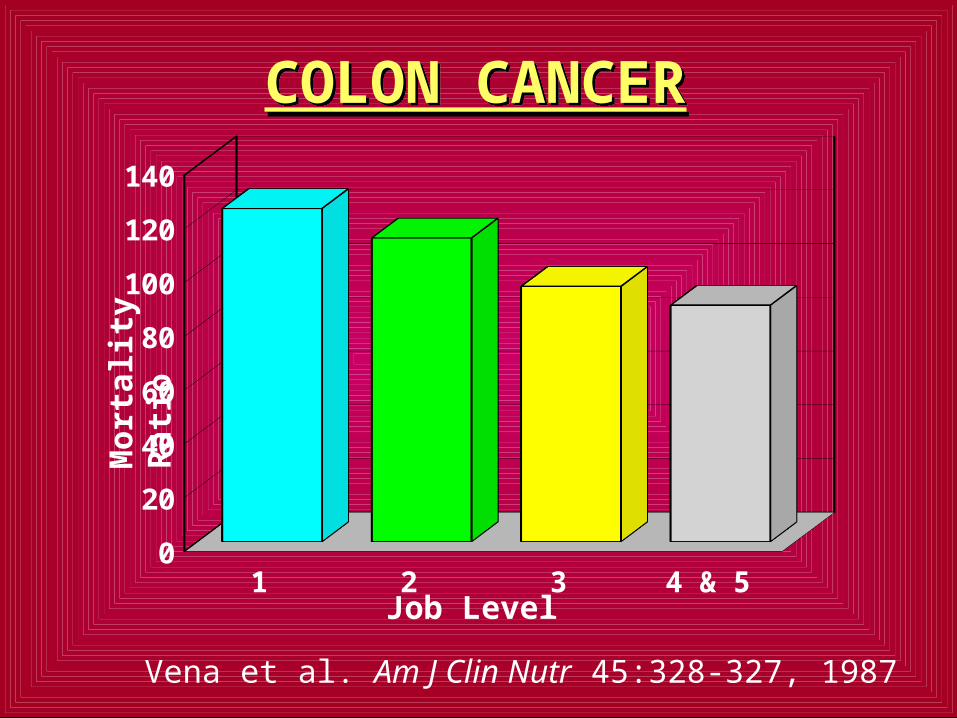
COLON CANCERCOLON CANCER
1 2 3 4 & 50
20
40
60
80
100
120
140
Mort
ality
R
ati
o
Job Level
Vena et al. Am J Clin Nutr 45:328-327, 1987

Normal
Colon Cancer Patient
McTiernan et al. Cancer Epidemiology Biomarkers Prevention 15:1588-97, 2006

Controls Exercise >250 min/wk
16.5
17
17.5
18
18.5
19
19.5
20
Before
After
Prol
ifera
tion
Mar
kers
(%)
McTiernan et al. Cancer Epidemiology Biomarkers Prevention 15:1588-97, 2006
COLON CELL PROLIFERATION AND EXERCISE

BREAST CANCERBREAST CANCER
1 2 3 to 50
20
40
60
80
100
120
Mort
ality
R
ati
o
Job Level
Vena et al. Am J Clin Nutr 45:328-327, 1987

Irwin, ML, et al. Breast Cancer Research and Treatment 95:171-178, 2006
Low Moderate High0
1000
2000
3000
4000
5000
6000
<30 BMI
>30 BMI
MAMMOGRAPHIC DENSITY AND PHYSICAL ACTIVITY IN POSTMENOPAUSAL WOMEN

Baseline 3 months 12 months40
41
42
43
44
45
46
ControlExercise
Estr
one
conc
entr
ation
REPRODUCTIVE HORMONES AND PHYSICAL ACTIVITY
McTiernan, et al. Cancer Research 64:2923-2928, 2004.

McTiernan, et al. Cancer Research 64:2923-2928, 2004.
REPRODUCTIVE HORMONES AND PHYSICAL ACTIVITY
Baseline 3 months 12 months16
16.5
17
17.5
18
18.5
Control
Exercise
Estr
adio
l Co
ncen
trati
on

Rectal Prostate Lung0
50
100
150
200
250
300
350
Risk Reduction
Risk Increase
Perc
ent R
isk
(%)
EPIDEMIOLOGY: PHYSICAL ACTIVITY AND CANCER

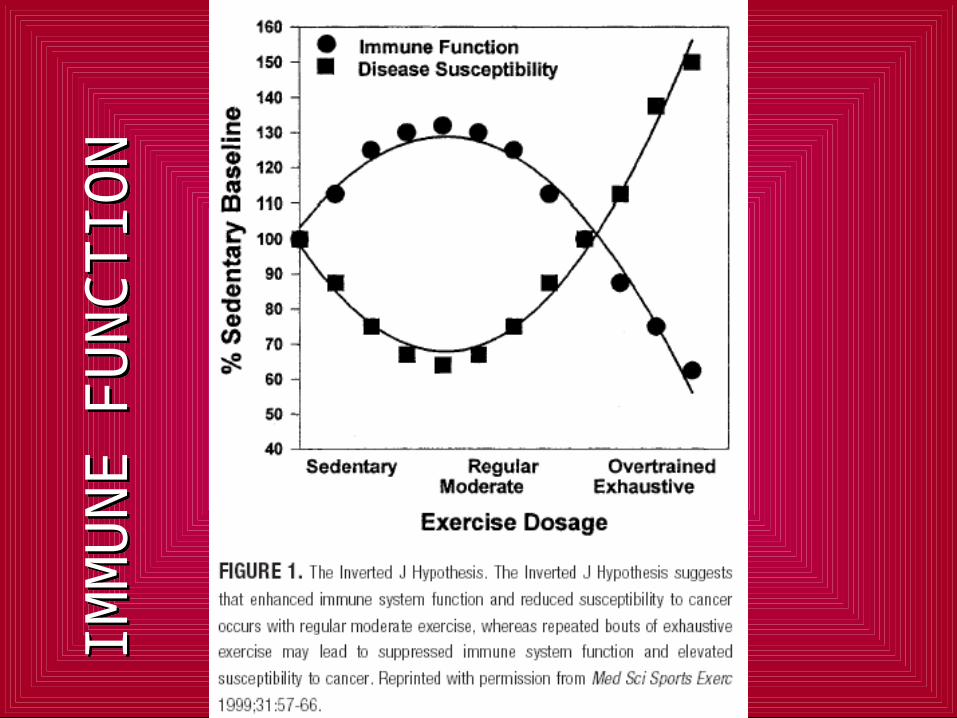
IMM
UN
E F
UN
CT
ION
IMM
UN
E F
UN
CT
ION


Hair Loss
Concentration
Hot Flashes
Skin Problems
Weight Loss
Memory Loss
Shortness of Breath
Depression
Sleep Disturbances
Nausea
Fatigue
Pain
0 1 2 3 4 5 6 7
ExercisersNon-Exercisers
Mustain, KM, et al Support Care Cancer 14:732-741, 2006.


