figure 1 : stochastics moving average chart...12 min nas nyse
TRANSCRIPT

Figure 1 : Stochastics Moving Average Chart
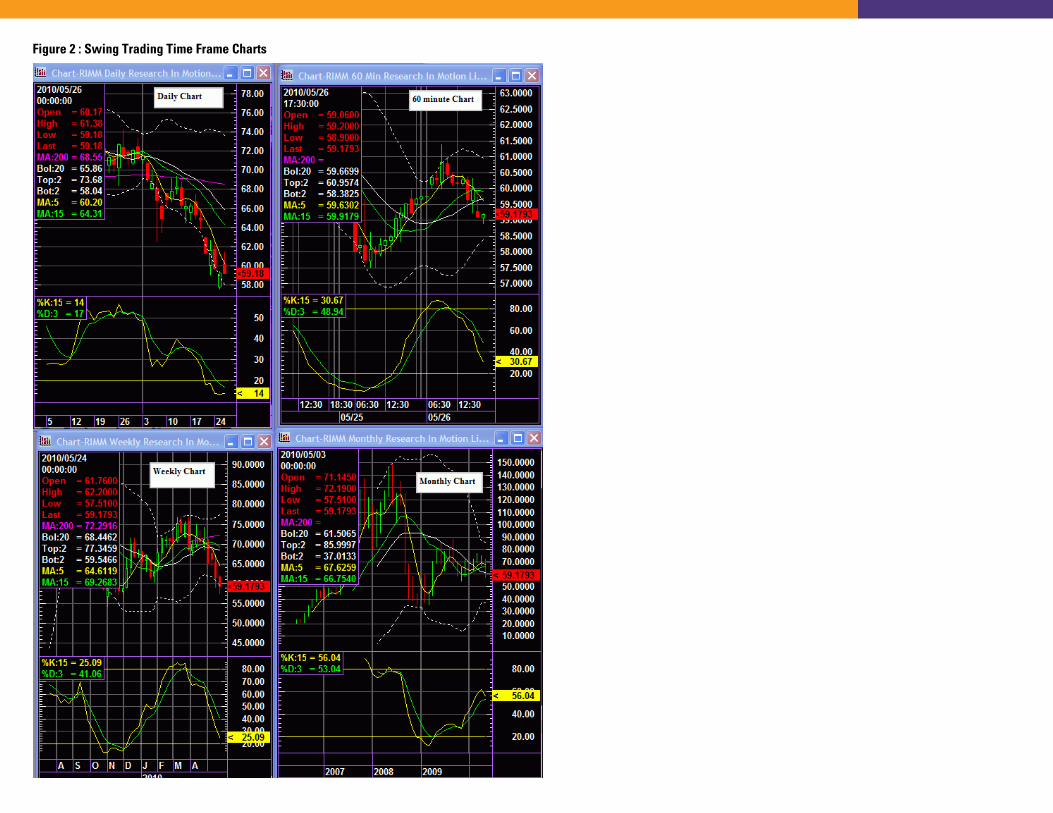
Figure 2 : Swing Trading Time Frame Charts

Figure 3 : Intraday Trading Time Frame Charts

Figure 4 : Bumpers
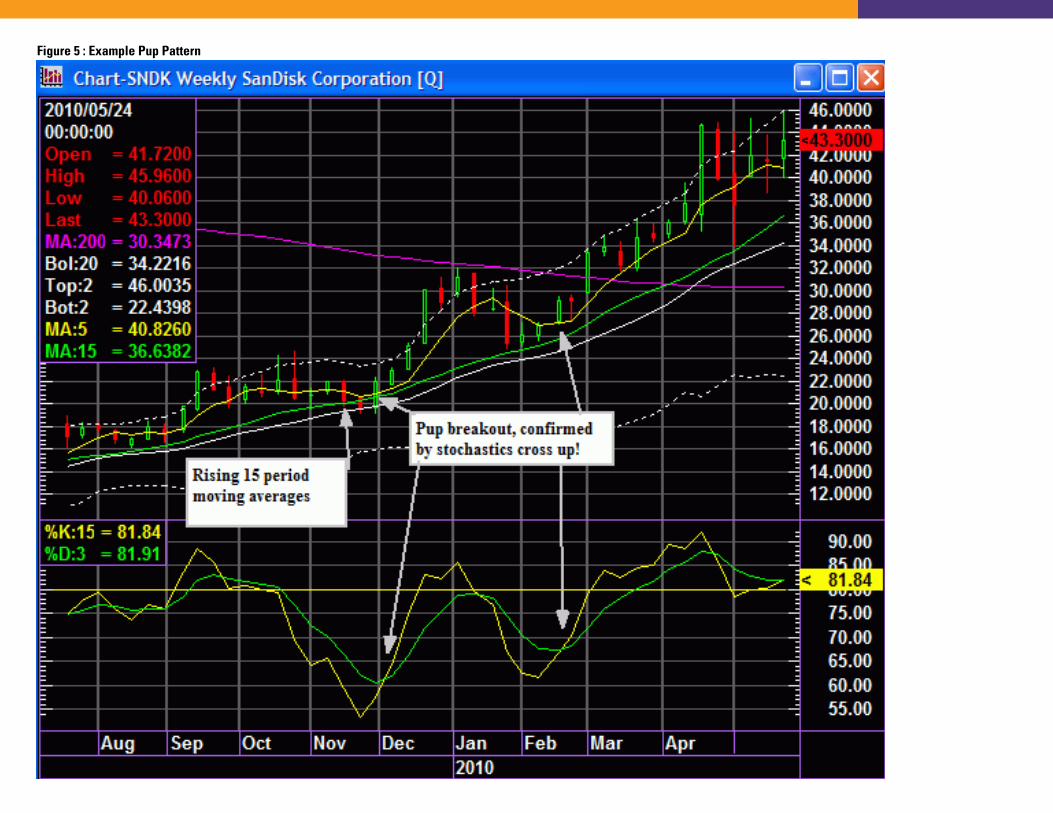
Figure 5 : Example Pup Pattern

Figure 6 : Inverse Pup Breakdown

Figure 7 : Mini-Pup Pattern

Figure 8 : Mini Inverse Pup Figure 9 : Mini Inverse Pup

Figure 10 : Perfect Storm Pattern

Figure 11 : Identify Patterns and Bumpers Figure 12 : Identify Stars and Hammers

Figure 13 : Galvanized Price Levels

Figure 14 : June 7, 2010 Daily SPY Chart Showing Inverse Pup Breakdown

Figure 15 : Buying Long

Figure 16 : Perfect Storm Long

Figure 17 : GMCR Six Lane Perfect Storm

Figure 18 : Selling Short
Figure 19 : Perfect Storm Short

Figure 20 : Daily Mini Inverse Pup Breakdown Triggers Short Trade Figure 21 : VHC Long on Daily Mini Pup

Figure 22 : Example Trading Alert
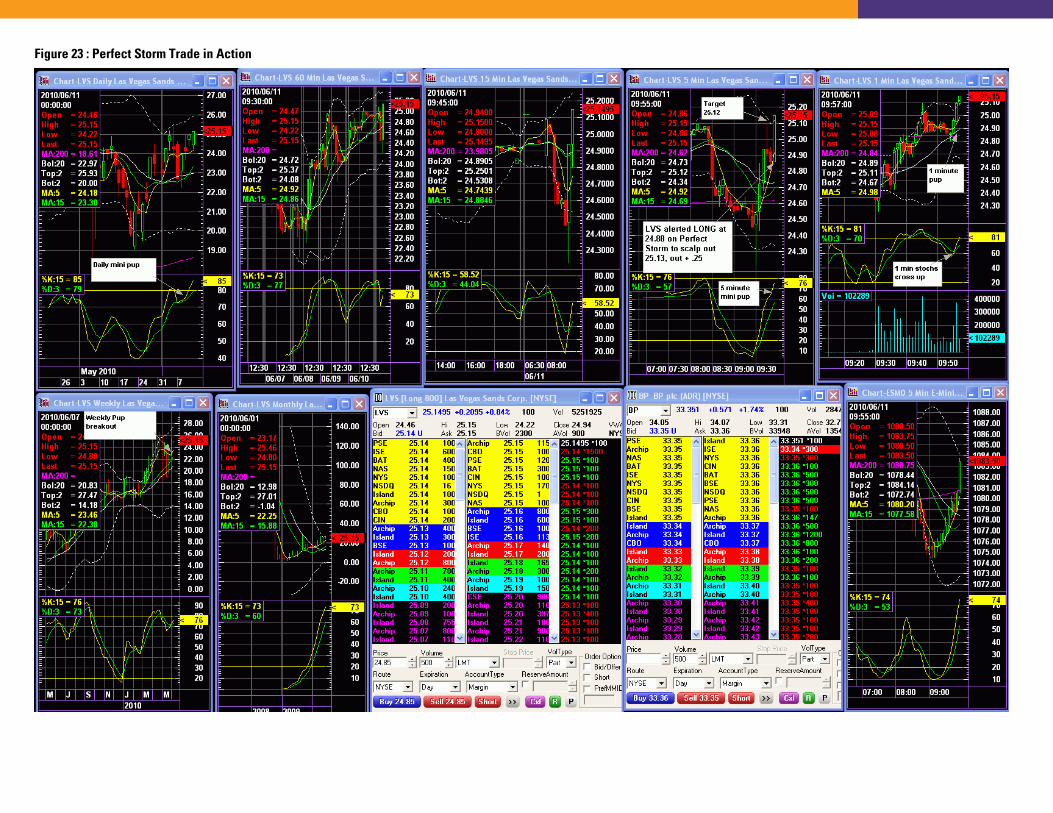
Figure 23 : Perfect Storm Trade in Action

Figure 24 : Perfect Storm Breakdown on TBL

Figure 25 : JNPR Short on Perfect Storm Breakdown

Figure 26 : CRM Short Trade

Figure 27 : Bearish Trade on SPY Put Options