web view#- formal definition of statistics:- #- statistics: - the science of . collecting,...
TRANSCRIPT

-#Formal Definition of Statistics -:
-#STATISTICS: - The science of collecting, organizing, presenting, analyzing, and interpreting data to assist in making more effective decisions.
-#Types of Statistics - :
1 - Descriptive Statistics: - methods of organizing, summarizing, and presenting data in an informative way .
2 - Inferential Statistics: - A decision, estimate, prediction, or generalization about a population, based on a sample.
Population: - The entire set of individuals or objects of interest or the measurements obtained from all individuals or objects of interest.
Sample: - A portion, or part, of the population of interest.
Types of Variables-# - :
A. Qualitative: - the characteristic being studied is nonnumeric .
EXAMPLES: - Gender, religious affiliation, type of automobile owned, state of birth, eye color are examples.
B. Quantitative variable: - information is reported numerically .
EXAMPLES: - balance in your checking account, minutes remaining in class, or number of children in a family.
-#Quantitative Variables - :
A. Discrete variables: - can only assume certain values and there are usually “gaps” between values .
EXAMPLE: - the number of bedrooms in a house .
B. Continuous variable: - can assume any value within a specified range.
EXAMPLE: - The weight or the height of students in a class.

-#Four Levels of Measurement - :
2 -Interval level: - similar to the ordinal level, with the additional property that meaningful amount of differences between data values can be determined. There is no natural zero
point .
EXAMPLE: - Temperature on the Fahrenheit scale.
1 -Nominal level: - data that is classified into categories and cannot be arranged in any
particular order .
EXAMPLES: - eye color, gender, religious affiliation.
4 -Ratio level: - the interval level with an inherent zero starts point. Differences and ratios are meaningful for this level of measurement.
EXAMPLES: - Monthly income of surgeons, or distance traveled by manufacturer’s
representatives per month.
3- Ordinal level: – data arranged in some order, but the differences between data values cannot be determined or are
meaningless .
EXAMPLE: - During a taste test of 4 soft drinks, Mellow Yellow was ranked number 1, Sprite number 2, Seven-up number 3, and Orange Crush number 4.
================================================================

-#Descriptive data:
Ex.1 The following data represents the social situation for the 21 person are as follows:
Married, Single, Divorced, Single, Married, Married, Divorced, Single, Married, Married, Single, Single, Single, Married, Single, Married, Divorced, Single, Single, Single, Single.
Solve - :
FrequencyTalliesClass7// /////Married
11/ ///// /////Single3///Divorced
21
-#Quantitative data:
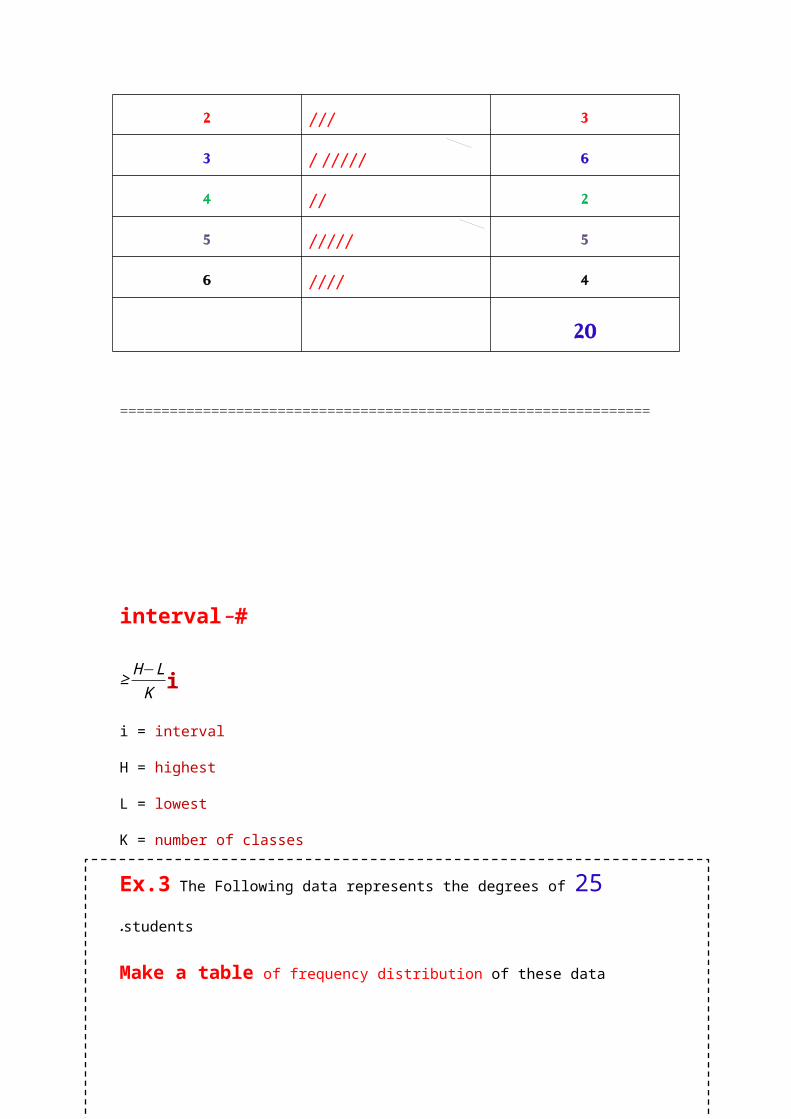
Ex.2 The Following data represents the number of family members of 20 families as
follows:
4,5,6,3,2,5,3,2,6,4,5,2,3,5,6,3,3,5,3,6
The required: Put this data in the frequency distribution table
Solve - :
frequencyTalliesClass3///26/ /////32//45/////54////6
20
================================================================

-#interval
i≥ H−LK
i = interval
H = highest
L = lowest
K = number of classes
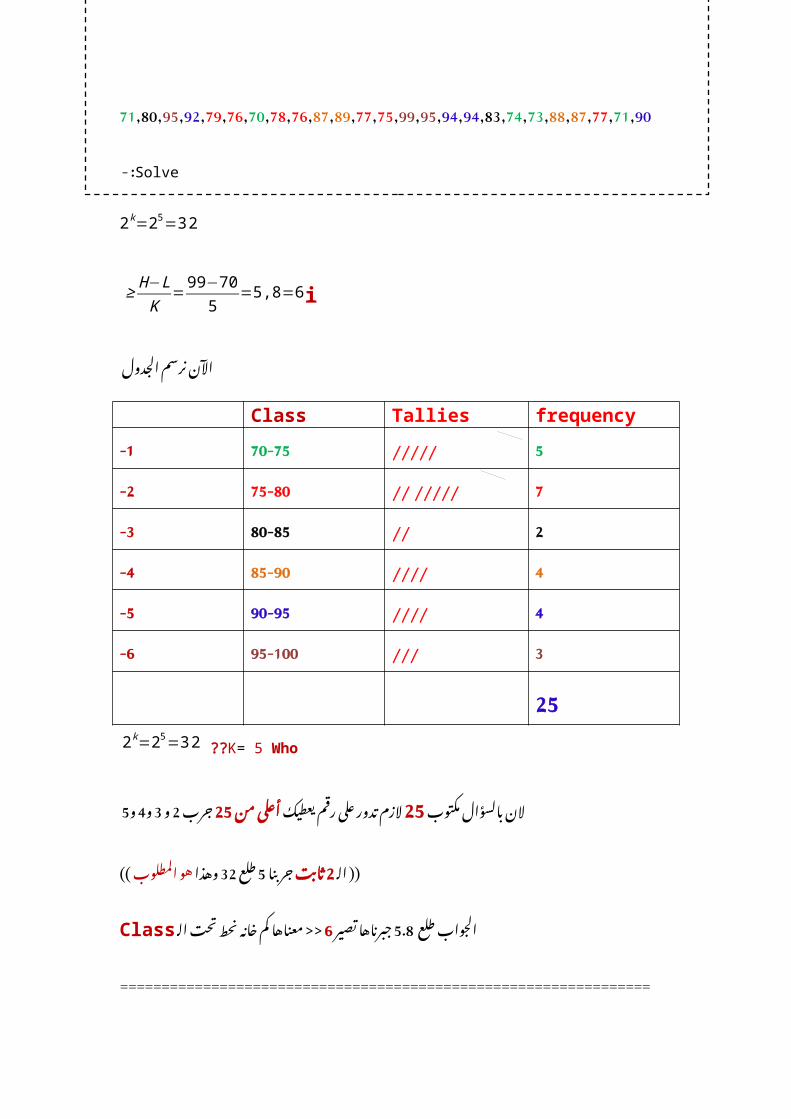
Ex.3 The Following data represents the degrees of 25 students.
Make a table of frequency distribution of these data
71,80,95,92,79,76,70,78,76,87,89,77,75,99,95,94,94,83,74,73,88,87,77,71,90
Solve - :
2k=25=32
i≥ H−LK
=99−705
=5,8=6
الجدول نرسم اآلن
frequencyTalliesClass5/////70-751-7// /////75-802-2//80-853-4////85-904-4////90-955-3///95-1006-25
K= 5 Who?? 2k=25=32
مكتوب بالسؤال يعطيك 25الن رقم على تدور من الزم 5و 4و 3و 2جرب 25أعلى
المطلوب وهذا 32طلع 5جربنا ثابت 2الــ)) ((هو
طلع تصير 5.8الجواب الـ >> 6 جبرناها تحت نحط خانه كم Classمعناها
================================================================
-#Class midpoint = M
الــ نوجد التالي :-Class midpointكيف الجدول في
Class midpointM
Frequencyf
TalliesClass
72.55/////70-7577.57// /////75-8082.52//80-8587.54////85-9092.54////90-9597.53///90-100
25
الــ وهي :-Class midpointأوجدنا المعادلة طريق عن
Classmidpoint M= Highest limit+ Lowest limit2
فقرهـ اول على الحل يكون
M=75+702
=72.5
االدنى >>> 70-75 Lowest ))الحد limit ))االعلى & 70هو Highest)) الحد limit ))75هو
================================================================
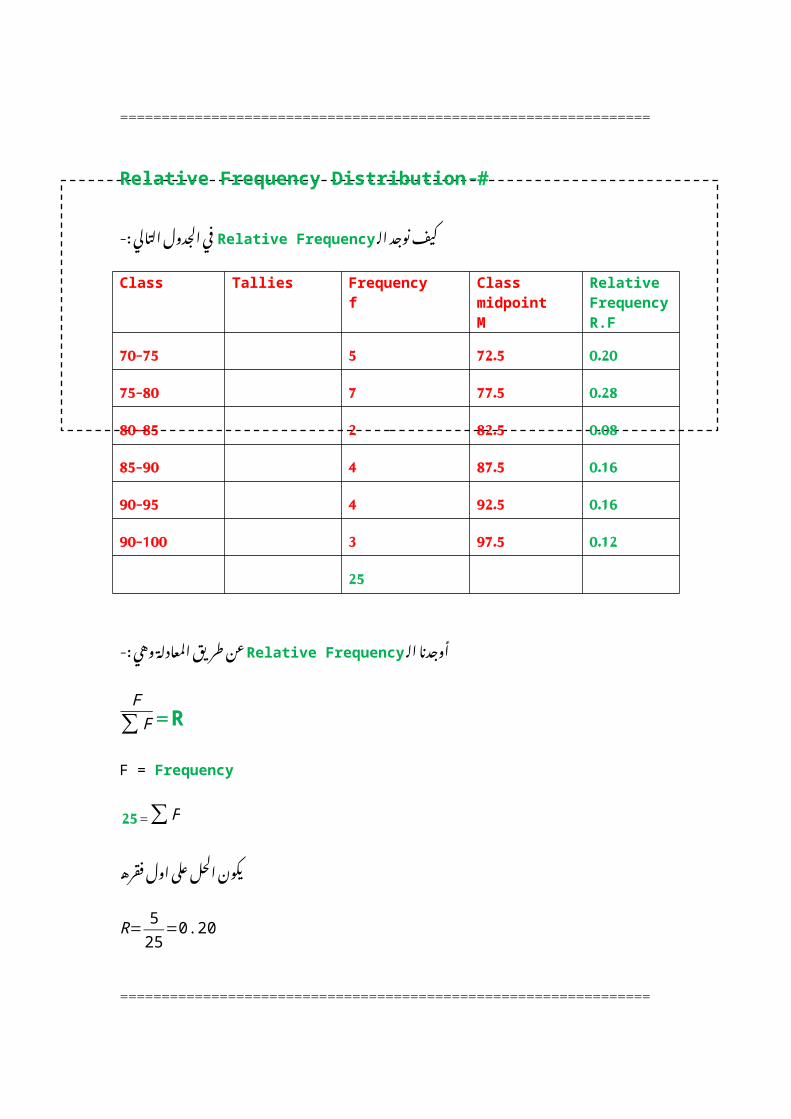
-#Relative Frequency Distribution
الــ نوجد التالي :- Relative Frequency كيف الجدول في
Relative FrequencyR.F
Class midpointM
Frequencyf
TalliesClass
0.2072.5570-750.2877.5775-800.0882.5280-850.1687.5485-900.1692.5490-950.1297.5390-100
25
الــ وهي :-Relative Frequencyأوجدنا المعادلة طريق عن
R = F∑ F
F = Frequency
∑ F = 25
فقرهـ اول على الحل يكون
R= 525
=0.20
================================================================
-#Cumulative Frequency Distributions
الــ نوجد التالي :- Cumulative Frequency كيف الجدول في
Cumulative FrequencyC.F.D
Relative FrequencyR.F
Class midpointM
Frequency f
TalliesClass
50.2072.55-----70-75120.2877.57-- -----75-80140.0882.52--80-85180.1687.54----85-90220.1692.54----90-95250.1297.53---90-100الزم
مجمو= آخرهالــ Fع
25
الــ الــ Cumulative Frequencyأوجدنا جمع طريق هي :-Fعن الخطوات الجدول من
70-75(( = 5 = ))5
75-80 (( =7 + 5 = ))12
80-85 (( =2 + 7 + 5 = ))14
هو 5هو Fأول كما يبقى 5اذا
الــ 7هو Fثاني تجمع وهو 7اذا قبل اللي 12يصير 5مع
الــ 2هو Fثالث تجمع وهو 2اذا قبل اللي وهو 7مع قبل 14يصير 5واللي
وهكذا.......
================================================================

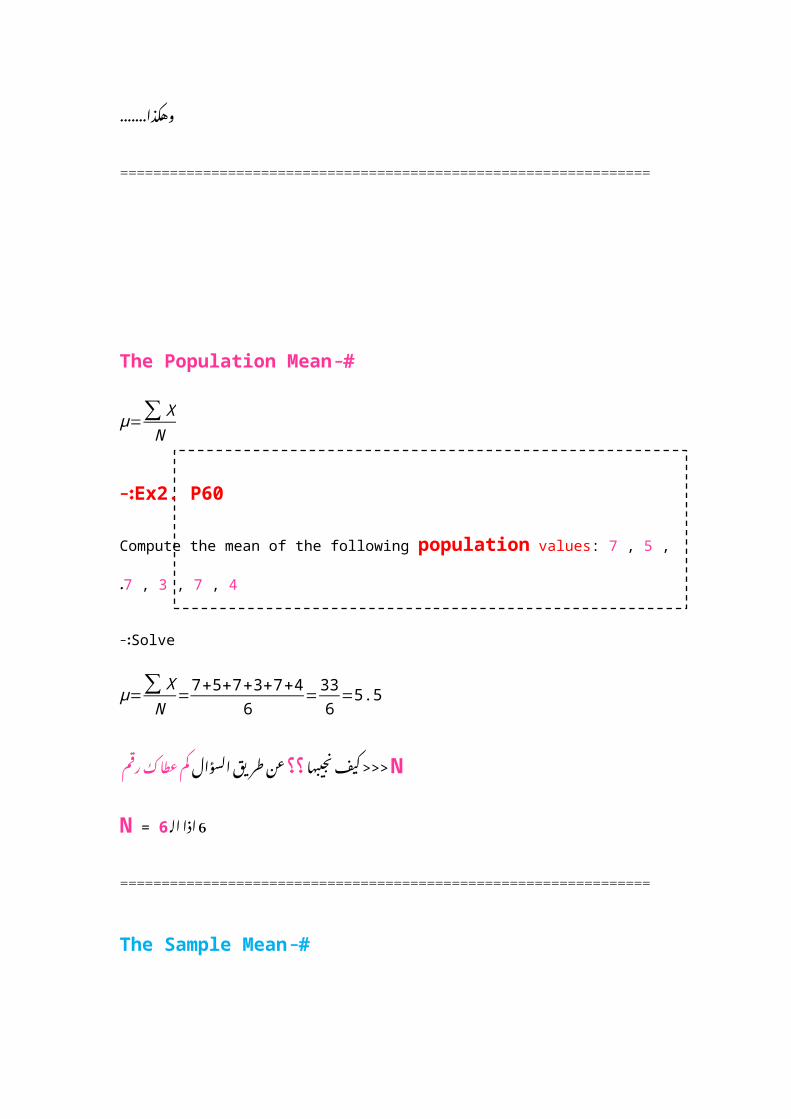
-#The Population Mean
μ=∑ XN
Ex2. P60-:
Compute the mean of the following population values: 7 , 5 , 7 , 3 , 7 , 4.
Solve-:
μ=∑ XN
=7+5+7+3+7+4
6=336
=5.5
N <<< نجيبها السؤال ؟؟كيف طريق رقم عن عطاك كم
الــ 6 N = 6اذا
================================================================
-#The Sample Mean
X=∑ Xn
Ex3. P60-:
a) Compute the mean of the following sample values: 5 , 9 , 4 , 10.
b) Show that ∑ (X−X ¿)=0¿
Solve-:
a) X=
∑ Xn
=5+9+4+10
4=234
=7
b )X−XX
-252934-310
0∑ (X−X ¿)¿
n <<<نجيبها رقم ؟؟كيف عطاك كم السؤال طريق عن
الــ 6 اذا n = 6أرقام
================================================================
-#The Median
Ex-:
a) 2 , 3 , 6 , 7 , 11
Solve-:
2 , 3 , 6 , 7 , 11(( Me=6))
b) 7 , 14 , 15 , 8 , 11 , 7
Solve -:
7 , 7 , 8 , 11 , 14 , 15 (( Me=8+112
=9.5))
حتى مره جهه كل من نشطب ثم للكبير الصغير من للوسط نرتبها (a ناصل
حال وفي للكبير الصغير من على نرتبها نقسم ثم نجمع رقمين بالوسط غير 2طلع ال (bفقط================================================================
#- The Mode
Ex:-
a) 5 , 2 , 3 , 2 , 5 , 3 , 2
Solve:-
السؤال تكرار صاحب The mode في الـــ أكثر هو يكون
The mode is 2
b) 5 , 6 , 4 , 3 , 6 , 5
Solve:-
كان لو حتى السؤال التكرار في عدد نفس عددين The mode تكرار صاحب هو أكثر يكون الـــ
The mode is 5 , 6
c) 3 , 3 , 2 , 4 , 4 , 2 , 3 , 4
Solve:-

كان لو حتى السؤال التكرار في عدد نفس عددين The mode تكرار صاحب الـــ أكثر هو يكون
The mode is 3 , 4
===========================================================================
Ex19.P65:-
Determine the (a) mean, (b) median, (c) mode.
The following is the percent change in net income from last year to this year for a sample of 12 construction companies in Denver.
5 1 -10 -6 5 12 7 8 2 5 -1 11
Solve-:
a) X=∑ Xn
=5+1+ (−10 )+(−6 )+5+12+7+8+2+5+(−1 )+11
12=4012
=3.3333333
الــ طالب هو صح meanتقول لك أقول
بالــ حليناها ما لــيه وكتب Populationتقول حدد بالسؤال النه لك Sampleأقول
b) -10 , -6 , -1 , 1 , 2 , 5 , 5 , 5 , 7 , 8 , 11 , 12
Median = 5+52
=102
=5
c) -10 , -6 , -1 , 1 , 2 , 5 , 5 , 5 , 7 , 8 , 11 , 12
The mode is 5
================================================================
-#Range
Range=Largest value−Smallest value
Arithmeticmean=∑ XN
Ex35.P75-:
Calculate the (a) range, (b) arithmetic mean.
There were five customer service representatives on duty at Electronic Super Store during last weekend's sale. The numbers of HDTVs these representatives sold are: 5, 8, 4, 10 and 3.
Solve-:
5 , 8 , 4 , 10 , 3
L = 10 S = 3
a) Range=10−3=7
b) Arithmeticmean=∑ XN
=5+8+4+10+3
5=305
=6
================================================================
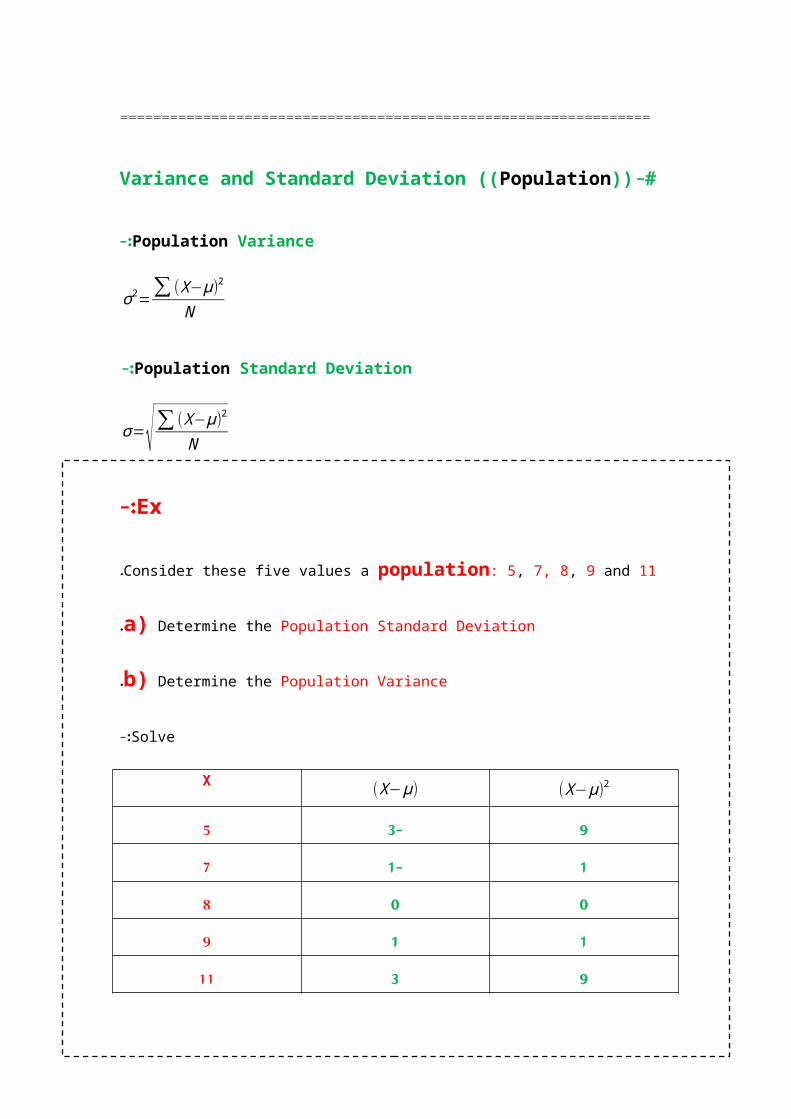
-#Variance and Standard Deviation ((Population))
Population Variance-:
σ 2=∑ (X−μ)2
N
Population Standard Deviation-:
σ=√∑ (X−μ)2
N
Ex-:
Consider these five values a population: 5, 7, 8, 9 and 11.
a) Determine the Population Standard Deviation.
b) Determine the Population Variance.
Solve-:
(X−μ)2(X−μ)X9-351-170081199311
∑ (X−μ)2=20 صفر يكون الزم∑ (X−μ )=0
∑ X=40
a) Population Standard Deviation
σ=√∑ (X−μ )2
N=√ 205 =√4=2

b) Population Variance
σ 2=∑ (X−μ)2
N=205
=4
الحل ؟؟؟ كيف
N <<<رقم عطاك كم السؤال طريق عن ؟؟ نجيبها كيف
الــ 5 اذا N = 5أرقام
الــ نوجد Populationأوال Arithmetic mean (( μ))
μ=∑ XN
=5+7+8+9+11
5=405
=8 μ=8
الـــ (X−μ)الــــ في 2(X−μ)و اللي قوانين الــ من مآخذينها a , bبالجدول
الــ نوجد (X−μ)ثم
(5−8 )=−3
(7−8 )=−1
وهكذا .....
الــ نوجد 2(X−μ)ثم
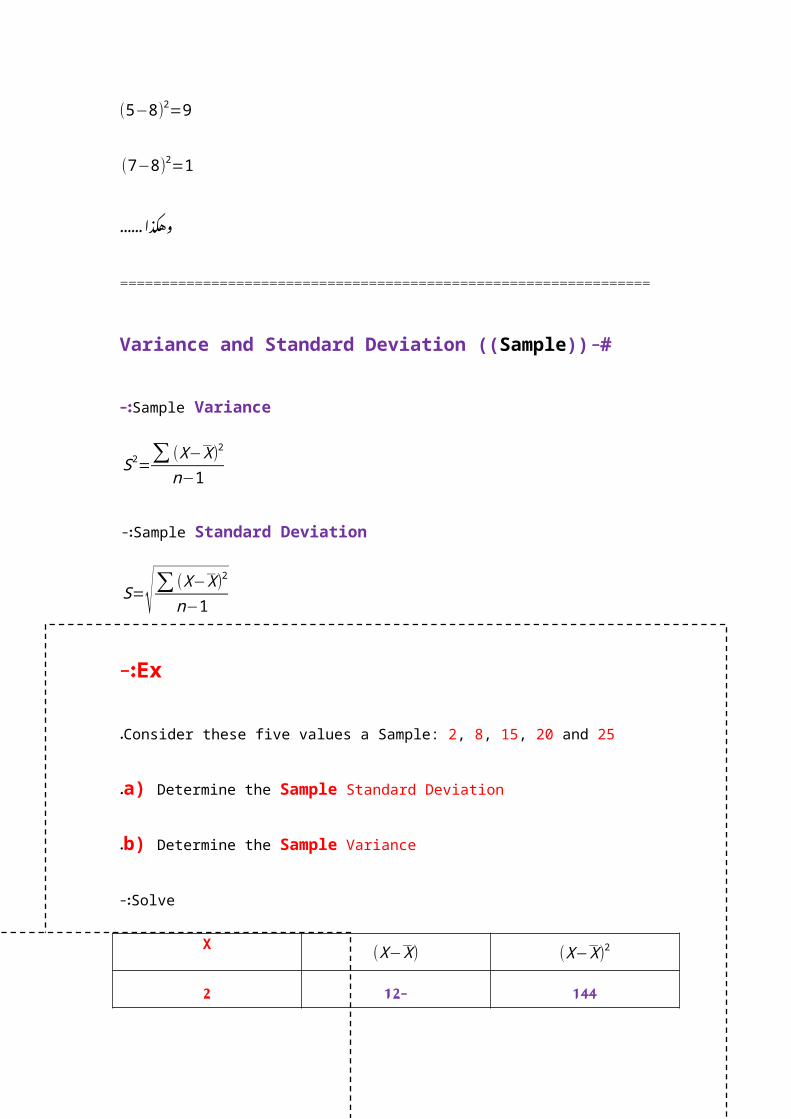
(5−8)2=9
(7−8)2=1
وهكذا ......
================================================================
-#Variance and Standard Deviation ((Sample))
Sample Variance-:
S2=∑ (X−X)2
n−1
Sample Standard Deviation -:
S=√∑(X−X)2
n−1
Ex-:

Consider these five values a Sample: 2, 8, 15, 20 and 25.
a) Determine the Sample Standard Deviation.
b) Determine the Sample Variance.
Solve-:
(X−X )2(X−X )X
144-12236-681115
366201211225
∑ (X−X صفر 338=2( يكون الزم∑ (X−X )=0
∑ X=70
a) Standard Deviation
S=√∑ (X−X )2
n−1=√ 3385−1
=√84.5=9.19
b) Variance

S2=∑ (X−X)2
n−1= 3385−1
=84.5
الحل ؟؟؟كيف
n <<<نجيبها السؤال ؟؟كيف طريق رقم عن عطاك كم
الــ أرقام 5 n = 5اذا
الــ نوجد Sampleأوال Arithmeticmean (( X))
X=∑ Xn
=2+8+15+20+25
5=705
=14 X=14
X−X)الــــ الـــ ( X−X)و في 2( اللي قوانين الــ من مآخذينها a , bبالجدول
الــ نوجد X−X)ثم )
(2−14 )=−12
(8−14 )=−6
وهكذا .....
الــ نوجد X−X)ثم )2
(2−14)2=144
(8−14)2=36
وهكذا ......
================================================================
-#Standard Deviation
Standard Deviation GROUPED DATA ((sample))-:
S=√∑ f (M−X )2
∑ f−1
X=∑ fM
fEx-:

Determine the mean and Standard Deviation of the following frequency distribution.
fClass30-444-838-12
Solve-:
F (M−X )2(M−X)2(M−X)FMMFClass4816-46230-400024644-848164301038-12∑ F (M−X)2320∑ fM=6010∑ f
Class midpoint-:
M= Highest limit+Lowest limit2
=4+02
=2
M 2=Highest limit+Lowest limit
2=8+42
=6
M 3=Highest limit+Lowest limit
2=12+8
2=10
The mean-:
X=∑ fM
f=6010
=6
Standard Deviation-:
S=√∑ f (M−X )2
∑ f−1=√ 969 =3.26
-#the median in grouped data-:
C=∑ f2
Me=L+( c−c1c2−c1 )∗i
Ex-:
Determine the median?
Frequencyf
Class
525 - 351035 - 452145 – 551655 - 65865 - 75
60
Solve-:
الــ أوال C . F << ((Cumulative Frequency))توجدCumulative FrequencyC.F.D
Frequencyf
Class
5525 - 35151035 - 45362145 – 55
521655 - 6560865 - 75 = مجموع آخره الزمFالــ
60
الـــ ثانيا CتوجدC=
∑ f2
C=602
=30
الـــ ثالثا الـــ Cتحدد الـــ __ C . Fفي تقع اللي تحط 30أي الرقمين بين عريض خطبينهم تقع
الـ رابعا الــ & c1ـ تحدد ؟؟ >>>> c2تحدد تحدد كيف

الخط اللي هو فوق الخط اللي& c1العريض هو تحت c2العريض
القاعدهـ خامسا ع طبق
Me=L+( c−c1c2−c1 )∗i
Me=25+( 30−1536−15 )∗5=28.75الـــ جبنا وشلون حد >>> Lبتقول أقل الــ معناها Class <<< ((25 – 35 ))في
الـــ جبنا وشلون الــ >>> iوبتقول عدد Classمعناهاالــ تكتب المطلوب تطبق & C . Fحلك و القانون
^_^
-#the mode in grouped data-:
Mo=L+F−F1
(F−F1 )+(F−F2)∗i
Ex-:
Determine the mode?
Frequencyf
Class
4525 - 35
7030 - 356035 – 403040 - 452045 - 50
Solve -:
الــ أوال في تكرار أكثر صاحب الــ fتحدد على التحديد Classوتكمل
الـ ثانيا الــ & F1ـ تحدد ؟؟ >>>> F2تحدد تحدد كيف
تكرار اللي االكثر تكرار اللي& F1هو فوق االكثر F2هو تحت
القاعدهـ ثالثا ع طبق
Mo=L+F−F1
(F−F1 )+(F−F2)∗i

Mo=30+ 70−45(70−45 )+(70−60)
∗5=¿
الـــ جبنا وشلون حد >>> Lبتقول أقل الــ معناها حددته Classفي أنت >>> اللي((30 – 35))
الـــ جبنا وشلون الــ >>> iوبتقول عدد Classمعناهاو القانون تكتب فقط بيكون المطلوب حلكتطبق ^_^