© david l. wells putting the business back in bi putting the business back in bi dave wells...
TRANSCRIPT

© David L. Wells
Putting the Business Back in BIPutting the Business Back in BI
Dave [email protected]
BI means “business intelligence” yet in many BI programs technology interests supersede those of business.
When a BI program gives more attention to dashboards, scorecards, OLAP, and data warehouses than to finance, R&D, marketing, operations, and customer support, then it is time to put the business back into BI.
© David L. Wells
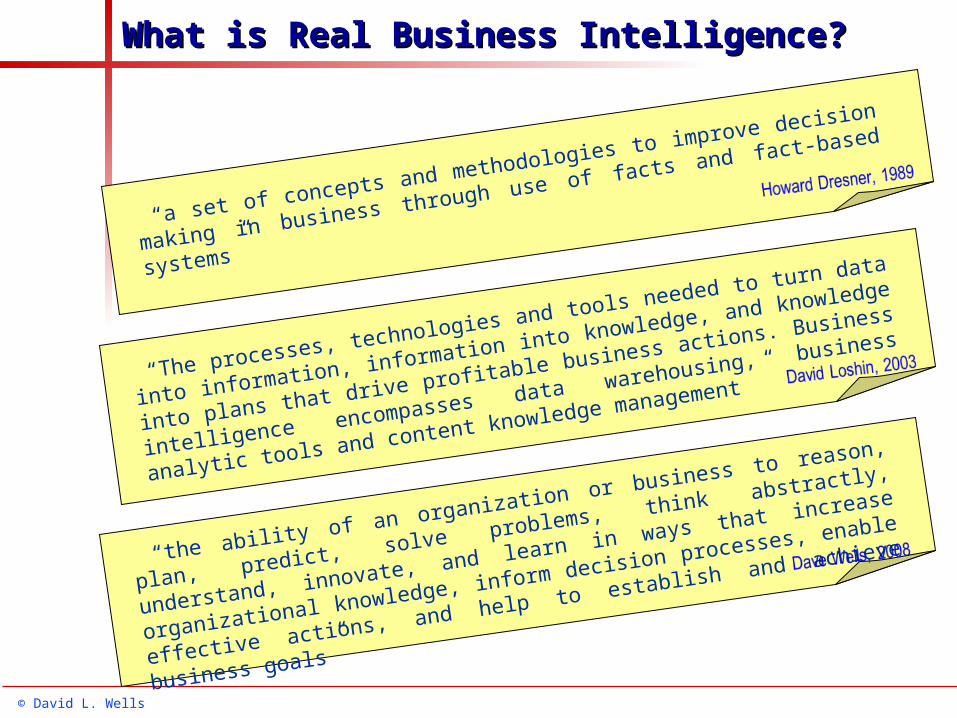
What is Real Business Intelligence?What is Real Business Intelligence?
“the ability of an organization or business to reason, plan, predict, solve
problems, think abstractly, understand, innovate, and learn in ways that increase
organizational knowledge, inform decision processes, enable effective actions,
and help to establish and achieve business goals”
“a set of concepts and methodologies to improve decision making in business
through use of facts and fact-based systems”
“The processes, technologies and tools needed to turn data into information,
information into knowledge, and knowledge into plans that drive profitable
business actions. Business intelligence encompasses data warehousing,
business analytic tools and content knowledge management ”

© David L. Wells
Business-Aligned BIBusiness-Aligned BI
Data IntegrationData Integration
DashboardsDashboardsScorecardsScorecards
OLAPOLAP
Data IntegrationData Integration
Ma
na
ge
men
t
Motivation
BusinessImpact !BusinessImpact !
Measurement
quantifi
catio
ng
oal
alig
nm
en
t
functionalalignment

© David L. Wells
The Business FrameworkThe Business Framework
Man
agem
ent
Strategy
Finance
R&D
Marketing
Sales
Customers
Operations
HR
IT
Man
agem
ent
Perf
orm
ance
Prof
it
Opp
ortu
nity
Gro
wth
Com
plia
nce
Gov
erna
nce
Ris
k
Lega
l & E
thic
s
Valu
es
MotivationMotivation
IndicatorsMetrics
MeasuresReferences
MeasurementIndexes
risk toleranceeconomic threats
competitive pressuresetc.
FLSAworkplace safetyunion contracts
etc.

© David L. Wells
Details Within the FrameworkDetails Within the Framework
Strategy
Finance
R&D
Marketing
Sales
Customers
Operations
HR
strategy and goalscompetitive environment
regulatory complianceinternal policies & processes
culture & beliefs
volume / sizeefficiency
effectivenessquality
costvalue
viabilitysustainability
past (lagging)present (positioning)
future (leading)

© David L. Wells
Business Scope of BIBusiness Scope of BI
STRATEGIC INTELLIGENCE
FINANCIAL INTELLIGENCE
R&D INTELLIGENCE
MARKET INTELLIGENCE
SALES FORCE INTELLIGENCE
CUSTOMER INTELLIGENCE
OPERATIONS INTELLIGENCE
WORKFORCE INTELLIGENCE
RISK INTELLIGENCE
REGULATORY INTELLIGENCE

© David L. Wells
Strategic IntelligenceStrategic Intelligence
Man
agem
ent
Perfo
rman
ce
Prof
it
Opp
ortu
nity
Gro
wth
Com
plia
nce
Gov
erna
nce
Risk
Lega
l & E
thics
Valu
es
Motivation
Mission & Goals
Strategy
Processes
Functions
Plans
Effectiveness
Efficiency
Strategy
Finance
R&D
Marketing
Sales
Customers
Operations
HR
IT
Man
agem
ent
IndicatorsMetrics Measures
References
MeasurementIndexes

© David L. Wells
Financial IntelligenceFinancial Intelligence
Man
agem
ent
Strategy
Finance
R&D
Marketing
Sales
Customers
Operations
HR
IT
Man
agem
ent
Perfo
rman
ce
Prof
it
Opp
ortu
nity
Gro
wth
Com
plia
nce
Gov
erna
nce
Risk
Lega
l & E
thics
Valu
es
IndicatorsMetrics Measures
References
MeasurementIndexes
Motivation
Budgeting
Cash Management
Credit & Debt
Revenue & Expense
Profit & Loss
GL Accounting
Fixed Assets
Depreciation & Amoritization
Financial Reporting

© David L. Wells
Research IntelligenceResearch Intelligence
Man
agem
ent
Competitor Analysis
Demand Analysis
Technical Research
Product Pipeline
Production Process Research
IndicatorsMetrics Measures
References
MeasurementIndexes
Strategy
Finance
R&D
Marketing
Sales
Customers
Operations
HR
IT
Man
agem
ent
Perfo
rman
ce
Prof
it
Opp
ortu
nity
Gro
wth
Com
plia
nce
Gov
erna
nce
Risk
Lega
l & E
thics
Valu
es
Motivation

© David L. Wells
Marketing IntelligenceMarketing Intelligence
Man
agem
ent
Branding
Market Segmentation
Differentiation
Positioning
Pricing
Distribution Channels
Advertising & Promotions
Customer Perceptions
IndicatorsMetrics Measures
References
MeasurementIndexes
Strategy
Finance
R&D
Marketing
Sales
Customers
Operations
HR
IT
Man
agem
ent
Perfo
rman
ce
Prof
it
Opp
ortu
nity
Gro
wth
Com
plia
nce
Gov
erna
nce
Risk
Lega
l & E
thics
Valu
es
Motivation

© David L. Wells
Sales Force IntelligenceSales Force Intelligence
Man
agem
ent Contact Mgmt
Account Mgmt
Opportunities
Forecasting
Sales Pipeline
Partner Relationships
Competitors
Estimating & Quotes
IndicatorsMetrics Measures
References
MeasurementIndexes
Strategy
Finance
R&D
Marketing
Sales
Customers
Operations
HR
IT
Man
agem
ent
Perfo
rman
ce
Prof
it
Opp
ortu
nity
Gro
wth
Com
plia
nce
Gov
erna
nce
Risk
Lega
l & E
thics
Valu
es
Motivation

© David L. Wells
Customer IntelligenceCustomer Intelligence
Man
agem
ent
Relationships
Perceptions
Communications
Call Center
Service & Support
Warranty Service
IndicatorsMetrics Measures
References
MeasurementIndexes
Strategy
Finance
R&D
Marketing
Sales
Customers
Operations
HR
IT
Man
agem
ent
Perfo
rman
ce
Prof
it
Opp
ortu
nity
Gro
wth
Com
plia
nce
Gov
erna
nce
Risk
Lega
l & E
thics
Valu
es
Motivation

© David L. Wells
Operations IntelligenceOperations Intelligence
Man
agem
ent
Procurement & Purchasing
Product & Service Mgmt
Inventory
Logistics & Transportation
Facilities Mgmt
Configuration Mgmt
Distribution
Quality Mgmt
IndicatorsMetrics Measures
References
MeasurementIndexes
Strategy
Finance
R&D
Marketing
Sales
Customers
Operations
HR
IT
Man
agem
ent
Perfo
rman
ce
Prof
it
Opp
ortu
nity
Gro
wth
Com
plia
nce
Gov
erna
nce
Risk
Lega
l & E
thics
Valu
es
Motivation

© David L. Wells
Workforce IntelligenceWorkforce Intelligence
Man
agem
ent
Workforce Planning
Labor Relations
Recruiting & Hiring
Outsourcing
Compensation & Benefits
Training & Development
Workplace Safety
Employee Performance
Employee Retention
IndicatorsMetrics Measures
References
MeasurementIndexes
Strategy
Finance
R&D
Marketing
Sales
Customers
Operations
HR
IT
Man
agem
ent
Perfo
rman
ce
Prof
it
Opp
ortu
nity
Gro
wth
Com
plia
nce
Gov
erna
nce
Risk
Lega
l & E
thics
Valu
es
Motivation

© David L. Wells
Risk and Regulatory IntelligenceRisk and Regulatory Intelligence
Perfo
rman
ce
Prof
it
Opp
ortu
nity
Gro
wth
Com
plia
nce
Gov
erna
nce
Ris
k
Lega
l & E
thic
s
Valu
es
Man
agem
ent Uncertainty
Probability
Regulation
Policy
Compliance
Audit
Authority
Accountability
IndicatorsMetrics Measures
References
MeasurementIndexes
Strategy
Finance
R&D
Marketing
Sales
Customers
Operations
HR
IT
Man
agem
ent
Motivation

© David L. Wells
Using the FrameworkUsing the Framework
SCOPING What is in scope for a BI project?
What is out of scope?
REQUIREMENTS GATHERING What business domain? (strategy, compliance, finance, …)
What kinds of informiaton are needed? (trends, indicators, indexes) For what time periods? (leading, positioning, lagging)
What measures are needed? (volume, cost, quality …)
PORTFOLIO MANAGEMENT What information do we have?
Where do we have gaps?How does information support strategy, tactics, & operations?

© David L. Wells
The “What’s” of Project ScopingThe “What’s” of Project Scoping

© David L. Wells
Project Scoping ChecklistProject Scoping Checklist

© David L. Wells
Project Scope ExampleProject Scope Example

© David L. Wells
Project Scope ExampleProject Scope Example

© David L. Wells
Business RequirementsBusiness Requirements
Business Requirements
PROJECT SCOPE
Information ... Delivery ... Data ... Processing
© David L. Wells
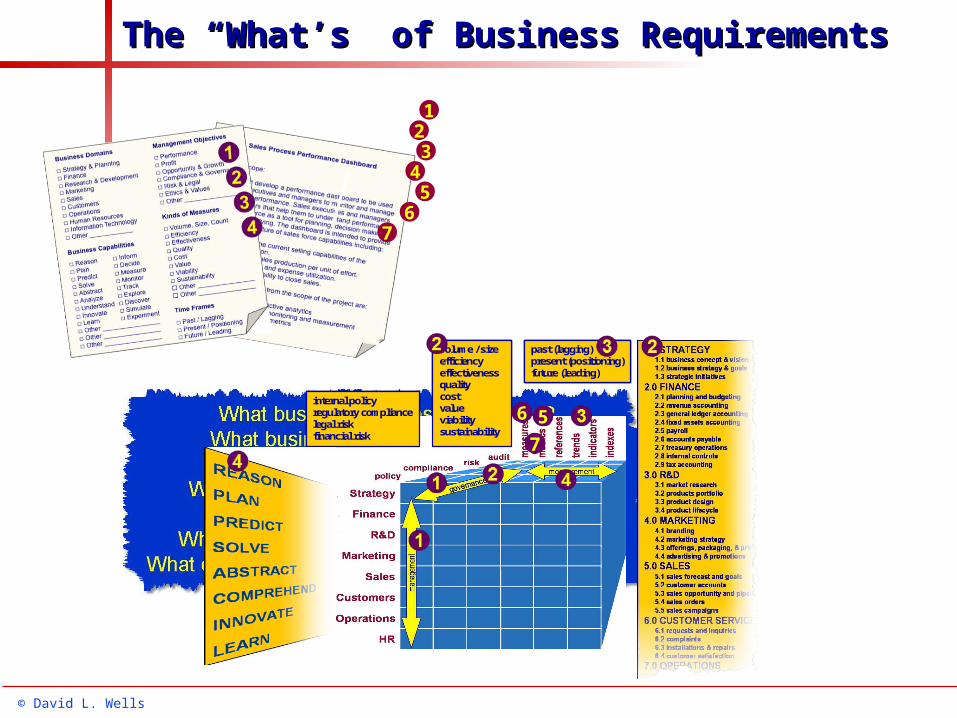
The “What’s” of Business RequirementsThe “What’s” of Business Requirements
123
45
67
internal policyregulatory compliancelegal riskfinancial risk
volume / sizeefficiencyeffectivenessqualitycostvalueviabilitysustainability
past (lagging)present (positioning)future (leading)
internal policyregulatory compliancelegal riskfinancial risk
volume / sizeefficiencyeffectivenessqualitycostvalueviabilitysustainability
past (lagging)present (positioning)future (leading)
internal policyregulatory compliancelegal riskfinancial risk
volume / sizeefficiencyeffectivenessqualitycostvalueviabilitysustainability
past (lagging)present (positioning)future (leading)
internal policyregulatory compliancelegal riskfinancial risk
volume / sizeefficiencyeffectivenessqualitycostvalueviabilitysustainability
past (lagging)present (positioning)future (leading)
56
7

© David L. Wells
Information Requirements – IndexesInformation Requirements – Indexes
One business domain forone management objectivetypically yields one index.
[Domain] [Objective] Index
is a composite of [list of business metrics that comprise the index]
calculated as [formula by which the index value is derived]

© David L. Wells
Information Requirements – IndicatorsInformation Requirements – Indicators
Which [kinds of measures]
for which [business processes]
indicate [management objective]?

© David L. Wells
Information Requirements – MetricsInformation Requirements – Metrics
Which [kinds of measures]for which [business processes]
indicate [management objective]?
INDICATOR
+
TEMPORAL CONTEXT
+
COMPARATIVE CONTEXT
+
BUSINESS CONTEXT
=
BUSINESS METRIC
past (lagging)present (positioning)
future (leading)
DIMENSIONS time customer product location organization etc.
Which [indicator] by what [dimensions]
for which [time span] or [point in time]
as compared to [references] or showing [trend]
Which [indicator] by what [dimensions]
for which [time span] or [point in time]
as compared to [references] or showing [trend]

Delivery RequirementsDelivery Requirements
?reporting
OLAPscorecarddashboard
etc.
reportingOLAP
scorecarddashboard
etc.
What does the project scope describe?
What kinds of information are needed?What business capabilities are needed?
© David L. Wells

Delivery RequirementsDelivery Requirements
© David L. Wells
When you need capability to: The most probable BI product is:
inform about … scheduled reports, ad hoc reportsinquire about … managed query, ad hoc querymeasure properties of … OLAPanalyze behavior of … OLAPalign business processes for … scorecardstrack performance against goals for … scorecardsinform real-time workflow in ... dashboards (operational/embedded)monitor current state of … dashboards (executive/management)examine alternatives for … analytic models (decision)simulate behavior of … analytic models (simulation)find influences and causes of … analytic models (correlation)test hypotheses for … analytic models (experimentation)explore patterns and trends of … data miningdiscover hidden insights for … data miningpredict future state of … predictive analyticssee patterns and trends in … visual analyticsmonitor/analyze location of … spatial analyticsfind meaning in … text analytics

© David L. Wells
Processing RequirementsProcessing Requirements
Which [indicator] by what [dimensions]for which [time span] or [point in time]
as compared to [references] or showing [trend]
Metrics
What quantitative data?What temporal data?
What dimensional data?What comparative data?
Data Requirements
What measurement processesto collect which measurement datafrom which business processes?
Instrumentation Requirements
What data transformation processesto turn measures into metrics,
indicators, and indexes?
Computation Requirements

© David L. Wells
Index Requirements ExampleIndex Requirements Example
Sales Performance Index
= sales force readiness sales process efficiency sales process effectiveness sales force productivity

© David L. Wells
Indicator Requirements ExampleIndicator Requirements Example
Sales Performance Index = sales force readiness sales process efficiency sales process effectiveness sales force productivity
Readiness: Employee Turnover Rate Employee Training Level Employee Satisfaction Employee Headcount Sales Capacity
Efficiency: Time Utilization Expense Utilization Time to Closure of Sales
Effectiveness: Ratio of Leads to Closed Sales Rate of Return Customers
Productivity: Revenue per Sales Person Margin per Sales Person Average Revenue per Sale Average Margin per Sale
PERFORMANCEINDICATORS

© David L. Wells
Metrics
Selection
PERFORMANCEINDICATORS
Readiness: Employee Turnover Rate Employee Training Level Employee Satisfaction Employee Headcount Sales Capacity
Effectiveness: Ratio of Leads to Closed Sales Rate of Return Customers
Efficiency: Time Utilization Expense Utilization Time to Closure of Sales
Productivity: Revenue per Sales Person Margin per Sales Person Average Revenue per Sale Average Margin per Sale
Metrics Requirements ExampleMetrics Requirements Example
Salesperson turnover count in thefiscal month just closed, by seniority,organization, and location compared to past 12 month company average.
Can be measured cost-effectively. Can be directly affected by management.
Salesperson count for the fiscal month just closed, by location andorganization as compared to each ofthe prior six months.
METRICS
Average days from first contact toclose of sale by organization andlocation with 6 month trend.
Percent of sales contacts that lead toclosed sales by organization andlocation with 6 month trend.
Average revenue value of closedsales per sales person each monthwith 6 month trend.
Average revenue value of closedsales in the month just closed ascompared to the prior six months.

© David L. Wells
Delivery Requirements Example – MetricsDelivery Requirements Example – Metrics
Salesperson turnover count in thefiscal month just closed, by seniority,organization, and location compared to past 12 month company average.
READINESS METRIC
Salesperson count for the fiscal month just closed, by location andorganization as compared to each ofthe prior six months.
READINESS METRIC

© David L. Wells
Delivery Requirements Example – MetricsDelivery Requirements Example – Metrics
Average days from first contact toclose of sale by organization andlocation with 6 month trend.
EFFICIENCY METRIC
Percent of sales contacts that lead to closed sales by organization andlocation with 6 month trend.
EFFECTIVENESS METRIC

© David L. Wells
Delivery Requirements Example - MetricsDelivery Requirements Example - Metrics
Average revenue value of closedsales per sales person each monthwith 6 month trend.
PRODUCTIVITY METRIC
Percent of sales contacts that lead to closed sales by organization andlocation with 6 month trend.
PRODUCTIVITY METRIC

© David L. Wells
Delivery Requirements Example – The DashboardDelivery Requirements Example – The Dashboard

© David L. Wells
Data Requirements ExampleData Requirements Example

© David L. Wells
Process Requirements Example – Instruments Process Requirements Example – Instruments

© David L. Wells
Portfolio Management – The InventoryPortfolio Management – The Inventory
Know what you do have.
Know what you don’t have.
Analyze gaps.
Find opportunities.

© David L. Wells
Portfolio Management – The ProcessPortfolio Management – The Process
