course materials copyrighted 2004 by ron d. hays health-related quality of life ron d. hays, ph.d....
TRANSCRIPT
Course materials copyrighted 2004 by Ron D. Hays
Health-Related Quality of Life Health-Related Quality of Life
Ron D. Hays, Ph.D. ([email protected])
February 4, 2004 (3:00-6:00 pm)
Main conference room
Health Care System ConcernsHealth Care System Concerns
AccessAccess
AffordabilityAffordability
AccountabilityAccountability
Resource Allocation ProblemResource Allocation Problem
Everyone in health care wants Everyone in health care wants reimbursement for their servicesreimbursement for their services
Options range from acute surgery, Options range from acute surgery, prevention, to long term careprevention, to long term care
But there is a limited amount of moneyBut there is a limited amount of money
How do we spend limited resources to How do we spend limited resources to enhance population health?enhance population health?
Cost Effective CareCost Effective Care
Cost Cost
Effectiveness Effectiveness
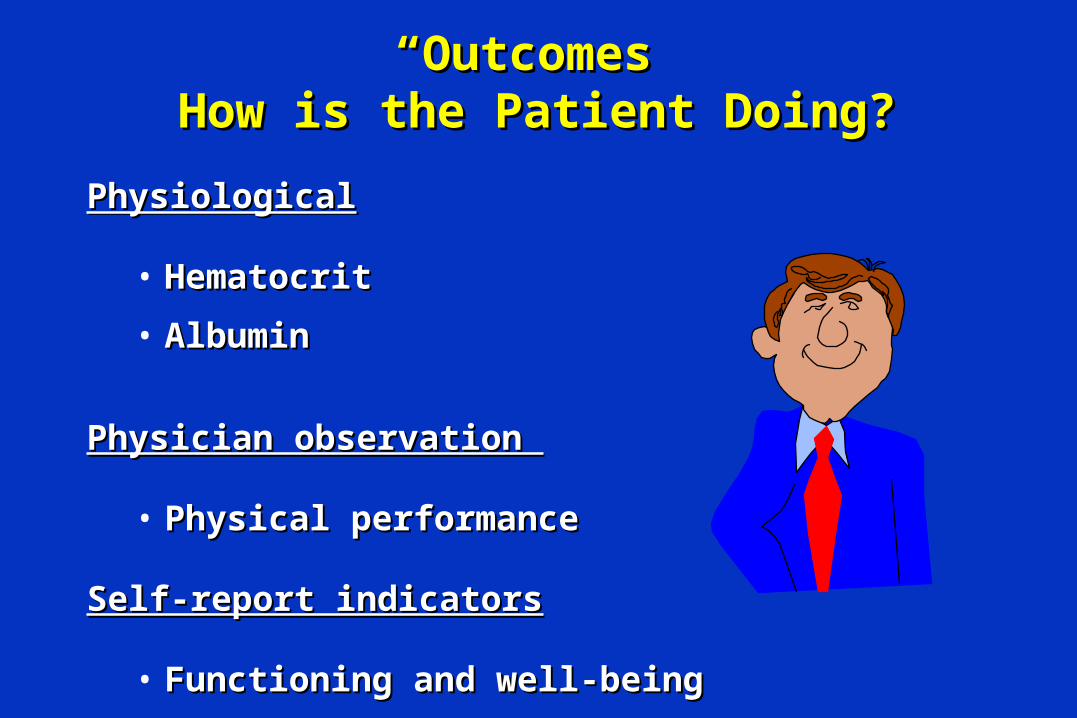
““Outcomes”Outcomes”How is the Patient Doing?How is the Patient Doing?
PhysiologicalPhysiological
• HematocritHematocrit
• AlbuminAlbumin
Physician observation Physician observation
• Physical performancePhysical performance
Self-report indicatorsSelf-report indicators
• Functioning and well-beingFunctioning and well-being
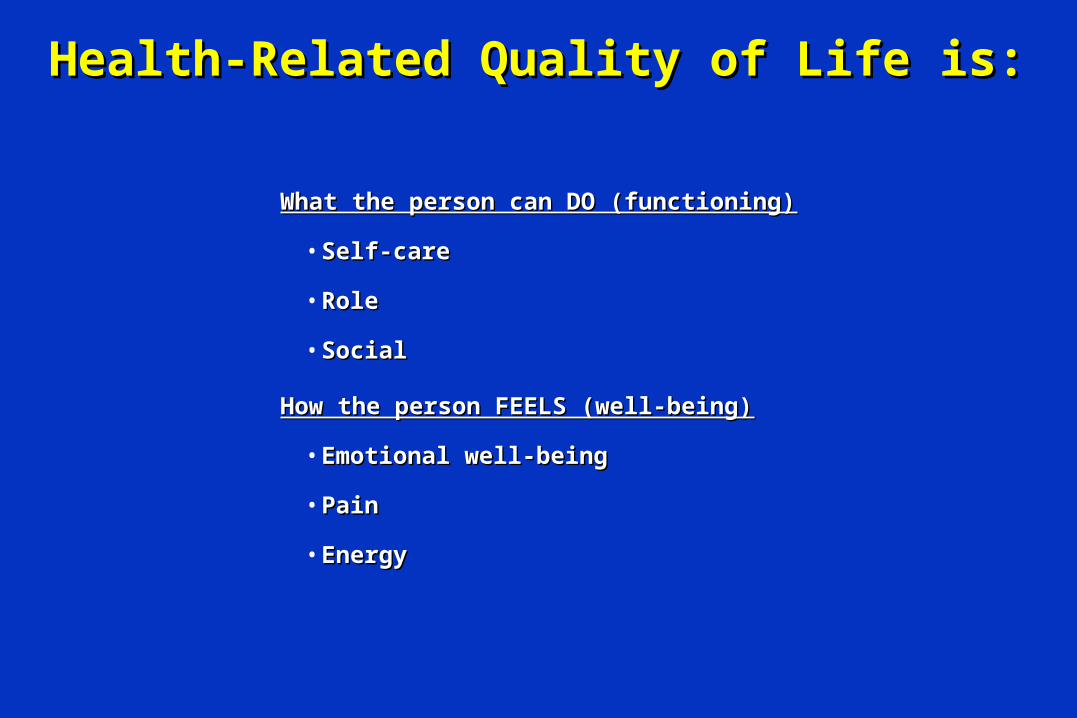
Health-Related Quality of Life is:Health-Related Quality of Life is:
What the person can DO (functioning)What the person can DO (functioning)
• Self-care Self-care
• Role Role
• Social Social
How the person FEELS (well-being)How the person FEELS (well-being)
• Emotional well-beingEmotional well-being
• PainPain
• EnergyEnergy
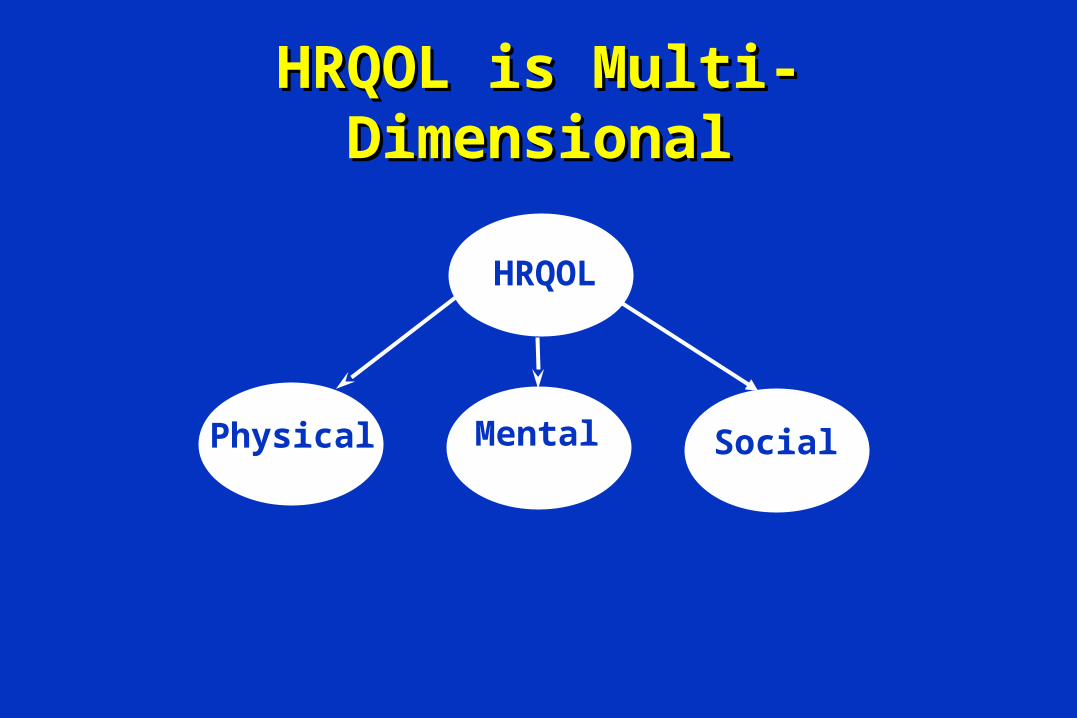
HRQOL is Multi-HRQOL is Multi-DimensionalDimensional
HRQOL
Physical Mental Social
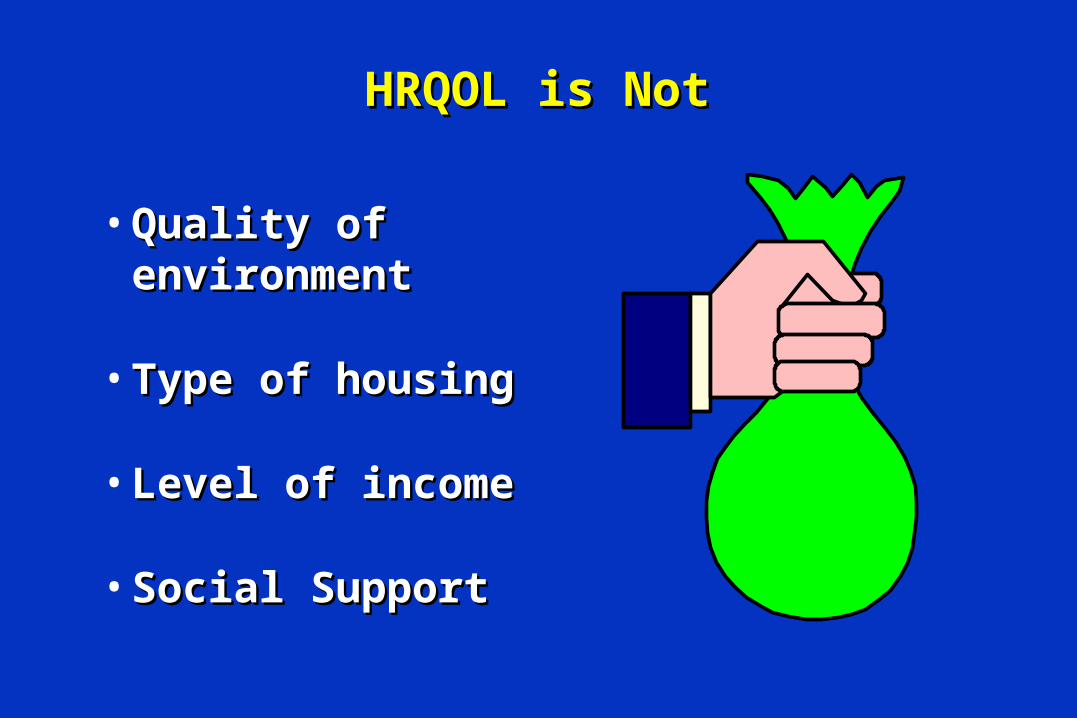
HRQOL is NotHRQOL is Not
• Quality of Quality of environmentenvironment
• Type of housingType of housing
• Level of incomeLevel of income
• Social SupportSocial Support
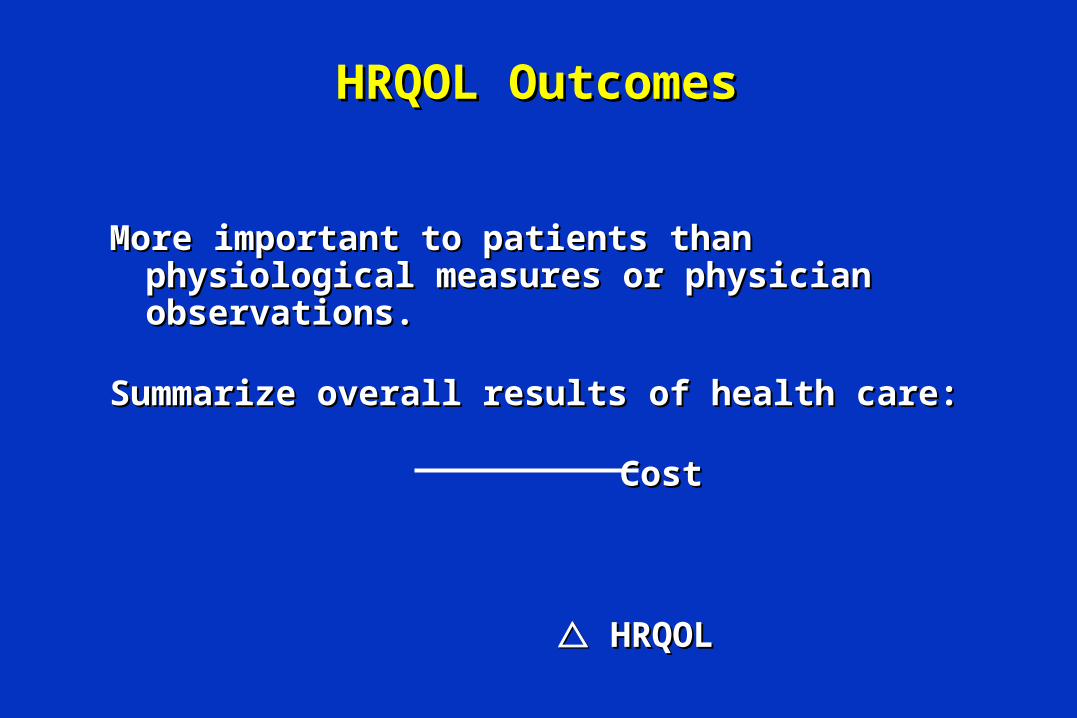
HRQOL OutcomesHRQOL Outcomes
More important to patients than physiological More important to patients than physiological measures or physician observations.measures or physician observations.
Summarize overall results of health care:Summarize overall results of health care:
CostCost
HRQOLHRQOL
•ProfileProfile
– GenericGeneric
– TargetedTargeted
•Preference-basedPreference-based
Types of HRQOL MeasuresTypes of HRQOL Measures
Powerpoint Slides
http://www.gim.med.ucla.edu/FacultyPages/Hays/
Advantages of Generic Advantages of Generic MeasuresMeasures
Allow comparisons across different peopleAllow comparisons across different people
• Across disease groupsAcross disease groups
• Sick versus wellSick versus well
• Young versus oldYoung versus old
Can detect unexpected side effectsCan detect unexpected side effects
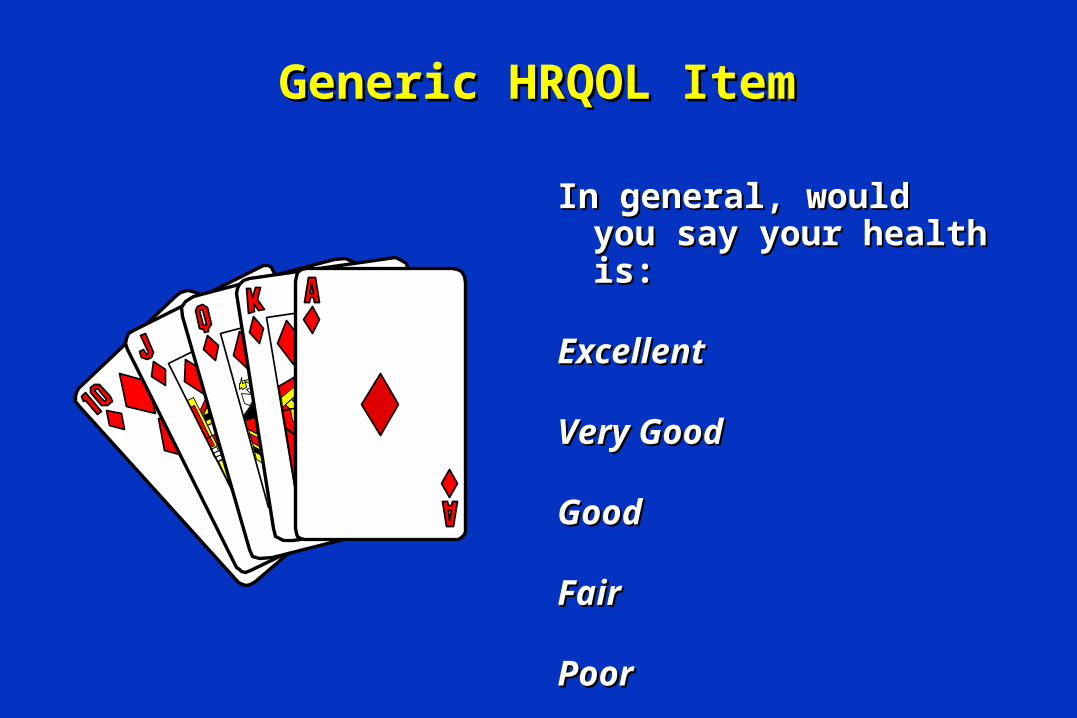
Generic HRQOL ItemGeneric HRQOL Item
In general, would you say In general, would you say your health is:your health is:
ExcellentExcellent
Very GoodVery Good
Good Good
FairFair
PoorPoor
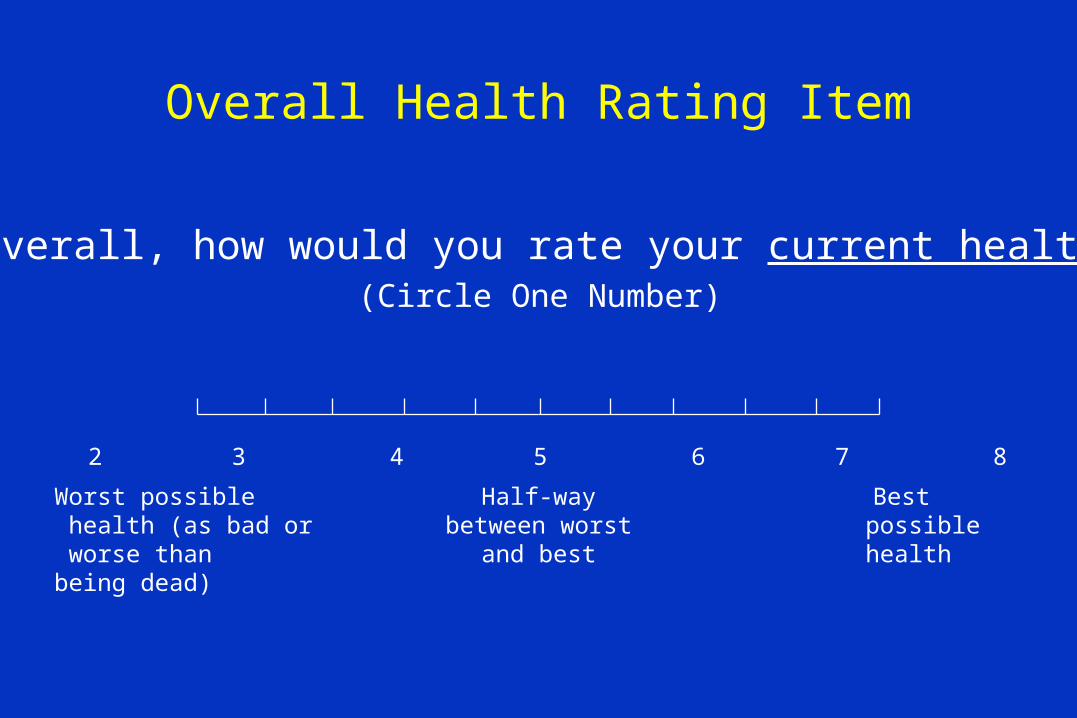
Overall Health Rating Item
Overall, how would you rate your current health?(Circle One Number)
0 1 2 3 4 5 6 7 8 9 10
Worst possible health (as bad or worse than being dead)
Half-waybetween worst
and best
Best possible
health
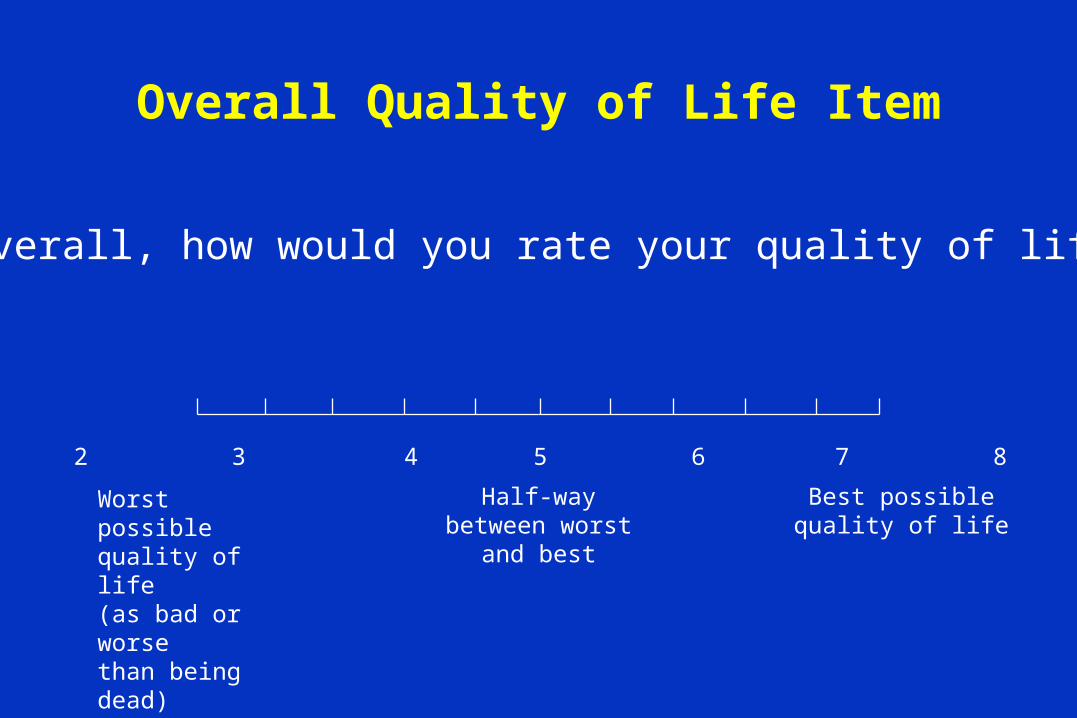
Overall Quality of Life Item
Overall, how would you rate your quality of life?
0 1 2 3 4 5 6 7 8 9 10
Worst possible quality of life(as bad or worse than being dead)
Half-waybetween worst
and best
Best possible quality of life

HealthHealth versus versus Quality of LifeQuality of Life
““In general, how would you rate your In general, how would you rate your health?”health?”
““Overall, how would you rate your quality Overall, how would you rate your quality of life?”of life?”
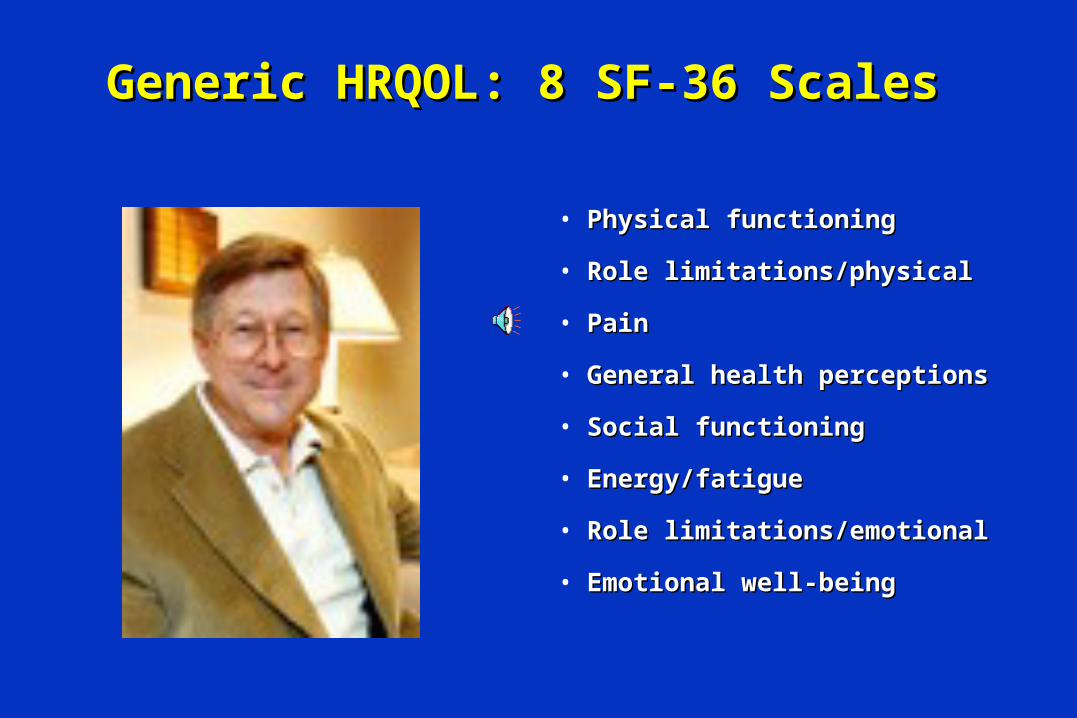
Generic HRQOL: 8 SF-36 Scales Generic HRQOL: 8 SF-36 Scales
• Physical functioning Physical functioning
• Role limitations/physical Role limitations/physical
• Pain Pain
• General health perceptions General health perceptions
• Social functioningSocial functioning
• Energy/fatigueEnergy/fatigue
• Role limitations/emotionalRole limitations/emotional
• Emotional well-being Emotional well-being
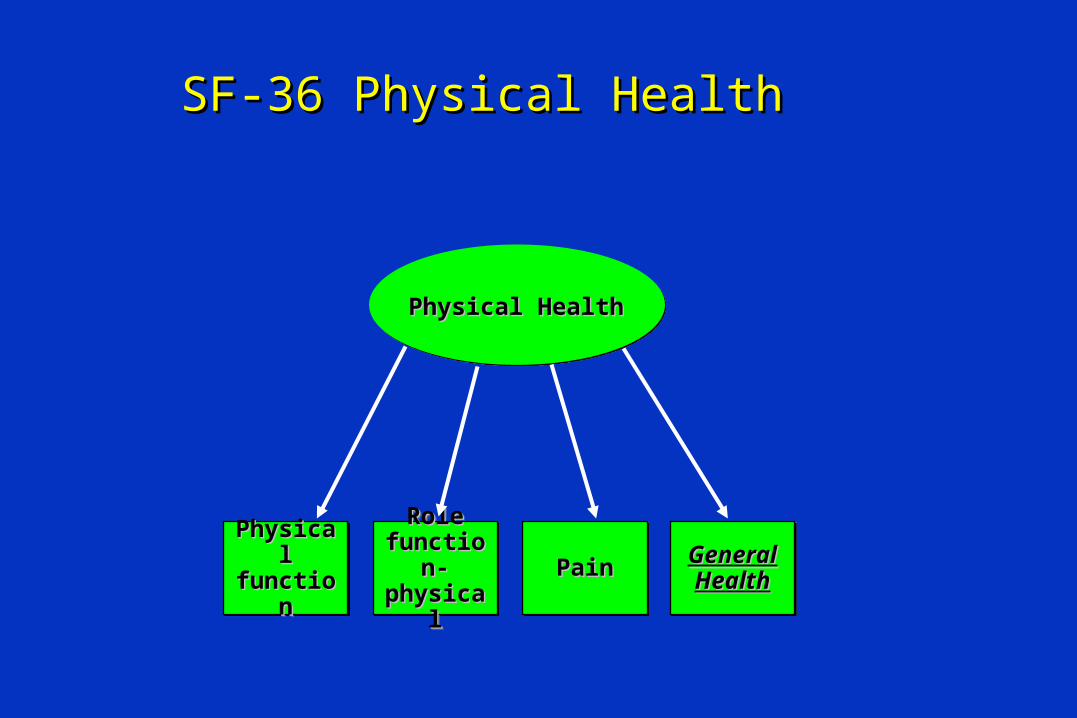
Physical HealthPhysical Health
Physical Physical functionfunctionPhysical Physical functionfunction
Role Role function-function-physicalphysical
Role Role function-function-physicalphysical
PainPainPainPain General General HealthHealth
General General HealthHealth
SF-36 Physical HealthSF-36 Physical Health
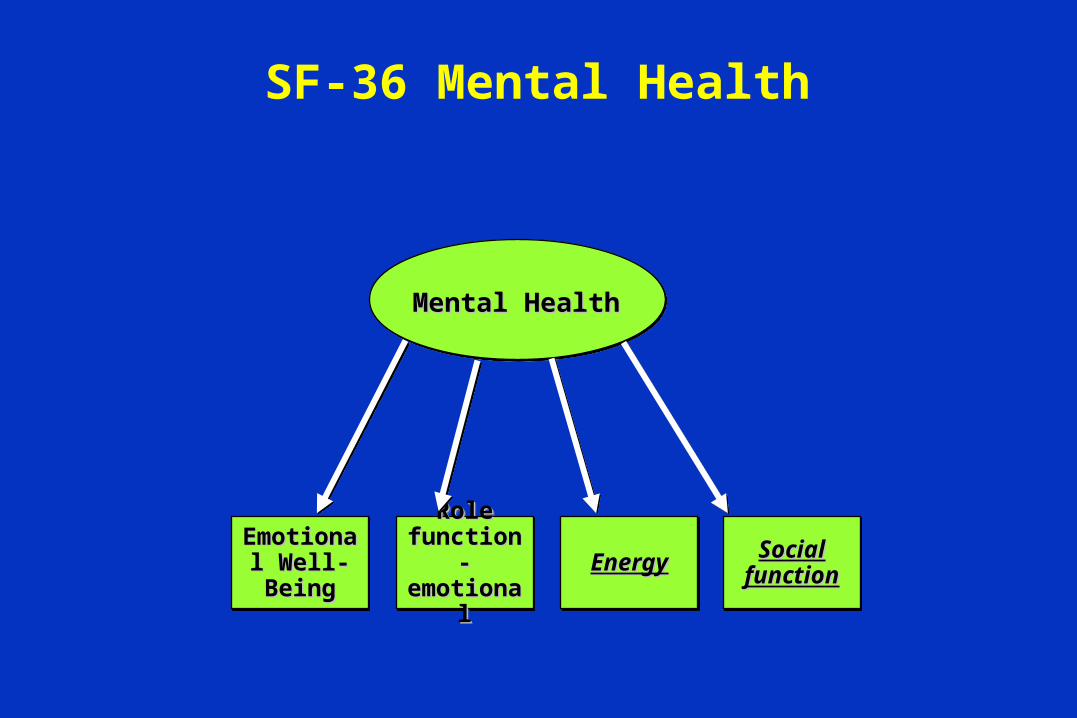
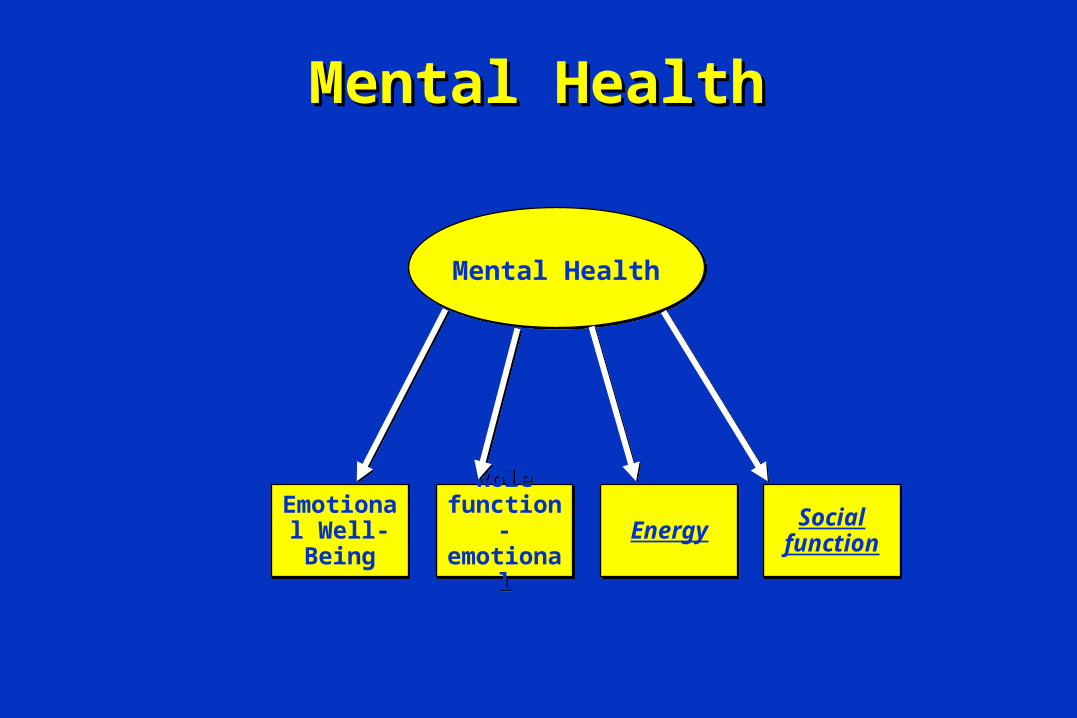
SF-36 Mental Health
Mental HealthMental Health
Emotional Emotional Well-Well-BeingBeing
Emotional Emotional Well-Well-BeingBeing
Role Role function-function-emotionalemotional
Role Role function-function-emotionalemotional
EnergyEnergyEnergyEnergy Social Social functionfunctionSocial Social
functionfunction
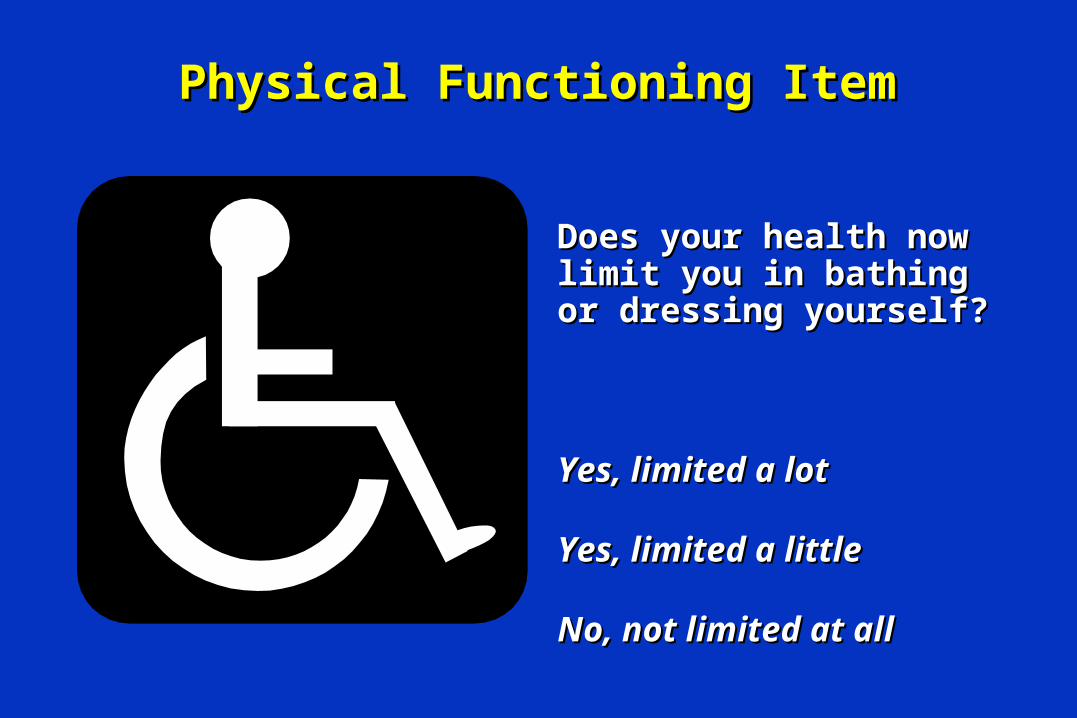
Physical Functioning ItemPhysical Functioning Item
Does your health now Does your health now limit you in bathing or limit you in bathing or dressing yourself?dressing yourself?
Yes, limited a lotYes, limited a lot
Yes, limited a littleYes, limited a little
No, not limited at allNo, not limited at all
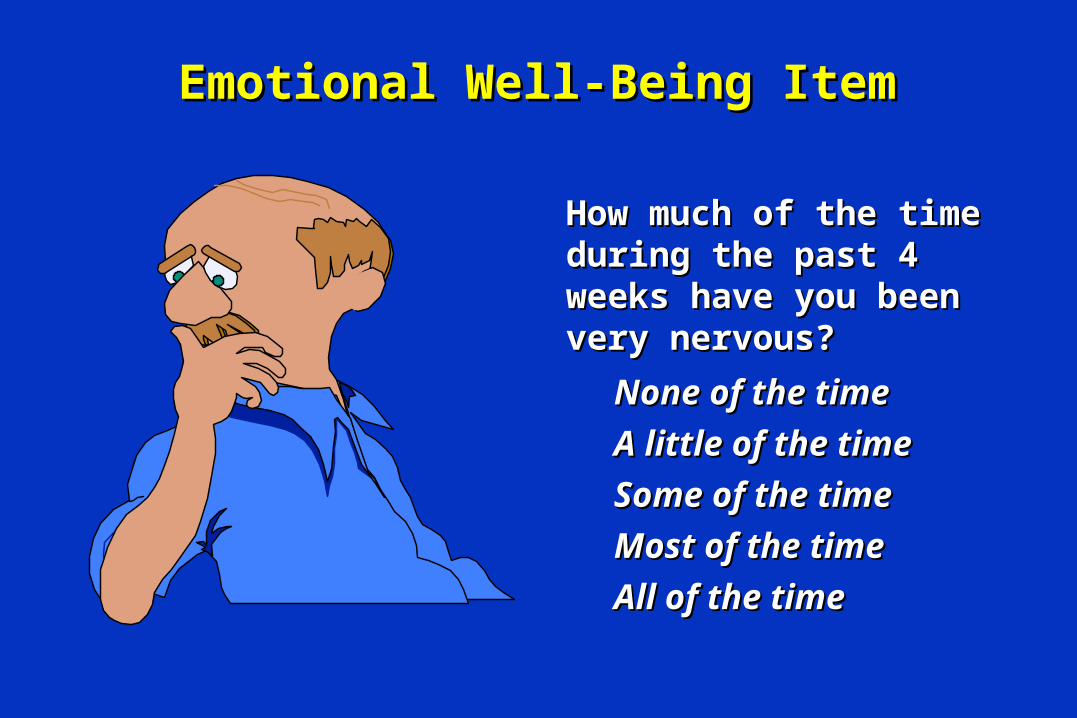
Emotional Well-Being ItemEmotional Well-Being Item
How much of the time How much of the time during the past 4 weeks during the past 4 weeks have you been very have you been very nervous?nervous?
None of the timeNone of the time
A little of the timeA little of the time
Some of the timeSome of the time
Most of the timeMost of the time
All of the timeAll of the time
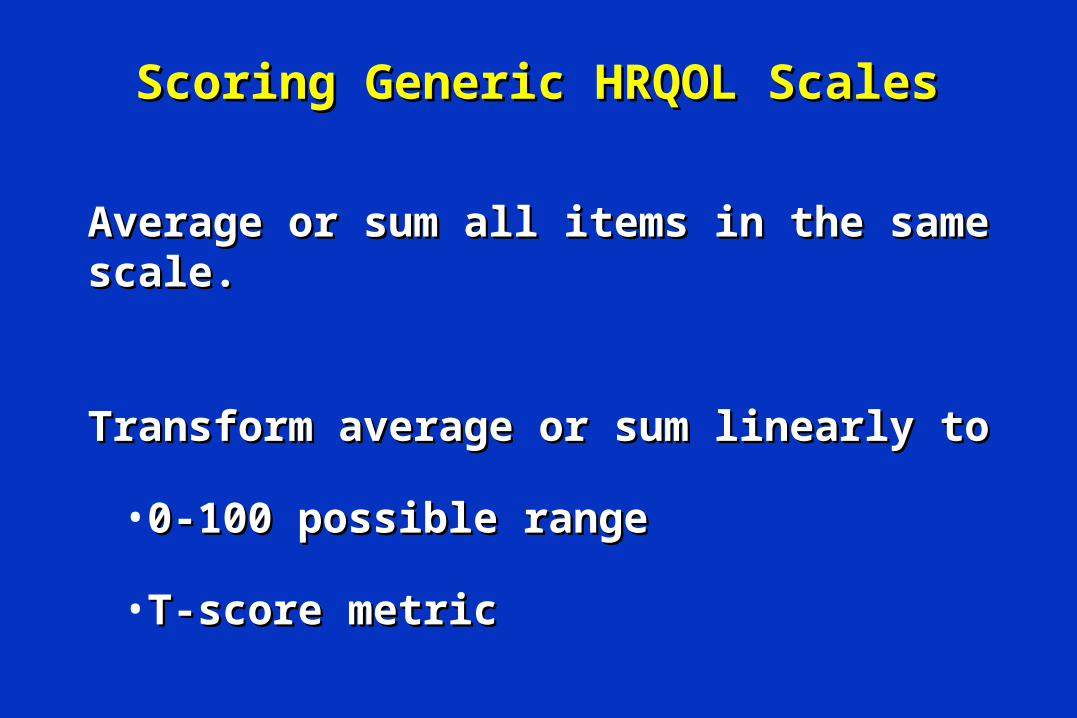
Scoring Generic HRQOL ScalesScoring Generic HRQOL Scales
Average or sum all items in the same scale.Average or sum all items in the same scale.
Transform average or sum linearly toTransform average or sum linearly to
• 0-100 possible range0-100 possible range
• T-score metricT-score metric
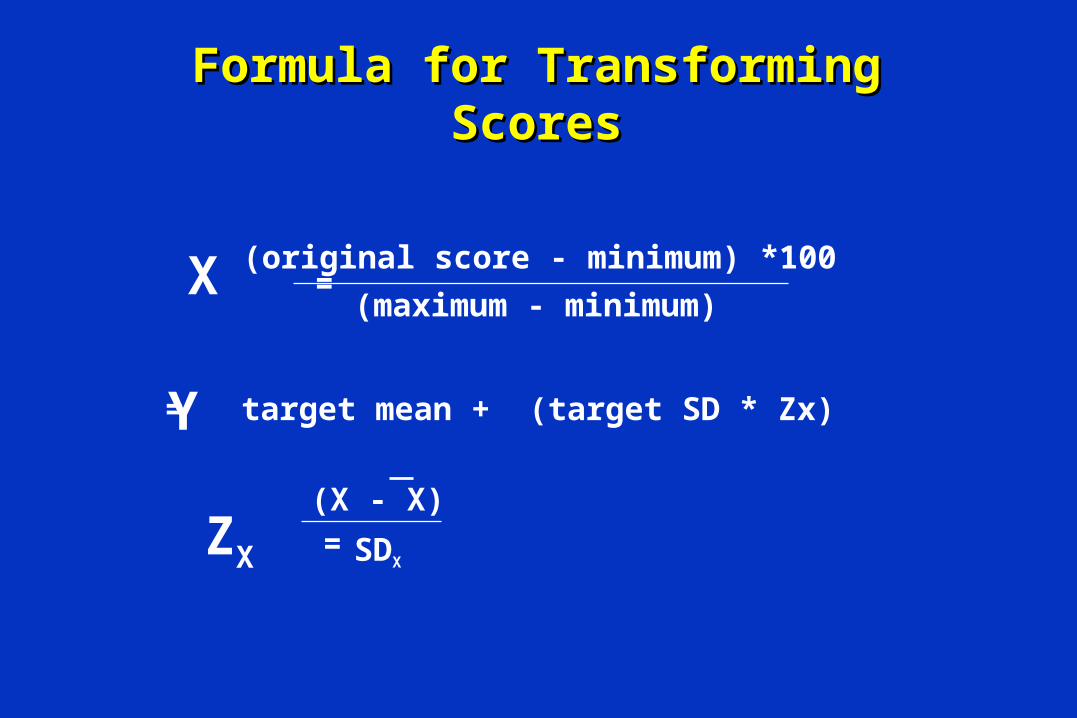
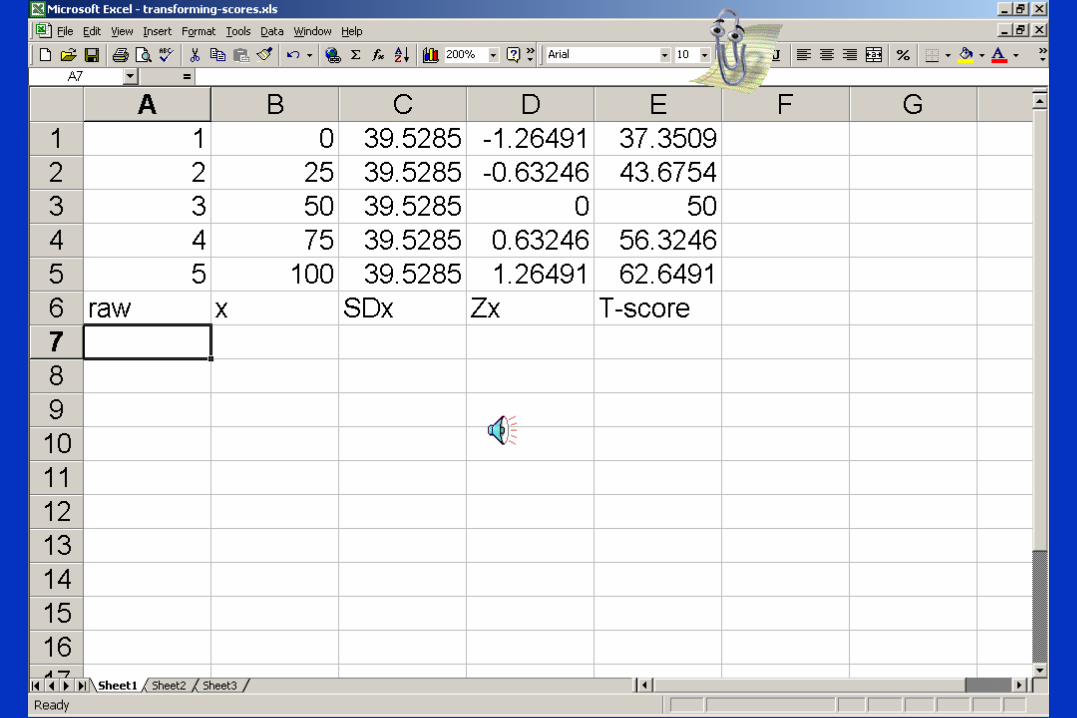
X =(original score - minimum) *100
(maximum - minimum)
Y = target mean + (target SD * Zx)
ZX = SDX
(X - X)
Formula for Transforming Formula for Transforming ScoresScores
Uses of Generic MeasuresUses of Generic Measures
Cross-SectionalCross-Sectional
• Comparison of Different SamplesComparison of Different Samples
• Profiles of Different DiseasesProfiles of Different Diseases
• LongitudinalLongitudinal
• Profiles of Different DiseasesProfiles of Different Diseases
• Examining Antecedents Examining Antecedents
• Predicting utilization or mortalityPredicting utilization or mortality
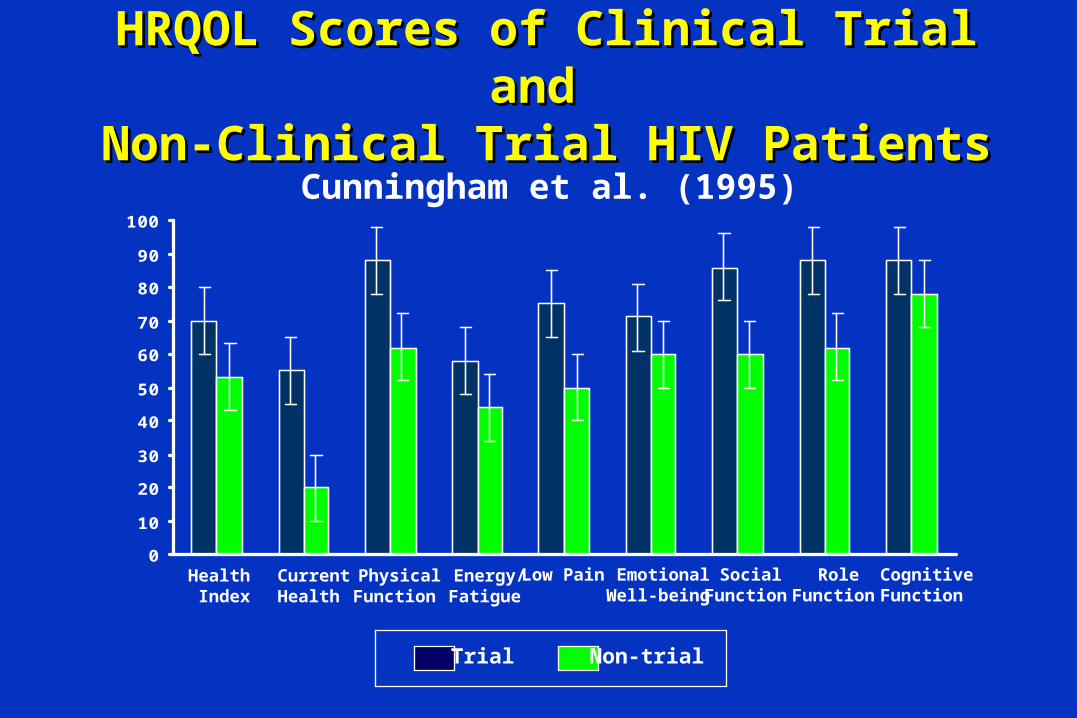
HRQOL Scores of Clinical Trial and HRQOL Scores of Clinical Trial and
Non-Clinical Trial HIV PatientsNon-Clinical Trial HIV PatientsCunningham et al. (1995)
0
10
20
30
40
50
60
70
80
90
100
Health Index
CurrentHealth
PhysicalFunction
Energy/Fatigue
Low Pain EmotionalWell-being
SocialFunction
RoleFunction
CognitiveFunction
Trial Non-trial
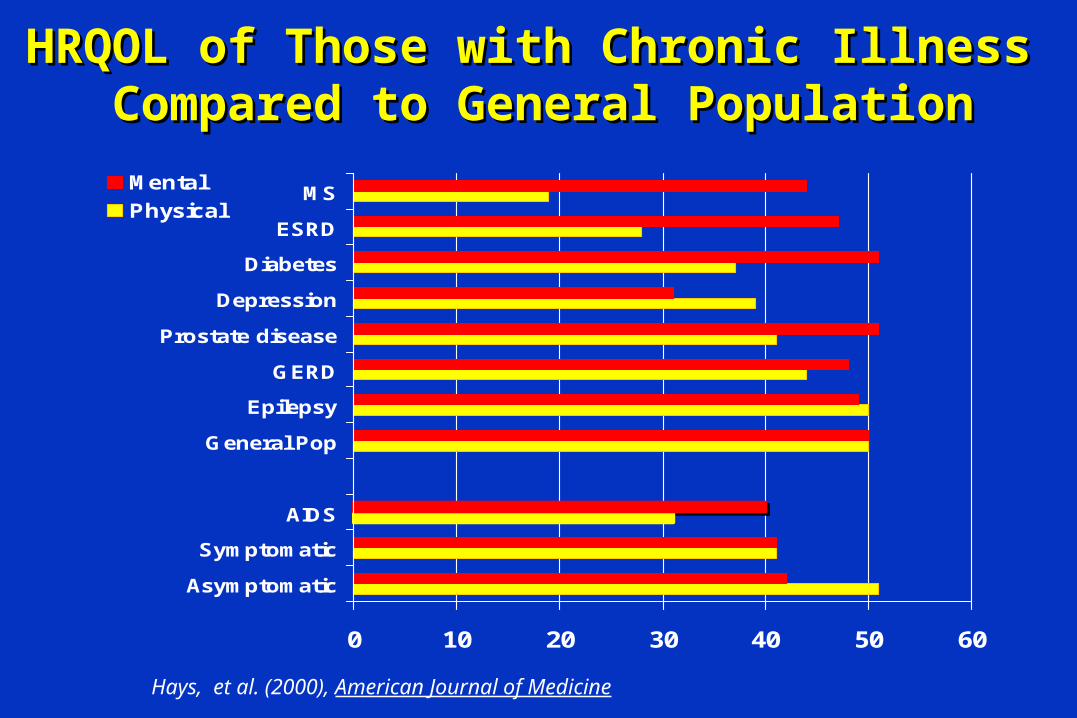
HRQOL of Those with Chronic Illness HRQOL of Those with Chronic Illness Compared to General PopulationCompared to General Population
0 10 20 30 40 50 60
Asymptomatic
Symptomatic
AIDS
General Pop
Epilepsy
GERD
Prostate disease
Depression
Diabetes
ESRD
MSMental
Physical
Hays, et al. (2000), American Journal of Medicine
Hays, R.D., Wells, K.B., Sherbourne, C.D., Rogers, W., & Spritzer, K. (1995).Functioning and well-being outcomes of patients with depression comparedto chronic medical illnesses. Archives of General Psychiatry, 52, 11-19.
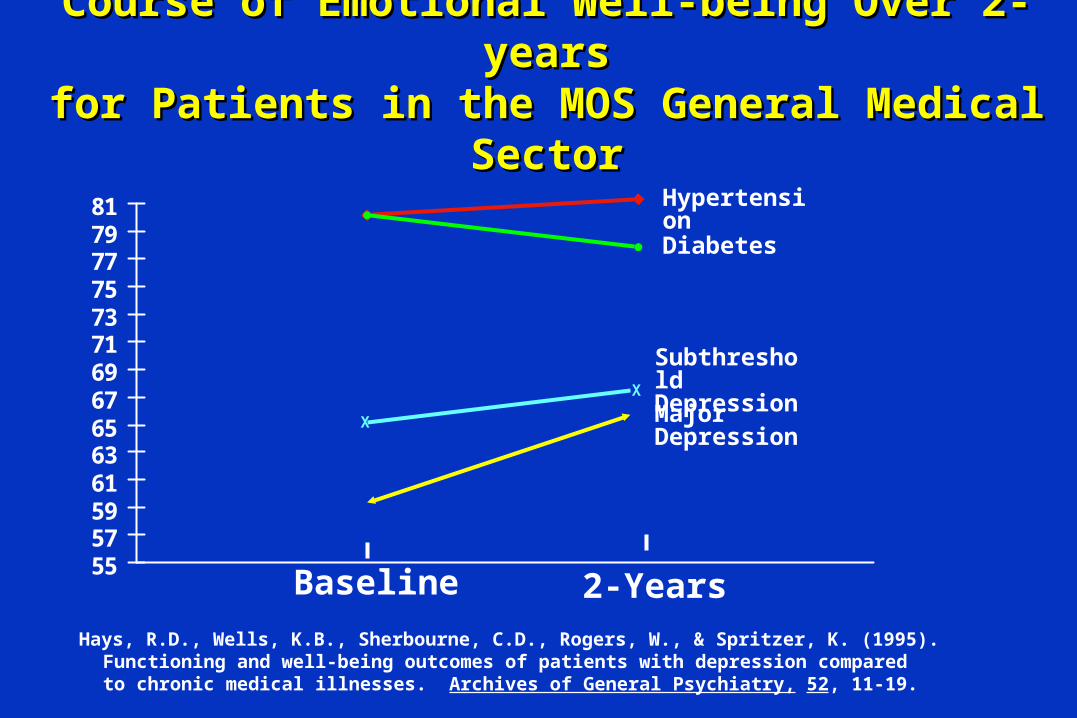
Course of Emotional Well-being Over 2-Course of Emotional Well-being Over 2-yearsyears
for Patients in the MOS General Medical for Patients in the MOS General Medical SectorSector
5557596163656769717375777981
Baseline 2-Years
X
X
Subthreshold Depression
Major Depression
Diabetes
Hypertension
Hypertension
Diabetes
Current DepressionSubthreshold Depression
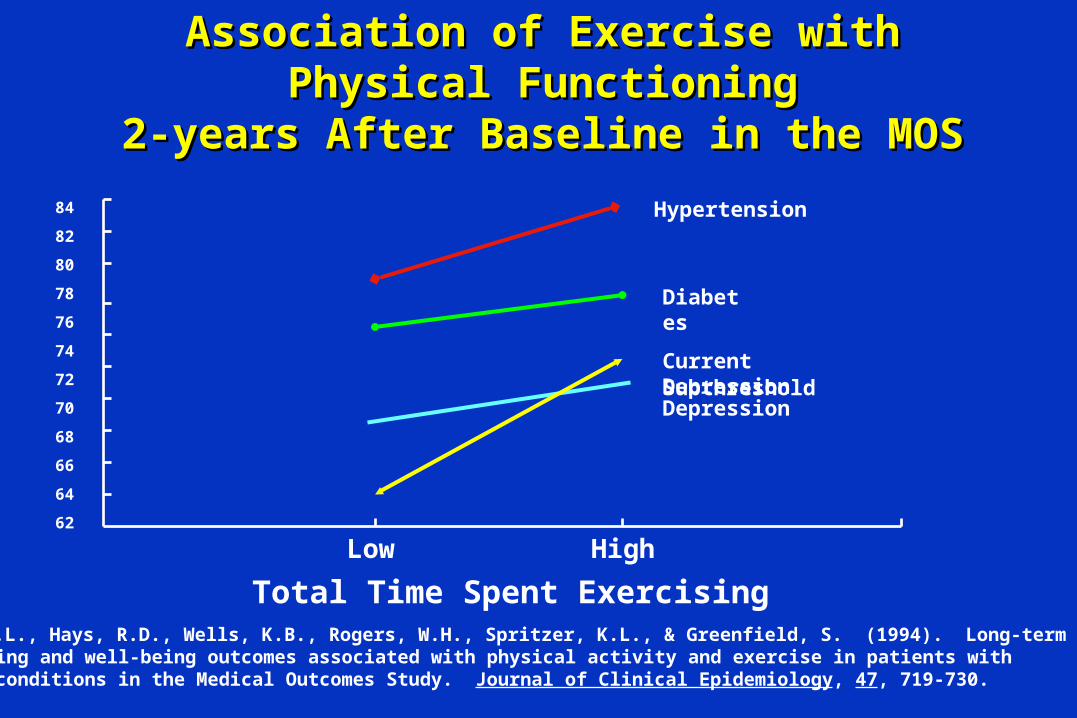
Stewart, A.L., Hays, R.D., Wells, K.B., Rogers, W.H., Spritzer, K.L., & Greenfield, S. (1994). Long-termfunctioning and well-being outcomes associated with physical activity and exercise in patients withchronic conditions in the Medical Outcomes Study. Journal of Clinical Epidemiology, 47, 719-730.
Association of Exercise with Physical Association of Exercise with Physical FunctioningFunctioning
2-years After Baseline in the MOS2-years After Baseline in the MOS
Low High
Total Time Spent Exercising
84
82
80
78
76
74
72
70
68
66
64
62
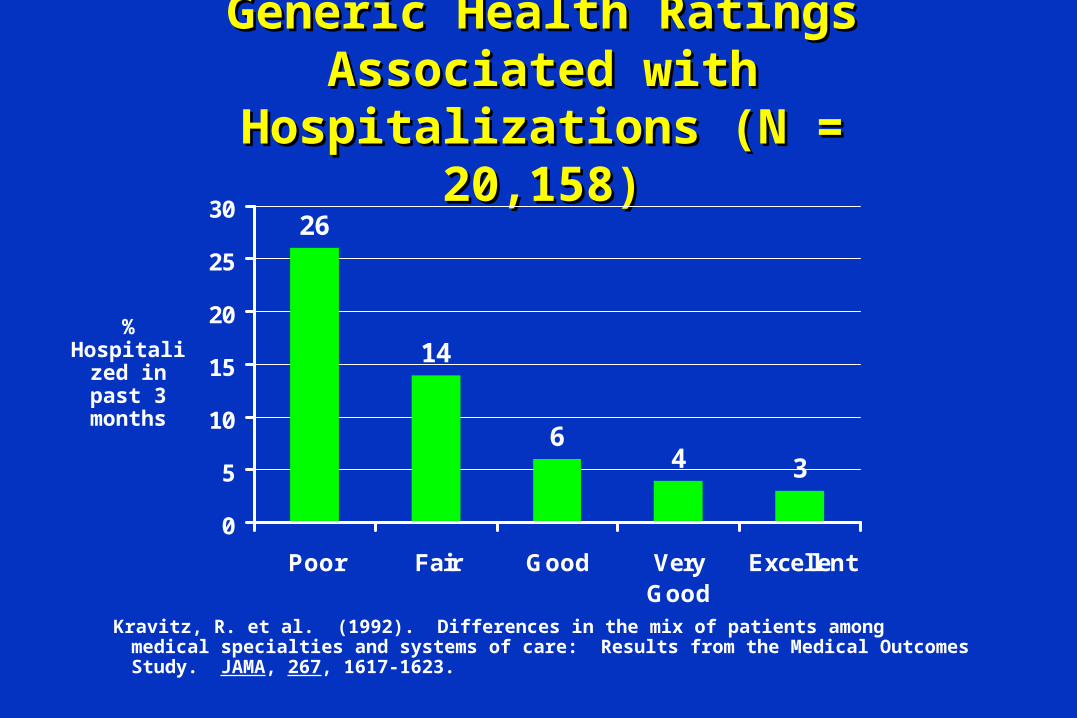
Generic Health Ratings Generic Health Ratings Associated with Associated with
Hospitalizations (N = 20,158)Hospitalizations (N = 20,158)26
14
64 3
0
5
10
15
20
25
30
Poor Fair Good VeryGood
Excellent
% Hospitalized
in past 3 months
Kravitz, R. et al. (1992). Differences in the mix of patients among medical specialties and systems of care: Results from the Medical Outcomes Study. JAMA, 267, 1617-1623.
6
2
17
5
0
2
4
6
8
10
12
14
16
18
<35 35-44 45-54 >55
%
Dead
(n=676) (n=754) (n=1181) (n=609)
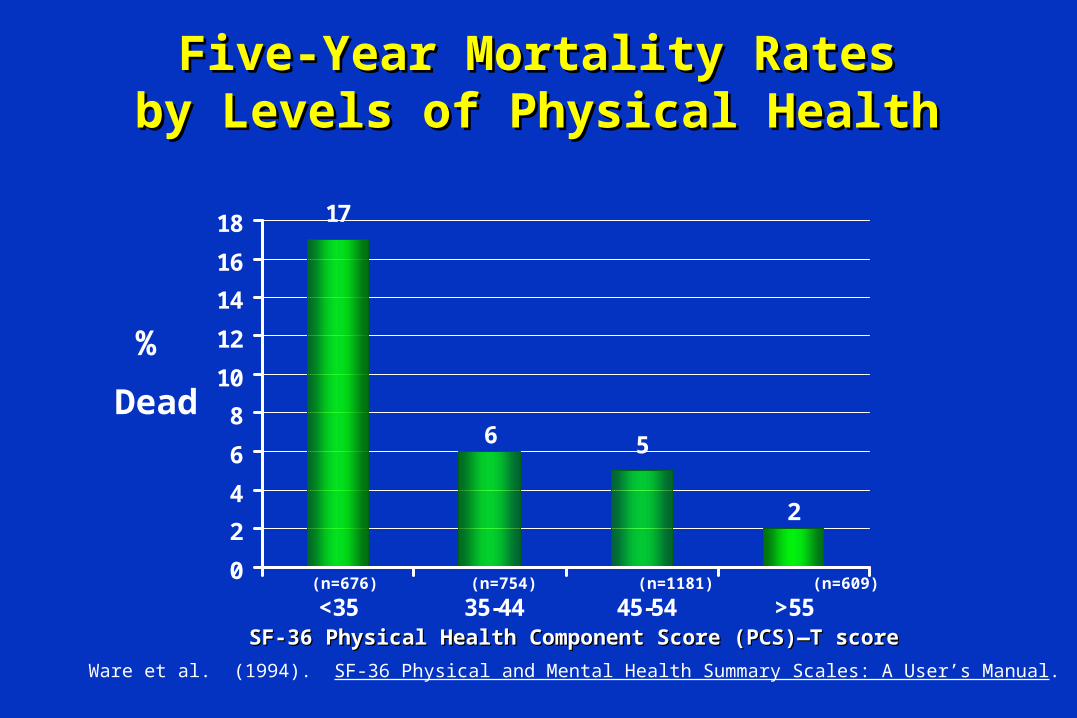
SF-36 Physical Health Component Score (PCS)—T scoreSF-36 Physical Health Component Score (PCS)—T score
Ware et al. (1994). SF-36 Physical and Mental Health Summary Scales: A User’s Manual.
Five-Year Mortality RatesFive-Year Mortality Ratesby Levels of Physical Healthby Levels of Physical Health
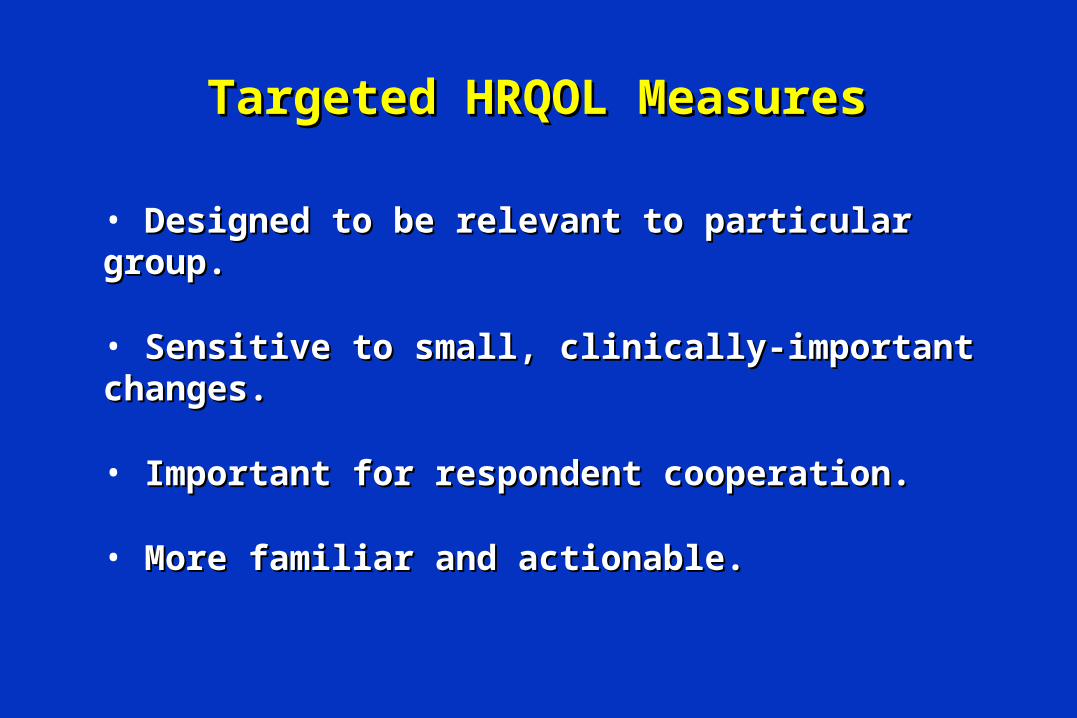
Targeted HRQOL MeasuresTargeted HRQOL Measures
• Designed to be relevant to particular group.Designed to be relevant to particular group.
• Sensitive to small, clinically-important changes.Sensitive to small, clinically-important changes.
• Important for respondent cooperation.Important for respondent cooperation.
• More familiar and actionable.More familiar and actionable.
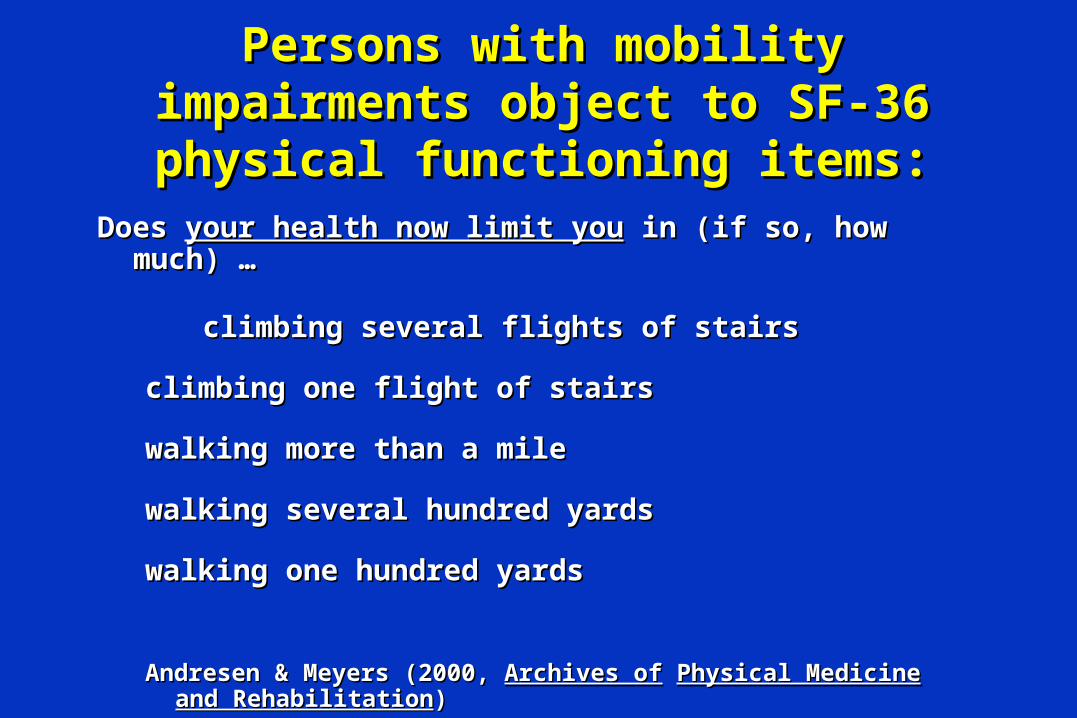
Persons with mobility Persons with mobility impairments object to SF-36 impairments object to SF-36 physical functioning items:physical functioning items:
Does Does your health now limit youyour health now limit you in (if so, how much) … in (if so, how much) …
climbing several flights of stairsclimbing several flights of stairs
climbing one flight of stairsclimbing one flight of stairs
walking more than a milewalking more than a mile
walking several hundred yardswalking several hundred yards
walking one hundred yardswalking one hundred yards
Andresen & Meyers (2000, Andresen & Meyers (2000, Archives ofArchives of Physical Medicine and Physical Medicine and RehabilitationRehabilitation))
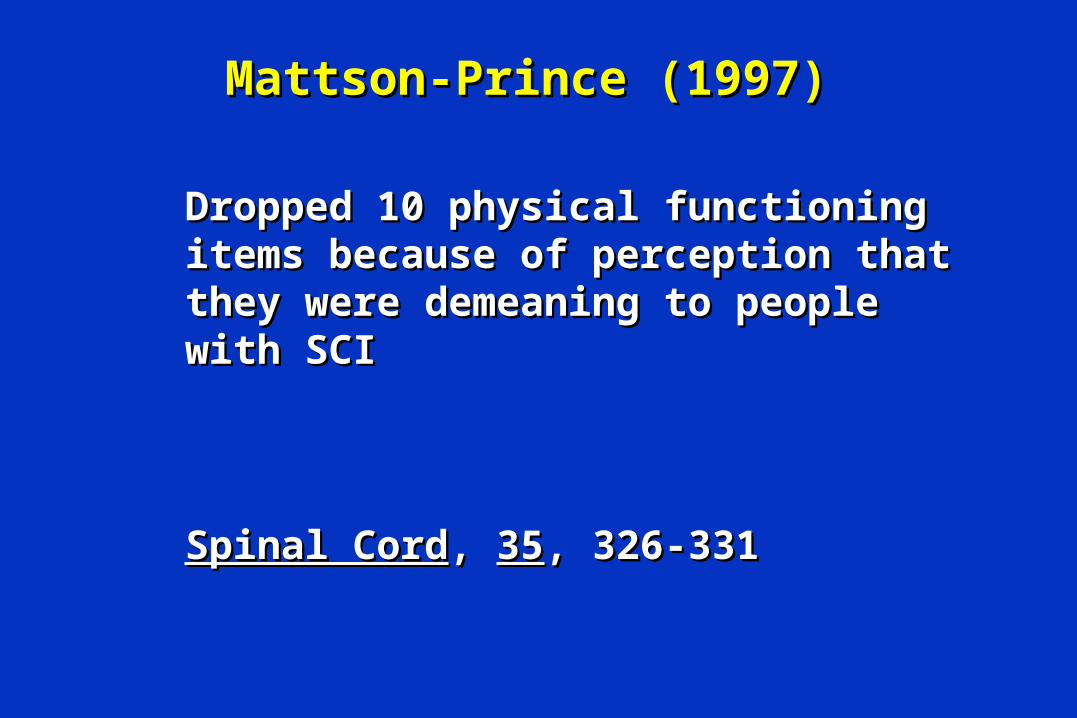
Mattson-Prince (1997)Mattson-Prince (1997)
Dropped 10 physical functioning items Dropped 10 physical functioning items because of perception that they were because of perception that they were demeaning to people with SCIdemeaning to people with SCI
Spinal CordSpinal Cord, , 3535, 326-331, 326-331
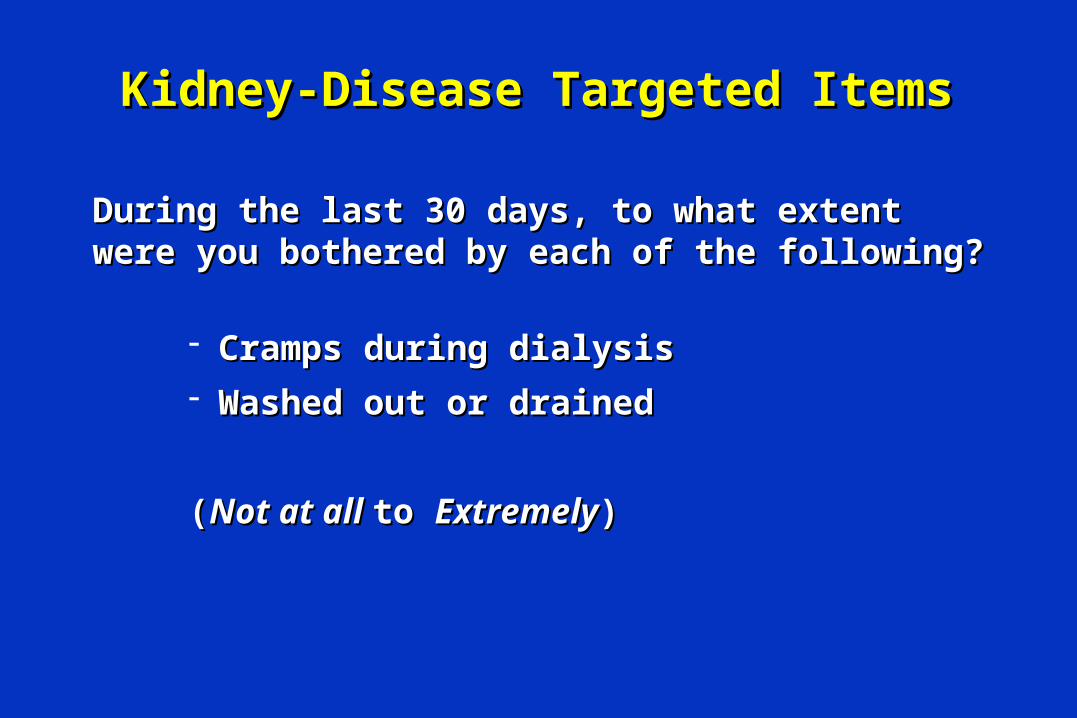
Kidney-Disease Targeted ItemsKidney-Disease Targeted Items
During the last 30 days, to what extent were you During the last 30 days, to what extent were you bothered by each of the following? bothered by each of the following?
Cramps during dialysis Cramps during dialysis
Washed out or drained Washed out or drained
((Not at all Not at all to to ExtremelyExtremely))
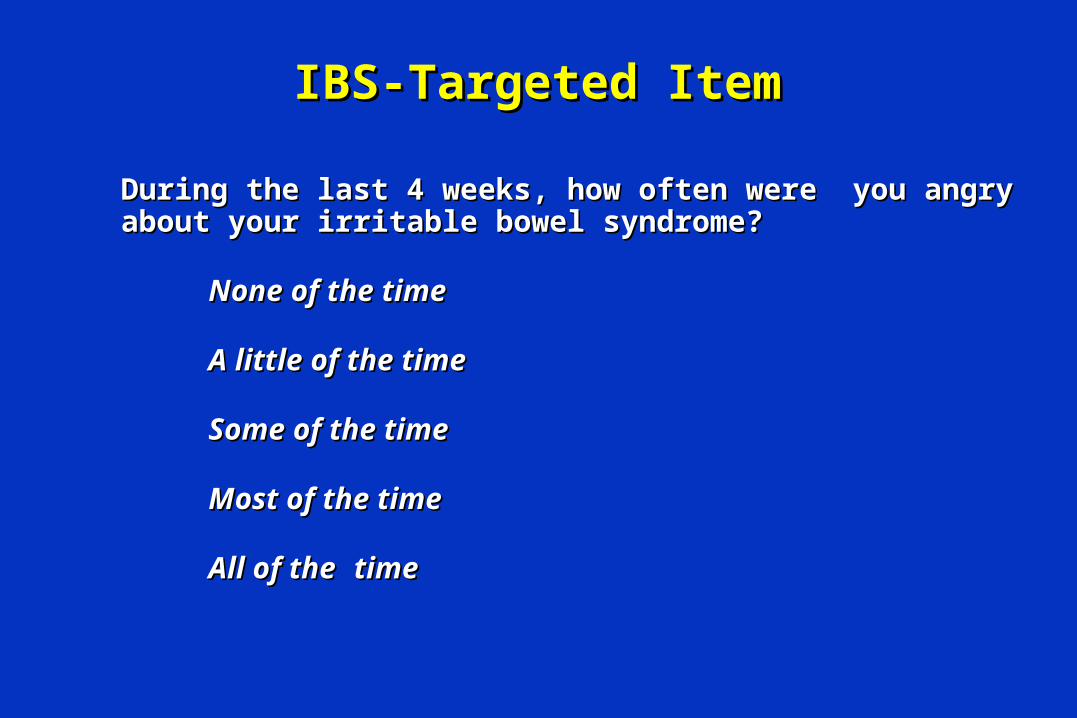
IBS-Targeted ItemIBS-Targeted Item
During the last 4 weeks, how often were you angry about During the last 4 weeks, how often were you angry about your irritable bowel syndrome?your irritable bowel syndrome?
None of the timeNone of the time
A little of the timeA little of the time
Some of the timeSome of the time
Most of the timeMost of the time
All of theAll of the timetime
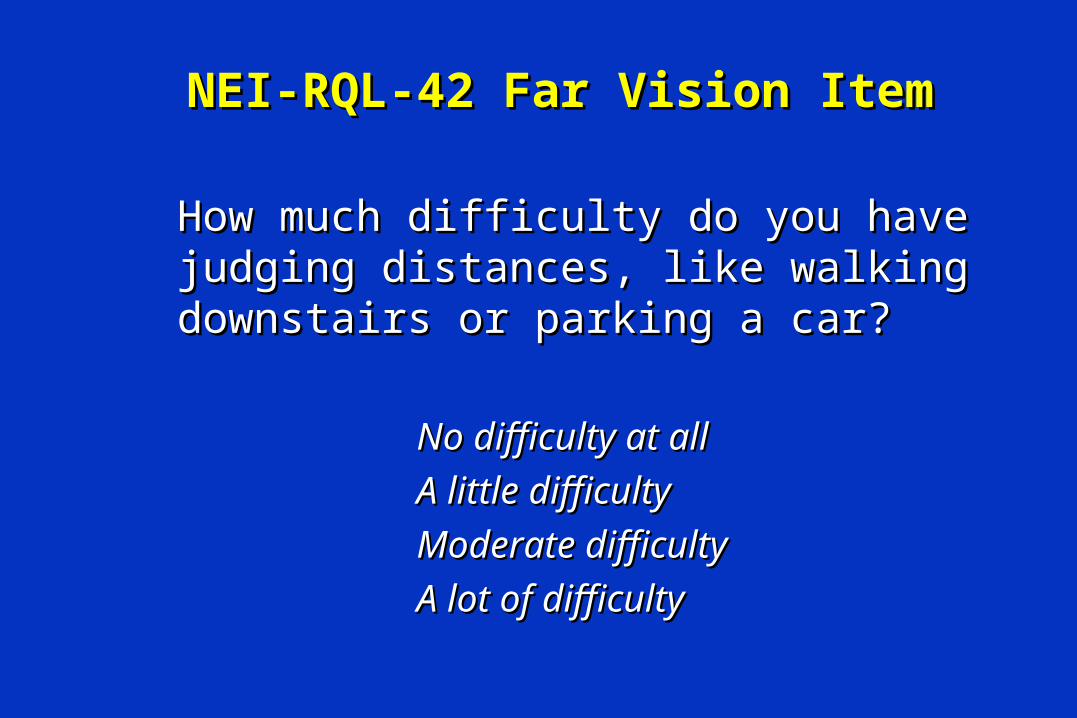
NEI-RQL-42 Far Vision ItemNEI-RQL-42 Far Vision Item
How much difficulty do you have judging How much difficulty do you have judging distances, like walking downstairs or distances, like walking downstairs or parking a car?parking a car?
No difficulty at allNo difficulty at all
A little difficultyA little difficulty
Moderate difficultyModerate difficulty
A lot of difficultyA lot of difficulty
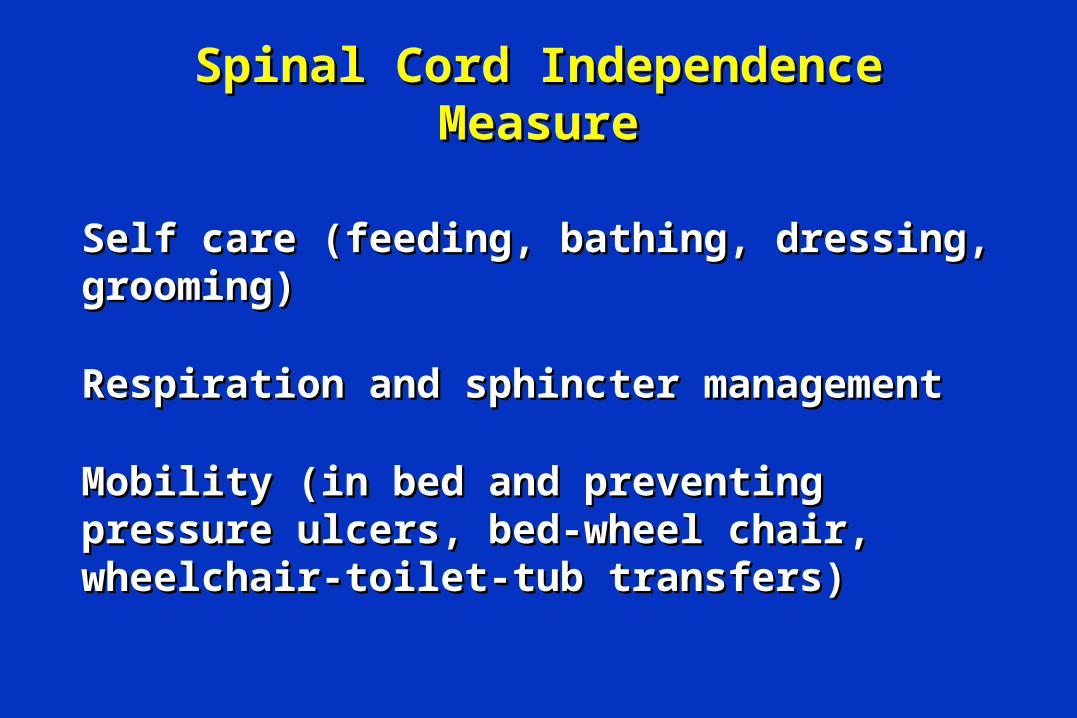
Spinal Cord Independence Spinal Cord Independence MeasureMeasure
Self care (feeding, bathing, dressing, grooming)Self care (feeding, bathing, dressing, grooming)
Respiration and sphincter managementRespiration and sphincter management
Mobility (in bed and preventing pressure ulcers, Mobility (in bed and preventing pressure ulcers, bed-wheel chair, wheelchair-toilet-tub transfers)bed-wheel chair, wheelchair-toilet-tub transfers)
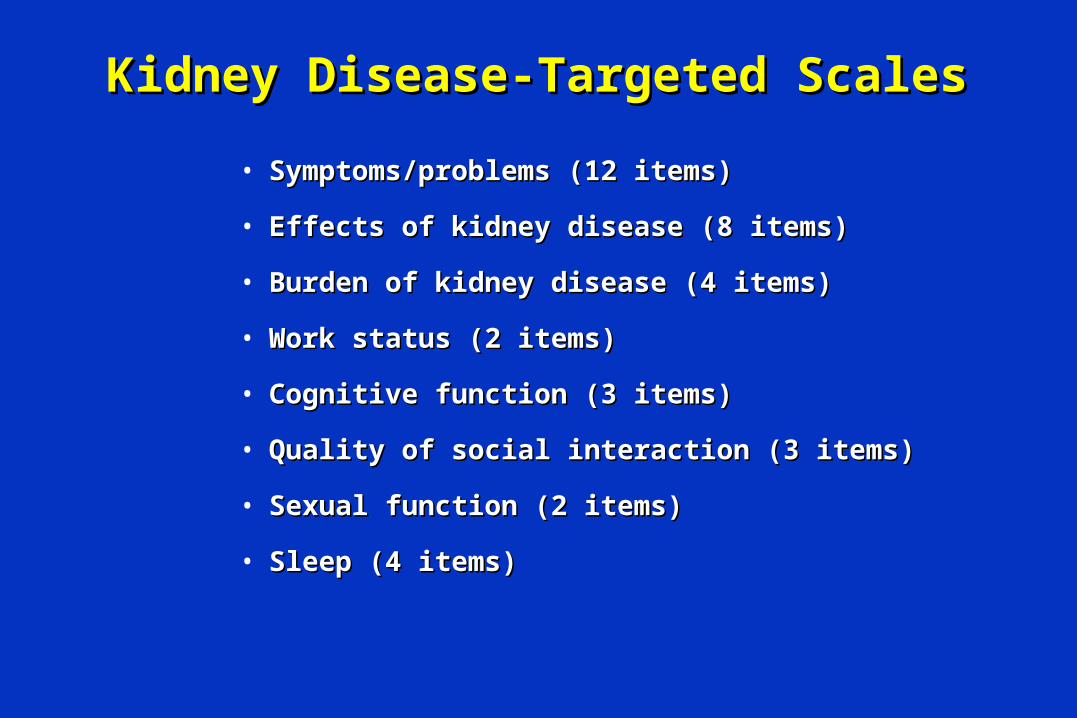
Kidney Disease-Targeted ScalesKidney Disease-Targeted Scales
• Symptoms/problems (12 items)Symptoms/problems (12 items)
• Effects of kidney disease (8 items)Effects of kidney disease (8 items)
• Burden of kidney disease (4 items)Burden of kidney disease (4 items)
• Work status (2 items)Work status (2 items)
• Cognitive function (3 items)Cognitive function (3 items)
• Quality of social interaction (3 items)Quality of social interaction (3 items)
• Sexual function (2 items)Sexual function (2 items)
• Sleep (4 items)Sleep (4 items)
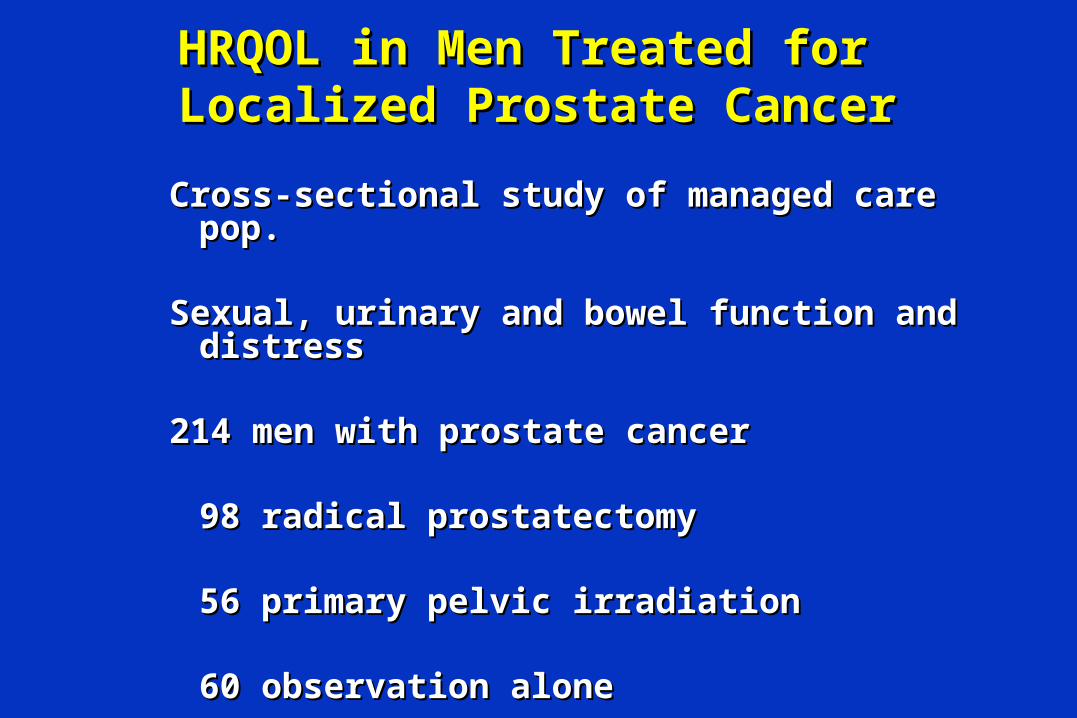
Cross-sectional study of managed care pop.Cross-sectional study of managed care pop.
Sexual, urinary and bowel function and distressSexual, urinary and bowel function and distress
214 men with prostate cancer 214 men with prostate cancer
98 radical prostatectomy98 radical prostatectomy
56 primary pelvic irradiation56 primary pelvic irradiation
60 observation alone60 observation alone
273 age/zip matched pts. without cancer273 age/zip matched pts. without cancer
HRQOL in Men Treated for HRQOL in Men Treated for Localized Prostate CancerLocalized Prostate Cancer
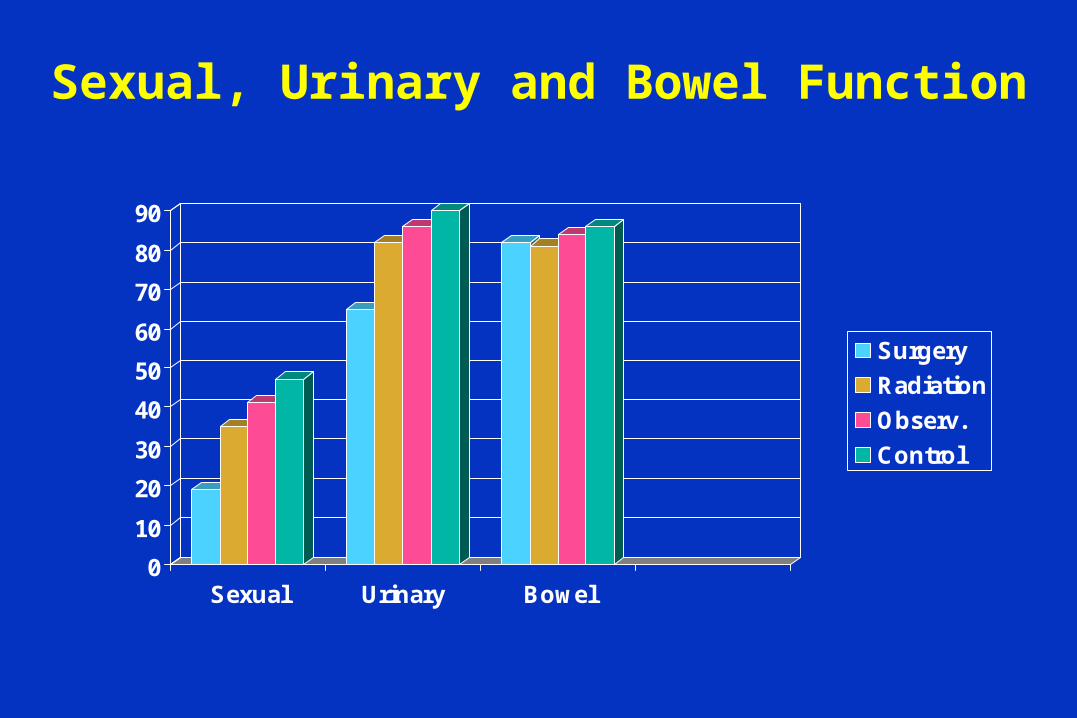
Sexual, Urinary and Bowel Function
0
10
20
30
40
50
60
70
80
90
Sexual Urinary Bowel
Surgery
Radiation
Observ.
Control
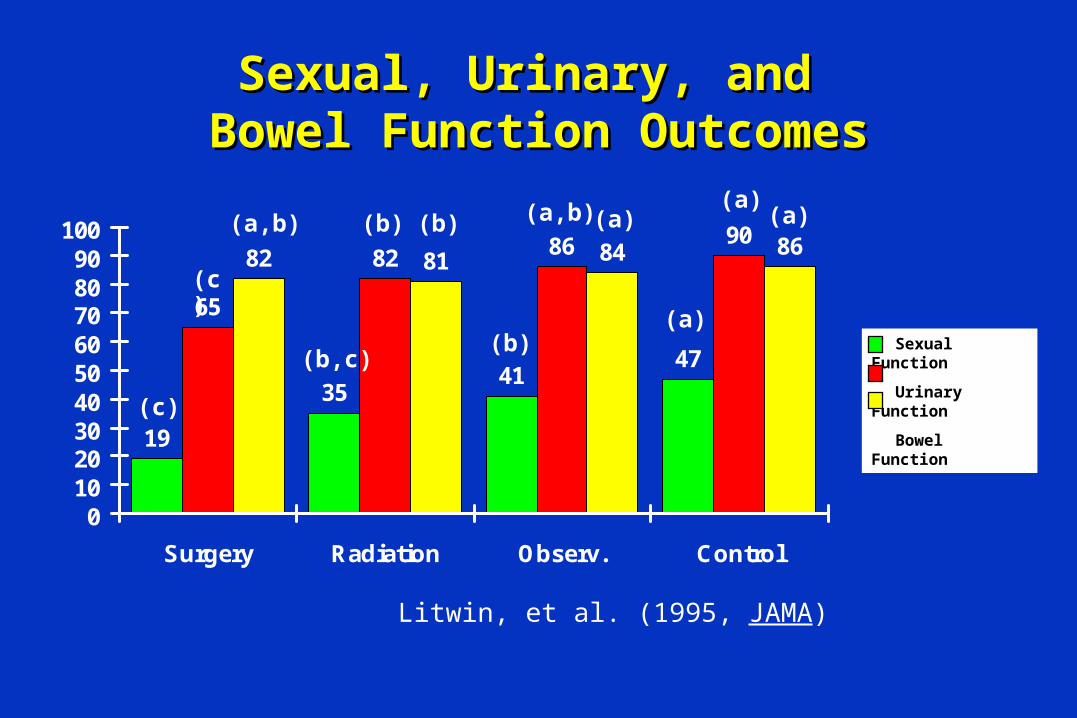
19
3541
47
65
82 86 9082 81 84 86
0102030405060708090
100
Surgery Radiation Observ. Control
(c)
(c)
(a,b)
(b,c)
(b) (b)
(b)
(a,b)
(a)
(a)(a)(a)
Sexual, Urinary, and Sexual, Urinary, and Bowel Function OutcomesBowel Function Outcomes
Sexual Function
Urinary Function
Bowel Function
Litwin, et al. (1995, JAMA)
Check-in PointCheck-in Point
Generic Profile MeasuresGeneric Profile Measures
Targeted Profile MeasuresTargeted Profile Measures
-> Summarizing Profile Information-> Summarizing Profile Information
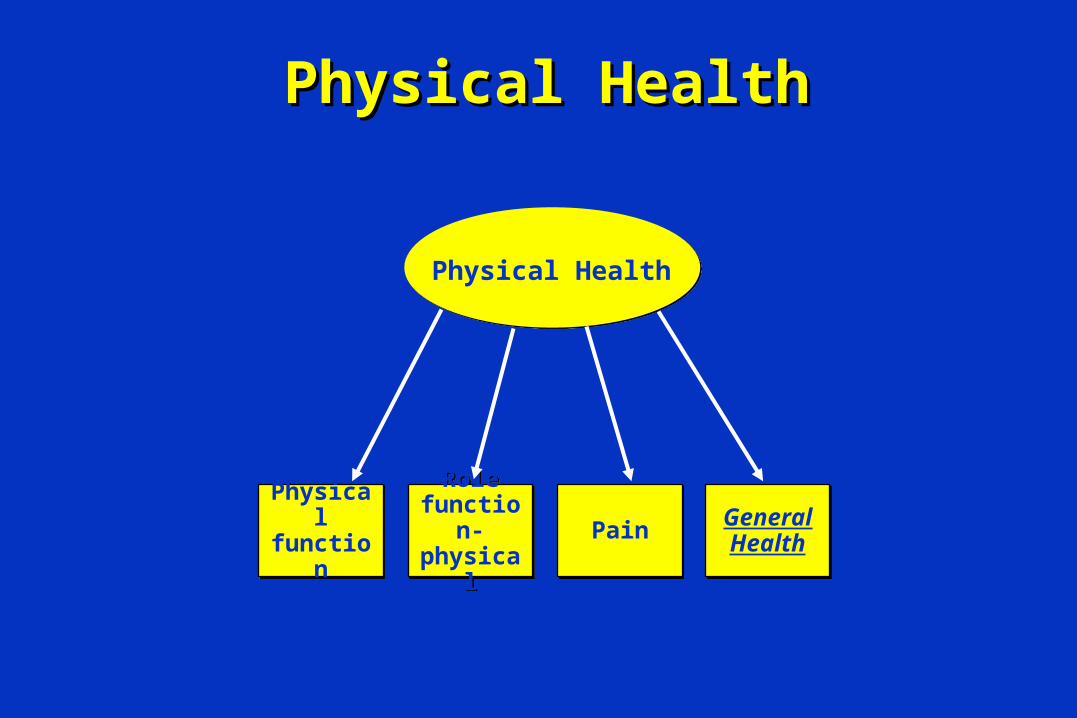
Physical Health
Physical functionPhysical function
Role function-physical
Role function-physical
PainPain General Health
General Health
Physical HealthPhysical Health
Mental Health
Emotional Well-Being
Emotional Well-Being
Role function-emotional
Role function-emotional
EnergyEnergy Social functionSocial
function
Mental HealthMental Health
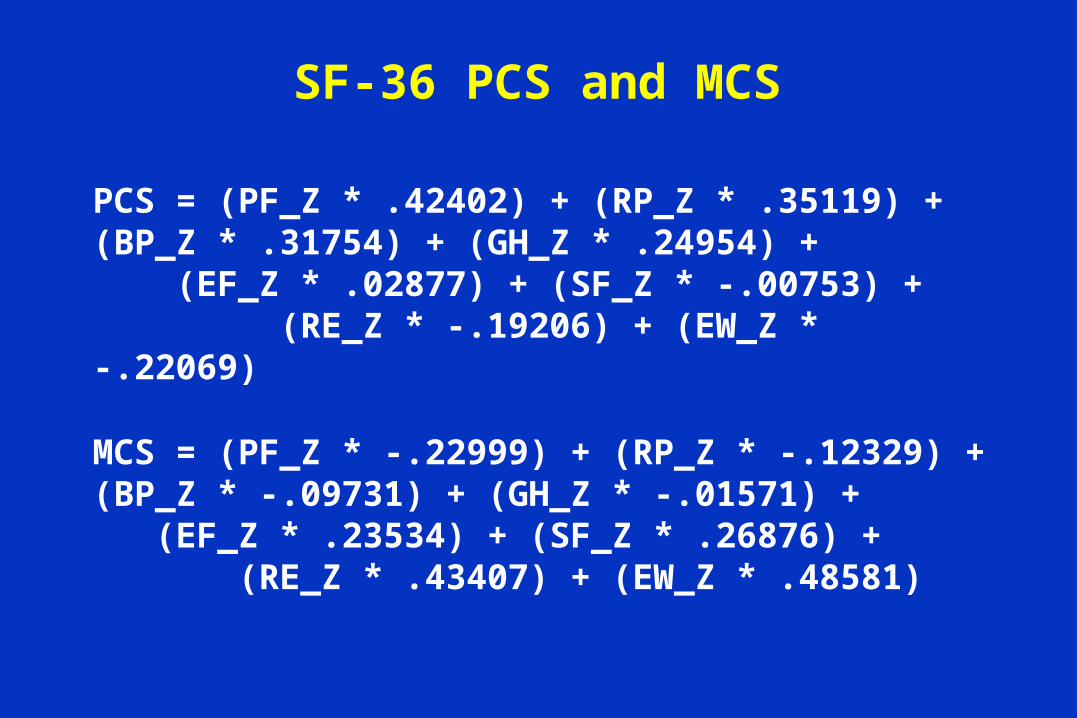
SF-36 PCS and MCS
PCS = (PF_Z * .42402) + (RP_Z * .35119) + (BP_Z * .31754) + (GH_Z * .24954) + (EF_Z * .02877) + (SF_Z * -.00753) + (RE_Z * -.19206) + (EW_Z * -.22069)
MCS = (PF_Z * -.22999) + (RP_Z * -.12329) + (BP_Z * -.09731) + (GH_Z * -.01571) + (EF_Z * .23534) + (SF_Z * .26876) + (RE_Z * .43407) + (EW_Z * .48581)
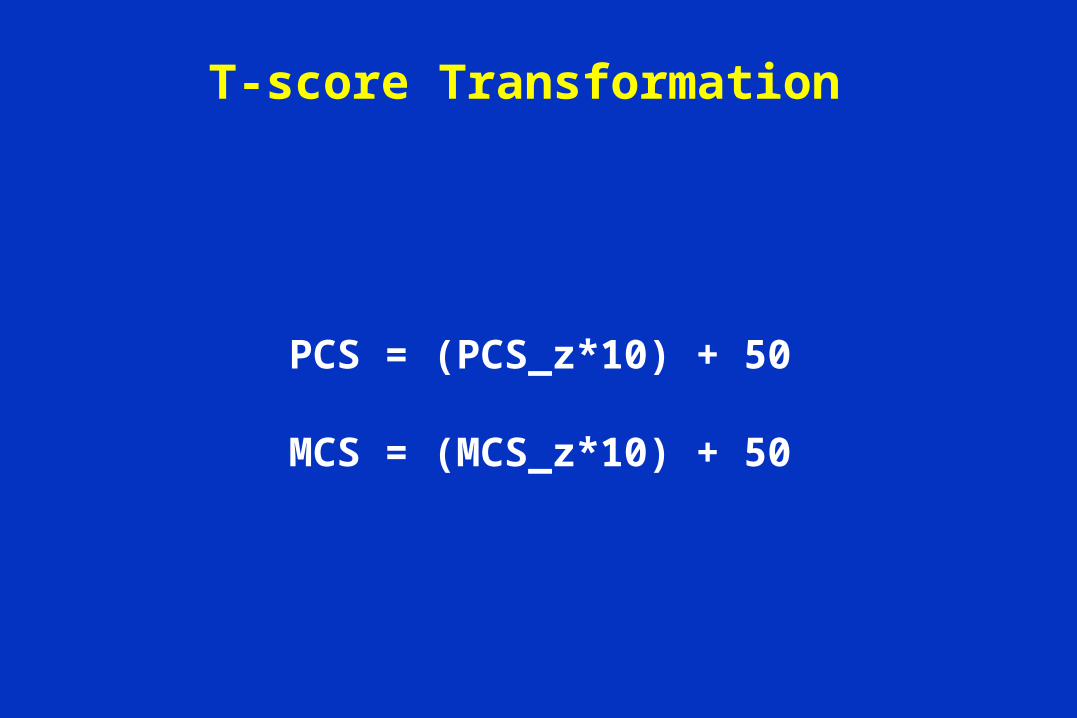
T-score Transformation
PCS = (PCS_z*10) + 50
MCS = (MCS_z*10) + 50
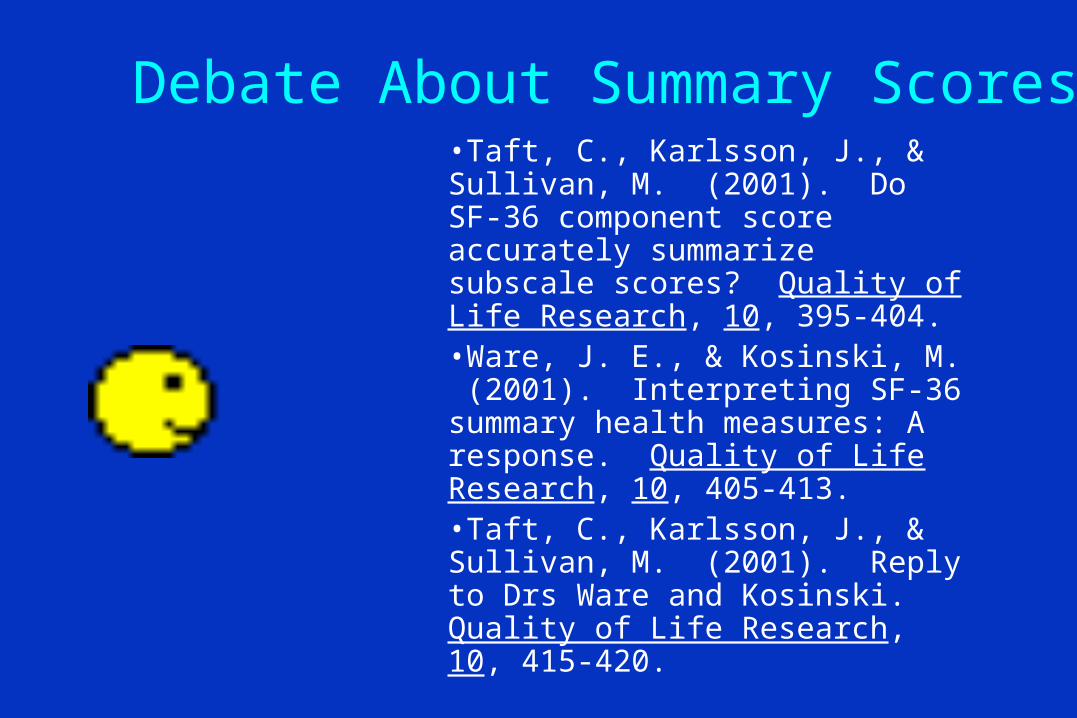
Debate About Summary Scores
•Taft, C., Karlsson, J., & Sullivan, M. (2001). Do SF-36 component score accurately summarize subscale scores? Quality of Life Research, 10, 395-404.•Ware, J. E., & Kosinski, M. (2001). Interpreting SF-36 summary health measures: A response. Quality of Life Research, 10, 405-413.•Taft, C., Karlsson, J., & Sullivan, M. (2001). Reply to Drs Ware and Kosinski. Quality of Life Research, 10, 415-420.
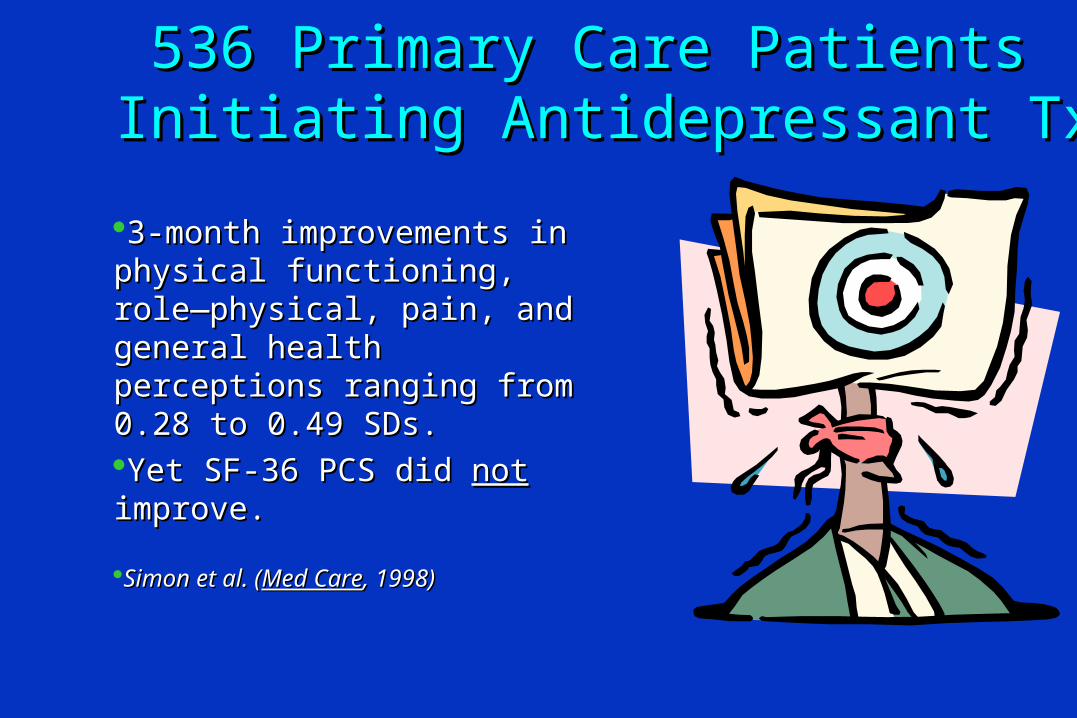
536 Primary Care Patients 536 Primary Care Patients Initiating Antidepressant TxInitiating Antidepressant Tx
3-month improvements in 3-month improvements in physical functioning, role—physical functioning, role—physical, pain, and general physical, pain, and general health perceptions ranging health perceptions ranging from 0.28 to 0.49 SDs.from 0.28 to 0.49 SDs.Yet SF-36 PCS did Yet SF-36 PCS did notnot improve.improve.
Simon et al. (Simon et al. (Med CareMed Care, 1998), 1998)
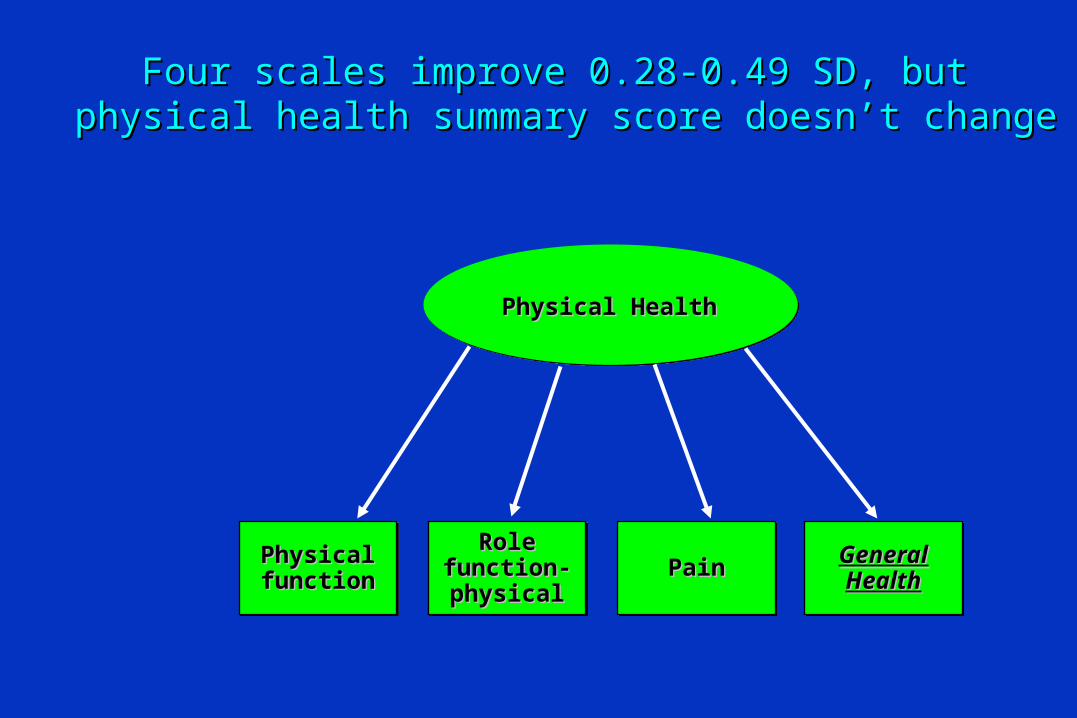
Physical HealthPhysical Health
Physical Physical functionfunctionPhysical Physical functionfunction
Role Role function-function-physicalphysical
Role Role function-function-physicalphysical
PainPainPainPain General General HealthHealth
General General HealthHealth
Four scales improve 0.28-0.49 SD, but physical Four scales improve 0.28-0.49 SD, but physical health summary score doesn’t changehealth summary score doesn’t change
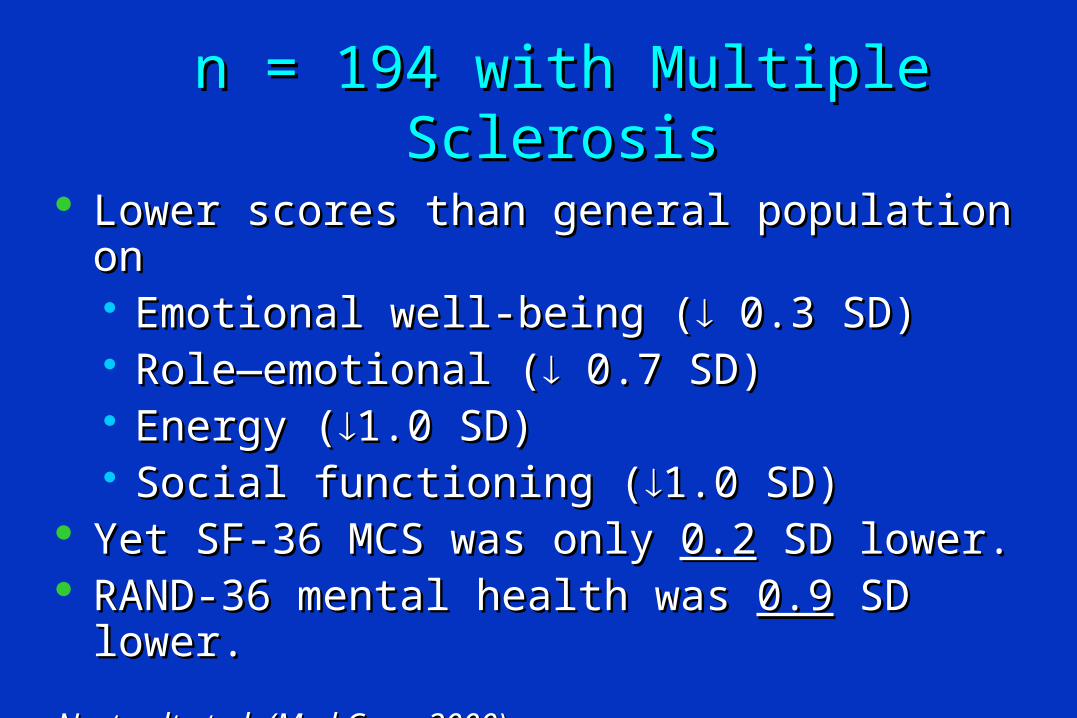
n = 194 with Multiple Sclerosisn = 194 with Multiple Sclerosis
Lower scores than general population on Lower scores than general population on Emotional well-being (Emotional well-being ( 0.3 SD) 0.3 SD) Role—emotional (Role—emotional ( 0.7 SD) 0.7 SD) Energy (Energy (1.0 SD)1.0 SD) Social functioning (Social functioning (1.0 SD) 1.0 SD)
Yet SF-36 MCS was only Yet SF-36 MCS was only 0.20.2 SD lower. SD lower. RAND-36 mental health was RAND-36 mental health was 0.90.9 SD lower. SD lower.
Nortvedt et al. (Nortvedt et al. (Med CareMed Care, 2000), 2000)
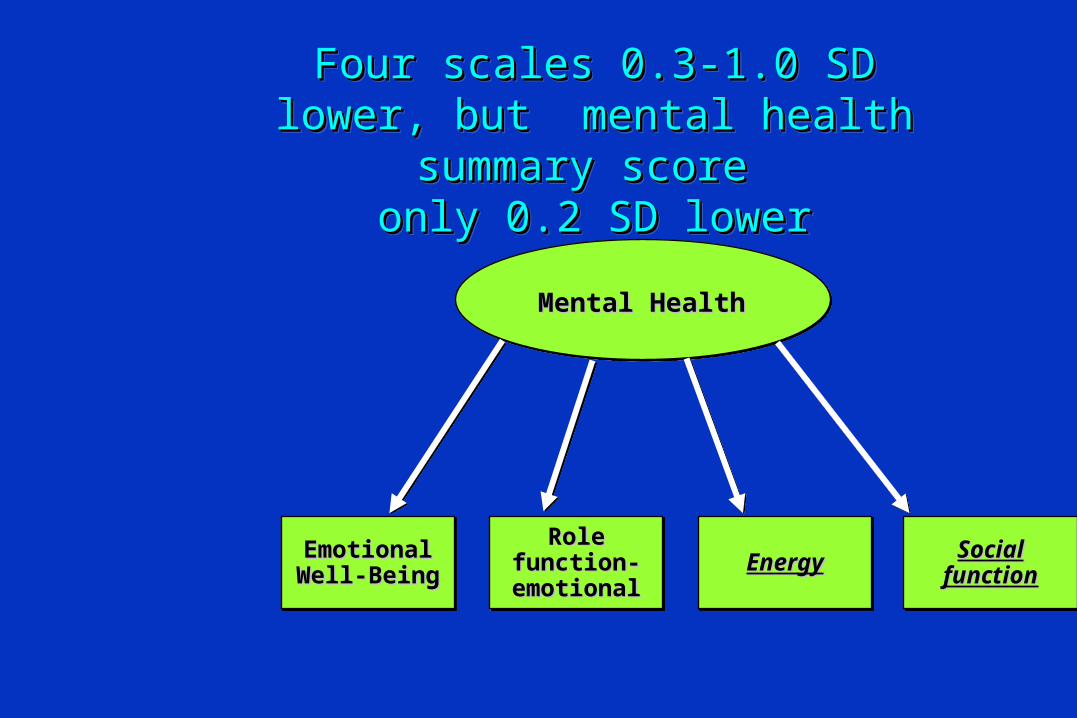
Mental HealthMental Health
Emotional Emotional Well-BeingWell-BeingEmotional Emotional Well-BeingWell-Being
Role Role function-function-emotionalemotional
Role Role function-function-emotionalemotional
EnergyEnergyEnergyEnergy Social Social functionfunctionSocial Social
functionfunction
Four scales 0.3-1.0 SD lower, but Four scales 0.3-1.0 SD lower, but mental health summary score mental health summary score
only 0.2 SD loweronly 0.2 SD lower
Four scales 0.3-1.0 SD lower, but Four scales 0.3-1.0 SD lower, but mental health summary score mental health summary score
only 0.2 SD loweronly 0.2 SD lower
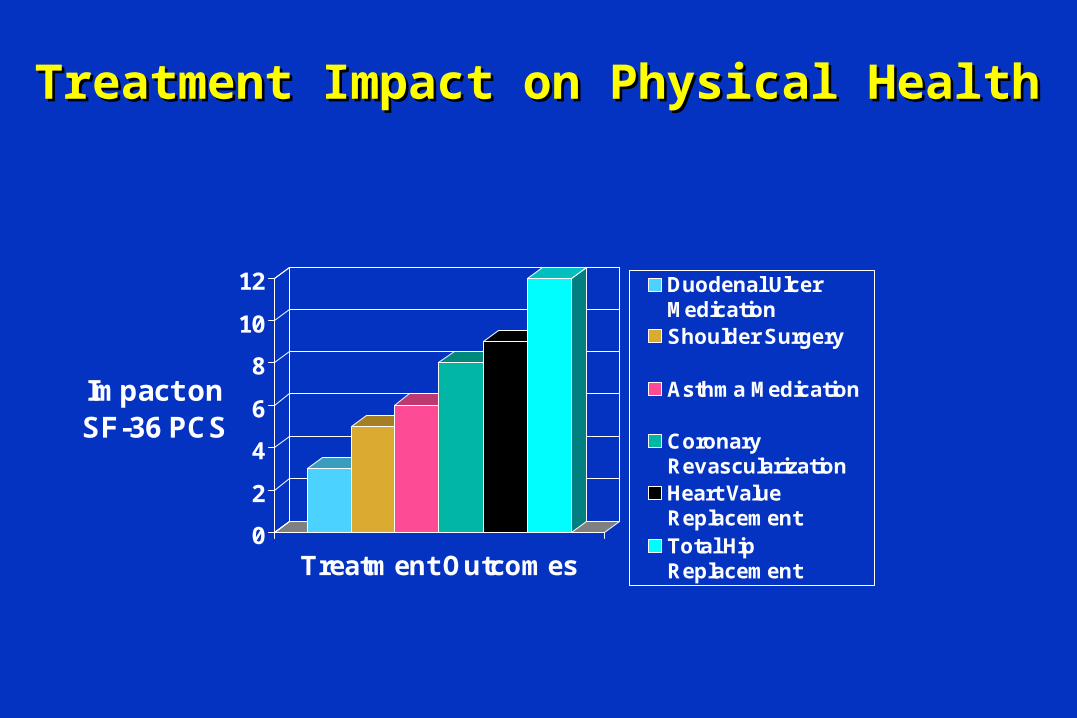
0
2
4
6
8
10
12
Impact on SF-36 PCS
Treatment Outcomes
Duodenal UlcerMedicationShoulder Surgery
Asthma Medication
CoronaryRevascularizationHeart ValueReplacementTotal HipReplacement
Treatment Impact on Physical HealthTreatment Impact on Physical Health
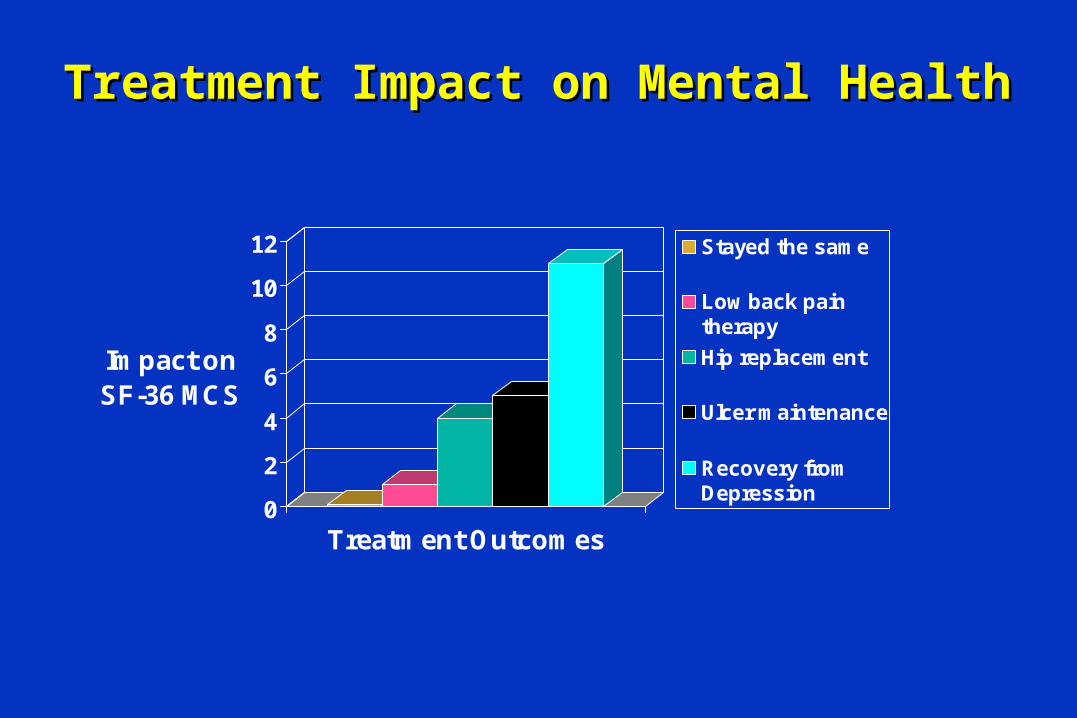
0
2
4
6
8
10
12
Impact on SF-36 MCS
Treatment Outcomes
Stayed the same
Low back paintherapy
Hip replacement
Ulcer maintenance
Recovery fromDepression
Treatment Impact on Mental HealthTreatment Impact on Mental Health
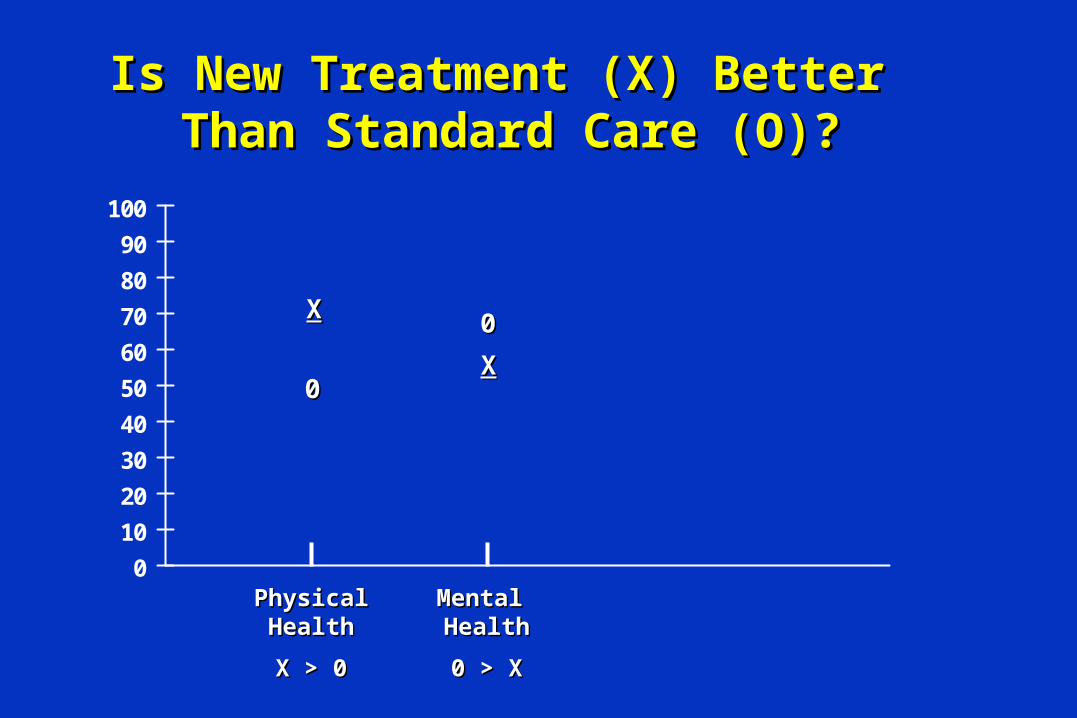
Is New Treatment (X) Better Is New Treatment (X) Better Than Standard Care (O)?Than Standard Care (O)?
0
10
20
30
40
50
60
70
80
90
100
XX
00XX
00
PhysicalPhysicalHealthHealth
X > 0X > 0
Mental Mental HealthHealth
0 > X0 > X
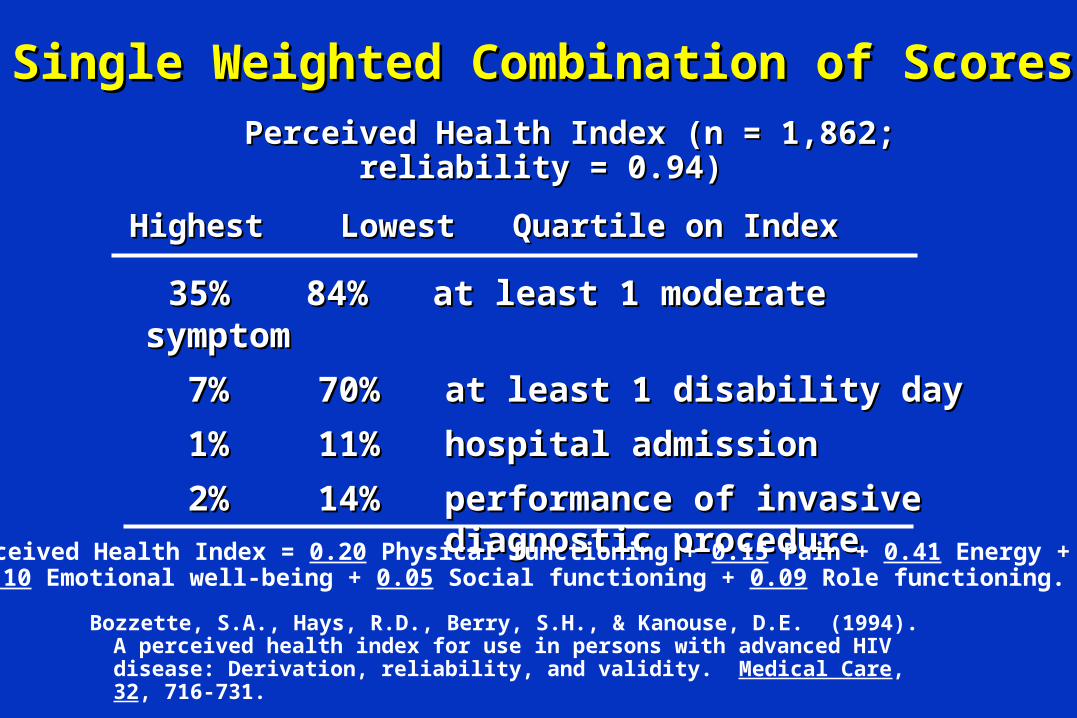
35%35% 84%84% at least 1 moderate symptomat least 1 moderate symptom
7%7% 70%70% at least 1 disability dayat least 1 disability day
1%1% 11%11% hospital admissionhospital admission
2%2% 14%14% performance of invasiveperformance of invasivediagnostic procedurediagnostic procedure
Perceived Health Index (n = 1,862; reliability = 0.94)Perceived Health Index (n = 1,862; reliability = 0.94)
Highest Lowest Quartile on Index Highest Lowest Quartile on Index
Perceived Health Index = 0.20 Physical functioning + 0.15 Pain + 0.41 Energy +0.10 Emotional well-being + 0.05 Social functioning + 0.09 Role functioning.
Bozzette, S.A., Hays, R.D., Berry, S.H., & Kanouse, D.E. (1994). A perceived health index for use in persons with advanced HIV disease: Derivation, reliability, and validity. Medical Care, 32, 716-731.
Single Weighted Combination of ScoresSingle Weighted Combination of Scores
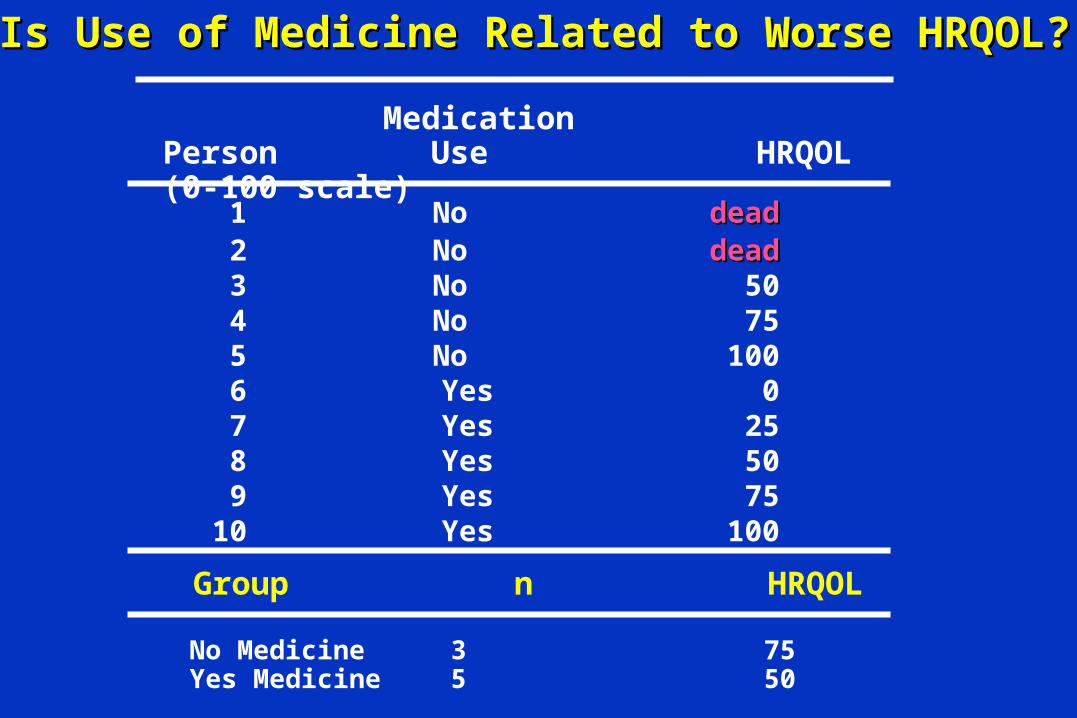
Is Use of Medicine Related to Worse HRQOL?Is Use of Medicine Related to Worse HRQOL?
1 No deaddead2 No deaddead
3 No 50 4 No 75 5 No 100 6 Yes 0 7 Yes 25 8 Yes 50 9 Yes 75 10 Yes 100
MedicationPerson Use HRQOL (0-100 scale)
No Medicine 3 75Yes Medicine 5 50
Group n HRQOL
Marathoner 1.0Marathoner 1.0
Person in coma 1.0Person in coma 1.0
Survival Analysis
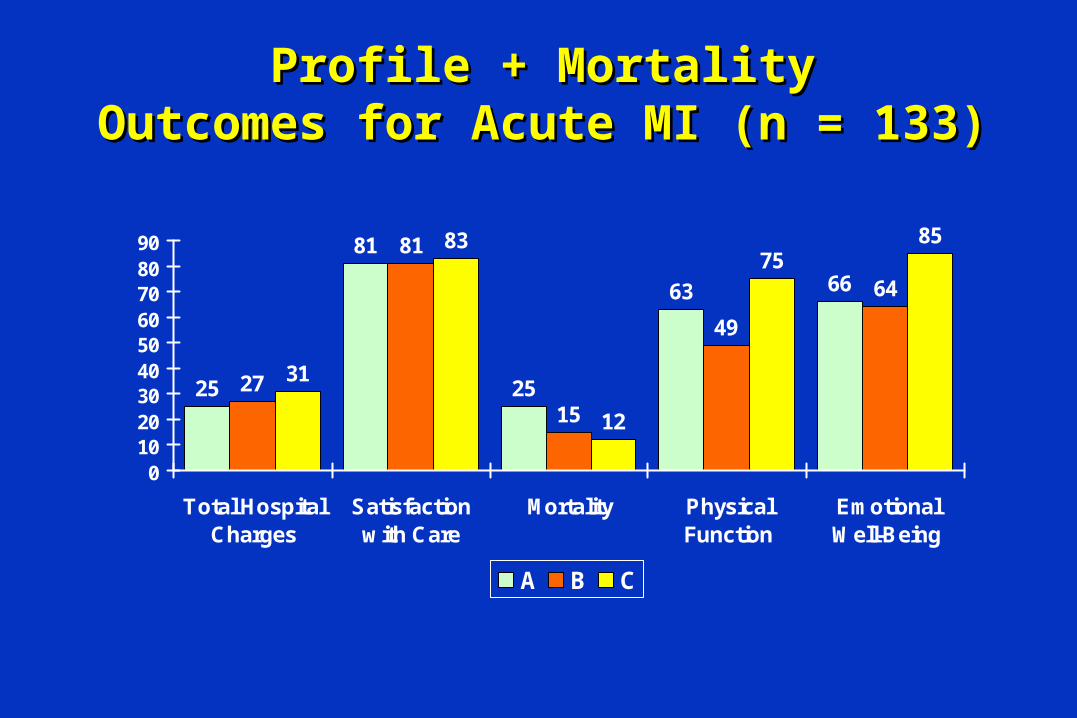
Profile + MortalityProfile + MortalityOutcomes for Acute MI (n = 133)Outcomes for Acute MI (n = 133)
25
81
25
63 66
27
81
15
49
64
31
83
12
7585
0102030405060708090
Total HospitalCharges
Satisfactionwith Care
Mortality PhysicalFunction
EmotionalWell-Being
A B C
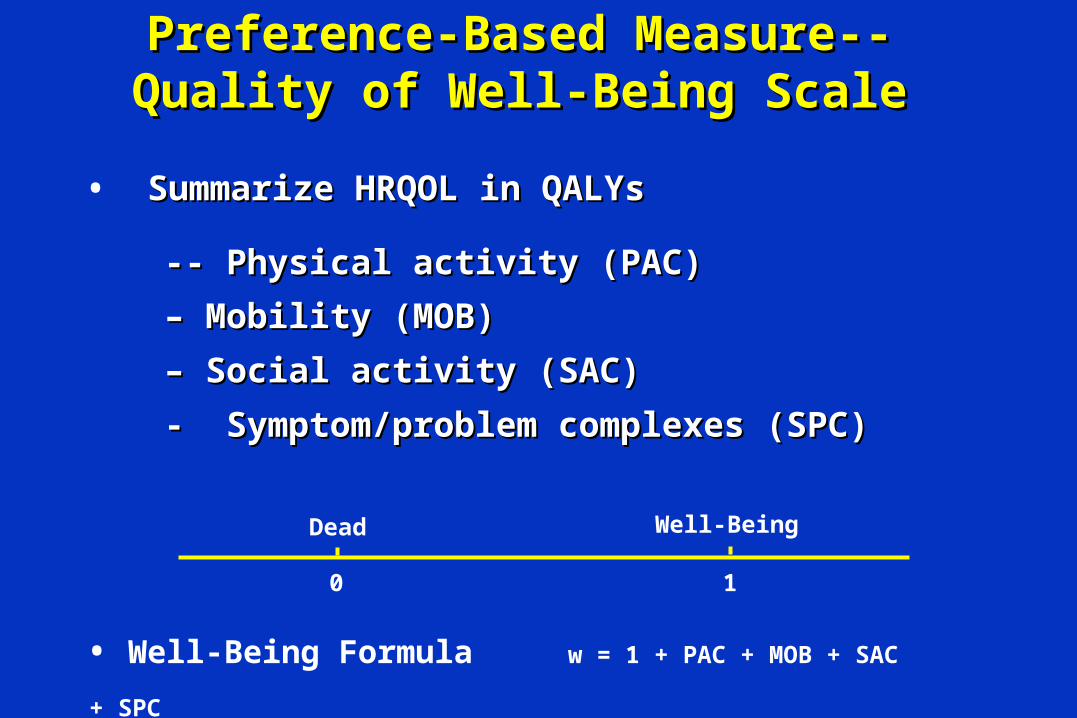
• Summarize HRQOL in QALYsSummarize HRQOL in QALYs
-- Physical activity (PAC)-- Physical activity (PAC)
– – Mobility (MOB)Mobility (MOB)
– – Social activity (SAC)Social activity (SAC)
- Symptom/problem complexes (SPC)- Symptom/problem complexes (SPC)
• Well-Being Formula w = 1 + PAC + MOB + SAC + SPC
Preference-Based Measure--Preference-Based Measure--Quality of Well-Being ScaleQuality of Well-Being Scale
Dead Well-Being
0 1
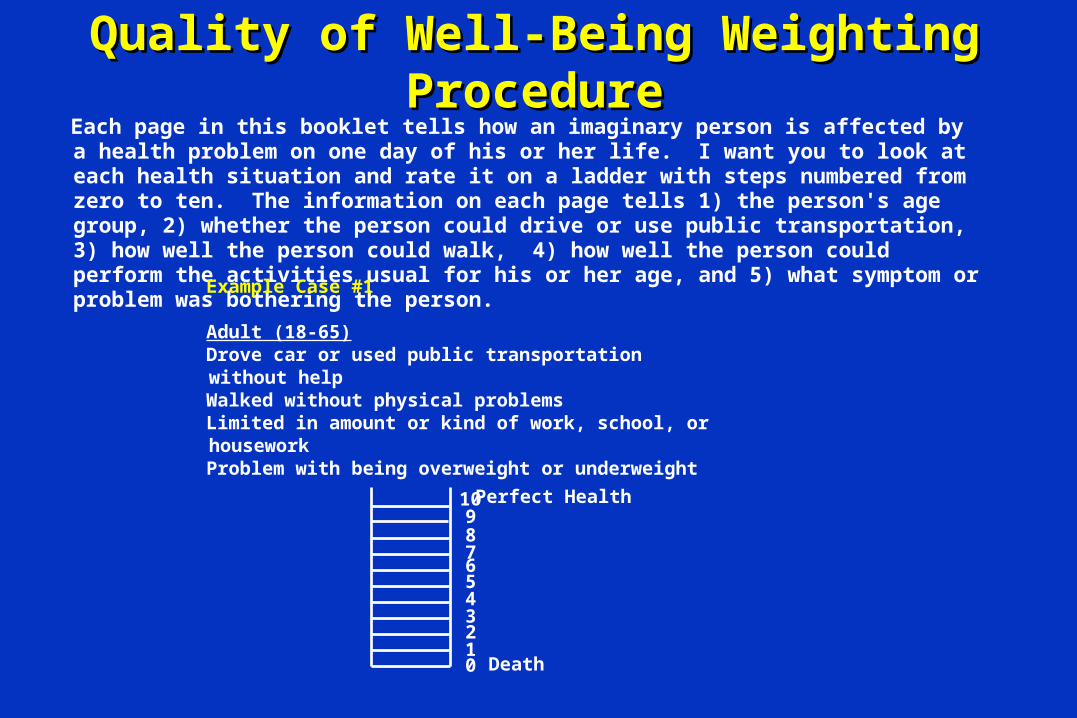
Each page in this booklet tells how an imaginary person is affected by a health problem on one day of his or her life. I want you to look at each health situation and rate it on a ladder with steps numbered from zero to ten. The information on each page tells 1) the person's age group, 2) whether the person could drive or use public transportation, 3) how well the person could walk, 4) how well the person could perform the activities usual for his or her age, and 5) what symptom or problem was bothering the person.
Example Case #1
Adult (18-65)Drove car or used public transportation without helpWalked without physical problemsLimited in amount or kind of work, school, or houseworkProblem with being overweight or underweight
Quality of Well-Being Weighting Quality of Well-Being Weighting ProcedureProcedure
012
43
5
78
6
910 Perfect Health
Death
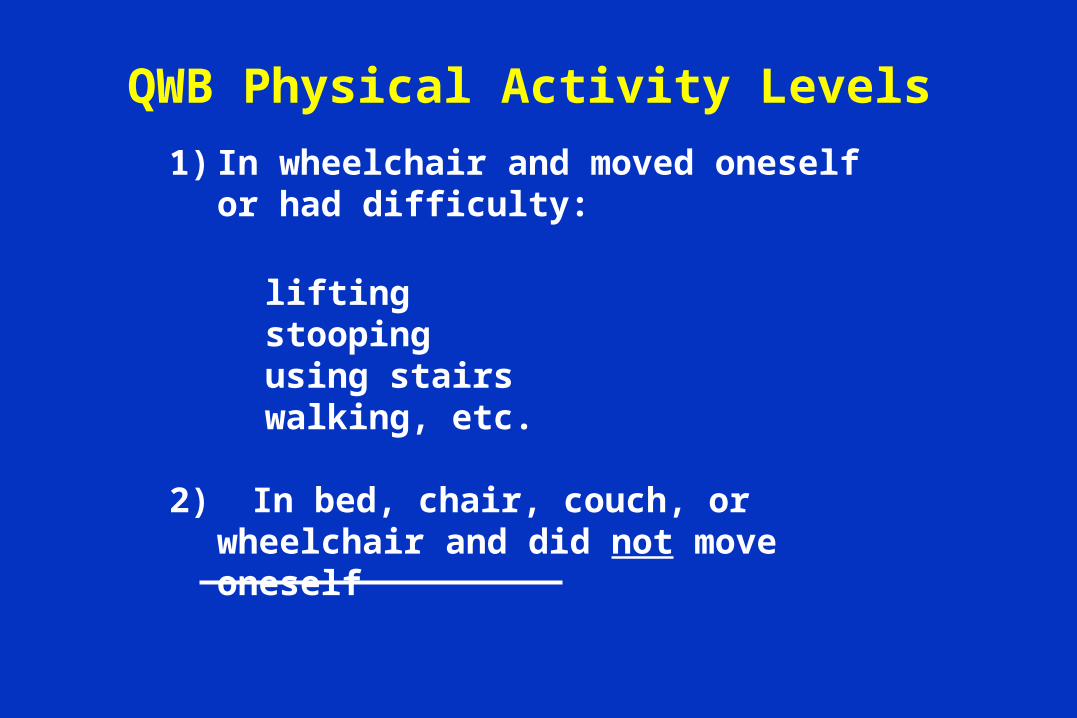
1) In wheelchair and moved oneself or had difficulty:
liftingstoopingusing stairswalking, etc.
2) In bed, chair, couch, or wheelchair and did not move oneself
QWB Physical Activity Levels
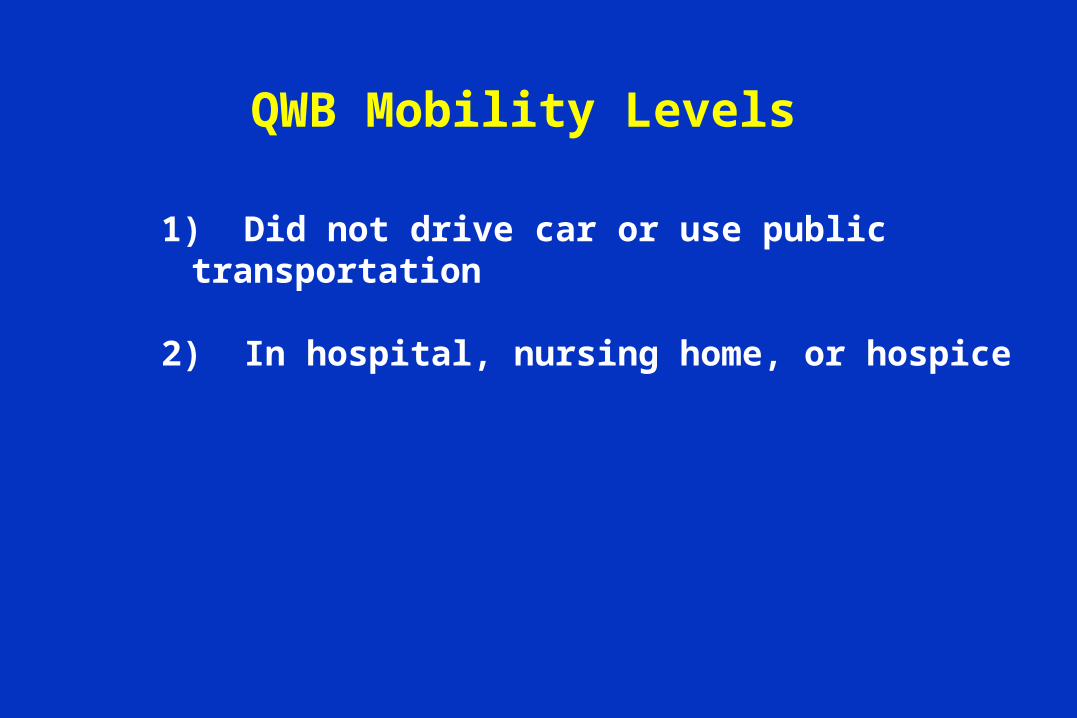
1) Did not drive car or use public transportation
2) In hospital, nursing home, or hospice
QWB Mobility Levels
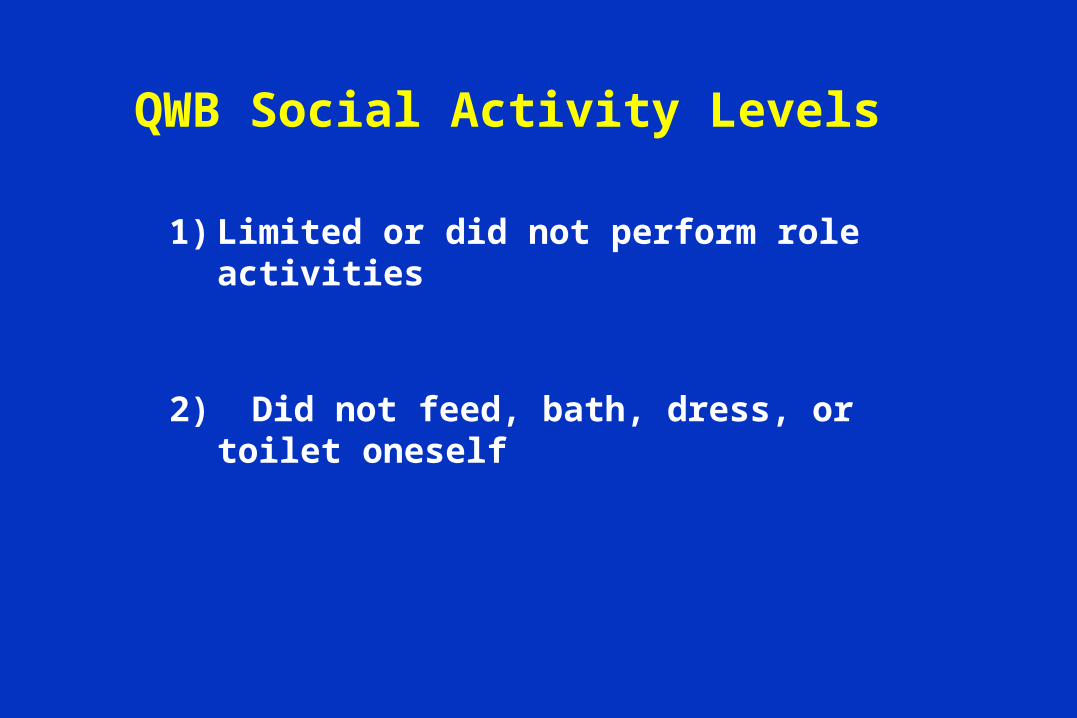
1) Limited or did not perform role activities
2) Did not feed, bath, dress, or toilet oneself
QWB Social Activity Levels
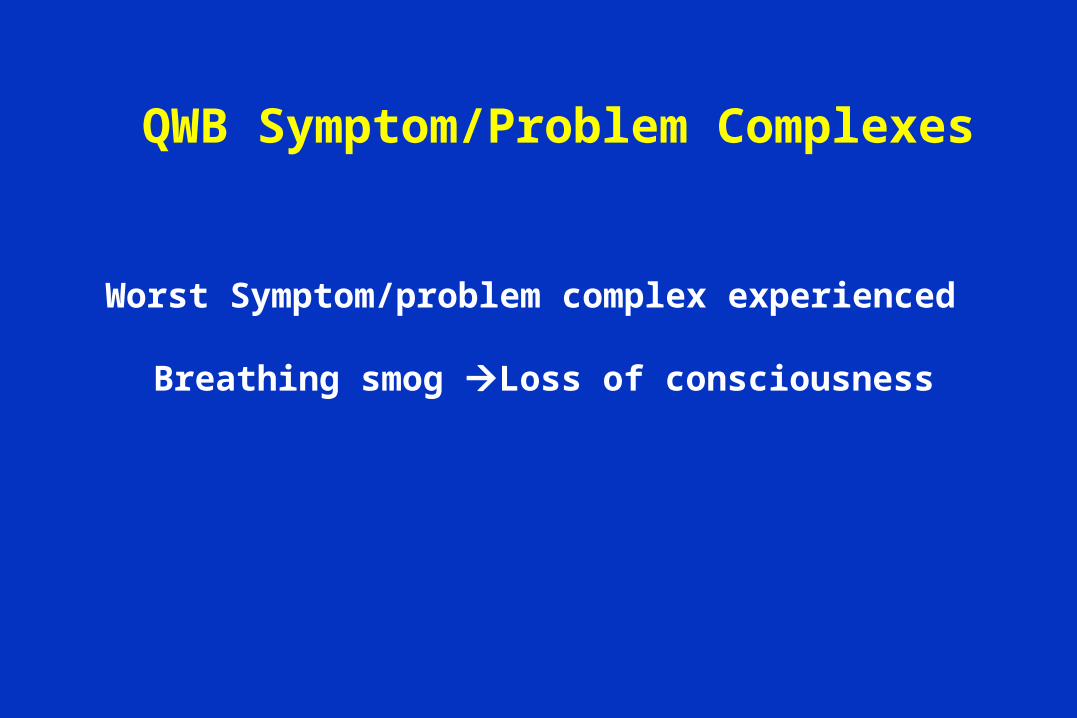
Worst Symptom/problem complex experienced
Breathing smog Loss of consciousness
QWB Symptom/Problem Complexes
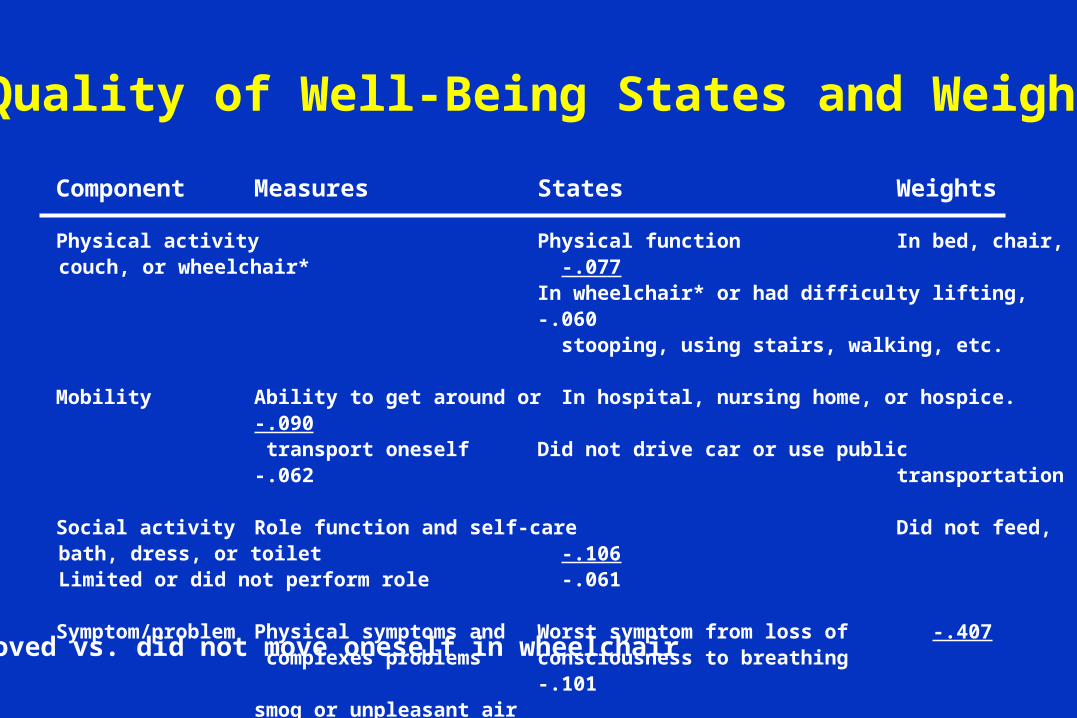
Component Measures States Weights
Physical activity Physical function In bed, chair, couch, or wheelchair* -.077In wheelchair* or had difficulty lifting, -.060
stooping, using stairs, walking, etc.
Mobility Ability to get around or In hospital, nursing home, or hospice. -.090 transport oneself Did not drive car or use public -.062
transportation
Social activity Role function and self-care Did not feed, bath, dress, or toilet -.106Limited or did not perform role -.061
Symptom/problem Physical symptoms and Worst symptom from loss of -.407 complexes problems consciousness to breathing -.101
smog or unpleasant air
* moved vs. did not move oneself in wheelchair
Quality of Well-Being States and Weights
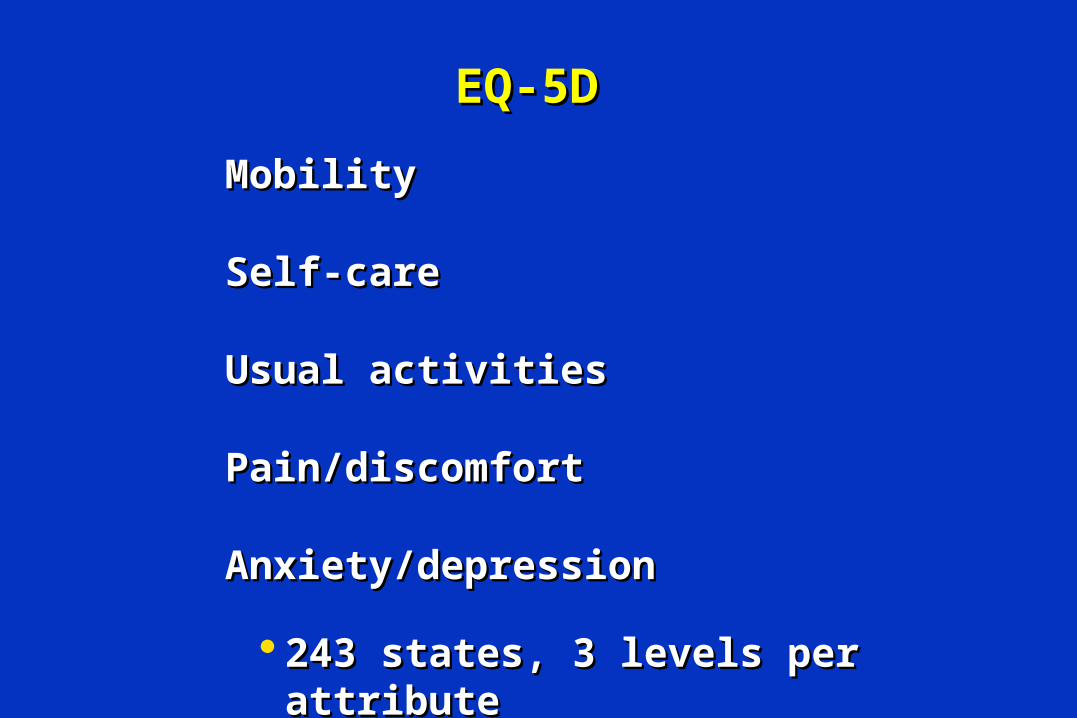
EQ-5DEQ-5D
MobilityMobility
Self-careSelf-care
Usual activitiesUsual activities
Pain/discomfortPain/discomfort
Anxiety/depressionAnxiety/depression
243 states, 3 levels per attribute243 states, 3 levels per attribute
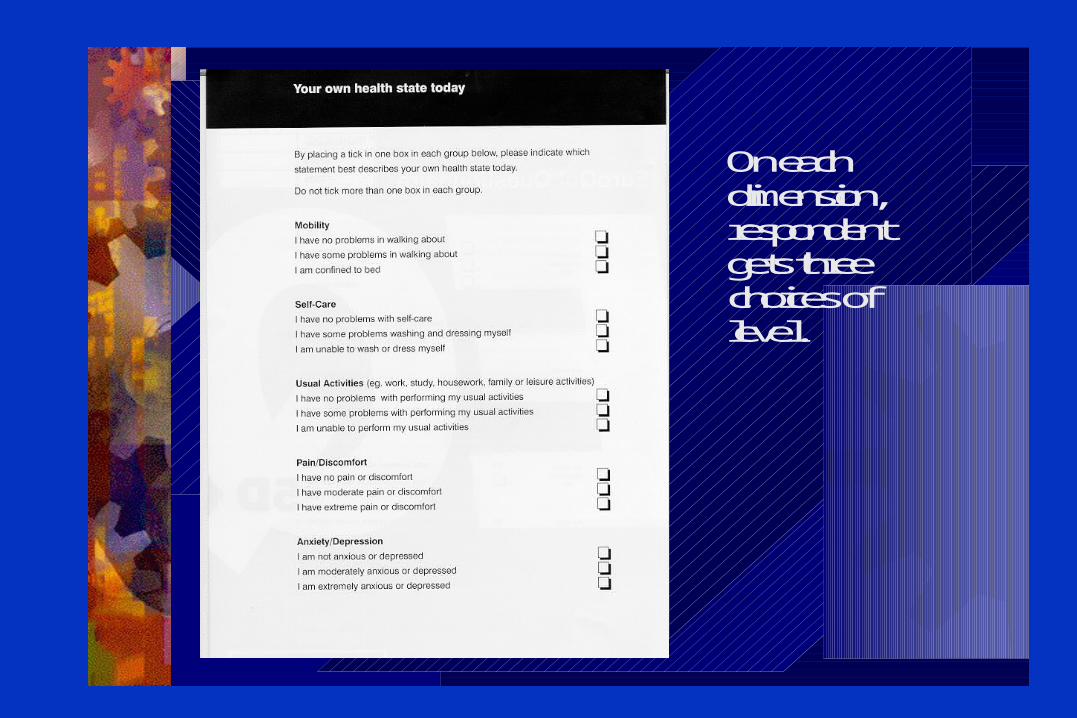
On each dimension, respondent gets three choices of level.
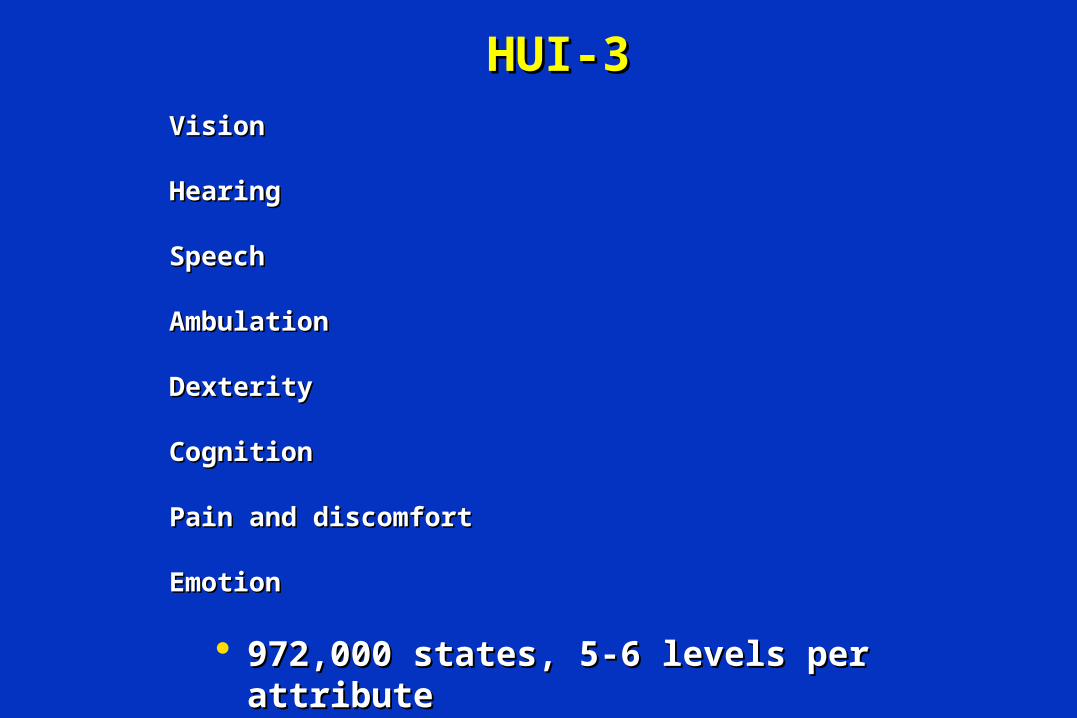
HUI-3HUI-3VisionVision
HearingHearing
SpeechSpeech
AmbulationAmbulation
DexterityDexterity
CognitionCognition
Pain and discomfortPain and discomfort
EmotionEmotion
972,000 states, 5-6 levels per attribute972,000 states, 5-6 levels per attribute
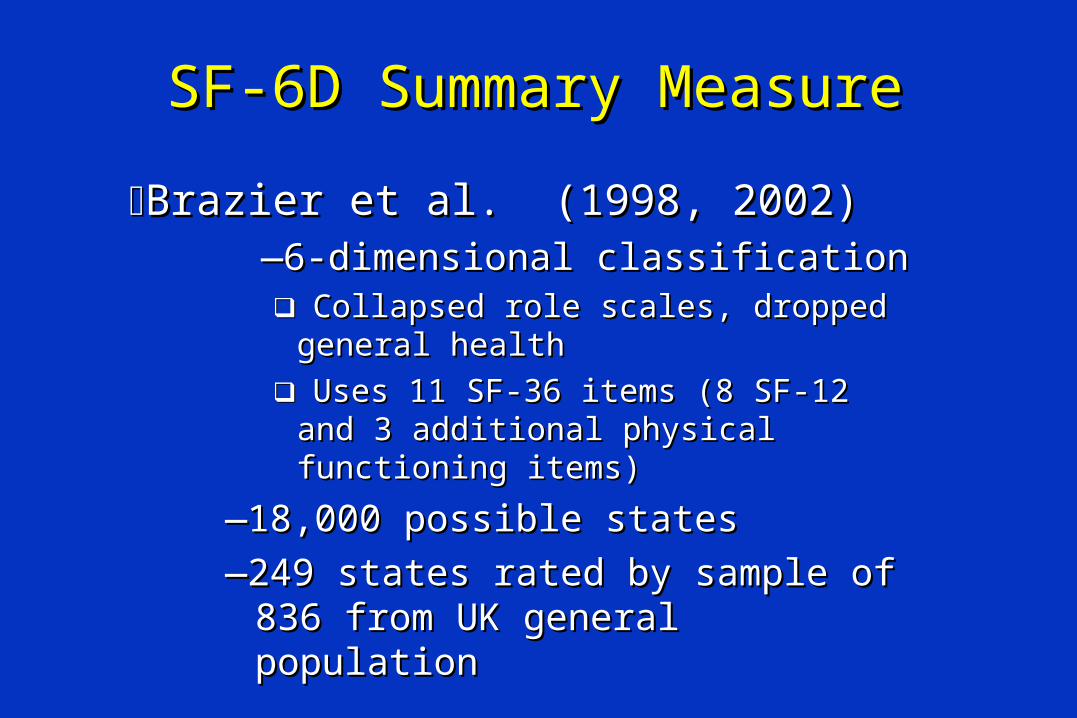
SF-6D Summary MeasureSF-6D Summary Measure
Brazier et al. (1998, 2002)Brazier et al. (1998, 2002)——6-dimensional classification6-dimensional classification Collapsed role scales, dropped Collapsed role scales, dropped
general healthgeneral health
Uses 11 SF-36 items (8 SF-12 and 3 Uses 11 SF-36 items (8 SF-12 and 3 additional physical functioning items)additional physical functioning items)
——18,000 possible states18,000 possible states
——249 states rated by sample of 836 249 states rated by sample of 836 from UK general populationfrom UK general population
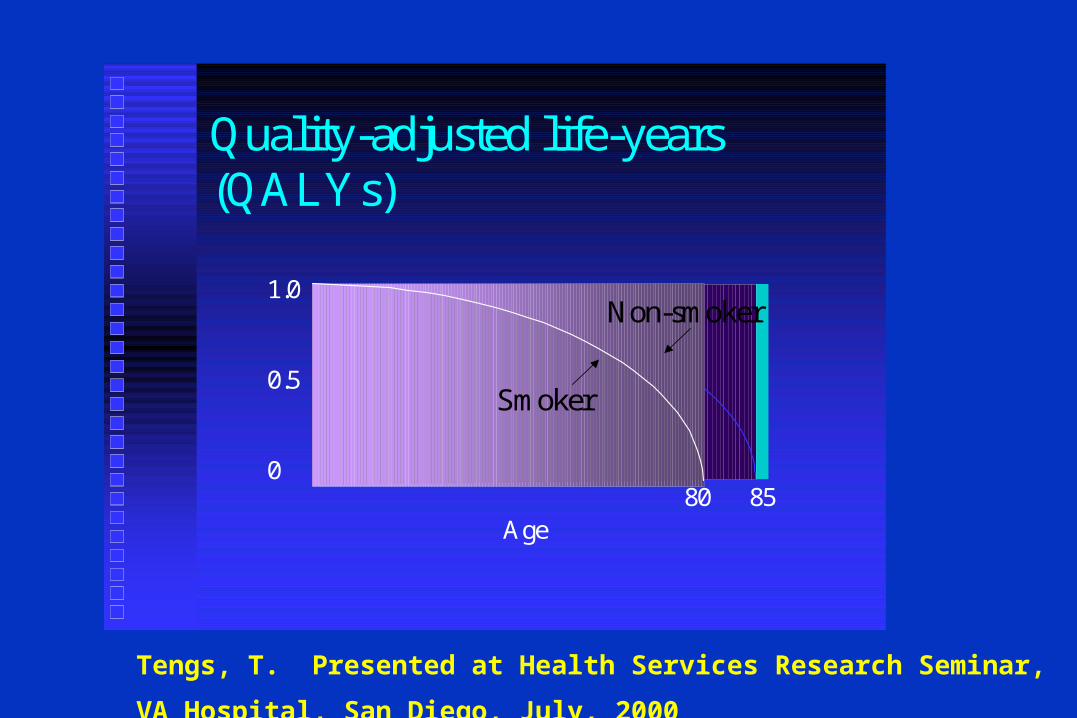
Quality-adjusted life-years (QALYs)
1.0
0.5
0
Age80 85
Smoker
Non-smoker
Tengs, T. Presented at Health Services Research Seminar,
VA Hospital, San Diego, July, 2000
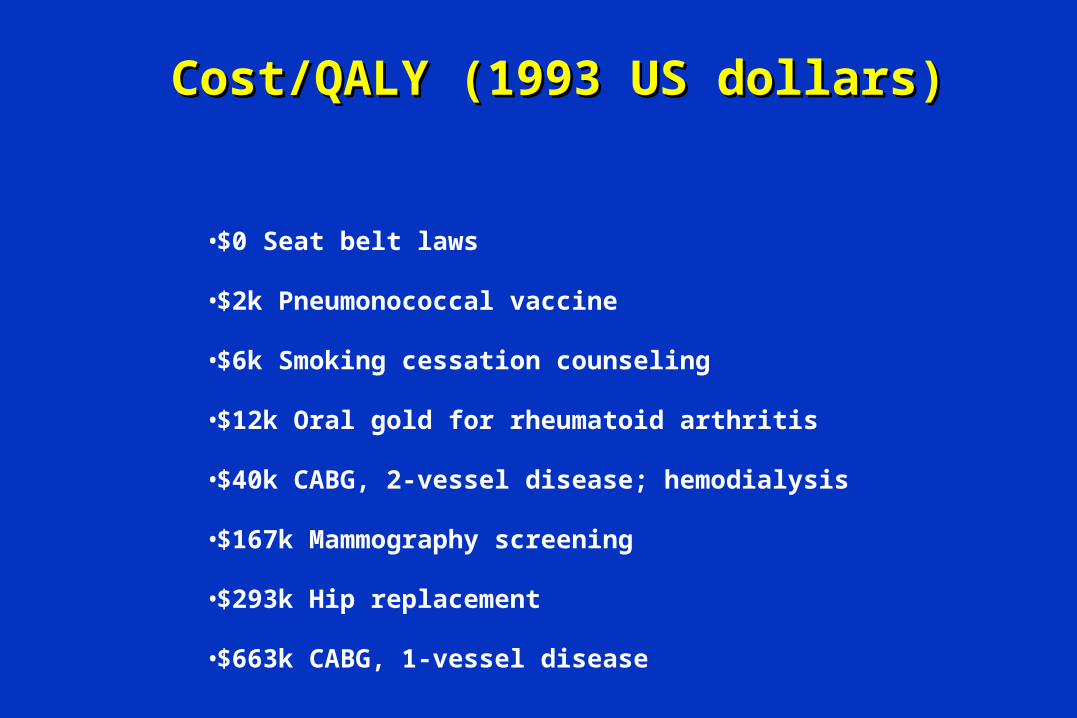
Cost/QALY (1993 US dollars)Cost/QALY (1993 US dollars)
•$0 Seat belt laws
•$2k Pneumonococcal vaccine
•$6k Smoking cessation counseling
•$12k Oral gold for rheumatoid arthritis
•$40k CABG, 2-vessel disease; hemodialysis
•$167k Mammography screening
•$293k Hip replacement
•$663k CABG, 1-vessel disease
Questions?
www.rand.org/health/surveys.html
http://gim.med.ucla.edu/FacultyPages/Hays/
Next Week’s Reading
Hays, R. D., Anderson, R. T., & Revicki, D. (1998). Assessing reliability and validity of measurement in clinical trials. In M. Staquet, R. Hays, & P. Fayers (eds.), Quality of Life Assessment in Clinical Trials: Methods and Practice (pp. 169-182). Oxford: Oxford University Press.
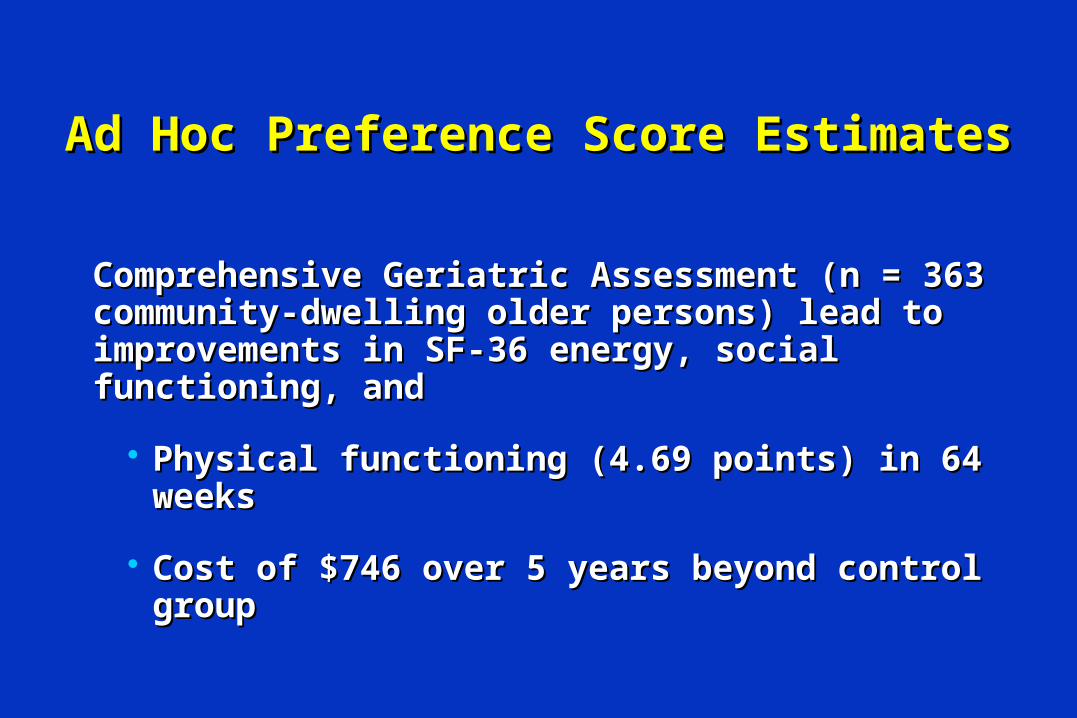
Ad Hoc Preference Score EstimatesAd Hoc Preference Score Estimates
Comprehensive Geriatric Assessment (n = 363 Comprehensive Geriatric Assessment (n = 363 community-dwelling older persons) lead to community-dwelling older persons) lead to improvements in SF-36 energy, social functioning, improvements in SF-36 energy, social functioning, andand
Physical functioning (4.69 points) in 64 weeksPhysical functioning (4.69 points) in 64 weeks
Cost of $746 over 5 years beyond control groupCost of $746 over 5 years beyond control group
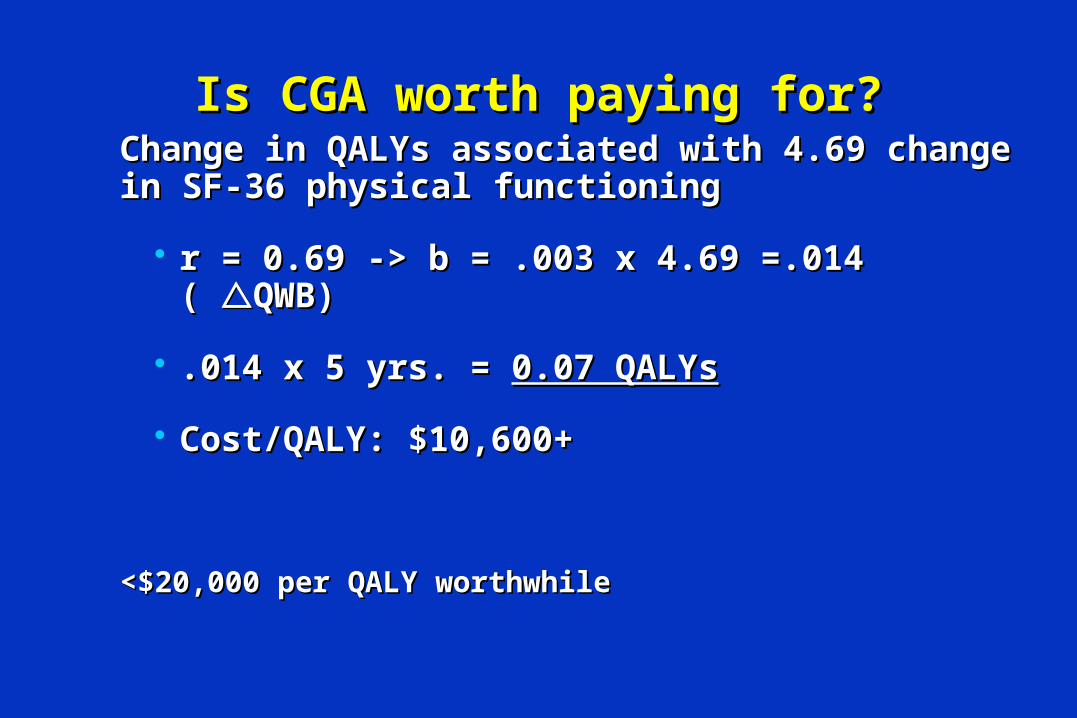
Is CGA worth paying for?Is CGA worth paying for?
Change in QALYs associated with 4.69 change in SF-Change in QALYs associated with 4.69 change in SF-36 physical functioning36 physical functioning
r = 0.69 -> b = .003 x 4.69 =.014 ( r = 0.69 -> b = .003 x 4.69 =.014 ( QWB)QWB)
.014 x 5 yrs. = .014 x 5 yrs. = 0.07 QALYs0.07 QALYs
Cost/QALY: $10,600+Cost/QALY: $10,600+
<$20,000 per QALY worthwhile<$20,000 per QALY worthwhile
Limitations of Preference Measures
Complexity of task
Coarseness of health states
Sensitivity to method of elicitation
• Choice between two certain outcomes
• Years of life traded for quality of life
• Simple to administer alternative to SG
Time Tradeoff (TTO)
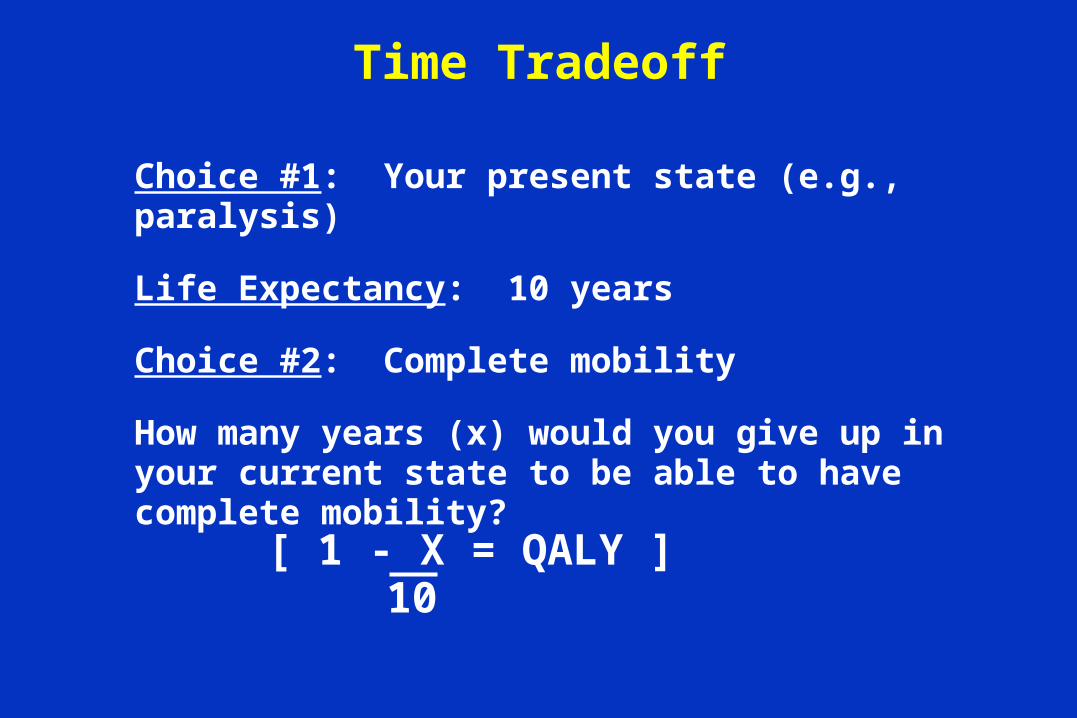
Choice #1: Your present state (e.g., paralysis)
Life Expectancy: 10 years
Choice #2: Complete mobility
How many years (x) would you give up in your current state to be able to have complete mobility?
[ 1 - X = QALY ]10
Time Tradeoff
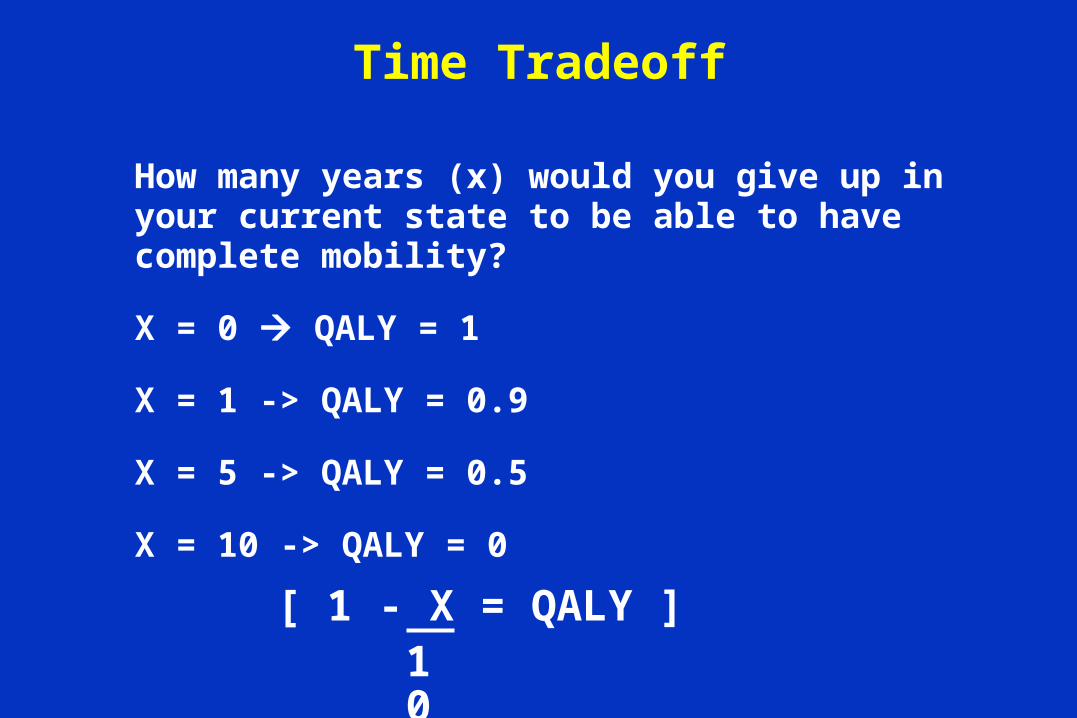
How many years (x) would you give up in your current state to be able to have complete mobility?
X = 0 QALY = 1
X = 1 -> QALY = 0.9
X = 5 -> QALY = 0.5
X = 10 -> QALY = 0
[ 1 - X = QALY ]10
Time Tradeoff
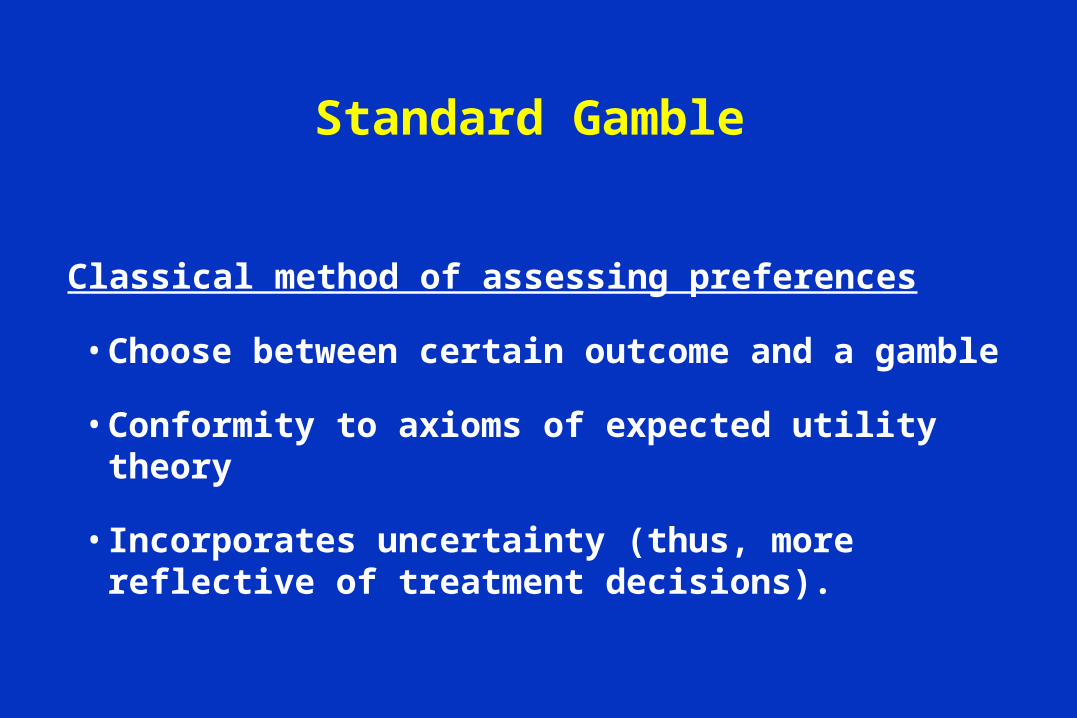
Classical method of assessing preferences
• Choose between certain outcome and a gamble
• Conformity to axioms of expected utility theory
• Incorporates uncertainty (thus, more reflective of treatment decisions).
Standard Gamble
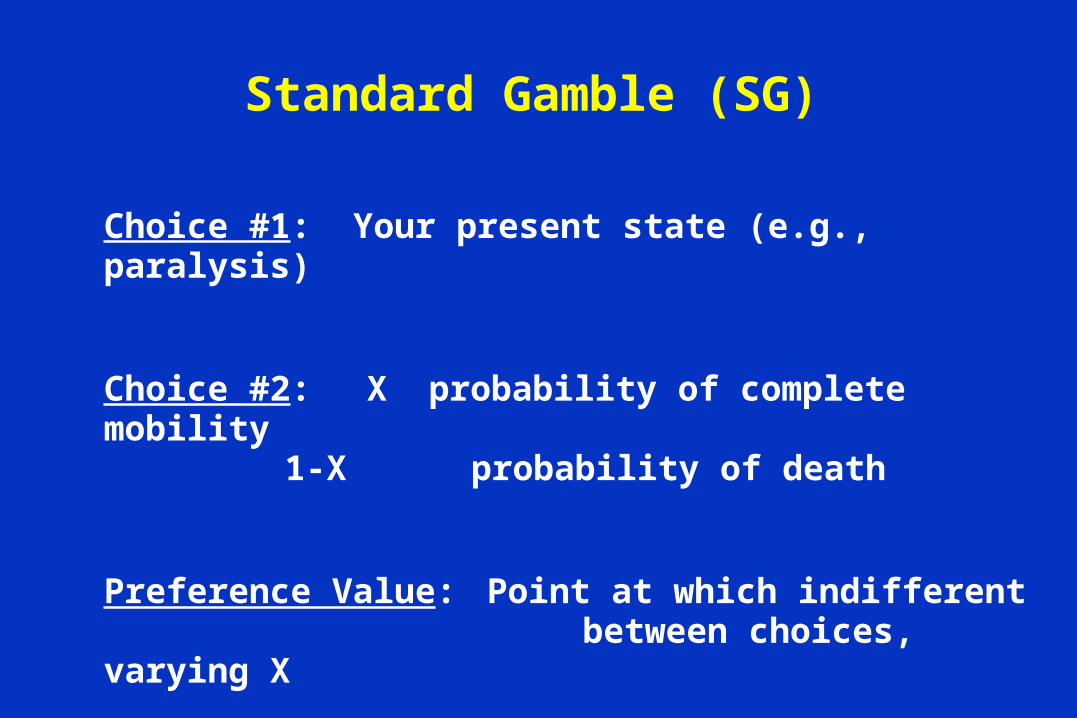
Choice #1: Your present state (e.g., paralysis)
Choice #2: X probability of complete mobility1-X probability of death
Preference Value: Point at which indifferent between choices, varying X
[ X = QALY ]
Standard Gamble (SG)
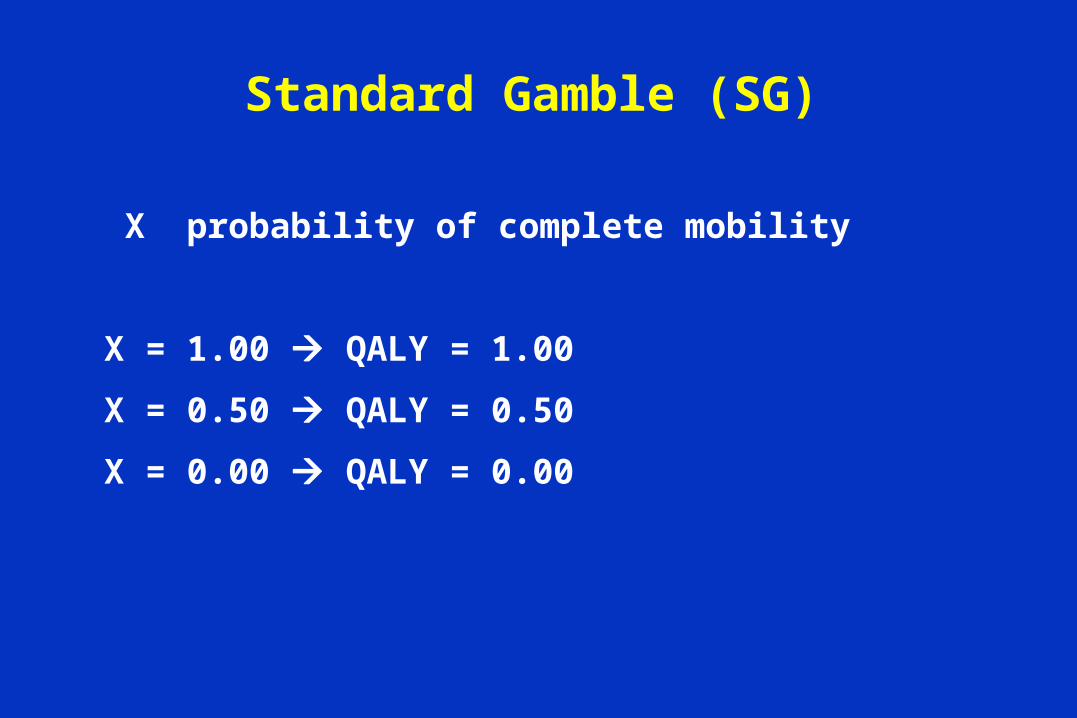
X probability of complete mobility
X = 1.00 QALY = 1.00
X = 0.50 QALY = 0.50
X = 0.00 QALY = 0.00
Standard Gamble (SG)
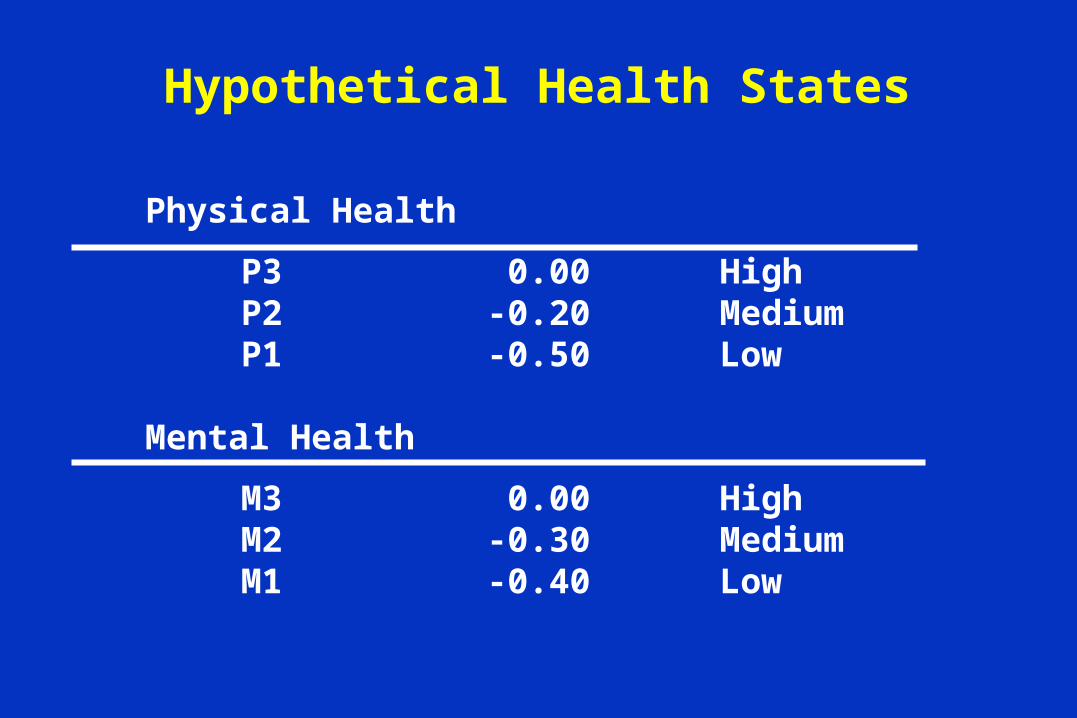
Physical Health
P3 0.00 High P2 -0.20 Medium P1 -0.50 Low
Mental Health
M3 0.00 High M2 -0.30 Medium M1 -0.40 Low
Hypothetical Health States
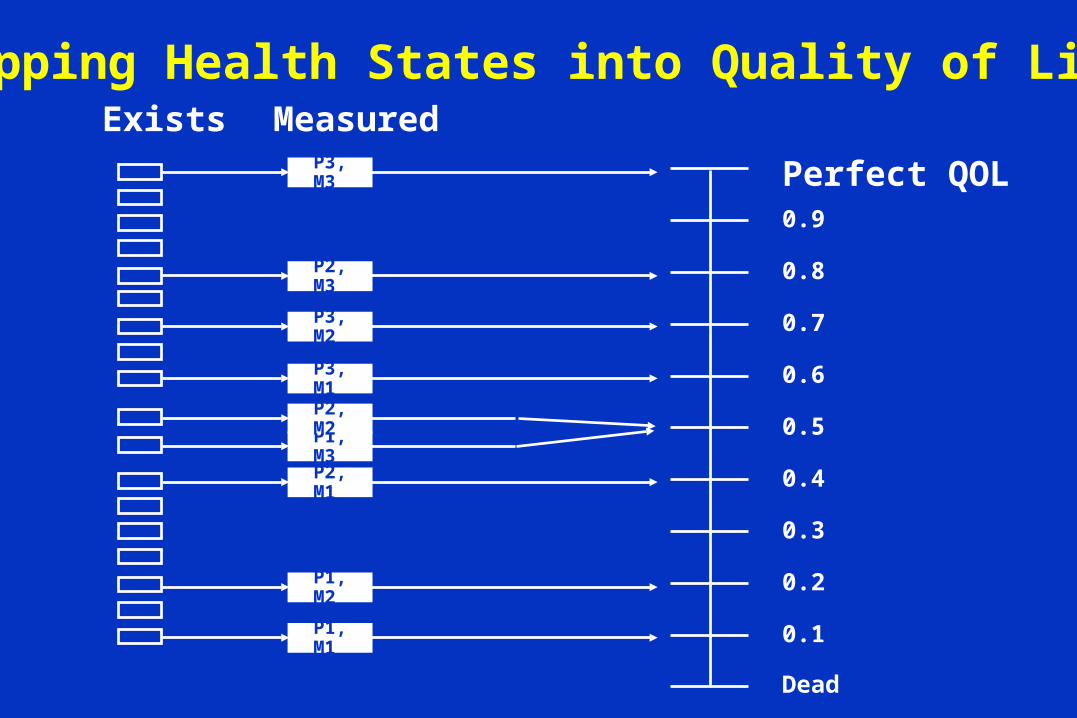
Perfect QOL
Dead
0.9
0.8
0.7
0.6
0.5
0.4
0.3
0.2
0.1
Exists MeasuredP3, M3
P2, M3
P3, M2
P3, M1
P1, M2
P1, M1
P1, M3
P2, M2
P2, M1
Mapping Health States into Quality of Life