copyright 2012 national council on compensation insurance, inc. all rights reserved. texas biennial...
TRANSCRIPT

Copyright 2012 National Council on Compensation Insurance, Inc. All rights reserved.
Texas Biennial Hearing
December 17, 2012
[email protected] [email protected] 561-893-3781

Copyright 2012 National Council on Compensation Insurance, Inc. All rights reserved.
2
Statistical Agent Services
• Collection and validation of various types of data
• Summarizing data and providing reports to TDI
Advisory Organization Services
• Production of experience rating modifications
• Third loss cost filing is pending
Proof of Coverage Vendor
• Supply policy transaction information to TDI
NCCI’s Role in Texas

Copyright 2012 National Council on Compensation Insurance, Inc. All rights reserved.
3
State of the Industry Countrywide
Vs. Texas

Copyright 2012 National Council on Compensation Insurance, Inc. All rights reserved.
4
Countrywide Workers Compensation Premium—First Increase in Years
Net Written Premium
1990 1991 1992 1993 1994 1995 1996 1997 1998 1999 2000 2001 2002 2003 2004 2005 2006 2007 2008 2009 2010 20110
10
20
30
40
50
31.0 31.3 29.8 30.5 29.126.3 25.2 24.2 23.3 22.3
25.0 26.129.2 31.1
34.737.8 38.6 37.6
33.830.3 29.9 32.2
31.0 31.329.8 30.5
29.126.3
28.427.0 25.9 25.0
28.6
32.1
37.7
42.3
46.547.8
46.544.3
39.3
34.6 33.836.3
State Funds ($ B)Private Carriers ($ B)
$ Billions
Calendar YearSource: 1990–2010 Private Carriers, Annual Statement Data; 2011, NCCI
1996–2011 State Funds: AZ, CA, CO, HI, ID, KY, LA, MD, MO, MT, NM, OK, OR, RI, TX, UT Annual StatementsState Funds available for 1996 and subsequent
Copyright 2012 National Council on Compensation Insurance, Inc. All rights reserved.
5
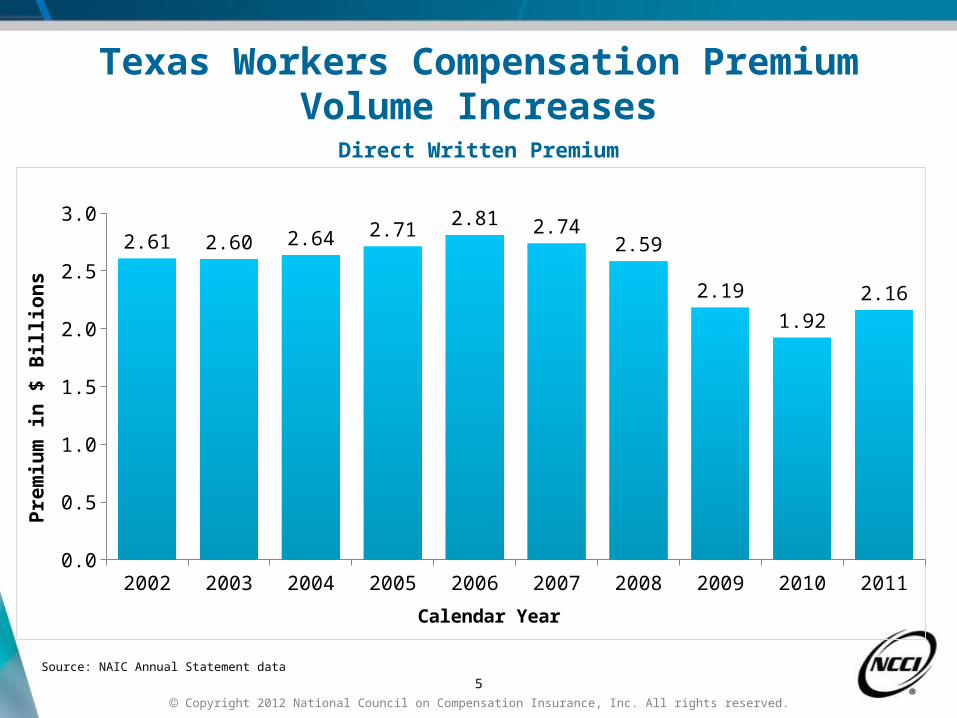
2002 2003 2004 2005 2006 2007 2008 2009 2010 20110.0
0.5
1.0
1.5
2.0
2.5
3.0
2.61 2.60 2.64 2.712.81 2.74
2.59
2.19
1.922.16
Calendar Year
Pre
miu
m i
n $
Bil
lio
ns
Texas Workers Compensation Premium Volume Increases
Direct Written Premium
Source: NAIC Annual Statement data

Copyright 2012 National Council on Compensation Insurance, Inc. All rights reserved.
6
2002 2003 2004 2005 2006 2007 2008 2009 2010 201180
90
100
110
120
130
111110
107
103
93
101 101
110
115 115
106
97
8887 86
98
104
109
116114
Calendar Year Accident Year
Countrywide Accident Year Net Combined Ratio
Workers Compensation Calendar Year vs. Ultimate Accident Year Private Carriers
Accident Year data is evaluated as of 12/31/2011 and developed to ultimateSource: Calendar Years 2002–2011, Annual Statement Data;
Ultimate Accident Years 2001–2011, NCCI analysis based on Annual Statement DataIncludes dividends to policyholders
Percent

Copyright 2012 National Council on Compensation Insurance, Inc. All rights reserved.
7
Texas Accident Year Combined Ratios
2011 2010 2009 2008 200760%
80%
100%
94.3%93.1%
82.0%
84.7%
75.1%
Accident Year
Co
mb
ined
Rat
io
Sources: NCCI financial data, NAIC Annual Statement data

Copyright 2012 National Council on Compensation Insurance, Inc. All rights reserved.
8
TX WV DC AR AK MO SD KS, VT
AL, VA
HI ME, MT, NM
ID, NV
OK NC GA, NE, TN
NH IN UT IL, IA
SC FL KY, MS, RI
LA MD AZ CO, CT
OR0
20
40
60
80
100
120
140
160
180
93
165
Results Vary From State to State
Accident Year 2010 Combined Ratios
Data is evaluated as of 12/31/2010

Copyright 2012 National Council on Compensation Insurance, Inc. All rights reserved.
9
ND IN AR VA DC NV UT MA CO MS KS WV OR TX AZ MO HI MD NE MI WY DE FL OH NM GA IA NC SD KY AL RI ID TN MN SC LA VT WA WI PA ME NH MT NJ OK NY IL CA CT AK0.0
1.0
2.0
3.0
4.0
5.0
6.0
1.02
1.60
3.01
Workers Compensation Premium Rate Ranking
Premium Rate Index per $100 of Payroll
Source: 2012 Oregon Workers’ Compensation Premium Rate Ranking SummaryIndexes based on rates in effect on January 1, 2012
TX Ranking14th (out of 51).

$0.31 - $1.04
$1.05 - $1.26
$1.27 - $1.49
$1.50 - $2.56
Not included
Countrywide = $1.14Based on the latest NCCI approved rates and loss costs in the various states.
Texas = $0.66
DC
OH
NM
MI
NC
MN
WI
IL
MO
IN
OR
KS
NE
ID
AL
CA
LA
KY
TX
AZ
VA
FL
MS
SCAR
GA
TN
IA
COUT
OK
OK
WA
WV
NDME
AK
SD
NV
PA
NY
MT
MDDE
NJCT
RI
MA
VTNH
HI
WY
Average Voluntary Pure Loss Costs Quartiles

NCCI’s Loss Cost Filings in Texas
11
2012 National Council on Compensation Insurance, Inc. All rights reserved.
•Initial Filing
6/1/2011
•Decrease of 0.3%
6/1/2012
•Decrease of 3.8%
6/1/2013*
* Filing is pending

$0.53 - $0.78
$0.79 - $0.97
$0.98 - $1.06
$1.07 - $1.56
Not included
Countrywide = $0.94Based on the latest NCCI approved rates and loss costs in the various states.
Texas = $0.66
DC
OH
NM
MI
NC
MN
WI
IL
MO
IN
OR
KS
NE
ID
AL
CA
LA
KY
TX
AZ
VA
FL
MS
SCAR
GA
TN
IA
COUT
OK
OK
WA
WV
NDME
AK
SD
NV
PA
NY
MT
MDDE
NJCT
RI
MA
VTNH
HI
WY
Average Voluntary Pure Loss Costs Quartiles Using Texas Payroll Distribution

Copyright 2012 National Council on Compensation Insurance, Inc. All rights reserved.
13
Countrywide vs. Texas Experience Rating
Source: Average Experience Rating Modifications produced by NCCI
2004 2005 2006 2007 2008 2009 2010 20110.76
0.80
0.84
0.88
0.92
0.96
1.00
0.898
0.865
0.8350.844
0.900 0.901 0.900
0.928
0.972 0.977 0.973 0.969 0.9690.978 0.983
0.985
Average Intrastate Mod
TX CW Rating Year
Mod
ifica
tion
Fact
or

Copyright 2012 National Council on Compensation Insurance, Inc. All rights reserved.
14
Countrywide vs. Texas Experience Rating
Source: Average Experience Rating Modifications produced by NCCI
2004 2005 2006 2007 2008 2009 2010 20110.76
0.80
0.84
0.88
0.92
0.96
1.00
0.896
0.865
0.8230.814
0.849 0.856 0.8610.871
0.958 0.9600.945
0.930 0.9330.941 0.947 0.943
Average Off-Balance Mod
TX CW Rating Year
Mod
ifica
tion
Fact
or

Copyright 2012 National Council on Compensation Insurance, Inc. All rights reserved.
15
5.8%
22.1%
32.0%
32.4%
7.6%
Region
Number of Texas Policies by Industry Group Compared with Countrywide/Region
6.2%
17.9%
43.5%
26.9%
5.5%
Texas
Manufacturing
5.7%
20.5%
35.4%
32.1%
6.2%
Countrywide
Regional states are AR, LA, NM, and OKCountrywide and Regional Averages do not include Texas.Based on NCCI’s Statistical Plan data
Contracting Office & Clerical Goods & Services Miscellaneous

Copyright 2012 National Council on Compensation Insurance, Inc. All rights reserved.
16
Claim Frequency

Copyright 2012 National Council on Compensation Insurance, Inc. All rights reserved.
17
Countrywide Workers Compensation Lost-Time Claim Frequency
Declined in 2011Lost-Time Claims
1991 1992 1993 1994 1995 1996 1997 1998 1999 2000 2001 2002 2003 2004 2005 2006 2007 2008 2009 2010 2011p
-10
-8
-6
-4
-2
0
2
4
6
8
10
12
-4.2 -4.4
-9.2
0.3
-6.5
-4.5
0.5
-3.9
-2.3
-4.5
-6.9
-4.5 -4.1 -3.7
-6.6
-4.5
-2.2
-4.5-5.9
10
-4
3
IndicatedLabel Indicated
Percent
Accident Year2011p: Preliminary based on data valued as of 12/31/20111991–2010: Based on data through 12/31/2010, developed to ultimateBased on the states where NCCI provides ratemaking services, including state funds; excludes high deductible policiesFrequency is the number of lost-time claims per $1M pure premium at current wage and voluntary loss cost level
Cumulative Change of –55.5%
(1991–2010 adjusted)
-1

Copyright 2012 National Council on Compensation Insurance, Inc. All rights reserved.
18
Texas Claim Frequency
1997 1998 1999 2000 2001 2002 2003 2004 2005 2006 2007 2008 2009 201015
25
35
45
55
43
Policy Year
Fre
qu
ency
per
Mil
lio
no
f O
n-L
evel
ed P
rem
ium
Based on NCCI’s financial dataFrequency of lost-time claims adjusted to a common wage level

Copyright 2012 National Council on Compensation Insurance, Inc. All rights reserved.
19
Texas Workers Compensation Lost-Time Claim Frequency
Lost-Time Claims
1998 1999 2000 2001 2002 2003 2004 2005 2006 2007 2008 2009 2010-15
-10
-5
0
5
10
4.2
0.2
-3.6
-11.8
-9.0
-13.6
-5.1
-8.9-6.8 -6.3
-5.2
0.7
3.2
Policy Year
Cumulative Change of -4.9%(1998–2010)
Percent Change
Based on data through 12/31/2011, developed to ultimate

Copyright 2012 National Council on Compensation Insurance, Inc. All rights reserved.
20
TX AR LA NM OK Reg CW0
2,000
4,000
6,000
732 653 749 9121,415
958 879
2,0492,799
2,076
3,2282,855
2,632 2,754
2,781
3,452
2,825
4,140 4,270
3,590 3,633
Lost Time Medical Only
Cla
im F
req
uen
cy
Texas Average Claim FrequencyFrequency per 100,000 Workers—All Claims
Based on NCCI’s Statistical Plan data

Copyright 2012 National Council on Compensation Insurance, Inc. All rights reserved.
21
Claim
frequency is
a key cost
driver
Texas
frequency has
increased
Texas
frequency is
lower than
CW and
region
CW frequency
decreased in
latest year
Key Takeaways— Claim Frequency

Copyright 2012 National Council on Compensation Insurance, Inc. All rights reserved.
22
Indemnity Severity

Copyright 2012 National Council on Compensation Insurance, Inc. All rights reserved.
23
Countrywide Workers Compensation Indemnity Claim Costs—Modest Increase in 2011
Average Indemnity Cost per Lost-Time Claim
1991 1992 1993 1994 1995 1996 1997 1998 1999 2000 2001 2002 2003 2004 2005 2006 2007 2008 2009 2010 2011p
5
10
15
20
25
$9
.8
$9
.5
$9
.2
$9
.7
$9
.8
$1
0.4
$1
1.2
$1
2.2
$1
3.5
$1
4.8
$1
6.2
$1
6.7
$1
7.5
$1
7.6
$1
8.3
$1
9.3
$2
0.5
$2
2.3
$2
2.5
$2
1.9
$2
2.3
+1.0%-3.1% -2.8%+4.9%+1.7%+5.9%
+7.7%+9.0%
+10.1%
+10.1%
+9.2%+3.1%
+4.6%+1.0%+3.6%
+5.5%
+6.5%
+8.8%+0.6%-2.8%+2%
Accident Year2011p: Preliminary based on data valued as of 12/31/20111991–2010: Based on data through 12/31/2010, developed to ultimateBased on the states where NCCI provides ratemaking services, including state fundsExcludes high deductible policies
Annual Change 1991–1993: –1.7%
Annual Change 1994–2001: +7.3%
Annual Change 2002–2010: +3.4%
IndemnityClaim Cost
($ '000s)

Copyright 2012 National Council on Compensation Insurance, Inc. All rights reserved.
24
Texas Average Indemnity Severity
1997 1998 1999 2000 2001 2002 2003 2004 2005 2006 2007 2008 2009 20104
9
14
19
24
29
22.8
14.6
Adjusted to Current Wage Level Actual
Policy Year
Ind
emn
ity
Ave
rag
eC
laim
Sev
erit
y ($
'000
s)
.15.3
AY 11
Based on NCCI’s financial data for lost-time claims at current benefit level and developed to ultimate

Copyright 2012 National Council on Compensation Insurance, Inc. All rights reserved.
25
Texas Average Indemnity Claim Severity
Lost-Time ClaimsIndemnitySeverity ($ '000s)
The severity figures shown are in excess of wage trendBased on data through 12/31/2011, on-leveled and developed to ultimate.
1998 1999 2000 2001 2002 2003 2004 2005 2006 2007 2008 2009 20100
5
10
15
20
25
$23.6
$23.4
$23.6
$22.0
$22.5
$20.8
$20.1
$18.2
$17.1
$16.7
$17.3
$15.6
$15.8
-0.9%
0.7%
-6.6%
2.0%
-7.4% -3.4%-9.4%
-6.2% -2.4%
4.1%
-10.0%
1.3%
Policy Year

Copyright 2012 National Council on Compensation Insurance, Inc. All rights reserved.
26
2007 2008 2009 2010 201110
12
14
16
18
20
22
24
16 16
21
22
Texas Countrywide
Accident Year
Co
st p
er C
ase
($ '0
00s)
Texas vs. Countrywide Average Indemnity Claim Severity
*Preliminary
Source: NCCI financial data valued as of 12/31/2010 for Countrywide AY 2007 – 2010Source: NCCI financial data valued as of 12/31/2011 for Countrywide AY 2011 and Texas AY 2007 - 2011

Copyright 2012 National Council on Compensation Insurance, Inc. All rights reserved.
27
Average Indemnity Claim Severity in the Region
TX AR LA NM OK0
5
10
15
20
25
30
35
40
45
16
13
40
22
29
Ind
emn
ity
Sev
erit
y ($
'000
s)
Based on NCCI’s financial data for lost-time claims

Copyright 2012 National Council on Compensation Insurance, Inc. All rights reserved.
28
Indemnity costs
remain low despite
increase in the most
recent year
Countrywide
indemnity severity
increased slightly
Texas average
indemnity cost is
lower than the region
and countrywide
Key Takeaways— Texas Indemnity Benefit Costs

Copyright 2012 National Council on Compensation Insurance, Inc. All rights reserved.
29
Medical Severity

Copyright 2012 National Council on Compensation Insurance, Inc. All rights reserved.
30
Medical Benefits Constitute the Majority of Total Benefit Costs in Texas
63%
37%
Texas
Indemnity Medical
56%
44%
Region
59%
41%
Countrywide
Regional states are AR, LA, NM, and OKBased on NCCI’s Statistical Plan data

Copyright 2012 National Council on Compensation Insurance, Inc. All rights reserved.
31
Countrywide Workers Compensation Medical Severity
Moderate Increase in 2011 Average Medical Cost per Lost-Time Claim
1991 1992 1993 1994 1995 1996 1997 1998 1999 2000 2001 2002 2003 2004 2005 2006 2007 2008 2009 2010 2011p
5
10
15
20
25
30
$8
.1
$8
.2
$8
.1
$8
.8
$9
.2
$9
.9
$1
0.9
$1
1.8
$1
3.1
$1
4.0
$1
5.9
$1
7.3
$1
8.7
$1
9.7
$2
1.3
$2
2.6
$2
4.0
$2
5.5
$2
6.6
$2
6.9
$2
8.0
+6.8%+1.3% -2.1%+9.0%+5.1%
+7.4%+10.1%
+8.3%+10.6%
+7.3%
+13.5%+8.8%
+7.7%+5.4%
+8.5%+5.9%
+6.3%+6.1%
+4.2% +1.3%+4%
Accident Year
Annual Change 1991–1993: +1.9%
Annual Change 1994–2001: +8.9%
Annual Change 2002–2010: +6.0%
MedicalClaim Cost
($ '000s)
2011p: Preliminary based on data valued as of 12/31/20111991–2010: Based on data through 12/31/2010, developed to ultimateBased on the states where NCCI provides ratemaking services, including state fundsExcludes high deductible policies

Copyright 2012 National Council on Compensation Insurance, Inc. All rights reserved.
32
Texas Average Medical Severity
1997 1998 1999 2000 2001 2002 2003 2004 2005 2006 2007 2008 2009 20104
9
14
19
24
29
34
39
44
34.4
22.0
Adjusted to Current Wage Level Actual
Policy Year
Med
ical
Ave
rag
eC
laim
Sev
erit
y ($
'000
s)
.23.5
AY 11
Based on NCCI’s financial data for lost-time claims at current benefit level and developed to ultimate

Copyright 2012 National Council on Compensation Insurance, Inc. All rights reserved.
33
Texas Average Medical Claim Severity
Lost-Time ClaimsMedicalSeverity ($ '000s)
The severity figures shown are in excess of wage trendBased on data through 12/31/2011, on-leveled and developed to ultimate
1998 1999 2000 2001 2002 2003 2004 2005 2006 2007 2008 2009 20100
5
10
15
20
25
30
35
40
$36.3
$37.3
$38.7
$37.5
$36.1
$34.4
$32.1
$28.9
$28.0
$28.1
$26.7
$24.7
$23.5
2.5%3.8%
-3.1%-3.7%
-4.7%-6.7%
-9.9% -3.3%
0.5%
-5.2%-7.3%
-4.9%
Policy Year

Copyright 2012 National Council on Compensation Insurance, Inc. All rights reserved.
34
2007 2008 2009 2010 2011*20
22
24
26
28
30
27
2324
28
Texas Countrywide
Accident Year
Co
st p
er C
ase
($ '0
00s)
Texas vs. Countrywide Average Medical Claim Severity
*Preliminary
Source: NCCI financial data valued as of 12/31/2010 for Countrywide AY 2007 – 2010Source: NCCI financial data valued as of 12/31/2011 for Countrywide AY 2011 and Texas AY 2007 - 2011

Copyright 2012 National Council on Compensation Insurance, Inc. All rights reserved.
35
TX AR LA NM OK0
5
10
15
20
25
30
35
40
45
50
23
28
47
37
27
Me
dic
al
Se
ve
rity
($
'00
0s
)
Based on NCCI’s financial data for lost-time claims
Average Medical Claim Severity in the Region

Copyright 2012 National Council on Compensation Insurance, Inc. All rights reserved.
36
Compris
e 63% of
benefits
Medical
severity
continues
to decline
Costs are
lower than
countrywid
e
Costs are
lowest in
the region
Key Takeaways— Texas Medical Benefit Costs

Copyright 2012 National Council on Compensation Insurance, Inc. All rights reserved.
37
Closing Remarks
Thank you!