© copyright 2007 national council on compensation insurance, inc. all rights reserved. 1 the new...
TRANSCRIPT

1© Copyright 2007 National Council on Compensation Insurance, Inc. All Rights Reserved.
The New NCCI Hazard GroupsPresented by:Jonathan Evans, FCAS, MAAAActuaryNCCI

2© Copyright 2007 National Council on Compensation Insurance, Inc. All Rights Reserved.
Today’s Outline:
Background on Hazard Groups
Item B-1403 and Subsequent Annual Updates
Impact of the New Hazard Groups
Next Steps—USL&HW

3© Copyright 2007 National Council on Compensation Insurance, Inc. All Rights Reserved.
Today’s Outline:
Background on Hazard Groups
Item B-1403 and Subsequent Annual Item B-1403 and Subsequent Annual UpdatesUpdates
Impact of the New Hazard GroupsImpact of the New Hazard Groups
Next Steps—USL&HWNext Steps—USL&HW

4© Copyright 2007 National Council on Compensation Insurance, Inc. All Rights Reserved.
What Are Hazard Groups? Each class code is assigned to a hazard group
(HG)
HGs capture the variation in large loss potential among class codes
Classes in HG A—least likelihood for large claims
Classes in HG G—greatest likelihood for large claims
HG A … … … … HG G
Likelihood of Large Claims

5© Copyright 2007 National Council on Compensation Insurance, Inc. All Rights Reserved.
What Are Hazard Groups Used For?
Retrospective Rating
Excess Loss Factors (ELFs), used to determine the charge for an optional claim limit
State Hazard Group Relativities (SHGRs), used in determining the insurance charge

6© Copyright 2007 National Council on Compensation Insurance, Inc. All Rights Reserved.
What Are Hazard Groups Used For?
Deductible Credits
NCCI files small deductible programs based on hazard groups in the voluntary market in just over 20 states
NCCI does not file large deductible programs

7© Copyright 2007 National Council on Compensation Insurance, Inc. All Rights Reserved.
What Are Hazard Groups Used For?
Other Miscellaneous Uses for Hazard Groups:
Profiling premium distribution for reinsurance purposes
Reinsurance pricing
Underwriting guidelines
Predictive modeling

8© Copyright 2007 National Council on Compensation Insurance, Inc. All Rights Reserved.
Today’s Outline:
Background on Hazard GroupsBackground on Hazard Groups
Item B-1403 and Subsequent Annual Updates
Impact of the New Hazard GroupsImpact of the New Hazard Groups
Next Steps—USL&HWNext Steps—USL&HW

9© Copyright 2007 National Council on Compensation Insurance, Inc. All Rights Reserved.
Item B-1403 Filing Contents
New mapping to both four and seven hazard groups
ELFs for most states State Hazard Group Relativities (SHGRs) Expected Loss Groups (ELGs) Deductible credits not included Approved in all states

10© Copyright 2007 National Council on Compensation Insurance, Inc. All Rights Reserved.
Interaction of HG and Rate Filings
ELFs and deductible credits in rate filing depend on HG filing (B-1403)
New HGs took effect with approval of the first rate or loss cost filing on or after January 1, 2007*
* Separate effective dates were filed in CO and ME due to no loss cost filings in 2007 and in SC due to a delayed loss cost effective date

11© Copyright 2007 National Council on Compensation Insurance, Inc. All Rights Reserved.
ELFs Effective in 2007 Loss cost states effective in first half of year
– AK, AL, AR, CO*, CT, GA, HI, IL, IN, KS, LA, MD, ME*, MO, MS, MT, NC, NE, NH, NM, NV, OK, OR, RI, SC*, SD, TN, VA, VT
– ELFs were in HG filing and loss cost filing
Loss cost states effective in second half of year– DC, KY, UT
– ELFs were in loss cost filing
Rate states– AZ, FL, IA, ID
– ELFs were in rate filing* No loss cost filing made in CO and ME with 2007 eff date; SC eff date delayed

12© Copyright 2007 National Council on Compensation Insurance, Inc. All Rights Reserved.
ELFs Effective in 2008 and Subsequent
Loss cost states – ELFs filed annually in ELG/SHGR filing (mid-year)– Effective with loss cost filing– Continue to appear in loss cost filings as well
Rate states– ELFs in rate filing– Same as current practice

13© Copyright 2007 National Council on Compensation Insurance, Inc. All Rights Reserved.
ELGs/SHGRs Effective in 2008 and
Subsequent
File annually at mid-year
Single January 1 effective date for all states

14© Copyright 2007 National Council on Compensation Insurance, Inc. All Rights Reserved.
The New Hazard Groups The old four hazard groups labeled I through
IV were replaced with seven hazard groups labeled A through G
To accommodate carriers that preferred a four-hazard group system, there was also a new four-hazard-group option labeled 1 through 4

15© Copyright 2007 National Council on Compensation Insurance, Inc. All Rights Reserved.
4 HG Option
Made available primarily for carriers who could not update their system in the time required.
Carriers that elected to use the new four-hazard-group option had to make a filing in each state to adopt it. Otherwise they are considered to have adopted the seven HGs.
New 7 Hazard Groups collapse into new 4. – New HG 1 = HGs A & B– New HG 2 = HGs C & D– New HG 3 = HGs E & F– New HG 4 – HG G

16© Copyright 2007 National Council on Compensation Insurance, Inc. All Rights Reserved.
Hierarchical Collapsing of New HGs
A B C D E F G
1 2 3 4

17© Copyright 2007 National Council on Compensation Insurance, Inc. All Rights Reserved.
Today’s Outline:
Background on Hazard GroupsBackground on Hazard Groups
Item B-1403 and Subsequent Item B-1403 and Subsequent Annual UpdatesAnnual Updates
Impact of the New Hazard Groups
Next Steps—USL&HWNext Steps—USL&HW

18© Copyright 2007 National Council on Compensation Insurance, Inc. All Rights Reserved.
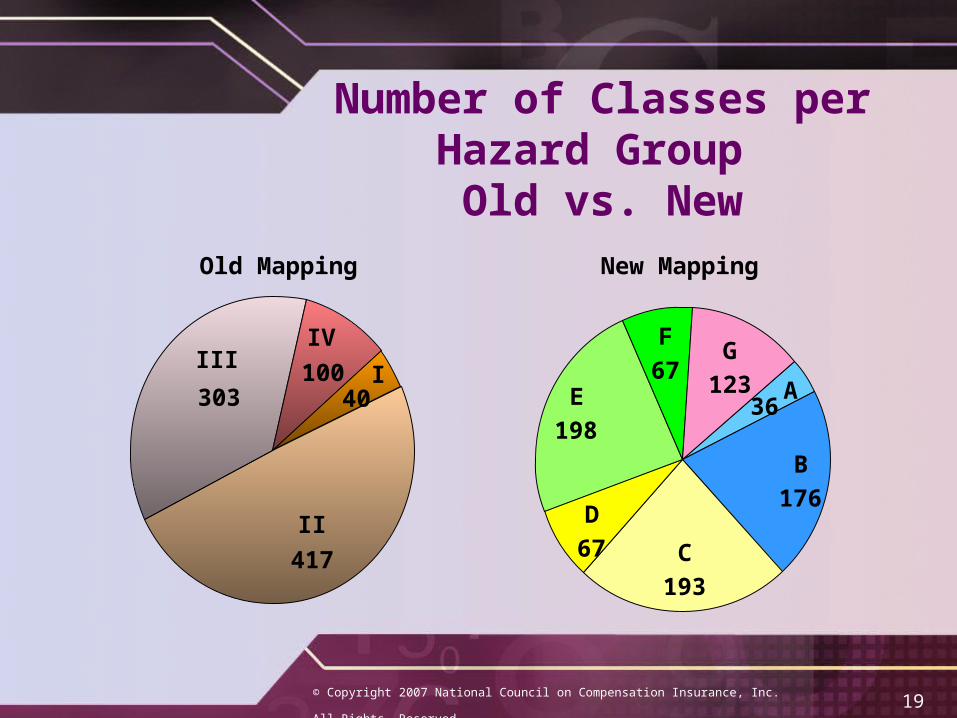
Old Hazard Groups
HG Number of
ClassesStandard Premium
% of Total Premium
I 40 1,262,958,374 0.9%
II 417 66,637,777,888 45.5%
III 303 74,858,646,647 51.1%
IV 100 3,633,449,434 2.5%
Total 860 146,392,832,343 100.00%
19© Copyright 2007 National Council on Compensation Insurance, Inc. All Rights Reserved.
Old Mapping
II 417
III
303
IV 100 I
New Mapping
G
123
F
67E
198
D
67 C
193
A
B
176
3640
Number of Classes per Hazard Group
Old vs. New

20© Copyright 2007 National Council on Compensation Insurance, Inc. All Rights Reserved.
New
A
B14%
C26%
D12%
E20%
F19% G
5%
Old
II 46%
III
51%
IV: 2%
I: 1%
4%
Percentage of Premium per Hazard Group
Old vs. New

21© Copyright 2007 National Council on Compensation Insurance, Inc. All Rights Reserved.
New Hazard Groups Before Underwriting
Review
0.000
0.050
0.100
0.150
0.200
0.250
0.200 0.300 0.400 0.500 0.600 0.700
Excess Ratio at $100K
Ex
ce
ss
Ra
tio
at
$1
M
Each symbol represents a class
Each color represents a HG

22© Copyright 2007 National Council on Compensation Insurance, Inc. All Rights Reserved.
Member companies surveyed
101 classes had full credibility, of which 53 received comments
61 classes had credibility of 75%–99%, of which 30 received comments
Of the remaining 700 classes, 200+ also received comments
Underwriting Review ofHazard Group Assignments

23© Copyright 2007 National Council on Compensation Insurance, Inc. All Rights Reserved.
Underwriting Review ofHazard Group Assignments
Much feedback pertained to dangers faced by employees, such as:
– Extensive driving– Heavy machinery– Dangerous materials
Feedback also reflected reasoning by analogy:– Suggesting classes with similar operations be assigned to
the same HG– Suggesting a small class be mapped to the same HG as a
larger class with similar operations

24© Copyright 2007 National Council on Compensation Insurance, Inc. All Rights Reserved.
Final HG assignments based on:
– Statistically indicated mapping
– Survey comments
– Internal Underwriting review
– Statistical credibility of class
– Statistical ambiguity of class (e.g., was indicated mapping between 2 HGs?)
Underwriting Review ofHazard Group Assignments

25© Copyright 2007 National Council on Compensation Insurance, Inc. All Rights Reserved.
Class Movement FromOld to New 4 HGs
Nu
mb
er o
f C
lass
es
3511
586
219
0
100
200
300
400
500
600
700
Down 2HGs
Down 1 HG NoMovement
Up 1 HG Up 2 HGs

26© Copyright 2007 National Council on Compensation Insurance, Inc. All Rights Reserved.
Revenue Neutrality
General increase in ELFs when comparing the old 4 HGs to the new 4 HGs (e.g., old HG I to new HG 1).
General movement of classes to lower HGs.
These two results offset each other, and the overall average ELFs are unaffected across all hazard groups and prior to trend. Therefore, there is no overall premium effect.

27© Copyright 2007 National Council on Compensation Insurance, Inc. All Rights Reserved.
Percentage Change in Average Cost per Case
Old vs. New 4 HGs
Injury Type
Hazard Group
1 2 3 4
Fatal +48.6% +14.0% +2.2% -5.3%
PT +18.7% +4.0% +3.4% +29.2%
PP +2.1% +9.1% +2.8% -6.0%
TT -3.3% +4.8% +1.1% -5.8%
Med Only
-6.8% +2.9% +1.4% -9.5%

28© Copyright 2007 National Council on Compensation Insurance, Inc. All Rights Reserved.
PT Average Cost per CaseOld HG IV vs. New HG 4
HG IV
$413,376
HG 4
$533,913
$ 214,619 $ 573,275$ 450,789
29© Copyright 2007 National Council on Compensation Insurance, Inc. All Rights Reserved.
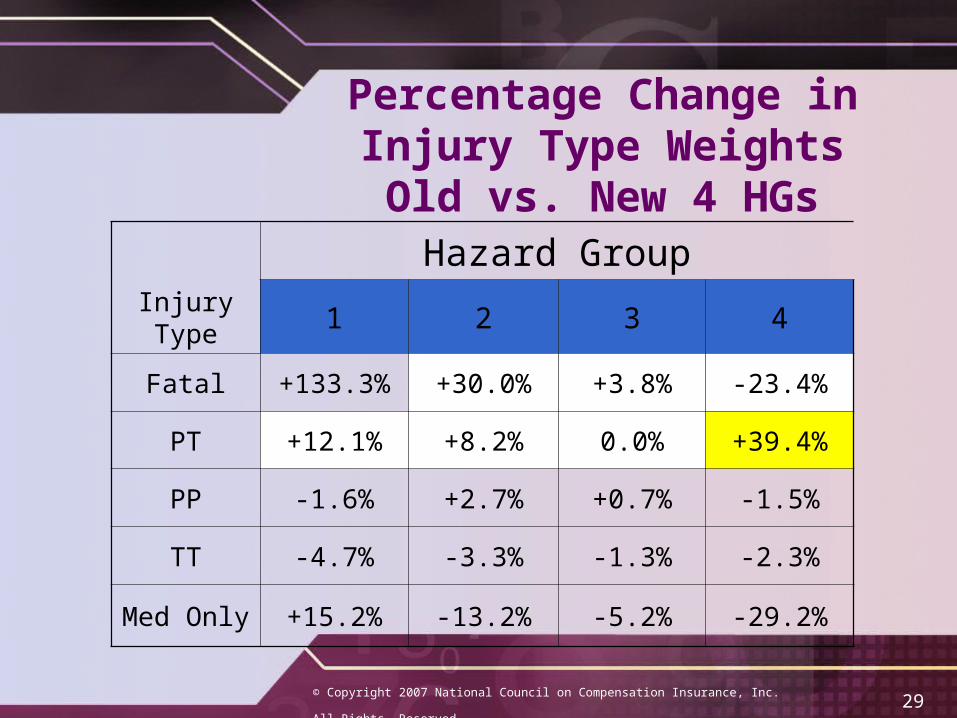
Percentage Change in Injury Type WeightsOld vs. New 4 HGs
Injury Type
Hazard Group
1 2 3 4
Fatal +133.3% +30.0% +3.8% -23.4%
PT +12.1% +8.2% 0.0% +39.4%
PP -1.6% +2.7% +0.7% -1.5%
TT -4.7% -3.3% -1.3% -2.3%
Med Only +15.2% -13.2% -5.2% -29.2%

30© Copyright 2007 National Council on Compensation Insurance, Inc. All Rights Reserved.
PT Weight Old HG IV vs. New HG 4
HG IV
10.4%
HG 4
14.5%
4.1% 15.7%12.0%

31© Copyright 2007 National Council on Compensation Insurance, Inc. All Rights Reserved.
Change Due to New Mapping
-12%
-6%
0%
6%
12%
18%
24%
30%
HG I to 1 HG II to 2 HG III to 3 HG IV to 4
$1M Attachment Point
Per
cen
tag
e C
han
ge
in E
xces
s R
atio
Change in Excess RatiosOld to New 4 HGs
Each symbol represents a state

32© Copyright 2007 National Council on Compensation Insurance, Inc. All Rights Reserved.
Change in Excess RatiosHG I to HG 1
$1,000,000
0%
10%
20%
30%
40%
50%
60%
70%
80%
AR NM VA SC MT HI ME MS OR SD NV MD NC TN LA NH RI IN VT AK KS CO NE OK IL CT MO
State
Per
cen
tag
e C
han
ge
in E
xces
s R
atio
s
Total Change in B-1403 Change Due To Remapping

33© Copyright 2007 National Council on Compensation Insurance, Inc. All Rights Reserved.
$1,000,000
0%
5%
10%
15%
20%
25%
30%
35%
40%
45%
MT AR OR SC NV NM SD VA HI TN MS AK NC ME NE VT LA CO RI MD OK NH IN KS CT IL MO
State
Per
cen
tag
e C
han
ge
in E
xce
ss R
atio
s
Total Change in B-1403 Change Due To Remapping
Change in Excess RatiosHG II to HG 2

34© Copyright 2007 National Council on Compensation Insurance, Inc. All Rights Reserved.
$1,000,000
-5%
0%
5%
10%
15%
20%
MT AR OR SC SD NM NV OK AK NE HI LA VA CO ME TN MD MS NH VT IN RI NC KS MO CT IL
State
Perc
enta
ge
Ch
ang
e in
Exce
ss
Rat
ios
Total Change in B-1403 Change Due To Remapping
Change in Excess RatiosHG III to HG 3

35© Copyright 2007 National Council on Compensation Insurance, Inc. All Rights Reserved.
$1,000,000
-10%
0%
10%
20%
30%
40%
50%
RI SD NH ME AK HI OK VA MD NE LA CT SC NM VT MT NC MS OR IL MO NV AR KS TN IN CO
State
Perc
en
tag
e C
han
ge i
n E
xcess R
ati
os
Total Change in B-1403 Change Due To Remapping
Change in Excess RatiosHG IV to HG 4

36© Copyright 2007 National Council on Compensation Insurance, Inc. All Rights Reserved.
Countrywide Excess Ratios
0.000
0.020
0.040
0.060
0.080
0.100
0.120
0.140
0.160
0.180
0.200
0.250 0.300 0.350 0.400 0.450 0.500 0.550 0.600 0.650
Excess Ratio at $100 K
Ex
ce
ss
Ra
tio
at
$ 1
mill
ion HG I
HG II
HG III
HG IV
HG A
HG B
HG C
HG D
HG E
HG F
HG G
Old and New HGsCountrywide Average Excess Ratios

37© Copyright 2007 National Council on Compensation Insurance, Inc. All Rights Reserved.
Key TransitionsOld Mapping
Hazard Group I II III IV Total
Number of Classes 40 417 303 100 860Percent of Premium 0.9% 45.5% 51.1% 2.5% 100%
Hazard Group26 10 0 0 36
0.4% 3.9% 0.0% 0.0% 4.3%
10 165 1 0 1760.4% 13.0% 0.1% 0.0% 13.6%
1 178 14 0 1930.0% 21.7% 3.7% 0.0% 25.5%
1 42 24 0 670.0% 5.2% 7.1% 0.0% 12.3%
2 17 178 1 1980.0% 1.5% 18.4% 0.0% 19.9%
0 4 58 5 670.0% 0.2% 18.9% 0.3% 19.3%
0 1 28 94 1230.0% 0.0% 2.9% 2.2% 5.1%
New
Map
ping
F
G
A
B
C
D
E

38© Copyright 2007 National Council on Compensation Insurance, Inc. All Rights Reserved.
Largest Class Codes Transitioning From II to B
Class Code
DescriptionPremium Size
(8810 = 1000)
8017 Store: Retail NOC 451*
8018 Store: Wholesale NOC 271
8868College: Professional Employees and Clerical
223
9052Hotel: All Other Employees and Salespersons, Drivers
219
9101College or School: All Other Employees
162
*Indicates premium 45.1% of 8810 premium.

39© Copyright 2007 National Council on Compensation Insurance, Inc. All Rights Reserved.
Largest Class Codes Transitioning From II to C
Class Code
DescriptionPremium Size
(8810 = 1000)
8810 Clerical Office Employees NOC 1000
8829Convalescent or Nursing Home—All Employees
293
8033Store: Meat, Grocery and Provision (Combined)—Retail—NOC
248
8833 Hospital: Professional Employees 214
9014Buildings—Operation by Contractors
189

40© Copyright 2007 National Council on Compensation Insurance, Inc. All Rights Reserved.
Change in Excess RatiosFrom Old HG II to …
Change Due to New Mapping … excluding trend
-30%
-20%
-10%
0%
10%
20%
30%
HG 2 HG B HG C
$1M Attachment Point
Pe
rce
nta
ge
Ch
an
ge
in
Ex
ce
ss
Ra
tio
Change Due to New Mapping—Excluding Trend
Each symbol represents a state

41© Copyright 2007 National Council on Compensation Insurance, Inc. All Rights Reserved.
Largest Class Codes Transitioning From III to E
Class Code
DescriptionPremium Size
(8810 = 1000)
8742Salespersons, Collectors or Messengers—Outside
453
5190Electrical Wiring—Within Buildings and Drivers
399
5183 Plumbing NOC and Drivers 366
7228Trucking—Local Hauling Only—All Employees and Drivers
325
5221Concrete or Cement Work—Floors, Driveways, Yards or Sidewalks—and Drivers
250

42© Copyright 2007 National Council on Compensation Insurance, Inc. All Rights Reserved.
Largest Class Codes Transitioning From III to F
Class Code
DescriptionPremium Size (8810 = 1000)
5645Carpentry—Detached One or Two Family Dwellings
500
7229Trucking—Long-Distance Hauling—All Employees and Drivers
416
5403 Carpentry NOC 289
5022 Masonry NOC 285
3724Machinery or Equipment Erection or Repair NOC and Drivers
272

43© Copyright 2007 National Council on Compensation Insurance, Inc. All Rights Reserved.
Change in Excess RatiosFrom Old HG III to …
-30%
-20%
-10%
0%
10%
20%
30%
HG 3 HG E HG F
$1M Attachment Point
Perc
en
tag
e C
han
ge in
Excess R
ati
o
Change Due to New Mapping—Excluding Trend
Each symbol represents a state

44© Copyright 2007 National Council on Compensation Insurance, Inc. All Rights Reserved.
Impact on Small Deductibles
NCCI files deductible credits that vary by HG in just over 20 states in the voluntary market and in just over 10 states in the residual market
For deductibles of $5,000 or less, the impact of the revised credit on the loss cost premium of most risks is less than 5%

45© Copyright 2007 National Council on Compensation Insurance, Inc. All Rights Reserved.
B I II C E IIIF IV GA
D0%
5%
10%
15%
20%
25%
$500 Deductible Amount
Ded
uct
ible
Cre
dit
Countrywide Average $500 Deductible Credits

46© Copyright 2007 National Council on Compensation Insurance, Inc. All Rights Reserved.
Today’s Outline:
Background on Hazard GroupsBackground on Hazard Groups
Item B-1403 and Subsequent Item B-1403 and Subsequent Annual UpdatesAnnual Updates
Impact of the New Hazard GroupsImpact of the New Hazard Groups
Next Steps—USL&HW

47© Copyright 2007 National Council on Compensation Insurance, Inc. All Rights Reserved.
Current USL&HW ELFs
Countrywide
Last filed in 1999
Not updated annually
Based on F-class data

48© Copyright 2007 National Council on Compensation Insurance, Inc. All Rights Reserved.
Countrywide vs. state-specific ELFs– USL&HW indemnity benefits are countrywide,
but medical probably varies by state– Even half of the indemnity losses are paid at
state benefit level in typical F-class
Minimal data available
Minimal use expected– Very few retro policies with USL exposure are
being written
Key Considerations

49© Copyright 2007 National Council on Compensation Insurance, Inc. All Rights Reserved.
Use state ELFs– Typically half of indemnity paid at state level– Medical probably varies by state and accounts for
majority of large losses
Make use of USL percentage to derive state-specific USL ELFs– USL ELFs that vary by state could be derived by
assuming USL costs exceed each specific state’s costs by the USL percentage, or some portion of the USL percentage
Possible Options

50© Copyright 2007 National Council on Compensation Insurance, Inc. All Rights Reserved.
Summary of New HGs
New 7 HGs provide a greater spread in ELFs
Classes are more evenly spread across the new HGs vs the old
General increase in ELFs, partly due to inflation over time
Increase in ELFs offset by movement to lower HG for many classes