˘ ˇ - clallam
TRANSCRIPT

���������������� ������������������������������
�
��
����������������������� ��!�"#��"��
������$�"��������%�#&��"���%�%%�$���'"�&�
����������������(&��
���!"���%����)������"����('���'�������%�$����"���")��*���%������
��"�����������"� ��!��
+�$���� "��,-%�%%�$����(���
��(�'��&�.//0

�
United States Department of the Interior
The mission of the Department of the Interior is to protect and provide access to our
Nation’s natural and cultural heritage and honor our trust responsibilities to tribes.
Bureau of Reclamation
The mission of the Bureau of Reclamation is to manage, develop, and protect water
and related resources in an environmentally and economically sound manner in the interest
of the American public.

Dungeness River In-Stream Flow Side Channel Study
Dungeness River, Washington
���������������� �
�������������������������������� ���������������� ������������!������"����������� ����#������
������$������%�����������������������������.
���������������� ������������!������"����������� ����#������
�"�������������������������������������
���������������� ������������!������"����������� ����#������
�������������� ��&���� � �����������������������������������
���������������� ������������!������"����������� ����#������
U.S. Depar tment of the Inter ior Bureau of Reclamation
Technical Service Center, Denver, Colorado


Acknowledgements
This study was a cooperative effort between the Department of Ecology, Jamestown S’Klallam
Tribe, Clallam County, and the U.S. Bureau of Reclamation (Reclamation). We would like to
thank all of the cooperators for their efforts and support of this study. In particular, Cynthia
Nelson from the Department of Ecology was very supportive in initiating the project. Chris
Evans and Jim Shedd from the Department of Ecology provided their time and assistance in
operating two river gages that were used in this study. Tom McKenna from USGS also provided
data from their continuous stage recorder on the Dungeness River. Byron Rot and Shawn Hines
from the Jamestown S’Klallam Tribe provided valuable information and side channel data
collection for the analysis presented in this report. Pam Edens from the Jamestown S’Klallam
Tribe was very helpful in providing GIS information to facilitate the analysis. Pat Crain from
Clallam County assisted in discussions regarding the evaluation of fisheries criteria. The
Reclamation survey crew from Ephrata, Washington provided valuable survey data that was
utilized in the study.

Executive Summary
The Bureau of Reclamation (Reclamation) and the Jamestown S’Klallam Tribe (Tribe) were asked to accomplish an analysis to better understand flow interactions between the main channel and side channels during the irrigation period, typically between June to October. Main channel flows are the highest during the beginning portion of the irrigation period due to runoff from snowmelt in the upper watershed. As the snowmelt runoff decreases in late summer to early fall, main channel flows fall to the lowest discharges recorded during each water year. The goal of this analysis is to enable fisheries scientists to evaluate the range of main channel flows that provide enough water in the side channels to sustain viable aquatic habitat. This study focused on the lower 10.5 miles of the Dungeness River from near the tributary of Canyon Creek to the mouth at the Straight of Juan de Fuca. Ten side channels were studied between the fish hatchery (RM 10.6) and the Woodcock Bridge (also known as the Ward Road Bridge at RM 3.3). Downstream of Woodcock Bridge the river is confined on both sides by roads and levees and there are no significant side channels present. Between the upstream end of the study reach and Railroad Bridge at RM 5.7, there are five side channels and five irrigation diversions from the main channel river flow. In this reach, the main channel flow is reduced due to natural groundwater losses and the five irrigation diversions, which account for 11 to 80 percent of the total flow reduction (mean of 61 percent during study period). Between the Railroad Bridge and the downstream end of the study reach there are five additional side channels and no diversions from the main channel river flow. This reach has some groundwater interaction between the mainstem and side channels, but overall the mainstem river gains flow (Simonds, 2002). Based on data collected during the irrigation period in 2002, relationships between mainstem discharge and side channel discharge, velocity, depth, and wetted width were established. Using these relationships, the range of main channel flows were computed that allowed fish habitat criteria to be satisfied for a variety of species. There are two kinds of flow interactions between side channels and the mainstem river, surface water and groundwater connections. Side channels with surface water connections met fish criteria for a variety of species during the irrigation season that was evaluated. Side channels with groundwater connections only met fish criteria for one species. Side channels with surface water connections are more sensitive to main channel flow decreases during the irrigation season than groundwater connected channels. The following side channels all had a surface flow connection for the duration of the study period: Dawley, Lower Right Railroad Bridge, Kinkade Right, Kinkade Middle, and Kinkade Left Side Channels. Additionally, Anderson and Stevens/Savage Side Channels had a surface flow connection for the majority of the study period, but as snowmelt flows decreased both channels temporarily lost the surface connection with the mainstem river. The remaining side channels had only groundwater connections during the study period. Because Anderson and Stevens/Savage lost their surface water connection during the study period, these channels may be good indicators of when the mainstem flow becomes low enough that a portion of viable habitat is lost.

ii
For the side channels studied during the irrigation period, the range of flows found in groundwater fed side channels is much lower than that of surface water fed side channels. This is because it takes a much larger increase in main channel flow to increase discharge in a groundwater fed side channel relative to one with a surface water connection. For this reason, the habitat parameters, such as velocity and depth, in surface water connected channels can vary considerably over a wide range of mainstem flows. The corollary of this is that discharge in groundwater fed side channels will be more stable over a wider range of flow regimes within the main channel. Thus viable habitat in groundwater fed side channels may become vulnerable only during large floods when the stage in the main channel becomes high enough to establish a surface water connection in the side channel. Additionally, the maximum depth and wetted width of side channels does not have a good correlation to discharge in groundwater side channels. Correspondingly, the discharge in the main channel will not be an indicator of the habitat parameters of depth and width in groundwater side channels. The information provided in this report is intended to be utilized as a tool to assist fisheries scientists in assessing potential loss in viable side channel habitat based on documented criteria and the new discharge relationships established. The relationships developed provide a way to assess the habitat based solely on the mainstem river discharge at the USGS RM 11.8 gage and the amount of flow being diverted for irrigation between this upstream gage and a given side channel. In applying the habitat criteria to determine desired mainstem flow ranges, the following guidelines should be considered:
• Increases in main channel flow will have a relatively small effect on flow in groundwater fed side channels. Therefore, surface water connected side channels should be used for management decisions regarding the determination of minimum main channel flow.
• Each side channel is unique and may require a different range of mainstem flow magnitudes to achieve desired habitat criteria. Therefore, one side channel alone is not an indicator of the complete habitat conditions along the studied reach of the Dungeness River.
• It is recommended that several surface water connected side channels be considered and used in any management decisions regarding mainstem flow criteria.
• Several of the side channels studied have been persistent over time, and the flow relationships developed will be applicable as long as they remain relatively stable. However, for some of these channels the presence of a surface water connection during low flow periods (which enables them to be used for management decisions) is often dependent on whether the low flow main channel flows adjacent to the side channel entrance.
• In other reaches such as in the vicinity of the Railroad Bridge, the side channel and main channel alignments are more dynamic, and flow relationships are constantly changing. The relationships developed provide an assessment of the range of habitat present at this point in time, but may need to be adjusted if significant geomorphic changes occur.

TABLE OF CONTENTS
1.0 INTRODUCTION .................................................................................................................... 1 1.1 Objective............................................................................................................................... 1 1.2 Study Area............................................................................................................................ 1 1.3 Study Timeframe.................................................................................................................. 3
2.0 DATA COLLECTION ............................................................................................................. 4 2.1 Field Reconnaissance............................................................................................................ 4 2.2 Survey Data........................................................................................................................... 4 2.3 Mainstem Flow Measurements............................................................................................. 5 2.4 Diversion Channel Flow Measurements............................................................................... 6 2.5 Side Channel Flow and Temperature Measurements........................................................... 6
3.0 CONCEPTUAL DISCUSSION OF FLOW MEASUREMENTS AND INTERACTION BETWEEN MAIN CHANNEL AND SIDE CHANNEL FLOWS............................................... 8
3.1 Use of Rating Curve to Determine River Discharge ............................................................ 8 3.2 Flow Interactions between Main Channel and Side Channels.............................................. 9
4.0 VARIATION IN MEAUSURED MAINSTEM CHANNEL DISCHARGE......................... 13 4.1 Previous Investigation of Groundwater Interaction by USGS............................................ 13 4.2 New 2002 Mainstem Discharge Data................................................................................. 14
5.0 DESCRIPTION OF SIDE CHANNELS................................................................................ 18 5.1 Surface Water versus Groundwater Connections in Side Channels................................... 18 5.2 Kinkade Side Channel......................................................................................................... 20 5.3 Spring Side Channel ........................................................................................................... 22 5.4 Dawley Side Channel.......................................................................................................... 22 5.5 Railroad Bridge Side Channels........................................................................................... 22 5.6 Stevens/Savage Side Channel ............................................................................................. 23 5.7 Gagnon Side Channel ......................................................................................................... 25 5.8 Anderson Side Channel....................................................................................................... 25
6.0 TOOLS FOR PREDICTION OF SIDE CHANNEL HYDRAULIC PARAMETERS.......... 27 6.1 Prediction of Side Channel Discharge................................................................................ 27 6.2 Prediction of Side Channel Velocity, Depth, and Wetted Width ....................................... 30
7.0 APPLICATION EXAMPLE .................................................................................................. 34 8.0 REQUIRED MAINSTEM FLOW RANGES BASED ON SIDE CHANNEL HABITAT CRITERIA .................................................................................................................................... 38 9.0 MANAGEMENT AND APPLICATION CONSIDERATIONS........................................... 40 10.0 REFERENCES..................................................................................................................... 44
ATTACHMENTS
ATTACHMENT A: 2002 AERIAL PHOTOGRAPH LOCATION MAPS
ATTACHMENT B: CROSS SECTION DATA
ATTACHMENT C: SIDE CHANNEL RATING CURVES
ATTACHMENT D: SIDE CHANNEL TEMPERATURE DATA

1
1.0 INTRODUCTION The State of Washington adopted Engrossed Substitute House Bill 2514 to formalize, and provide financial support for, local watershed planning efforts. Under the legislation, local watershed plans are required to address water quantity and may address water quality, habitat, and setting or revising in-stream flows. The planning unit for the area that includes the Dungeness River (WRIA 18 Initiating Governments) has decided to address the issue of setting in-stream flows and has received a watershed planning grant from the Washington State Department of Ecology (WSDOE) to undertake this effort. Clallam County administers this watershed planning grant as well as others with similar objectives surrounding floodplain management. The Bureau of Reclamation (Reclamation) recently completed a geomorphology investigation of the lower 10.5 river miles (RM) of the Dungeness River. Among other things, this study analyzes relationships between river flows and flood stages, models the effects of potential dike setbacks, and describes the historic flow channels and impacts to those channels from human activities. Reclamation and the Jamestown S’Klallam Tribe (Tribe) have been asked to extend this analysis to better understand flow interactions between the main channel and side channels during low flow periods, and the impact on aquatic habitat. 1.1 Objective The local planning unit and Water Users Association would like to acquire further scientific information for in-stream flows. The goal of this analysis is to provide information and tools to help decision-makers address the relationship between side channel flows relative to main channel flows during the irrigation season. This information will enable fisheries scientists to evaluate the range of main channel flows that provide enough water in the side channels to sustain viable aquatic habitat. 1.2 Study Area This study focused on the lower 10.5 miles of the Dungeness River from near the tributary of Canyon Creek to the mouth at the Straight of Juan de Fuca. Ten side channels were studied between the fish hatchery (RM 10.6) and the Woodcock Bridge (also known as the Ward Road Bridge at RM 3.3). Downstream of Woodcock Bridge the river is confined on both sides by roads and levees and there are no significant side channels present. A series of aerial photographs showing the locations of the side channels and landmarks are provided (see Attachment A and Table 1.) Between the upstream end of the study reach and Railroad Bridge at RM 5.7, there are five side channels and five irrigation diversions from the main channel river flow. Between the Railroad Bridge and the downstream end of the study reach there are five additional side channels and no diversions from the main channel river flow.

2
Table 1. Landmarks and side channel locations in the study area (referenced looking downstream).
SIDE CHANNEL RIVER MILE1
LANDMARK RELATIVE LOCATION TO MAINSTEM RIVER
11.8 USGS Gage 11 Agnew Diversion Left Side 10.6 Fish Hatchery Left Side 10.6 Highland Diversion Right Side Kinkade (3 Flow Paths at Entrance) 10.2 Right Side Channel 8.5 Independence Diversion Right Side 8.1 to 7.5 Dungeness Meadows Levee Right Side 7.5 CCD Diversion Left Side Spring Creek 7.5 Right Side Channel Dawley 6.9 Right Side Channel 6.9 Sequim Prairie Diversion Right Side 6.4 Highway 101 Bridge Upper Right RR Bridge (2 Flow Paths) 5.9 Right Side Channel Upper Left RR Bridge 5.9 Left Side Channel 5.7 Railroad Bridge Lower Right RR Bridge 5.4 Right Side Channel Stevens/Savage 4.7 Right Side Channel
4 Olympic Highway Bridge (Burlingame)
Gagnon Right Flow Path 4 Left Side Channel Gagnon Left Flow Path 3.9 Left Side Channel Anderson 3.6 Right Side Channel 3.3 Woodcock Bridge 2.6 to mouth ACOE Levee Right Side 2.1 to 1.0 Olympic Game Farm Levee Left Side 0.7 Schoolhouse Bridge 0.8 to mouth River’s End Levee Left Side 0 River Mouth
1 Note: For side channel locations the river mile is specified at the upstream entrance to the channel.

3
1.3 Study Timeframe This study focuses on river flows between April and October when the majority of water diversions occur. During this timeframe, river flows increase at the beginning due to snowmelt runoff in the upper basin, and then gradually decrease throughout the summer (figure 3 referenced from England, Appendix G in Bountry, et al, 2002). Generally, by the August to September timeframe river flows reach the lowest values for the entire water year. This study focuses on understanding how this annual decrease in main channel river flows affects the amount of flow in side channels, and what additional impact diversion flows may have on this relationship. Major storms that result in heavy precipitation and large-magnitude flooding in the Dungeness River basin usually occur in winter following the low flow period in the fall, and are primarily warm frontal systems. In general, intense winter rainfall on snow at low altitudes causes most of the flooding in western Washington. The interaction between side channels and river flow in the main channel during the winter flood season was beyond the scope of this study.
Oct 1
O N
Dec 1
D J
Feb 1
F M
Apr 1
A M
Jun 1
J J
Aug 1
A S
10
100
1,000
10,000
Dungeness River near Sequim, WAPeriod-of-Record Mean Daily Flow Duration Hydrograph
06/01/1923 - 09/30/1930, 06/01/1937 - 09/30/1998
maximum observation 25 percent exceedance 50 percent exceedance 75 percent exceedance minimum observation
Dai
ly M
ean
Dis
char
ge (
ft3 /s
)
Water Year Time (days) Figure 1. Mean daily flow duration hydrograph for USGS gage on Dungeness River near RM 11.8 at upstream end of study reach.

4
2.0 DATA COLLECTION Data was collected to facilitate the investigation of the relationship between Dungeness mainstem flow and side channels. The first step was to identify which side channels were of interest within the study area through consultation with fisheries scientists studying the Dungeness River. 2.1 Field Reconnaissance On March 11, 2002, study team members from Reclamation and the Tribe performed an initial field reconnaissance to assess changes in the relationship between the main channel and side channel flow from the January 2002 flood on the Dungeness River. Ten existing side channels were identified to study during a follow-up meeting at the Jamestown S’Klallam Tribal Center (see table 1 and Attachment A). Study team members accomplished a second field reconnaissance on August 15, 2002, to investigate the measurement sites chosen for each of the side channels. 2.2 Survey Data New cross section data was collected to compare the elevation of the side channels relative to the adjacent main channel (figure 2). This data helps describe whether a particular side channel receives flow from the main channel through surface water connections, groundwater interaction, or a combination of both. In 1997, Reclamation surveyed a network of 60 cross sections (XSs) across the active, unvegetated channel in the lower 10.5 RM. The network was established in Washington State Plane Coordinates (1983 North American Datum, Washington North Zone and 1988 National American Vertical Datum) and has permanent benchmarks so that repeat survey work is possible. Longitudinal cross section spacing was approximately 1000 ft, with sections spaced closer together in areas where significant changes in alignment or geometry were evident. Additional cross section work was accomplished for a portion of the cross sections in 1998, 1999, and 2000 to resurvey where changes were observed or to extend existing sections farther into the flood plain. This survey data is documented in detail in the 2002 geomorphology report. The flood of record occurred on the Dungeness River on January 7, 2002, (7,610 ft3/s). Because the river channel alignment and geometry can have significant changes as a result of flooding, cross sections established in the vicinity of the ten side channels were resurveyed to document existing conditions (see attachment B). Four new cross sections were also surveyed to provide additional data where needed. Traditional total station equipment was used and tied to the existing control network established in 1997. The new survey work was done in two phases starting in late April to beginning of May, and finishing in August 20-27, 2002, by the Reclamation survey crew from Ephrata, WA. Assistance by the Tribe was provided during the survey work to help clear brush and locate stage recorders in side channels.

5
Figure 2. Example of cross section survey location and equipment.
2.3 Mainstem Flow Measurements Three gage sites along the study reach were utilized to provide discharge data for the mainstem Dungeness River (see Attachment A aerial photographs for locations). The three sites provide measurements at the upstream, middle, and downstream end of the study reach. Discharge on the mainstem Dungeness River is continuously recorded by the United States Geological Survey (USGS) at a gage site near the upstream end of the study reach, about 1 mi upstream from the confluence with Canyon Creek (USGS Gage 12048000, RM 11.8, drainage area of 156 mi2). The period of record includes June 1923 to September 1930, and from June 1937 to present. In addition to this gage location, two additional sites were used by USGS to estimate discharge from 1897 to 1901, but are not directly equivalent to the current gage. A temporary gage was established just downstream of the Railroad Bridge (RM 5.7) along the east (right) bank by the WSDOE on July 23, 2002, for this study. This gage represents mainstem river flow at a location near the middle of the study reach. Discharge measurements were recorded every fifteen minutes between July 23 and October 23, 2002. A third gage on the mainstem Dungeness River operated by the WSDOE records continuous discharge measurements at the Schoolhouse Bridge (RM 0.7) near the downstream end of the study reach. This gage was established in 1999 and continuously records river stage and temperature.

6
2.4 Diversion Channel Flow Measurements The following text is taken directly from the WSDOE Web Site with permission to reprint in this report (www.ecy.wa.gov/apps/watersheds/flows/state.asp).
In April 1998, the WSDOE and the members of the Dungeness River Water Users Association formalized a memorandum creating a temporary trust water right under Chapter 90.42 RCW. This agreement describes the process of creating a permanent trust water right for future irrigation and in-stream flows and states that no more than 50 percent of the flow of the Dungeness River may be diverted. To assist the Dungeness River Water Users Association with the implementation of this agreement, WSDOE has installed five flow-monitoring stations on selected irrigation ditches. In cooperation with the irrigation districts, Parshall flumes and near real-time flow monitoring equipment has been installed at the CCD Irrigation Ditch (above the split), at the Independent Irrigation Company Ditch (at the fish screen), at the Agnew Irrigation Ditch (at the fish screen), at the Sequim Prairie/ Dungeness District Ditch (at the fish screen), and at the Highland Irrigation District Ditch (at the fish screen). Construction of these sites was completed in Spring 2001 (see attachment A aerial photographs for locations).
2.5 Side Channel Flow and Temperature Measurements In early June 2002, the Tribe installed fourteen staff gauges in ten side channels (see attachment A for locations on aerial photographs and figure 3). At Kinkade Island and on the east side upstream of the Railroad Bridge, the side channels contained multiple flow paths. Staff gauges were installed on each of the flow paths to capture the total side channel discharge. Temperature data loggers (tidbits) were also placed at cross-sections 22, 23, 33, 36-east, 36-west, and 40 in June 2002 (see attachment D for temperature data). Weekly readings were done at each of the fourteen sites between mid-June to the end of September 2002 to record the temperature, velocity, depth, width, and stage. The data collection period was extended to include the time period when the majority of irrigation withdrawal is stopped in mid-September. This data was utilized to determine the discharge at each of the measurement locations, along with record information that can be used to assess the aquatic habitat value. During the peak snowmelt period in June, certain side-channels were determined to be unsafe for wading due to high discharges and only stage readings were recorded at these sites (Stevens/Savage, East Railroad Bridge, Dawley, and Kinkade Creek). By July 1 all fourteen sites were safe for wading and measurements continued on a weekly basis for the remainder of the study.

7
Figure 3. Shawn Hines of Jamestown S'K lallam Tr ibe at discharge measurement location in side channel.
Photo taken August 15, 2002.

8
3.0 CONCEPTUAL DISCUSSION OF FLOW MEASUREMENTS AND INTERACTION BETWEEN MAIN CHANNEL AND SIDE CHANNEL
FLOWS Side channel habitat parameters of interest are water velocity, depth, width, and temperature. These parameters are dependent upon discharge in the side channel, which in turn is dependent on the amount of flow in the main channel. By knowing how flows in the side channel are impacted by changes in main channel discharge, we can develop a real time tool for the assessment of habitat parameters in the side channels. The following section discusses how flow measurements are accomplished, and what types of flow interactions between mainstem and side channel flow occur on the Dungeness River. 3.1 Use of Rating Curve to Determine River Discharge River channel discharge can be easily determined for a given location by simply knowing the stage, or water depth, of flow in the channel once a rating curve has been established. A rating curve provides a mathematical relationship between the depth of water in feet (as measured by a staff gage that determines the stage of the river), and the discharge of water in cubic feet per second at a given cross section. The relationship is of the form
stage C aQwb= + (3.1)
where Qw is the measured discharge of water (ft3/s), and a, b and C are constants to be determined empirically. The curve is based on fitting the above mathematical equation to discharge measurements collected at various flow magnitudes. The rating curve is appropriate to use for the range of flows measured at the location of the measurements. Typically, a cross section location is chosen for measurements that is relatively stable and does not change significantly over time. If the geometry of the section does change, a new rating curve must be established because the relationship between discharge and stage will have been altered. As an example, flow in the main channel has been continuously measured at a USGS gage located on the Dungeness River at RM 11.8 since 1937. The rating curve for the USGS RM 11.8 gage (see figure 4) is represented by the following equation:
stage Qw= 072 0 26. . (3.2)
In this case the constant C = 0, representing that there is no discharge when the stage is 0 (dry channel). If C > 0, then it would represent that a stage measurement > 0 corresponds to a flow of 0 ft3/s (ponded water with no conveyance). The given stage discharge relationship was developed by USGS in the summer of 2002 after the channel geometry significantly changed during the flood of record in January 2002.

9
Rating Curve for USGS Dungeness River Upstream gage
0
0.5
1
1.5
2
2.5
3
3.5
4
4.5
0 100 200 300 400 500 600 700 800 900 1000
USGS gage discharge (cfs)
Sta
ge
(ft)
Figure 4. Rating curve for the USGS RM 11.8 gage on the Dungeness River .
The relationship between water discharge and stage is not linear. At lower flows, stage increases much more rapidly than wetted width with increases in flow. This relationship continues until the discharge increases enough that the banks on either side of the channel begin to be overtopped, known as a “bankfull” channel condition. Once the channel banks are overtopped, wetted width increases much more rapidly than stage as the water begins to inundate the flood plain. This is why the stage-discharge rating curve for the RM 11.8 gaging station is steeper at lower flows and flattens out as flows increase in magnitude. 3.2 Flow Interactions between Main Channel and Side Channels Water in Dungeness River side channels originates from either a groundwater connection, or a combination of a groundwater and surface flow connection at the head of the side channel (figure 5). Most often the dominant source of groundwater or surface flow into the side channel originates from the mainstem river, although other sources do exist including irrigation diversion return flows and natural springs. Both surface water and groundwater side channels have a surface water connection with the mainstem at the downstream end of the side channel. So the groundwater side channels are never completely isolated habitats unconnected with the mainstem. The surface flow relationship between the main channel and side channel is a function of the depth of water in the main channel, along with the width and relative elevation of the entrance to

10
the side channel (figure 5). This relationship can be theoretically represented by the weir equation, where the width of the side channel entrance is equivalent to the length of the weir. The elevation of the crest of the weir can be represented by the elevation of the bed of the side channel, or even the top of a dense, stable log jam. In figure 5, the side channel bed elevation is higher than the river bed elevation, though many cases exist where the rive bed elevation is higher than the side channel bed elevation. In the latter cases, the value of h in the weir equation would be measured from the river bed.
Side Channel connections to main channel
Groundwater fed side channel
Groundwater flow
Main Channel
Surface water connected side channel
Q KWhs =3
2
K = constant
Q KA hs = ( )∆ 12 K = Constant
A = area of wetted side channel bottom�
h = difference in elevation of side channel and main channel water surface
River bank overtopped during high flows
Figure 5. Theoretical illustration of the connection of a side channel with the main channel.
The flow relationship for the side channel is given by the following weir type of equation.
Q KWhs = 32 (3.3)
where K = empirically determined constant, W = width of side channel entrance (ft), h = head or depth of water (ft) measured from the crest of the weir to the water surface.
Groundwater flow from the mainstem into side channels occurs when the main channel water surface elevation is equal to or higher in elevation than the water surface in the side channel. Groundwater flow of this type is termed hyporheic. Hyporheic flow is water that flows just below the surface of the river in the interstitial spaces of sediment and is closely related to surface flow in the mainstem of the river. The majority of groundwater flow into side channels is a from hyporheic flow, however there may be cases where groundwater seeping from other sources may feed a groundwater side channel. Groundwater flow can be theoretically

11
represented by an orifice type of equation, where the side channel flow is a function of the square root of the head (difference in stage) in the main channel.
Q KA hs = ∆ 12 (3.4)
where Qs = flow in the side channel (ft3/s), K = empirically determined constant, A = wetted area of the side channel bottom,
�h = h1 – h2,
h1 = water surface elevation of the main channel (ft), h2 = water surface elevation of the side channel (ft).
In the case of groundwater flow into a side channel, A is the wetted area of the side channel bed surface multiplied by the porosity (n) of the surface through which groundwater is flowing,
A nA= bed surface (3.5)
and
nV
Vv
t
= (3.6)
where Vv = volume of voids in river bed-material, Vt = total volume of river bed-material.
Figure 6 shows a comparison between the flow in three theoretical side channels relative to the flow in the main channel. The first channel has only a groundwater flow connection no matter how high the flow in the main river channel gets (small dashed line). The second channel starts with only a groundwater connection, but when the main channel river flow exceeds 250 ft3/s, the head in the main channel becomes high enough to initiate a surface flow connection into the side channel also (medium dashed line). The third channel has a surface flow and groundwater connection at almost all flows, even when the discharge in the main channel is relatively low. (Flow in surface water and groundwater connected side channels is dominated by the surface flow component, therefore these types of channels are referred to as surface water side channels.) The figure illustrates the large difference in discharge magnitude between a side channel with a surface water connection versus only a groundwater flow connection from the main channel.

12
0
100
200
0 500
Main Channel Discharge (cfs)
Sid
e C
ha
nn
el
Dis
ch
arg
e (
ft)
Surface water connected
Groundwater connected
Surface water connection when Q > 250 cfs inmain channel
Figure 6. Theoretical curves obtained by applying a weir type equation (Equation 3.3) to estimate side channel flow from a main channel sur face water connection and by applying an or ifice type equation (Equation 3.4) to estimate side channel flow from a main channel groundwater connection.

13
4.0 VARIATION IN MEAUSURED MAINSTEM CHANNEL DISCHARGE Since the flow magnitude in side channels is dependent upon flow magnitude in the main channel, it is important to determine if the main channel flow gains or loses flow throughout the study reach. This is of particular importance during low flow periods in the late summer and early fall when reductions in mainstem flow will have a greater impact on whether a side channel maintains a surface water connection with the main channel. The majority of reductions in flow in the main channel result from either irrigation diversions or natural flow losses to groundwater. The majority of gains in main channel flow likely occur where the main channel is lower in elevation than the adjacent flood plain. Along a given reach of river, if groundwater is lost, it is lost in proportion to the head difference between the water surface main channel and the water table elevation of groundwater.
groundwater loss∝ ∆ h Achannel
12 (3.7)
where Achannel = wetted area of the channel bed, �
h = hs – hg, hs = water surface elevation of flow in the main channel, hg, = top of the water table of the groundwater.
A similar relation holds for a gain in discharge in the main channel from the addition of groundwater. In this case, the water table elevation in the groundwater is greater than the water surface in the channel. 4.1 Previous Investigation of Groundwater Interaction by USGS The USGS in collaboration with the WSDOE published a report in 2002 on surface water-ground water interactions along the main channel of the Dungeness River between USGS stream gage 12048000 upstream at RM 11.8 and Schoolhouse Bridge downstream at RM 0.7 (Simonds and Sinclair, 2002). The study was conducted over a period of 22 months from September 1999 to July 2001 and covered a wide range of flows. The river was divided into five reaches:
1. Reach 1 extends from the USGS RM 11.8 gage to Dungeness Meadows (RM 11.8 to 8.13)
2. Reach 2 extends from Dungeness Meadows to the Railroad Bridge (RM 8.13 to 5.54) 3. Reach 3 extends from the Railroad Bridge to the New Old Olympic Highway Bridge
(RM 5.54 to 3.68) 4. Reach 4 extends from the New Old Olympic Highway to Woodcock Road (RM 3.68 to
2.92) 5. Reach 5 extends from Woodcock Road to the Schoolhouse Bridge (RM 2.92 to 0.71).
A combination of in-stream mini-piezometers and off stream well transects were used to determine groundwater levels and the direction of groundwater flow. From this data, the direction of groundwater flow can be determined and whether a given reach of the mainstem river is losing or gaining flow to or from groundwater (table 2). Negative values represent the loss of flow from the reach and positive values represent a gain of flow to the reach.

14
Table 2. Summary of USGS data showing the discharge loss or gain along the Dungeness River by reach (Simonds and Sinclair , 2002) of sur face water-ground water interactions. The study per iod was the 22 month per iod from September 1999 to July 2001 and covered a wide range of flows in the main channel.
Reach 1 Reach 2 Reach 3 Reach 4 Reach 5 USGS RM 11.8
gage to Dungeness Meadows
Dungeness Meadows to RR Bridge
RR Bridge to Old Olympic Hwy
Old Olympic Hwy to Woodcock Bridge
Woodcock Bridge to Schoolhouse Bridge
Flow reduction (-) or gain (+) (ft3/s) per river mile: Min -2.1 0.23 -0.54 12.2 -2.1
Max -4.1 3.5 -12.8 21.1 -5.2 Total flow reduction (-) or gain (+) over reach (ft3/s):
Min -7.707 0.596 -1.004 9.272 -4.641 Max -15.047 9.065 -23.808 16.036 -11.492
Flow reduction (-) or gain (+) over reach as percentage of channel flow: Min -4.0% 0.5% -1.0% 4.6% -2.8%
Max -6.0% 3.0% -8.0% 5.8% -4.0% Length of reach (mi)
3.67 2.59 1.86 0.76 2.21
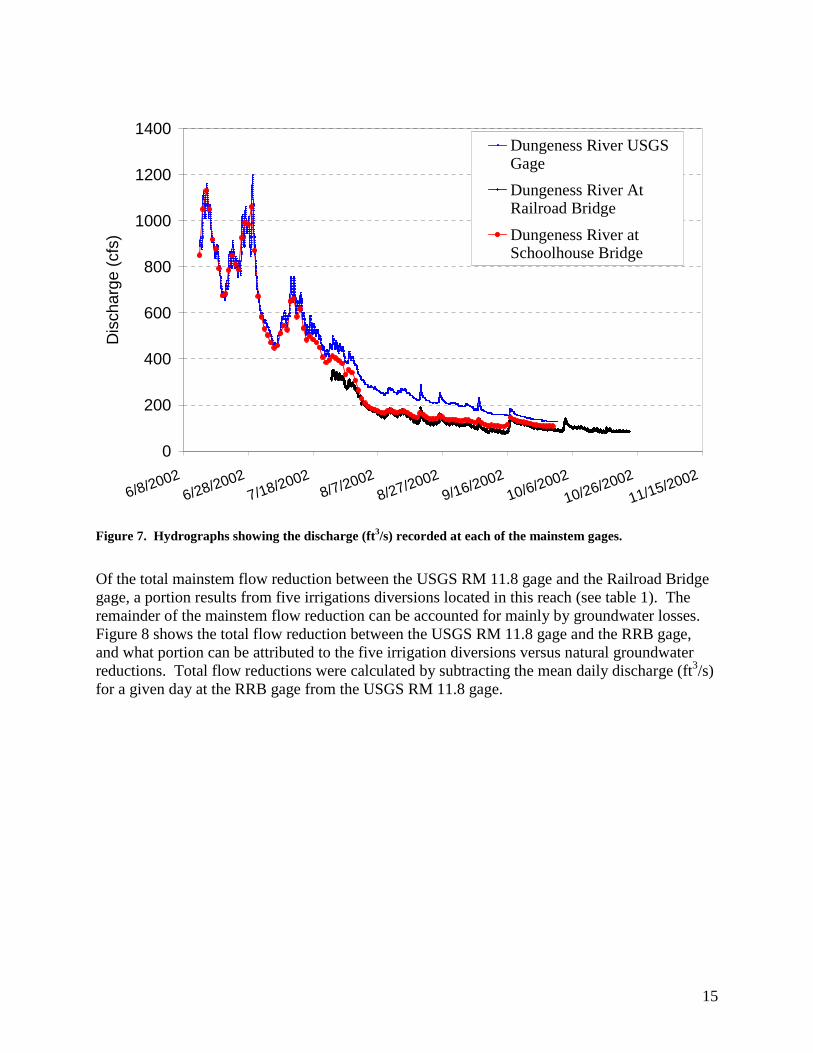
Reach 1 between the USGS gage and Dungeness Meadows is a losing reach losing a maximum of 15 ft3/s of total flow over the reach according to the USGS-WSDOE study. Reach 2 is a gaining reach showing gains of at least 0.6 ft3/s over the reach before reaching the railroad bridge. Reaches 3 and 5 downstream of the railroad bridge are both losing reaches, and reach 4 is a gaining reach. 4.2 New 2002 Mainstem Discharge Data Three mainstem flow measurement locations were utilized for the side channel study at RM 11.8, the Railroad Bridge at RM5.7, and the Schoolhouse Bridge at RM 0.7. Figure 7 shows the study period hydrographs for the three mainstem gages. Based on these mainstem flow measurements, flow reductions are found to occur between the USGS RM 11.8 gage and the gage at Railroad Bridge over the course of the study period. During the beginning of the study period when mainstem flows are higher, the river gains flow between the Railroad and Schoolhouse Bridges, but this reach tends to lose flow as mainstem flows decrease during the latter part of the study period (figure 7). Note that data from the Railroad Bridge (RRB) gage are only available beginning on July 23, 2002.
15
0
200
400
600
800
1000
1200
1400
6/8/20026/28/2002
7/18/20028/7/2002
8/27/20029/16/2002
10/6/2002
10/26/2002
11/15/2002
Dis
char
ge (
cfs)
Dungeness River USGSGage
Dungeness River AtRailroad Bridge
Dungeness River atSchoolhouse Bridge
Figure 7. Hydrographs showing the discharge (ft3/s) recorded at each of the mainstem gages.
Of the total mainstem flow reduction between the USGS RM 11.8 gage and the Railroad Bridge gage, a portion results from five irrigations diversions located in this reach (see table 1). The remainder of the mainstem flow reduction can be accounted for mainly by groundwater losses. Figure 8 shows the total flow reduction between the USGS RM 11.8 gage and the RRB gage, and what portion can be attributed to the five irrigation diversions versus natural groundwater reductions. Total flow reductions were calculated by subtracting the mean daily discharge (ft3/s) for a given day at the RRB gage from the USGS RM 11.8 gage.

16
0
20
40
60
80
100
120
140
160
7/23
7/30 8/
68/
138/
208/
27 9/3
9/10
9/17
9/24
10/1
10/8
10/1
510
/22
Date
Flo
w R
educ
tion
(cfs
)
Natural Flow ReductionsTotal Irrigation Diversions
Figure 8. Total mean daily flow reduction between the USGS RM 11.8 gage and the Railroad Br idge gage.
Figure 9 shows a comparison of the natural flow reduction (groundwater losses) between the USGS RM 11.8 and RRB gages for the 2002 side channel study data and estimated data based on predictive tools provided in the USGS-WSDOE study. The USGS-WSDOE flow loss was computed by assuming a constant discharge reduction based on the maximum potential natural flow reduction that could occur for this reach (see table 2). The overall trend of natural flow reduction measured in the main channel is consistent with the findings from the USGS-WSDOE study of the Dungeness River. However, the magnitude of natural flow reduction measured from the 2002 Reclamation stream gage data indicates a greater natural loss of flow over most of the study period flows than would be expected assuming the maximum possible loss as reported in the USGS-WSDOE study for this reach. The larger groundwater losses predicted from the 2002 data may be due to mainstem and irrigation diversion gage error (typically +/- 5 percent), lag time of water from USGS gage to the Railroad Bridge, or even local precipitation which could cause local peaks not accounted for in the USGS-WSDOE prediction. Although there is overall more fluctuation in the measured 2002 data than the predicted USGS-WSDOE values, in general the values show a consistent trend that indicates a natural flow reduction between the USGS RM 11.8 and the RRB gages does occur as a result of groundwater losses, but the magnitude of groundwater loss gradually decreases as main channel flow decreases.

17
Natural Flow Reductions in the Main Channel
0.0
10.0
20.0
30.0
40.0
50.0
60.0
7/20
/200
2
7/27
/200
2
8/3/
2002
8/10
/200
2
8/17
/200
2
8/24
/200
2
8/31
/200
2
9/7/
2002
9/14
/200
2
9/21
/200
2
9/28
/200
2
10/5
/200
2
10/1
2/20
02
10/1
9/20
02
10/2
6/20
02
11/2
/200
2
Date
Dis
char
ge
Red
uct
ion
(cf
s)
Observed Natural Flow Losses
Max. Potential Losses (USGS study)
Figure 9. Compar ison of natural flow reduction (groundwater losses) observed in side channel study between the USGS RM 11.8 gage and Railroad Br idge (dotted line) and the maximum predicted flow reduction (solid line) from the USGS-WSDOE study.

18
5.0 DESCRIPTION OF SIDE CHANNELS Ten side channels were evaluated in this study as shown on the aerial photographs in Attachment A. The location of each side channel is given in Table 3 by river mile, along with its approximate length, and whether it is located to the right or left of the mainstem river channel.
Table 3. Location by r iver mile of side channel entrance (star t) and exit (end), approximate length of side channel in feet, and the location of the side channel relative to the main channel (r ight or left side of main channel).
Side Channel Or Mainstem Gage
River Mile: Start
River Mile: End
Approximate Length
(ft)
Right (East) or Left (West) of Main channel
USGS gage 11.8 Kinkade Channels: 10.2 9.5 4720 Right (1) Kinkade right (east) Right (2) Kinkade middle Right (3) Kinkade left (west) Right Spring 7.5 6.4 3370 Right Dawley 6.9 3630 Right Upper Right (East) RRB 5.9 5.72 1880 Right Upper Left (West) RRB 5.9 5.68 1330 Left Railroad Bridge (RRB) gage
5.7
Lower Right (East) RRB 5.4 4.83 3060 Right Stevens/Savage 4.7 4.37 1730 Right Gagnon Right (East) 4 3.64 1380 Left Gagnon Left (West) 3.9 3.64 1300 Left Anderson 3.6 3.31 1680 Right Schoolhouse Bridge gage 0.7
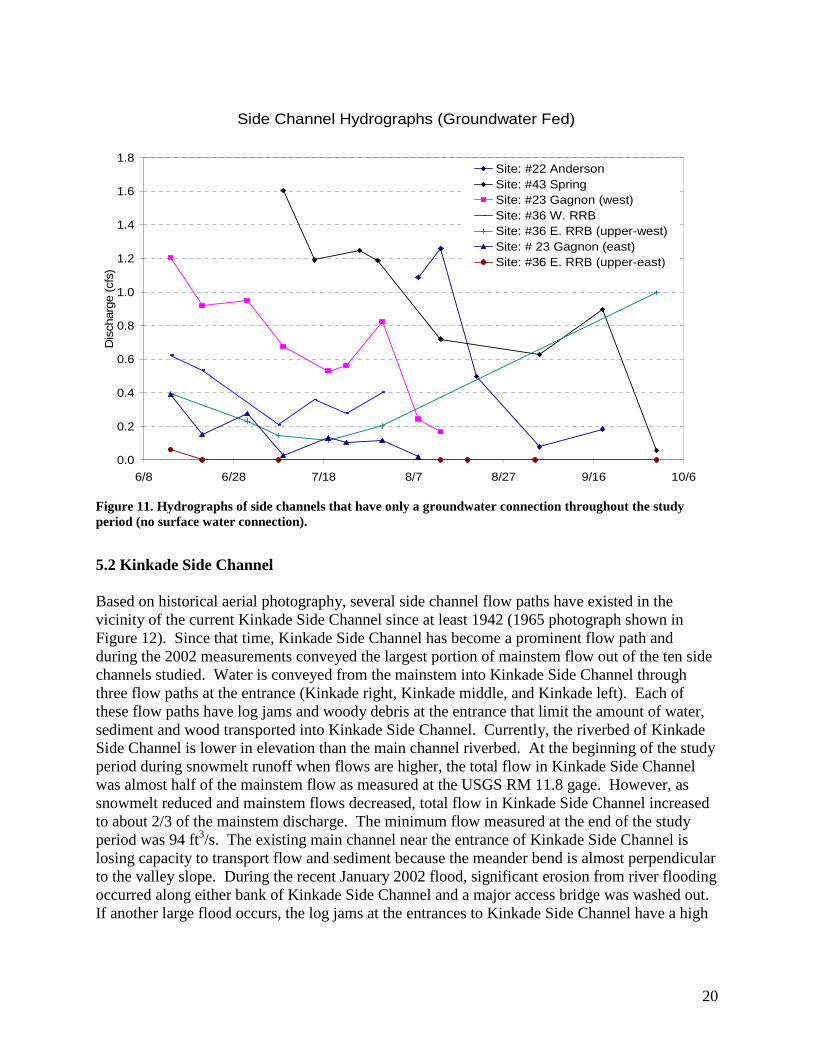
5.1 Surface Water versus Groundwater Connections in Side Channels There are two categories of side channels that can be defined for this study, those with surface water and groundwater connections, and those with only groundwater connections. Figure 10 shows the hydrographs of each of the side channels that had a surface water connection with the main channel throughout most or all of the study period. Figure 11 shows the hydrographs of side channels that had only a groundwater connection throughout the study period. Anderson, Lower Right RRB, Stevens/Savage, Dawley, and the Kinkade Side Channels show a surface water connection for all or most recorded flows throughout the study period. Two side channels, Anderson and Stevens/Savage showed evidence that toward the latter part of the study period when main channel flows reduced, the dominant source of flow shifted from primarily a surface water connection to solely groundwater fed. Gagnon right, Gagnon left, Upper Left RRB, Upper Right RRB, and Spring Creek Side Channels showed only a groundwater connection throughout the study period. Whether a side channel has a surface flow connection during the irrigation period appears to depend not only on the elevation of the side channel bed relative to the stage in the mainstem river, but also on whether the low flow main channel runs adjacent to the entrance.

19
Side Channel Hydrographs (surface water fed)
0
20
40
60
80
100
120
140
160
6/8 6/28 7/18 8/7 8/27 9/16 10/6
Dis
char
ge (cf
s)
Site: Kinkade East
Site: #33 E. RRB (lower)
Site: #29 Stevens / Savage
Site: #40 Dawley
Site: Kinkade Middle
Site: Kinkade West
Site: #22 Anderson
Figure 10. Hydrographs of side channels that have a sur face water and groundwater connection throughout most or all of the study per iod.
20
Side Channel Hydrographs (Groundwater Fed)
0.0
0.2
0.4
0.6
0.8
1.0
1.2
1.4
1.6
1.8
6/8 6/28 7/18 8/7 8/27 9/16 10/6
Dis
char
ge (
cfs)
Site: #22 AndersonSite: #43 SpringSite: #23 Gagnon (west)Site: #36 W. RRBSite: #36 E. RRB (upper-west)Site: # 23 Gagnon (east)Site: #36 E. RRB (upper-east)
Figure 11. Hydrographs of side channels that have only a groundwater connection throughout the study per iod (no sur face water connection).
5.2 Kinkade Side Channel Based on historical aerial photography, several side channel flow paths have existed in the vicinity of the current Kinkade Side Channel since at least 1942 (1965 photograph shown in Figure 12). Since that time, Kinkade Side Channel has become a prominent flow path and during the 2002 measurements conveyed the largest portion of mainstem flow out of the ten side channels studied. Water is conveyed from the mainstem into Kinkade Side Channel through three flow paths at the entrance (Kinkade right, Kinkade middle, and Kinkade left). Each of these flow paths have log jams and woody debris at the entrance that limit the amount of water, sediment and wood transported into Kinkade Side Channel. Currently, the riverbed of Kinkade Side Channel is lower in elevation than the main channel riverbed. At the beginning of the study period during snowmelt runoff when flows are higher, the total flow in Kinkade Side Channel was almost half of the mainstem flow as measured at the USGS RM 11.8 gage. However, as snowmelt reduced and mainstem flows decreased, total flow in Kinkade Side Channel increased to about 2/3 of the mainstem discharge. The minimum flow measured at the end of the study period was 94 ft3/s. The existing main channel near the entrance of Kinkade Side Channel is losing capacity to transport flow and sediment because the meander bend is almost perpendicular to the valley slope. During the recent January 2002 flood, significant erosion from river flooding occurred along either bank of Kinkade Side Channel and a major access bridge was washed out. If another large flood occurs, the log jams at the entrances to Kinkade Side Channel have a high

21
probability of being breached. If this occurs, Kinkade Side Channel will become the main channel, and the current main channel would eventually re-vegetate and become a side channel.
Figure 12. 1965 aer ial photograph of K inkade Side Channel and Island.
Main Channel
Side Channels

22
5.3 Spr ing Side Channel The entrance to Spring Side Channel is cutoff from the mainstem river by the Dungeness Meadows Levee and, therefore does not have a surface flow connection to the mainstem at any flow (see Attachment A). At the measured cross section located about half way down the side channel, the side channel bed elevation is 4 feet higher than the mainstem riverbed. The current source of water is only groundwater, likely from a natural spring since the side channel bed is significantly higher in elevation than the mainstem riverbed (maximum discharge measured was 1.6 ft3/s). Given the absence of a surface water connection and the presence of the levee, it is likely that Spring Side Channel will remain relatively stable, and will continue to have a small, limited amount of discharge as long as the groundwater source is maintained. 5.4 Dawley Side Channel Dawley Side Channel maintained a surface water connection throughout the study period. The gage measurement location on Dawley was in the downstream half of the channel, downstream of the Sequim Prairie Irrigation diversion (see Attachment A). A surface flow connection from the mainstem river is maintained just upstream of Dawley Side Channel in order to maintain flow into the Sequim Prairie Irrigation Diversion. A portion of the diverted flow bypasses the irrigation ditch and enters the Dawley Side Channel. Therefore, as long as the upstream diversion is maintained, it is likely that Dawley Side Channel will remain stable and continue to have a surface flow connection to the mainstem river. The minimum flow measured was 19.5 ft3/s for the channel gage located downstream of the diversion, but would be higher if measured in the short channel section upstream of the diversion. Dawley Side Channel is lower in elevation than the mainstem riverbed in the upstream half (above the diversion and gage measurement location), and has approximately the same elevation as the main channel just downstream of the gage in the lower half of the channel. 5.5 Railroad Br idge Side Channels Three side channels were studied in the vicinity of the Railroad Bridge. Analysis of historical aerial photography indicates that this is a very dynamic section of river. This is also a section of river where a major transition in slope begins to occur. Because the slope of the river begins to decrease in this reach, the river’s capacity to transport sediment and woody debris is also reduced. Therefore, the low flow main channel is constantly migrating and avulsing in response to changing sediment and woody debris deposition within the active channel area. During the irrigation period, the amount of flow in the side channels is highly dependent on the location of the low flow river channel in the active flood plain. When the low flow channel is located near the entrance to a given side channel, a surface water connection is easily maintained into the side channel. However, when the low flow main channel is not located near the entrance, groundwater is the only source of flow into the side channel during low flow periods. However, when a large enough flood occurs, the entire active channel becomes inundated and a surface water connection would be initiated. The side channel just downstream of the Railroad Bridge on the right side (Right RRB lower) is a relatively new side channel that was formed during the January 2002 flood (see photo below

23
and Attachment A). This side channel maintained a significant surface water connection throughout the study period. The entrance to the side channel is on the outside of a meander bend, and has no woody debris or log jams at the entrance limiting sediment or wood from being transported into the side channel. Overall, the flow measured in this channel was the second largest of all the side channels after Kinkade. The side channel elevation at a point 400 ft downstream from the side channel entrance is 5 feet higher than the mainstem riverbed. The fact that the side channel bed elevation is higher than the main channel at some distance from the side channel entrance indicates that the side
channel does not likely have a significant groundwater connection with the main channel. Two side channels were studied upstream of the Railroad Bridge, one on the right side and one on the left side of the main channel (Upper Right RRB and Upper Left RRB). Neither of these channels showed a surface flow connection during the study period. Maximum flows measured were 0.4 ft3/s (right side) and 0.6 ft3/s (left side). The left side channel is 4 feet higher than the mainstem riverbed 400 ft downstream from the channel entrance. The right side channel, approximately 300 ft downstream from the side channel entrance, is 1 foot lower in elevation than the mainstem riverbed. 5.6 Stevens/Savage Side Channel Stevens/Savage Side Channel had the third largest flow measurements at the start of the study period when flows were high as a result of snowmelt; as snowmelt decreased, flow in the side channel was significantly reduced. The side channel appeared to lose the surface flow connection when mainstem flows went below around 105 ft3/s. For main channel flows less than 105 ft3/s the side channel is likely fed only by groundwater. At the upstream end, the side channel bed is 7 feet higher in elevation than the mainstem riverbed, which likely explains the lack of surface flow connection with the main channel during the lower flow periods. The cross-section in the middle of the side channel showed that the side channel bed was only 3 feet higher than the mainstem. The elevation at the outlet of the side channel is estimated to be similar to the mainstem riverbed elevation directly adjacent to the outlet. Historical aerial photography shown on the following page indicates that this side channel has been persistent since at least 1942. However, the surface water connection with the mainstem likely changes over time, depending on the location of the low flow mainstem river channel. When the low flow main channel passes along the entrance to Stevens/Savage as it does currently and it did in 1965, the surface flow connection would be maintained. However, when the low flow mainstem channel is located on the opposite side, as shown in 1942, there is likely only a groundwater connection even during periods of relatively high flow.

24
1942 Aerial Photograph 2002 Aerial Photograph 1965 Aerial Photograph
Stevens/Savage Side Channel

25
5.7 Gagnon Side Channel Data from Gagnon right and left side channels, which are just downstream of the Olympic Highway Bridge on the left side of the mainstem river (two flow paths), indicate a lack of a surface water connection throughout the study period. The maximum flows measured were 0.4 (right) and 1.2 (left) ft3/s. Both side channels near the upstream end are about 3 feet higher in elevation than the mainstem riverbed, contributing to the absence of a surface water connection at lower flows. These side channels appear to have existed in some form since at least 1942 as shown on the historical aerial photograph on the following page. It is likely these side channels will continue to persist, but will only have a surface water connection during high flows when the active channel becomes completely inundated from the right to left river banks. 5.8 Anderson Side Channel The Anderson Side Channel had a surface flow connection during the initial snowmelt portion of the study period when flows were higher. The surface flow connection was lost during August when mainstem flows fell below 160 ft3/s, but a groundwater connection was maintained. At the upstream end, the side channel bed elevation is 0.7 feet lower than the mainstem bed elevation, and at the downstream end the side channel bed is 0.6 feet higher than the mainstem bed. Historical aerial photography shown on the following page indicates that this side channel has existed since at least 1942. The photography also indicate that the surface water connection will only be maintained during the irrigation period when the low flow main channel passes along the entrance to the Anderson Side Channel, as it is currently.

26
1942 Aerial Photograph 2002 Aerial Photograph 1965 Aerial Photograph
Gagnon
Anderson

27
6.0 TOOLS FOR PREDICTION OF SIDE CHANNEL HYDRAULIC PARAMETERS
6.1 Prediction of Side Channel Discharge Using discharge measurements from the study, a relationship can be established to develop a predictive equation to estimate side channel discharge at any gage location for a given discharge in the main channel. Because the USGS RM 11.8 gage is upstream of all of the side channels being evaluated and will continue to be operated in the future, it is used to approximate main channel discharge. In order to more accurately account for flow reductions between the USGS RM 11.8 gage and each side channel, all irrigation diversions upstream of a given side channel can be subtracted from the USGS measurement. Additional flow losses in the main channel upstream of the Railroad Bridge due to groundwater interaction were incorporated using an empirically derived constant as discussed below. The relations given are valid only for the flow range that occurred during the study period and was used for analysis of each particular side channel (not appropriate for large winter floods). The discharge in each side channel can be directly related to the discharge in the main channel using a power equation of the following form:
Q k Q Cs md= −( ) (6.1)
where Qs = side channel discharge (ft3/s), Q Q Q Q Q Q Qm USGS Ag Sqpr Hld Ind CCD= − − − − −
QUSGS = discharge in the main channel as recorded at the USGS gage (ft3/s), QAg = discharge diverted at Agnew Irrigation Ditch (ft3/s), QSqpr = discharge diverted at Sequim Prairie Irrigation Ditch (ft3/s s), QHld = discharge diverted at Highland Irrigation Ditch (ft3/s s), QInd = discharge diverted at Independent Irrigation Ditch (ft3/s), QCCD = discharge diverted at CCD Irrigation Ditch (ft3/s), Qm = discharge in the main channel near the point of side channel entrance (ft3/s s), k and d = empirically determined parameters, C = constant (ft3/s).
To get the correct measure of Qm, the discharge at the USGS RM 11.8 gage and at each of the upstream irrigation diversions must be known. If the irrigation diversion is downstream of the side channel entrance then the discharge value for that diversion in equation 6.1 is set to 0. For side channels with a surface water connection, the constant C represents both natural flow losses and an approximate measure of the discharge in the main channel below which there is no longer a surface water connection. For groundwater connected side channels, the constant C represents natural flow losses and the main channel discharge below which flow in the side channel is no longer related to flow in the main channel. Negative C values do not hold any significance with regard to main channel discharge, but instead imply that flow in the side channel would likely continue from other sources even if flow in the mainstem channel went to zero. Negative values for C occur in two side channels that do not have a surface water connection (Upper Right RRB and Upper Left RRB).

28
Table 4 shows the values of k, d, and C for each of the side channels along with the R2 value. The R2 value provides a measure of how well the predictive equation fits the observed data (a value of 1 represents a perfect fit of the model).
Table 4. Empir ical determined parameter values for equation 6.1 in text.
Surface Water Connected Side Channels Anderson Stevens/Savage Right
RRB (lower)
Dawley Kinkade Right
Kinkade Middle
Kinkade Left
Kinkade Total
k 0.0153 0.2364 1.3149 0.6603 4.088 7.1617 0.4522 1.7049 d 1.1532 1.0134 0.7539 0.7691 0.5562 0.3847 0.7743 0.8023 C 156 105 50 20 0 110 110 0 R2 0.9942 0.9878 0.9866 0.7828 0.964 0.9432 0.8501 0.9638
Groundwater Fed Side Channels Anderson Gagnon (left) Gagnon
(right) Right RRB (upper)
Left RRB (upper)
Spring
k 0.0411 0.0418 0.0016 0.0007 0.0026 0.1607 d 0.8091 0.4988 0.7607 0.8811 0.7615 0.3755 C 133 155 150 -130 -200 116 R2 0.9503 0.835 0.5546 0.4243 0.3221 0.9653
Figure 13 shows a comparison between the predictive equations for Lower Right (East) RRB Side Channel, which has a groundwater and surface water connection, and for Spring Side Channel, which has only a groundwater connection. There are several important differences that can be seen between surface water fed and groundwater fed side channels, as was discussed in section 3. First, the range of discharge throughout the study period in side channels with a surface water connection is much larger when compared to the discharge range in groundwater fed side channels (figure 14). Side channels with only groundwater connections did not attain discharges greater than 2 ft3/s during the study period. Second, side channel discharge in groundwater fed channels show very little response (increase or decrease) with changes in main channel discharge for the range of flows studied. However, discharge in side channels with a surface water connection was very responsive to changes in main channel discharge. The most noticeable change can occur in side channels where the main channel discharge becomes reduced enough that the surface water connection is lost and the side channel becomes only groundwater fed.

29
E . R R B (low e r) and S pring S ide C hanne ls D ischa rge R a ting C urves
0
20
40
60
80
100
120
140
160
180
200
0 200 400 600 800
M ain C hanne l D ischarge (c fs )
Sid
e C
ha
nn
el
Dis
ch
arg
e (
cfs
)
E . R R B (low e r)S pring
Figure 13. Discharge rating curve relating flow in the side channels (ft3/s) to flow in the main channel (USGS gage – ir r igation diversions).
Range of Side Channel Discharge
0
20
40
60
80
100
120
140
160
Sid
e C
hann
el D
isch
arge
Dis
char
ge (
cfs)
Surface Water Connected SideChannels (Black)
Groundwater Fed Side Channels(Red)
Figure 14. Compar ison of range of measured discharges in side channels with a sur face water and groundwater connection versus channels with only a groundwater connection.

30
6.2 Prediction of Side Channel Velocity, Depth, and Wetted Width The previous section discussed how to use a predictive equation to estimate the side channel discharge by knowing the mainstem channel discharge. Based on measured data from the study, additional relationships can be established between the side channel discharge and the maximum depth-averaged velocity, water depth, and wetted width at the side channel gage location. Therefore, by simply knowing the mainstem discharge, the side channel discharge, maximum depth-averaged velocity, water depth, and wetted width can be estimated for the range of flows studied using these predictive equations. Each of the hydraulic parameter predictive equations also follows the form of a power function:
V D W kQsd, , = (6.2)
where V = Maximum depth-averaged velocity (ft/s) D = Maximum depth (ft) W = Wetted width (ft)
Qs = side channel discharge (ft3/s) k and d = empirically determined coefficients. Tables 5 and 6 provide the information utilized to develop the predictive equations for the surface water and groundwater fed only side channels, respectively. The R2 value presented in the tables show the relative “ fit” of the measured data to the predictive equation. The higher the R2 value, the better the predictive equation represents the measured values, with a R2 value of 1 being a perfect fit. The rating curves for velocity, depth, and width for each of the side channels are contained in Attachment C. The relationship between side channel discharge and maximum depth-averaged velocity, maximum depth, and wetted width of the side channel are different for side channels with a surface water connection when compared to side channels with only a groundwater connection. Figures 15 through 17 show the range of velocity, depth, and width found in surface water connected side channels as compared to groundwater fed side channels. The range of velocities found in groundwater side channels is much smaller than that found in surface water side channels. This is consistent with the much smaller range of flows found in groundwater side channels. The range of maximum depth and wetted width of groundwater side channels is also lesser than the range found in surface water side channels. However, the range of depths and widths is large relative to the range of flows in groundwater side channels. This is further illustrated by the relatively low R2 values for channel depth and width predictive equations for groundwater fed channels when compared to surface water fed side channels. However this is not the case for the velocity predictive equations, where R2 values are relatively high for both surface water and groundwater fed side channels. This indicates that discharge in groundwater side channels is not a good indicator of side channel depth or width, each of which may be important habitat parameters. Furthermore, main channel discharge will also not be a good indicator of groundwater side channel depth or width.

31
Range of Side Channel Velocity
0
1
2
3
4
5
6
Vel
ocity
(ft/
s)
Surface Water Connected SideChannels (Black)
Groundwater Fed SideChannels (Red)
Figure 15. Range of maximum depth averaged velocity of flow in sur face water side channels (black) and groundwater side channels (red).
Range of Maximum Depth of Side Channels
0
0.5
1
1.5
2
2.5
3
3.5
4
4.5
5
Max
imum
Dep
th (ft)
Surface Water ConnectedSide Channels (Black)
Groundwater Fed SideChannels (Red)
Figure 16. Range of maximum depth of flow in sur face water side channels (black) and groundwater side channels (red).

32
Range of Maximum Wetted Width of Side Channels
0
5
10
15
20
25
30
35
40
45
50
Max
imum
Wet
ted
Wid
th (
ft)
Surface Water ConnectedSide Channels (Black)
Groundwater Fed SideChannels (Red)
Figure 17. Range of maximum wetted width of flow in sur face water side channels (black) and groundwater side channels (red).

33
Table 5. Values of empir ically determined coefficients k and d, R2, range of measured flows, velocity, depth, and width for each sur face water connected side channel.
AndersonStevens-Savage
Right (East) RRB (lower) Dawley
Kinkade east
Kinkade middle
Kinkade West
Sample size 7 11 12 11 10 10 12
Velocity (ft/s) Vs=kQsd
k 1.170 0.112 0.280 0.242 0.507 0.765 0.684
d 0.257 0.677 0.545 0.552 0.417 0.472 0.326
R 2 0.82 0.99 0.98 0.95 0.84 0.80 0.44Max. 4.0 2.5 4.1 3.1 4.2 5.6 3.9
Min. 2.4 0.2 1.7 1.2 2.8 2.6 0.9
Max. Depth (ft) Ds=kQsd
k 0.288 1.560 0.587 0.872 0.793 0.243 1.660
d 0.412 0.139 0.310 0.224 0.284 0.420 0.220R 2 0.96 0.83 0.94 0.91 0.88 0.78 0.59
Max. 1.4 3.3 2.7 2.4 3.3 1.6 4.8Min. 0.6 1.8 1.7 1.7 2.5 0.9 2.1
Max. Wetted Ws=kQsd
Width (ft) k 4.370 25.32 19.19 16.25 22.62 16.84 27.77d 0.326 0.017 0.082 0.125 0.063 0.090 0.075
R 2 0.92 0.59 0.70 0.92 0.10 0.63 0.35Max. 15.6 28.6 29.8 28.4 32.3 25.5 46.5Min. 7.7 25.7 24.9 23.3 26.6 22.1 31.1
Discharge (cfs)Max. 37.0 111.2 130.3 84.2 147.0 69.5 59.0Min. 5.0 1.8 29.0 19.5 55.8 18.8 5.7
Surface water fed side channels
Table 6. Values of empir ically determined coefficients k and d, R2, range of measured flows, velocity, depth, and width for each groundwater connected side channel.
Anderson Gagnon (west)Gagnon (east)
Upper Right RRB
Upper Left (west) RRB Spring Creek
Sample size 5 9 8 5 6 8
Velocity (ft/s) Vs=kQsd
k 1.160 0.320 0.626 0.518 0.134 0.269d 0.529 0.660 0.770 0.971 0.051 0.604
R 2 0.95 0.85 0.95 0.71 0.02 0.97Max. 1.29 0.41 0.26 0.27 0.15 0.41Min. 0.27 0.11 0.03 0.07 0.10 0.05
Max. Depth (ft) Ds=kQsd
k 0.339 0.765 0.787 0.571 1.640 0.802d 0.251 0.171 -0.026 -0.069 0.151 -0.037
R 2 0.87 0.40 0.10 0.15 0.31 0.92Max. 0.4 0.9 0.9 0.7 1.7 0.9Min. 0.2 0.5 0.7 0.6 1.3 0.8
Max. Wetted Ws=kQsd
Width (ft) k 6.620 10.270 4.770 14.000 10.110 19.670d -0.024 -0.026 0.056 0.066 -0.003 0.008
R 2 0.35 0.17 0.08 0.17 0.00 0.00Max. 7.2 11.5 4.9 14.1 11.8 21.7Min. 6.4 10.0 2.6 11.7 8.4 11.5
Discharge (cfs)Max. 1.29 1.21 0.39 0.40 0.62 1.61Min. 0.08 0.17 0.02 0.12 0.21 0.06
Groundwater fed side channels

34
7.0 APPLICATION EXAMPLE The following example shows how the predictive equations developed for this study can be utilized to assess whether a given side channel has viable habitat given the discharge and amount of flow being diverted for irrigation purposes in the main channel. The example habitat criteria are taken from data provided by the Tribe. Spawning Chinook are chosen arbitrarily. Example Goal: Maintain viable habitat for spawning Chinook in Stevens/Savage, Dawley, Lower Right RRB, and/or Kinkade Right side channels. Criteria: Spawning Chinook prefer habitat with a flow velocity range of 1.75 to 3.0 ft/s and a depth range of 1.2 to 3.4 ft. Question: What is the necessary minimum flow in the main channel to maintain these habitat conditions in the given side channels? Starting with Lower Right RRB Side Channel, the first step is to determine the minimum flow required to maintain the required depth range. Figure 18 shows the depth rating curve for this side channel. Looking at the vertical axis where values of maximum depth are located, it can be seen that a depth of 1.2 feet will be maintained for all flows greater than 30 ft3/s in the side channel (30 ft3/s was the lowest recorded flow in the side channel and the data should not be extrapolated past the minimum and maximum values used in the analysis). Additionally, the depth in the side channel did not rise above 3.4 feet for the range of measured flows (130 ft3/s was the highest recorded flow). Therefore, the required range of flows to maintain the depth requirement in the side channel is 30 to 130 ft3/s. Next, the range of flows in the side channel necessary to maintain the required velocity is determined. Figure 19 is the velocity rating curve for Lower Right RRB Side Channel. The minimum required velocity in the side channel is 1.75 ft/s. Looking at the vertical axis where values of velocity are located, it can be determined that a discharge of 30 ft3/s is required in the side channel to obtain this velocity. This corresponds to the lower discharge value needed to maintain depth. The maximum velocity is 3.0 ft/s. From Figure 19 it can be determined that a flow of 75 ft3/s corresponds to a velocity of 3.0 ft/s in the side channel. Since this is less than the upper value determined from the depth criteria, it represents the upper value for side channel discharge. The side channel discharge range is, therefore, 30 to 75 ft3/s to maintain the required habitat for spawning Chinook.

35
Depth Rating Curve y = 0.5868x0.3095
R2 = 0.9393
0
0.5
1
1.5
2
2.5
3
0 20 40 60 80 100 120 140
Discharge (cfs)
Max
imum
Dep
th (ft
)
Depth criterial met over entire range of recorded flows, � 30 cfs
Figure 18 Depth rating curve for Lower Right RRB Side Channel.
E. RRB (lower) Side ChannelVelocity Rating Curve
y = 0.2803x0.5449
R2 = 0.9803
0.0
0.5
1.0
1.5
2.0
2.5
3.0
3.5
4.0
4.5
0 20 40 60 80 100 120 140
Discharge (cfs)
Max
imu
m A
vera
ge
Vel
oci
ty (
ft/s
)
Observed
Minimum required velocity is 1.75 ft/s
Minimum required discharge is 30 cfs
Maximum velocity is 3.0 ft/s
Maximum discharge is 75 cfs
Figure 19. Velocity rating curve for Lower Right RRB Side Channel.

36
Finally, the discharge rating curve for the Lower Right RRB Side Channel, shown in Figure 20, is used to determine the required range of discharge in the main channel necessary to maintain the required range of discharge in the side channel. The maximum main channel discharge is determined to be 270 ft3/s, and the minimum main channel discharge is determined to be 105 ft3/s corresponding to a range of 30 to 75 ft3/s discharge in the side channel. Using the same method for the other side channels, the minimum side channel discharge and main channel discharge needed to maintain spawning Chinook habitat can be determined and the theoretical results are shown in table 7.
Right (east) RRB lower Side Channel Discharge Rating Curve
0
20
40
60
80
100
120
140
0 100 200 300 400 500 600
Main Channel Discharge (cfs)
Sid
e C
han
nel
Dis
char
ge
(cfs
)
Observed
Qs = 1.3149(Qm-50)0.7539
R2 = 0.987
Maximum discharge in side channel is 75 cfs
Maximum discharge in main channel is 270 cfs
Figure 20. Discharge rating curve for Lower Right RRB Side Channel.
Table 7. Conceptual Example of minimum required flows in main channel and side channels to maintain spawning Chinook habitat conditions dur ing the ir r igation per iod.
Side Channel Required Discharge Range in Side Channel (cfs)
Required Discharge Range in Main Channel (cfs)
Steven/Savage 60-120 340-590 Lower Right RRB 30-75 105-270
Dawley 35-90 180-640 Kinkade East 30-70 40-240

37
In this example, it is evident that the flows needed in each side channel to maintain the same habitat conditions based on velocity and depth criteria are variable. It is also evident that a large range of flows in the main channel corresponds to the necessary habitat conditions depending on the side channel being considered.

38
8.0 REQUIRED MAINSTEM FLOW RANGES BASED ON SIDE CHANNEL HABITAT CRITERIA
Using the methodology given in the previous example section, Tables 8 and 9 show the actual range of flows needed in each of the side channels in order to maintain the specified habitat preference ranges of each species listed. Data on fish habitat was provided by the Tribe. The tables also show the required flow in the main channel needed to maintain the necessary habitat flows in each of the side channels. Side channels with a surface water connection throughout most or all of the study period are shown in Table 8. Surface water connected side channels show a much larger range of habitat parameters and are capable of supporting a greater diversity of fish species. Anderson Side Channel and Kinkade Middle Side Channel did not meet habitat preferences for any species. This analysis would indicate that the required habitat for any of the evaluated species is not attainable in these side channels for the range of flows measured. Several other side channels showed conditions where habitat would not be attainable for one or two species. Side channels with only a groundwater connection throughout the study period are shown in Table 9. The only species where habitat parameters were met in these side channels during the measured flow ranges was juvenile Coho. According to the data, no other habitat preferences are attainable in the groundwater fed side channels. It is recommended that these results be verified by field observations and analysis of habitat usage. It is not to be concluded on the basis of this analysis that the specified fish species in these cases is absent from a particular side channel, but rather that the conditions are not typical or ideal based on provided habitat criteria.

39
Table 8. Range of flow required in sur face water connected side channels to maintain specified habitat conditions, and the range of flows required in the main channel to maintain the specified flow in the side channels.
Species
IFIM, Depth Preference Range (ft)
IFIM, Velocity Preference Range (ft/s)
Anderson Required Discharge (cfs)
Kinkade Middle required discharge (cfs)
Side Channel
Side Channel
Main Channel
Side Channel
Main Channel
Side Channel
Main Channel
Side Channel
Main Channel Side Channel
Side Channel
Main Channel
SteelheadSpawning � 1.0 1.9-2.5 NA* 65-95 360-480 35-57 110-190 40-68 230-460 20-55 30-90 NA 25-54 250-560
Juvenile � 2.0 2.2-2.6 NA 85-110 440-540 55-60 180-210 55-72 360-480 35-50 50-85 NA 35-75 360-700Adult � 1.7 1.5-1.8 NA 45-65 290-360 37-40 110-125 27-40 120-230 15-25 20-35 NA 11-25 150-280
Dolly VardenJuvenile � 1.75 0.8-3.0 NA 18-120 160-590 35-75 110-280 25-90 115-640 0-70 0-240 NA 3-80 120-700
CohoSpawning 0.95-3.4 0.75-2.0 NA 17-70 150-375 � 37
�
110 15-45 80-280 � 20 � 30 NA 4-25 120-250Juvenile 0.5-2.25
�
0.4 NA � 8 � 120 NA � 3 � 20 NA NA � 2 � 115Chinook
Spawning 1.2-3.4 1.75-3.0 NA 60-120 340-590 30-75 105-280 35-90 180-640 30-70 40-240 NA 20-25 240-290Juvenile 1.5-2.25 1.55-1.8 NA NA 25-30 95-105 30-42 160-240 � 35 � 50 NA NA
Adult � 6.5
�
3.8 NA NA NA NA NA NA NAPink
Spawning 1.0-2.7 1.3-2.3 NA 35-80 240-430 20-55 80-180 20-60 100-380 � 40 � 60 NA 5-15 120-130* NA = Habitat Parameters NOT ATTAINABLE
Kinkade West Required Discharge (cfs)
Stevens/Savage Required Discharge (cfs)
Right (east) RRB lower Required Discharge (cfs)
Dawley Required Discharge (cfs)
Kinkade East Required Discharge (cfs)
Table 9. Range of flows in groundwater side channels needed to maintain habitat for juvenile Coho, and main channel discharge that is likely needed to maintain flow in side channels. No other species habitat cr iter ia are met in these groundwater side channels.
IFIM, Depth Preference Range (ft)
IFIM, Velocity Preference Range (ft/s)
Coho Juvenile 0.5-2.25 0.4
Side ChannelRequired Side Channel Discharge (cfs)
Required Main Channel Discharge (cfs)
Gagnon west (left) 0.2-1.4 � 180Gagnon east (right) 0-0.5 � 150
Upper Right (east) RRB 0-0.75 All flows
Upper Left (west) RRB All flows All flowsSpring Creek 1.9 800

40
9.0 MANAGEMENT AND APPLICATION CONSIDERATIONS Ten side channels were evaluated in the lower Dungeness River to determine the relationships between mainstem discharge and side channel discharge, velocity, depth, and wetted width. These relationships are applicable for the range of flows measured during the 2002 irrigation period from early summer to late fall. Using these relationships, the range of main channel flows were computed that allowed fish habitat criteria to be satisfied for a variety of species. There are two kinds of flow interactions between side channels and the mainstem river, surface water and groundwater connections. Side channels with surface water connections met several of the fish criteria during the irrigation period flow range that was evaluated. Side channels with groundwater connections only met criteria for one habitat species. If it can be assumed that surface water connected channels provide more viable habitat, channels with surface water connections would be better indicators of potential habitat loss as main channel flows decrease during the irrigation period. Dawley, Lower Right RRB, Kinkade Right, Kinkade Middle, and Kinkade Left Side Channels all had a surface flow connection for the duration of the study period. Anderson and Stevens/Savage Side Channel had a surface flow connection for the majority of the study period, but as snowmelt flows decreased both channels temporarily lost the surface connection with the mainstem river. The remaining side channels had only groundwater connections during the study period. Because Anderson and Stevens/Savage lost their surface water connection during the study period, these channels may be good indicators of when the mainstem flow becomes low enough that a portion of viable habitat is lost. Anderson loses its surface water connection when flows in the main channel drop below approximately 156 ft3/s. Figure 21 shows the change in side channel velocity and depth for Anderson Side Channel as the mainstem river flows decrease in magnitude over the course of the irrigation period. This figure illustrates how side channel flow, velocity, and depth have more variability with change in the main channel flow while there is a surface water connection then when there is only a groundwater connection.

41
Anderson Side Channel
0.00
0.50
1.00
1.50
2.00
2.50
3.00
3.50
4.00
4.50
05/2
4/02
06/0
3/02
06/1
3/02
06/2
3/02
07/0
3/02
07/1
3/02
07/2
3/02
08/0
2/02
08/1
2/02
08/2
2/02
09/0
1/02
09/1
1/02
09/2
1/02
10/0
1/02
Max
imu
m A
ve. V
elo
city
(m
per
s)
0.00
0.20
0.40
0.60
0.80
1.00
1.20
1.40
1.60
Max
imu
m D
epth
(ft
)
Velocity
Depth
Surface water connection until approximately 8/8
Figure 21. Change in depth and velocity over the course of the ir r igation season for Anderson side channel. The sur face water connection with the main channel was lost in ear ly August.
It is estimated that the surface water connection at the head of Stevens/Savage Side Channel is lost when flow in the main channel falls below approximately 105 ft3/s. Figure 22 shows the change in side channel velocity and depth for Stevens/Savage Side Channel as the mainstem river flows decrease in magnitude over the course of the irrigation period.

42
Stevens/Savage
0.00
0.50
1.00
1.50
2.00
2.50
3.00
06/23/02 07/03/02 07/13/02 07/23/02 08/02/02 08/12/02 08/22/02 09/01/02 09/11/02 09/21/02 10/01/02
Max
imu
m A
ve. V
elo
city
(m
/s)
0.00
0.50
1.00
1.50
2.00
2.50
3.00
3.50
Max
imu
m D
epth
(ft
)
Velocity Depth
Side Channel connection until approximately 9/13
Increase in Main Channel flow re-established surface water connection around 9/18.
Figure 22. Change in depth and velocity over the course of the ir r igation season for Stevens/Savage side channel. The sur face water connection with the main channel was lost in mid-September . The sur face water connection was re-established at a time when discharge in the main channel showed a local peak.
For the side channels studied during the irrigation period, the range of flows found in groundwater fed side channels is much lower than that of surface water fed side channels. This is because it takes a much larger increase in main channel flow to increase discharge in a groundwater fed side channel relative to one with a surface water connection. For this reason, the habitat parameters, such as velocity and depth, in surface water connected channels can vary considerably over a wide range of mainstem flows. The corollary of this is that discharge in groundwater fed side channels will be more stable over a wider range of flow regimes within the main channel. Thus viable habitat in groundwater fed side channels may become vulnerable only during large floods when the stage in the main channel becomes high enough to establish a surface water connection in the side channel. Additionally, the maximum depth and wetted width of side channels shows little relation to discharge in groundwater side channels. Correspondingly, the discharge in the main channel will not be an indicator of the habitat parameters of depth and width in groundwater side channels. The information provided in this report is intended to be utilized as a tool to assist fisheries scientists in assessing potential loss in viable side channel fish habitat based on documented criteria and the new discharge relationships established. The relationships developed provide a way to assess the habitat based solely on the mainstem river discharge at the USGS RM 11.8 gage and the amount of flow being diverted for irrigation between this upstream gage and a

43
given side channel. In applying the habitat criteria to determine desired mainstem flow ranges, the following guidelines should be considered:
• Increases in main channel flow will have a relatively small effect on flow in groundwater fed side channels. Therefore, surface water connected side channels should be used for management decisions regarding the determination of minimum main channel flow.
• Each side channel is unique and may require a different range of mainstem flow magnitudes to achieve desired habitat criteria. Therefore, one side channel alone is not an indicator of the complete habitat conditions along the studied reach of the Dungeness River.
• It is recommended that several surface water connected side channels be considered and used in any management decisions regarding mainstem flow criteria.
• Several of the side channels studied have been persistent over time, and the flow relationships developed will be applicable as long as they remain relatively stable. However, for some of these channels the presence of a surface water connection during low flow periods (which enables them to be used for management decisions) is often dependent on whether the low flow main channel flows adjacent to the side channel entrance.
• In other reaches such as in the vicinity of the Railroad Bridge, the side channel and main channel alignments are more dynamic, and flow relationships are constantly changing. The relationships developed provide an assessment of the range of habitat present at this point in time, but may need to be adjusted if significant geomorphic changes occur.

44
10.0 REFERENCES Bountry, J., Randle, T., Piety, L, and Link, R.A. May 2002. “Physical Processes, Human Impacts, and Restoration Issues of the Lower Dungeness River” , Prepared for Jamestown S’Klallam Tribe by the U.S. Department of Interior, Bureau of Reclamation, 112 pgs plus appendices. Simonds, F. W. and Sinclair, K. A. 2002. “Surface Water-Ground Water Interactions Along the Lower Dungeness River and Vertical Hydraulic Conductivity of Streambed Sediments, Clallam County, Washington, September 1999-July 2001” , USGS Water-Resources Investigation Report 02-4161, Washington State Department of Ecology Report 02-03-027. USGS, 2002, Electronic email communication providing updated rating curve and data for gaging stations along Dungeness River. Washington State Department of Ecology, 2002, Electronic email communication providing updated rating curve and data for gaging stations along Dungeness River. Washington State Department of Ecology Web Site (http://www.ecy.wa.gov/apps/watersheds/flows/state.asp)

ATTACHMENT A: 2002 AERIAL PHOTOGRAPH LOCATION MAPS
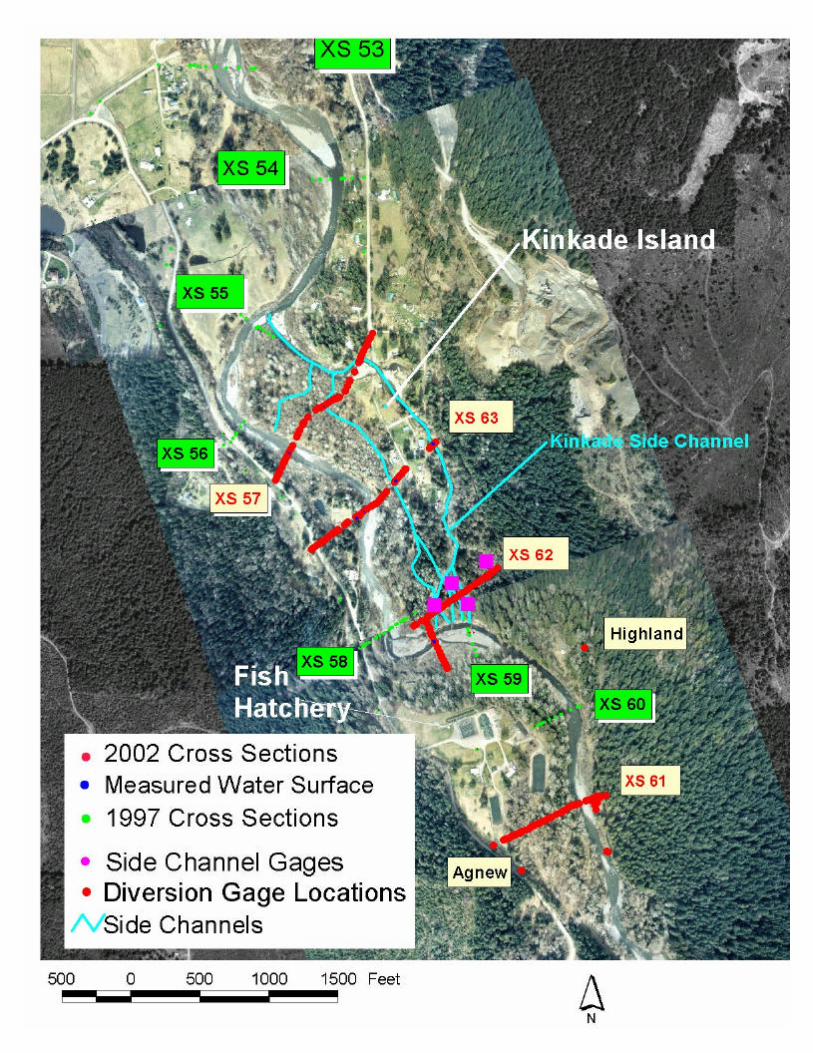


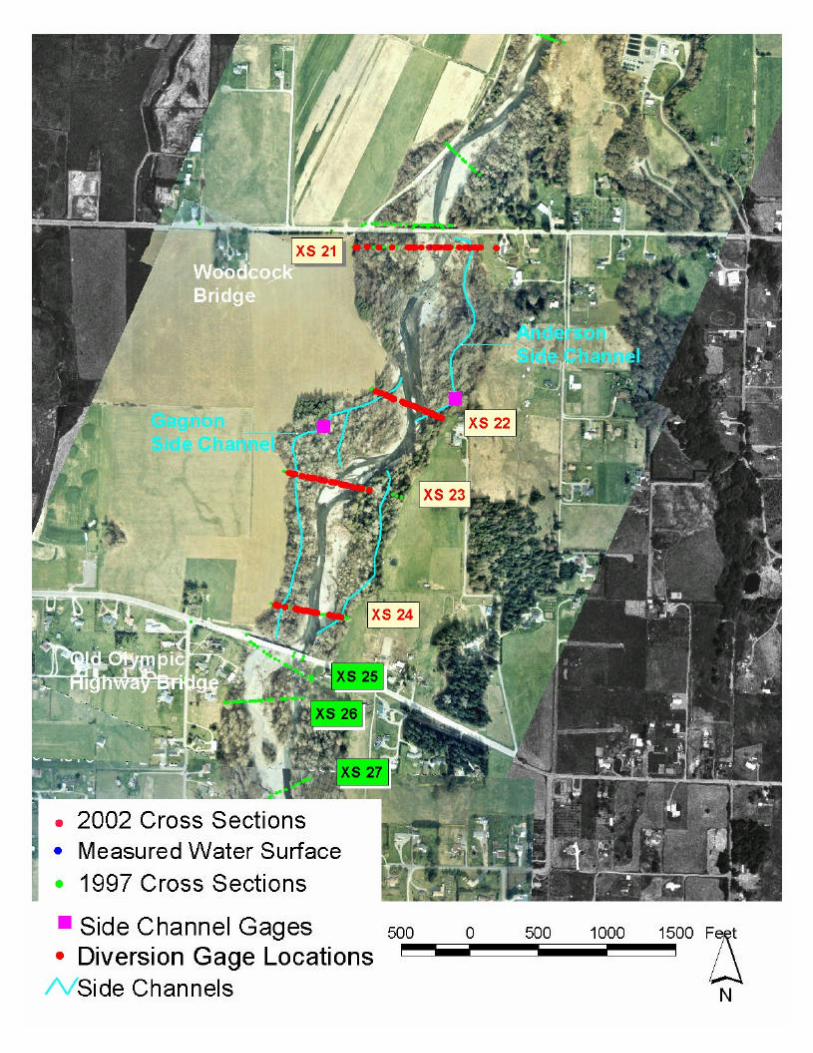

ATTACHMENT B: CROSS SECTION DATA

Cross Section 61River Mile 10.4915 (680 feet upstream of XS 60 at Fish Hatchery)
495
500
505
510
515
520
525
530
535
540
545
0 100 200 300 400 500 600 700 800 900 1000
Station (feet)
Ele
vati
on
(fe
et)
2002 Channel Bottom 2002 Water Surface

Cross Section 62River Mile 10.1456 at Entrance to Kinkade Creek
475
480
485
490
495
500
505
510
515
520
525
0 200 400 600 800 1000 1200
Station (feet)
Ele
vati
on
(fe
et)
2002 Channel Bottom 2002 Water Surface

Cross Section 63 on Kinkade IslandRiver Mile 9.9478 (730 feet upstream of XS 57)
460
465
470
475
480
485
490
495
500
505
510
0 200 400 600 800 1000 1200 1400Station (feet)
Ele
vati
on
(fe
et)
2002 Channel Bottom 2002 Water Surface

Cross Section 57 on Kinkade IslandRiver Mile 9.8095
450
455
460
465
470
475
480
485
490
495
500
-200 0 200 400 600 800 1000 1200 1400
Station (ft)
Ele
vati
on
(ft
)
Oct-99October 1998Sep-97 - Limited survey2002 Channel Bottom2002 Water Surface
forestedforested

Cross Section 46 at Dungeness MeadowsRiver Mile 7.7276
330
335
340
345
350
355
360
365
370
375
380
-50 150 350 550 750 950 1150 1350 1550 1750
Station (ft)
Ele
vati
on
(ft
)
September 1997
March 1996 data
2002 Channel Bottom
2002 Water Surface
Dungeness Meadows Levee

Cross Section 43 at Spring CreekRiver Mile 7.1700
290
295
300
305
310
315
320
325
330
335
340
0 200 400 600 800 1000 1200 1400 1600 1800 2000
Station (ft)
Ele
vati
on
(ft
)Oct-98September 19972002 Channel Bottom2002 Water Surface

Cross Section 41 - Upstream End of Dawley Side Channel and Sequim Prairie Irrigation Diversion
River Mile 6.7504
265
270
275
280
285
290
295
300
305
310
315
-400 -200 0 200 400 600 800 1000 1200 1400 1600
Station (ft)
Ele
vati
on
(ft
)
October 1998
Sep-97
August 2002
Water Surface

Cross Section 40 - Dawley Side Channel Downstream of Sequim Prairie DiversionRiver Mile 6.6001
250
255
260
265
270
275
280
285
290
295
300
-50 50 150 250 350 450 550 650 750 850 950
Station (ft)
Ele
vati
on
(ft
)
March, 1996 dataSeptember 1997Oct 98 dataAugust 20022002 Water Surface

Cross Section 37 - No monitored side channelsRiver Mile 6.0936
220
225
230
235
240
245
250
255
260
265
270
-650 -450 -250 -50 150 350 550 750 950
Station (ft)
Ele
vati
on
(ft
)
Oct-00
September 1997
August 2002
2002 Water Surface

Cross Section 36 - River Mile 5.8588Just Upstream of Railroad Bridge
Upper Right (East) and Left (West) Railroad Bridge Side Channels
210
215
220
225
230
235
240
245
250
255
260
-400 -200 0 200 400 600 800 1000 1200 1400
Station (ft)
Ele
vati
on
(ft
)
Oct-00October 1998Sep-97August 20022002 Water Surface

Cross Section 33 - Lower RailRoad Bridge Right Side ChannelRiver Mile 5.5050
180
185
190
195
200
205
210
215
220
225
230
-50 150 350 550 750 950 1150
Station (ft)
Ele
vati
on
(ft
)
Oct-00Oct-99September 1997August 20022002 Water Surface

Cross Section 64 - Upstream End of Steven/Savage Side ChannelRiver Mile 4.7107 (560 feet upstream of XS 29)
135
140
145
150
155
160
165
170
175
180
185
0 200 400 600 800 1000 1200 1400 1600 1800
Station (feet)
Ele
vati
on
(fe
et)
2002 Channel Bottom 2002 Water Surface

Cross Section 29 - Middle Stevens/Savage Side ChannelRiver Mile 4.6046
130
135
140
145
150
155
160
165
170
175
180
0 200 400 600 800 1000 1200
Station (ft)
Ele
vati
on
(ft
)
Oct-00
Sep-97
March 1996
August 2002
2002 Water Surface

Cross Section 28- Just Downstream of Stevens/Savage Side ChannelRiver Mile 4.4608
120
125
130
135
140
145
150
155
160
165
170
-50 50 150 250 350 450 550 650 750 850 950
Station (ft)
Ele
vati
on
(ft
)
September 1997March 1996 dataAugust 20022002 Water Surface

Cross Section 24 - Upstream End Gagnon Left Side ChannelLocated Just Downstream of Old Olympic Highway
River Mile 3.9480
100
105
110
115
120
125
130
135
140
145
150
-50 50 150 250 350 450 550 650 750 850 950
Station (ft)
Ele
vati
on
(ft
)
September 1997
August 2002
2002 Water Surface

Cross Section 23 - River Mile 3.7427Middle Gagnon Left Side Channel
90
95
100
105
110
115
120
125
130
135
140
-50 50 150 250 350 450 550 650 750 850 950
Station (ft)
Ele
vati
on
(ft
)
September 1997
August 2002
2002 Water Surface

Cross Section 22 -River Mile 3.6035Upstream End of Anderson Side Channel and Downstream End of Gagnon Left Side Channel
85
90
95
100
105
110
115
120
125
130
135
-50 50 150 250 350 450 550 650 750 850 950
Station (ft)
Ele
vati
on
(ft
)
September 1997
August 2002
2002 Water Surface
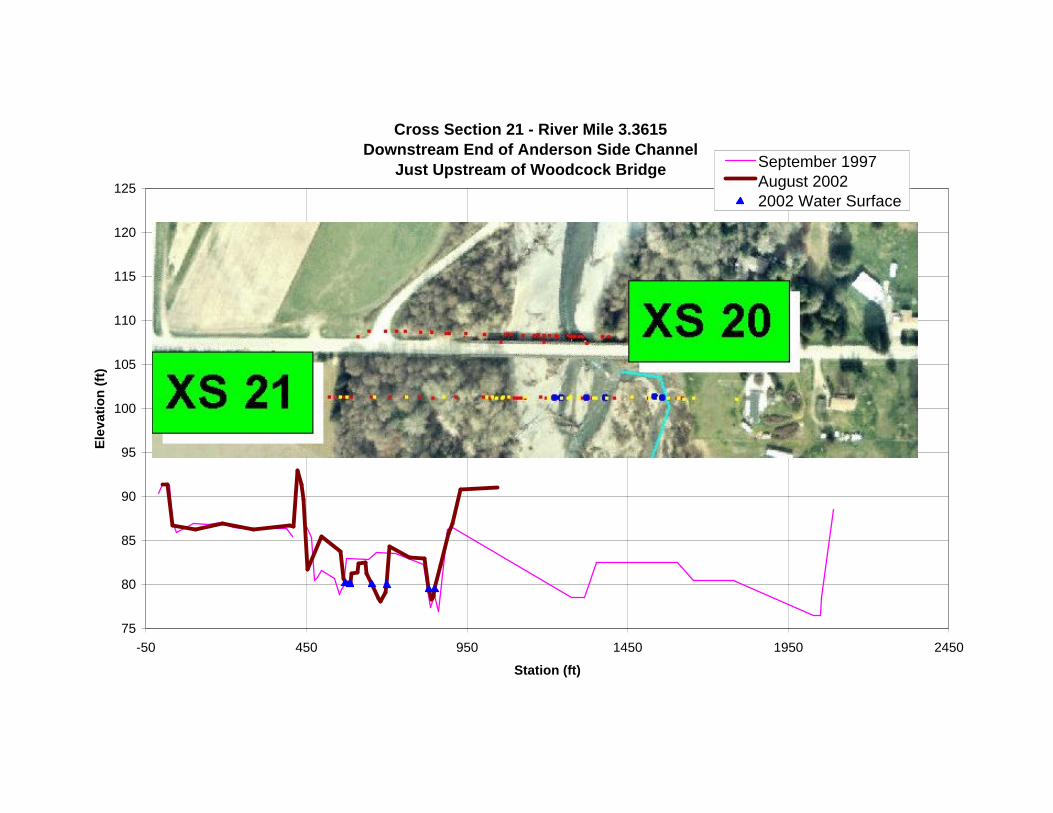
Cross Section 21 - River Mile 3.3615Downstream End of Anderson Side Channel
Just Upstream of Woodcock Bridge
75
80
85
90
95
100
105
110
115
120
125
-50 450 950 1450 1950 2450
Station (ft)
Ele
vati
on
(ft
)
September 1997August 20022002 Water Surface

ATTACHMENT C: SIDE CHANNEL RATING CURVES

Anderson Side Channel (groundwater)(For side channel discharge < 4 cfs)
Velocity Rating Curve
y = 1.1586x0.5286
R2 = 0.9514
0.00.20.40.60.81.01.21.4
0.0 1.0 2.0 3.0 4.0Side Channel Discharge (cfs)
Max
imum
Ave
rage
V
eloc
ity (f
t/s)
Observed

Anderson Side Channel (groundwater)Depth Rating Curve y = 0.339x0.2513
R2 = 0.8734
0.00
0.05
0.10
0.15
0.20
0.25
0.30
0.35
0.40
0.45
0.0 0.5 1.0 1.5 2.0 2.5 3.0 3.5 4.0
Side Channel Discharge (cfs)
Max
imum
Dep
th (f
t)

Anderson Side Channel (groundwater)Width Rating Curve y = 6.6248x-0.024
R2 = 0.3173
6.3
6.4
6.5
6.6
6.7
6.8
6.9
7.0
7.1
7.2
7.3
0.0 0.5 1.0 1.5 2.0 2.5 3.0 3.5 4.0
Side Channel Discharge (cfs)
Max
imum
Wet
ted
wid
th (f
t)

Anderson Side Channel (surface water)(For side channel discharge > 4 cfs)
Velocity Rating Curvey = 1.6911x0.257
R2 = 0.8202
0.00.51.01.52.02.53.03.54.04.5
0 10 20 30 40 50 60Side Channel Discharge (cfs)
Max
imum
Ave
rage
Vel
ocity
(ft/s
)
Observed

Anderson Side Channel (surface water)Depth Rating Curve y = 0.2876x0.4119
R2 = 0.9613
0.00.20.40.60.81.01.21.41.6
0 10 20 30 40Side Channel Discharge (cfs)
Max
imum
Dep
th (f
t)

Anderson Side Channel (surface water)Width Rating Curve
y = 4.3698x0.3257
R2 = 0.9173
0
2
4
6
8
10
12
14
16
18
0 5 10 15 20 25 30 35 40
Side Channel Discharge (cfs)
Max
imum
Wet
ted
wid
th (f
t)

Gagnon (west) Side ChannelVelocity Rating Curve
y = 0.3196x0.6602
R2 = 0.8482
0.0
0.1
0.2
0.3
0.4
0.5
0.6
0.0 0.5 1.0 1.5 2.0 2.
Side Channel Discharge (cfs)
Max
imum
Ave
rage
Vel
ocity
(ft/s
)
5
Observed

Gagnon (west) Side ChannelDepth Rating Curve
y = 0.7645x0.1705
R2 = 0.3981
0.0
0.1
0.2
0.3
0.4
0.5
0.6
0.7
0.8
0.9
1.0
0.0 0.2 0.4 0.6 0.8 1.0 1.2 1.4
Side Channel Discharge (cfs)
Max
imum
Dep
th (f
t)

Gagnon (west) Side ChannelWidth Rating Curve
y = 10.265x-0.0261
R2 = 0.1664
9.8
10
10.2
10.4
10.6
10.8
11
11.2
11.4
11.6
0 0.2 0.4 0.6 0.8 1 1.2 1.4
Side Channel Discharge (cfs)
Wet
ted
wid
th (f
t)

Gagnon (east) Side ChannelVelocity Rating Curve y = 0.6261x0.7704
R2 = 0.9513
0.00
0.05
0.10
0.15
0.20
0.25
0.30
0.35
0.00 0.05 0.10 0.15 0.20 0.25 0.30 0.35 0.40 0.45
Side Channel Discharge (cfs)
Max
imum
Ave
rage
Vel
ocity
(ft
/s)

Gagnon (east) Side ChannelDepth Rating Curve
y = 0.7866x-0.0263
R2 = 0.1001
0.4
0.5
0.6
0.7
0.8
0.9
1.0
0.00 0.05 0.10 0.15 0.20 0.25 0.30 0.35 0.40 0.45
Side Channel Discharge (cfs)
Max
imum
Dep
th (f
t)

Gagnon (east) Side ChannelWidth Rating Curve
y = 4.7746x0.0557
R2 = 0.0783
0
1
2
3
4
5
6
0.00 0.05 0.10 0.15 0.20 0.25 0.30 0.35 0.40 0.45
Side Channel Discharge (cfs)
Wet
ted
wid
th (f
t)

Stevens/Savage Side ChannelVelocity Rating Curve y = 0.
R2 =
0
0.5
1
1.5
2
2.5
3
0 20 40 60 80 100
Side Channel Discharge (cfs)
Max
imum
Ave
rage
Vel
ocity
(ft/s
)
1122x0.6768
0.9913
120
Observed

Stevens/Savage Side ChannelDepth Rating Curve y = 1.5561x0.1392
R2 = 0.8322
0.0
0.5
1.0
1.5
2.0
2.5
3.0
3.5
0 20 40 60 80 100 120
Side Channel Discharge (cfs)
Max
imum
Dep
th (f
t)

Stevens/Savage Side ChannelWidth Rating Curve y = 25.324x0.0172
R2 = 0.5928
25.0
25.5
26.0
26.5
27.0
27.5
28.0
28.5
29.0
0 20 40 60 80 100 120
Side Channel Discharge (cfs)
Wet
ted
wid
th (f
t)

E. RRB (lower) Side ChannelVelocity Rating Curve
y = 0.2803x0.5449
R2 = 0.9803
0.0
0.5
1.0
1.5
2.0
2.5
3.0
3.5
4.0
4.5
0 20 40 60 80 100 120 140
Side Channel Discharge (cfs)
Max
imum
Ave
rage
Vel
ocity
(ft/s
)
Observed

E. RRB (lower) Side ChannelDepth Rating Curve
y = 0.5868x0.3095
R2 = 0.9393
0
0.5
1
1.5
2
2.5
3
0 20 40 60 80 100 120 140
Side Channel Discharge (cfs)
Max
imum
Dep
th (f
t)

E. RRB (lower) Side ChannelWidth Rating curve
y = 19.19x0.0823
R2 = 0.695
24
25
26
27
28
29
30
31
0 20 40 60 80 100 120 140
Side Channel Discharge (cfs)
Wet
ted
wid
th (f
t)

E. RRB (upper-west) Side ChannelVelocity Rating Curve
y = 0.5184x0.9705
R2 = 0.7116
0.00
0.05
0.10
0.15
0.20
0.25
0.30
0.00 0.05 0.10 0.15 0.20 0.25 0.30 0.35 0.40 0.45
Side Channel Discharge (cfs)
Max
imum
Ave
rage
Vel
ocity
(ft/s
)
Observed

E. RRB (upper-west) Side ChannelDepth Rating Curve
y = 0.5707x-0.0692
R2 = 0.1489
0.0
0.1
0.2
0.3
0.4
0.5
0.6
0.7
0.8
0.00 0.05 0.10 0.15 0.20 0.25 0.30 0.35 0.40 0.45
Side Channel Discharge (cfs)
Max
imum
Dep
th (f
t)

E. RRB (upper-west) Side ChannelWidth Rating Curve
y = 14.001x0.0658
R2 = 0.1738
0
2
4
6
8
10
12
14
16
0.00 0.05 0.10 0.15 0.20 0.25 0.30 0.35 0.40 0.45
Side Channel Discharge (cfs)
Wet
ted
wid
th (f
t)
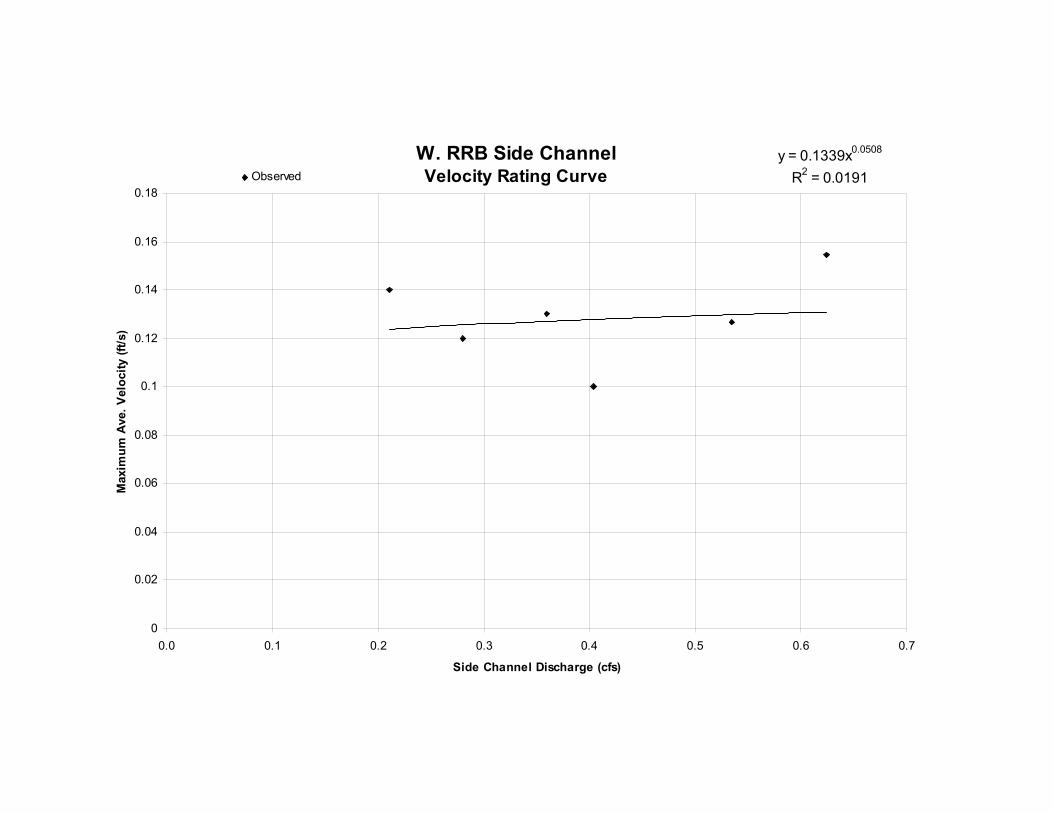
W. RRB Side ChannelVelocity Rating Curve
y = 0.1339x0.0508
R2 = 0.0191
0
0.02
0.04
0.06
0.08
0.1
0.12
0.14
0.16
0.18
0.0 0.1 0.2 0.3 0.4 0.5 0.6 0.7
Side Channel Discharge (cfs)
Max
imum
Ave
. Vel
ocity
(ft/s
)
Observed

W. RRB Side ChannelDepth Rating Curve y = 1.6426x0.1508
R2 = 0.3107
0.0
0.2
0.4
0.6
0.8
1.0
1.2
1.4
1.6
1.8
0.0 0.1 0.2 0.3 0.4 0.5 0.6 0.7
Side Channel Discharge (cfs)
Max
imum
Dep
th (f
t)

W. RRB Side ChannelWidth Rating Curve
y = 10.109x-0.0028
R2 = 5E-05
0
2
4
6
8
10
12
14
0.0 0.1 0.2 0.3 0.4 0.5 0.6 0.7
Side Channel Discharge (cfs)
Wet
ted
wid
th (f
t)

Dawley Side ChannelVelocity Rating Curve
y = 0.2423x0.5521
R2 = 0.9497
0.0
0.5
1.0
1.5
2.0
2.5
3.0
3.5
0 10 20 30 40 50 60 70 80 90
Side Channel Discharge (cfs)
Max
imum
Ave
rage
Vel
ocity
(ft/s
)
Observed

Dawley Side ChannelDepth Rating Curve
y = 0.8723x0.2241
R2 = 0.9058
0.0
0.5
1.0
1.5
2.0
2.5
3.0
0 10 20 30 40 50 60 70 80 90
Side Channel Discharge (cfs)
Max
imum
Dep
th (f
t)

Dawley Side ChannelWidth Rating Curve
y = 16.252x0.1247
R2 = 0.9178
0
5
10
15
20
25
30
0 10 20 30 40 50 60 70 80 90
Side Channel Discharge (cfs)
Wet
ted
wid
th (f
t)

Spring Side ChannelVelocity Rating Curve y = 0.2689x0.6042
R2 = 0.9743
0.00
0.05
0.10
0.15
0.20
0.25
0.30
0.35
0.40
0.45
0.0 0.2 0.4 0.6 0.8 1.0 1.2 1.4 1.6 1.8
Side Channel Discharge (cfs)
Max
imum
Ave
rage
Vel
ocity
(ft/s
)
Observed

Spring Side Channel]Depth Rating Curve
y = 0.8016x-0.0374
R2 = 0.9159
0.78
0.80
0.82
0.84
0.86
0.88
0.90
0.92
0.0 0.2 0.4 0.6 0.8 1.0 1.2 1.4 1.6 1.8
Side Channel Discharge (cfs)
Max
imum
Dep
th (f
t)

Spring Side ChannelWidth Rating Curve
y = 21.273x0.0089
R2 = 0.2608
15
16
17
18
19
20
21
22
23
0.0 0.2 0.4 0.6 0.8 1.0 1.2 1.4 1.6 1.8
Side Channel Discharge (cfs)
Wet
ted
wid
th (f
t)

Kinkade (east) Side ChannelVelocity Rating Curve
y = 0.5072x0.4166
R2 = 0.8348
0.0
0.5
1.0
1.5
2.0
2.5
3.0
3.5
4.0
4.5
0 20 40 60 80 100 120 140 160
Side Channel Discharge (cfs)
Max
imum
Ave
rage
Vel
ocity
(ft/s
)
Observed

Kinkade (east) Side ChannelDepth Rating Curve
y = 0.7932x0.2836
R2 = 0.8754
0
0.5
1
1.5
2
2.5
3
3.5
0 20 40 60 80 100 120 140 160
Side Channel Discharge (cfs)
Max
imum
Dep
th (f
t)

Kinkade (east) Side ChannelWidth Rating Curve y = 22.622x0.0626
R2 = 0.099
0
5
10
15
20
25
30
35
0 20 40 60 80 100 120 140 160
Side Channel Discharge (cfs)
Wet
ted
wid
th (f
t)

Kinkade (middle) Side ChannelVelocity Rating Curve
y = 0.7651x0.4718
R2 = 0.8039
0
1
2
3
4
5
6
0 10 20 30 40 50 60 70 80
Side Channel Discharge (cfs)
Max
imum
Ave
rage
Vel
ocity
(ft/s
)
Observed

Kinkade (middle) Side ChannelDepth Rating Curve y = 0.243x0.4195
R2 = 0.7775
0.0
0.2
0.4
0.6
0.8
1.0
1.2
1.4
1.6
1.8
0 10 20 30 40 50 60 70 80
Side Channel Discharge (cfs)
Max
imum
Dep
th (f
t)

Kinkade (middle) Side ChannelWidth Rating Curve
y = 16.836x0.0904
R2 = 0.6261
21.5
22.0
22.5
23.0
23.5
24.0
24.5
25.0
25.5
26.0
0 10 20 30 40 50 60 70 80
Side Channel Discharge (cfs)
Wet
ted
wid
th (f
t)
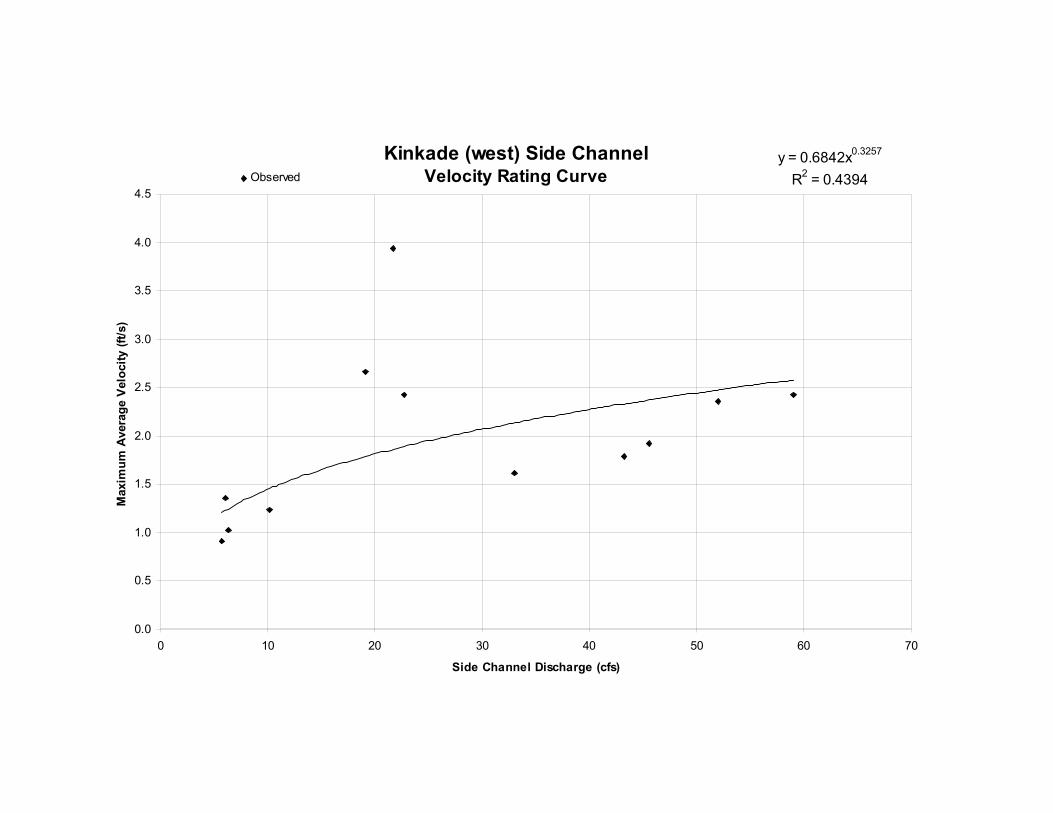
Kinkade (west) Side ChannelVelocity Rating Curve
y = 0.6842x0.3257
R2 = 0.4394
0.0
0.5
1.0
1.5
2.0
2.5
3.0
3.5
4.0
4.5
0 10 20 30 40 50 60 70
Side Channel Discharge (cfs)
Max
imum
Ave
rage
Vel
ocity
(ft/s
)
Observed

Kinkade (west) Side ChannelDepth Rating Curve y = 1.6602x0.2199
R2 = 0.5913
0.0
0.5
1.0
1.5
2.0
2.5
3.0
3.5
4.0
4.5
5.0
0 10 20 30 40 50 60 70
Side Channel Discharge (cfs)
Max
imum
Dep
th (f
t)

Kinkade (west) Side ChannelWidth Rating Curve
y = 27.766x0.0752
R2 = 0.3502
0
5
10
15
20
25
30
35
40
45
50
0 10 20 30 40 50 60 70
Side Channel Discharge (cfs)
Wet
ted
wid
th (f
t)

Anderson Side ChannelDischarge Rating Curve
0
5
10
15
20
25
30
35
40
0 100 200 300 400 500 600 700 800 900 1000
Main Channel Discharge (cfs)
Side
Cha
nnel
dis
char
ge (c
fs)
ObservedQs = 0.0145(Qm-155)1.16
R2 = 0.9941

Gagnon (west) Side ChannelDischarge Rating Curve
0
0.2
0.4
0.6
0.8
1
1.2
1.4
0 100 200 300 400 500 600 700 800 900 1000
Main Channel Discharge (cfs)
Side
Cha
nnel
Dis
char
ge (c
fs)
Observed
Qs = 0.0418(Qm-155)0.499
R2 = 0.835

Gagnon (east) Side ChannelDischarge Rating Curve
0
0.05
0.1
0.15
0.2
0.25
0.3
0.35
0.4
0.45
0 100 200 300 400 500 600 700 800 900 1000
Main Channel Discharge (cfs)
Side
Cha
nnel
Dis
char
ge (c
fs)
Observed
Qs = 0.0016(Qm-150)0.761
R2 = 0.5546

Stevens/Savage Side Channel Discharge Rating Curve
0
20
40
60
80
100
120
140
0 100 200 300 400 500 600
Main Channel Discharge (cfs)
Side
Cha
nnel
Dis
char
ge (c
fs)
Observed
Qs = 0.2364(Qm-105)1.013
R2 = 0.9878

E. RRB (lower) Side Channel Discharge Rating Curve
0
20
40
60
80
100
120
140
0 100 200 300 400 500 600
Main Channel Discharge (cfs)
Side
Cha
nnel
Dis
char
ge (c
fs)
Observed
Qs = 1.3149(Qm-50)0.7539
R2 = 0.987

E. RRB (upper-west) Side Channel Discharge Rating Curve
0
0.05
0.1
0.15
0.2
0.25
0.3
0.35
0.4
0.45
0 100 200 300 400 500 600 700 800 900 1000
Main Channel Discharge (cfs)
Side
Cha
nnel
Dis
char
ge (c
fs)
Observed
Qs = 0.0007(Qm+130)0.8811
R2 = 0.4309

W. RRB Side Channel Discharge Rating Curve
0
0.1
0.2
0.3
0.4
0.5
0.6
0.7
0.8
0 100 200 300 400 500 600 700 800 900
Main Channel Discharge (cfs)
Side
Cha
nnel
Dis
char
ge (c
fs)
Observed
Qs = 0.0026(Qm+200)0.7615
R2 = 0.3221

Dawley Side ChannelDischarge Rating Curve
0
10
20
30
40
50
60
70
80
90
100
0 50 100 150 200 250 300 350 400 450 500
Main Channel Discharge (cfs)
Side
Cha
nnel
Dis
char
ge (c
fs)
Observed
Qs = 0.6603(Qm-20)0.7691
R2 = 0.7828

Spring Side Channel Discharge Rating Curve
0
0.2
0.4
0.6
0.8
1
1.2
1.4
1.6
1.8
2
0 100 200 300 400 500
Main Channel Discharge (cfs)
Side
Cha
nnel
Dis
char
ge (c
fs)
ObservedQs = 0.1607(Qm-116)0.3755
R2 = 0.9653

Kinkade (east) Side Channel Discharge Rating Curve
0
20
40
60
80
100
120
140
160
0 100 200 300 400 500
Main Channel Discharge (cfs)
Side
Cha
nnel
Dis
char
ge (c
fs)
ObservedQs = 4.088(Qm)0.5562
R2 = 0.964

Kinkade (middle) Side Channel Discharge Rating Curve
0
10
20
30
40
50
60
70
80
0 50 100 150 200 250 300 350 400 450 500
Main Channel Discharge (cfs)
Side
Cha
nnel
Dis
char
ge (c
fs)
Observed
Qs = 7.1617(Qm-110)0.3847
R2 = 0.9432

Kinkade (west) Side Channel Discharge Rating Curve
0
10
20
30
40
50
60
0 100 200 300 400 500 600 700
Main Channel Discharge (cfs)
Side
Cha
nnel
Dis
char
ge (c
fs)
ObservedQs = 0.4522(Qm-110)0.7743
R2 = 0.8501

Kinkade Side Channel (Total)Discharge Rating Curve
0
50
100
150
200
250
300
0 50 100 150 200 250 300 350 400 450 500
Main Channel Discharge (cfs)
Side
Cha
nnel
Dis
char
ge (c
fs)
ObservedQs = 1.7049(Qm)0.8023
R2 = 0.9638

ATTACHMENT D: SIDE CHANNEL TEMPERATURE DATA

DOE Side channel study Temperature and flow in selected side channels
Byron Rot Lori DeLorm
Stephani Adams John Stark
January 15, 2003

Anderson flow and temperature
0.0
5.0
10.0
15.0
20.0
25.0
30.0
35.0
40.0
5/24 6/18 7/13 8/7 9/1 9/26 10/21
flo
w (c
fs)
0
2
4
6
8
10
12
14
16
18
tem
per
atu
re (C
)
cfs temp
Gagnon flow and maximum daily temperature
0.0
0.2
0.4
0.6
0.8
1.0
1.2
1.4
5/24 6/18 7/13 8/7 9/1 9/26 10/21
flo
w (
cfs)
0
2
4
6
8
10
12
14
16
18te
mp
C
cfs w est cfs east temp w est

Lower RR bridge flow and maximum temperature
0
20
40
60
80
100
120
140
5/24 6/18 7/13 8/7 9/1 9/26 10/21 11/15
flo
w (
cfs)
0
2
4
6
8
10
12
14
16
18
tem
per
atu
re (
C)
f low max temp
East RR Bridge flow and temperature
0.00
0.05
0.10
0.15
0.20
0.25
0.30
0.35
0.40
0.45
5/24 6/18 7/13 8/7 9/1 9/26 10/21 11/15
flo
w (
cfs)
0
2
4
6
8
10
12
14
16
18
tem
p (
C)
east (cfs) w est (cfs) temp max

West RR Bridge flow and temperature
0.00
0.10
0.20
0.30
0.40
0.50
0.60
0.70
5/24 6/18 7/13 8/7 9/1 9/26 10/21 11/15
flo
w (
cfs)
0
2
4
6
8
10
12
14
tem
p (
C)
f low (cfs) Temp
Dawley flow and maximum daily temperature
0
10
20
30
40
50
60
70
80
90
5/24 6/18 7/13 8/7 9/1 9/26 10/21 11/15
flo
w (
cfs)
0
2
4
6
8
10
12
14
16
18
tem
per
atu
re C
flow temp max