calculation of the university student’s ecological footprint size: a pilot research on students...
TRANSCRIPT

Calculation of the University Student’s Ecological
Footprint Size: A Pilot Research on Students Living in
AdanaDr Eda Yasa Ozelturkay, Cag University, TurkeyDr Hatice Dogan Sudas, Cukurova University, Turkey

AGENDA Introduction related key termsPrevious studies and resultsMethodology- Study design- Sample- Results- Conclusions


Introduction: The main goal of sustainable development economy is to improve well-
being and to lower the exploitation of global resources at the same time (Latszek, 2013).
According to the Brundtland Report, (1987) “Sustainable development is defined as development that meets the needs of the present without compromising the ability of future generations to meet their own need” (Janina, 2012).
The agenda 21 which was adopted at the Rio conference in 1992 introduced the term “sustainable consumption” into scientific and environmental political discussion.
Sustainable consumption: is the consumption behavior of private households aimed at contributing to the sustainable development of society. (!)Sustainable development is accepted as one of the key factor for global
economy in the future.

The report of World commission By United Nations in1987:
«we all depend on one biosphere for sustaining our lives. Yet each community, each country, strives for survival and prosperity with little regard for its impact on others.
Some consume the earth’s resources at a rate that would leave little for future generations. Others many more in number, consume far too little and live with the prospects of hunger, squalor, disease, and early death” (Wackernagel, 1994).
The concept of ecological footprint (EF) is well known amongst ecological economists and it represents the human impact on the Earth in a clear manner and the ecological footprint compares renewable natural resource consumption with nature’s biologically productive capacity (Moffatt,2000).

According to Rees and Wackerganel (1996), ecologic footprint was defined as “total area of productive land and water area required continuously to produce all the resources consumed and to assimilate all the wastes produced, by a defined population, wherever on earth that land is located».
The biocapacity can be described as a method that answers the question of “how many of the renewable resources have been made available by the biosphere’s regenerative capacity?

Previous studies and results
Sudas & Ozelturkay ,(2014) 400 Turkish students who were living in Adana. The majority of the
students were living alone in a rented house or dormitories. Whether the students lived ecologically or not, and how?
Results showed that most of them live in inner cities and that their houses measure approximately 150-200 square meters, and electricity is the most preferred energy source used in the houses.
To save the environment, they turn off the electricity when they leave the room and close computers when they are not in use, and also mostly dry their clothes outside.
For food consumption, their patterns are aligned such that they prefer mostly an omnivore diet (meat, fish, vegetables) and eat two large meals a day (60%) with snacks or related things.
They prefer supermarkets for food shopping and also visit farmer markets to purchase fresh vegetables and fruits.
For goods and services footprint, students claimed that they generally live within their means (70%), using some items for years.
Even though they claimed that they contributed towards protecting the environment, they did not tend to recycle their used materials a lot.
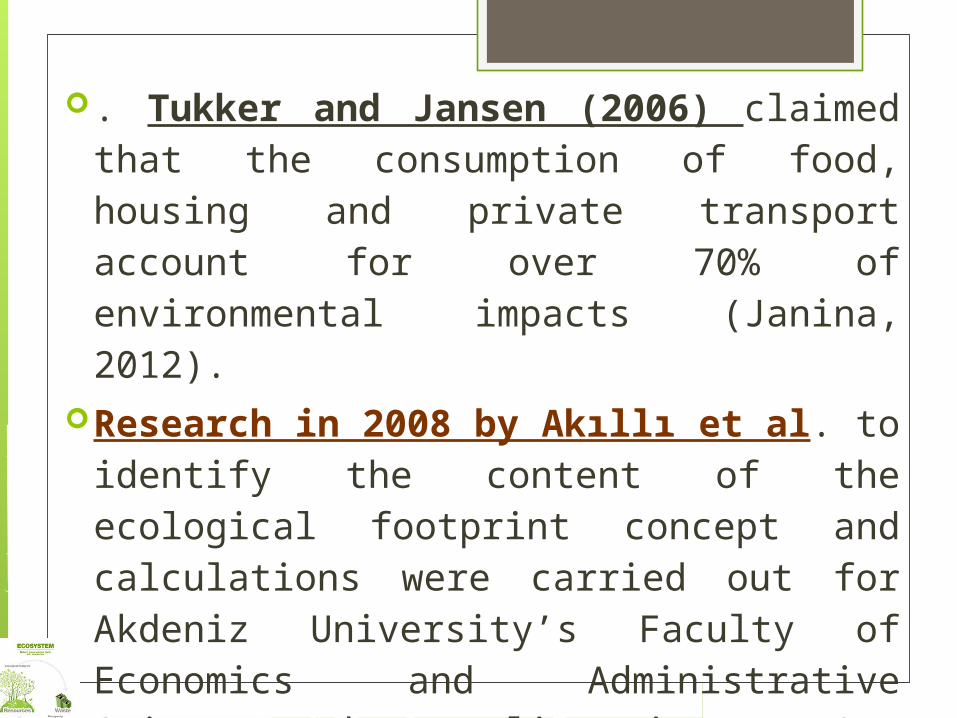
. Tukker and Jansen (2006) claimed that the consumption of food, housing and private transport account for over 70% of environmental impacts (Janina, 2012).
Research in 2008 by Akıllı et al. to identify the content of the ecological footprint concept and calculations were carried out for Akdeniz University’s Faculty of Economics and Administrative Sciences. The sampling size was 241 They found that ecological footprint did not have significant relationships with gender, and it was seen that the ecological footprint gets larger with increased income, property and automobile ownership.
Waight (2013), individual savings related to baby clothes, toys and equipment. These products are perfectly suited to entering the second-hand market as their useful life often extends beyond the needs of one family due to babies growing so quickly.
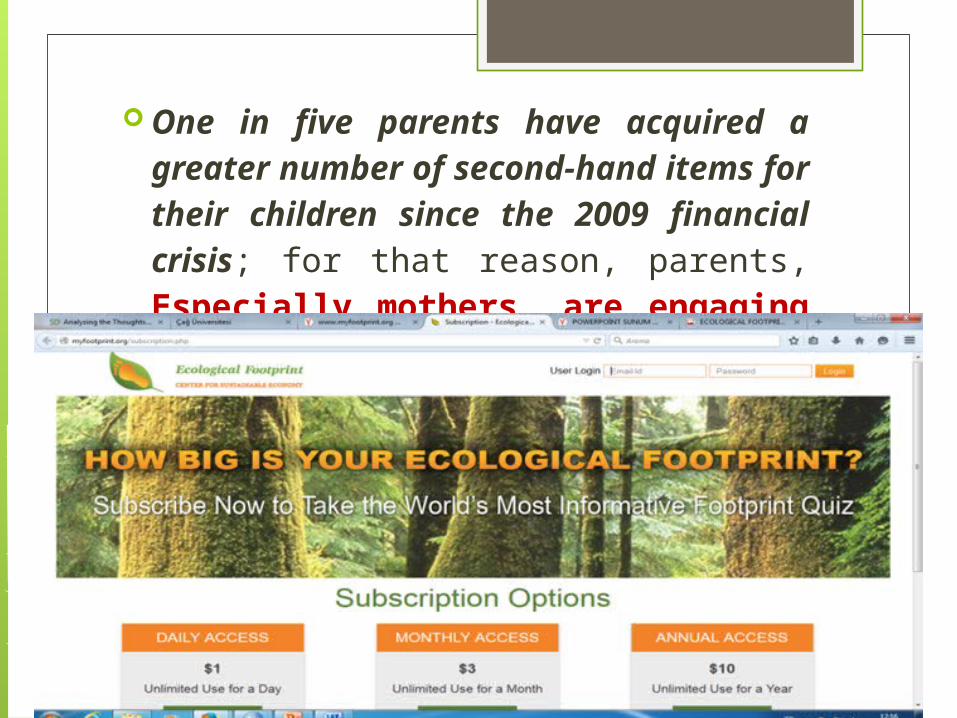
One in five parents have acquired a greater number of second-hand items for their children since the 2009 financial crisis; for that reason, parents, Especially mothers, are engaging in sustainable consumption practices for their clothes.

MethodologyStudy design: Ecological Footprint Quiz”, placed on www.myfootprint.org 20 November 2014 - 25 December 2014. The questionnaire had six main parts consisting of 27
questions. Quiz results show how much “nature” one’s lifestyle
requires. The Ecological Footprint Quiz estimates the amount of land and
ocean area required to sustain an individual’s consumption patterns and absorb his/her wastes on an annual basis.
The Ecological Footprint is expressed in "global hectares" (gha), which are standardized units that take into account the differences in biological productivity of various ecosystems impacted by one’s consumption activities (myfootprint.org).

The Footprint is broken down into four consumption categories: carbon (home energy use and transportation), food, housing, and goods and services. The first four parts of the questionnaire include statements about the carbon, housing, food, goods and services footprint.
The fifth part includes questions about environmental protection activities.
In the last part of the questionnaire, participants responded to demographic questions. Students were asked whether they use social media tools in relation to environmental campaigns or activities.
Sample: 175 university students who lived in Adana, in the
southern part of Turkey, with their parents. Adana is one of the five largest cities in
Turkey with a population of nearly more than 2 million.
Undergraduate and graduate university students were selected for the (convenience) sample.
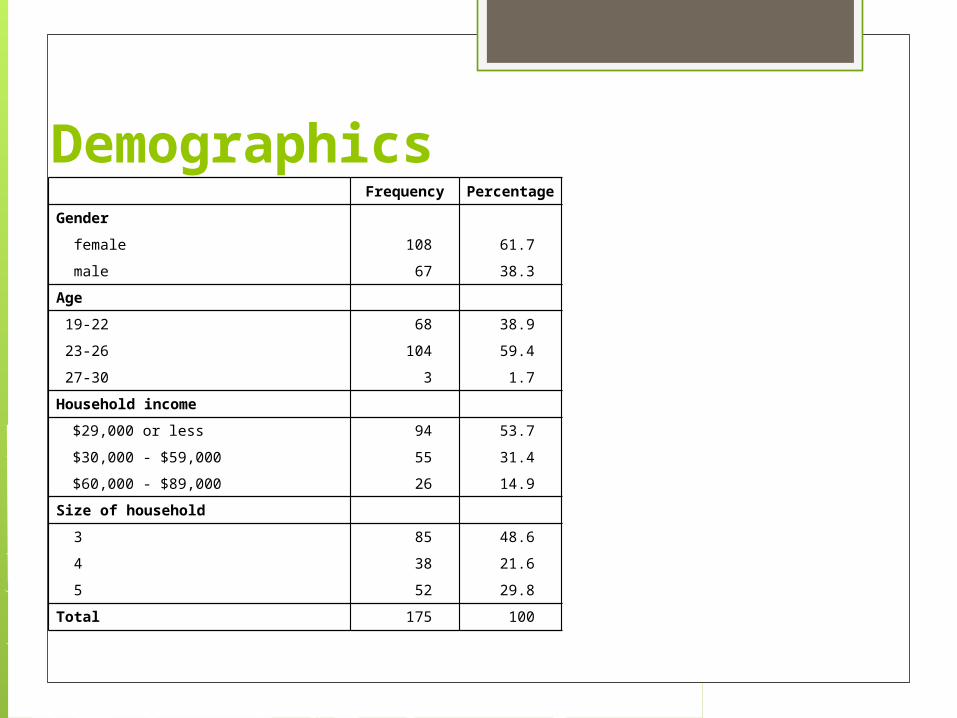
Demographics Frequency Percentage
Gender
female 108 61.7
male 67 38.3
Age
19-22 68 38.9
23-26 104 59.4
27-30 3 1.7
Household income
$29,000 or less 94 53.7
$30,000 - $59,000 55 31.4
$60,000 - $89,000 26 14.9
Size of household
3 85 48.6
4 38 21.6
5 52 29.8
Total 175 100

Environmental Protection Activities

Individual Ecological Footprint Per Capita
N Min. Max. SD. Mean (gha)
Turkey
A v. (gha)
Carbon Footprint 175
.98 19.85
3.68
7.00 5,15
Food Footprint 175
1.05
8.57 1.57
5.00 5,12
Housing Footprint 175
1.08
3.20 .34 1.79 2,07
Goods and Services Footprint
175
1.79
9.84 1.59
5.05 4,29
Total Footprint 175
9.99
33.22
4.38
18.82
16,08
Earth need 175
.64 2.14 .28 1.19 1,06
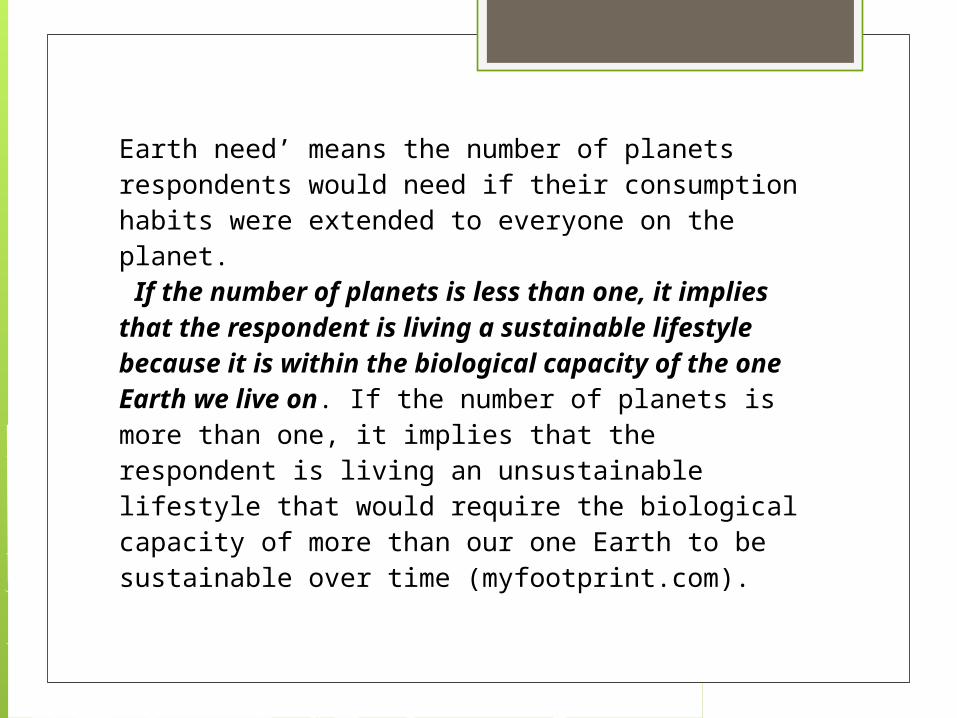
Earth need’ means the number of planets respondents would need if their consumption habits were extended to everyone on the planet. If the number of planets is less than one, it implies that the respondent is living a sustainable lifestyle because it is within the biological capacity of the one Earth we live on. If the number of planets is more than one, it implies that the respondent is living an unsustainable lifestyle that would require the biological capacity of more than our one Earth to be sustainable over time (myfootprint.com).
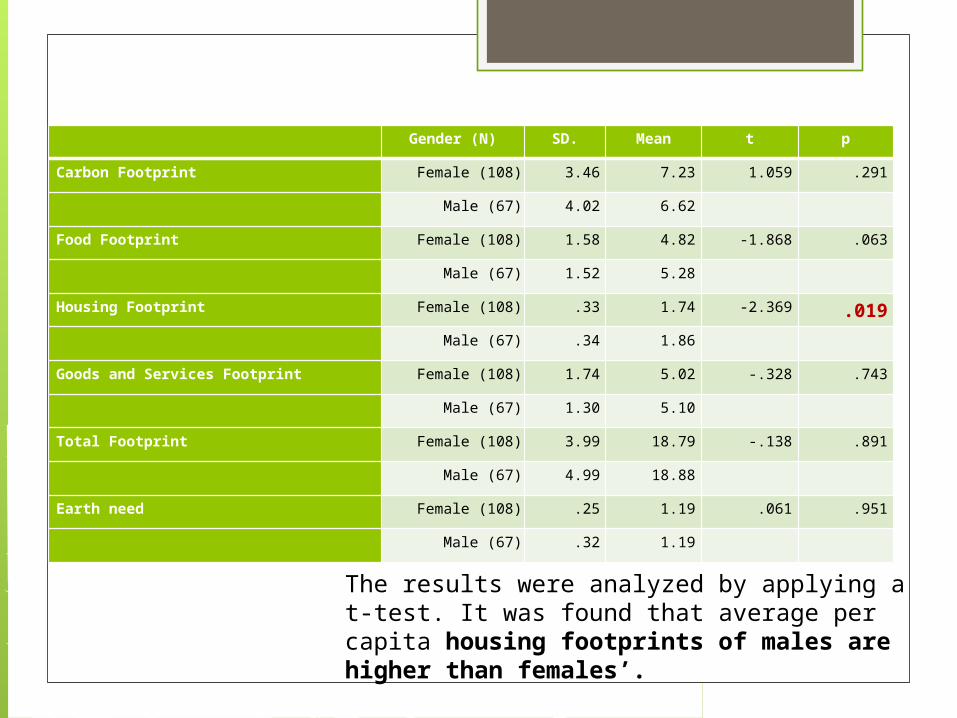
Gender/ Ecological Footprint Comparison
Gender (N) SD. Mean t p
Carbon Footprint Female (108) 3.46 7.23 1.059 .291
Male (67) 4.02 6.62
Food Footprint Female (108) 1.58 4.82 -1.868 .063
Male (67) 1.52 5.28
Housing Footprint Female (108) .33 1.74 -2.369 .019
Male (67) .34 1.86
Goods and Services Footprint Female (108) 1.74 5.02 -.328 .743
Male (67) 1.30 5.10
Total Footprint Female (108) 3.99 18.79 -.138 .891
Male (67) 4.99 18.88
Earth need Female (108) .25 1.19 .061 .951
Male (67) .32 1.19
The results were analyzed by applying a t-test. It was found that average per capita housing footprints of males are higher than females’.

Household Income/ Ecological Footprint Comparison
Household income*
(N)
SD. Mean F p PostHoc (Scheffe
)Carbon Footprint 1 (94) 3.30 6.93 .601 .549 2 (55) 4.48 6.77 3 (26) 3.14 7.71 Food Footprint 1 (94) 1.28 4.91 .361 .697 2 (55) 1.62 5.13 3 (26) 2.30 5.04 Housing Footprint 1 (94) .38 1.81 2.422 .092 2 (55) .24 1.71 3 (26) .31 1.87 Goods and Services Footprint
1 (94) 1.55 4.45 17.709
.000 1<2,3
2 (55) 1.45 5.81
3 (26) 1.04 5.65 Total Footprint 1 (94) 3.73 18.28 1.892 .154 2 (55) 5.16 19.19 3 (26) 4.66 20.02 Earth need 1 (94) .24 1.16 1.996 .139 2 (55) .33 1.22 3 (26) .29 1.27
When income levels of people increase, ecological footprints of goods and services increase, however the other footprints remain unchanged.
The questions related to goods and services are such as being a non frugal spender, tend to replace belongings even if they are in good condition etc. that means when people allocate their resources to the things that they do not need so much, their footprint is increasing.
By decreasing these expenses, it can be easier to obtain a more sustainable world.

Conclusions Individuals have the most power to lessen
the demand for earth’s finite resources through the choices they make in their daily life.
Businesses also can use the Ecological Footprint to improve their production processes.
For instance, the hotels with regard to environmental issues, e.g., they may ask whether we need the room to be cleaned or the towels to be changed each day or not. Or, from yemeksepeti.com, when you order some meals they ask whether you need the extra plastic knife/spoon/plate,
Municipalities in Turkey who are trying to collect garbages in different baskets. In some public spots or advertisements are shown on television about saving habits, and reducing footprints

Consequently, we need more ecologically conscious individuals, businesses, and governments.
Networks’ effect: one click may contribute to saving everything in the future.
In results, Facebook is the most visited virtual community in relation to environmental protection campaigns/activities, with news sites and second is Youtube videos.
Governments and businesses can shape their ecologically conscious activities/campaigns by using these tools to increase the level of information available on these issues.

Through this study, we think that we have made 175 individuals became aware of the meaning of saving the earth and the importance of protecting the environment.
Increasing this sampling size is important to save the planet as in the story of the starfishes.
For further research, the authors are planning to calculate other generation’s consumption patterns and comparing the countries based on cultural dimensions.


12 Simple Ways to Reduce Your Family’s Footprint Plan your meal Shower less frequently Wear clothes more than once Hang your clothes to dry Bring home less waste Grow your own veggies Make a windowsill herb garden Have a yard sale Use your car less Invest in reusable bags Dress in layers Buy gently used clothing

As a human, we must not forget “welfare of the
humanity depends on the health and sustainability of
the planet“ …
Thank you for your listening…
Eda YASA OZELTURKAY [email protected]
Hatice DOGAN SÜDAŞ [email protected]