bioenergetics – our cells’ ability to release the energy in glucose, starch, and fat we do this...
TRANSCRIPT
Cellular Energetics – Respiration and Photosynthesis
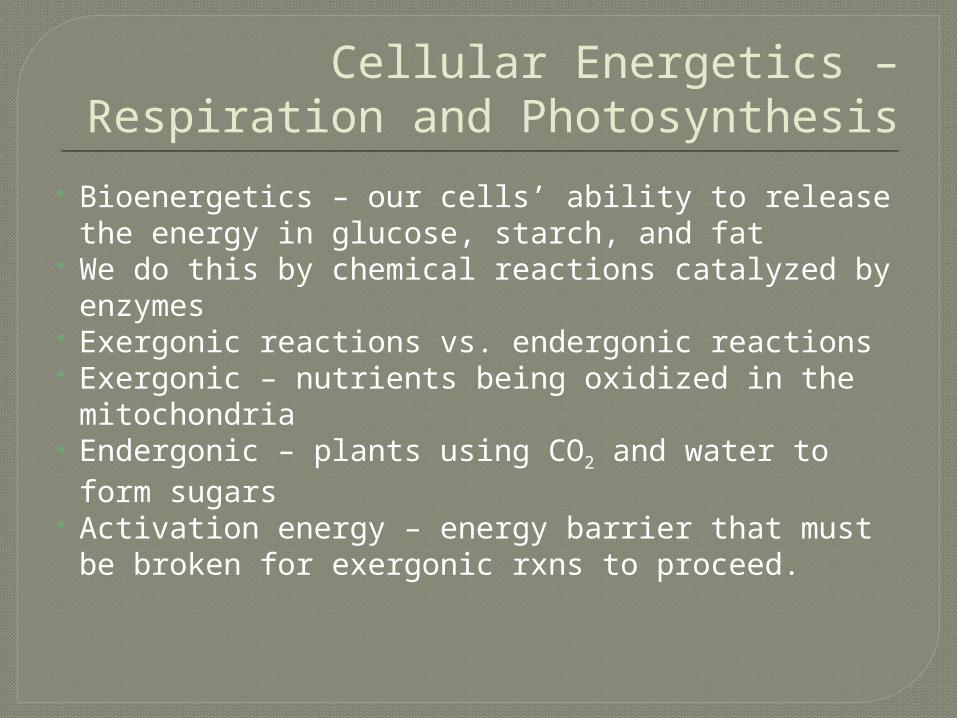
Bioenergetics – our cells’ ability to release the energy in glucose, starch, and fat
We do this by chemical reactions catalyzed by enzymes
Exergonic reactions vs. endergonic reactions Exergonic – nutrients being oxidized in the
mitochondria Endergonic – plants using CO2 and water to
form sugars Activation energy – energy barrier that must
be broken for exergonic rxns to proceed.

Figure 8.6
(a) Exergonic reaction: energy released, spontaneous
(b) Endergonic reaction: energy required, nonspontaneous
Reactants
EnergyProducts
Progress of the reaction
Amount of energy
released(G 0)
ReactantsEnergy
Products
Amount of energy
required(G 0)
Progress of the reaction
Fre
e e
nerg
yFre
e e
nerg
y

Figure 8.8b
Adenosine triphosphate (ATP)
Energy
Inorganicphosphate
Adenosine diphosphate (ADP)
(b) The hydrolysis of ATP
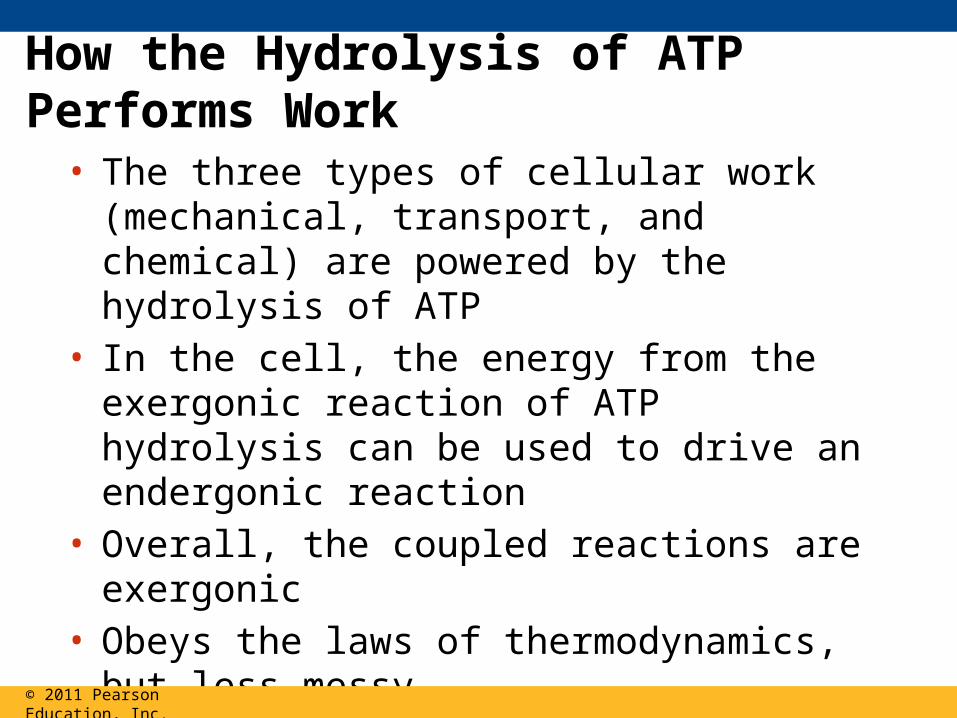
How the Hydrolysis of ATP Performs Work
• The three types of cellular work (mechanical, transport, and chemical) are powered by the hydrolysis of ATP
• In the cell, the energy from the exergonic reaction of ATP hydrolysis can be used to drive an endergonic reaction
• Overall, the coupled reactions are exergonic • Obeys the laws of thermodynamics, but less
messy
© 2011 Pearson Education, Inc.

Figure 8.9
Glutamicacid
Ammonia Glutamine
(b)Conversionreactioncoupledwith ATPhydrolysis
Glutamic acidconversionto glutamine
(a)
(c)Free-energychange forcoupledreaction
Glutamicacid
GlutaminePhosphorylatedintermediate
GluNH3 NH2
Glu GGlu = +3.4 kcal/mol
ATP ADP ADP
NH3
Glu Glu
PP i
P iADP
GluNH2
GGlu = +3.4 kcal/mol
Glu GluNH3 NH2ATP
GATP = 7.3 kcal/molGGlu = +3.4 kcal/mol
+ GATP = 7.3 kcal/mol
Net G = 3.9 kcal/mol
1 2
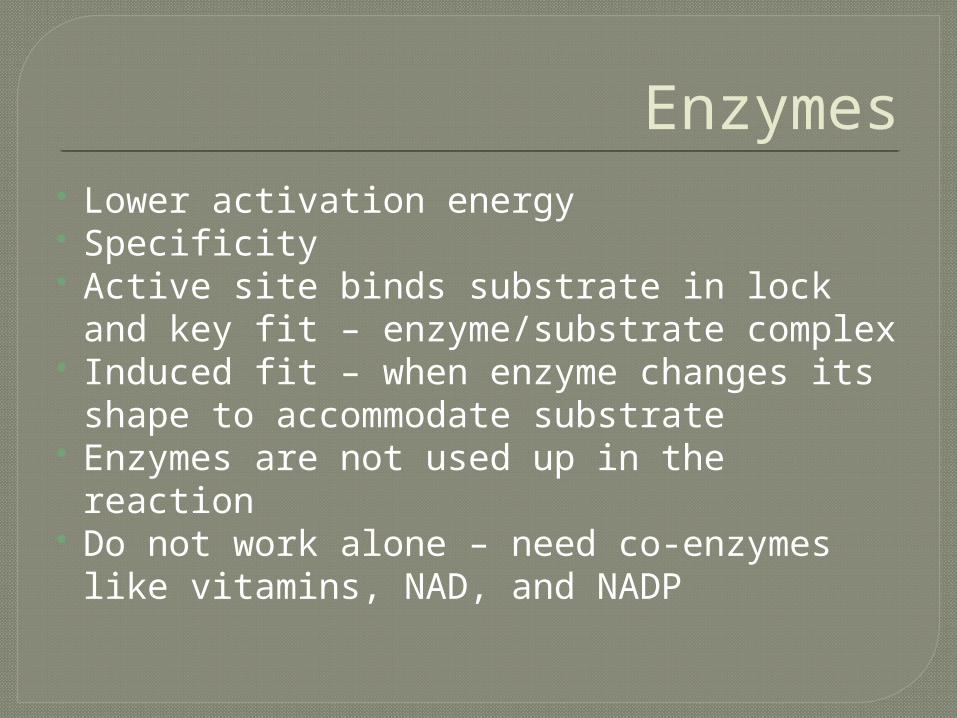
Enzymes Lower activation energy Specificity Active site binds substrate in lock and
key fit – enzyme/substrate complex Induced fit – when enzyme changes its
shape to accommodate substrate Enzymes are not used up in the reaction Do not work alone – need co-enzymes
like vitamins, NAD, and NADP

Figure 8.13
Course ofreactionwithoutenzyme
EA
withoutenzyme EA with
enzymeis lower
Course ofreactionwith enzyme
Reactants
Products
G is unaffectedby enzyme
Progress of the reaction
Fre
e en
erg
y

Figure 8.14
Substrate
Active site
Enzyme Enzyme-substratecomplex
(a) (b)
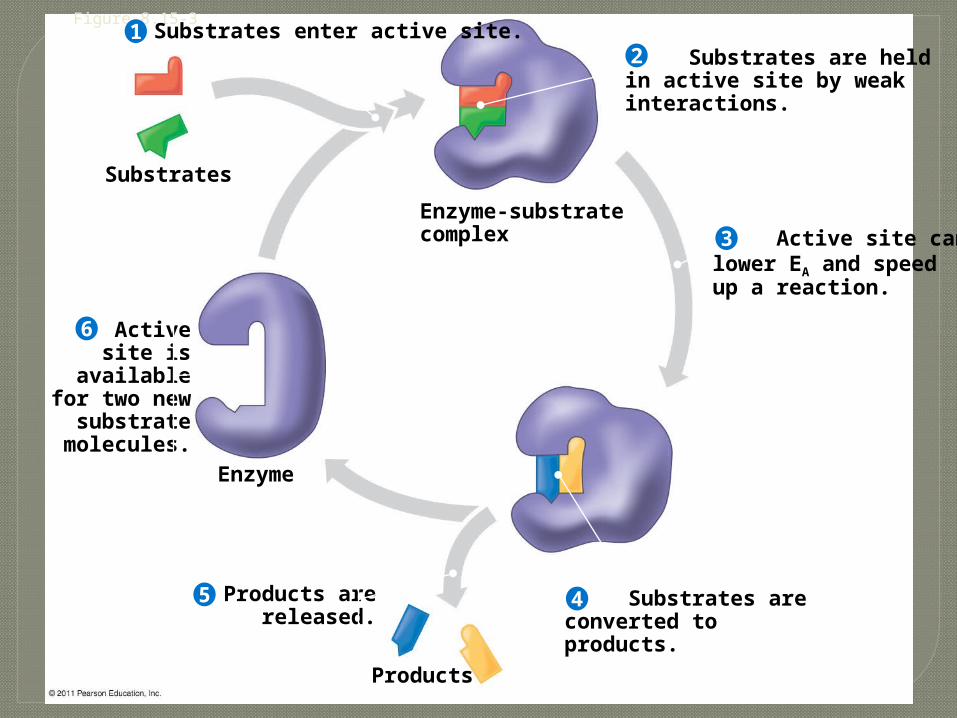
Figure 8.15-3
Substrates
Substrates enter active site.
Enzyme-substratecomplex
Enzyme
Products
Substrates are heldin active site by weakinteractions.
Active site canlower EA and speedup a reaction.
Activesite is
availablefor two new
substratemolecules.
Products arereleased.
Substrates areconverted toproducts.
12
3
45
6
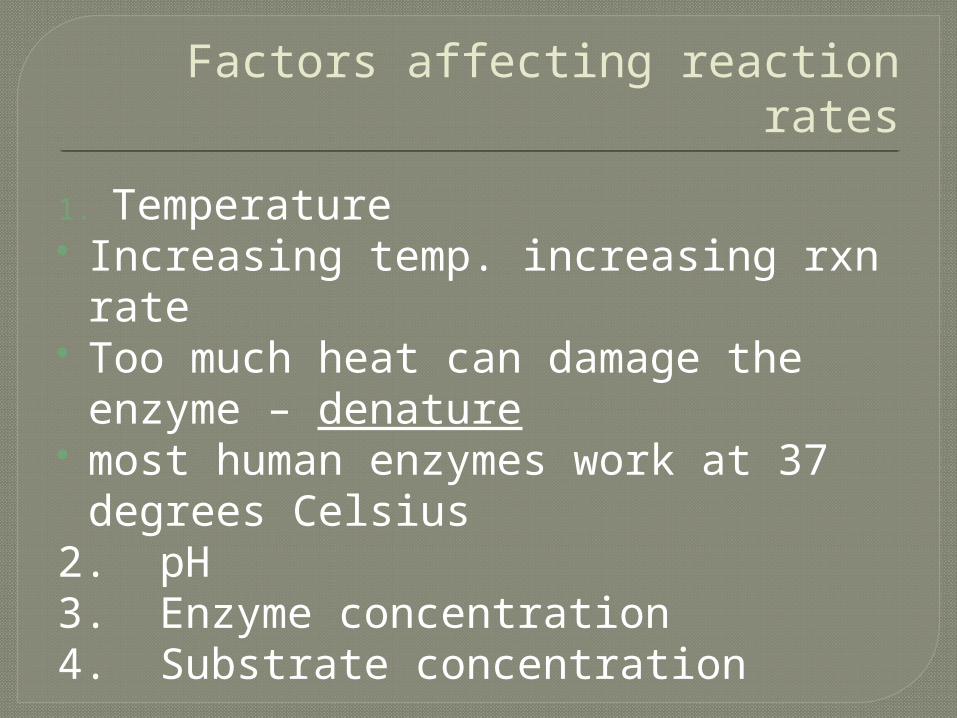
Factors affecting reaction rates
1. Temperature Increasing temp. increasing rxn rate Too much heat can damage the
enzyme – denature most human enzymes work at 37
degrees Celsius2. pH3. Enzyme concentration4. Substrate concentration

Figure 8.16
Optimal temperature fortypical human enzyme (37°C)
Optimal temperature forenzyme of thermophilic
(heat-tolerant)bacteria (77°C)
Temperature (°C)(a) Optimal temperature for two enzymes
Rate
of
reacti
on
Rate
of
reacti
on
120100806040200
0 1 2 3 4 5 6 7 8 9 10pH
(b) Optimal pH for two enzymes
Optimal pH for pepsin(stomachenzyme)
Optimal pH for trypsin(intestinal
enzyme)
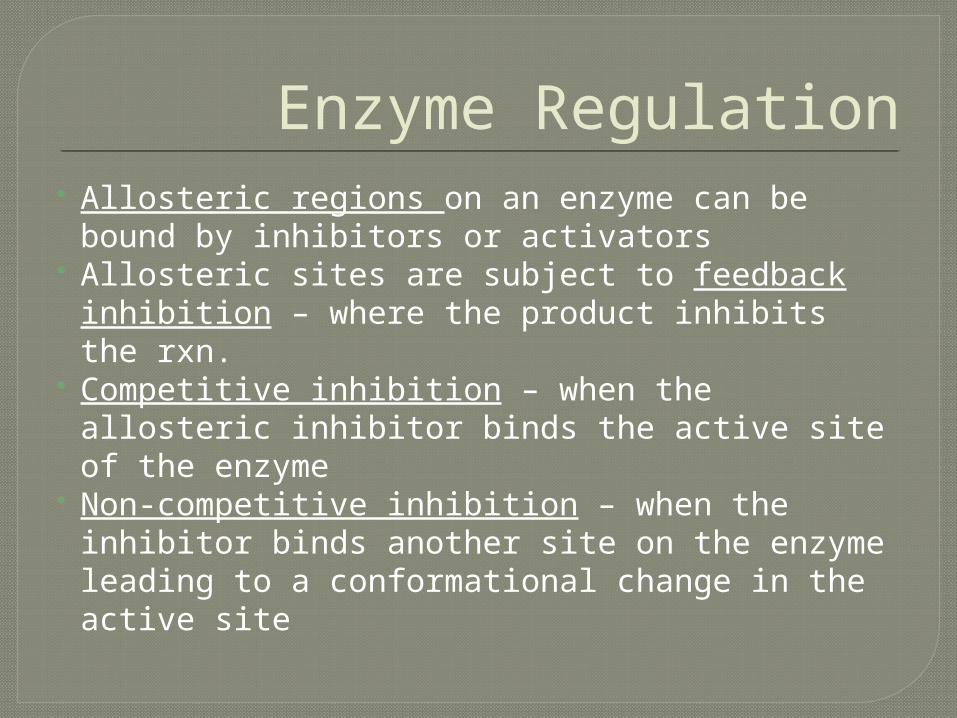
Enzyme Regulation Allosteric regions on an enzyme can be
bound by inhibitors or activators Allosteric sites are subject to feedback
inhibition – where the product inhibits the rxn.
Competitive inhibition – when the allosteric inhibitor binds the active site of the enzyme
Non-competitive inhibition – when the inhibitor binds another site on the enzyme leading to a conformational change in the active site

Figure 8.17
(a) Normal binding (b) Competitive inhibition (c) Noncompetitive inhibition
Substrate
Activesite
Enzyme
Competitiveinhibitor
Noncompetitiveinhibitor

Figure 8.19
Regulatorysite (oneof four)
(a) Allosteric activators and inhibitors
Allosteric enzymewith four subunits
Active site(one of four)
Active form
Activator
Stabilized active form
Oscillation
Non-functionalactive site
Inactive formInhibitor
Stabilized inactiveform
Inactive form
Substrate
Stabilized activeform
(b) Cooperativity: another type of allosteric activation

Figure 8.21
Active siteavailable
Isoleucineused up bycell
Feedbackinhibition
Active site ofenzyme 1 isno longer ableto catalyze theconversionof threonine tointermediate A;pathway isswitched off. Isoleucine
binds toallostericsite.
Initial substrate(threonine)
Threoninein active site
Enzyme 1(threoninedeaminase)
Intermediate A
Intermediate B
Intermediate C
Intermediate D
Enzyme 2
Enzyme 3
Enzyme 4
Enzyme 5
End product(isoleucine)
Sources of ATP Photosynthesis Cellular respiration

Figure 9.6-3
Electronscarried
via NADH
Electrons carriedvia NADH and
FADH2
Citricacidcycle
Pyruvateoxidation
Acetyl CoA
Glycolysis
Glucose Pyruvate
Oxidativephosphorylation:electron transport
andchemiosmosis
CYTOSOL MITOCHONDRION
ATP ATP ATP
Substrate-levelphosphorylation
Substrate-levelphosphorylation
Oxidative phosphorylation

Figure 9.8
Energy Investment Phase
Glucose
2 ADP 2 P
4 ADP 4 P
Energy Payoff Phase
2 NAD+ 4 e 4 H+
2 Pyruvate 2 H2O
2 ATP used
4 ATP formed
2 NADH 2 H+
NetGlucose 2 Pyruvate 2 H2O
2 ATP
2 NADH 2 H+ 2 NAD+ 4 e 4 H+
4 ATP formed 2 ATP used
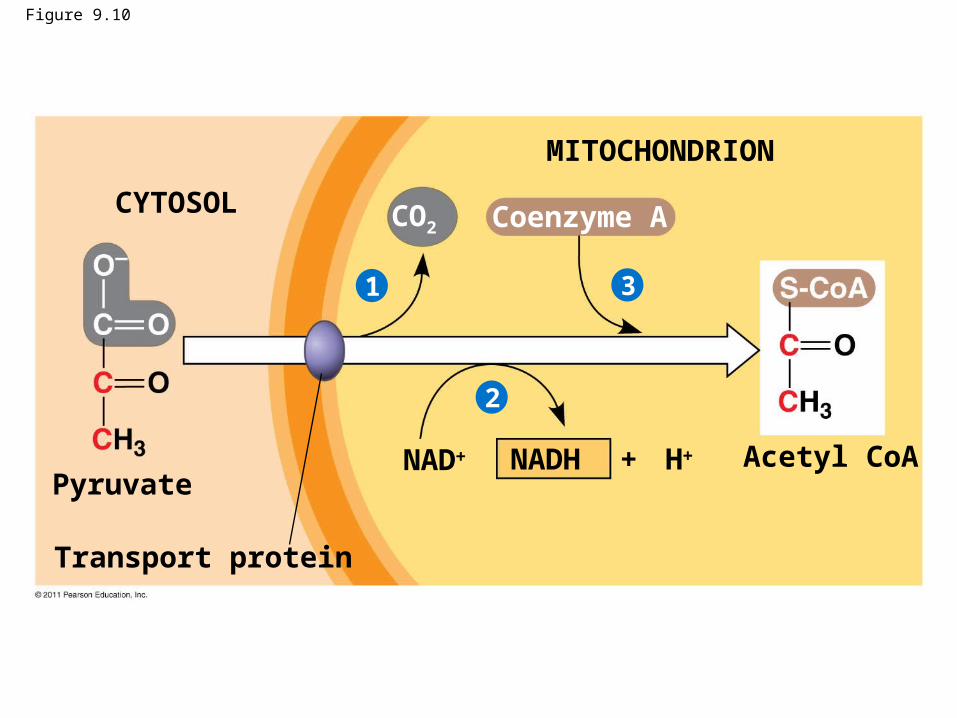
Figure 9.10
Pyruvate
Transport protein
CYTOSOL
MITOCHONDRION
CO2 Coenzyme A
NAD + HNADH Acetyl CoA
1
2
3
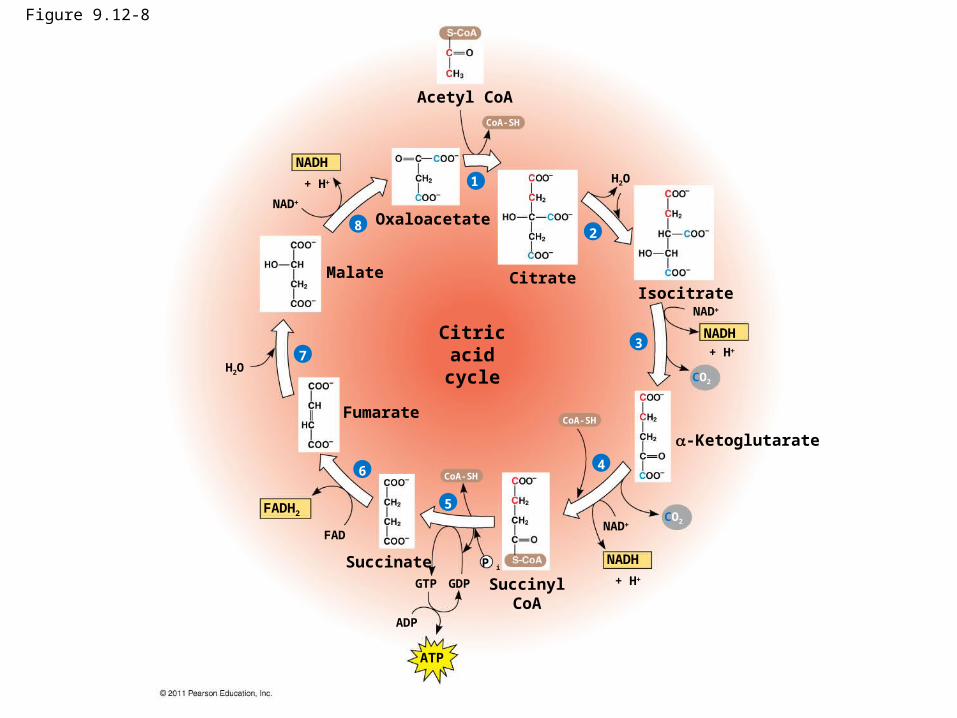
Figure 9.12-8
NADH
1
Acetyl CoA
CitrateIsocitrate
-Ketoglutarate
SuccinylCoA
Succinate
Fumarate
Malate
Citricacidcycle
NAD
NADH
NADH
FADH2
ATP
+ H
+ H
+ H
NAD
NAD
H2O
H2O
ADP
GTP GDP
P i
FAD
3
2
4
5
6
7
8
CoA-SH
CO2
CoA-SH
CoA-SH
CO2
Oxaloacetate

Figure 9.15
Proteincomplexof electroncarriers
(carrying electronsfrom food)
Electron transport chain
Oxidative phosphorylation
Chemiosmosis
ATPsynth-ase
I
II
III
IVQ
Cyt c
FADFADH2
NADH ADP P i
NAD
H
2 H + 1/2O2
H
HH
21
H
H2O
ATP

Figure 9.17
2 ADP 2 ATP
Glucose Glycolysis
2 Pyruvate
2 CO22
2 NADH
2 Ethanol 2 Acetaldehyde
(a) Alcohol fermentation (b) Lactic acid fermentation
2 Lactate
2 Pyruvate
2 NADH
Glucose Glycolysis
2 ATP2 ADP 2 Pi
NAD
2 H
2 Pi
2 NAD
2 H

Animations
• Glycolysis• Krebs cycle• Oxidative phosphorylation