americas headquarters cisco systems, inc. 170 west tasman drive san jose, ca 95134-1706 usa tel:...
TRANSCRIPT
Americas HeadquartersCisco Systems, Inc.170 West Tasman DriveSan Jose, CA 95134-1706 USAhttp://www.cisco.comTel: 408 526-4000
800 553-NETS (6387)Fax: 408 527-0883
Cisco Traffic Anomaly Detector Module Configuration Guide for the Catalyst 6500 Series Switches and Cisco 7600 Series Router
Software Release 6.0 and 6.0-XG February 2007
Text Part Number: OL-11857-01
THE SPECIFICATIONS AND INFORMATION REGARDING THE PRODUCTS IN THIS MANUAL ARE SUBJECT TO CHANGE WITHOUT NOTICE. ALL STATEMENTS, INFORMATION, AND RECOMMENDATIONS IN THIS MANUAL ARE BELIEVED TO BE ACCURATE BUT ARE PRESENTED WITHOUT WARRANTY OF ANY KIND, EXPRESS OR IMPLIED. USERS MUST TAKE FULL RESPONSIBILITY FOR THEIR APPLICATION OF ANY PRODUCTS.
THE SOFTWARE LICENSE AND LIMITED WARRANTY FOR THE ACCOMPANYING PRODUCT ARE SET FORTH IN THE INFORMATION PACKET THAT SHIPPED WITH THE PRODUCT AND ARE INCORPORATED HEREIN BY THIS REFERENCE. IF YOU ARE UNABLE TO LOCATE THE SOFTWARE LICENSE OR LIMITED WARRANTY, CONTACT YOUR CISCO REPRESENTATIVE FOR A COPY.
The Cisco implementation of TCP header compression is an adaptation of a program developed by the University of California, Berkeley (UCB) as part of UCB’s public domain version of the UNIX operating system. All rights reserved. Copyright © 1981, Regents of the University of California.
NOTWITHSTANDING ANY OTHER WARRANTY HEREIN, ALL DOCUMENT FILES AND SOFTWARE OF THESE SUPPLIERS ARE PROVIDED “AS IS” WITH ALL FAULTS. CISCO AND THE ABOVE-NAMED SUPPLIERS DISCLAIM ALL WARRANTIES, EXPRESSED OR IMPLIED, INCLUDING, WITHOUT LIMITATION, THOSE OF MERCHANTABILITY, FITNESS FOR A PARTICULAR PURPOSE AND NONINFRINGEMENT OR ARISING FROM A COURSE OF DEALING, USAGE, OR TRADE PRACTICE.
IN NO EVENT SHALL CISCO OR ITS SUPPLIERS BE LIABLE FOR ANY INDIRECT, SPECIAL, CONSEQUENTIAL, OR INCIDENTAL DAMAGES, INCLUDING, WITHOUT LIMITATION, LOST PROFITS OR LOSS OR DAMAGE TO DATA ARISING OUT OF THE USE OR INABILITY TO USE THIS MANUAL, EVEN IF CISCO OR ITS SUPPLIERS HAVE BEEN ADVISED OF THE POSSIBILITY OF SUCH DAMAGES.
Any Internet Protocol (IP) addresses used in this document are not intended to be actual addresses. Any examples, command display output, and figures included in the document are shown for illustrative purposes only. Any use of actual IP addresses in illustrative content is unintentional and coincidental.
Cisco Traffic Anomaly Detector Module Configuration Guide © 2007 Cisco Systems, Inc. All rights reserved.
CCVP, the Cisco logo, and Welcome to the Human Network are trademarks of Cisco Systems, Inc.; Changing the Way We Work, Live, Play, and Learn isa service mark of Cisco Systems, Inc.; and Access Registrar, Aironet, Catalyst, CCDA, CCDP, CCIE, CCIP, CCNA, CCNP, CCSP, Cisco, the CiscoCertified Internetwork Expert logo, Cisco IOS, Cisco Press, Cisco Systems, Cisco Systems Capital, the Cisco Systems logo, Cisco Unity,Enterprise/Solver, EtherChannel, EtherFast, EtherSwitch, Fast Step, Follow Me Browsing, FormShare, GigaDrive, HomeLink, Internet Quotient, IOS,iPhone, IP/TV, iQ Expertise, the iQ logo, iQ Net Readiness Scorecard, iQuick Study, LightStream, Linksys, MeetingPlace, MGX, Networkers,Networking Academy, Network Registrar, PIX, ProConnect, ScriptShare, SMARTnet, StackWise, The Fastest Way to Increase Your Internet Quotient,and TransPath are registered trademarks of Cisco Systems, Inc. and/or its affiliates in the United States and certain other countries.
All other trademarks mentioned in this document or Website are the property of their respective owners. The use of the word partner does not imply apartnership relationship between Cisco and any other company. (0711R)
OL-11857-01
C O N T E N T S
Preface xv
Audience xv
How to Use This Guide xvi
Symbols and Conventions xvii
Obtaining Documentation, Obtaining Support, and Security Guidelines xviii
C H A P T E R 1 Product Overview 1-1
Understanding the Detector Module 1-1
Understanding DDoS Attacks 1-2
Understanding Spoofed Attacks 1-3
Understanding Nonspoofed Attacks 1-3
Understanding Zones, Zone Policies, and the Learning Process 1-3
Understanding Zones 1-3
Understanding the Zone Policies 1-4
Understanding the Learning Process 1-4
Understanding the Anomaly Detection Process 1-4
Understanding Traffic Filters 1-5
Understanding the Different Anomaly Detection Modes 1-5
Understanding the Detect and Learn Function 1-5
Understanding Attack Reports 1-5
Understanding the 1-Gbps and 2-Gbps Bandwidth Options 1-6
C H A P T E R 2 Configuring the Detector Module on the Supervisor Engine 2-1
Verifying the Detector Module Installation 2-2
Setting Up Detector Module Management 2-2
Configuring Traffic Sources for Capturing Traffic 2-3
Configuring VACLs 2-4
Configuring SPAN 2-7
Accessing the Detector Module for the First Time 2-9
Establishing a Session with the Detector Module after the Initial Session 2-10
Rebooting the Detector Module 2-10
Verifying the Detector Module Configuration 2-12
iiiCisco Traffic Anomaly Detector Module Configuration Guide
Contents
C H A P T E R 3 Initializing the Detector Module 3-1
Using the Command-Line Interface 3-1
Understanding User Privilege Levels 3-2
Understanding Command Modes 3-2
Entering CLI Commands 3-3
Using the no Form of a Command 3-5
show Command Syntax 3-5
CLI Error Messages 3-5
Tips for Using the CLI 3-6
Using Help 3-6
Using Tab Completion 3-6
Understanding Conventions of Operation Direction 3-6
Abbreviating a Command 3-7
Using Wildcard Characters 3-7
Configuring the Detector Module Interfaces 3-7
Configuring a Physical Interface 3-8
Clearing the Counters of a Physical Interface 3-9
Configuring the Default Gateway 3-10
Adding a Static Route to the Routing Table 3-10
Managing the Detector Module 3-11
Managing the Detector Module with the Web-Based Manager 3-11
Managing the Detector Module with the Cisco DDoS MultiDevice Manager 3-13
Accessing the Detector Module with SSH 3-13
C H A P T E R 4 Configuring the Detector 4-1
Activating Detector Services 4-1
Configuring Access Control Using AAA 4-3
Configuring Authentication 4-4
Configuring Authentication Methods 4-5
Configuring Local Authentication 4-6
Configuring Authorization 4-8
Configuring Local Authorization 4-9
Configuring Authorization Methods 4-10
Disabling Tab Completion of Zone Names 4-12
Configuring Accounting 4-12
Configuring the TACACS+ Server Attributes 4-13
Configuring a TACACS+ Server IP Address 4-14
Configuring the TACACS+ Server Encryption Key 4-15
Configuring the TACACS+ Search Method 4-15
ivCisco Traffic Anomaly Detector Module Configuration Guide
OL-11857-01
Contents
Configuring the TACACS+ Server Connection Timeout 4-15
Displaying TACACS+ Server Statistics 4-16
Establishing Communication with the Guard 4-16
Configuring the SSL Communication Channels Parameters 4-17
Enabling an SSL Communication Channel 4-18
Regenerating SSL Certificates 4-19
Configuring the SSH Communication Channel Parameters 4-20
Enabling an SSH Communication Channel 4-20
Regenerating SSH Communication Channel Keys 4-20
Establishing Communication Channels 4-21
Managing SSH Keys 4-23
Adding SSH Keys 4-23
Deleting SSH Keys 4-24
Configuring the Keys for SFTP and SCP Connections 4-24
Changing the Hostname 4-25
Enabling SNMP Traps 4-25
Configuring SNMP Community Strings 4-29
Configuring the Login Banner 4-30
Configuring the Login Banner from the CLI 4-30
Importing the Login Banner 4-31
Deleting the Login Banner 4-31
Configuring the Web-Based Manager Logo 4-32
Importing the WBM Logo 4-32
Deleting the WBM Logo 4-33
Configuring the Session Timeout 4-33
C H A P T E R 5 Configuring Zones 5-1
Understanding Zones 5-1
Using Zone Templates 5-2
Creating a New Zone 5-4
Creating a New Zone from a Zone Template 5-4
Creating a New Zone by Duplicating an Existing Zone 5-5
Configuring Zone Attributes 5-6
Configuring the Zone IP Address Range 5-7
Synchronizing Zone Configurations with a Guard 5-8
Understanding the Configuration Guidelines for Synchronization 5-9
Creating a Zone for Synchronization 5-10
Configuring the Automatic Zone Synchronization and Export Parameters 5-11
vCisco Traffic Anomaly Detector Module Configuration Guide
OL-11857-01
Contents
Synchronizing a Zone Configuration from the Guard to the Detector Module 5-12
Synchronizing a Zone Configuration from the Detector Module to the Guard 5-13
Synchronizing a Zone Configuration Offline 5-14
Exporting a Zone Configuration Automatically to a Network Server 5-15
Exporting a Zone Configuration Manually to a Network Server 5-16
Example Synchronization Scenario 5-18
C H A P T E R 6 Configuring Zone Filters 6-1
Understanding Zone Filters 6-1
Configuring Flex-Content Filters 6-2
Adding a Flex-Content Filter 6-3
Configuring the tcpdump-expression Syntax 6-5
Configuring the pattern-expression Syntax 6-8
Displaying Flex-Content Filters 6-9
Deleting Flex-Content Filters 6-9
Changing the State of a Flex-Content Filter 6-10
Configuring Bypass Filters 6-10
Adding a Bypass Filter 6-10
Displaying Bypass Filters 6-11
Deleting Bypass Filters 6-12
Configuring Dynamic Filters 6-12
Displaying Dynamic Filters 6-13
Adding Dynamic Filters 6-14
Deleting Dynamic Filters 6-15
Preventing the Production of Dynamic Filters 6-16
C H A P T E R 7 Configuring Policy Templates and Policies 7-1
Understanding Zone Policies 7-1
Understanding Policy Templates 7-2
Understanding the Different Policy Template Types 7-2
Configuring Policy Template Parameters 7-4
Configuring the Maximum Number of Services 7-5
Configuring the Minimum Threshold 7-5
Configuring Policy Template States 7-6
Configuring All Policy Template Parameters Simultaneously 7-6
Understanding the Policy Path 7-7
Understanding and Managing the Policy Services 7-8
Adding a Service 7-9
Deleting a Service 7-9
viCisco Traffic Anomaly Detector Module Configuration Guide
OL-11857-01
Contents
Understanding the Packet Types that the Detector module Monitors 7-10
Understanding the Traffic Characteristics that the Detector Module Monitors 7-11
Configuring Policy Parameters 7-12
Changing the Policy State 7-13
Configuring the Policy Threshold 7-13
Setting the Policy Threshold 7-14
Setting the Threshold as Fixed 7-15
Configuring a Threshold Multiplier 7-15
Multiplying a Threshold by a Factor 7-16
Configuring Specific IP Thresholds 7-17
Configuring the Policy Timeout 7-18
Configuring the Policy Action 7-18
Configuring the Policy Interactive Status 7-19
Understanding Worm Policies 7-20
Configuring Worm Policies 7-21
Identifying Worm Attacks 7-22
Monitoring Policies 7-22
Displaying Policies 7-23
Displaying Policy Statistics 7-24
Backing Up the Policy Configuration 7-25
C H A P T E R 8 Learning the Zone Traffic Characteristics 8-1
Understanding the Learning Process and Related Options 8-1
Understanding the Phases of the Learning Process 8-2
Verifying the Results of the Learning Process 8-2
Understanding the Detect and Learn Function 8-3
Synchronizing the Zone Learning Process Results with a Guard 8-3
Activating the Policy Construction Phase 8-4
Activating the Threshold Tuning Phase 8-6
Configuring Learning Parameters 8-8
Configuring Periodic Actions 8-8
Configuring the Threshold Selection Method 8-9
Marking the Policies as Tuned 8-10
Enabling the Detect and Learn Function 8-11
Using Snapshots to Verify the Results of the Learning Process 8-12
Creating Snapshots 8-12
Comparing Learning Results 8-13
Comparing Snapshots 8-13
viiCisco Traffic Anomaly Detector Module Configuration Guide
OL-11857-01
Contents
Comparing Zones 8-14
Displaying Snapshots 8-15
Deleting Snapshots 8-15
Copying Policies to the Zone Configuration 8-16
Backing Up the Zone Policies 8-17
C H A P T E R 9 Detecting Zone Traffic Anomalies 9-1
Understanding Zone Anomaly Detection 9-1
Configuring How the Detector Module Performs Zone Anomaly Detection 9-3
Configuring Guard-Protection Activation Methods 9-3
Activating Zone Anomaly Detection 9-4
Deactivating Zone Anomaly Detection 9-5
Activating Remote Guards to Protect a Zone 9-5
Activating Remote Guards Using Remote Guard Lists 9-5
Activating a Remote Guard and Synchronizing Zone Configuration 9-6
Configuring the Default Remote Guard List 9-7
Configuring the Zone Remote Guard Lists 9-8
Activating Remote Guards Offline 9-8
Activating Remote Guards Manually 9-9
C H A P T E R 10 Using Interactive Detect Mode 10-1
Understanding Interactive Detect Mode 10-1
Activating Interactive Detect Mode and Anomaly Detection 10-2
Configuring the Zone for Interactive Detect Mode 10-3
Displaying Recommendations 10-4
Managing Recommendations 10-6
Deactivating Interactive Detect Mode 10-8
C H A P T E R 11 Using Attack Reports 11-1
Understanding the Report Layout 11-1
General Details 11-1
Attack Statistics 11-2
Detected Anomalies 11-2
Understanding the Report Parameters 11-3
Displaying Attack Reports 11-4
Exporting Attack Reports 11-6
Exporting Attack Reports Automatically 11-6
viiiCisco Traffic Anomaly Detector Module Configuration Guide
OL-11857-01
Contents
Exporting Attack Reports of All Zones 11-7
Exporting Zone Reports 11-8
Deleting Attack Reports 11-9
C H A P T E R 12 Using Detector Module Diagnostic Tools 12-1
Displaying the Installed Software Version Number and License Agreement 12-2
Displaying the Software License Key Information 12-2
Displaying the Detector Module Configuration 12-3
Displaying Detector Module Zones 12-4
Using Counters to Analyze Traffic 12-4
Displaying Counters and Average Traffic Rates 12-4
Clearing Detector Module and Zone Counters 12-5
Displaying the Zone Status 12-6
Managing Detector Module Logs 12-6
Managing Online Event Logs 12-7
Displaying Online Event Logs 12-7
Exporting Online Event Logs 12-7
Managing the Log File 12-9
Displaying the Log File 12-9
Exporting the Log File 12-9
Clearing the Log File 12-10
Monitoring Network Traffic and Extracting Attack Signatures 12-11
Configuring the Detector Module to Automatically Record Traffic 12-12
Activating the Detector Module to Manually Record Traffic 12-13
Stopping the Detector Module from Manually Recording Traffic 12-14
Displaying Manual Packet-Dump Settings 12-14
Exporting Packet-Dump Capture Files Automatically 12-15
Exporting Packet-Dump Capture Files Manually 12-15
Importing Packet-Dump Capture Files 12-17
Displaying Packet-Dump Capture Files 12-18
Generating Attack Signatures from Packet-Dump Capture Files 12-19
Copying Packet-Dump Capture Files 12-20
Deleting Packet-Dump Capture Files 12-21
Displaying General Diagnostic Data 12-22
Displaying Flash Memory Usage 12-23
Displaying Memory Consumption 12-23
Displaying the CPU Utilization 12-24
Monitoring System Resources 12-24
ixCisco Traffic Anomaly Detector Module Configuration Guide
OL-11857-01
Contents
Managing the ARP Cache 12-26
Displaying Network Statistics 12-26
Using Traceroute 12-29
Verifying Connectivity 12-30
Obtaining Debug Information 12-31
C H A P T E R 13 Performing Maintenance Tasks 13-1
Configuring File Servers 13-2
Exporting the Configuration 13-3
Importing and Updating the Configuration 13-4
Exporting Files Automatically to a Network Server 13-6
Reloading the Detector Module 13-8
Rebooting the Detector Module and Inactivating Zones 13-8
Upgrading the Detector Module Software 13-8
Supervisor Engine 2 or Supervisor Engine 720 Cisco IOS Software 13-8
Detector Module Software 13-9
Upgrading Operation Notes 13-9
Upgrading the AP Image 13-10
Upgrading the MP Image 13-12
Upgrading the AP and MP Images Inline 13-13
Burning a New Flash Version to Upgrade the CFE 13-15
Upgrading the Bandwidth Performance from 1 Gbps to 2 Gbps 13-16
Obtaining and Installing the XG Software Image for the 2-Gbps Operation 13-17
Obtaining and Installing the XG Software Image License Key 13-17
Activating the Additional Data Port for the 2-Gbps Operation 13-18
Regenerating the SSL Certificates for the 2-Gbps Operation 13-18
Using MP Commands 13-18
Recovering from a Lost Password Condition 13-19
Resetting the Default admin User Account Password 13-20
Resetting All User Account Information 13-20
Resetting the User Account Information Using the MP root User Account 13-21
Resetting the User Account Information Using the AP root User Account 13-22
Resetting the Detector Module Configuration to Factory Default Values 13-22
IN D E X
xCisco Traffic Anomaly Detector Module Configuration Guide
OL-11857-01
Preface
This guide describes the Cisco Traffic Anomaly Detector Module (Detector module), how it functions, and how to perform administration tasks.
This preface describes the audience, organization, and conventions of this publication, and provides information on how to obtain related documentation.
This preface contains the following sections:
• Audience
• How to Use This Guide
• Symbols and Conventions
• Obtaining Documentation, Obtaining Support, and Security Guidelines
AudienceThe Cisco Traffic Anomaly Detector Module Configuration Guide is intended primarily for the following audiences:
• Network administrators
• Engineers
• Operators
• Network security professionals
This guide assumes a thorough knowledge of networking and networking security.
xvCisco Traffic Anomaly Detector Module Configuration Guide
OL-11857-01
Preface
How to Use This GuideThis guide is organized as follows:
Chapter Description
Chapter 1, “Product Overview”
Describes the Detector module and outlines the Detector module operation states and components.
Chapter 2, “Configuring the Detector Module on the Supervisor Engine”
Describes how to configure the Detector module on a Catalyst 6500 series switch and a Cisco 7600 series router.
Chapter 3, “Initializing the Detector Module”
Describes the initial procedures required to connect and configure the Detector module. The chapter outlines the Detector module CLI environment and authentication methods.
Chapter 4, “Configuring the Detector”
Describes how to configure Detector module services and access control.
Chapter 5, “Configuring Zones”
Describes how to create and manage zones.
Chapter 6, “Configuring Zone Filters”
Describes the zone filters and how to configure them.
Chapter 7, “Configuring Policy Templates and Policies”
Describes the zone policies and policy templates and how to configure them.
Chapter 8, “Learning the Zone Traffic Characteristics”
Describes the learning process and how to use the learning process to construct and tune the policies that the Detector module uses for zone anomaly detection.
Chapter 9, “Detecting Zone Traffic Anomalies”
Describes how to configure and activate the Detector module to detect anomalies in the zone traffic and to activate a Cisco Anomaly Guard Module to protect a zone.
Chapter 10, “Using Interactive Detect Mode”
Describes the Interactive detect mode and the recommendations, the user decision options, and the policy interactive status.
Chapter 11, “Using Attack Reports”
Describes the attack reports, the report structure, and viewing options.
Chapter 12, “Using Detector Module Diagnostic Tools”
Describes the Detector module diagnostic tools.
xviCisco Traffic Anomaly Detector Module Configuration Guide
OL-11857-01
Preface
Symbols and ConventionsThis guide uses the following conventions:
This guide uses the zone name scannet and the prompt user@DETECTOR-conf-zone-scannet# in examples.
This guide uses the following symbols and conventions to identify different types of information:
Caution Means reader be careful. In this situation, you might do something that could result in equipment damage or loss of data.
Note Means reader take note. Notes contain helpful suggestions or references to material not covered in the manual.
Tip Means the following information will help you solve a problem. The tips information might not be troubleshooting or even an action, but could be useful information.
Timesaver Means the described action saves time. You can save time by performing the action described in the paragraph.
Style or Symbol Description
boldface font Boldface text indicates commands and keywords that you must enter exactly as shown.
Italics font Italic font indicates arguments for which you supply the values.
Screen font Screen font indicates the screen display, such as a prompt, and information that the Detector displays on the screen. Do not enter screen font as part of the command.
[x] Square brackets indicate an optional element (keyword or argument).
[x | y] Square brackets enclosing keywords or arguments separated by a vertical line indicate an optional choice.
{x | y} Braces enclosing keywords or arguments separated by a vertical line indicate a required choice.
[x {y | z}] Braces and vertical bars within square brackets indicate a required choice within an optional element. You do not need to select one. If you do, you have some required choices.
xviiCisco Traffic Anomaly Detector Module Configuration Guide
OL-11857-01
Preface
Obtaining Documentation, Obtaining Support, and Security Guidelines
For information on obtaining documentation, obtaining support, providing documentation feedback, security guidelines, and also recommended aliases and general Cisco documents, see the monthly What’s New in Cisco Product Documentation, which also lists all new and revised Cisco technical documentation, at:
http://www.cisco.com/en/US/docs/general/whatsnew/whatsnew.html
xviiiCisco Traffic Anomaly Detector Module Configuration Guide
OL-11857-01
Cisco TraOL-11857-01
C H A P T E R 1
Product OverviewThis chapter provides a general overview of the Cisco Traffic Anomaly Detector Module (Detector module) including its major components and how they work together to help protect network elements by detecting malicious attack traffic.
The chapter contains the following sections:
• Understanding the Detector Module
• Understanding DDoS Attacks
• Understanding Zones, Zone Policies, and the Learning Process
• Understanding the Anomaly Detection Process
• Understanding the 1-Gbps and 2-Gbps Bandwidth Options
Understanding the Detector ModuleThe Detector module monitors a copy of the network traffic, continuously looking for indications of a Distributed Denial of Service (DDoS) attack against a network element, or zone, such as a server, firewall interface, or router interface.
You can install the Detector module in one of the following Cisco products:
• Catalyst 6500 series switch
• Cisco 7600 series router
Using port mirroring or a fiber optic link splitter, you configure the switch or router to capture the traffic sent to the zone and pass a copy of it to the Detector module.
The Detector module can operate as an independent DDoS detection and alarm component; however, it works optimally with the Cisco Guard (Guard), the companion product of the Detector module.
Note The Guard is a DDoS attack detection and mitigation device that cleans the zone traffic as the traffic flows through it, dropping the attack traffic and injecting the legitimate traffic back into the network. When the Detector module determines that the zone is under attack, it can activate the Guard attack mitigation services. The Detector module can also synchronize zone configurations with the Guard. For more information about the Guard, see the Cisco Anomaly Guard Module Configuration Guide or the Cisco Guard Configuration Guide.
1-1ffic Anomaly Detector Module Configuration Guide
Chapter 1 Product OverviewUnderstanding DDoS Attacks
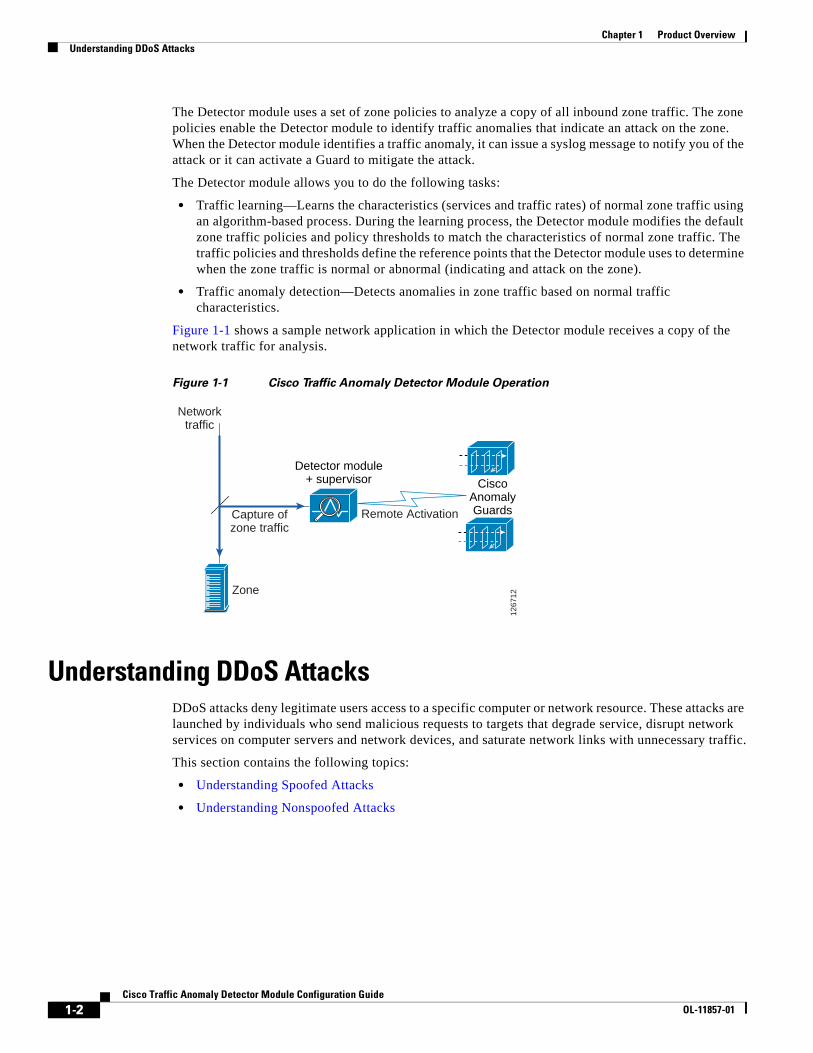
The Detector module uses a set of zone policies to analyze a copy of all inbound zone traffic. The zone policies enable the Detector module to identify traffic anomalies that indicate an attack on the zone. When the Detector module identifies a traffic anomaly, it can issue a syslog message to notify you of the attack or it can activate a Guard to mitigate the attack.
The Detector module allows you to do the following tasks:
• Traffic learning—Learns the characteristics (services and traffic rates) of normal zone traffic using an algorithm-based process. During the learning process, the Detector module modifies the default zone traffic policies and policy thresholds to match the characteristics of normal zone traffic. The traffic policies and thresholds define the reference points that the Detector module uses to determine when the zone traffic is normal or abnormal (indicating and attack on the zone).
• Traffic anomaly detection—Detects anomalies in zone traffic based on normal traffic characteristics.
Figure 1-1 shows a sample network application in which the Detector module receives a copy of the network traffic for analysis.
Figure 1-1 Cisco Traffic Anomaly Detector Module Operation
Understanding DDoS AttacksDDoS attacks deny legitimate users access to a specific computer or network resource. These attacks are launched by individuals who send malicious requests to targets that degrade service, disrupt network services on computer servers and network devices, and saturate network links with unnecessary traffic.
This section contains the following topics:
• Understanding Spoofed Attacks
• Understanding Nonspoofed Attacks
1267
12Zone
Remote Activation
Networktraffic
Detector module+ supervisor Cisco
AnomalyGuardsCapture of
zone traffic
1-2Cisco Traffic Anomaly Detector Module Configuration Guide
OL-11857-01
Chapter 1 Product OverviewUnderstanding Zones, Zone Policies, and the Learning Process
Understanding Spoofed AttacksA spoofed attack is a type of DDoS attack in which the packets contain an IP address in the header that is not the actual IP address of the originating device. The source IP addresses of the spoofed packets can be random or have specific, focused addresses. Spoofed attacks saturate the target site links and the target site server resources. It is easy for a computer hacker to generate high volume spoofed attacks even from a single device.
Understanding Nonspoofed AttacksNonspoofed attacks (or client attacks) are mostly TCP-based with real TCP connections that can overwhelm the application level on the server rather than the network link or operating system.
Client attacks from a large number of clients (or zombies) may overwhelm the server application even without any of the individual clients creating an anomaly. The zombie programs try to imitate legitimate browsers that access the target site.
Understanding Zones, Zone Policies, and the Learning ProcessThis section describes what a Detector module zone represents, how zone policies detect traffic anomalies, and how the Detector module learns the zone traffic characteristics.
These sections contain the following topics:
• Understanding Zones
• Understanding the Zone Policies
• Understanding the Learning Process
Understanding ZonesA zone that the Detector module monitors for traffic anomalies can be one of the following elements:
• A network server, client, or router
• A network link, subnet, or an entire network
• An individual Internet user or a company
• An Internet Service Provider (ISP)
• Any combination of these elements
When you create a new zone, you assign a name to it and configure the zone with network addresses. The Detector module configures the zone with a default set of policies and policy thresholds to detect anomalies in the zone traffic.
The Detector module can protect multiple zones at the same time if the network address ranges do not overlap.
For more information about zones, see Chapter 5, “Configuring Zones.”
1-3Cisco Traffic Anomaly Detector Module Configuration Guide
OL-11857-01
Chapter 1 Product OverviewUnderstanding the Anomaly Detection Process
Understanding the Zone PoliciesThe policies associated with the zone configuration enable the Detector module to detect anomalies in the zone traffic. When the traffic flow exceeds a policy threshold, the Detector module identifies the traffic as abnormal or malicious and dynamically configures a set of filters (dynamic filters) to apply the appropriate detection level to the traffic flow according to the severity of the attack.
For more information about zone policies, see Chapter 7, “Configuring Policy Templates and Policies.”
Understanding the Learning ProcessThe learning process enables the Detector module to analyze normal zone traffic and create a set of zone-specific policies and policy thresholds that enable the Detector module to more accurately detect zone traffic anomalies.
You enable the learning process to replace the default set of zone policies or to update the current set of zone policies that may not be configured properly to recognize current normal traffic services and volume. When policy thresholds are set too high compared to the current normal traffic volume, the Detector module might not be able to detect traffic anomalies (attacks). When policy thresholds are set too low, the Detector module may mistake legitimate traffic for attack traffic.
The learning process consists of the following two phases:
• Policy Construction Phase—Creates the zone policies for the main services that the zone traffic uses. To create zone policies, the Detector module follows the rules established by the policy templates that each zone configuration contains.
• Threshold Tuning Phase—Tunes the thresholds of the zone policies to values that are appropriate for recognizing the normal traffic rates of the zone services.
For more information about the learning process, see Chapter 8, “Learning the Zone Traffic Characteristics.”
Understanding the Anomaly Detection ProcessThis section describes how the Detector module detects zone traffic anomalies and generates attack reports.
This section contains the following topics:
• Understanding Traffic Filters
• Understanding the Different Anomaly Detection Modes
• Understanding the Detect and Learn Function
• Understanding Attack Reports
1-4Cisco Traffic Anomaly Detector Module Configuration Guide
OL-11857-01
Chapter 1 Product OverviewUnderstanding the Anomaly Detection Process
Understanding Traffic FiltersThe Detector module uses three types of traffic filters to apply the required anomaly detection level to the zone traffic. You can configure these filters to customize the traffic flow and control the DDoS detection operation.
The Detector module uses the following types of traffic filters:
• Bypass filters—Prevent the Detector module from applying DDoS detection measures to specific traffic flows.
• Flex-Content filters—Count a specified traffic flow and filter according to fields in the IP and TCP headers and content bytes.
• Dynamic filters—Apply the analysis detection level to the traffic flow. When the Detector module detects an anomaly during the analysis process, the dynamic filters instruct the Detector module to either record the event in the syslog or activate a Guard to protect the zone.
The Detector module coordinates the actions of the zone policies that monitor the zone traffic for anomalies with the zone filters.
For more information about filters, see Chapter 6, “Configuring Zone Filters.”
Understanding the Different Anomaly Detection ModesYou can activate the Detector module anomaly detection operation in the following ways:
• Automatic detection mode—The Detector module automatically activates the dynamic filters that it creates.
• Interactive detect mode—The Detector module builds a queue of the dynamic filters that it creates and then groups the filters as recommended actions. You review the recommendations and decide whether to accept, ignore, or direct these recommendations to automatic activation. For more information about the interactive detect mode, see Chapter 10, “Using Interactive Detect Mode.”
Understanding the Detect and Learn FunctionYou can activate the threshold tuning phase of the learning process and activate zone anomaly detection simultaneously (the detect and learn function) to enable the Detector module to learn the new zone policy thresholds and at the same time monitor the traffic for anomalies using the current thresholds. When the Detector module detects an attack, it stops the learning process but continues to monitor the traffic for anomalies. This process prevents the Detector module from learning malicious traffic thresholds during an attack.
For more information about the detect and learn function, see the “Enabling the Detect and Learn Function” section on page 8-11.
Understanding Attack ReportsThe Detector module provides an attack report for every zone that provides zone status information and details of the attack, starting with the production of the first dynamic filter, and ending with anomaly detection termination.
For more information about the attack reports, see Chapter 11, “Using Attack Reports.”
1-5Cisco Traffic Anomaly Detector Module Configuration Guide
OL-11857-01
Chapter 1 Product OverviewUnderstanding the 1-Gbps and 2-Gbps Bandwidth Options
Understanding the 1-Gbps and 2-Gbps Bandwidth OptionsThe Detector module can operate at two different bandwidth performance levels: 1 Gigabit per second (Gbps) or 2 Gbps. The software image that you load on the Detector module determines the operating bandwidth by controlling the three physical interfaces between the module and the supervisor engine. The installed software image controls the interfaces as follows:
• 6.0 software image—Provides 1-Gbps throughput, allowing data traffic to move between the supervisor engine and the Detector module over a single interface port. A second interface port is used to transport out-of-band management traffic and activate associated Guard devices. The third interface port is not used.
• 6.0-XG software image—Provides 2-Gbps throughput, enabling two of the interface ports for transporting data traffic. The third interface is dedicated to transporting out-of-band management traffic and activating Guard devices. To use the XG software image, the Detector module requires a software license.
Note You can order the Detector module with either software image installed or you can upgrade a 6.0 software image (1-Gbps operation) to the 6.0-XG software image (2-Gbps operation). If you order a new Detector module with the 6.0-XG software image, Cisco installs the required license along with the software image. For information about upgrading to the 6.0-XG software image, see the “Upgrading the Bandwidth Performance from 1 Gbps to 2 Gbps” section on page 13-16).
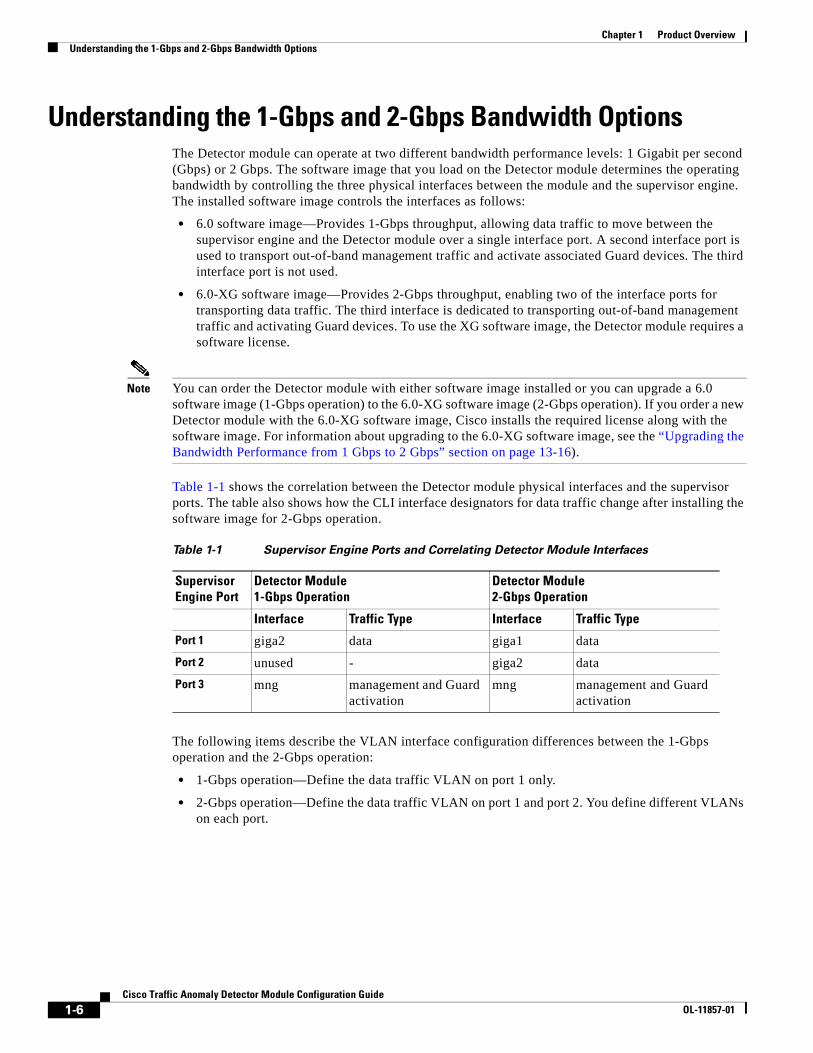
Table 1-1 shows the correlation between the Detector module physical interfaces and the supervisor ports. The table also shows how the CLI interface designators for data traffic change after installing the software image for 2-Gbps operation.
The following items describe the VLAN interface configuration differences between the 1-Gbps operation and the 2-Gbps operation:
• 1-Gbps operation—Define the data traffic VLAN on port 1 only.
• 2-Gbps operation—Define the data traffic VLAN on port 1 and port 2. You define different VLANs on each port.
Table 1-1 Supervisor Engine Ports and Correlating Detector Module Interfaces
Supervisor Engine Port
Detector Module 1-Gbps Operation
Detector Module 2-Gbps Operation
Interface Traffic Type Interface Traffic Type
Port 1 giga2 data giga1 data
Port 2 unused - giga2 data
Port 3 mng management and Guard activation
mng management and Guard activation
1-6Cisco Traffic Anomaly Detector Module Configuration Guide
OL-11857-01
Cisco TraOL-11857-01
C H A P T E R 2
Configuring the Detector Module on the Supervisor EngineThis chapter describes how to configure the Cisco Traffic Anomaly Detector Module (Detector module) on the supervisor engine of a Catalyst 6500 series switch or a Cisco 7600 series router. You must configure the Detector module on the supervisor engine before you can establish a session with the Detector module to configure it.
To configure the Detector module on the supervisor engine, you must have EXEC privileges and must be in configuration mode.
To save all configuration changes to the flash memory, use the write memory command in privileged EXEC mode.
Note Operational and configuration differences exist between a Detector module operating at 1 Gbps and a Detector module operating at 2 Gbps. This chapter discusses the differences between the 1-Gbps operation and the 2-Gbps operation. Unless stated, the information in this chapter applies to both modes of operation. For more information, see the “Understanding the 1-Gbps and 2-Gbps Bandwidth Options” section on page 1-6.
This chapter contains the following sections:
• Verifying the Detector Module Installation
• Setting Up Detector Module Management
• Configuring Traffic Sources for Capturing Traffic
• Accessing the Detector Module for the First Time
• Establishing a Session with the Detector Module after the Initial Session
• Rebooting the Detector Module
• Verifying the Detector Module Configuration
2-1ffic Anomaly Detector Module Configuration Guide
Chapter 2 Configuring the Detector Module on the Supervisor EngineVerifying the Detector Module Installation
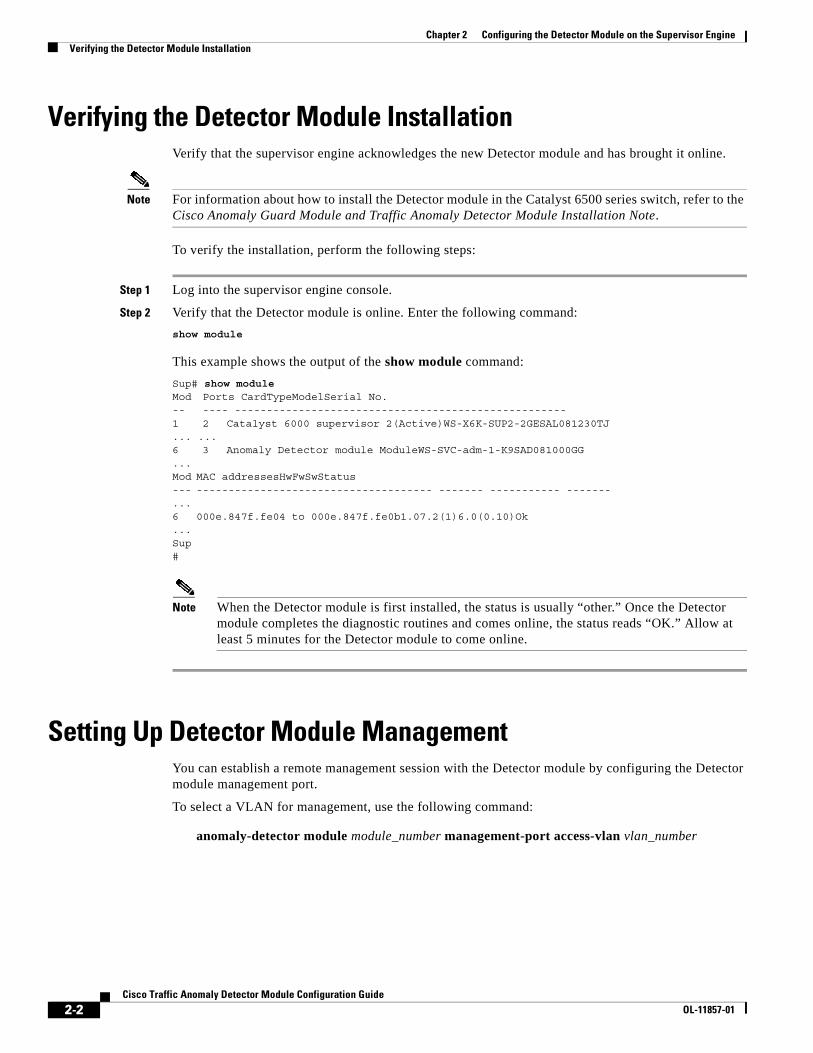
Verifying the Detector Module InstallationVerify that the supervisor engine acknowledges the new Detector module and has brought it online.
Note For information about how to install the Detector module in the Catalyst 6500 series switch, refer to the Cisco Anomaly Guard Module and Traffic Anomaly Detector Module Installation Note.
To verify the installation, perform the following steps:
Step 1 Log into the supervisor engine console.
Step 2 Verify that the Detector module is online. Enter the following command:
show module
This example shows the output of the show module command:
Sup# show module Mod Ports CardTypeModelSerial No.-- ---- ----------------------------------------------------1 2 Catalyst 6000 supervisor 2(Active)WS-X6K-SUP2-2GESAL081230TJ... ...6 3 Anomaly Detector module ModuleWS-SVC-adm-1-K9SAD081000GG...Mod MAC addressesHwFwSwStatus--- ------------------------------------- ------- ----------- -------...6 000e.847f.fe04 to 000e.847f.fe0b1.07.2(1)6.0(0.10)Ok...Sup#
Note When the Detector module is first installed, the status is usually “other.” Once the Detector module completes the diagnostic routines and comes online, the status reads “OK.” Allow at least 5 minutes for the Detector module to come online.
Setting Up Detector Module ManagementYou can establish a remote management session with the Detector module by configuring the Detector module management port.
To select a VLAN for management, use the following command:
anomaly-detector module module_number management-port access-vlan vlan_number
2-2Cisco Traffic Anomaly Detector Module Configuration Guide
OL-11857-01
Chapter 2 Configuring the Detector Module on the Supervisor EngineConfiguring Traffic Sources for Capturing Traffic
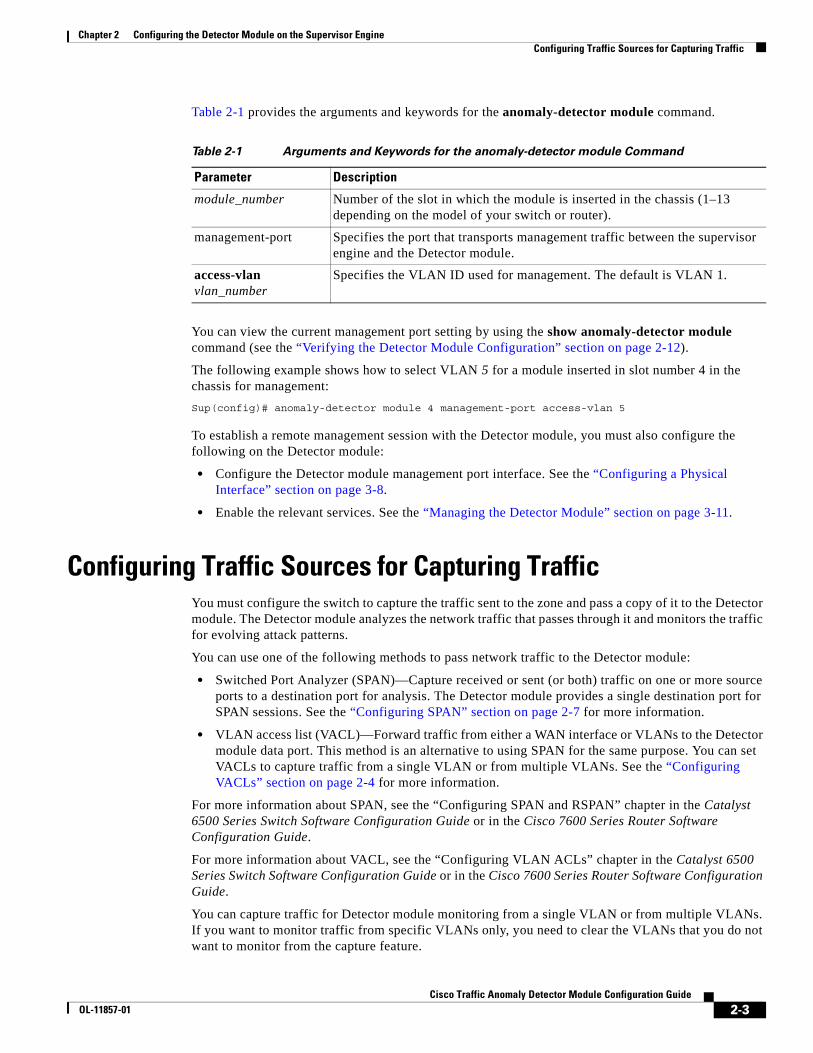
Table 2-1 provides the arguments and keywords for the anomaly-detector module command.
You can view the current management port setting by using the show anomaly-detector module command (see the “Verifying the Detector Module Configuration” section on page 2-12).
The following example shows how to select VLAN 5 for a module inserted in slot number 4 in the chassis for management:
Sup(config)# anomaly-detector module 4 management-port access-vlan 5
To establish a remote management session with the Detector module, you must also configure the following on the Detector module:
• Configure the Detector module management port interface. See the “Configuring a Physical Interface” section on page 3-8.
• Enable the relevant services. See the “Managing the Detector Module” section on page 3-11.
Configuring Traffic Sources for Capturing TrafficYou must configure the switch to capture the traffic sent to the zone and pass a copy of it to the Detector module. The Detector module analyzes the network traffic that passes through it and monitors the traffic for evolving attack patterns.
You can use one of the following methods to pass network traffic to the Detector module:
• Switched Port Analyzer (SPAN)—Capture received or sent (or both) traffic on one or more source ports to a destination port for analysis. The Detector module provides a single destination port for SPAN sessions. See the “Configuring SPAN” section on page 2-7 for more information.
• VLAN access list (VACL)—Forward traffic from either a WAN interface or VLANs to the Detector module data port. This method is an alternative to using SPAN for the same purpose. You can set VACLs to capture traffic from a single VLAN or from multiple VLANs. See the “Configuring VACLs” section on page 2-4 for more information.
For more information about SPAN, see the “Configuring SPAN and RSPAN” chapter in the Catalyst 6500 Series Switch Software Configuration Guide or in the Cisco 7600 Series Router Software Configuration Guide.
For more information about VACL, see the “Configuring VLAN ACLs” chapter in the Catalyst 6500 Series Switch Software Configuration Guide or in the Cisco 7600 Series Router Software Configuration Guide.
You can capture traffic for Detector module monitoring from a single VLAN or from multiple VLANs. If you want to monitor traffic from specific VLANs only, you need to clear the VLANs that you do not want to monitor from the capture feature.
Table 2-1 Arguments and Keywords for the anomaly-detector module Command
Parameter Description
module_number Number of the slot in which the module is inserted in the chassis (1–13 depending on the model of your switch or router).
management-port Specifies the port that transports management traffic between the supervisor engine and the Detector module.
access-vlan vlan_number
Specifies the VLAN ID used for management. The default is VLAN 1.
2-3Cisco Traffic Anomaly Detector Module Configuration Guide
OL-11857-01
Chapter 2 Configuring the Detector Module on the Supervisor EngineConfiguring Traffic Sources for Capturing Traffic
This section contains the following topics:
• Configuring VACLs
• Configuring SPAN
Configuring VACLsYou can set VACLs to capture traffic for the Detector module from a single VLAN or from multiple VLANs.
Note The procedure in this section provides the basic information for configuring a VACL to capture Detector module traffic on a VLAN. For more information, refer to the appropriate Catalyst 6500 series switch or Cisco 7600 series router configuration guide.
To configure VACLs to capture Detector module traffic on VLANs, perform the following steps:
Step 1 Define the access control list (ACL) and add access-control entries (ACEs) through the permit and/or deny statements by entering the following command:
ip access-list {standard | extended} acl-name
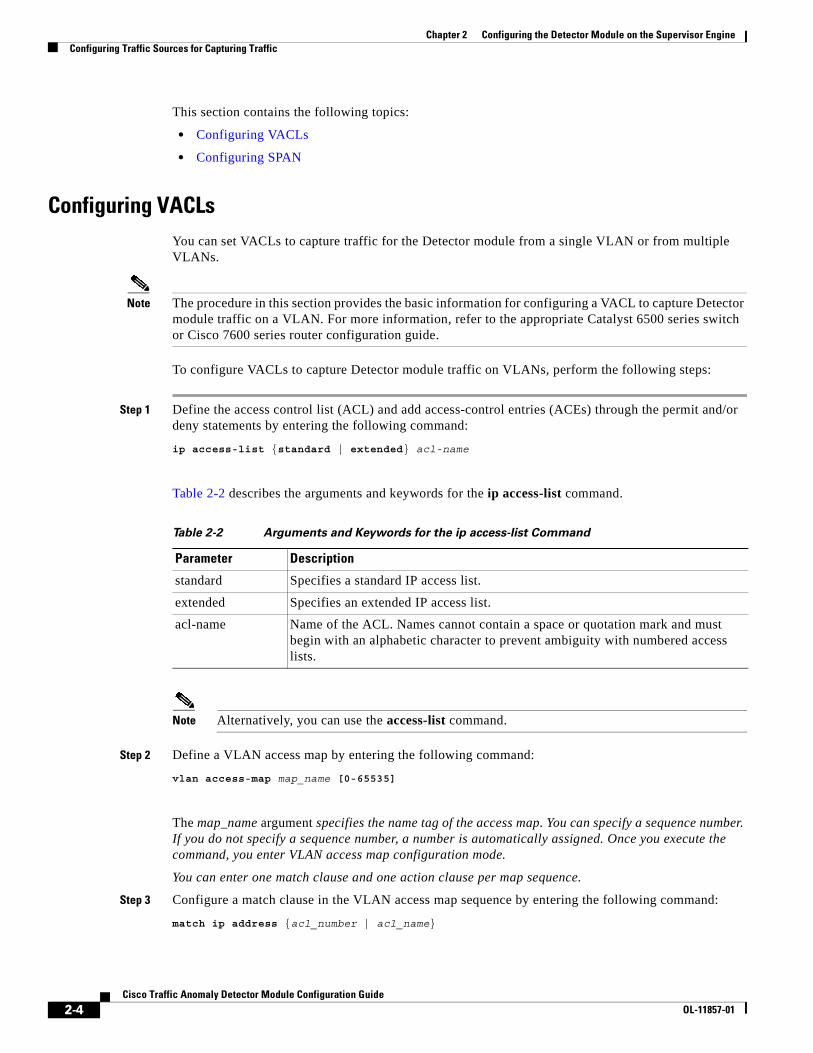
Table 2-2 describes the arguments and keywords for the ip access-list command.
Note Alternatively, you can use the access-list command.
Step 2 Define a VLAN access map by entering the following command:
vlan access-map map_name [0-65535]
The map_name argument specifies the name tag of the access map. You can specify a sequence number. If you do not specify a sequence number, a number is automatically assigned. Once you execute the command, you enter VLAN access map configuration mode.
You can enter one match clause and one action clause per map sequence.
Step 3 Configure a match clause in the VLAN access map sequence by entering the following command:
match ip address {acl_number | acl_name}
Table 2-2 Arguments and Keywords for the ip access-list Command
Parameter Description
standard Specifies a standard IP access list.
extended Specifies an extended IP access list.
acl-name Name of the ACL. Names cannot contain a space or quotation mark and must begin with an alphabetic character to prevent ambiguity with numbered access lists.
2-4Cisco Traffic Anomaly Detector Module Configuration Guide
OL-11857-01
Chapter 2 Configuring the Detector Module on the Supervisor EngineConfiguring Traffic Sources for Capturing Traffic
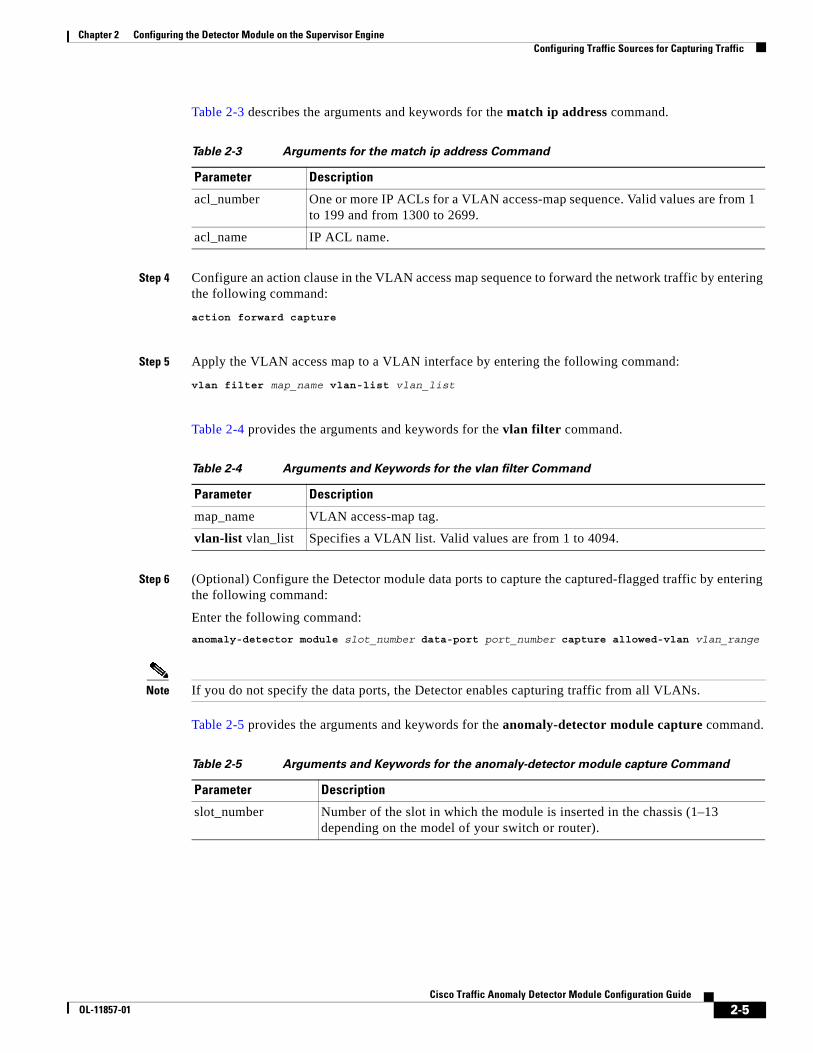
Table 2-3 describes the arguments and keywords for the match ip address command.
Step 4 Configure an action clause in the VLAN access map sequence to forward the network traffic by entering the following command:
action forward capture
Step 5 Apply the VLAN access map to a VLAN interface by entering the following command:
vlan filter map_name vlan-list vlan_list
Table 2-4 provides the arguments and keywords for the vlan filter command.
Step 6 (Optional) Configure the Detector module data ports to capture the captured-flagged traffic by entering the following command:
Enter the following command:
anomaly-detector module slot_number data-port port_number capture allowed-vlan vlan_range
Note If you do not specify the data ports, the Detector enables capturing traffic from all VLANs.
Table 2-5 provides the arguments and keywords for the anomaly-detector module capture command.
Table 2-3 Arguments for the match ip address Command
Parameter Description
acl_number One or more IP ACLs for a VLAN access-map sequence. Valid values are from 1 to 199 and from 1300 to 2699.
acl_name IP ACL name.
Table 2-4 Arguments and Keywords for the vlan filter Command
Parameter Description
map_name VLAN access-map tag.
vlan-list vlan_list Specifies a VLAN list. Valid values are from 1 to 4094.
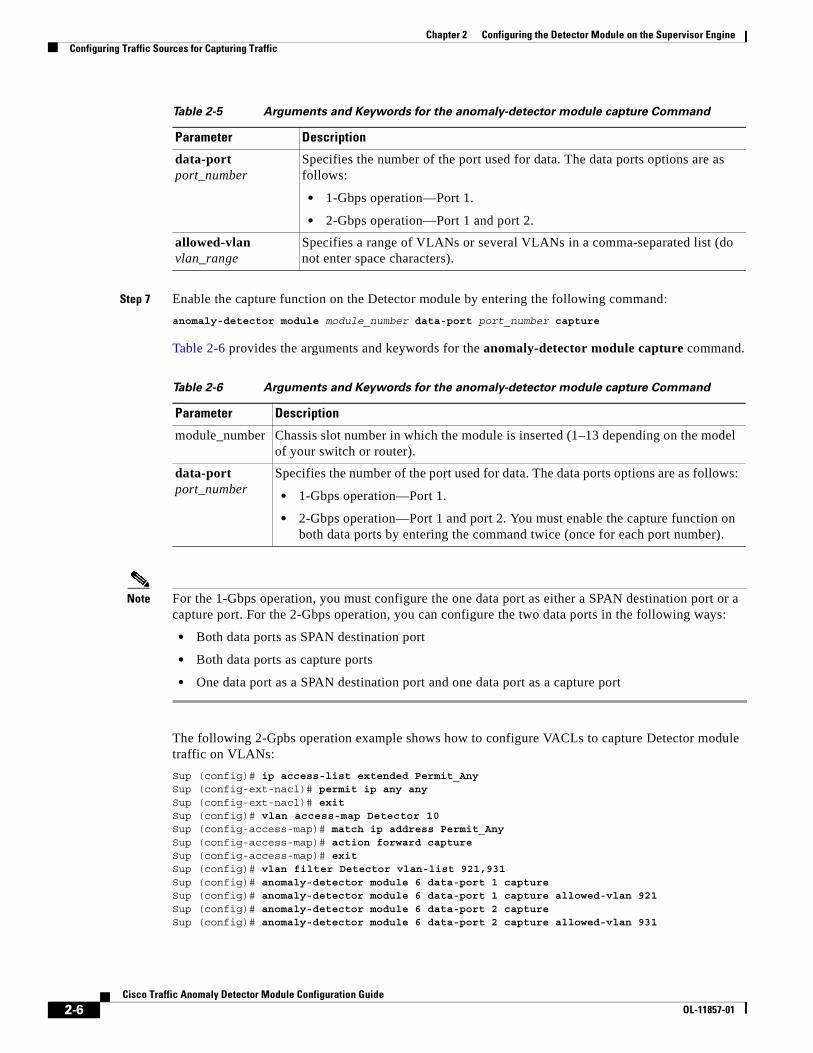
Table 2-5 Arguments and Keywords for the anomaly-detector module capture Command
Parameter Description
slot_number Number of the slot in which the module is inserted in the chassis (1–13 depending on the model of your switch or router).
2-5Cisco Traffic Anomaly Detector Module Configuration Guide
OL-11857-01
Chapter 2 Configuring the Detector Module on the Supervisor EngineConfiguring Traffic Sources for Capturing Traffic
Step 7 Enable the capture function on the Detector module by entering the following command:
anomaly-detector module module_number data-port port_number capture
Table 2-6 provides the arguments and keywords for the anomaly-detector module capture command.
Note For the 1-Gbps operation, you must configure the one data port as either a SPAN destination port or a capture port. For the 2-Gbps operation, you can configure the two data ports in the following ways:
• Both data ports as SPAN destination port
• Both data ports as capture ports
• One data port as a SPAN destination port and one data port as a capture port
The following 2-Gpbs operation example shows how to configure VACLs to capture Detector module traffic on VLANs:
Sup (config)# ip access-list extended Permit_AnySup (config-ext-nacl)# permit ip any anySup (config-ext-nacl)# exitSup (config)# vlan access-map Detector 10Sup (config-access-map)# match ip address Permit_AnySup (config-access-map)# action forward captureSup (config-access-map)# exitSup (config)# vlan filter Detector vlan-list 921,931Sup (config)# anomaly-detector module 6 data-port 1 captureSup (config)# anomaly-detector module 6 data-port 1 capture allowed-vlan 921Sup (config)# anomaly-detector module 6 data-port 2 captureSup (config)# anomaly-detector module 6 data-port 2 capture allowed-vlan 931
data-port port_number
Specifies the number of the port used for data. The data ports options are as follows:
• 1-Gbps operation—Port 1.
• 2-Gbps operation—Port 1 and port 2.
allowed-vlan vlan_range
Specifies a range of VLANs or several VLANs in a comma-separated list (do not enter space characters).
Table 2-5 Arguments and Keywords for the anomaly-detector module capture Command
Parameter Description
Table 2-6 Arguments and Keywords for the anomaly-detector module capture Command
Parameter Description
module_number Chassis slot number in which the module is inserted (1–13 depending on the model of your switch or router).
data-port port_number
Specifies the number of the port used for data. The data ports options are as follows:
• 1-Gbps operation—Port 1.
• 2-Gbps operation—Port 1 and port 2. You must enable the capture function on both data ports by entering the command twice (once for each port number).
2-6Cisco Traffic Anomaly Detector Module Configuration Guide
OL-11857-01
Chapter 2 Configuring the Detector Module on the Supervisor EngineConfiguring Traffic Sources for Capturing Traffic
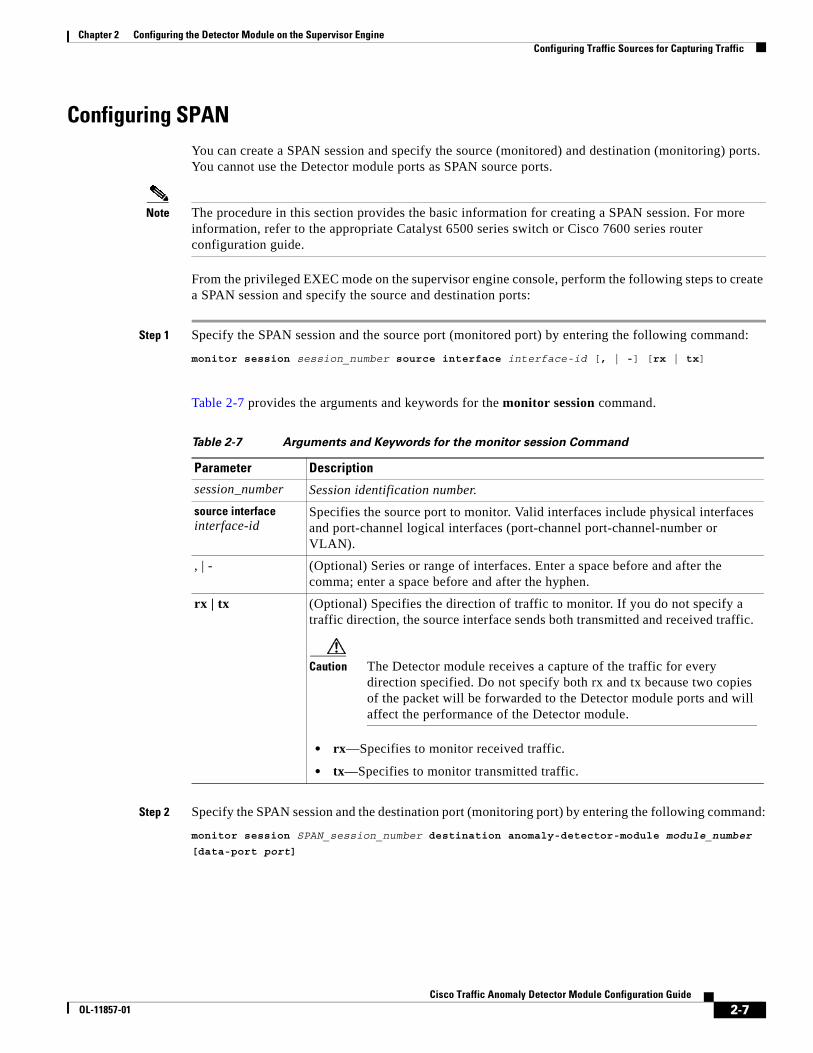
Configuring SPAN You can create a SPAN session and specify the source (monitored) and destination (monitoring) ports. You cannot use the Detector module ports as SPAN source ports.
Note The procedure in this section provides the basic information for creating a SPAN session. For more information, refer to the appropriate Catalyst 6500 series switch or Cisco 7600 series router configuration guide.
From the privileged EXEC mode on the supervisor engine console, perform the following steps to create a SPAN session and specify the source and destination ports:
Step 1 Specify the SPAN session and the source port (monitored port) by entering the following command:
monitor session session_number source interface interface-id [, | -] [rx | tx]
Table 2-7 provides the arguments and keywords for the monitor session command.
Step 2 Specify the SPAN session and the destination port (monitoring port) by entering the following command:
monitor session SPAN_session_number destination anomaly-detector-module module_number
[data-port port]
Table 2-7 Arguments and Keywords for the monitor session Command
Parameter Description
session_number Session identification number.
source interface interface-id
Specifies the source port to monitor. Valid interfaces include physical interfaces and port-channel logical interfaces (port-channel port-channel-number or VLAN).
, | - (Optional) Series or range of interfaces. Enter a space before and after the comma; enter a space before and after the hyphen.
rx | tx (Optional) Specifies the direction of traffic to monitor. If you do not specify a traffic direction, the source interface sends both transmitted and received traffic.
Caution The Detector module receives a capture of the traffic for every direction specified. Do not specify both rx and tx because two copies of the packet will be forwarded to the Detector module ports and will affect the performance of the Detector module.
• rx—Specifies to monitor received traffic.
• tx—Specifies to monitor transmitted traffic.
2-7Cisco Traffic Anomaly Detector Module Configuration Guide
OL-11857-01
Chapter 2 Configuring the Detector Module on the Supervisor EngineConfiguring Traffic Sources for Capturing Traffic
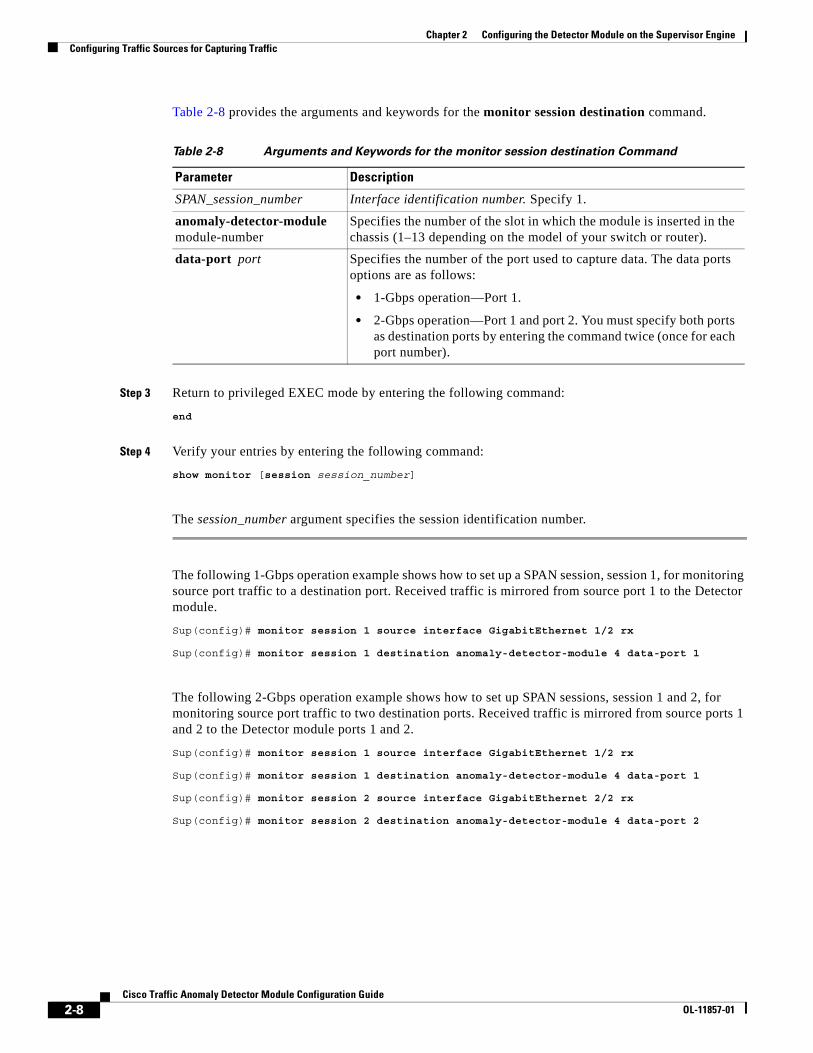
Table 2-8 provides the arguments and keywords for the monitor session destination command.
Step 3 Return to privileged EXEC mode by entering the following command:
end
Step 4 Verify your entries by entering the following command:
show monitor [session session_number]
The session_number argument specifies the session identification number.
The following 1-Gbps operation example shows how to set up a SPAN session, session 1, for monitoring source port traffic to a destination port. Received traffic is mirrored from source port 1 to the Detector module.
Sup(config)# monitor session 1 source interface GigabitEthernet 1/2 rx
Sup(config)# monitor session 1 destination anomaly-detector-module 4 data-port 1
The following 2-Gbps operation example shows how to set up SPAN sessions, session 1 and 2, for monitoring source port traffic to two destination ports. Received traffic is mirrored from source ports 1 and 2 to the Detector module ports 1 and 2.
Sup(config)# monitor session 1 source interface GigabitEthernet 1/2 rx
Sup(config)# monitor session 1 destination anomaly-detector-module 4 data-port 1
Sup(config)# monitor session 2 source interface GigabitEthernet 2/2 rx
Sup(config)# monitor session 2 destination anomaly-detector-module 4 data-port 2
Table 2-8 Arguments and Keywords for the monitor session destination Command
Parameter Description
SPAN_session_number Interface identification number. Specify 1.
anomaly-detector-module module-number
Specifies the number of the slot in which the module is inserted in the chassis (1–13 depending on the model of your switch or router).
data-port port Specifies the number of the port used to capture data. The data ports options are as follows:
• 1-Gbps operation—Port 1.
• 2-Gbps operation—Port 1 and port 2. You must specify both ports as destination ports by entering the command twice (once for each port number).
2-8Cisco Traffic Anomaly Detector Module Configuration Guide
OL-11857-01
Chapter 2 Configuring the Detector Module on the Supervisor EngineAccessing the Detector Module for the First Time
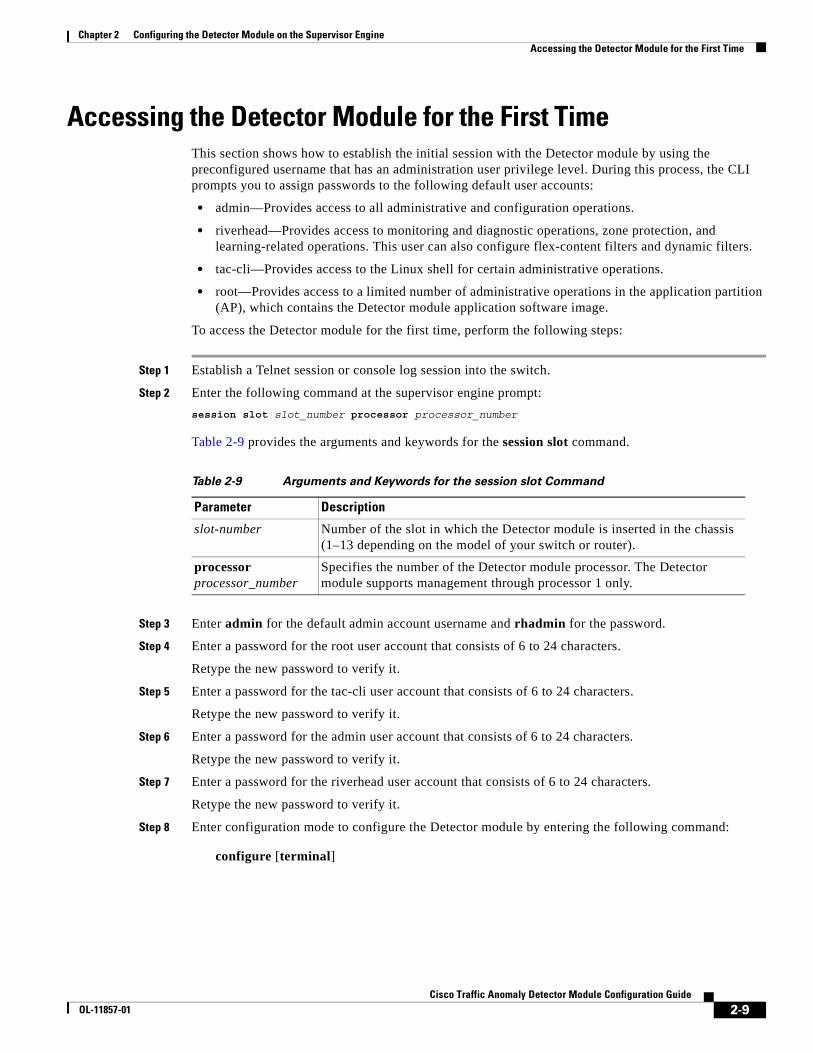
Accessing the Detector Module for the First TimeThis section shows how to establish the initial session with the Detector module by using the preconfigured username that has an administration user privilege level. During this process, the CLI prompts you to assign passwords to the following default user accounts:
• admin—Provides access to all administrative and configuration operations.
• riverhead—Provides access to monitoring and diagnostic operations, zone protection, and learning-related operations. This user can also configure flex-content filters and dynamic filters.
• tac-cli—Provides access to the Linux shell for certain administrative operations.
• root—Provides access to a limited number of administrative operations in the application partition (AP), which contains the Detector module application software image.
To access the Detector module for the first time, perform the following steps:
Step 1 Establish a Telnet session or console log session into the switch.
Step 2 Enter the following command at the supervisor engine prompt:
session slot slot_number processor processor_number
Table 2-9 provides the arguments and keywords for the session slot command.
Step 3 Enter admin for the default admin account username and rhadmin for the password.
Step 4 Enter a password for the root user account that consists of 6 to 24 characters.
Retype the new password to verify it.
Step 5 Enter a password for the tac-cli user account that consists of 6 to 24 characters.
Retype the new password to verify it.
Step 6 Enter a password for the admin user account that consists of 6 to 24 characters.
Retype the new password to verify it.
Step 7 Enter a password for the riverhead user account that consists of 6 to 24 characters.
Retype the new password to verify it.
Step 8 Enter configuration mode to configure the Detector module by entering the following command:
configure [terminal]
Table 2-9 Arguments and Keywords for the session slot Command
Parameter Description
slot-number Number of the slot in which the Detector module is inserted in the chassis (1–13 depending on the model of your switch or router).
processor processor_number
Specifies the number of the Detector module processor. The Detector module supports management through processor 1 only.
2-9Cisco Traffic Anomaly Detector Module Configuration Guide
OL-11857-01
Chapter 2 Configuring the Detector Module on the Supervisor EngineEstablishing a Session with the Detector Module after the Initial Session
The following example shows how to enter configuration mode:
user@DETECTOR# configure user@DETECTOR-conf#
Note You can change the passwords for the admin and riverhead user accounts at any time. See the “Changing Your Password” section on page 4-7 for more information.
To establish all future sessions with the Detector module, use the procedure in the “Establishing a Session with the Detector Module after the Initial Session” section.
Establishing a Session with the Detector Module after the Initial Session
This section shows how to session with the Detector module following the initial session in which you assigned passwords to the default user account usernames (see the “Accessing the Detector Module for the First Time” section).
To log in to the Detector module, perform the following steps:
Step 1 Establish a Telnet session or console log session into the switch.
Step 2 Enter the following command at the supervisor engine prompt:
session slot slot_number processor processor_number
See Table 2-9 for argument and keyword descriptions.
Step 3 Log in at the Detector module login prompt using a configured user account:
login: user
Step 4 Enter the password.
After a successful login, the command-line prompt is represented as user@DETECTOR#. You can change the prompt by entering the hostname command.
Rebooting the Detector ModuleCisco IOS software provides the following commands to control the Detector module: boot, shutdown, power enable and reset:
Caution If you enter the reload command at the supervisor engine prompt, the reload occurs for the entire chassis and includes all the modules in the chassis. See the “Reloading the Detector Module” section on page 13-8 for information about how to reload the Detector module.
2-10Cisco Traffic Anomaly Detector Module Configuration Guide
OL-11857-01
Chapter 2 Configuring the Detector Module on the Supervisor EngineRebooting the Detector Module
• shutdown—Brings the operating system down gracefully, ensuring that no data is lost. To prevent corruption of the Detector module, it is critical that you shut down the Detector module properly. Enter the following command at the supervisor engine prompt:
hw-module module slot_number shutdown
The slot_number argument specifies the number of the slot in which the module is inserted in the chassis.
You must then enter the hw-module module module_number reset command to restart the Detector module.
The following example shows how to shut down the Detector module:
Sup# hw-module module 8 shutdown
Note The Detector module reboots if you reboot the switch.
• reset—Resets the module. Use this command to recover from a shutdown or to switch between the followingDetector module operating images:
– Application Partition (AP)—Detector module application software image (see “Upgrading the Detector Module Software” section on page 13-8).
– Maintenance Partition (MP)—Software image required for base module initialization and daughter card control functions (see “Upgrading the Detector Module Software” section on page 13-8).
The hw-module reset command resets the module by turning the power off and then on. The reset process requires several minutes. Enter the following command at the supervisor engine prompt:
hw-module module slot_number reset [string]
The slot_number argument specifies the number of the slot in which the module is inserted in the chassis. The string argument is an optional string for the PC boot sequence. Enter cf:1 to reset to the MP and cf:4 to reset to the AP. See the “Upgrading the Detector Module Software” section on page 13-8 for more information.
The following example shows how to reset the Detector module:
Sup# hw-module module 8 reset
• no power enable—Shuts down the module so that it can be safely removed from the chassis. Enter the following command at the supervisor engine prompt:
no power enable module slot_number
The slot_number argument specifies the number of the slot in which the module is inserted in the chassis.
To switch the module on again, use the following command:
power enable module slot_number
The following example shows how to shut down the Detector module:
Sup (config)# no power enable module 8
• boot—Forces the Detector module to boot to the MP at the next power on. Enter the following command at the supervisor engine prompt:
boot device module slot_number cf:1
2-11Cisco Traffic Anomaly Detector Module Configuration Guide
OL-11857-01
Chapter 2 Configuring the Detector Module on the Supervisor EngineVerifying the Detector Module Configuration
The slot_number argument specifies the number of the slot in which the module is inserted in the chassis.
To enable the Detector module to boot to the default partition, which is the AP, at the next boot cycle, use the following command at the supervisor engine prompt:
no boot device module slot_number cf:1
The following example shows how to configure the Detector module to boot to the AP at the next boot cycle:
Sup# no boot device module 8 cf:1
Caution The zone learning phases are restarted after reboot. See the “Rebooting the Detector Module and Inactivating Zones” section on page 13-8 for more information about the default behavior of the zones after reboot.
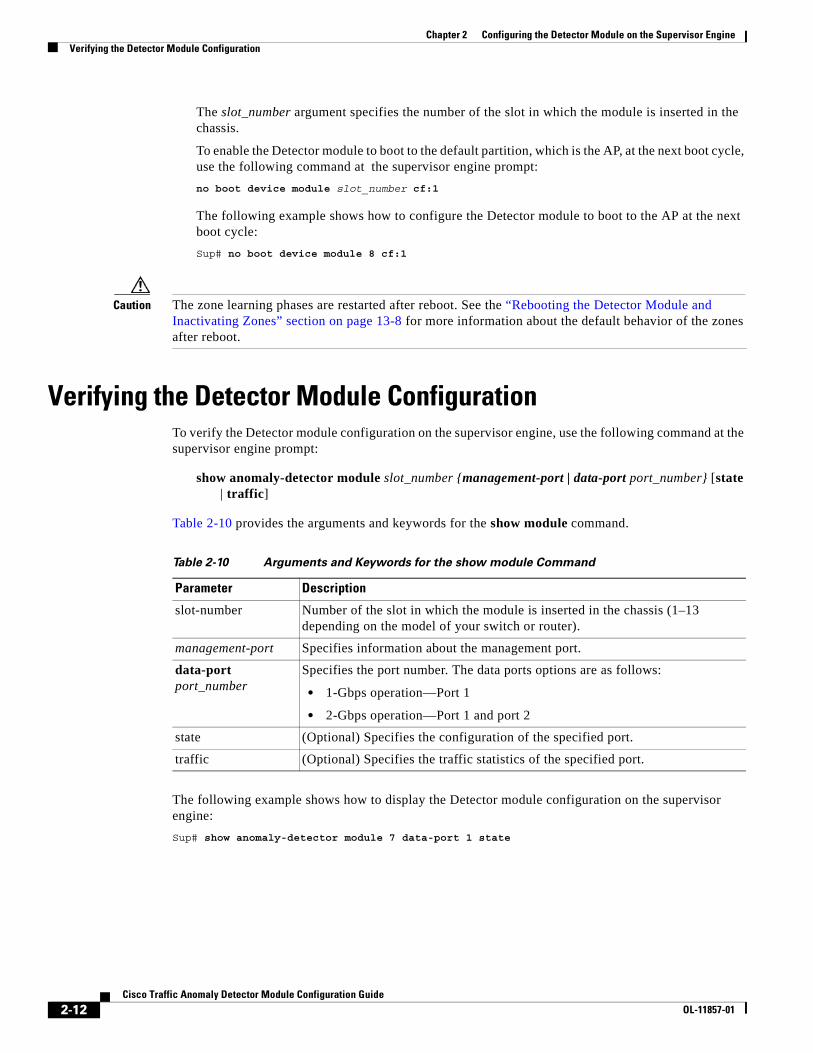
Verifying the Detector Module ConfigurationTo verify the Detector module configuration on the supervisor engine, use the following command at the supervisor engine prompt:
show anomaly-detector module slot_number {management-port | data-port port_number} [state | traffic]
Table 2-10 provides the arguments and keywords for the show module command.
The following example shows how to display the Detector module configuration on the supervisor engine:
Sup# show anomaly-detector module 7 data-port 1 state
Table 2-10 Arguments and Keywords for the show module Command
Parameter Description
slot-number Number of the slot in which the module is inserted in the chassis (1–13 depending on the model of your switch or router).
management-port Specifies information about the management port.
data-port port_number
Specifies the port number. The data ports options are as follows:
• 1-Gbps operation—Port 1
• 2-Gbps operation—Port 1 and port 2
state (Optional) Specifies the configuration of the specified port.
traffic (Optional) Specifies the traffic statistics of the specified port.
2-12Cisco Traffic Anomaly Detector Module Configuration Guide
OL-11857-01
Cisco TraOL-11857-01
C H A P T E R 3
Initializing the Detector ModuleThis chapter describes the basic tasks required to initialize the Cisco Traffic Anomaly Detector (Detector module) in a network and how to manage it.
This chapter refers to the Cisco Guard (Guard), the companion product of the Detector module. The Guard is a Distributed Denial of Service (DDoS) attack detection and mitigation device that cleans the zone traffic as the traffic flows through it, dropping the attack traffic and injecting the legitimate traffic back into the network. When the Detector module determines that the zone is under attack, it can activate the Guard attack mitigation services. The Detector module can also synchronize zone configurations with the Guard. For more information about the Guard, see the Cisco Anomaly Guard Module Configuration Guide or the Cisco Guard Configuration Guide.
Note Operational and configuration differences exist between a Detector module operating at 1 Gbps and a Detector module operating at 2 Gbps. This chapter discusses the differences between the 1-Gbps operation and the 2-Gbps operation. Unless stated, the information in this chapter applies to both modes of operation. For more information, see the “Understanding the 1-Gbps and 2-Gbps Bandwidth Options” section on page 1-6.
This chapter contains the following sections:
• Using the Command-Line Interface
• Configuring the Detector Module Interfaces
• Configuring the Default Gateway
• Adding a Static Route to the Routing Table
• Managing the Detector Module
Using the Command-Line InterfaceYou can control the Detector module functions by using the command-line interface (CLI). The Detector module user interface is divided into many different command modes and the access to the CLI is mapped according to user privilege levels. The commands that are available to you depend on which mode you are currently in.
This section contains the following topics:
• Understanding User Privilege Levels
• Understanding Command Modes
3-1ffic Anomaly Detector Module Configuration Guide
Chapter 3 Initializing the Detector ModuleUsing the Command-Line Interface
• Entering CLI Commands
• Tips for Using the CLI
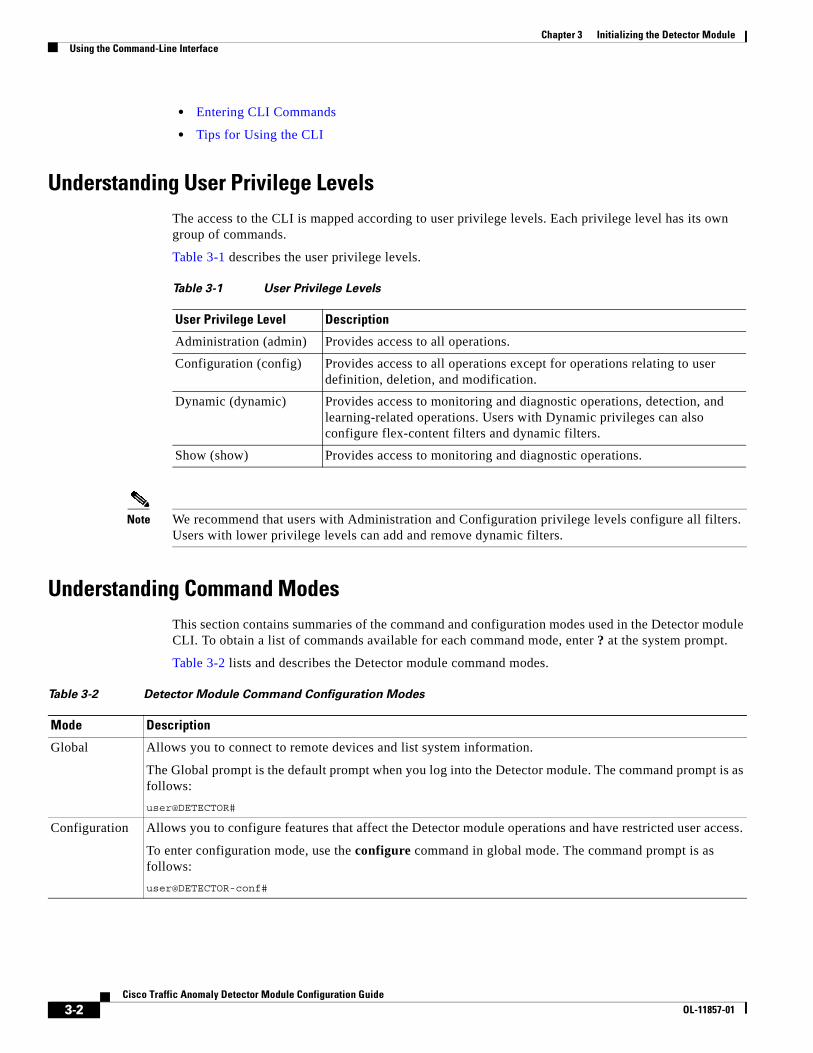
Understanding User Privilege LevelsThe access to the CLI is mapped according to user privilege levels. Each privilege level has its own group of commands.
Table 3-1 describes the user privilege levels.
Note We recommend that users with Administration and Configuration privilege levels configure all filters. Users with lower privilege levels can add and remove dynamic filters.
Understanding Command ModesThis section contains summaries of the command and configuration modes used in the Detector module CLI. To obtain a list of commands available for each command mode, enter ? at the system prompt.
Table 3-2 lists and describes the Detector module command modes.
Table 3-1 User Privilege Levels
User Privilege Level Description
Administration (admin) Provides access to all operations.
Configuration (config) Provides access to all operations except for operations relating to user definition, deletion, and modification.
Dynamic (dynamic) Provides access to monitoring and diagnostic operations, detection, and learning-related operations. Users with Dynamic privileges can also configure flex-content filters and dynamic filters.
Show (show) Provides access to monitoring and diagnostic operations.
Table 3-2 Detector Module Command Configuration Modes
Mode Description
Global Allows you to connect to remote devices and list system information.
The Global prompt is the default prompt when you log into the Detector module. The command prompt is as follows:
user@DETECTOR#
Configuration Allows you to configure features that affect the Detector module operations and have restricted user access.
To enter configuration mode, use the configure command in global mode. The command prompt is as follows:
user@DETECTOR-conf#
3-2Cisco Traffic Anomaly Detector Module Configuration Guide
OL-11857-01
Chapter 3 Initializing the Detector ModuleUsing the Command-Line Interface
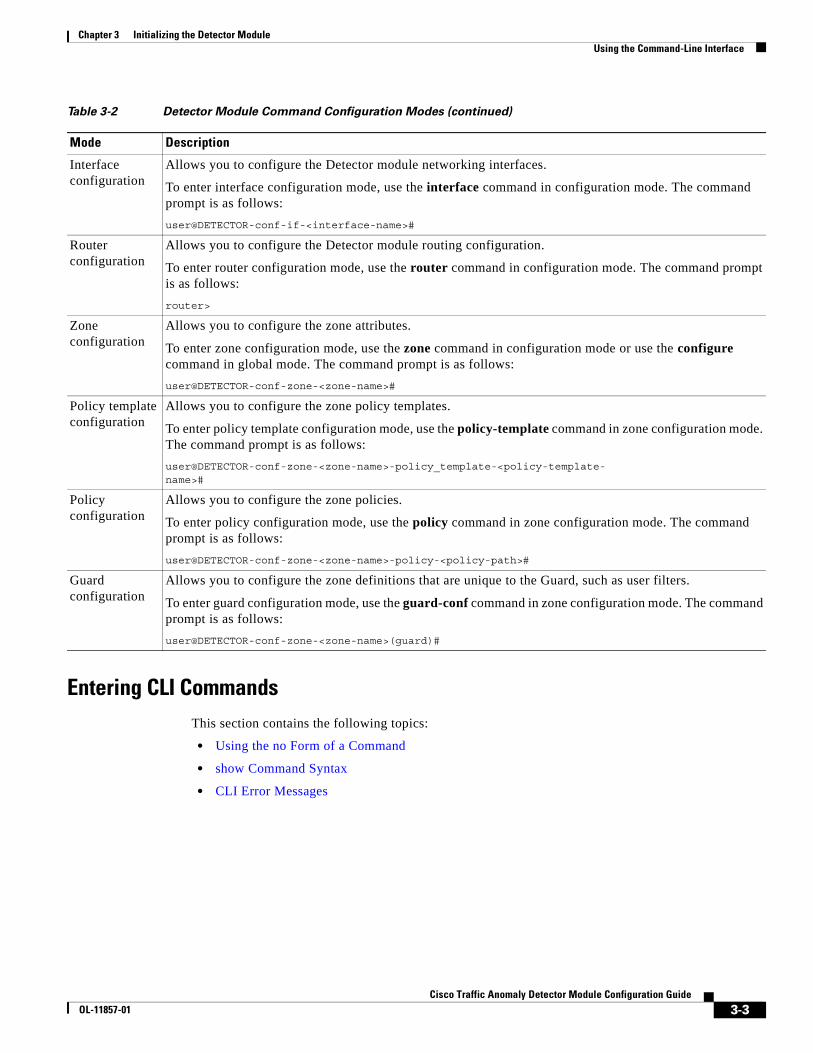
Entering CLI CommandsThis section contains the following topics:
• Using the no Form of a Command
• show Command Syntax
• CLI Error Messages
Interface configuration
Allows you to configure the Detector module networking interfaces.
To enter interface configuration mode, use the interface command in configuration mode. The command prompt is as follows:
user@DETECTOR-conf-if-<interface-name>#
Router configuration
Allows you to configure the Detector module routing configuration.
To enter router configuration mode, use the router command in configuration mode. The command prompt is as follows:
router>
Zone configuration
Allows you to configure the zone attributes.
To enter zone configuration mode, use the zone command in configuration mode or use the configure command in global mode. The command prompt is as follows:
user@DETECTOR-conf-zone-<zone-name>#
Policy template configuration
Allows you to configure the zone policy templates.
To enter policy template configuration mode, use the policy-template command in zone configuration mode. The command prompt is as follows:
user@DETECTOR-conf-zone-<zone-name>-policy_template-<policy-template- name>#
Policy configuration
Allows you to configure the zone policies.
To enter policy configuration mode, use the policy command in zone configuration mode. The command prompt is as follows:
user@DETECTOR-conf-zone-<zone-name>-policy-<policy-path>#
Guard configuration
Allows you to configure the zone definitions that are unique to the Guard, such as user filters.
To enter guard configuration mode, use the guard-conf command in zone configuration mode. The command prompt is as follows:
user@DETECTOR-conf-zone-<zone-name>(guard)#
Table 3-2 Detector Module Command Configuration Modes (continued)
Mode Description
3-3Cisco Traffic Anomaly Detector Module Configuration Guide
OL-11857-01
Chapter 3 Initializing the Detector ModuleUsing the Command-Line Interface
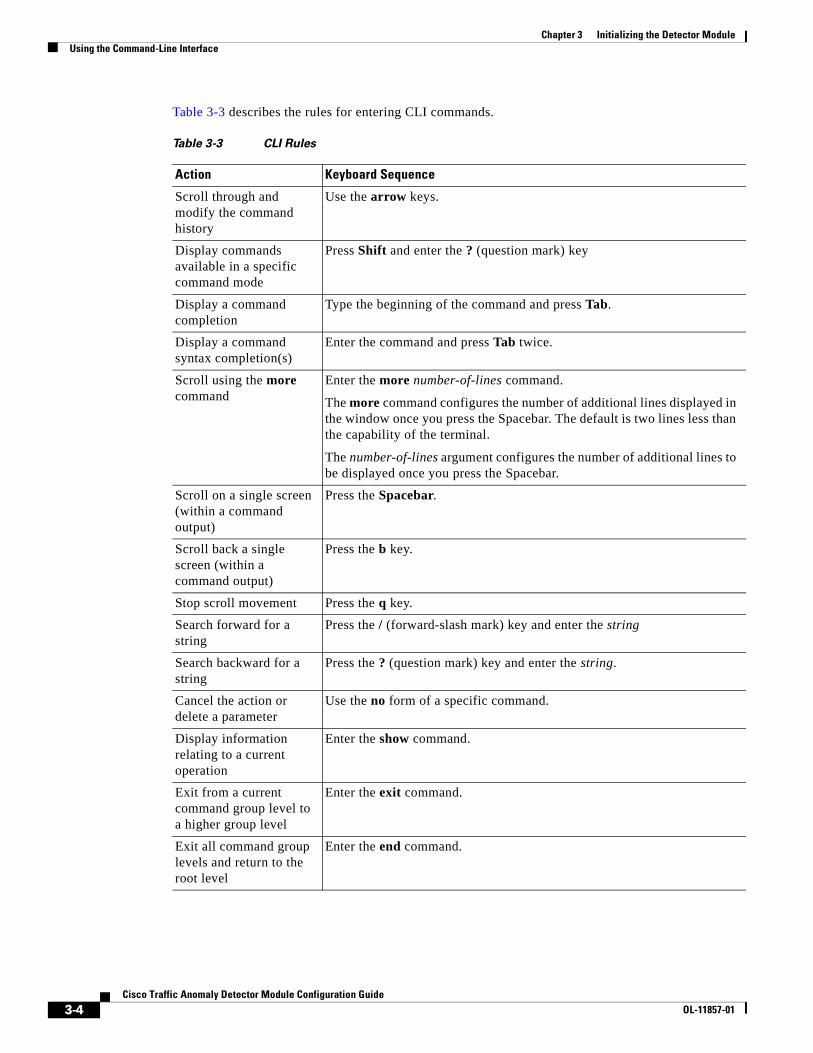
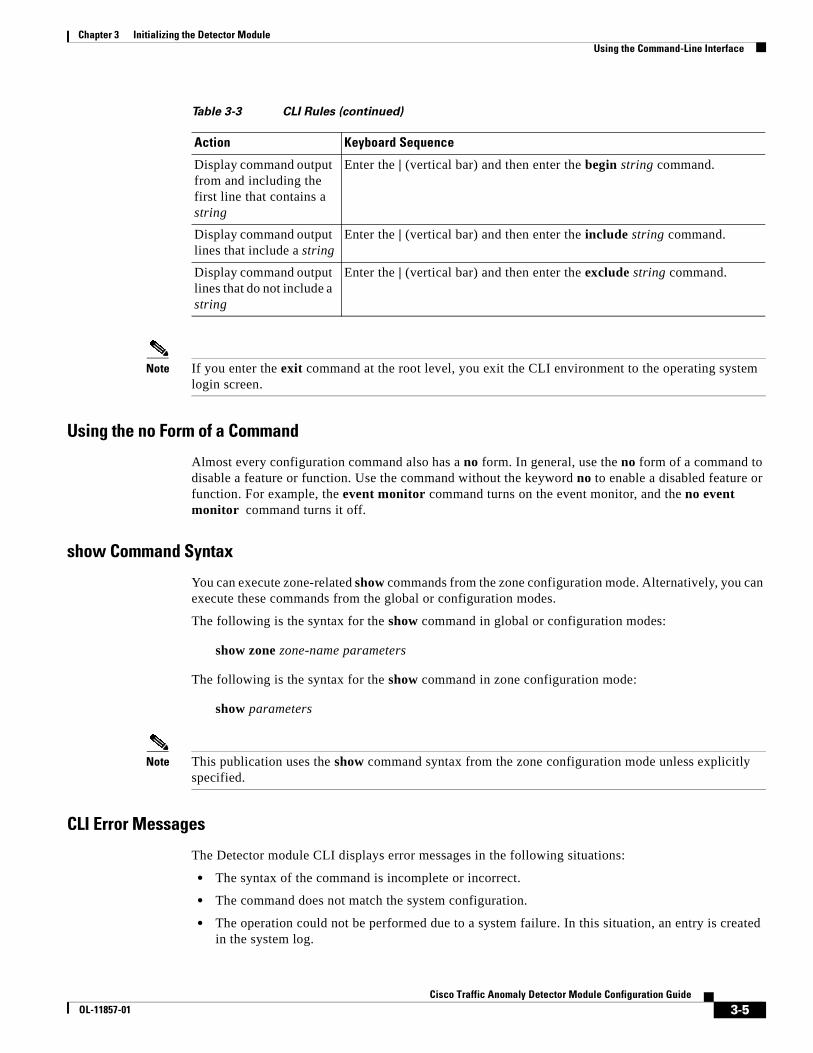
Table 3-3 describes the rules for entering CLI commands.
Table 3-3 CLI Rules
Action Keyboard Sequence
Scroll through and modify the command history
Use the arrow keys.
Display commands available in a specific command mode
Press Shift and enter the ? (question mark) key
Display a command completion
Type the beginning of the command and press Tab.
Display a command syntax completion(s)
Enter the command and press Tab twice.
Scroll using the more command
Enter the more number-of-lines command.
The more command configures the number of additional lines displayed in the window once you press the Spacebar. The default is two lines less than the capability of the terminal.
The number-of-lines argument configures the number of additional lines to be displayed once you press the Spacebar.
Scroll on a single screen (within a command output)
Press the Spacebar.
Scroll back a single screen (within a command output)
Press the b key.
Stop scroll movement Press the q key.
Search forward for a string
Press the / (forward-slash mark) key and enter the string
Search backward for a string
Press the ? (question mark) key and enter the string.
Cancel the action or delete a parameter
Use the no form of a specific command.
Display information relating to a current operation
Enter the show command.
Exit from a current command group level to a higher group level
Enter the exit command.
Exit all command group levels and return to the root level
Enter the end command.
3-4Cisco Traffic Anomaly Detector Module Configuration Guide
OL-11857-01
Chapter 3 Initializing the Detector ModuleUsing the Command-Line Interface
Note If you enter the exit command at the root level, you exit the CLI environment to the operating system login screen.
Using the no Form of a Command
Almost every configuration command also has a no form. In general, use the no form of a command to disable a feature or function. Use the command without the keyword no to enable a disabled feature or function. For example, the event monitor command turns on the event monitor, and the no event monitor command turns it off.
show Command Syntax
You can execute zone-related show commands from the zone configuration mode. Alternatively, you can execute these commands from the global or configuration modes.
The following is the syntax for the show command in global or configuration modes:
show zone zone-name parameters
The following is the syntax for the show command in zone configuration mode:
show parameters
Note This publication uses the show command syntax from the zone configuration mode unless explicitly specified.
CLI Error Messages
The Detector module CLI displays error messages in the following situations:
• The syntax of the command is incomplete or incorrect.
• The command does not match the system configuration.
• The operation could not be performed due to a system failure. In this situation, an entry is created in the system log.
Display command output from and including the first line that contains a string
Enter the | (vertical bar) and then enter the begin string command.
Display command output lines that include a string
Enter the | (vertical bar) and then enter the include string command.
Display command output lines that do not include a string
Enter the | (vertical bar) and then enter the exclude string command.
Table 3-3 CLI Rules (continued)
Action Keyboard Sequence
3-5Cisco Traffic Anomaly Detector Module Configuration Guide
OL-11857-01
Chapter 3 Initializing the Detector ModuleUsing the Command-Line Interface
Tips for Using the CLIThis section provides tips for using the CLI and includes the following topics:
• Using Help
• Using Tab Completion
• Understanding Conventions of Operation Direction
• Abbreviating a Command
• Using Wildcard Characters
Using Help
The CLI provides context-sensitive help at every mode of the command hierarchy. The help information tells you which commands are available at the current command mode and provides a brief description of each command.
To get help, type ?.
To display help for a command, type ? after the command.
To display all commands available in a mode along with a short description, enter ? at the command prompt.
The help displays commands available in the current mode only.
Using Tab Completion
You can use tab completion to reduce the number of characters that you need to type for a command. Type the first few characters of a command and press Tab to complete the command.
After entering a command that has a value with multiple options, press Tab twice to display a list of possible input parameters, including system-defined parameters and user-defined parameters. For example, if you press Tab twice after entering the policy-template command in zone configuration mode, the list of policy template names is displayed. If you press Tab twice after entering the zone command in configuration mode, zones that are already defined are displayed.
If multiple commands match for a Tab completion action, nothing is displayed; the system repeats the current line that you entered.
The tab completion feature displays only commands available for the current mode.
You can disable tab completion for zone names in all commands in global and configuration modes such as the zone command and the show zone commands by using the aaa authorization commands zone-completion tacacs+ command. See the “Disabling Tab Completion of Zone Names” section on page 4-12 for more information.
Understanding Conventions of Operation Direction
The order of keywords in the command syntax define the direction of the operation. When you enter the keyword before you enter the command, the Detector module copies the data from the Detector module to the server. When you enter the command before you enter the keyword, the Detector module copies the data from the server to the Detector module. For example, the copy log ftp command copies the log file from the Detector module to the FTP server. The copy ftp new-version command copies the new software version file from the FTP server to the Detector module.
3-6Cisco Traffic Anomaly Detector Module Configuration Guide
OL-11857-01
Chapter 3 Initializing the Detector ModuleConfiguring the Detector Module Interfaces
Abbreviating a Command
You can abbreviate commands and keywords to the number of characters that allow a unique abbreviation.
For example, you can abbreviate the show command to sh.
Using Wildcard Characters
You can use an asterisk (*) as a wildcard.
For example, if you enter the permit wbm * command, you allow all remote manager IP addresses to access the Detector module using the Web-Based Manager (WBM).
If you enter the learning policy-construction scan* command, the policy construction phase is activated for all the zones that are configured on the Detector module with names that begin with scan (such as scannet, scanserver, and so on).
If you enter the no zone * command, all zones are removed.
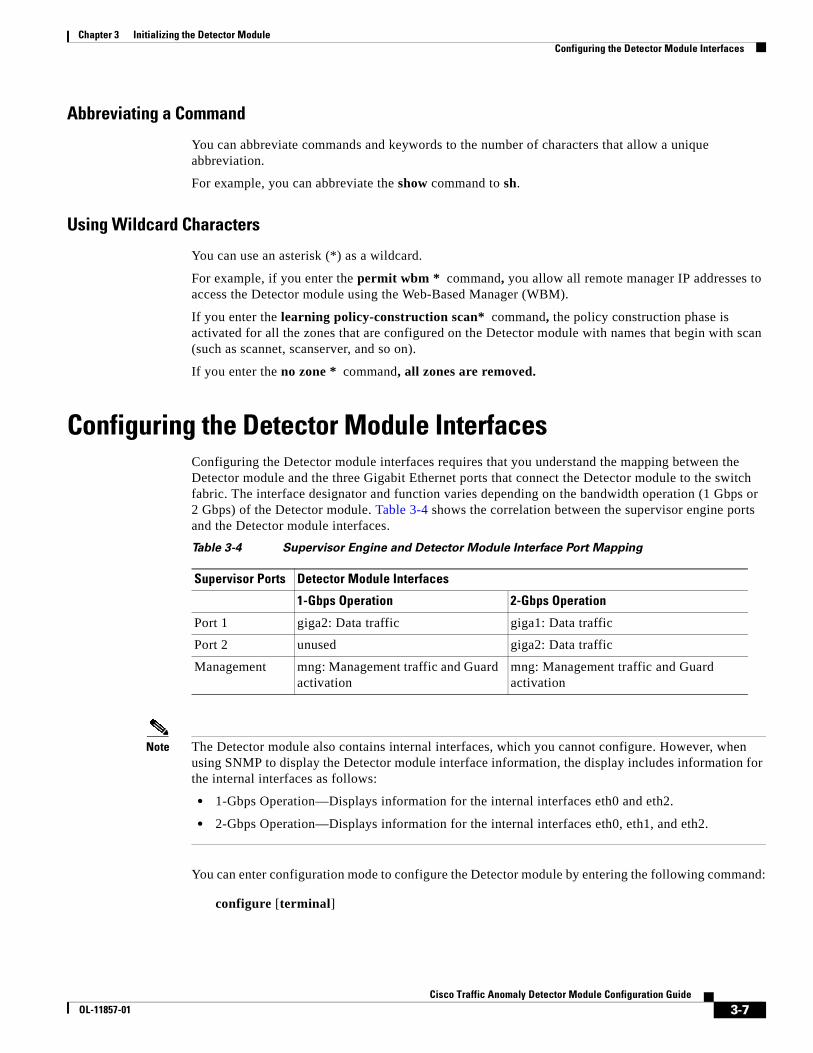
Configuring the Detector Module InterfacesConfiguring the Detector module interfaces requires that you understand the mapping between the Detector module and the three Gigabit Ethernet ports that connect the Detector module to the switch fabric. The interface designator and function varies depending on the bandwidth operation (1 Gbps or 2 Gbps) of the Detector module. Table 3-4 shows the correlation between the supervisor engine ports and the Detector module interfaces.
Note The Detector module also contains internal interfaces, which you cannot configure. However, when using SNMP to display the Detector module interface information, the display includes information for the internal interfaces as follows:
• 1-Gbps Operation—Displays information for the internal interfaces eth0 and eth2.
• 2-Gbps Operation—Displays information for the internal interfaces eth0, eth1, and eth2.
You can enter configuration mode to configure the Detector module by entering the following command:
configure [terminal]
Table 3-4 Supervisor Engine and Detector Module Interface Port Mapping
Supervisor Ports Detector Module Interfaces
1-Gbps Operation 2-Gbps Operation
Port 1 giga2: Data traffic giga1: Data traffic
Port 2 unused giga2: Data traffic
Management mng: Management traffic and Guard activation
mng: Management traffic and Guard activation
3-7Cisco Traffic Anomaly Detector Module Configuration Guide
OL-11857-01
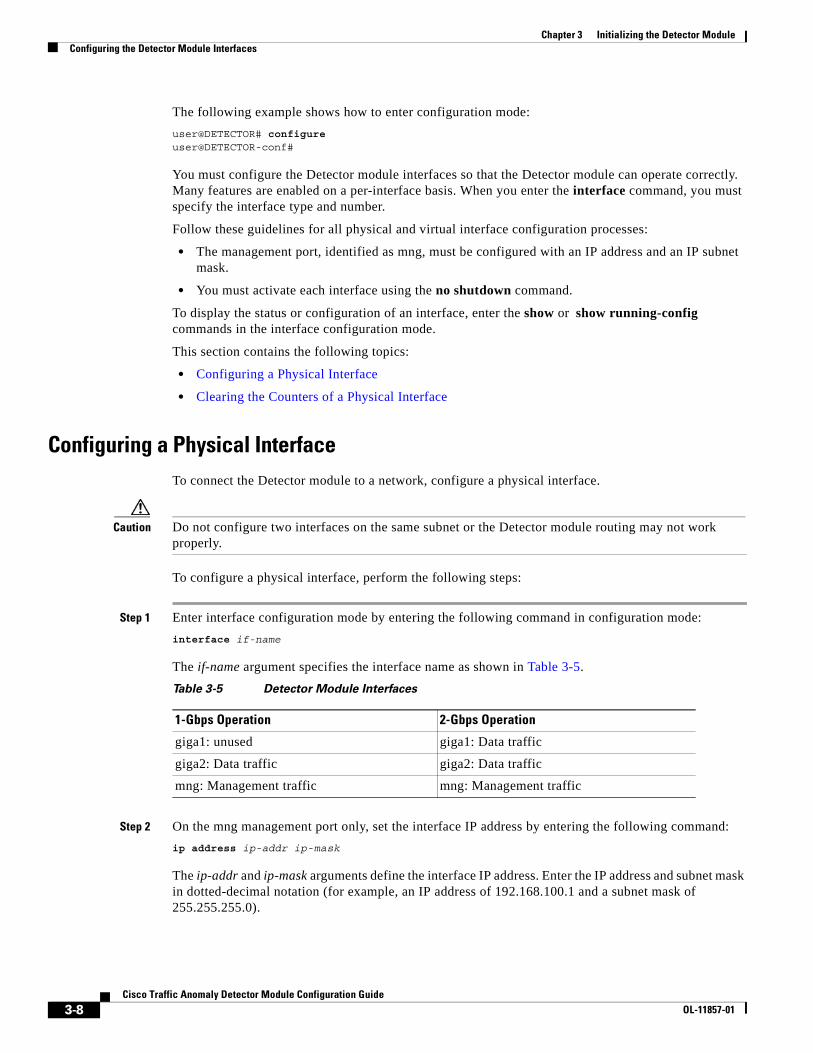
Chapter 3 Initializing the Detector ModuleConfiguring the Detector Module Interfaces
The following example shows how to enter configuration mode:
user@DETECTOR# configure user@DETECTOR-conf#
You must configure the Detector module interfaces so that the Detector module can operate correctly. Many features are enabled on a per-interface basis. When you enter the interface command, you must specify the interface type and number.
Follow these guidelines for all physical and virtual interface configuration processes:
• The management port, identified as mng, must be configured with an IP address and an IP subnet mask.
• You must activate each interface using the no shutdown command.
To display the status or configuration of an interface, enter the show or show running-config commands in the interface configuration mode.
This section contains the following topics:
• Configuring a Physical Interface
• Clearing the Counters of a Physical Interface
Configuring a Physical InterfaceTo connect the Detector module to a network, configure a physical interface.
Caution Do not configure two interfaces on the same subnet or the Detector module routing may not work properly.
To configure a physical interface, perform the following steps:
Step 1 Enter interface configuration mode by entering the following command in configuration mode:
interface if-name
The if-name argument specifies the interface name as shown in Table 3-5.
Step 2 On the mng management port only, set the interface IP address by entering the following command:
ip address ip-addr ip-mask
The ip-addr and ip-mask arguments define the interface IP address. Enter the IP address and subnet mask in dotted-decimal notation (for example, an IP address of 192.168.100.1 and a subnet mask of 255.255.255.0).
Table 3-5 Detector Module Interfaces
1-Gbps Operation 2-Gbps Operation
giga1: unused giga1: Data traffic
giga2: Data traffic giga2: Data traffic
mng: Management traffic mng: Management traffic
3-8Cisco Traffic Anomaly Detector Module Configuration Guide
OL-11857-01
Chapter 3 Initializing the Detector ModuleConfiguring the Detector Module Interfaces
Step 3 (Optional) Define the interface maximum transmission unit (MTU) by entering the following command:
mtu integer
The integer argument is an integer as follows:
• 1-Gbps Operation:
– Data port (giga2)—MTU range is between 576 and 1800 bytes.
– Management port (mng)—MTU range is between 1200 and 8162 bytes.
• 2-Gbps Operation:
– Data ports (giga1, giga2)—MTU range is between 576 and 1800 bytes.
– Management port (mng)—MTU range is between 1200 and 1800 bytes.
Step 4 The default MTU value for all interfaces is 1500 bytes. Activate the interface by entering the following command:
no shutdown
Step 5 Repeat Steps 1–4 to configure each of the remaining physical interfaces.
After activating or deactivating a data port interface, you must reload the Detector module for the configuration change to take effect.
The following example shows how to configure and activate the management interface (mng):
user@DETECTOR-conf# interface mnguser@DETECTOR-conf-if-mng# ip address 10.10.10.23 255.255.255.252user@DETECTOR-conf-if-mng2# no shutdown
The following 1-Gbps operation example shows how to activate interface giga2:
user@DETECTOR-conf# interface giga2user@DETECTOR-conf-if-giga2# no shutdown
The following 2-Gbps operation example shows how to activate interfaces giga1 and giga2:
user@DETECTOR-conf# interface giga1user@DETECTOR-conf-if-giga1# no shutdownuser@DETECTOR-conf-if-giga1# interface giga2user@DETECTOR-conf-if-giga2# no shutdown
To deactivate a physical interface, use the shutdown command.
Clearing the Counters of a Physical Interface You can clear the counters of physical interfaces that are used for data traffic if you are going to perform testing and want to be sure that the counters include information from the testing session only.
To clear the interface counters, use the following command in interface configuration mode:
clear counters
The following 1-Gbps operation example shows how to clear the counters of the interface giga2:
user@DETECTOR-conf-if-giga2# clear counters
3-9Cisco Traffic Anomaly Detector Module Configuration Guide
OL-11857-01
Chapter 3 Initializing the Detector ModuleConfiguring the Default Gateway
The following 2-Gbps operation example shows how to clear the counters of the interfaces giga1 and giga2:
user@DETECTOR-conf-if-giga1# clear countersuser@DETECTOR-conf-if-giga1# interface giga2user@DETECTOR-conf-if-giga2# clear counters
Configuring the Default GatewayThe default gateway receives and forwards packets that have IP addresses that are unknown to the local network. In most cases, the Detector module default gateway IP address is the adjacent router, located between the Detector module and the Internet. The default gateway address must be on the same network as one of the IP addresses of the Detector module network interfaces.
To assign a default gateway address, use the following command in configuration mode:
default-gateway ip-addr
The ip-addr argument specifies the default gateway IP address. Enter the IP address in dotted-decimal notation (for example, enter an IP address of 192.168.100.1).
To modify the default gateway address, reenter the command.
The following example shows how to configure the default gateway:
user@DETECTOR-conf# default-gateway 192.168.100.1
Adding a Static Route to the Routing TableYou can add a static route to the Detector module routing table. Add a static route to specify routes for servers or networks outside the local networks that are associated with the Detector module IP interfaces. The static route is added permanently and is not removed after the Detector module is rebooted.
To add a static route to the Detector module routing table, use the following command in configuration mode:
ip route ip-addr ip-mask nexthop-ip [if-name]
Table 3-6 provides the arguments for the ip route command.
Table 3-6 Arguments for the ip route Command
Parameter Description
ip-addr Network destination of the route. The destination can be an IP network address (where the host bits of the network address are set to 0) or an IP address for a host route. Enter the IP address in dotted-decimal notation (for example, enter 192.168.100.1).
ip-mask Subnet mask associated with the network destination. Enter the subnet mask in dotted-decimal notation (for example, enter 255.255.255.0).
3-10Cisco Traffic Anomaly Detector Module Configuration Guide
OL-11857-01
Chapter 3 Initializing the Detector ModuleManaging the Detector Module
The following example shows how to configure a static route:
user@DETECTOR-conf# ip route 172.16.31.5 255.255.255.255 192.168.100.34
To display the routing table, enter the show ip route command.
Managing the Detector ModuleAfter you establish a session from the supervisor engine and configure the Detector module networking (see Chapter 2, “Configuring the Detector Module on the Supervisor Engine” and the “Configuring the Detector Module Interfaces” section on page 3-7), you can access and manage the Detector module using one of the following methods:
• Access using a Secure Shell (SSH) session.
• Access the Detector module using a Web-Based Manager (WBM).
• Access the Detector module using the MultiDevice Manager (MDM).
• Access from a DDoS-sensing network element. Refer to the appropriate documentation for more information.
This section contains the following topics:
• Managing the Detector Module with the Web-Based Manager
• Managing the Detector Module with the Cisco DDoS MultiDevice Manager
• Accessing the Detector Module with SSH
Managing the Detector Module with the Web-Based ManagerYou can manage the Detector module using the WBM and a web browser.
To enable the WBM and manage the Detector module, perform the following steps:
Step 1 Enable the WBM service by entering the following command in configuration mode:
service wbm
Step 2 Permit access to the Detector module from the remote manager IP address by entering the following command in configuration mode:
nexthop-ip Forwarding or the next-hop IP address over which the set of addresses that are defined by the network destination and subnet mask are reachable. The next-hop IP address should be within the interface subnet. For local subnet routes, the next-hop IP address is the IP address that is assigned to the interface that is attached to the subnet. For remote routes, available across one or more routers, the next-hop IP address is a directly reachable IP address that is assigned to a neighboring router.
if-name (Optional) Interface on the Detector module over which the destination is reachable. If you do not specify an interface, the next-hop IP address in the Detector module routing table determines the interface used.
Table 3-6 Arguments for the ip route Command (continued)
Parameter Description
3-11Cisco Traffic Anomaly Detector Module Configuration Guide
OL-11857-01
Chapter 3 Initializing the Detector ModuleManaging the Detector Module
permit wbm {ip-addr [ip-mask] | *}
Table 3-7 provides the arguments for the permit wbm command.
Step 3 Open the browser and enter the following address:
https://Detector module-ip-address/
The Detector module-ip-address argument is the IP address of the Detector module.
The Detector module WBM window appears.
Note HTTPS, not HTTP, is used to enable web-based management control.
Step 4 Enter your username and password and click OK. After you enter the username and password, the Detector module home page displays.
If you have the Detector module configured to use Terminal Access Controller Access-Control System Plus (TACACS+) authentication, the Detector module uses the TACACS+ user database for user authentication instead of using its local database. If you have configured advanced authentication attributes on the TACACS+ server, such as password expiry, the Detector module may prompt you for a new password based on the configuration of the user on the TACACS+ server or notify you when the password is about to expire.
The following example shows how to enable the Detector module WBM:
user@DETECTOR-conf# service wbmuser@DETECTOR-conf# permit wbm 192.168.30.32
For information on using the WBM to manage your Detector module, see the appropriate Cisco Web-Based Manager Configuration Guide.
Table 3-7 Arguments for the permit wbm Command
Parameter Description
ip-addr IP address of the remote manager. Enter the IP address in dotted-decimal notation (for example, enter 192.168.100.1).
ip-mask (Optional) Subnet mask. Enter the subnet mask in dotted-decimal notation (for example, enter 255.255.255.0).
* Asterisk wildcard character that allows access by all remote manager IP addresses.
Caution For security reasons, we recommend that you not permit access to a service from all IP addresses.
3-12Cisco Traffic Anomaly Detector Module Configuration Guide
OL-11857-01
Chapter 3 Initializing the Detector ModuleManaging the Detector Module
Managing the Detector Module with the Cisco DDoS MultiDevice ManagerThe Cisco DDoS MultiDevice Manager (MDM) is a server-based application that allows you to manage one or more Detector modules using a web browser. To use the MDM to manage your network of Detector modules, perform the following actions:
• Install and configure the MDM software on a network server (see the Cisco DDoS MultiDevice Manager Configuration Guide).
• Enable the MDM service on your Detector module and permit access by the MDM as described in the following procedure.
To enable the MDM service on the Detector module, perform the following steps:
Step 1 Enable the MDM service by entering the following command in configuration mode:
service mdm
Step 2 Permit access to the Detector module from the MDM by entering the following command in configuration mode:
mdm server ip-addr
The ip-addr argument defines the IP address of your MDM server. Enter the IP address in dotted-decimal notation.
The following example shows how to enable the MDM service and permit access by the MDM:
user@DETECTOR-conf# service mdmuser@DETECTOR-conf# mdm server 192.168.30.32
For information about using the MDM to manage your Detector modules, see the Cisco DDoS MultiDevice Manager Configuration Guide.
Accessing the Detector Module with SSHYou can access the Detector module using a SSH connection. The SSH service is enabled by default.
To access the Detector module with SSH, perform the following steps:
Step 1 Permit access to the Detector module from the remote network IP address by entering the following command in configuration mode:
permit ssh {ip-addr [ip-mask] | *}
Table 3-8 provides the arguments for the permit ssh command.
Table 3-8 Arguments for the permit ssh Command
Parameter Description
ip-addr IP address of the remote network. Enter the IP address in dotted-decimal notation (for example, enter 192.168.100.1).
ip-mask (Optional) Subnet mask. Enter the subnet mask in dotted-decimal notation (for example, enter 255.255.255.0).
3-13Cisco Traffic Anomaly Detector Module Configuration Guide
OL-11857-01
Chapter 3 Initializing the Detector ModuleManaging the Detector Module
Step 2 Establish a connection from the remote network address and enter your login username and password.
If you have the Detector module configured to use TACACS+ authentication, the Detector module uses the TACACS+ user database for user authentication instead of using its local database. If you have configured advanced authentication attributes on the TACACS+ server, such as password expiry, the Detector module may prompt you for a new password based on the configuration of the user on the TACACS+ server or notify you when the password is about to expire.
To enable the SSH connection without entering a login username and password, perform the following:
• Configure the Detector module to use a locally configured login and password for authentication. See the “Configuring Authentication” section on page 4-4 for more information.
• Add the remote connection SSH public key to the Detector module SSH key list. See the “Managing SSH Keys” section on page 4-23 for more information.
The following example shows how to enable an SSH connection to the Detector module:
user@DETECTOR-conf# permit ssh 192.168.30.32
* Asterisk wildcard character that allows access by any remote network.
Caution For security reasons, we recommend that you not permit access to all remote networks.
Table 3-8 Arguments for the permit ssh Command (continued)
Parameter Description
3-14Cisco Traffic Anomaly Detector Module Configuration Guide
OL-11857-01
Cisco TraOL-11857-01
C H A P T E R 4
Configuring the DetectorThis chapter describes how to configure the Cisco Traffic Anomaly Detector (Detector module) services.
This chapter refers to the Cisco Guard (Guard), the companion product of the Detector module. The Guard is a Distributed Denial of Service (DDoS) attack detection and mitigation device that cleans the zone traffic as the traffic flows through it, dropping the attack traffic and injecting the legitimate traffic back into the network. When the Detector module determines that the zone is under attack, it can activate the Guard attack mitigation services. The Detector module can also synchronize zone configurations with the Guard. For more information about the Guard, see the Cisco Anomaly Guard Module Configuration Guide or the Cisco Guard Configuration Guide.
This chapter contains the following sections:
• Activating Detector Services
• Configuring Access Control Using AAA
• Establishing Communication with the Guard
• Managing SSH Keys
• Configuring the Keys for SFTP and SCP Connections
• Changing the Hostname
• Enabling SNMP Traps
• Configuring SNMP Community Strings
• Configuring the Login Banner
• Configuring the Web-Based Manager Logo
• Configuring the Session Timeout
Activating Detector ServicesThe Detector module has several service options which you can activate by enabling the service and then defining the IP address that is permitted access to the service. With the exception of the Secure Shell service which is always active, this section describes how to activate the services.
The Detector module services are as follows:
• Internode communication service—The Detector module uses this service when establishing a communication channel with the Cisco Guard. See the “Establishing Communication with the Guard” section on page 4-16 for more information.
4-1ffic Anomaly Detector Module Configuration Guide
Chapter 4 Configuring the DetectorActivating Detector Services
• Simple Network Management Protocol (SNMP) server service—You can access the Detector module using SNMP to retrieve information as defined by the following MIBs:
– Riverhead private MIB
– MIB2 (RFC1213-MIB)—All of the MIB groups with the exceptions of the EGP and transmission MIB groups
– UCDAVIS (UCD-SNMP-MIB)—Only the following MIB groups: memory, latable, systemStats, version, and snmperrs
See the MIB file that is released with the software version for information about the MIB definitions.
Note The Riverhead MIB contains 64-bit counters. To read the MIB, you must use a browser that supports SNMP version 2.
• SNMP trap service—When you activate the snmp-trap service, the Detector module generates SNMP traps. See the “Enabling SNMP Traps” section on page 4-25 for more information.
• Secure Shell (SSH) service—The SSH service is always active. See the “Accessing the Detector Module with SSH” section on page 3-13 and the “Managing SSH Keys” section on page 4-23 for more information.
• Web-Based Manager (WBM) service—You can control the Detector module from the web using a web browser. See the “Managing the Detector Module with the Web-Based Manager” section on page 3-11 for more information.
• MultiDevice Manager (MDM) service—Using a web browser, you can monitor and control the Detector module and other Guard and Detector devices from the MDM server. See the “Managing the Detector Module with the Cisco DDoS MultiDevice Manager” section on page 3-13 for more information.
To activate a Detector module service, perform the following steps:
Step 1 Enable the Detector module service by entering the following command in configuration mode:
service {internode-comm | mdm | snmp-server | snmp-trap | wbm}
Table 4-1 provides the keywords for the service command.
Step 2 Permit access to the Detector module service by entering one of the following commands:
• For the MDM service, permit access to the Detector module service from the MDM by entering the following command in configuration mode:
mdm server ip-addr
Table 4-1 Keywords for the service Command
Service Description
internode-comm Specifies the internode communication service.
mdm Specifies the MDM service.
snmp-server Specifies the SNMP server service.
snmp-trap Specifies the SNMP trap service.
wbm Specifies the WBM service.
4-2Cisco Traffic Anomaly Detector Module Configuration Guide
OL-11857-01
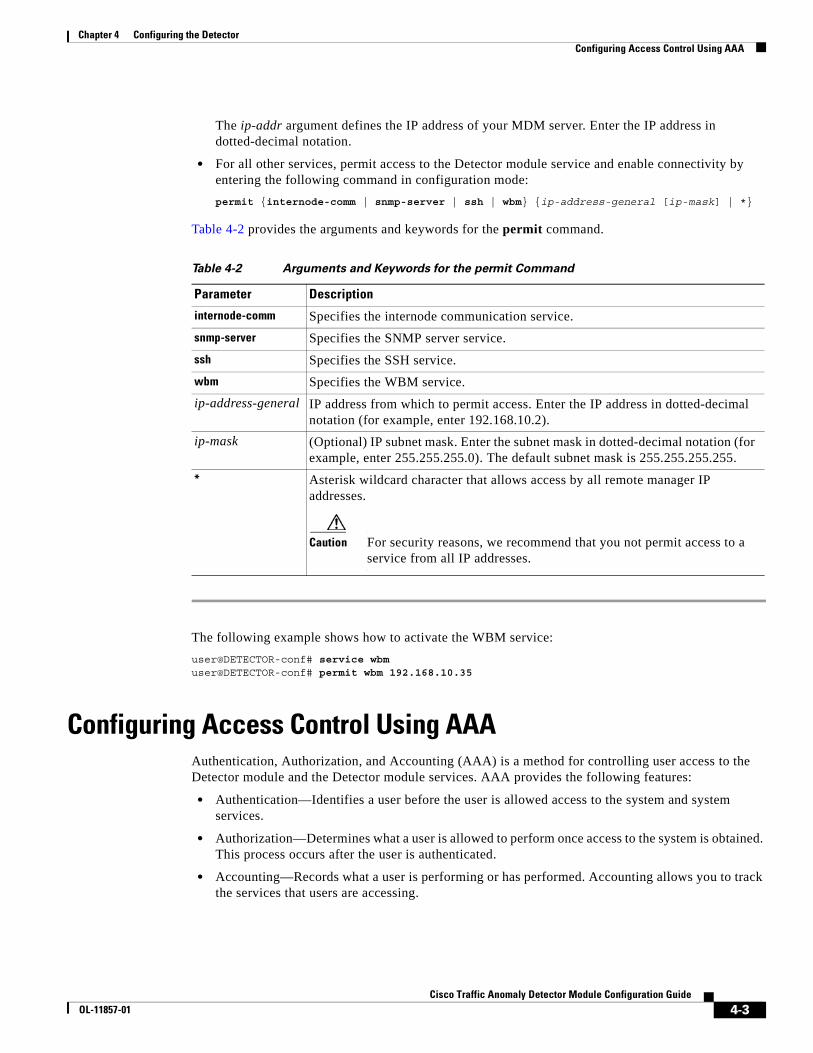
Chapter 4 Configuring the DetectorConfiguring Access Control Using AAA
The ip-addr argument defines the IP address of your MDM server. Enter the IP address in dotted-decimal notation.
• For all other services, permit access to the Detector module service and enable connectivity by entering the following command in configuration mode:
permit {internode-comm | snmp-server | ssh | wbm} {ip-address-general [ip-mask] | *}
Table 4-2 provides the arguments and keywords for the permit command.
The following example shows how to activate the WBM service:
user@DETECTOR-conf# service wbmuser@DETECTOR-conf# permit wbm 192.168.10.35
Configuring Access Control Using AAAAuthentication, Authorization, and Accounting (AAA) is a method for controlling user access to the Detector module and the Detector module services. AAA provides the following features:
• Authentication—Identifies a user before the user is allowed access to the system and system services.
• Authorization—Determines what a user is allowed to perform once access to the system is obtained. This process occurs after the user is authenticated.
• Accounting—Records what a user is performing or has performed. Accounting allows you to track the services that users are accessing.
Table 4-2 Arguments and Keywords for the permit Command
Parameter Description
internode-comm Specifies the internode communication service.
snmp-server Specifies the SNMP server service.
ssh Specifies the SSH service.
wbm Specifies the WBM service.
ip-address-general IP address from which to permit access. Enter the IP address in dotted-decimal notation (for example, enter 192.168.10.2).
ip-mask (Optional) IP subnet mask. Enter the subnet mask in dotted-decimal notation (for example, enter 255.255.255.0). The default subnet mask is 255.255.255.255.
* Asterisk wildcard character that allows access by all remote manager IP addresses.
Caution For security reasons, we recommend that you not permit access to a service from all IP addresses.
4-3Cisco Traffic Anomaly Detector Module Configuration Guide
OL-11857-01
Chapter 4 Configuring the DetectorConfiguring Access Control Using AAA
The Detector module is preconfigured with the following system user accounts:
• admin—The admin user account is configured with the administration access rights, allowing access to the Detector module CLI and all its functionality. When connecting to the Detector module CLI for the first time, you are required to set a password for this account. Use the admin user account to configure additional user accounts.
• riverhead—The riverhead user account is configured with dynamic access rights. The Detector module uses this user account to establish the initial communication channel with the Guard. When you connect to the Detector module CLI for the first time, you are required to set a password for this account.
You cannot delete system user accounts.
You can divide the Detector module user community into domains and assign passwords for secure management access. We recommend that you create new user accounts and avoid using the system user accounts after the initial configuration so that you can monitor user actions.
The following sections describe how to configure access control:
• Configuring Authentication
• Configuring Authorization
• Configuring Accounting
• Configuring the TACACS+ Server Attributes
Configuring AuthenticationYou can configure which authentication method that the Detector module uses when a user tries to log into the Detector module or requests a higher privilege level (using the enable command). The Detector module offers the following authentication options:
• Local authentication—Uses locally configured login and enable passwords for authentication. This authentication method is the default. See the “Configuring Local Authentication” section on page 4-6 for more information.
• Terminal Access Controller Access-Control System Plus (TACACS+) authentication—Remote user authentication using one or more TACACS+ servers.
Note You must configure authentication for the user on a TACACS+ server before configuring user authorization or the user may not be able to access the Detector module (see the “Configuring Authorization” section on page 4-8).
You can configure that the Detector module to use one or both of the user authentication methods. When using TACACS+ authentication, you can define multiple TACACS+ servers. Defining more than one authentication method provides a backup in case the initial method fails due to a communication error.
The Detector module authenticates a user by using each of the methods that you define and in the order in which you define them on the Detector module. To view the list of defined authentication methods, enter the show running config command. The Detector module attempts to authenticate the user using the first method on the list. If the first authentication method does not respond, the Detector module sequentially selects the next authentication method on the list until it finds one that responds.
You can configure the action that the Detector module takes when it receives a response from the first TACACS+ server by using the tacacs-server first-hit command. If you disable the first-hit option (the default setting) and the first server rejects the authentication, the Detector module sequentially scans the
4-4Cisco Traffic Anomaly Detector Module Configuration Guide
OL-11857-01
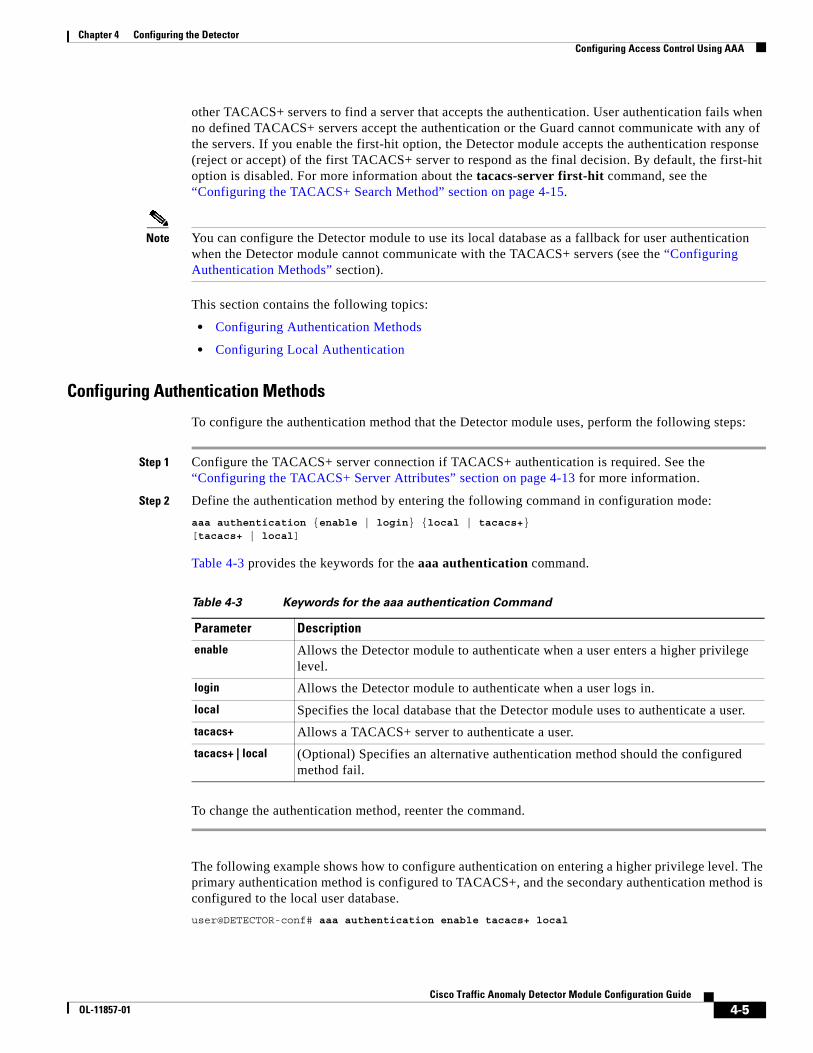
Chapter 4 Configuring the DetectorConfiguring Access Control Using AAA
other TACACS+ servers to find a server that accepts the authentication. User authentication fails when no defined TACACS+ servers accept the authentication or the Guard cannot communicate with any of the servers. If you enable the first-hit option, the Detector module accepts the authentication response (reject or accept) of the first TACACS+ server to respond as the final decision. By default, the first-hit option is disabled. For more information about the tacacs-server first-hit command, see the “Configuring the TACACS+ Search Method” section on page 4-15.
Note You can configure the Detector module to use its local database as a fallback for user authentication when the Detector module cannot communicate with the TACACS+ servers (see the “Configuring Authentication Methods” section).
This section contains the following topics:
• Configuring Authentication Methods
• Configuring Local Authentication
Configuring Authentication Methods
To configure the authentication method that the Detector module uses, perform the following steps:
Step 1 Configure the TACACS+ server connection if TACACS+ authentication is required. See the “Configuring the TACACS+ Server Attributes” section on page 4-13 for more information.
Step 2 Define the authentication method by entering the following command in configuration mode:
aaa authentication {enable | login} {local | tacacs+} [tacacs+ | local]
Table 4-3 provides the keywords for the aaa authentication command.
To change the authentication method, reenter the command.
The following example shows how to configure authentication on entering a higher privilege level. The primary authentication method is configured to TACACS+, and the secondary authentication method is configured to the local user database.
user@DETECTOR-conf# aaa authentication enable tacacs+ local
Table 4-3 Keywords for the aaa authentication Command
Parameter Description
enable Allows the Detector module to authenticate when a user enters a higher privilege level.
login Allows the Detector module to authenticate when a user logs in.
local Specifies the local database that the Detector module uses to authenticate a user.
tacacs+ Allows a TACACS+ server to authenticate a user.
tacacs+ | local (Optional) Specifies an alternative authentication method should the configured method fail.
4-5Cisco Traffic Anomaly Detector Module Configuration Guide
OL-11857-01
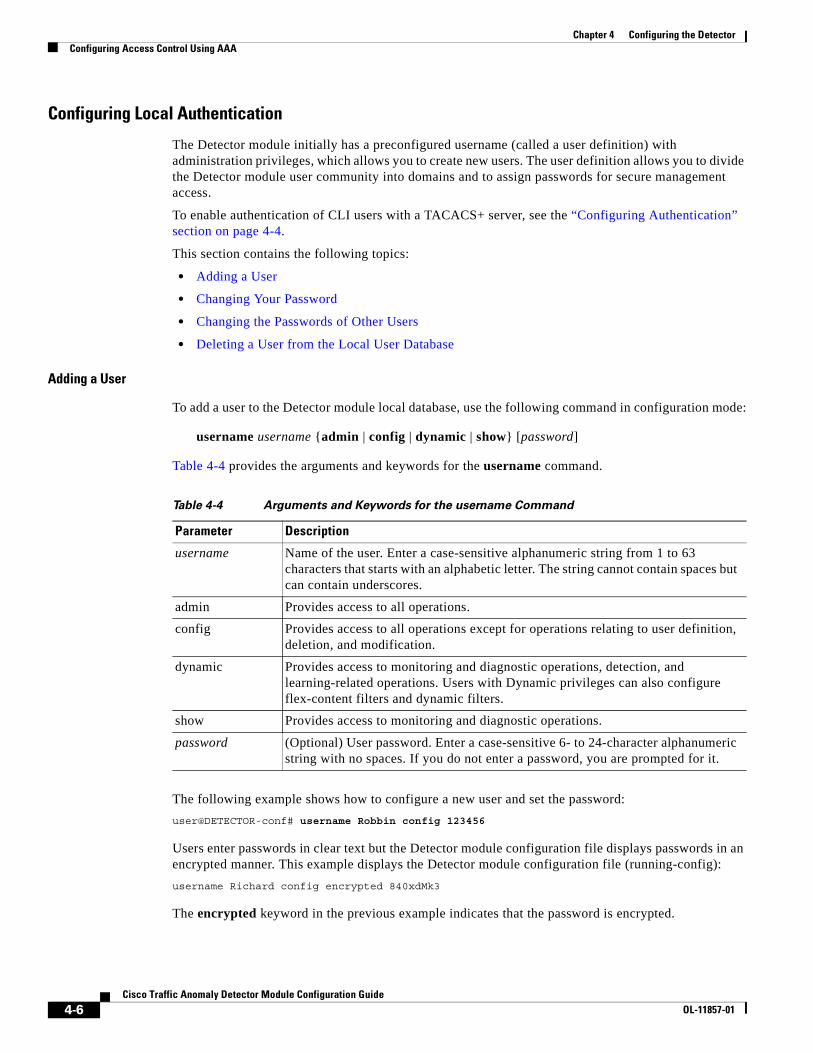
Chapter 4 Configuring the DetectorConfiguring Access Control Using AAA
Configuring Local Authentication
The Detector module initially has a preconfigured username (called a user definition) with administration privileges, which allows you to create new users. The user definition allows you to divide the Detector module user community into domains and to assign passwords for secure management access.
To enable authentication of CLI users with a TACACS+ server, see the “Configuring Authentication” section on page 4-4.
This section contains the following topics:
• Adding a User
• Changing Your Password
• Changing the Passwords of Other Users
• Deleting a User from the Local User Database
Adding a User
To add a user to the Detector module local database, use the following command in configuration mode:
username username {admin | config | dynamic | show} [password]
Table 4-4 provides the arguments and keywords for the username command.
The following example shows how to configure a new user and set the password:
user@DETECTOR-conf# username Robbin config 123456
Users enter passwords in clear text but the Detector module configuration file displays passwords in an encrypted manner. This example displays the Detector module configuration file (running-config):
username Richard config encrypted 840xdMk3
The encrypted keyword in the previous example indicates that the password is encrypted.
Table 4-4 Arguments and Keywords for the username Command
Parameter Description
username Name of the user. Enter a case-sensitive alphanumeric string from 1 to 63 characters that starts with an alphabetic letter. The string cannot contain spaces but can contain underscores.
admin Provides access to all operations.
config Provides access to all operations except for operations relating to user definition, deletion, and modification.
dynamic Provides access to monitoring and diagnostic operations, detection, and learning-related operations. Users with Dynamic privileges can also configure flex-content filters and dynamic filters.
show Provides access to monitoring and diagnostic operations.
password (Optional) User password. Enter a case-sensitive 6- to 24-character alphanumeric string with no spaces. If you do not enter a password, you are prompted for it.
4-6Cisco Traffic Anomaly Detector Module Configuration Guide
OL-11857-01
Chapter 4 Configuring the DetectorConfiguring Access Control Using AAA
To display the list of users configured on the Detector module, use the show running-config or show detector commands.
To display a list of the users currently logged into the CLI, use the show users command.
Changing Your Password
You can change your own password. Administrators can change their own password and the passwords of other users (see the “Changing the Passwords of Other Users” section on page 4-7).
To change your own password, perform the following steps:
Step 1 Enter the following command in global mode:
password
Step 2 Enter your current password. The system prompts you for a new password.
Step 3 Enter a new password. The password must be an alphanumeric, 6- to 24-character alphanumeric string, with no spaces. The password is case sensitive. The system prompts you to confirm the new password by typing it again.
The following example shows how to change your password:
user@DETECTOR# password Old Password: <old-password>New Password: <new-password>Retype New Password: <new-password>
Changing the Passwords of Other Users
You must have administration user privileges to change the password of other users.
To change the password of another user, perform the following steps:
Step 1 Enter the following command in global mode:
password username-password
The username-password argument is the user whose password you are changing.
Step 2 Enter a new password.
The password must be an alphanumeric, 6- to 24-character string with no spaces. The password is case sensitive. The system prompts you to confirm the new password by typing it again.
The following example shows that the administrator changes the password of the user Jose:
user@DETECTOR# password Jose New Password: <new-password>Retype New Password: <new-password>
Deleting a User from the Local User Database
When you delete a user from the local user database, the associated user cannot access the Detector module if authentication is performed using the local user database only.
4-7Cisco Traffic Anomaly Detector Module Configuration Guide
OL-11857-01
Chapter 4 Configuring the DetectorConfiguring Access Control Using AAA
To delete a user from the Detector module local user database, use the no username username command.
The following example shows how to delete a user from the local user database:
user@DETECTOR-conf# no username Robbin
Configuring AuthorizationYou can limit the services available to a user. When you enable authorization, the Detector module verifies the user profile, which is located either in the local user database or on a TACACS+ security server. The user is permitted access to the requested service only if the information in the user profile allows it.
You can configure which authorization method that the Detector module uses when a user tries to execute a command. The Detector module offers the following authorization options:
• TACACS+ authorization—Remote user authorization method that uses one or more TACACS+ servers.
Two types of TACACS+ authorization are supported:
– EXEC authorization—Determines the user privilege level once when the user is authenticated upon logging into the Detector module.
– Command authorization—Consults a TACACS+ server to get authorization for each command after the user enters the command.
TACACS+ authorization enables you to specify access rights for each command.
Caution We recommend that you limit authorization to the copy running-config command because using the copy running-config command allows a user to execute all configuration commands, regardless of whether the user is actually authorized to use every command in the configuration file.
• Local authorization—Uses locally configured user profiles for command group access control. Authorization is defined for all commands at the specified privilege level. This authorization method is the default.
The Detector module can use local authorization when communication to the TACACS+ server fails.
You can configure a sequential authorization list that defines the methods for authorizing a user, allows you to designate one or more methods to be used for authorization, and provides a backup if communication to the initial method fails.
The Detector module uses the first method that you list to authorize users; if that method does not respond, the Detector module selects the second authorization method. The authorization fails only if both authorization methods do not succeed.
To configure the Detector module to consider an authentication rejection as final and stop further searching with other TACACS+ servers or the local user database, you can configure the TACACS+ server attributes. See the “Configuring the TACACS+ Server Attributes” section on page 4-13 for more information.
This section contains the following topics:
• Configuring Local Authorization
• Configuring Authorization Methods
4-8Cisco Traffic Anomaly Detector Module Configuration Guide
OL-11857-01
Chapter 4 Configuring the DetectorConfiguring Access Control Using AAA
• Disabling Tab Completion of Zone Names
Configuring Local Authorization
Access to Detector operations depends on the user privilege level. You can limit the operations available to a user. The Detector module checks the user profile to verify the user access rights. Once authorized, the user is granted access to the requested operation only if the information in the user profile allows it. See Table 3-1 for more information about user privilege levels.
This section contains the following topics:
• Assigning Privilege Levels with Passwords
• Moving Between User Privilege Levels
Assigning Privilege Levels with Passwords
You can set passwords that restrict access to user privilege levels. After you specify the privilege level and the password, you can give the password to the users who need to access this level. Without knowing the privilege level password, the user cannot move to the password-protected level.
To set a local password to control access to a privilege level, use the following command in configuration mode:
enable password [level level] [password]
Table 4-5 provides the arguments for the enable password command.
The following example shows how to assign a password to the user privilege level admin:
user@DETECTOR-conf# enable password level admin <password>
Table 4-5 Arguments for the enable password Command
Parameter Description
level level (Optional) The user privilege level. The level can be one of the following:
• admin—Provides access to all operations.
• config—Provides access to all operations except for operations relating to user definition, deletion, and modification.
• dynamic—Provides access to monitoring and diagnostic operations, detection, and learning-related operations. Users with Dynamic privileges can also configure flex-content filters and dynamic filters.
• show—Provides access to monitoring and diagnostic operations.
The default level is admin.
password (Optional) Password for the privilege level. The password must be an alphanumeric, 6- to 24-character string with no spaces. The password is case sensitive. If you do not enter a password, you are prompted for it.
4-9Cisco Traffic Anomaly Detector Module Configuration Guide
OL-11857-01
Chapter 4 Configuring the DetectorConfiguring Access Control Using AAA
Moving Between User Privilege Levels
Authorized users can move between user privilege levels.
To move between user privilege levels, perform the following steps:
Step 1 Enter the following command in global mode:
enable [level]
The level argument specifies the user privilege level. This level can be one of the following:
• admin—Provides access to all operations.
• config—Provides access to all operations except for operations relating to user definition, deletion, and modification.
• dynamic—Provides access to monitoring and diagnostic operations, detection, and learning-related operations. Users with Dynamic privileges can also configure flex-content filters and dynamic filters.
• show—Provides access to monitoring and diagnostic operations.
The default level is admin.
Step 2 Enter the privilege level password.
The following example shows how to switch to the admin privilege level:
user@DETECTOR> enable admin Enter enable admin Password: <password>
To return to the show privilege level (as described in Table 4-5), use the disable command.
Configuring Authorization Methods
To configure the authorization method, perform the following steps:
Step 1 Configure the TACACS+ server connection if TACACS+ authorization is required. See the “Configuring the TACACS+ Server Attributes” section on page 4-13 for more information.
Step 2 Define the authorization method by entering one of the following commands in configuration mode:
• aaa authorization exec tacacs+
• aaa authorization commands level tacacs+
To remove an authorization method, use the no form of the command.
4-10Cisco Traffic Anomaly Detector Module Configuration Guide
OL-11857-01
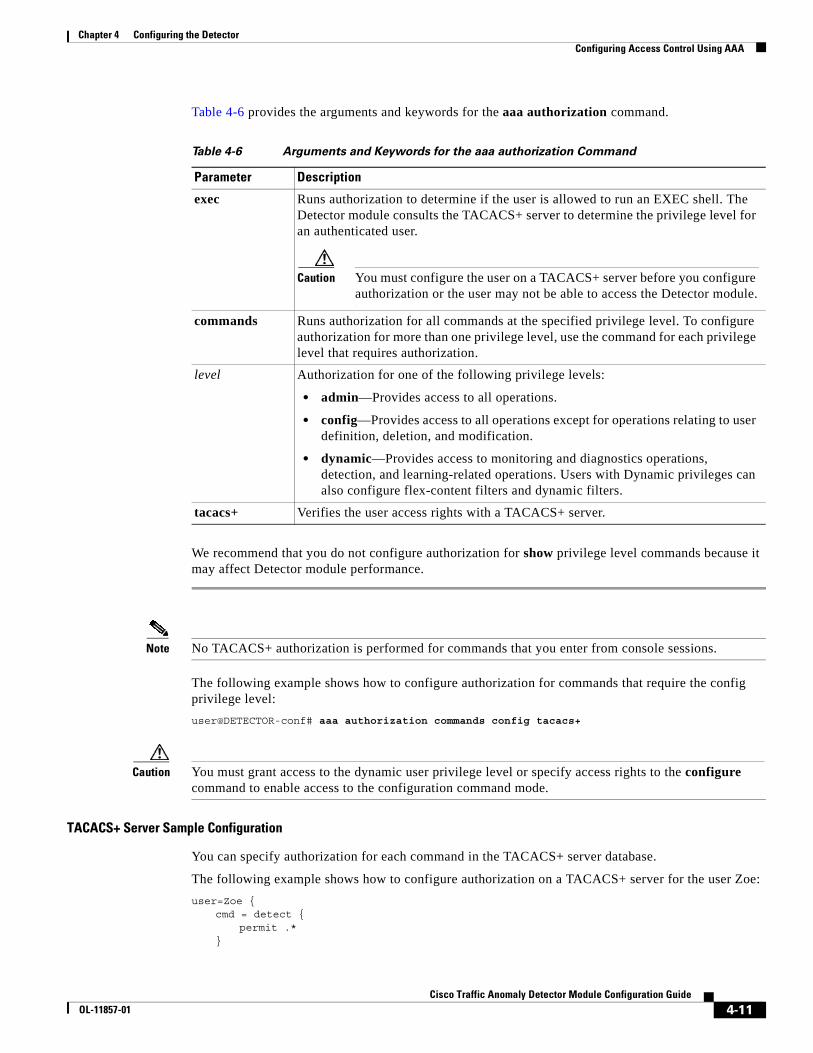
Chapter 4 Configuring the DetectorConfiguring Access Control Using AAA
Table 4-6 provides the arguments and keywords for the aaa authorization command.
We recommend that you do not configure authorization for show privilege level commands because it may affect Detector module performance.
Note No TACACS+ authorization is performed for commands that you enter from console sessions.
The following example shows how to configure authorization for commands that require the config privilege level:
user@DETECTOR-conf# aaa authorization commands config tacacs+
Caution You must grant access to the dynamic user privilege level or specify access rights to the configure command to enable access to the configuration command mode.
TACACS+ Server Sample Configuration
You can specify authorization for each command in the TACACS+ server database.
The following example shows how to configure authorization on a TACACS+ server for the user Zoe:
user=Zoe {cmd = detect {
permit .*}
Table 4-6 Arguments and Keywords for the aaa authorization Command
Parameter Description
exec Runs authorization to determine if the user is allowed to run an EXEC shell. The Detector module consults the TACACS+ server to determine the privilege level for an authenticated user.
Caution You must configure the user on a TACACS+ server before you configure authorization or the user may not be able to access the Detector module.
commands Runs authorization for all commands at the specified privilege level. To configure authorization for more than one privilege level, use the command for each privilege level that requires authorization.
level Authorization for one of the following privilege levels:
• admin—Provides access to all operations.
• config—Provides access to all operations except for operations relating to user definition, deletion, and modification.
• dynamic—Provides access to monitoring and diagnostics operations, detection, and learning-related operations. Users with Dynamic privileges can also configure flex-content filters and dynamic filters.
tacacs+ Verifies the user access rights with a TACACS+ server.
4-11Cisco Traffic Anomaly Detector Module Configuration Guide
OL-11857-01
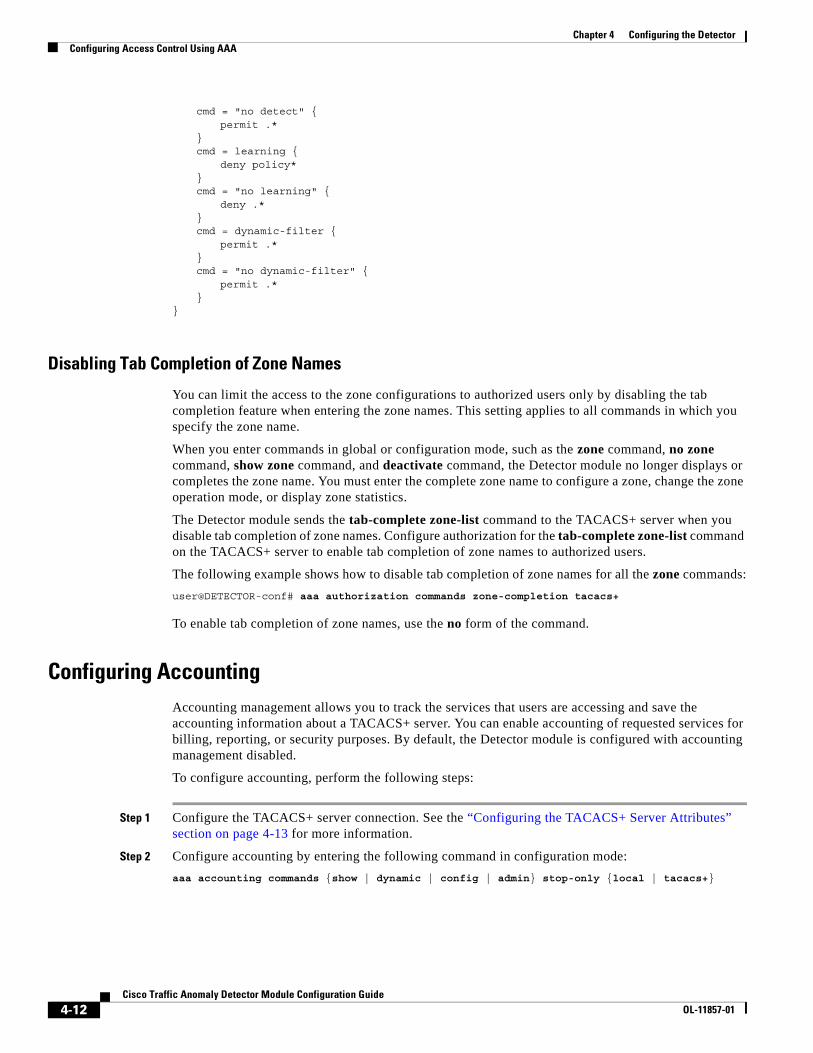
Chapter 4 Configuring the DetectorConfiguring Access Control Using AAA
cmd = "no detect" {permit .*
}cmd = learning {
deny policy*}cmd = "no learning" {
deny .*}cmd = dynamic-filter {
permit .*}cmd = "no dynamic-filter" {
permit .*}
}
Disabling Tab Completion of Zone Names
You can limit the access to the zone configurations to authorized users only by disabling the tab completion feature when entering the zone names. This setting applies to all commands in which you specify the zone name.
When you enter commands in global or configuration mode, such as the zone command, no zone command, show zone command, and deactivate command, the Detector module no longer displays or completes the zone name. You must enter the complete zone name to configure a zone, change the zone operation mode, or display zone statistics.
The Detector module sends the tab-complete zone-list command to the TACACS+ server when you disable tab completion of zone names. Configure authorization for the tab-complete zone-list command on the TACACS+ server to enable tab completion of zone names to authorized users.
The following example shows how to disable tab completion of zone names for all the zone commands:
user@DETECTOR-conf# aaa authorization commands zone-completion tacacs+
To enable tab completion of zone names, use the no form of the command.
Configuring AccountingAccounting management allows you to track the services that users are accessing and save the accounting information about a TACACS+ server. You can enable accounting of requested services for billing, reporting, or security purposes. By default, the Detector module is configured with accounting management disabled.
To configure accounting, perform the following steps:
Step 1 Configure the TACACS+ server connection. See the “Configuring the TACACS+ Server Attributes” section on page 4-13 for more information.
Step 2 Configure accounting by entering the following command in configuration mode:
aaa accounting commands {show | dynamic | config | admin} stop-only {local | tacacs+}
4-12Cisco Traffic Anomaly Detector Module Configuration Guide
OL-11857-01
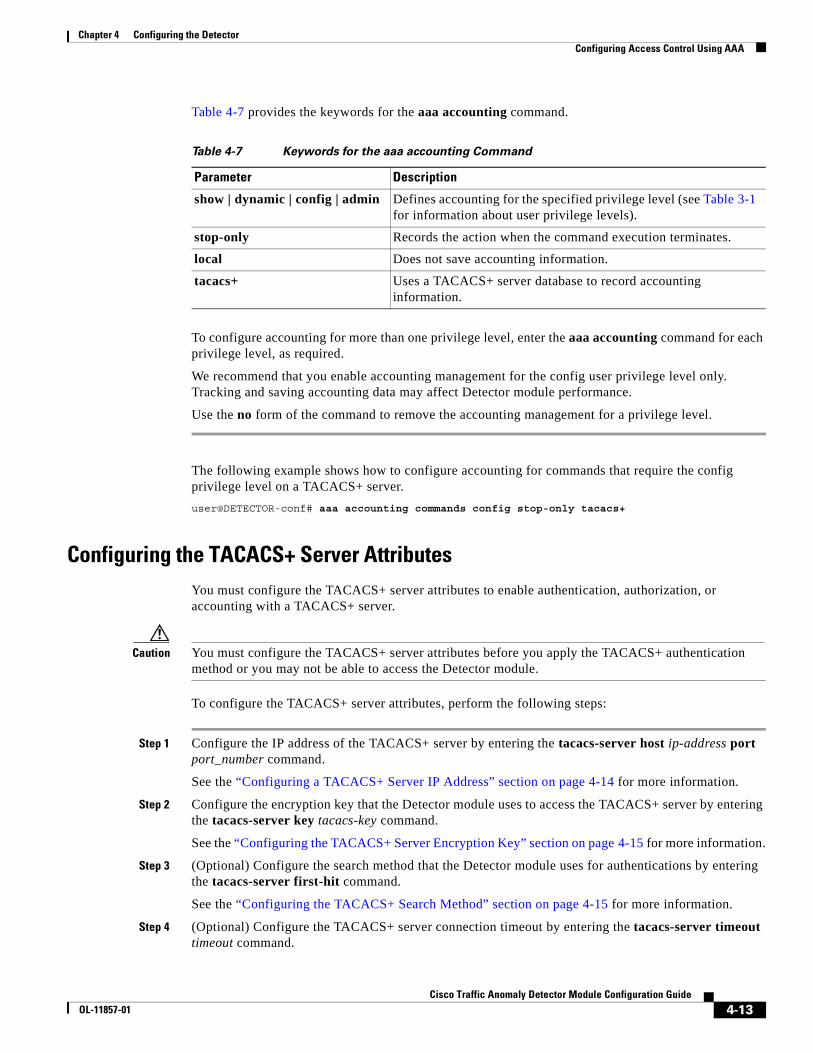
Chapter 4 Configuring the DetectorConfiguring Access Control Using AAA
Table 4-7 provides the keywords for the aaa accounting command.
To configure accounting for more than one privilege level, enter the aaa accounting command for each privilege level, as required.
We recommend that you enable accounting management for the config user privilege level only. Tracking and saving accounting data may affect Detector module performance.
Use the no form of the command to remove the accounting management for a privilege level.
The following example shows how to configure accounting for commands that require the config privilege level on a TACACS+ server.
user@DETECTOR-conf# aaa accounting commands config stop-only tacacs+
Configuring the TACACS+ Server AttributesYou must configure the TACACS+ server attributes to enable authentication, authorization, or accounting with a TACACS+ server.
Caution You must configure the TACACS+ server attributes before you apply the TACACS+ authentication method or you may not be able to access the Detector module.
To configure the TACACS+ server attributes, perform the following steps:
Step 1 Configure the IP address of the TACACS+ server by entering the tacacs-server host ip-address port port_number command.
See the “Configuring a TACACS+ Server IP Address” section on page 4-14 for more information.
Step 2 Configure the encryption key that the Detector module uses to access the TACACS+ server by entering the tacacs-server key tacacs-key command.
See the “Configuring the TACACS+ Server Encryption Key” section on page 4-15 for more information.
Step 3 (Optional) Configure the search method that the Detector module uses for authentications by entering the tacacs-server first-hit command.
See the “Configuring the TACACS+ Search Method” section on page 4-15 for more information.
Step 4 (Optional) Configure the TACACS+ server connection timeout by entering the tacacs-server timeout timeout command.
Table 4-7 Keywords for the aaa accounting Command
Parameter Description
show | dynamic | config | admin Defines accounting for the specified privilege level (see Table 3-1 for information about user privilege levels).
stop-only Records the action when the command execution terminates.
local Does not save accounting information.
tacacs+ Uses a TACACS+ server database to record accounting information.
4-13Cisco Traffic Anomaly Detector Module Configuration Guide
OL-11857-01
Chapter 4 Configuring the DetectorConfiguring Access Control Using AAA
See the “Configuring the TACACS+ Server Connection Timeout” section on page 4-15 for more information.
Step 5 Display the TACACS+ server connection statistics by entering the show tacacs statistics command.
See the “Displaying TACACS+ Server Statistics” section on page 4-16 for more information.
The Detector module user privilege levels relate to the TACACS+ privilege numeration as follows:
• admin = 15
• config = 10
• dynamic = 5
• show = 0
This section contains the following topics:
• Configuring a TACACS+ Server IP Address
• Configuring the TACACS+ Server Encryption Key
• Configuring the TACACS+ Search Method
• Configuring the TACACS+ Server Connection Timeout
• Displaying TACACS+ Server Statistics
Configuring a TACACS+ Server IP Address
You can configure the Detector module to use a sequential list of TACACS+ servers for authentication, authorization, and accounting. The Detector module uses the TACACS+ server list to authenticate or authorize users or send an accounting event; if that server does not respond, the Detector module selects the second server. Authentication or authorization fails only if all servers listed do not respond.
Alternatively, you can configure the Detector module to use only the first TACACS+ server on the list to authenticate users (see the “Configuring the TACACS+ Search Method” section on page 4-15 for more information).
You must define the IP address of each TACACS+ server on the list. You can define a maximum of nine TACACS+ servers.
To add a TACACS+ server to the list and assign its IP address, use the following command in configuration mode:
tacacs-server host ip-address [port port_number]
Table 4-8 provides the arguments and keywords for the tacacs-server host command.
Table 4-8 Keywords for the tacacs-server host Command
Parameter Description
ip-address IP address of the TACACS+ server. Enter the IP address in dotted-decimal notation (for example, an IP address of 192.168.100.1).
port port_number (Optional) Specifies the port number to use. If you do not specify a port number, the Detector module uses port 49 by default.
4-14Cisco Traffic Anomaly Detector Module Configuration Guide
OL-11857-01
Chapter 4 Configuring the DetectorConfiguring Access Control Using AAA
The TACACS+ servers are added to the list in the order in which you enter them. You can add a maximum of nine servers to the list.
The following example shows how to add a server to the TACACS+ server list:
user@DETECTOR-conf# tacacs-server host 192.168.33.45 port 60
Configuring the TACACS+ Server Encryption Key
You must configure the encryption key to access a TACACS+ server. The key must match the key on the TACACS+ servers. The key cannot contain spaces.
To configure the server encryption access key, use the following command in configuration mode:
tacacs-server key tacacs-key
The argument tacacs-key is an alphanumeric string that contains up to 100 characters.
Note You can define only one encryption key. When using several TACACS+ servers, the Detector module uses the same key to encrypt communication with all TACACS+ servers.
Disable the encryption function by using the following command:
no tacacs-server key
The following example shows how to set the TACACS+ server encryption key to MyKey:
user@DETECTOR-conf# tacacs-server key MyKey
Configuring the TACACS+ Search Method
You can configure the Detector module to consider an authentication rejection as final and stop further searching with other TACACS+ servers by using the tacacs-server first-hit command in configuration mode. The Detector module performs user authentication using only the first TACACS+ server on the server list. If the first TACACS+ server does not respond, the Detector module selects the next server on the list. The Detector module regards the first user authentication approval or rejection received as the final decision and stops attempting to authenticate the user with other TACACS+ servers.
To configure the Detector module to continue a sequential search of the defined TACACS+ servers in an attempt to find a server that accepts the user authentication, use the no tacacs-server first-hit command in configuration mode. This method is the default setting for the first-hit operation. User authentication fails if all of the defined TACACS+ servers reject the user authentication or the Detector module cannot communicate with any of the servers.
The following example shows how to configure the TACACS+ search method so that the Detector module uses only the first TACACS+ server on the list to authenticate users:
user@DETECTOR-conf# tacacs-server first-hit
Configuring the TACACS+ Server Connection Timeout
You can configure the amount of time that the Detector module waits for a reply from the TACACS+ server. When the timeout ends, the Detector module either attempts to establish a connection with the next TACACS+ server (if a server was configured) or falls back to local AAA (if a fallback was configured). Authentication and authorization fail if no fallback method is configured.
4-15Cisco Traffic Anomaly Detector Module Configuration Guide
OL-11857-01
Chapter 4 Configuring the DetectorEstablishing Communication with the Guard
Note The same server timeout is used for communication with all TACACS+ servers.
To configure the TACACS+ server connection timeout, use the following command in configuration mode:
tacacs-server timeout timeout
The timeout argument specifies the amount of time (in seconds) that the Detector module waits for a TACACS+ server to reply. The default timeout is 0.
The following example shows how to configure the TACACS+ server connection timeout to 600 seconds:
user@DETECTOR-conf# tacacs-server timeout 600
Tip You may want to increase the timeout value if you have network problems or if the TACACS+ servers are slow to respond and cause persistent timeouts.
Displaying TACACS+ Server Statistics
You can display statistical information for the TACACS+ servers that you define by using the show tacacs statistics command in configuration mode.
To clear the TACACS+ statistics, use the clear tacacs statistics command in configuration mode.
Table 4-9 displays the fields in the show tacacs statistics command output.
Establishing Communication with the GuardYou can establish a secure communication channel between the Detector module and the Guards that you define on the Detector module remote Guard lists. The secure communication channel enables the Detector to perform the following tasks:
• Activate the Guard—When the Detector module detects a zone traffic anomaly, it uses the communication channel to activate the Guard that provides zone protection and to poll the Guard during zone protection.
• Synchronize a zone configuration—The Detector module uses the communication channel to exchange zone configuration information with the Guard.
Table 4-9 Field Descriptions in the show tacacs statistics Command Output
Field Description
PASS Number of times that the Detector module accessed the TACACS+ server successfully and was granted access.
FAIL Number of times that the Detector module accessed the TACACS+ server successfully and was denied access.
ERROR Number of times that the Detector module could not access the TACACS+ server.
4-16Cisco Traffic Anomaly Detector Module Configuration Guide
OL-11857-01
Chapter 4 Configuring the DetectorEstablishing Communication with the Guard
After you configure the communication channel parameters on both the Detector module and Guard, from the Detector module you initiate a connection with the Guard which enables the Detector module to exchange the keys and certificates that are required to establish a secure communication channel with the Guard. The Detector module then closes the connection and establishes the communication channel when it needs to activate the Guard, synchronize a zone configuration, or poll the Guard.
The Detector module and Guard support the following two types of communication channels:
• Secure Shell (SSH) version 2—Enables the Detector to activate the Guard.
• Secure Sockets Layer (SSL)—Enables the Detector to activate the Guard, poll the Guard, and synchronize zone configurations.
You use the zone remote Guard list and default remote Guard list on the Detector module to specify the Guards that the Detector module communicates with for zone protection and synchronization. When you specify a Guard on a remote Guard list, you select the type of communication channel that the Detector module is to establish with the Guard: SSH or SSL. Both devices require the SSH service for establishing a SSH or SSL communication channel. By default, the SSH service is always enabled on both devices. When you establish an SSL communication channel, the Detector module uses the SSH communication channel only for the initial connection with a Guard, during which time the devices exchange their keys and certificates.
Note Before you can establish a communication channel with a Guard, you must add the Guard to a remote Guard list on the Detector module. See the “Activating Remote Guards to Protect a Zone” section on page 9-5 for more information.
This section contains the following topics:
• Configuring the SSL Communication Channels Parameters
• Configuring the SSH Communication Channel Parameters
• Establishing Communication Channels
Configuring the SSL Communication Channels ParametersConfigure an SSL communication channel between the Detector module and the Guard when you need the Detector module to interact with the Guard as follows:
• Activate the Guard when the Detector module detects a traffic anomaly.
• Synchronize zone configurations with the Guard.
• Poll the Guard to identify that an attack on the zone has ended. If you enable the detect and learn process on the Detector module, the Detector module suspends the learning process (threshold tuning) when it detects an attack on the zone. The Detector module polls the Guard that it activated to mitigate the attack to determine when the attack is over, at which point, the Detector module automatically resumes the learning process.
• Monitor communication with the Guard and notify you if remote actions fail, such as activating the Guard to protect the zone.
An SSL communication channel provides secure connections through a combination of authentication and data encryption and relies upon digital certificates, private-public key exchange pairs, and Diffie-Hellman key agreement parameters for this level of security. SSL encrypts the data so that only the intended recipient can decipher the data.
4-17Cisco Traffic Anomaly Detector Module Configuration Guide
OL-11857-01
Chapter 4 Configuring the DetectorEstablishing Communication with the Guard
Each Guard and Detector module uses a digital certificate to authenticate the device attempting to communicate with it over the communication channel. The identity of the Guard and the Detector module in the SSL certificates is associated with the device IP address. To ensure a secure connection, the Detector module generates a private-public key pair and distributes its public key to the Guards that you define on the remote Guard lists.
After you configure the SSL communication parameters on both the Guard and the Detector module, you must establish the communication channel between the two devices, which you perform from the Detector module. During the initial connection to the Guard, the Detector module establishes an SSH communication channel with the user riverhead on the Guard and then the devices exchange the keys and certificates that are required to secure the communication channel. After the initial connection, the Detector module establishes an SSL communication channel when needed to activate the Guard, poll the Guard, or synchronize zone configurations.
If you replace one the devices on either end of an SSL communication channel or change one of their IP addresses, then you must regenerate the SSL certificates in both devices so that the two devices can successfully authenticate each other.
This section contains the following topics:
• Enabling an SSL Communication Channel
• Regenerating SSL Certificates
Enabling an SSL Communication Channel
To enable an SSL communication channel, you must configure the Detector module and the Guard to allow the following connection types:
• SSH—The Detector module establishes the initial connection with the Guard using an SSH communication channel to exchange the keys and certificates.
• SSL—The Detector module uses an SSL communication channel to establish all connections with the Guard after the initial connection.
Caution If the Guard is authenticating users using TACACS+ authentication, you must define the user riverhead on the TACACS+ server to enable the Detector to establish the SSH communication channel during the initial connection with the Guard.
To enable an SSL communication channel, perform the following steps on both the Detector module and the Guard:
Step 1 Permit access to the SSH service by the companion device IP address by entering the permit ssh ip-address-general [ip-mask] in configuration mode.
The ip-address-general and ip-mask arguments define the IP address of the companion device.
Step 2 Enable the communication channel service by entering the service internode-comm command in configuration mode.
Step 3 Permit access to the communication channel service by the companion device IP address by entering the permit internode-comm ip-address-general [ip-mask] command in configuration mode.
The ip-address-general and ip-mask arguments define the IP address of the companion device.
4-18Cisco Traffic Anomaly Detector Module Configuration Guide
OL-11857-01
Chapter 4 Configuring the DetectorEstablishing Communication with the Guard
After you configure the Detector module and the Guard to enable the SSL communication channel, you can establish the communication channel between them. For information on establishing the communication channel, see the “Establishing Communication Channels” section on page 4-21.
Regenerating SSL Certificates
The key that identifies the Guard and the Detector in the SSL certificates is associated with the device IP addresses. You must regenerate new SSL certificates for the Guard and the Detector on both ends of a communication channel when you make the following changes:
• Change the IP address of one of the devices.
• Replace one of the devices.
The process of regenerating new SSL certificates includes deleting the current certificates from both devices.
To display the current SSL certificates, use the show internode-comm certs command.
To regenerate the SSL certificates, perform the following steps:
Step 1 From the Detector module, delete the SSL certificate of the Guard by using the following command in configuration mode:
cert remove cert-host-ip
The cert-host-ip argument specifies the IP address of the Guard. Enter an asterisk (*) to delete the SSL certificates of all the Guards that you define on the remote Guard lists.
The following example shows how to delete an SSL certificate:
user@DETECTOR-conf# cert remove 10.56.36.4
Step 2 From the Guard, delete the SSL certificate of the Detector module by using the following command in configuration mode:
cert remove cert-host-ip
The cert-host-ip argument specifies the IP address of the Detector module. Enter an asterisk (*) to delete the SSL certificates of all Detector modules that have established communication channels with the Guard.
Step 3 If you replace the Guard, then you must also delete its SSH host key from the Detector module. From the Detector module, use the following command in configuration mode to delete Guard SSH host keys:
no host-keys ip-address-general
The ip-address-general argument specifies the IP address of the remote device.
The following example shows how to delete host keys from the Detector module:
user@DETECTOR-conf# no host-keys 10.56.36.4
Step 4 From the Detector module, regenerate new SSL certificates by establishing a new SSL communication channel between the Guard and the Detector module. For information about establishing a communication channel, see the “Establishing Communication Channels” section on page 4-21.
4-19Cisco Traffic Anomaly Detector Module Configuration Guide
OL-11857-01
Chapter 4 Configuring the DetectorEstablishing Communication with the Guard
Configuring the SSH Communication Channel ParametersConfigure an SSH communication channel between the Detector module and the Guard when the only interaction between the two devices that you need is for the Detector module to activate the Guard when it detects a traffic anomaly. An SSH communication channel does not allow the Detector module to perform the following tasks with the Guard:
• Synchronize zone configurations with the Guard.
• Poll the Guard to identify that an attack on the zone has ended. If you enable the detect and learn process on the Detector module, the Detector module suspends the learning process (threshold tuning) when it detects an attack on the zone. Because the Detector module cannot poll the Guard to determine when the attack is over, it is unable to automatically resume the learning process when the attack ends.
• Monitor communication with the Guard and notify you if remote actions fail, such as activating the Guard to protect the zone.
To allow the Detector module to perform these tasks, you must configure an SSL communication channel (see the “Configuring the SSL Communication Channels Parameters” section on page 4-17).
To ensure a secure SSH communication channel, the Detector module generates a private-public SSH key pair and distributes the public SSH key to the Guards listed in the remote Guard lists.
After you enable the SSH communication channel, you must establish the communication channel between the Detector module and the Guard, which you perform from the Detector module.
If you replace a Guard at one end of an SSH communication channel, then you must regenerate the SSH private (host) and public keys on the Detector module so that it can successfully authenticate itself with the new Guard.
This section contains the following topics:
• Enabling an SSH Communication Channel
• Regenerating SSH Communication Channel Keys
Enabling an SSH Communication Channel
To enable an SSH communication channel between a Guard and a Detector module, from the Guard, permit access to the SSH service by the Detector module IP address by entering the permit ssh command in configuration mode.
After you enable the SSL communication channel between the Guard and the Detector module, you can establish the communication channel between them. For information on establishing the communication channel, see the “Establishing Communication Channels” section on page 4-21 for more information.
Regenerating SSH Communication Channel Keys
If you replace a Guard that a Detector module communicates with over an SSH communication channel, then you must perform the following steps to regenerate the SSH communication channel keys:
Step 1 Delete the SSH host key from the Detector module by entering the no host-keys ip-address-general configuration mode command on the Detector module.
The ip-address-general argument specifies the IP address of the remote device.
To display the host keys listed on the Detector module, use the show host-keys command.
4-20Cisco Traffic Anomaly Detector Module Configuration Guide
OL-11857-01
Chapter 4 Configuring the DetectorEstablishing Communication with the Guard
Step 2 Configure the SSH key on the remote Guard by performing one of the following actions:
• Establish a new SSH communication channel from the Detector module (see the “Establishing Communication Channels” section on page 4-21).
• Add the Detector module public key manually to the remote Guard. You can copy the Detector module public SSH key, and paste it into the list of SSH keys that the Guard maintains.
To display the Detector module public SSH key, use the show public-key command on the Detector.
To add the Detector module public SSH key to the list of SSH keys that the Guard maintains, use the key add command on the Guard.
Establishing Communication ChannelsEstablish an SSH or SSL communication channel between the Detector and the Guard to enable the Detector to communicate directly with the Guard.
Note You must enable the communication channel on both the Detector module and the Guard before you establish the communication channel. For information about enabling a communication channel, see the “Enabling an SSL Communication Channel” section on page 4-18 or the “Enabling an SSH Communication Channel” section on page 4-20.
During the initial connection between the two devices, the Detector module exchanges the SSH keys and SSL certificates that are required to secure the communication channel. The Detector module then closes the connection and establishes the communication channel when it needs to activate the Guard, synchronize a zone configuration with the Guard (SSL communication channel only), or poll the Guard (SSL communication channel only).
Caution If the Guard is authenticating users using TACACS+ authentication, you must define the user riverhead on the TACACS+ server in order for the key publish command to function.
To establish a communication channel from the Detector module to the Guard, perform the following steps on the Detector module:
Step 1 Generate the SSH private-public key pair by entering the following command in configuration mode:
key generate
If an SSH key pair already exists, the following message appears:
/root/.ssh/id_rsa already exists.Overwrite (y/n)?
Choose the desired option by entering one of the following options:
• y—The Detector module generates a new SSH key pair.
• n—The Detector module does not generate a new SSH key pair.
4-21Cisco Traffic Anomaly Detector Module Configuration Guide
OL-11857-01
Chapter 4 Configuring the DetectorEstablishing Communication with the Guard
Step 2 Publish the public SSH key only, which is required for an SSH communication channel, or publish the public SSH key and generate and exchange the SSL certificate, which is required for an SSL communication channel. Use one of the following commands in configuration mode:
• key publish remote-guard-address {ssh | ssl}
• key publish *
Table 4-10 provides the arguments and keywords for the key publish command.
Step 3 To prevent a man-in-the-middle attack (attack in which an attacker is able to intercept and modify messages going between two victims), SSH uses host keys to verify the remote host, or Guard, authenticity. When initiating an SSH communication channel to a Guard for the first time, the Guard sends its public key to the Detector module. If this is the first connection initiated from the Detector module to the Guard, the following message appears:
The authenticity of host '<remote-hostname> (<remote-host IPaddress>)' can't be established.RSA key fingerprint is <RSA key fingerprint> Are you sure you want to continue connecting (yes/no)?
Enter yes.
The following prompt appears:
riverhead@remote-Guard-IP-address’s password:
Step 4 Enter the password configured on the Guard for the user riverhead.
The following example shows how to generate the private-public SSH key pair and establish an SSH communication channel between the Detector module and a remote Guard that has an IP address of 192.168.100.33:
user@DETECTOR-conf# key generateuser@DETECTOR-conf# key publish 192.168.100.33 ssh/root/.ssh/id_rsa already exists.Overwrite (y/n)? yThe authenticity of host '192.168.100.33 (192.168.100.33)' can't beestablished.RSA key fingerprint is
Table 4-10 Arguments and Keywords for the key publish Command
Parameter Description
remote-guard-address Remote Guard IP address.
ssh Publishes the SSH public key to the remote Guard that is defined by the remote-guard-address argument.
ssl Publishes the SSH public key and generates and exchanges an SSL certificate with the remote Guard that is defined by the remote-guard-address argument.
* Publishes the SSH key and generates and exchanges SSL certificates with all of the Guards that are configured in the remote Guard lists.
The Detector module establishes an SSH communication channel with each of the Guards in the remote Guard lists. Repeat Step 3 and Step 4 for each remote Guard.
4-22Cisco Traffic Anomaly Detector Module Configuration Guide
OL-11857-01
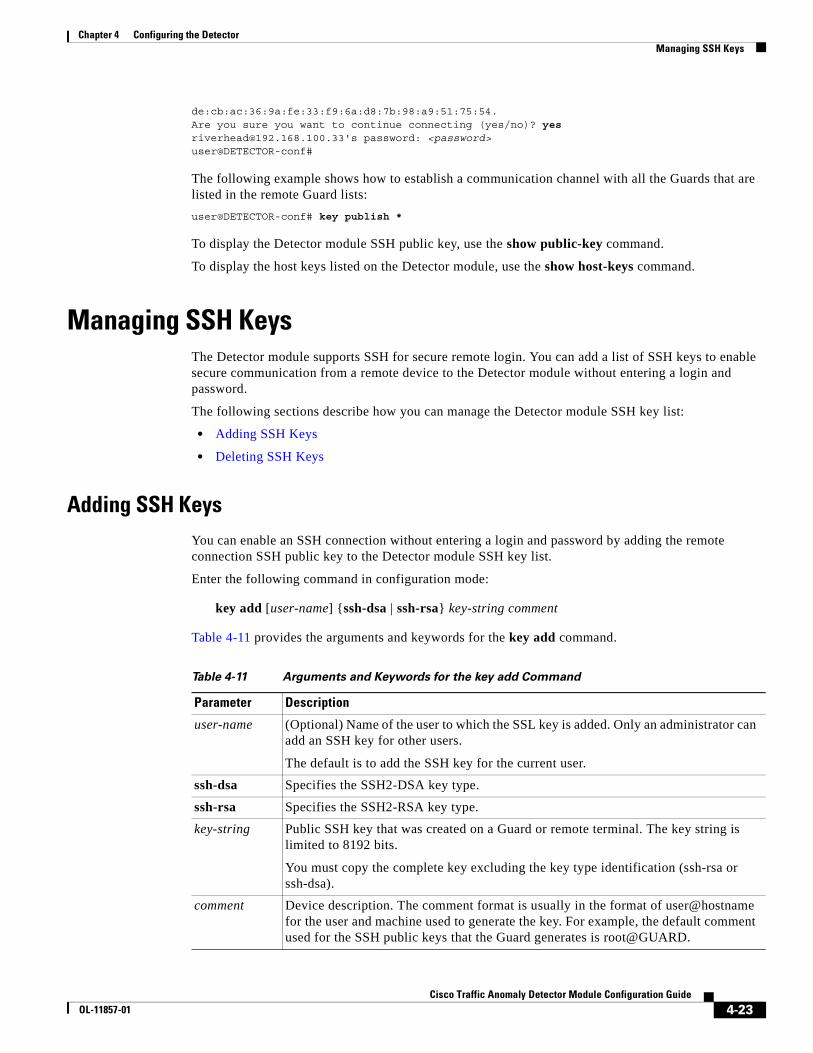
Chapter 4 Configuring the DetectorManaging SSH Keys
de:cb:ac:36:9a:fe:33:f9:6a:d8:7b:98:a9:51:75:54.Are you sure you want to continue connecting (yes/no)? [email protected]'s password: <password>user@DETECTOR-conf#
The following example shows how to establish a communication channel with all the Guards that are listed in the remote Guard lists:
user@DETECTOR-conf# key publish *
To display the Detector module SSH public key, use the show public-key command.
To display the host keys listed on the Detector module, use the show host-keys command.
Managing SSH KeysThe Detector module supports SSH for secure remote login. You can add a list of SSH keys to enable secure communication from a remote device to the Detector module without entering a login and password.
The following sections describe how you can manage the Detector module SSH key list:
• Adding SSH Keys
• Deleting SSH Keys
Adding SSH KeysYou can enable an SSH connection without entering a login and password by adding the remote connection SSH public key to the Detector module SSH key list.
Enter the following command in configuration mode:
key add [user-name] {ssh-dsa | ssh-rsa} key-string comment
Table 4-11 provides the arguments and keywords for the key add command.
Table 4-11 Arguments and Keywords for the key add Command
Parameter Description
user-name (Optional) Name of the user to which the SSL key is added. Only an administrator can add an SSH key for other users.
The default is to add the SSH key for the current user.
ssh-dsa Specifies the SSH2-DSA key type.
ssh-rsa Specifies the SSH2-RSA key type.
key-string Public SSH key that was created on a Guard or remote terminal. The key string is limited to 8192 bits.
You must copy the complete key excluding the key type identification (ssh-rsa or ssh-dsa).
comment Device description. The comment format is usually in the format of user@hostname for the user and machine used to generate the key. For example, the default comment used for the SSH public keys that the Guard generates is root@GUARD.
4-23Cisco Traffic Anomaly Detector Module Configuration Guide
OL-11857-01
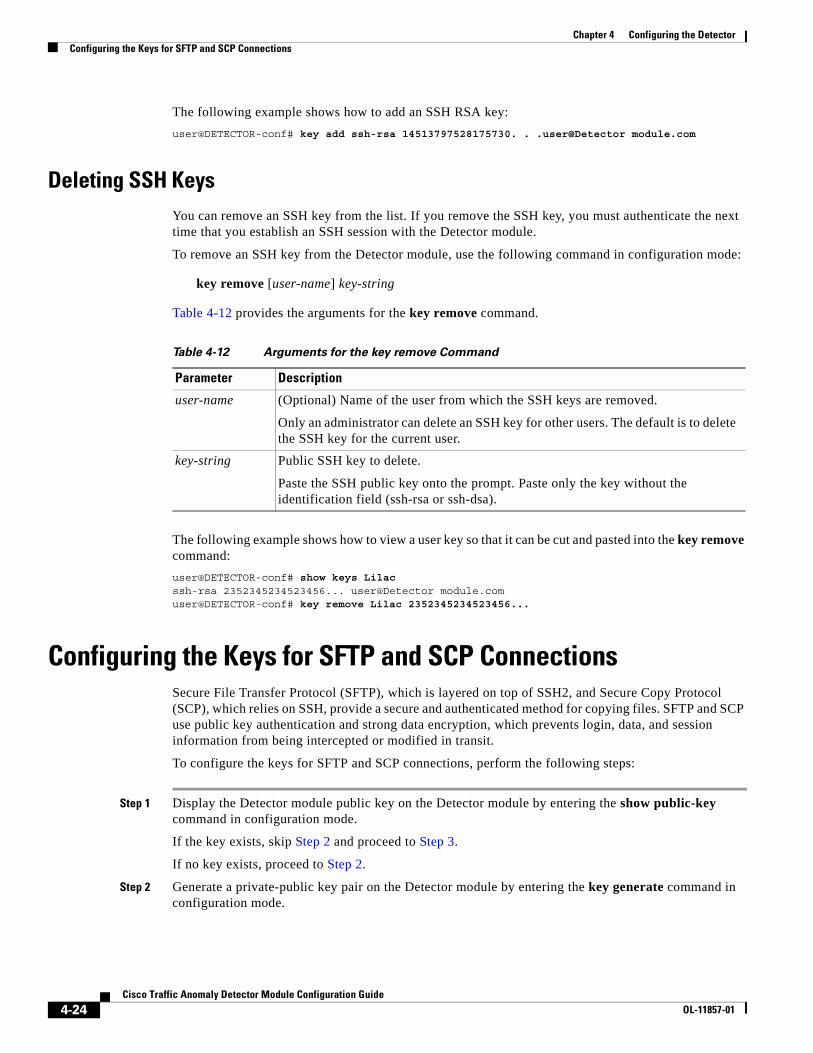
Chapter 4 Configuring the DetectorConfiguring the Keys for SFTP and SCP Connections
The following example shows how to add an SSH RSA key:
user@DETECTOR-conf# key add ssh-rsa 14513797528175730. . .user@Detector module.com
Deleting SSH Keys You can remove an SSH key from the list. If you remove the SSH key, you must authenticate the next time that you establish an SSH session with the Detector module.
To remove an SSH key from the Detector module, use the following command in configuration mode:
key remove [user-name] key-string
Table 4-12 provides the arguments for the key remove command.
The following example shows how to view a user key so that it can be cut and pasted into the key remove command:
user@DETECTOR-conf# show keys Lilacssh-rsa 2352345234523456... user@Detector module.comuser@DETECTOR-conf# key remove Lilac 2352345234523456...
Configuring the Keys for SFTP and SCP ConnectionsSecure File Transfer Protocol (SFTP), which is layered on top of SSH2, and Secure Copy Protocol (SCP), which relies on SSH, provide a secure and authenticated method for copying files. SFTP and SCP use public key authentication and strong data encryption, which prevents login, data, and session information from being intercepted or modified in transit.
To configure the keys for SFTP and SCP connections, perform the following steps:
Step 1 Display the Detector module public key on the Detector module by entering the show public-key command in configuration mode.
If the key exists, skip Step 2 and proceed to Step 3.
If no key exists, proceed to Step 2.
Step 2 Generate a private-public key pair on the Detector module by entering the key generate command in configuration mode.
Table 4-12 Arguments for the key remove Command
Parameter Description
user-name (Optional) Name of the user from which the SSH keys are removed.
Only an administrator can delete an SSH key for other users. The default is to delete the SSH key for the current user.
key-string Public SSH key to delete.
Paste the SSH public key onto the prompt. Paste only the key without the identification field (ssh-rsa or ssh-dsa).
4-24Cisco Traffic Anomaly Detector Module Configuration Guide
OL-11857-01
Chapter 4 Configuring the DetectorChanging the Hostname
Caution We recommend that you do not regenerate the private-public key pair if one already exists. Unnecessarily regenerating the key pair may cause future communication problems with remote Guards that are not currently online. If you regenerate the private-public key pair, you must publish the new public key by using the key publish command to all remote Guards that are configured in the Detector default remote Guard lists and the zone remote Guard lists.
If an SSH key pair already exists, the following message appears:
/root/.ssh/id_rsa already exists.Overwrite (y/n)?
Type y to regenerate the key.
The Detector module creates the public-private key pair. To display the Detector module public key, use the show public-key command in configuration mode.
Step 3 Copy the public key from the Detector module and paste it into the key file on the network server.
For example, if you are connecting to a network server that is installed on a Linux operating system with the username user account, add the Detector module public key to the /home/username/.ssh/authorized_keys2 file.
Make sure that the key is copied as a single line. If the key is copied as two lines, delete the new line character at the end of the first line.
Note If you do not copy the public key and paste it into the key file on the network server, you cannot configure automatic export functions (such as the export reports command) and you have to enter your password each time that you manually connect to the network server.
Changing the HostnameYou can change the hostname of the Detector module. The change takes effect immediately, and the new hostname is automatically integrated into the CLI prompt string.
To change the Detector module hostname, use the following command in configuration mode:
hostname name
The name argument specifies the new hostname.
The following example shows how to change the hostname of the Detector module:
user@DETECTOR-conf# hostname CiscoDetectoradmin@CiscoDetector-conf#
Enabling SNMP TrapsYou can enable the Detector module to send SNMP traps and notify you of significant events that occur on the Detector module. In addition, you can configure the Detector module SNMP trap generator parameters and define the scope of the SNMP trap information that the Detector module reports.
4-25Cisco Traffic Anomaly Detector Module Configuration Guide
OL-11857-01
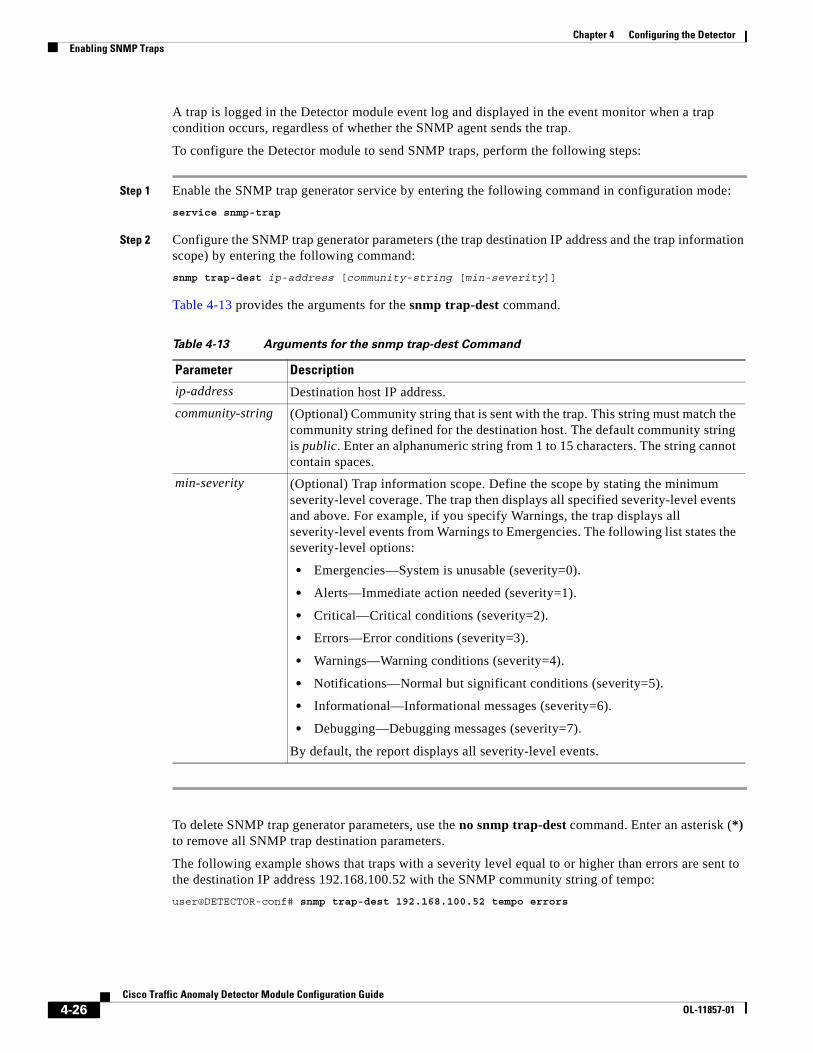
Chapter 4 Configuring the DetectorEnabling SNMP Traps
A trap is logged in the Detector module event log and displayed in the event monitor when a trap condition occurs, regardless of whether the SNMP agent sends the trap.
To configure the Detector module to send SNMP traps, perform the following steps:
Step 1 Enable the SNMP trap generator service by entering the following command in configuration mode:
service snmp-trap
Step 2 Configure the SNMP trap generator parameters (the trap destination IP address and the trap information scope) by entering the following command:
snmp trap-dest ip-address [community-string [min-severity]]
Table 4-13 provides the arguments for the snmp trap-dest command.
To delete SNMP trap generator parameters, use the no snmp trap-dest command. Enter an asterisk (*) to remove all SNMP trap destination parameters.
The following example shows that traps with a severity level equal to or higher than errors are sent to the destination IP address 192.168.100.52 with the SNMP community string of tempo:
user@DETECTOR-conf# snmp trap-dest 192.168.100.52 tempo errors
Table 4-13 Arguments for the snmp trap-dest Command
Parameter Description
ip-address Destination host IP address.
community-string (Optional) Community string that is sent with the trap. This string must match the community string defined for the destination host. The default community string is public. Enter an alphanumeric string from 1 to 15 characters. The string cannot contain spaces.
min-severity (Optional) Trap information scope. Define the scope by stating the minimum severity-level coverage. The trap then displays all specified severity-level events and above. For example, if you specify Warnings, the trap displays all severity-level events from Warnings to Emergencies. The following list states the severity-level options:
• Emergencies—System is unusable (severity=0).
• Alerts—Immediate action needed (severity=1).
• Critical—Critical conditions (severity=2).
• Errors—Error conditions (severity=3).
• Warnings—Warning conditions (severity=4).
• Notifications—Normal but significant conditions (severity=5).
• Informational—Informational messages (severity=6).
• Debugging—Debugging messages (severity=7).
By default, the report displays all severity-level events.
4-26Cisco Traffic Anomaly Detector Module Configuration Guide
OL-11857-01
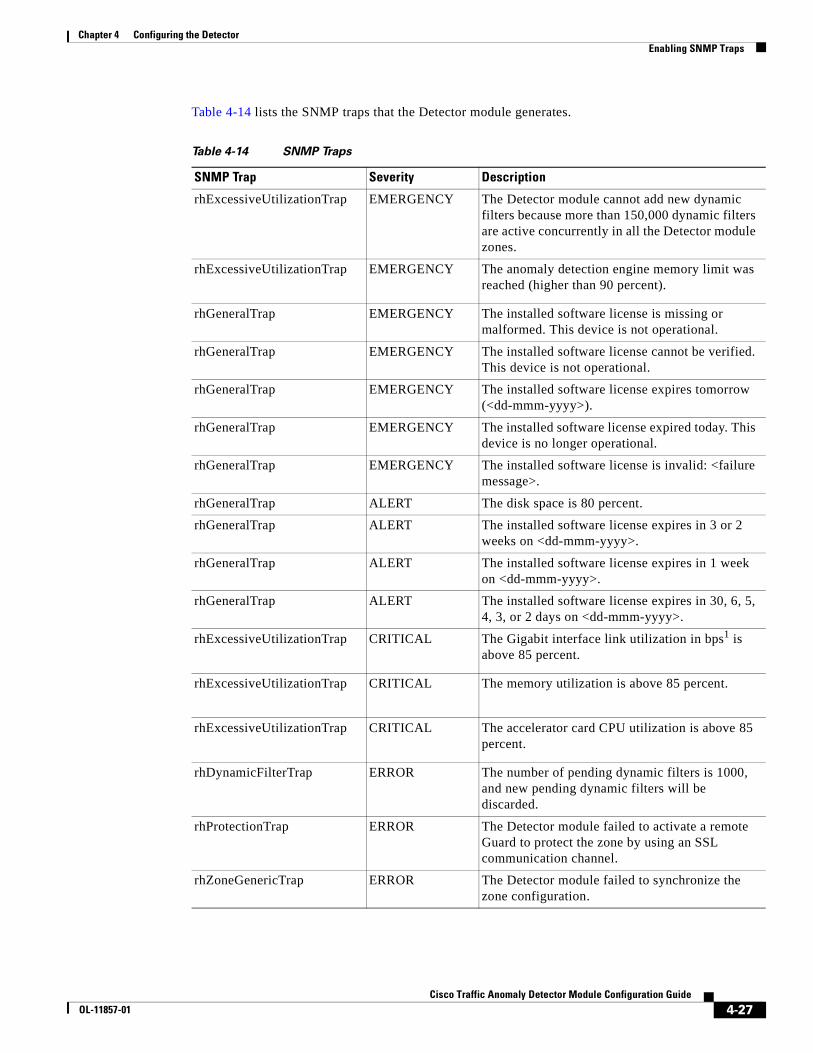
Chapter 4 Configuring the DetectorEnabling SNMP Traps
Table 4-14 lists the SNMP traps that the Detector module generates.
Table 4-14 SNMP Traps
SNMP Trap Severity Description
rhExcessiveUtilizationTrap EMERGENCY The Detector module cannot add new dynamic filters because more than 150,000 dynamic filters are active concurrently in all the Detector module zones.
rhExcessiveUtilizationTrap EMERGENCY The anomaly detection engine memory limit was reached (higher than 90 percent).
rhGeneralTrap EMERGENCY The installed software license is missing or malformed. This device is not operational.
rhGeneralTrap EMERGENCY The installed software license cannot be verified. This device is not operational.
rhGeneralTrap EMERGENCY The installed software license expires tomorrow (<dd-mmm-yyyy>).
rhGeneralTrap EMERGENCY The installed software license expired today. This device is no longer operational.
rhGeneralTrap EMERGENCY The installed software license is invalid: <failure message>.
rhGeneralTrap ALERT The disk space is 80 percent.
rhGeneralTrap ALERT The installed software license expires in 3 or 2 weeks on <dd-mmm-yyyy>.
rhGeneralTrap ALERT The installed software license expires in 1 week on <dd-mmm-yyyy>.
rhGeneralTrap ALERT The installed software license expires in 30, 6, 5, 4, 3, or 2 days on <dd-mmm-yyyy>.
rhExcessiveUtilizationTrap CRITICAL The Gigabit interface link utilization in bps1 is above 85 percent.
rhExcessiveUtilizationTrap CRITICAL The memory utilization is above 85 percent.
rhExcessiveUtilizationTrap CRITICAL The accelerator card CPU utilization is above 85 percent.
rhDynamicFilterTrap ERROR The number of pending dynamic filters is 1000, and new pending dynamic filters will be discarded.
rhProtectionTrap ERROR The Detector module failed to activate a remote Guard to protect the zone by using an SSL communication channel.
rhZoneGenericTrap ERROR The Detector module failed to synchronize the zone configuration.
4-27Cisco Traffic Anomaly Detector Module Configuration Guide
OL-11857-01
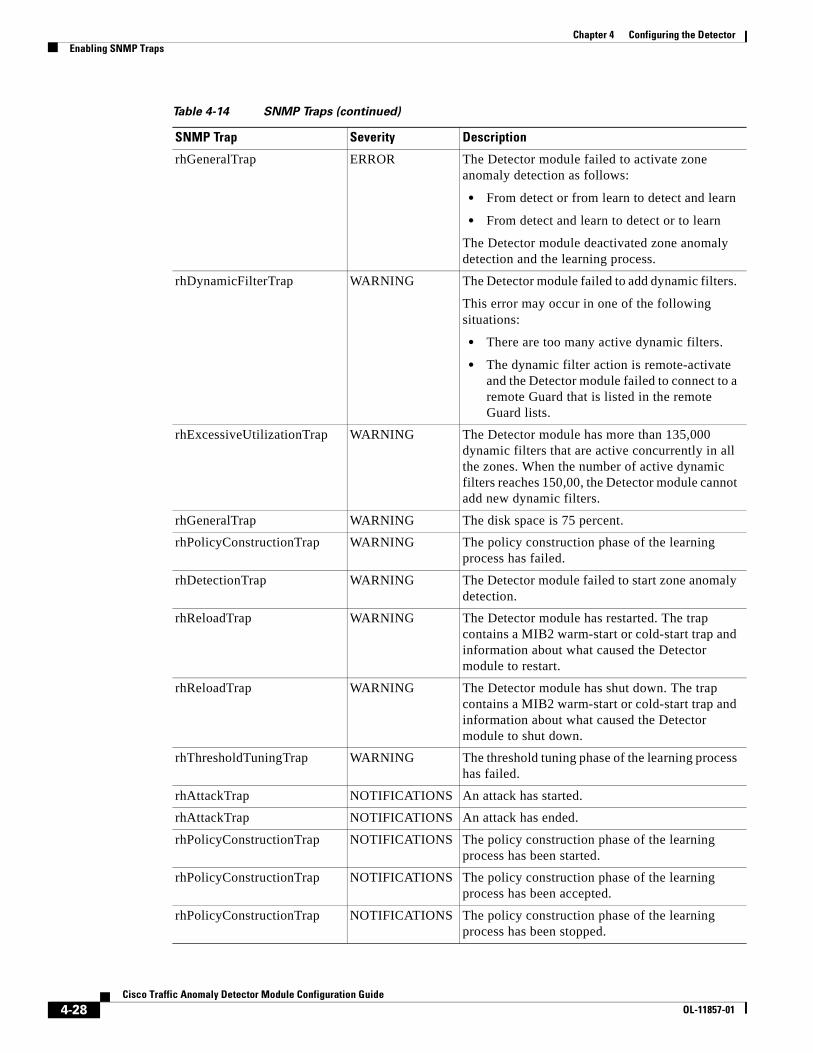
Chapter 4 Configuring the DetectorEnabling SNMP Traps
rhGeneralTrap ERROR The Detector module failed to activate zone anomaly detection as follows:
• From detect or from learn to detect and learn
• From detect and learn to detect or to learn
The Detector module deactivated zone anomaly detection and the learning process.
rhDynamicFilterTrap WARNING The Detector module failed to add dynamic filters.
This error may occur in one of the following situations:
• There are too many active dynamic filters.
• The dynamic filter action is remote-activate and the Detector module failed to connect to a remote Guard that is listed in the remote Guard lists.
rhExcessiveUtilizationTrap WARNING The Detector module has more than 135,000 dynamic filters that are active concurrently in all the zones. When the number of active dynamic filters reaches 150,00, the Detector module cannot add new dynamic filters.
rhGeneralTrap WARNING The disk space is 75 percent.
rhPolicyConstructionTrap WARNING The policy construction phase of the learning process has failed.
rhDetectionTrap WARNING The Detector module failed to start zone anomaly detection.
rhReloadTrap WARNING The Detector module has restarted. The trap contains a MIB2 warm-start or cold-start trap and information about what caused the Detector module to restart.
rhReloadTrap WARNING The Detector module has shut down. The trap contains a MIB2 warm-start or cold-start trap and information about what caused the Detector module to shut down.
rhThresholdTuningTrap WARNING The threshold tuning phase of the learning process has failed.
rhAttackTrap NOTIFICATIONS An attack has started.
rhAttackTrap NOTIFICATIONS An attack has ended.
rhPolicyConstructionTrap NOTIFICATIONS The policy construction phase of the learning process has been started.
rhPolicyConstructionTrap NOTIFICATIONS The policy construction phase of the learning process has been accepted.
rhPolicyConstructionTrap NOTIFICATIONS The policy construction phase of the learning process has been stopped.
Table 4-14 SNMP Traps (continued)
SNMP Trap Severity Description
4-28Cisco Traffic Anomaly Detector Module Configuration Guide
OL-11857-01
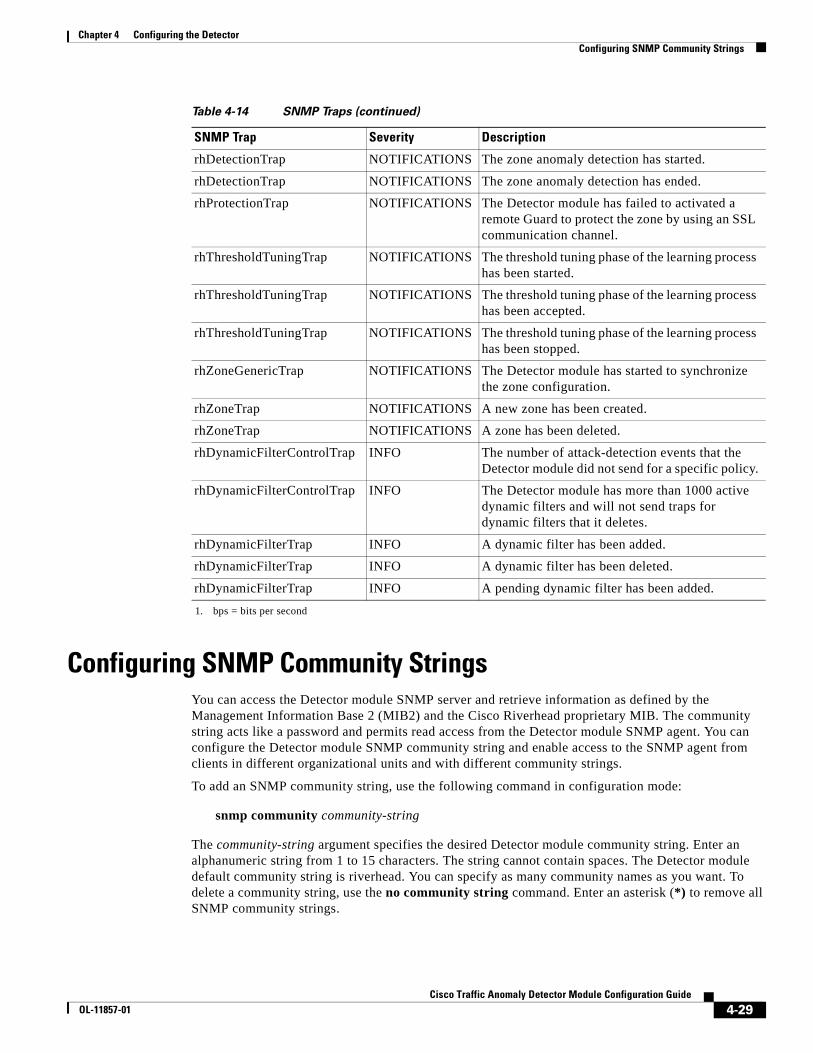
Chapter 4 Configuring the DetectorConfiguring SNMP Community Strings
Configuring SNMP Community StringsYou can access the Detector module SNMP server and retrieve information as defined by the Management Information Base 2 (MIB2) and the Cisco Riverhead proprietary MIB. The community string acts like a password and permits read access from the Detector module SNMP agent. You can configure the Detector module SNMP community string and enable access to the SNMP agent from clients in different organizational units and with different community strings.
To add an SNMP community string, use the following command in configuration mode:
snmp community community-string
The community-string argument specifies the desired Detector module community string. Enter an alphanumeric string from 1 to 15 characters. The string cannot contain spaces. The Detector module default community string is riverhead. You can specify as many community names as you want. To delete a community string, use the no community string command. Enter an asterisk (*) to remove all SNMP community strings.
rhDetectionTrap NOTIFICATIONS The zone anomaly detection has started.
rhDetectionTrap NOTIFICATIONS The zone anomaly detection has ended.
rhProtectionTrap NOTIFICATIONS The Detector module has failed to activated a remote Guard to protect the zone by using an SSL communication channel.
rhThresholdTuningTrap NOTIFICATIONS The threshold tuning phase of the learning process has been started.
rhThresholdTuningTrap NOTIFICATIONS The threshold tuning phase of the learning process has been accepted.
rhThresholdTuningTrap NOTIFICATIONS The threshold tuning phase of the learning process has been stopped.
rhZoneGenericTrap NOTIFICATIONS The Detector module has started to synchronize the zone configuration.
rhZoneTrap NOTIFICATIONS A new zone has been created.
rhZoneTrap NOTIFICATIONS A zone has been deleted.
rhDynamicFilterControlTrap INFO The number of attack-detection events that the Detector module did not send for a specific policy.
rhDynamicFilterControlTrap INFO The Detector module has more than 1000 active dynamic filters and will not send traps for dynamic filters that it deletes.
rhDynamicFilterTrap INFO A dynamic filter has been added.
rhDynamicFilterTrap INFO A dynamic filter has been deleted.
rhDynamicFilterTrap INFO A pending dynamic filter has been added.
1. bps = bits per second
Table 4-14 SNMP Traps (continued)
SNMP Trap Severity Description
4-29Cisco Traffic Anomaly Detector Module Configuration Guide
OL-11857-01
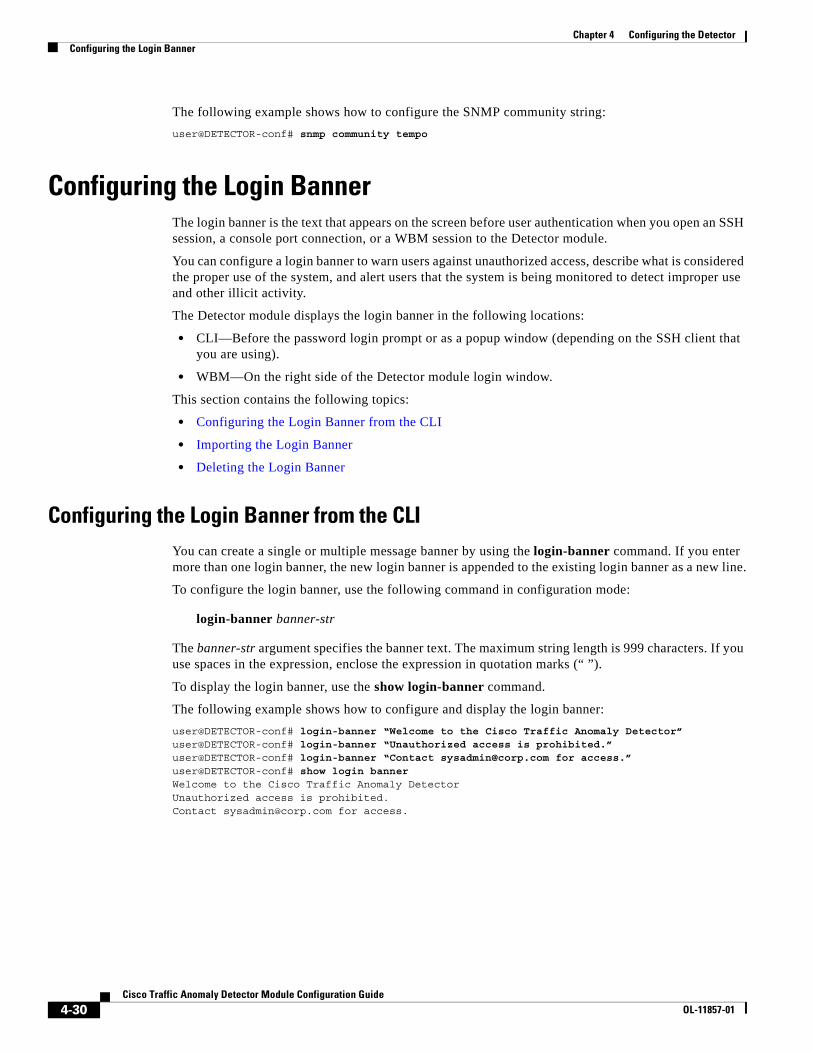
Chapter 4 Configuring the DetectorConfiguring the Login Banner
The following example shows how to configure the SNMP community string:
user@DETECTOR-conf# snmp community tempo
Configuring the Login BannerThe login banner is the text that appears on the screen before user authentication when you open an SSH session, a console port connection, or a WBM session to the Detector module.
You can configure a login banner to warn users against unauthorized access, describe what is considered the proper use of the system, and alert users that the system is being monitored to detect improper use and other illicit activity.
The Detector module displays the login banner in the following locations:
• CLI—Before the password login prompt or as a popup window (depending on the SSH client that you are using).
• WBM—On the right side of the Detector module login window.
This section contains the following topics:
• Configuring the Login Banner from the CLI
• Importing the Login Banner
• Deleting the Login Banner
Configuring the Login Banner from the CLIYou can create a single or multiple message banner by using the login-banner command. If you enter more than one login banner, the new login banner is appended to the existing login banner as a new line.
To configure the login banner, use the following command in configuration mode:
login-banner banner-str
The banner-str argument specifies the banner text. The maximum string length is 999 characters. If you use spaces in the expression, enclose the expression in quotation marks (“ ”).
To display the login banner, use the show login-banner command.
The following example shows how to configure and display the login banner:
user@DETECTOR-conf# login-banner “Welcome to the Cisco Traffic Anomaly Detector”user@DETECTOR-conf# login-banner “Unauthorized access is prohibited.”user@DETECTOR-conf# login-banner “Contact [email protected] for access.”user@DETECTOR-conf# show login bannerWelcome to the Cisco Traffic Anomaly DetectorUnauthorized access is prohibited.Contact [email protected] for access.
4-30Cisco Traffic Anomaly Detector Module Configuration Guide
OL-11857-01
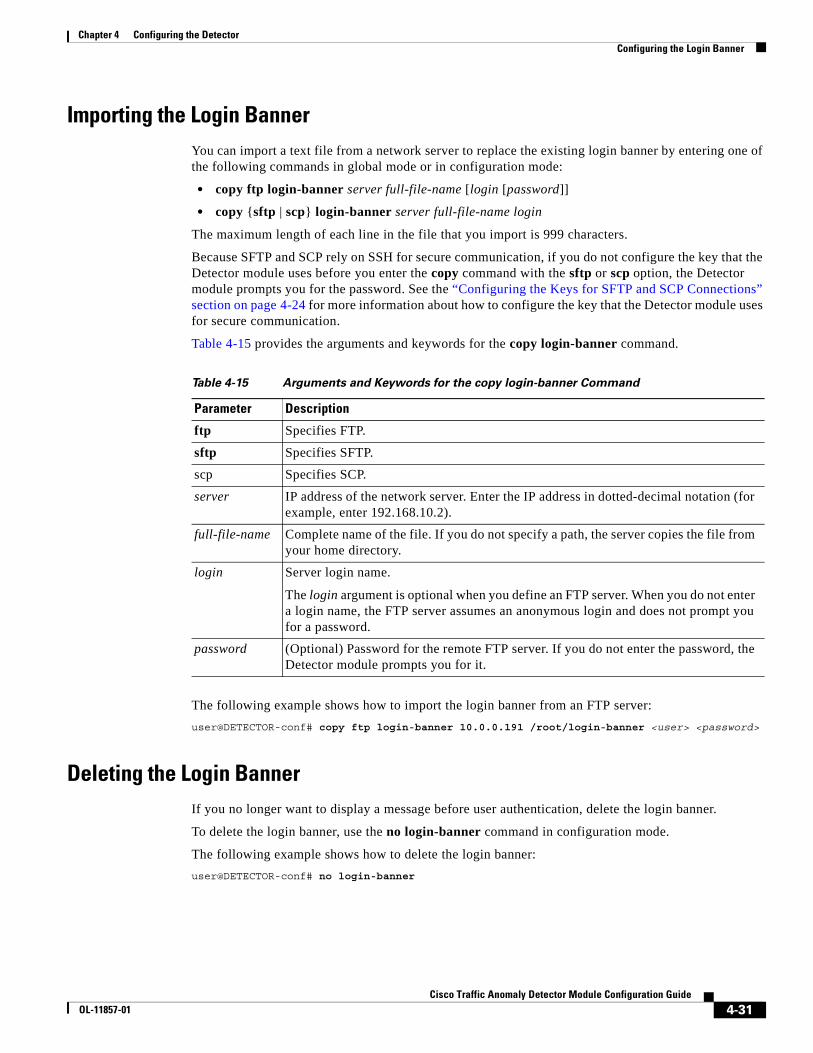
Chapter 4 Configuring the DetectorConfiguring the Login Banner
Importing the Login BannerYou can import a text file from a network server to replace the existing login banner by entering one of the following commands in global mode or in configuration mode:
• copy ftp login-banner server full-file-name [login [password]]
• copy {sftp | scp} login-banner server full-file-name login
The maximum length of each line in the file that you import is 999 characters.
Because SFTP and SCP rely on SSH for secure communication, if you do not configure the key that the Detector module uses before you enter the copy command with the sftp or scp option, the Detector module prompts you for the password. See the “Configuring the Keys for SFTP and SCP Connections” section on page 4-24 for more information about how to configure the key that the Detector module uses for secure communication.
Table 4-15 provides the arguments and keywords for the copy login-banner command.
The following example shows how to import the login banner from an FTP server:
user@DETECTOR-conf# copy ftp login-banner 10.0.0.191 /root/login-banner <user> <password>
Deleting the Login BannerIf you no longer want to display a message before user authentication, delete the login banner.
To delete the login banner, use the no login-banner command in configuration mode.
The following example shows how to delete the login banner:
user@DETECTOR-conf# no login-banner
Table 4-15 Arguments and Keywords for the copy login-banner Command
Parameter Description
ftp Specifies FTP.
sftp Specifies SFTP.
scp Specifies SCP.
server IP address of the network server. Enter the IP address in dotted-decimal notation (for example, enter 192.168.10.2).
full-file-name Complete name of the file. If you do not specify a path, the server copies the file from your home directory.
login Server login name.
The login argument is optional when you define an FTP server. When you do not enter a login name, the FTP server assumes an anonymous login and does not prompt you for a password.
password (Optional) Password for the remote FTP server. If you do not enter the password, the Detector module prompts you for it.
4-31Cisco Traffic Anomaly Detector Module Configuration Guide
OL-11857-01
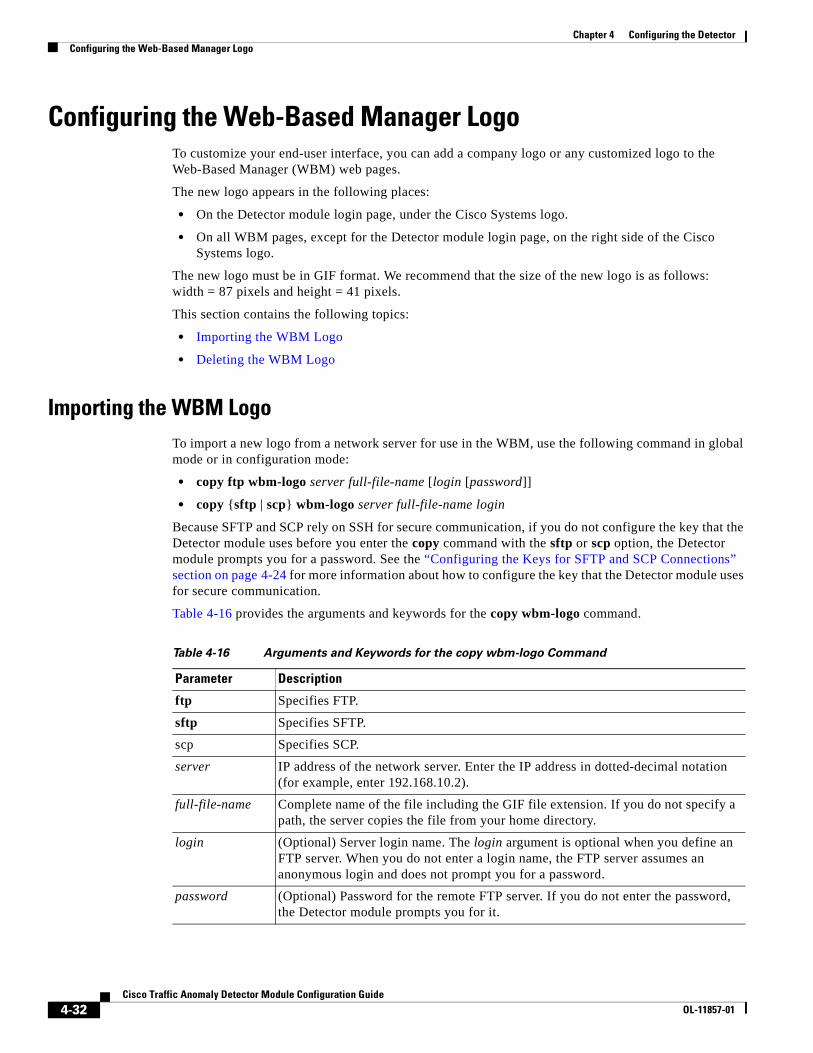
Chapter 4 Configuring the DetectorConfiguring the Web-Based Manager Logo
Configuring the Web-Based Manager LogoTo customize your end-user interface, you can add a company logo or any customized logo to the Web-Based Manager (WBM) web pages.
The new logo appears in the following places:
• On the Detector module login page, under the Cisco Systems logo.
• On all WBM pages, except for the Detector module login page, on the right side of the Cisco Systems logo.
The new logo must be in GIF format. We recommend that the size of the new logo is as follows: width = 87 pixels and height = 41 pixels.
This section contains the following topics:
• Importing the WBM Logo
• Deleting the WBM Logo
Importing the WBM LogoTo import a new logo from a network server for use in the WBM, use the following command in global mode or in configuration mode:
• copy ftp wbm-logo server full-file-name [login [password]]
• copy {sftp | scp} wbm-logo server full-file-name login
Because SFTP and SCP rely on SSH for secure communication, if you do not configure the key that the Detector module uses before you enter the copy command with the sftp or scp option, the Detector module prompts you for a password. See the “Configuring the Keys for SFTP and SCP Connections” section on page 4-24 for more information about how to configure the key that the Detector module uses for secure communication.
Table 4-16 provides the arguments and keywords for the copy wbm-logo command.
Table 4-16 Arguments and Keywords for the copy wbm-logo Command
Parameter Description
ftp Specifies FTP.
sftp Specifies SFTP.
scp Specifies SCP.
server IP address of the network server. Enter the IP address in dotted-decimal notation (for example, enter 192.168.10.2).
full-file-name Complete name of the file including the GIF file extension. If you do not specify a path, the server copies the file from your home directory.
login (Optional) Server login name. The login argument is optional when you define an FTP server. When you do not enter a login name, the FTP server assumes an anonymous login and does not prompt you for a password.
password (Optional) Password for the remote FTP server. If you do not enter the password, the Detector module prompts you for it.
4-32Cisco Traffic Anomaly Detector Module Configuration Guide
OL-11857-01
Chapter 4 Configuring the DetectorConfiguring the Session Timeout
The following example shows how to import the WBM logo file from an FTP server:
user@DETECTOR-conf# copy ftp wbm-logo 10.0.0.191 /root/WBMlogo.gif <user> <password>
Deleting the WBM LogoTo delete the WBM logo, use the no wbm-logo command in configuration mode.
The following example shows how to delete the login banner:
user@DETECTOR-conf# no wbm-logo
Configuring the Session TimeoutThe session timeout is the amount of time that a session remains active when there is no activity. If there is no activity for the configured time, a timeout occurs, and then you must log in again. The session timeout is disabled by default.
The session timeout applies to the CLI only and does not apply to the WBM.
You can configure the number of minutes until the Detector module disconnects an idle session automatically by entering the following command in configuration mode:
session-timeout timeout-val
The timeout-val argument specifies the number of minutes until the Detector module disconnects an idle session automatically. Valid values are from 1 to 1440 minutes (one day).
The following example shows how to configure the Detector module to disconnect an idle session after 10 minutes:
user@DETECTOR-conf# session-timeout 10
To prevent the Detector module from disconnecting idle sessions automatically, use the no session-timeout command.
To display the value of the session timeout, use the show session-timeout command.
4-33Cisco Traffic Anomaly Detector Module Configuration Guide
OL-11857-01

Chapter 4 Configuring the DetectorConfiguring the Session Timeout
4-34Cisco Traffic Anomaly Detector Module Configuration Guide
OL-11857-01
Cisco TraOL-11857-01
C H A P T E R 5
Configuring ZonesThis chapter describes how to create and manage zones on the Cisco Traffic Anomaly Detector (Detector module).
This chapter refers to the Cisco Guard (Guard), the companion product of the Detector module. The Guard is a Distributed Denial of Service (DDoS) attack detection and mitigation device that cleans the zone traffic as the traffic flows through it, dropping the attack traffic and injecting the legitimate traffic back into the network. When the Detector module determines that the zone is under attack, it can activate the Guard attack mitigation services. The Detector module can also synchronize zone configurations with the Guard. For more information about the Guard, see the Cisco Anomaly Guard Module Configuration Guide or the Cisco Guard Configuration Guide.
This chapter contains the following sections:
• Understanding Zones
• Using Zone Templates
• Creating a New Zone
• Configuring Zone Attributes
• Configuring the Zone IP Address Range
• Synchronizing Zone Configurations with a Guard
Understanding ZonesA zone is a network element that the Detector module monitors for DDoS attacks. A zone can be any combination of the following elements:
• A network server, client, or router
• A network link or subnet or an entire network
• An individual Internet user or a company
• An Internet Service Provider (ISP)
When the Detector module identifies a DDoS attack, it can activate a Guard automatically to protect the zone against the attack, or it can notify you to activate the Guard manually. The Detector module can analyze the traffic for different zones simultaneously providing their network address ranges do not overlap.
5-1ffic Anomaly Detector Module Configuration Guide
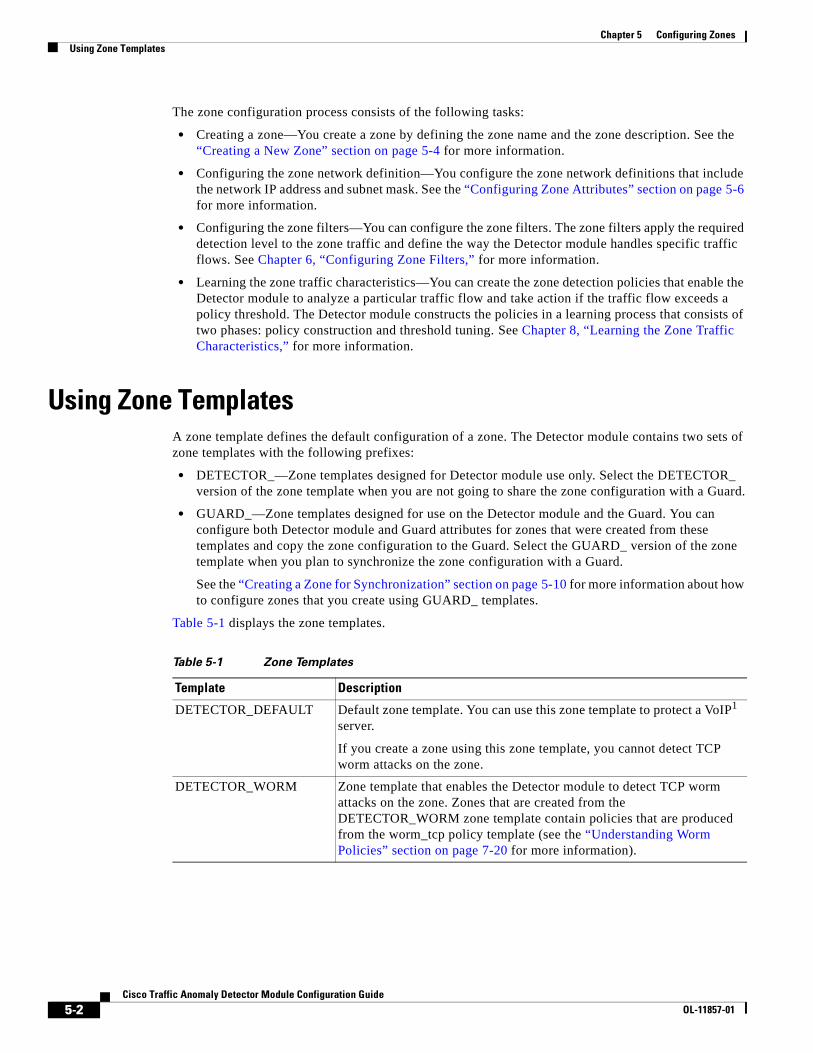
Chapter 5 Configuring ZonesUsing Zone Templates
The zone configuration process consists of the following tasks:
• Creating a zone—You create a zone by defining the zone name and the zone description. See the “Creating a New Zone” section on page 5-4 for more information.
• Configuring the zone network definition—You configure the zone network definitions that include the network IP address and subnet mask. See the “Configuring Zone Attributes” section on page 5-6 for more information.
• Configuring the zone filters—You can configure the zone filters. The zone filters apply the required detection level to the zone traffic and define the way the Detector module handles specific traffic flows. See Chapter 6, “Configuring Zone Filters,” for more information.
• Learning the zone traffic characteristics—You can create the zone detection policies that enable the Detector module to analyze a particular traffic flow and take action if the traffic flow exceeds a policy threshold. The Detector module constructs the policies in a learning process that consists of two phases: policy construction and threshold tuning. See Chapter 8, “Learning the Zone Traffic Characteristics,” for more information.
Using Zone TemplatesA zone template defines the default configuration of a zone. The Detector module contains two sets of zone templates with the following prefixes:
• DETECTOR_—Zone templates designed for Detector module use only. Select the DETECTOR_ version of the zone template when you are not going to share the zone configuration with a Guard.
• GUARD_—Zone templates designed for use on the Detector module and the Guard. You can configure both Detector module and Guard attributes for zones that were created from these templates and copy the zone configuration to the Guard. Select the GUARD_ version of the zone template when you plan to synchronize the zone configuration with a Guard.
See the “Creating a Zone for Synchronization” section on page 5-10 for more information about how to configure zones that you create using GUARD_ templates.
Table 5-1 displays the zone templates.
Table 5-1 Zone Templates
Template Description
DETECTOR_DEFAULT Default zone template. You can use this zone template to protect a VoIP1 server.
If you create a zone using this zone template, you cannot detect TCP worm attacks on the zone.
DETECTOR_WORM Zone template that enables the Detector module to detect TCP worm attacks on the zone. Zones that are created from the DETECTOR_WORM zone template contain policies that are produced from the worm_tcp policy template (see the “Understanding Worm Policies” section on page 7-20 for more information).
5-2Cisco Traffic Anomaly Detector Module Configuration Guide
OL-11857-01
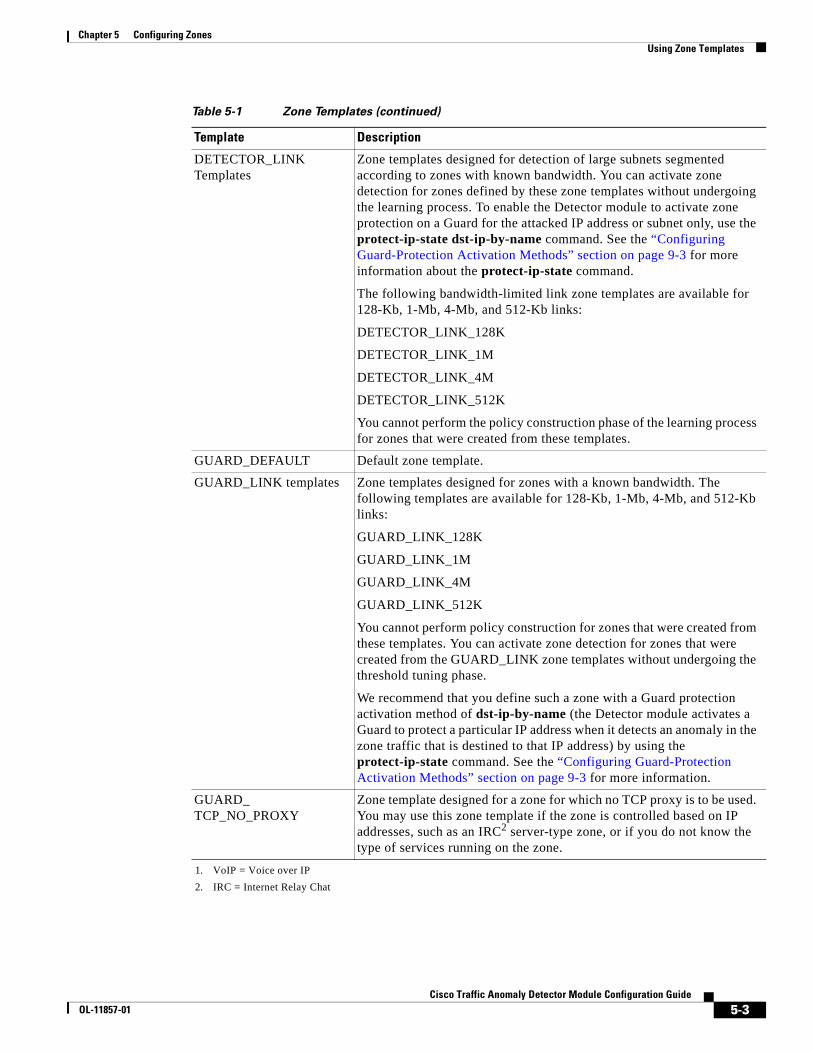
Chapter 5 Configuring ZonesUsing Zone Templates
DETECTOR_LINK Templates
Zone templates designed for detection of large subnets segmented according to zones with known bandwidth. You can activate zone detection for zones defined by these zone templates without undergoing the learning process. To enable the Detector module to activate zone protection on a Guard for the attacked IP address or subnet only, use the protect-ip-state dst-ip-by-name command. See the “Configuring Guard-Protection Activation Methods” section on page 9-3 for more information about the protect-ip-state command.
The following bandwidth-limited link zone templates are available for 128-Kb, 1-Mb, 4-Mb, and 512-Kb links:
DETECTOR_LINK_128K
DETECTOR_LINK_1M
DETECTOR_LINK_4M
DETECTOR_LINK_512K
You cannot perform the policy construction phase of the learning process for zones that were created from these templates.
GUARD_DEFAULT Default zone template.
GUARD_LINK templates Zone templates designed for zones with a known bandwidth. The following templates are available for 128-Kb, 1-Mb, 4-Mb, and 512-Kb links:
GUARD_LINK_128K
GUARD_LINK_1M
GUARD_LINK_4M
GUARD_LINK_512K
You cannot perform policy construction for zones that were created from these templates. You can activate zone detection for zones that were created from the GUARD_LINK zone templates without undergoing the threshold tuning phase.
We recommend that you define such a zone with a Guard protection activation method of dst-ip-by-name (the Detector module activates a Guard to protect a particular IP address when it detects an anomaly in the zone traffic that is destined to that IP address) by using the protect-ip-state command. See the “Configuring Guard-Protection Activation Methods” section on page 9-3 for more information.
GUARD_ TCP_NO_PROXY
Zone template designed for a zone for which no TCP proxy is to be used. You may use this zone template if the zone is controlled based on IP addresses, such as an IRC2 server-type zone, or if you do not know the type of services running on the zone.
1. VoIP = Voice over IP
2. IRC = Internet Relay Chat
Table 5-1 Zone Templates (continued)
Template Description
5-3Cisco Traffic Anomaly Detector Module Configuration Guide
OL-11857-01
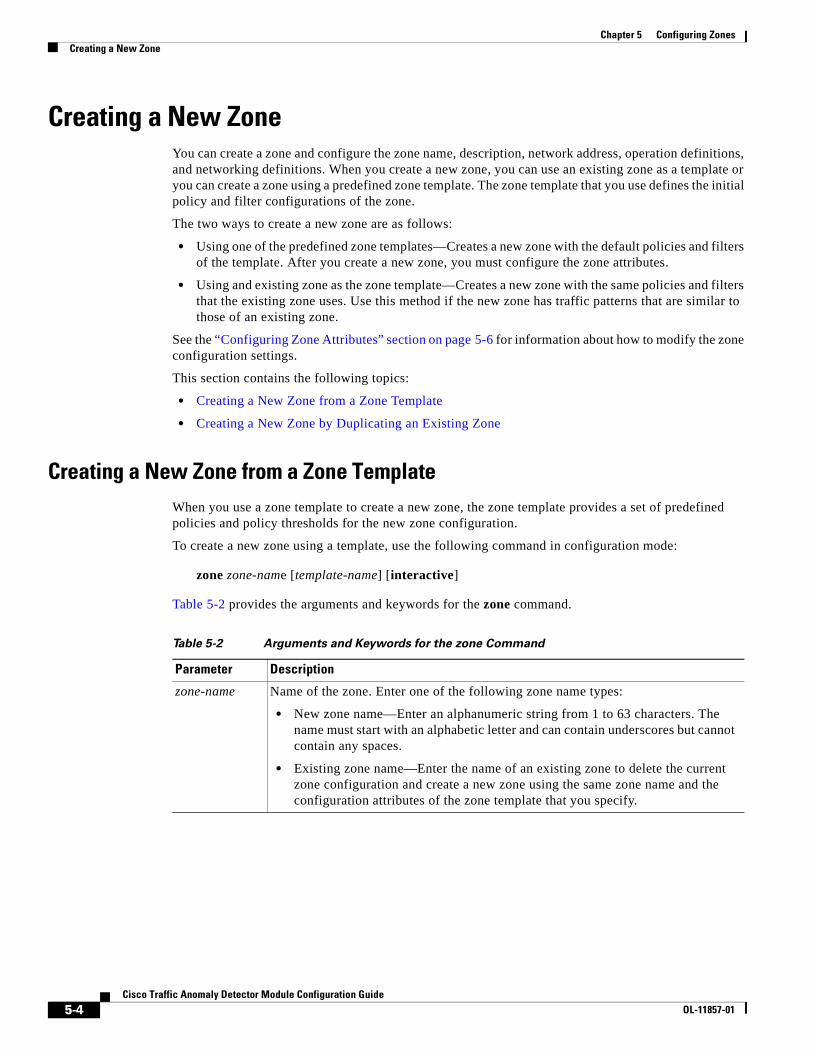
Chapter 5 Configuring ZonesCreating a New Zone
Creating a New ZoneYou can create a zone and configure the zone name, description, network address, operation definitions, and networking definitions. When you create a new zone, you can use an existing zone as a template or you can create a zone using a predefined zone template. The zone template that you use defines the initial policy and filter configurations of the zone.
The two ways to create a new zone are as follows:
• Using one of the predefined zone templates—Creates a new zone with the default policies and filters of the template. After you create a new zone, you must configure the zone attributes.
• Using and existing zone as the zone template—Creates a new zone with the same policies and filters that the existing zone uses. Use this method if the new zone has traffic patterns that are similar to those of an existing zone.
See the “Configuring Zone Attributes” section on page 5-6 for information about how to modify the zone configuration settings.
This section contains the following topics:
• Creating a New Zone from a Zone Template
• Creating a New Zone by Duplicating an Existing Zone
Creating a New Zone from a Zone TemplateWhen you use a zone template to create a new zone, the zone template provides a set of predefined policies and policy thresholds for the new zone configuration.
To create a new zone using a template, use the following command in configuration mode:
zone zone-name [template-name] [interactive]
Table 5-2 provides the arguments and keywords for the zone command.
Table 5-2 Arguments and Keywords for the zone Command
Parameter Description
zone-name Name of the zone. Enter one of the following zone name types:
• New zone name—Enter an alphanumeric string from 1 to 63 characters. The name must start with an alphabetic letter and can contain underscores but cannot contain any spaces.
• Existing zone name—Enter the name of an existing zone to delete the current zone configuration and create a new zone using the same zone name and the configuration attributes of the zone template that you specify.
5-4Cisco Traffic Anomaly Detector Module Configuration Guide
OL-11857-01
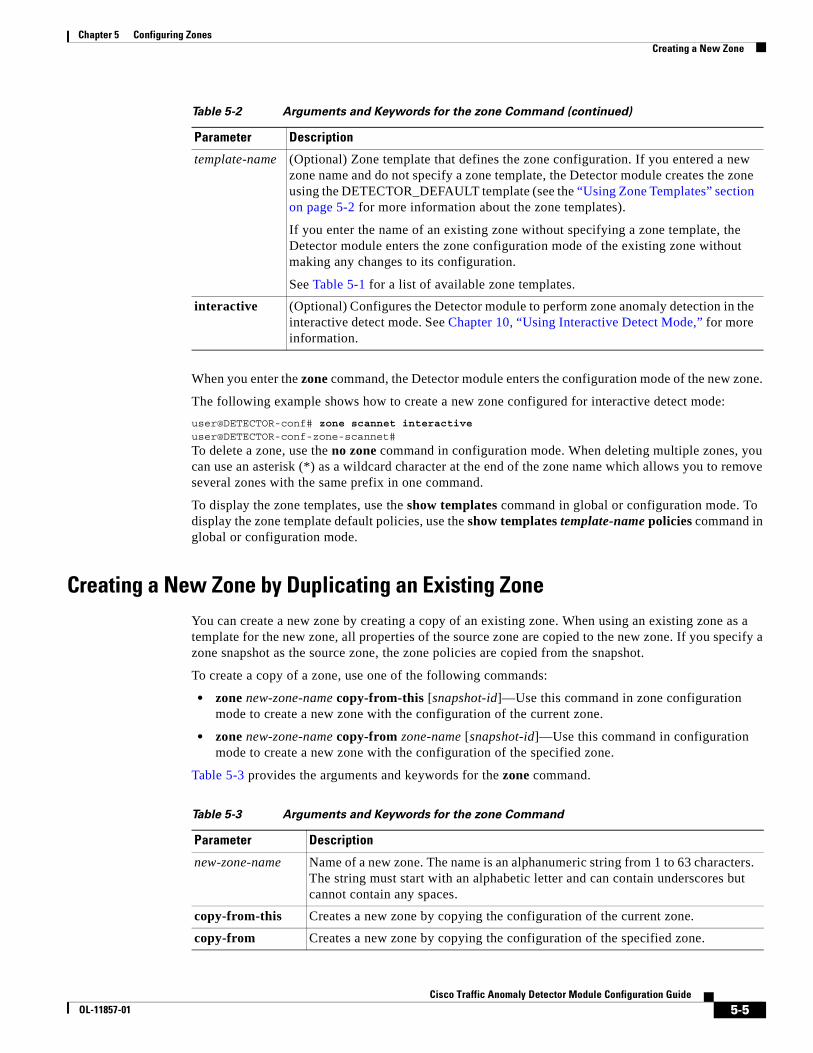
Chapter 5 Configuring ZonesCreating a New Zone
When you enter the zone command, the Detector module enters the configuration mode of the new zone.
The following example shows how to create a new zone configured for interactive detect mode:
user@DETECTOR-conf# zone scannet interactive user@DETECTOR-conf-zone-scannet#
To delete a zone, use the no zone command in configuration mode. When deleting multiple zones, you can use an asterisk (*) as a wildcard character at the end of the zone name which allows you to remove several zones with the same prefix in one command.
To display the zone templates, use the show templates command in global or configuration mode. To display the zone template default policies, use the show templates template-name policies command in global or configuration mode.
Creating a New Zone by Duplicating an Existing ZoneYou can create a new zone by creating a copy of an existing zone. When using an existing zone as a template for the new zone, all properties of the source zone are copied to the new zone. If you specify a zone snapshot as the source zone, the zone policies are copied from the snapshot.
To create a copy of a zone, use one of the following commands:
• zone new-zone-name copy-from-this [snapshot-id]—Use this command in zone configuration mode to create a new zone with the configuration of the current zone.
• zone new-zone-name copy-from zone-name [snapshot-id]—Use this command in configuration mode to create a new zone with the configuration of the specified zone.
Table 5-3 provides the arguments and keywords for the zone command.
template-name (Optional) Zone template that defines the zone configuration. If you entered a new zone name and do not specify a zone template, the Detector module creates the zone using the DETECTOR_DEFAULT template (see the “Using Zone Templates” section on page 5-2 for more information about the zone templates).
If you enter the name of an existing zone without specifying a zone template, the Detector module enters the zone configuration mode of the existing zone without making any changes to its configuration.
See Table 5-1 for a list of available zone templates.
interactive (Optional) Configures the Detector module to perform zone anomaly detection in the interactive detect mode. See Chapter 10, “Using Interactive Detect Mode,” for more information.
Table 5-2 Arguments and Keywords for the zone Command (continued)
Parameter Description
Table 5-3 Arguments and Keywords for the zone Command
Parameter Description
new-zone-name Name of a new zone. The name is an alphanumeric string from 1 to 63 characters. The string must start with an alphabetic letter and can contain underscores but cannot contain any spaces.
copy-from-this Creates a new zone by copying the configuration of the current zone.
copy-from Creates a new zone by copying the configuration of the specified zone.
5-5Cisco Traffic Anomaly Detector Module Configuration Guide
OL-11857-01
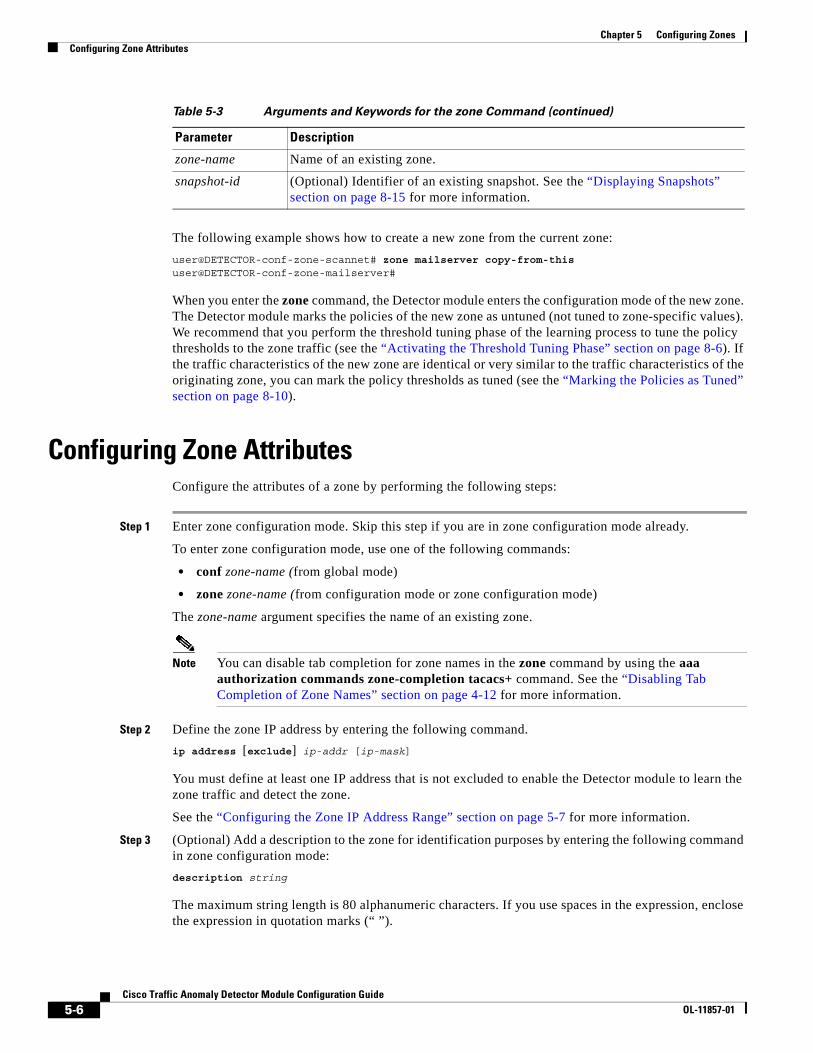
Chapter 5 Configuring ZonesConfiguring Zone Attributes
The following example shows how to create a new zone from the current zone:
user@DETECTOR-conf-zone-scannet# zone mailserver copy-from-this user@DETECTOR-conf-zone-mailserver#
When you enter the zone command, the Detector module enters the configuration mode of the new zone. The Detector module marks the policies of the new zone as untuned (not tuned to zone-specific values). We recommend that you perform the threshold tuning phase of the learning process to tune the policy thresholds to the zone traffic (see the “Activating the Threshold Tuning Phase” section on page 8-6). If the traffic characteristics of the new zone are identical or very similar to the traffic characteristics of the originating zone, you can mark the policy thresholds as tuned (see the “Marking the Policies as Tuned” section on page 8-10).
Configuring Zone AttributesConfigure the attributes of a zone by performing the following steps:
Step 1 Enter zone configuration mode. Skip this step if you are in zone configuration mode already.
To enter zone configuration mode, use one of the following commands:
• conf zone-name (from global mode)
• zone zone-name (from configuration mode or zone configuration mode)
The zone-name argument specifies the name of an existing zone.
Note You can disable tab completion for zone names in the zone command by using the aaa authorization commands zone-completion tacacs+ command. See the “Disabling Tab Completion of Zone Names” section on page 4-12 for more information.
Step 2 Define the zone IP address by entering the following command.
ip address [exclude] ip-addr [ip-mask]
You must define at least one IP address that is not excluded to enable the Detector module to learn the zone traffic and detect the zone.
See the “Configuring the Zone IP Address Range” section on page 5-7 for more information.
Step 3 (Optional) Add a description to the zone for identification purposes by entering the following command in zone configuration mode:
description string
The maximum string length is 80 alphanumeric characters. If you use spaces in the expression, enclose the expression in quotation marks (“ ”).
zone-name Name of an existing zone.
snapshot-id (Optional) Identifier of an existing snapshot. See the “Displaying Snapshots” section on page 8-15 for more information.
Table 5-3 Arguments and Keywords for the zone Command (continued)
Parameter Description
5-6Cisco Traffic Anomaly Detector Module Configuration Guide
OL-11857-01
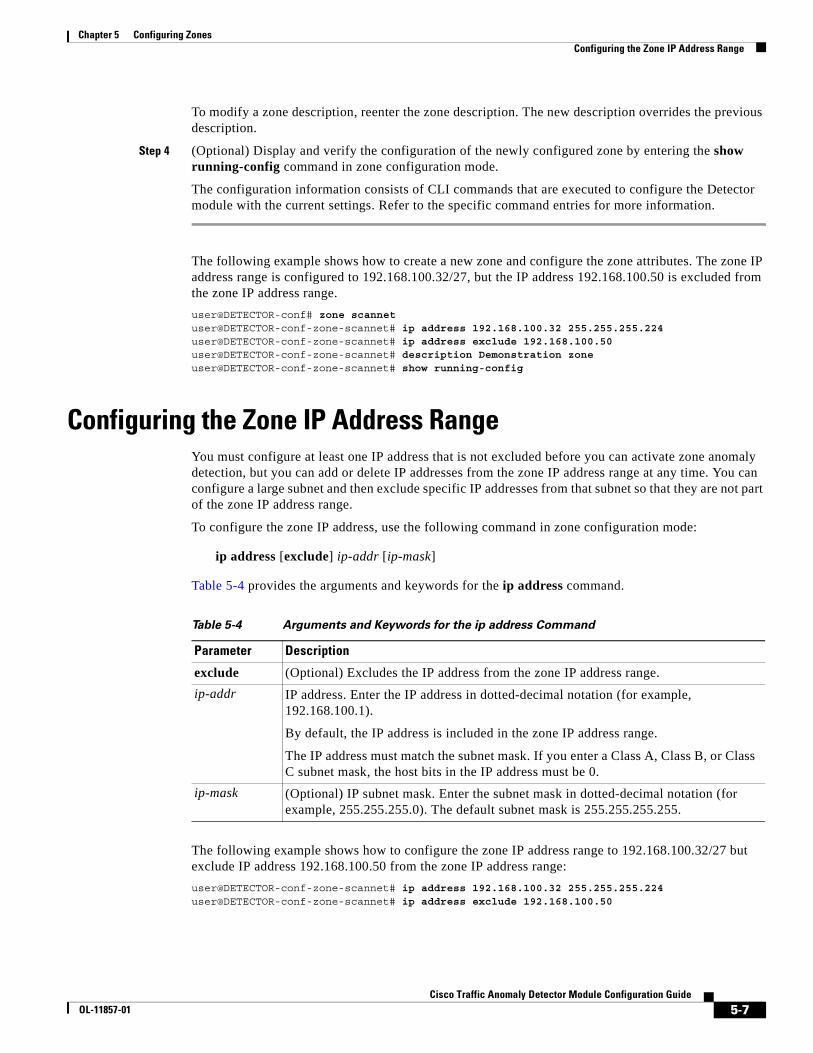
Chapter 5 Configuring ZonesConfiguring the Zone IP Address Range
To modify a zone description, reenter the zone description. The new description overrides the previous description.
Step 4 (Optional) Display and verify the configuration of the newly configured zone by entering the show running-config command in zone configuration mode.
The configuration information consists of CLI commands that are executed to configure the Detector module with the current settings. Refer to the specific command entries for more information.
The following example shows how to create a new zone and configure the zone attributes. The zone IP address range is configured to 192.168.100.32/27, but the IP address 192.168.100.50 is excluded from the zone IP address range.
user@DETECTOR-conf# zone scannetuser@DETECTOR-conf-zone-scannet# ip address 192.168.100.32 255.255.255.224user@DETECTOR-conf-zone-scannet# ip address exclude 192.168.100.50user@DETECTOR-conf-zone-scannet# description Demonstration zoneuser@DETECTOR-conf-zone-scannet# show running-config
Configuring the Zone IP Address RangeYou must configure at least one IP address that is not excluded before you can activate zone anomaly detection, but you can add or delete IP addresses from the zone IP address range at any time. You can configure a large subnet and then exclude specific IP addresses from that subnet so that they are not part of the zone IP address range.
To configure the zone IP address, use the following command in zone configuration mode:
ip address [exclude] ip-addr [ip-mask]
Table 5-4 provides the arguments and keywords for the ip address command.
The following example shows how to configure the zone IP address range to 192.168.100.32/27 but exclude IP address 192.168.100.50 from the zone IP address range:
user@DETECTOR-conf-zone-scannet# ip address 192.168.100.32 255.255.255.224user@DETECTOR-conf-zone-scannet# ip address exclude 192.168.100.50
Table 5-4 Arguments and Keywords for the ip address Command
Parameter Description
exclude (Optional) Excludes the IP address from the zone IP address range.
ip-addr IP address. Enter the IP address in dotted-decimal notation (for example, 192.168.100.1).
By default, the IP address is included in the zone IP address range.
The IP address must match the subnet mask. If you enter a Class A, Class B, or Class C subnet mask, the host bits in the IP address must be 0.
ip-mask (Optional) IP subnet mask. Enter the subnet mask in dotted-decimal notation (for example, 255.255.255.0). The default subnet mask is 255.255.255.255.
5-7Cisco Traffic Anomaly Detector Module Configuration Guide
OL-11857-01
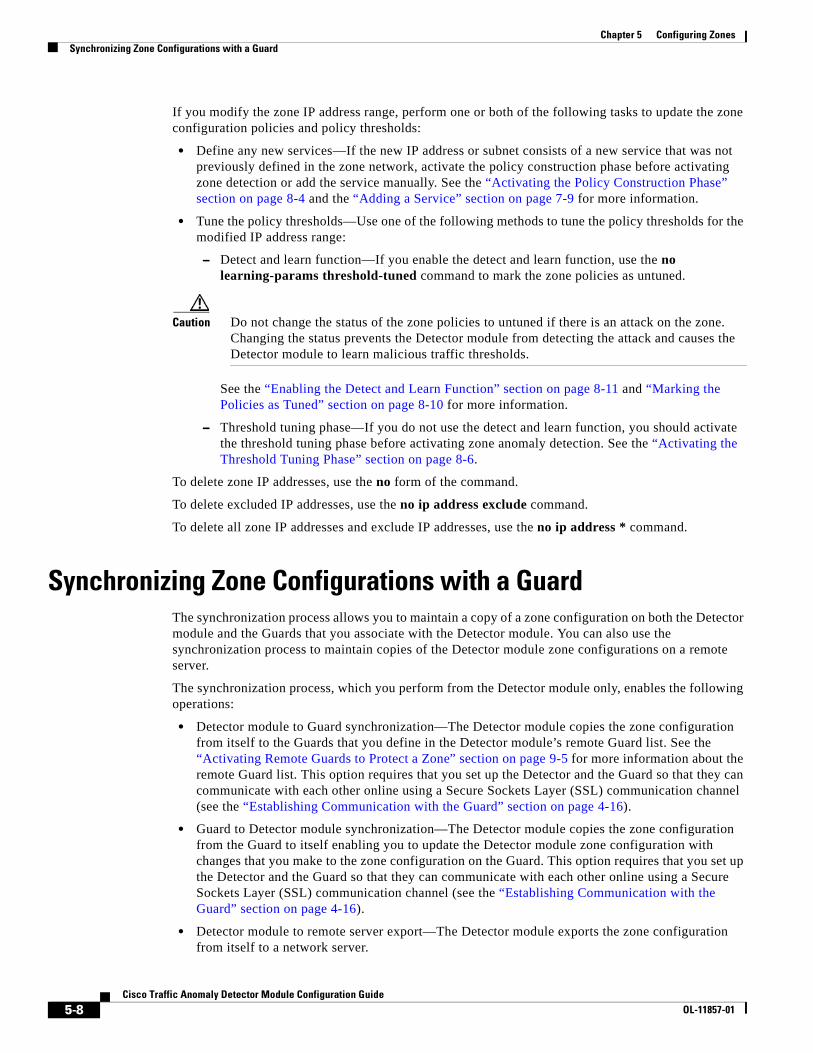
Chapter 5 Configuring ZonesSynchronizing Zone Configurations with a Guard
If you modify the zone IP address range, perform one or both of the following tasks to update the zone configuration policies and policy thresholds:
• Define any new services—If the new IP address or subnet consists of a new service that was not previously defined in the zone network, activate the policy construction phase before activating zone detection or add the service manually. See the “Activating the Policy Construction Phase” section on page 8-4 and the “Adding a Service” section on page 7-9 for more information.
• Tune the policy thresholds—Use one of the following methods to tune the policy thresholds for the modified IP address range:
– Detect and learn function—If you enable the detect and learn function, use the no learning-params threshold-tuned command to mark the zone policies as untuned.
Caution Do not change the status of the zone policies to untuned if there is an attack on the zone. Changing the status prevents the Detector module from detecting the attack and causes the Detector module to learn malicious traffic thresholds.
See the “Enabling the Detect and Learn Function” section on page 8-11 and “Marking the Policies as Tuned” section on page 8-10 for more information.
– Threshold tuning phase—If you do not use the detect and learn function, you should activate the threshold tuning phase before activating zone anomaly detection. See the “Activating the Threshold Tuning Phase” section on page 8-6.
To delete zone IP addresses, use the no form of the command.
To delete excluded IP addresses, use the no ip address exclude command.
To delete all zone IP addresses and exclude IP addresses, use the no ip address * command.
Synchronizing Zone Configurations with a GuardThe synchronization process allows you to maintain a copy of a zone configuration on both the Detector module and the Guards that you associate with the Detector module. You can also use the synchronization process to maintain copies of the Detector module zone configurations on a remote server.
The synchronization process, which you perform from the Detector module only, enables the following operations:
• Detector module to Guard synchronization—The Detector module copies the zone configuration from itself to the Guards that you define in the Detector module’s remote Guard list. See the “Activating Remote Guards to Protect a Zone” section on page 9-5 for more information about the remote Guard list. This option requires that you set up the Detector and the Guard so that they can communicate with each other online using a Secure Sockets Layer (SSL) communication channel (see the “Establishing Communication with the Guard” section on page 4-16).
• Guard to Detector module synchronization—The Detector module copies the zone configuration from the Guard to itself enabling you to update the Detector module zone configuration with changes that you make to the zone configuration on the Guard. This option requires that you set up the Detector and the Guard so that they can communicate with each other online using a Secure Sockets Layer (SSL) communication channel (see the “Establishing Communication with the Guard” section on page 4-16).
• Detector module to remote server export—The Detector module exports the zone configuration from itself to a network server.
5-8Cisco Traffic Anomaly Detector Module Configuration Guide
OL-11857-01
Chapter 5 Configuring ZonesSynchronizing Zone Configurations with a Guard
You can manually synchronize zone configurations or you can configure the Detector module to perform the following tasks automatically:
• Synchronize the zone configuration with the Guard or remote server after accepting the results of the threshold tuning phase.
• Synchronize the zone configuration with the Guard before activating the Guard to provide zone protection.
Using the synchronization process, you can create, configure, and modify a zone on the Detector module and then update the Guard with the same zone information. The synchronization process also enables the Detector module to continuously learn the zone traffic characteristics to keep the zone policies updated on both itself and the Guard. When you let the Detector module do the learning for the Guard, you avoid having to divert the zone traffic to the Guard.
This section contains the following topics:
• Understanding the Configuration Guidelines for Synchronization
• Creating a Zone for Synchronization
• Configuring the Automatic Zone Synchronization and Export Parameters
• Synchronizing a Zone Configuration from the Guard to the Detector Module
• Synchronizing a Zone Configuration from the Detector Module to the Guard
• Synchronizing a Zone Configuration Offline
• Exporting a Zone Configuration Automatically to a Network Server
• Exporting a Zone Configuration Manually to a Network Server
• Example Synchronization Scenario
Understanding the Configuration Guidelines for SynchronizationTo synchronize zone configurations between the Detector module and a Guard, follow these guidelines:
• Create the new zone on the Detector using one of the Guard zone templates that contain configuration parameters for both device types (see Table 5-1 for more information about the available zone templates).
• Ensure that the same type of traffic (same traffic rates, protocols, and so on) flows to both the Guard and the Detector module for proper synchronization of zone policies.
• Configure the SSL communication connection channel to enable communication between the Detector module and the Guard (see the “Establishing Communication with the Guard” section on page 4-16).
• Regenerate the SSL certificates that the Detector module and the Guard use for secure communication if you replace a device or change the IP address of the interface that the Detector module and the Guard use to communicate (see the “Regenerating SSL Certificates” section on page 4-19).
• Verify the zone configuration on the Guard. If the activation extent is ip-address-only and the activation method is not zone-name-only, we recommend that you configure the timer that the Detector module uses to identify that an attack on the zone has ended by entering the protection-end-timer command. If you configure the value of the protection-end-timer to forever, the Detector module does not terminate zone protection when the attack ends and does not delete the subzone that it had created to protect the specific IP address.
5-9Cisco Traffic Anomaly Detector Module Configuration Guide
OL-11857-01
Chapter 5 Configuring ZonesSynchronizing Zone Configurations with a Guard
Creating a Zone for SynchronizationTo synchronize a zone configuration between the Detector module and a Guard, you must create the zone on the Detector module using one of the Guard zone templates which have two sets of definitions; one for the Guard and one for the Detector module. See Table 5-1 for more information on the zone templates.
When creating a zone using one the Guard zone templates, you use the following configuration modes to configure the zone:
• Zone configuration mode—Configures zone attributes that are unique to the Detector, such as defining the remote Guards. To enter zone configuration mode, use the zone command in configuration mode. The zone configuration command prompt is as follows:
user@DETECTOR-conf-zone-scannet#
• Guard configuration mode—Configures zone attributes that are unique to the Guard, such as user filters. To enter guard configuration mode, use the guard-conf command in zone configuration mode. The guard configuration mode command prompt is as follows:
user@DETECTOR-conf-zone-scannet(guard)#
• Zone configuration mode or guard configuration mode—Configures definitions that are common to both the Guard and the Detector, such as IP addresses.
If you modify a zone attribute that is common to both the Guard and the Detector, the change applies to both sets of definitions. For example, if you modify the zone IP address in zone configuration mode, the new IP address is also modified in the zone definition for the Guard. You can display the new zone definition for the Guard in guard configuration mode. If you change the operation state of a policy in guard configuration mode, the operation state is also modified in the Detector zone definition.
To create and configure a zone for synchronization, perform the following steps:
Step 1 Create a new zone on the Detector using one of the Guard zone templates (see the “Creating a New Zone from a Zone Template” section on page 5-4).
When you create a new zone using a Guard zone templates, the Detector displays (Guard/Detector) next to the zone ID field in the output of the show command in zone configuration mode.
Step 2 Configure the zone attributes (see the “Configuring Zone Attributes” section on page 5-6).
Step 3 Configure characteristics that are unique to the Guard by entering guard configuration mode when you use one of the following commands:
• guard-conf (from zone configuration mode)
• configure zone-name guard-conf (from global mode)
• zone zone-name guard-conf (from configuration mode)
The zone-name argument specifies the name of an existing zone.
The Detector module enters the guard configuration mode. The CLI prompt indicates the mode by adding the word guard in parentheses (guard) to the prompt.
The following example shows how to enter guard configuration mode:
user@DETECTOR-conf-zone-scannet# guard-confuser@DETECTOR-conf-zone-scannet(guard)#
5-10Cisco Traffic Anomaly Detector Module Configuration Guide
OL-11857-01
Chapter 5 Configuring ZonesSynchronizing Zone Configurations with a Guard
The guard configuration mode allows you to configure all zone attributes that are unique to the Guard, such as user filters, filter termination, and a policy or a filter action of drop. See the Cisco Guard Configuration Guide for more information.
Configuring the Automatic Zone Synchronization and Export ParametersYou can configure the Detector module to perform the following tasks automatically:
• Synchronize the zone configuration with the remote Guards that you define in the zone remote Guard list as follows:
– After the Detector module accepts the results of the threshold-tuning phase.
– Before the Detector module activates the Guards to protect the zone.
If you do not define any Guards on the zone remote Guard list, then the Detector module synchronizes the zone configuration with the remote Guards that you define in the Detector default remote Guard list. If synchronization with one of the remote Guards fails, the Detector module continues to the next remote Guard on the list.
If both the zone remote Guard list and the Detector default remote Guard list are empty, the Detector does not synchronize the zone configuration.
If a zone with the same name exists on the Guard, the new configuration replaces the existing one.
• Export the zone configuration to all the network servers that you define in the zone remote server list when the Detector module accepts the results of the threshold-tuning phase. If the zone remote server list is empty, the Detector module searches the Detector module default remote list. See the “Exporting a Zone Configuration Automatically to a Network Server” section on page 5-15 for more information.
If both the zone remote server list and the Detector module default remote server list are empty, the Detector module does not export the zone configuration.
To enable automatic synchronization and export of a zone configuration, use the following command in zone configuration mode:
learning-params sync {accept | remote-activate}
Table 5-5 provides the keywords for the learning-params sync command.
Table 5-5 Keywords for the learning-params sync Command
Parameter Description
accept Synchronizes the zone configuration with the remote Guard and exports the zone configuration to the remote server each time that the Detector module accepts the results of the threshold-tuning phase of the learning process.
remote-activate Synchronizes the zone configuration with the remote Guard before activating the Guard to protect the zone. The Detector module synchronizes the zone configuration only if the zone configuration on the remote Guard is not up to date.
The Detector module does not export the zone configuration to a network server.
5-11Cisco Traffic Anomaly Detector Module Configuration Guide
OL-11857-01
Chapter 5 Configuring ZonesSynchronizing Zone Configurations with a Guard
The following example shows how to automatically synchronize and export the zone configuration each time that the Detector module accepts the results of the threshold-tuning phase of the learning process:
user@DETECTOR-conf-zone-scannet# learning-params sync accept
To disable the automatic synchronization and export functions, use the no learning-params sync command.
Synchronizing a Zone Configuration from the Guard to the Detector ModuleYou can enable the Detector module to copy a zone configuration from a Guard to the Detector module. If the zone already exists on the Detector module, the new configuration from the Guard overrides the existing one.
Synchronizing a zone configuration from the Guard to the Detector module may be required if you manually modify the zone policies on the Guard to adjust them for attack characteristics and would like to update the Detector module with the changes. You can set certain policy thresholds as fixed or set a fixed multiplier for policy thresholds to ensure the following:
• The Detector module has the correct policy thresholds and can detect future DDoS attacks correctly.
• The correct zone configuration on the Guard is maintained if you synchronize the zone configuration from the Detector module to the Guard in the future, which may be required if the Detector module continues to learn the zone traffic characteristics.
See the “Setting the Threshold as Fixed” section on page 7-15 and the “Configuring a Threshold Multiplier” section on page 7-15 for more information.
To synchronize the zone configuration from the Guard to the Detector module, perform the following steps from the Detector module:
Step 1 If the zone is currently active, deactivate the zone by using the deactivate command in zone configuration mode.
Step 2 Synchronize the zone configuration from the Detector module to the Guard by entering one of the following commands:
• sync zone zone-name remote-guard-address local (in global mode)
• sync remote-guard-address local (in zone configuration mode)
Table 5-6 provides the arguments for the sync command.
Step 3 If the zone was active before you initiated the synchronization process, reactivate the zone by using the detect command or the learning command in zone configuration mode.
Table 5-6 Arguments and Keywords for the sync Command
Parameter Description
zone Synchronizes the configuration of the specified zone.
zone-name Name of an existing zone.
remote-guard-address IP address of the remote Guard. Enter the IP address in dotted-decimal notation (for example, 192.168.100.1).
local Synchronizes the zone configuration from the Detector to the Guard.
5-12Cisco Traffic Anomaly Detector Module Configuration Guide
OL-11857-01
Chapter 5 Configuring ZonesSynchronizing Zone Configurations with a Guard
For more information, see Chapter 9, “Detecting Zone Traffic Anomalies,” and the “Synchronizing Zone Configurations with a Guard” section on page 5-8.
The following example shows how to deactivate the zone scannet and synchronize the zone configuration from a Guard with an IP address of 192.168.55.10 to the Detector. It then shows how to reactivate the zone.
user@DETECTOR-conf-zone-scannet# deactivateuser@DETECTOR-conf-zone-scannet# sync 192.168.55.10 localuser@DETECTOR-conf-zone-scannet# detect learning
Synchronizing a Zone Configuration from the Detector Module to the GuardYou can synchronize a Detector module zone configuration with the zone on the Guard to ensure that the zone configuration and policies on the Guard are updated when the Guard activates zone protection. This process allows you to configure the zone once on the Detector, continuously learn the zone traffic characteristics, and maintain the same zone configuration and policies on the Guard without constantly diverting the zone traffic to the Guard.
The Detector copies the configuration of the zone to the Guard. If a zone with the same name exists on the Guard, the new configuration replaces the existing one.
Note Before you initiate the zone synchronization process, ensure that the Guard is not currently protecting the zone. You must deactivate zone protection before synchronizing the zone configuration.
Synchronize the zone configuration and policies from the Detector module by entering one of the following commands:
• sync zone zone-name local {remote-guards | remote-guard-address-to} (in global mode)
• sync local {remote-guards | remote-guard-address-to} (in zone configuration mode)
Table 5-7 provides the arguments and keywords for the sync command.
Table 5-7 Arguments and Keywords for the sync Command
Parameter Description
zone Synchronizes the configuration of the specified zone.
zone-name Name of an existing zone.
local Synchronizes the zone configuration and policies from the Detector module to the Guard.
remote-guards Synchronizes the zone configuration with all remote Guards in the zone remote Guard list. If the zone remote Guard list is empty, synchronizes the zone configuration with the remote Guards that are defined in the Detector module default remote Guard list.
remote-guard-address-to IP address of the remote Guard. The Detector module synchronizes the zone configuration with the specified remote Guard. Enter the IP address in dotted-decimal notation (for example, 192.168.100.1).
5-13Cisco Traffic Anomaly Detector Module Configuration Guide
OL-11857-01
Chapter 5 Configuring ZonesSynchronizing Zone Configurations with a Guard
The following example shows how to synchronize the zone configuration to all remote Guards in the zone remote Guard list:
user@DETECTOR# sync zone scannet local remote-guards
The following example shows how to synchronize the zone configuration to a remote Guard with an IP address of 192.168.100.5:
user@DETECTOR-conf-zone-scannet# sync local 192.168.100.5
Synchronizing a Zone Configuration OfflineYou can synchronize a Detector module zone configuration with a Guard by using the offline synchronization procedure that is described in this section. You may need to synchronize a zone configuration offline if one of the following conditions applies:
• You cannot establish a secure communication channel between the two devices (the Guard and Detector module cannot communicate with each other).
• The Detector module communicates with the Guard across a Network Address Translation (NAT) device.
To synchronize a zone configuration offline, you must first export the zone configuration from the Detector module to a network server using FTP, SFTP, or SCP, and then import the zone configuration manually from the network server to the Guard.
To synchronize the zone on the Detector module with the zone configuration on the Guard configuration offline, perform the following steps:
Step 1 Create the zone on the Detector module using one of the Guard zone templates (see the “Creating a New Zone from a Zone Template” section on page 5-4).
Step 2 Export the zone configuration from the Detector module using one of the following methods:
• Automatically—Configure the Detector module to export the zone configuration whenever a specific condition occurs (see the “Exporting a Zone Configuration Automatically to a Network Server” section on page 5-15).
• Manually—Export the zone configuration by entering one of the following commands in global mode:
– copy zone zone-name guard-running-config ftp server remote-path [login [password]]
– copy zone zone-name guard-running-config {sftp | scp} server remote-path login
See Table 5-9 on page 5-17 for descriptions of the copy zone command arguments and keywords. See “Exporting a Zone Configuration Manually to a Network Server” section on page 5-16 for more information.
Step 3 From the Guard, import the zone configuration from the network server by entering one of the following commands in global mode:
Note If the Guard is currently protecting the zone, deactivate a zone before importing the zone configuration.
• copy ftp running-config server full-file-name [login [password]]
• copy {sftp | scp} running-config server full-file-name login
5-14Cisco Traffic Anomaly Detector Module Configuration Guide
OL-11857-01
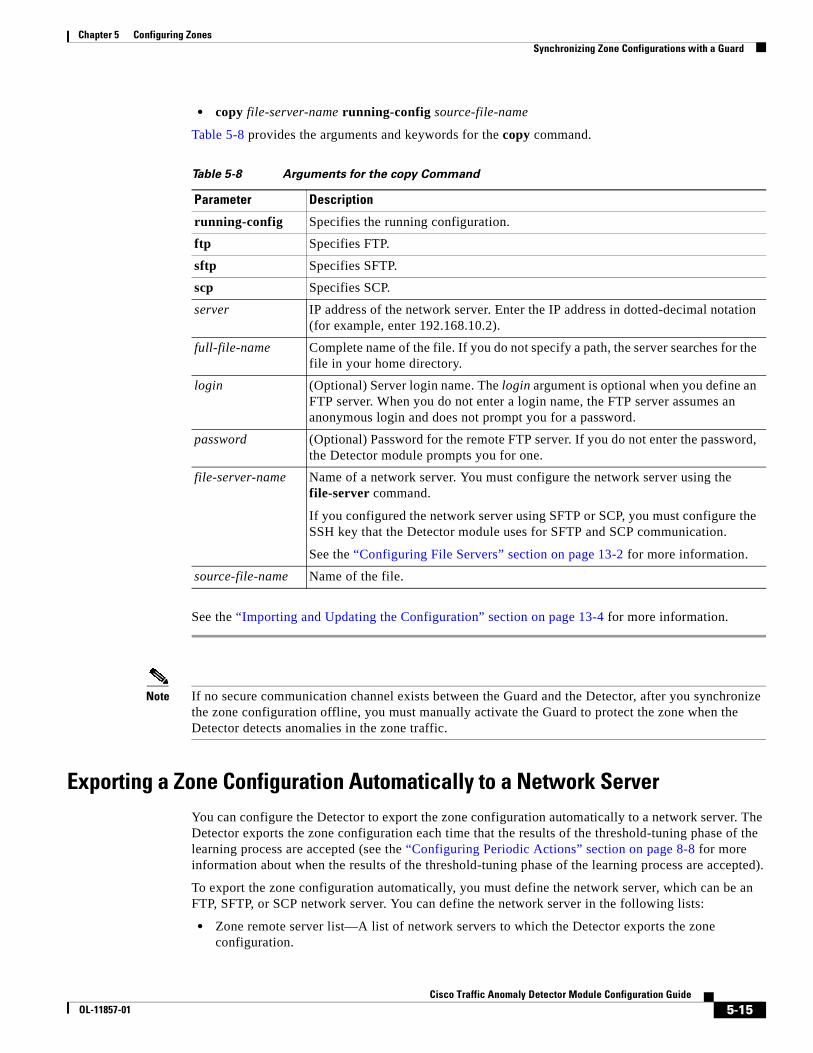
Chapter 5 Configuring ZonesSynchronizing Zone Configurations with a Guard
• copy file-server-name running-config source-file-name
Table 5-8 provides the arguments and keywords for the copy command.
See the “Importing and Updating the Configuration” section on page 13-4 for more information.
Note If no secure communication channel exists between the Guard and the Detector, after you synchronize the zone configuration offline, you must manually activate the Guard to protect the zone when the Detector detects anomalies in the zone traffic.
Exporting a Zone Configuration Automatically to a Network ServerYou can configure the Detector to export the zone configuration automatically to a network server. The Detector exports the zone configuration each time that the results of the threshold-tuning phase of the learning process are accepted (see the “Configuring Periodic Actions” section on page 8-8 for more information about when the results of the threshold-tuning phase of the learning process are accepted).
To export the zone configuration automatically, you must define the network server, which can be an FTP, SFTP, or SCP network server. You can define the network server in the following lists:
• Zone remote server list—A list of network servers to which the Detector exports the zone configuration.
Table 5-8 Arguments for the copy Command
Parameter Description
running-config Specifies the running configuration.
ftp Specifies FTP.
sftp Specifies SFTP.
scp Specifies SCP.
server IP address of the network server. Enter the IP address in dotted-decimal notation (for example, enter 192.168.10.2).
full-file-name Complete name of the file. If you do not specify a path, the server searches for the file in your home directory.
login (Optional) Server login name. The login argument is optional when you define an FTP server. When you do not enter a login name, the FTP server assumes an anonymous login and does not prompt you for a password.
password (Optional) Password for the remote FTP server. If you do not enter the password, the Detector module prompts you for one.
file-server-name Name of a network server. You must configure the network server using the file-server command.
If you configured the network server using SFTP or SCP, you must configure the SSH key that the Detector module uses for SFTP and SCP communication.
See the “Configuring File Servers” section on page 13-2 for more information.
source-file-name Name of the file.
5-15Cisco Traffic Anomaly Detector Module Configuration Guide
OL-11857-01
Chapter 5 Configuring ZonesSynchronizing Zone Configurations with a Guard
• Detector default remote server list—The default list of network servers. The Detector exports the zone configuration to the servers on this list if the zone remote server list is empty.
To configure the Detector to automatically export the zone configuration to a network server, perform the following steps:
Step 1 Define the network server by entering the file-server command in configuration mode (see the “Configuring File Servers” section on page 13-2 for more information).
If you configured the network server using SFTP or SCP, you must configure the SSH key that the Detector module uses for SFTP and SCP communication (see the “Configuring the Keys for SFTP and SCP Connections” section on page 4-24).
Step 2 (Optional) Add the network server to a zone remote server list by entering the following command in zone configuration mode:
export sync-config file-server-name
The file-server-name argument specifies the name of the network server that you specified in Step 1. To remove a network server from the remote server list, use the no form of the command.
Step 3 (Optional) Add the network server to the Detector default remote server list by entering the following command in configuration mode:
export sync-config file-server-name
The file-server-name argument specifies the name of the network server that you specified in Step 1. To remove a network server from the remote server list, use the no form of the command.
Step 4 Configure the Detector to automatically export the zone configuration to the network server each time that it accepts the results of the threshold-tuning phase by entering the learning-params sync accept command in zone configuration mode. See the “Configuring the Automatic Zone Synchronization and Export Parameters” section on page 5-11 for more information.
The following example shows how to add a network server to the zone remote server list:
user@DETECTOR-conf-zone-scannet# export sync-config Corp-FTP-Server
To display the default list of network servers to which the Detector module exports zone configuration, use the show sync-config file-servers command in configuration mode.
To display the zone remote server list, use the show sync-config file-servers command in zone configuration mode.
Exporting a Zone Configuration Manually to a Network ServerYou can manually export the zone configuration to a network server.
Export the zone configuration to a network server by entering one of the following commands in global mode:
• copy zone zone-name guard-running-config ftp server full-file-name [login password] (Export the zone configuration to an FTP server.)
• copy zone zone-name guard-running-config {sftp | scp} server full-file-name login (Export the zone configuration to a network server using SFTP or SCP.)
5-16Cisco Traffic Anomaly Detector Module Configuration Guide
OL-11857-01
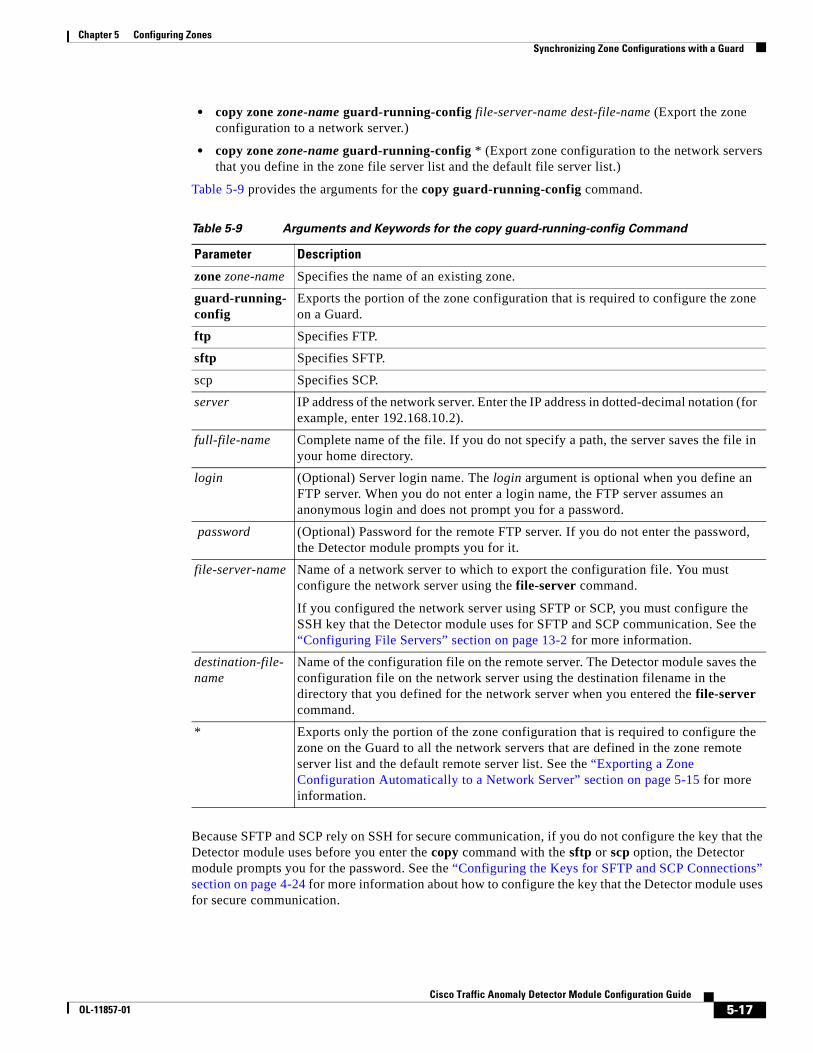
Chapter 5 Configuring ZonesSynchronizing Zone Configurations with a Guard
• copy zone zone-name guard-running-config file-server-name dest-file-name (Export the zone configuration to a network server.)
• copy zone zone-name guard-running-config * (Export zone configuration to the network servers that you define in the zone file server list and the default file server list.)
Table 5-9 provides the arguments for the copy guard-running-config command.
Because SFTP and SCP rely on SSH for secure communication, if you do not configure the key that the Detector module uses before you enter the copy command with the sftp or scp option, the Detector module prompts you for the password. See the “Configuring the Keys for SFTP and SCP Connections” section on page 4-24 for more information about how to configure the key that the Detector module uses for secure communication.
Table 5-9 Arguments and Keywords for the copy guard-running-config Command
Parameter Description
zone zone-name Specifies the name of an existing zone.
guard-running-config
Exports the portion of the zone configuration that is required to configure the zone on a Guard.
ftp Specifies FTP.
sftp Specifies SFTP.
scp Specifies SCP.
server IP address of the network server. Enter the IP address in dotted-decimal notation (for example, enter 192.168.10.2).
full-file-name Complete name of the file. If you do not specify a path, the server saves the file in your home directory.
login (Optional) Server login name. The login argument is optional when you define an FTP server. When you do not enter a login name, the FTP server assumes an anonymous login and does not prompt you for a password.
password (Optional) Password for the remote FTP server. If you do not enter the password, the Detector module prompts you for it.
file-server-name Name of a network server to which to export the configuration file. You must configure the network server using the file-server command.
If you configured the network server using SFTP or SCP, you must configure the SSH key that the Detector module uses for SFTP and SCP communication. See the “Configuring File Servers” section on page 13-2 for more information.
destination-file- name
Name of the configuration file on the remote server. The Detector module saves the configuration file on the network server using the destination filename in the directory that you defined for the network server when you entered the file-server command.
* Exports only the portion of the zone configuration that is required to configure the zone on the Guard to all the network servers that are defined in the zone remote server list and the default remote server list. See the “Exporting a Zone Configuration Automatically to a Network Server” section on page 5-15 for more information.
5-17Cisco Traffic Anomaly Detector Module Configuration Guide
OL-11857-01
Chapter 5 Configuring ZonesSynchronizing Zone Configurations with a Guard
The following example shows how to export the zone configuration to an FTP server:
user@DETECTOR-conf# copy zone scannet guard-running-config ftp 10.0.0.191 /root/ConfigFiles/scannet.txt <user> <password>
Example Synchronization ScenarioThis example scenario shows how to synchronize a zone configuration on the Detector module with a zone configuration on the Guard to protect the zone while the Detector module is learning the zone traffic characteristics:
1. Create and configure a new zone on the Detector module using one of the Guard zone templates. When you create a new zone using a Guard zone template, the Detector module displays (Guard/Detector) next to the zone ID field in the output of the show command in zone configuration mode.
For more information, see the “Creating a New Zone from a Zone Template” section on page 5-4.
2. Add the Guard to the zone remote Guard list or the default remote Guard list on the Detector module.
For more information, see the “Configuring the Default Remote Guard List” section on page 9-7 and the “Configuring the Zone Remote Guard Lists” section on page 9-8.
3. Enable the Detector module to learn the zone traffic and construct the zone policies by entering the learning policy-construction command (see the “Activating the Policy Construction Phase” section on page 8-4).
4. Enable the Detector module to learn the zone traffic and tune the policy thresholds while detecting traffic anomalies by entering the detect learning command (see “Enabling the Detect and Learn Function” section on page 8-11).
5. Configure the Detector module to accept the policy thresholds every 24 hours to ensure that the zone policies are updated with the changing traffic patterns by using the learning-params periodic-action auto-accept command.
For more information, see the “Configuring Periodic Actions” section on page 8-8.
6. Configure the Detector module to synchronize the zone configuration with the Guard each time that it accepts the new learned policy thresholds to ensure that when the Detector module learns new zone policy thresholds, the zone policies on the Guard are also updated.
Use the learning-params sync command to configure the Detector module to synchronize the zone configuration with the Guard. For more information, see the “Configuring the Automatic Zone Synchronization and Export Parameters” section on page 5-11.
7. Configure the Detector module to synchronize the zone configuration with the configuration on the Guard before activating the Guard to ensure that the zone configuration and policies on the Guard are updated when the Guard activates zone protection.
Use the learning-params sync command.
For more information, see the “Configuring the Automatic Zone Synchronization and Export Parameters” section on page 5-11.
When the Detector module detects an attack on the zone, it performs the following actions:
• Verifies that the zone configuration on the Guard is updated. If the zone configuration on the Guard is not the same as the zone configuration on the Detector module, the Detector synchronizes the zone configuration with the Guard.
• Activates the Guard to protect the zone (the Guard activates zone protection).
5-18Cisco Traffic Anomaly Detector Module Configuration Guide
OL-11857-01
Chapter 5 Configuring ZonesSynchronizing Zone Configurations with a Guard
• Stops the learning process for the zone to prevent it from learning malicious traffic thresholds. The Detector module continues to look for anomalies in the zone traffic.
You can modify the zone policies on the Guard when the attack is in progress.
The Detector module polls the Guard constantly. When the Detector module identifies that the Guard has deactivated zone protection (the Guard deactivates zone protection when the attack ends) and additional traffic anomalies do not exist, then the Detector module reactivates zone anomaly detection and the learning process.
8. If you manually modify the zone policies on the Guard to adjust the zone policies to the attack characteristics, you can synchronize the new policies with the Detector module. This action is important if the zone traffic requires that you set certain policy thresholds as fixed or set a fixed multiplier for policy thresholds. Synchronizing the zone configuration with the Detector module ensures that the Detector module has the correct policy thresholds, calculates the thresholds correctly in future threshold tuning phases, and updates the Guard policies with the correct thresholds.
For more information, see the “Setting the Threshold as Fixed” section on page 7-15 and the “Configuring a Threshold Multiplier” section on page 7-15.
To synchronize the zone configuration and policies from the Guard to the Detector module, perform the following actions from the Detector module:
• Deactivate the zone by entering the deactivate command.
• Synchronize the zone configuration from the Guard to the Detector module by entering the sync command.
• Reactivate zone detection by entering the detect command.
For more information, see the “Synchronizing a Zone Configuration from the Guard to the Detector Module” section on page 5-12 and Chapter 9, “Detecting Zone Traffic Anomalies.”
5-19Cisco Traffic Anomaly Detector Module Configuration Guide
OL-11857-01

Chapter 5 Configuring ZonesSynchronizing Zone Configurations with a Guard
5-20Cisco Traffic Anomaly Detector Module Configuration Guide
OL-11857-01
Cisco TraOL-11857-01
C H A P T E R 6
Configuring Zone FiltersThis chapter describes how to configure the Cisco Traffic Anomaly Detector module (Detector module) network traffic filters.
This chapter refers to the Cisco Guard (Guard), the companion product of the Detector module. The Guard is a Distributed Denial of Service (DDoS) attack detection and mitigation device that cleans the zone traffic as the traffic flows through it, dropping the attack traffic and injecting the legitimate traffic back into the network. When the Detector module determines that the zone is under attack, it can activate the Guard attack mitigation services. The Detector module can also synchronize zone configurations with the Guard. For more information about the Guard, see the Cisco Anomaly Guard Module Configuration Guide or the Cisco Guard Configuration Guide.
This chapter contains the following sections:
• Understanding Zone Filters
• Configuring Flex-Content Filters
• Configuring Bypass Filters
• Configuring Dynamic Filters
Understanding Zone FiltersZone filters define how the Detector module handles a specific traffic flow. You can configure filters to customize the methods that the Detector module uses to detect traffic anomalies.
Zone filters enable the Detector module to perform the following functions:
• Analyze zone traffic for anomalies
• Bypass the Detector module anomaly detection features
The Detector module has the following types of filters:
• Bypass filters—Prevent the Detector module from analyzing specific traffic flows. You can direct trusted traffic away from the Detector module anomaly detection features. See the “Configuring Bypass Filters” section on page 6-10 for more information.
• Flex-content filters—Count a specific traffic flow. Flex-content filters provide extremely flexible filtering capabilities, such as filtering according to fields in the IP and TCP headers, filtering based on the payload content, and filtering based on complex Boolean expressions. See the “Configuring Flex-Content Filters” section on page 6-2 for more information.
6-1ffic Anomaly Detector Module Configuration Guide
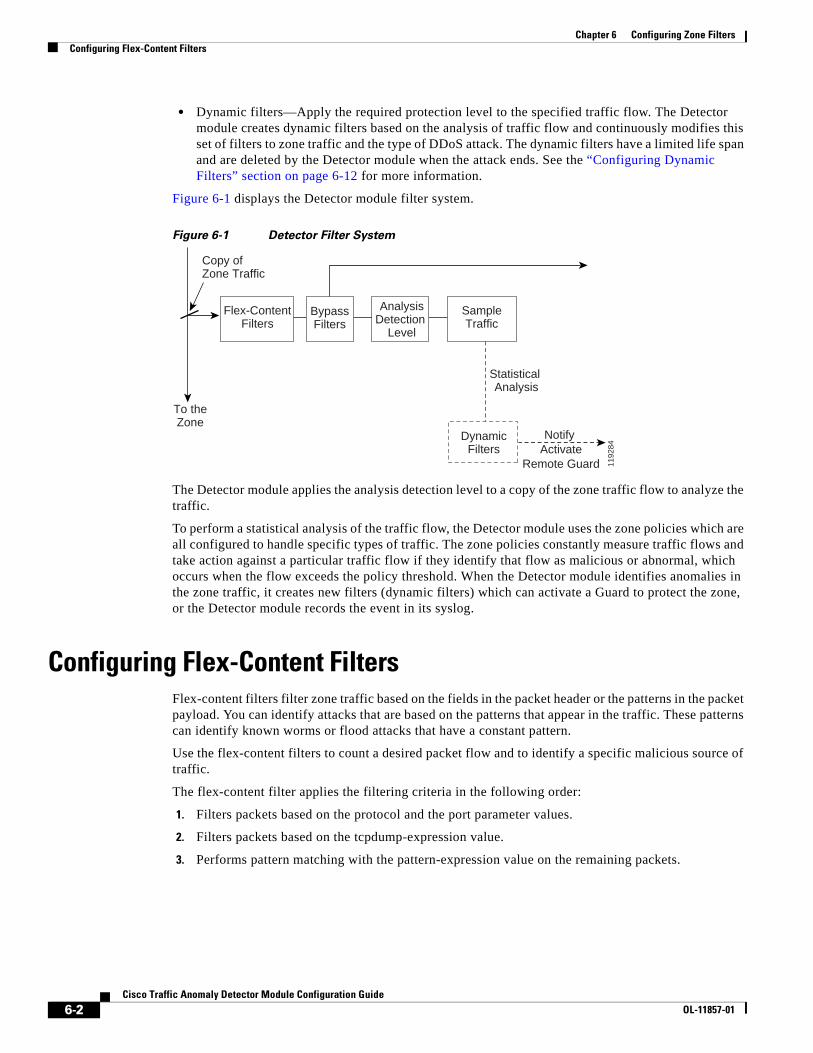
Chapter 6 Configuring Zone FiltersConfiguring Flex-Content Filters
• Dynamic filters—Apply the required protection level to the specified traffic flow. The Detector module creates dynamic filters based on the analysis of traffic flow and continuously modifies this set of filters to zone traffic and the type of DDoS attack. The dynamic filters have a limited life span and are deleted by the Detector module when the attack ends. See the “Configuring Dynamic Filters” section on page 6-12 for more information.
Figure 6-1 displays the Detector module filter system.
Figure 6-1 Detector Filter System
The Detector module applies the analysis detection level to a copy of the zone traffic flow to analyze the traffic.
To perform a statistical analysis of the traffic flow, the Detector module uses the zone policies which are all configured to handle specific types of traffic. The zone policies constantly measure traffic flows and take action against a particular traffic flow if they identify that flow as malicious or abnormal, which occurs when the flow exceeds the policy threshold. When the Detector module identifies anomalies in the zone traffic, it creates new filters (dynamic filters) which can activate a Guard to protect the zone, or the Detector module records the event in its syslog.
Configuring Flex-Content FiltersFlex-content filters filter zone traffic based on the fields in the packet header or the patterns in the packet payload. You can identify attacks that are based on the patterns that appear in the traffic. These patterns can identify known worms or flood attacks that have a constant pattern.
Use the flex-content filters to count a desired packet flow and to identify a specific malicious source of traffic.
The flex-content filter applies the filtering criteria in the following order:
1. Filters packets based on the protocol and the port parameter values.
2. Filters packets based on the tcpdump-expression value.
3. Performs pattern matching with the pattern-expression value on the remaining packets.
1192
84
Copy of Zone Traffic
Notify Activate
Remote Guard
To theZone
Flex-ContentFilters
BypassFilters
SampleTraffic
AnalysisDetection
Level
DynamicFilters
Statistical Analysis
6-2Cisco Traffic Anomaly Detector Module Configuration Guide
OL-11857-01
Chapter 6 Configuring Zone FiltersConfiguring Flex-Content Filters
Note Flex-content filters consume a lot of CPU resources. We recommend that you limit the use of flex-content filters because they might affect the performance of the Detector module. If you are using a flex-content filter to detect a specific attack that can be identified by a dynamic filter, such as TCP traffic to a specified port, we recommend that you filter the traffic using a dynamic filter.
This section contains the following topics:
• Adding a Flex-Content Filter
• Displaying Flex-Content Filters
• Deleting Flex-Content Filters
• Changing the State of a Flex-Content Filter
Adding a Flex-Content FilterThe Detector module creates a list of flex-content filters that you create and activates the filters in an ascending order. When you add a new flex-content filter, make sure that you place it in the correct location in the filter list.
To configure a flex-content filter, perform the following steps:
Step 1 Display the list of flex-content filters and identify the location in the list in which you want to add the new filter (see the “Displaying Flex-Content Filters” section on page 6-9).
Step 2 If the current row numbers are consecutive, renumber the flex-content filters in increments that allow you to insert the new flex-content filter by entering the following command in zone configuration mode:
flex-content-filter renumber [start [step]]
Table 6-1 provides the arguments for the flex-content-filter renumber command.
Step 3 (Optional) Filter a pattern expression of an ongoing attack or an attack that you have previously recorded. Activate the Detector module to generate a signature of the attack by using the show packet-dump signatures command. See the “Generating Attack Signatures from Packet-Dump Capture Files” section on page 12-19 for more information.
Step 4 Add a new flex-content filter by entering the following command:
flex-content-filter row-num {disabled | enabled} {drop | count} protocol port [start start-offset [end end-offset]] [ignore-case] expression tcpdump-expression pattern pattern-expression
Table 6-1 Arguments for the flex-content-filter renumber Command
Parameter Description
start (Optional) Integer from 1 to 9999 that denotes the new starting number of the flex-content filter list. The default is 10.
step (Optional) Integer from 1 to 999 that defines the increment between the flex-content filter row numbers. The default is 10.
6-3Cisco Traffic Anomaly Detector Module Configuration Guide
OL-11857-01
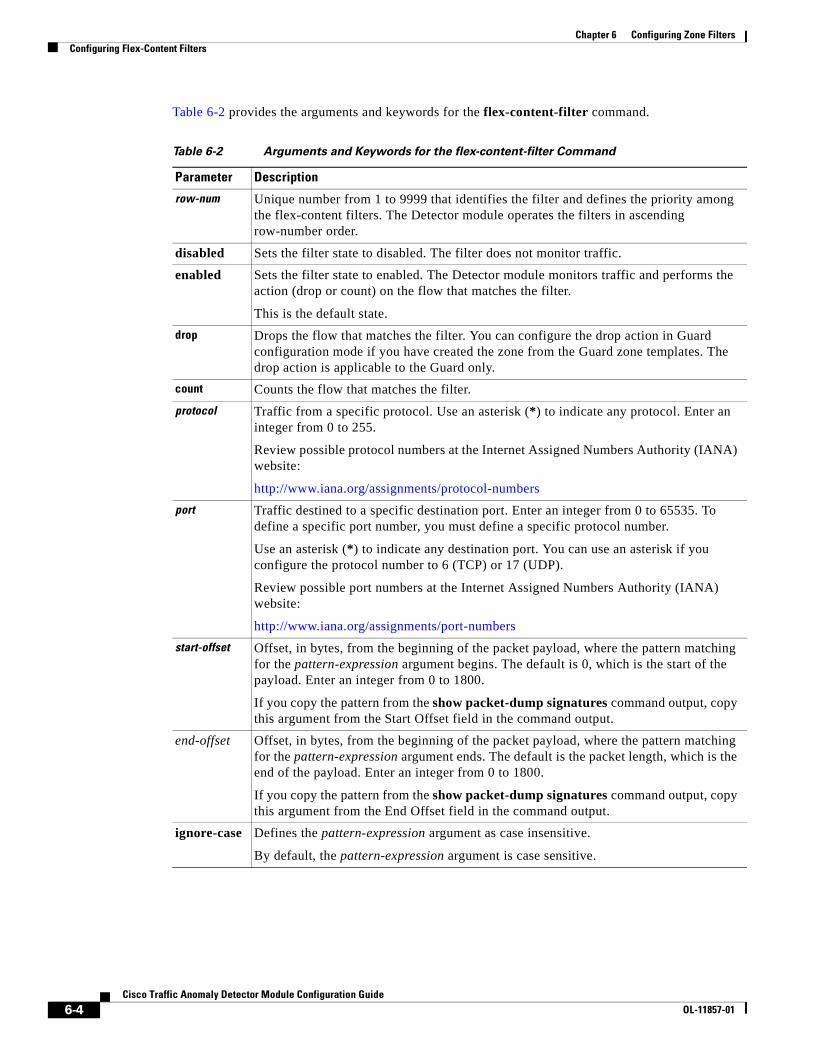
Chapter 6 Configuring Zone FiltersConfiguring Flex-Content Filters
Table 6-2 provides the arguments and keywords for the flex-content-filter command.
Table 6-2 Arguments and Keywords for the flex-content-filter Command
Parameter Description
row-num Unique number from 1 to 9999 that identifies the filter and defines the priority among the flex-content filters. The Detector module operates the filters in ascending row-number order.
disabled Sets the filter state to disabled. The filter does not monitor traffic.
enabled Sets the filter state to enabled. The Detector module monitors traffic and performs the action (drop or count) on the flow that matches the filter.
This is the default state.
drop Drops the flow that matches the filter. You can configure the drop action in Guard configuration mode if you have created the zone from the Guard zone templates. The drop action is applicable to the Guard only.
count Counts the flow that matches the filter.
protocol Traffic from a specific protocol. Use an asterisk (*) to indicate any protocol. Enter an integer from 0 to 255.
Review possible protocol numbers at the Internet Assigned Numbers Authority (IANA) website:
http://www.iana.org/assignments/protocol-numbers
port Traffic destined to a specific destination port. Enter an integer from 0 to 65535. To define a specific port number, you must define a specific protocol number.
Use an asterisk (*) to indicate any destination port. You can use an asterisk if you configure the protocol number to 6 (TCP) or 17 (UDP).
Review possible port numbers at the Internet Assigned Numbers Authority (IANA) website:
http://www.iana.org/assignments/port-numbers
start-offset Offset, in bytes, from the beginning of the packet payload, where the pattern matching for the pattern-expression argument begins. The default is 0, which is the start of the payload. Enter an integer from 0 to 1800.
If you copy the pattern from the show packet-dump signatures command output, copy this argument from the Start Offset field in the command output.
end-offset Offset, in bytes, from the beginning of the packet payload, where the pattern matching for the pattern-expression argument ends. The default is the packet length, which is the end of the payload. Enter an integer from 0 to 1800.
If you copy the pattern from the show packet-dump signatures command output, copy this argument from the End Offset field in the command output.
ignore-case Defines the pattern-expression argument as case insensitive.
By default, the pattern-expression argument is case sensitive.
6-4Cisco Traffic Anomaly Detector Module Configuration Guide
OL-11857-01
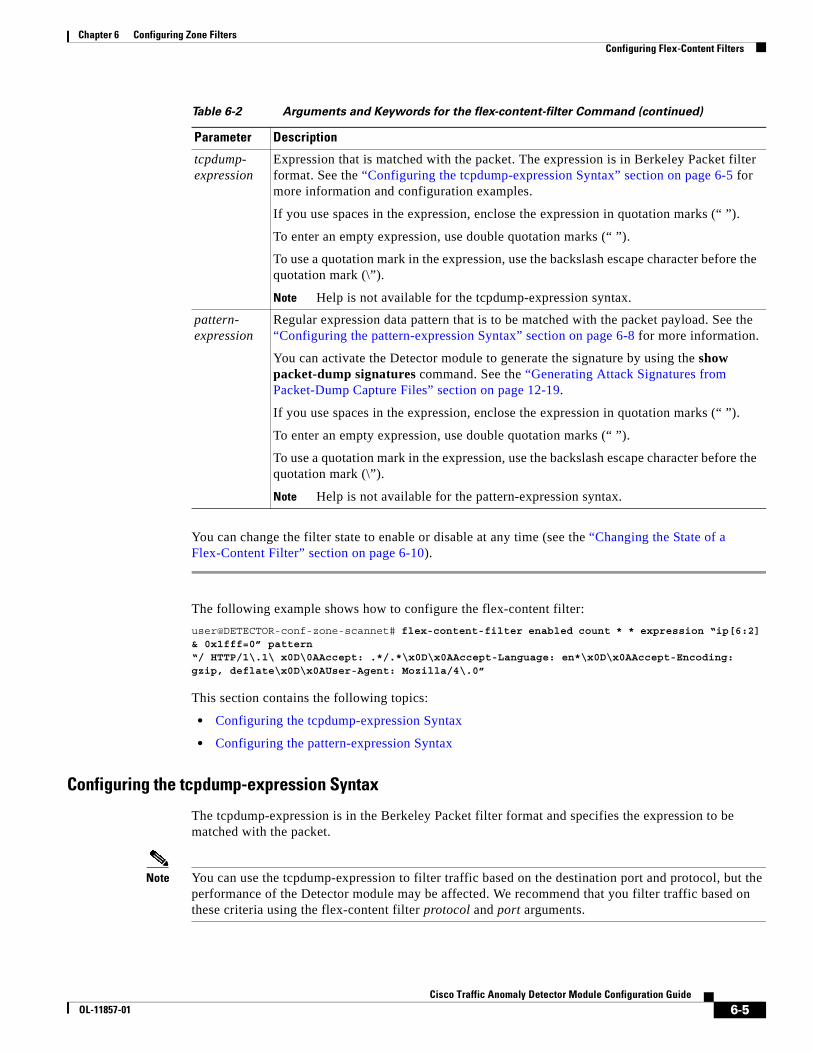
Chapter 6 Configuring Zone FiltersConfiguring Flex-Content Filters
You can change the filter state to enable or disable at any time (see the “Changing the State of a Flex-Content Filter” section on page 6-10).
The following example shows how to configure the flex-content filter:
user@DETECTOR-conf-zone-scannet# flex-content-filter enabled count * * expression “ip[6:2] & 0x1fff=0” pattern “/ HTTP/1\.1\ x0D\0AAccept: .*/.*\x0D\x0AAccept-Language: en*\x0D\x0AAccept-Encoding: gzip, deflate\x0D\x0AUser-Agent: Mozilla/4\.0”
This section contains the following topics:
• Configuring the tcpdump-expression Syntax
• Configuring the pattern-expression Syntax
Configuring the tcpdump-expression Syntax
The tcpdump-expression is in the Berkeley Packet filter format and specifies the expression to be matched with the packet.
Note You can use the tcpdump-expression to filter traffic based on the destination port and protocol, but the performance of the Detector module may be affected. We recommend that you filter traffic based on these criteria using the flex-content filter protocol and port arguments.
tcpdump- expression
Expression that is matched with the packet. The expression is in Berkeley Packet filter format. See the “Configuring the tcpdump-expression Syntax” section on page 6-5 for more information and configuration examples.
If you use spaces in the expression, enclose the expression in quotation marks (“ ”).
To enter an empty expression, use double quotation marks (“ ”).
To use a quotation mark in the expression, use the backslash escape character before the quotation mark (\”).
Note Help is not available for the tcpdump-expression syntax.
pattern- expression
Regular expression data pattern that is to be matched with the packet payload. See the “Configuring the pattern-expression Syntax” section on page 6-8 for more information.
You can activate the Detector module to generate the signature by using the show packet-dump signatures command. See the “Generating Attack Signatures from Packet-Dump Capture Files” section on page 12-19.
If you use spaces in the expression, enclose the expression in quotation marks (“ ”).
To enter an empty expression, use double quotation marks (“ ”).
To use a quotation mark in the expression, use the backslash escape character before the quotation mark (\”).
Note Help is not available for the pattern-expression syntax.
Table 6-2 Arguments and Keywords for the flex-content-filter Command (continued)
Parameter Description
6-5Cisco Traffic Anomaly Detector Module Configuration Guide
OL-11857-01
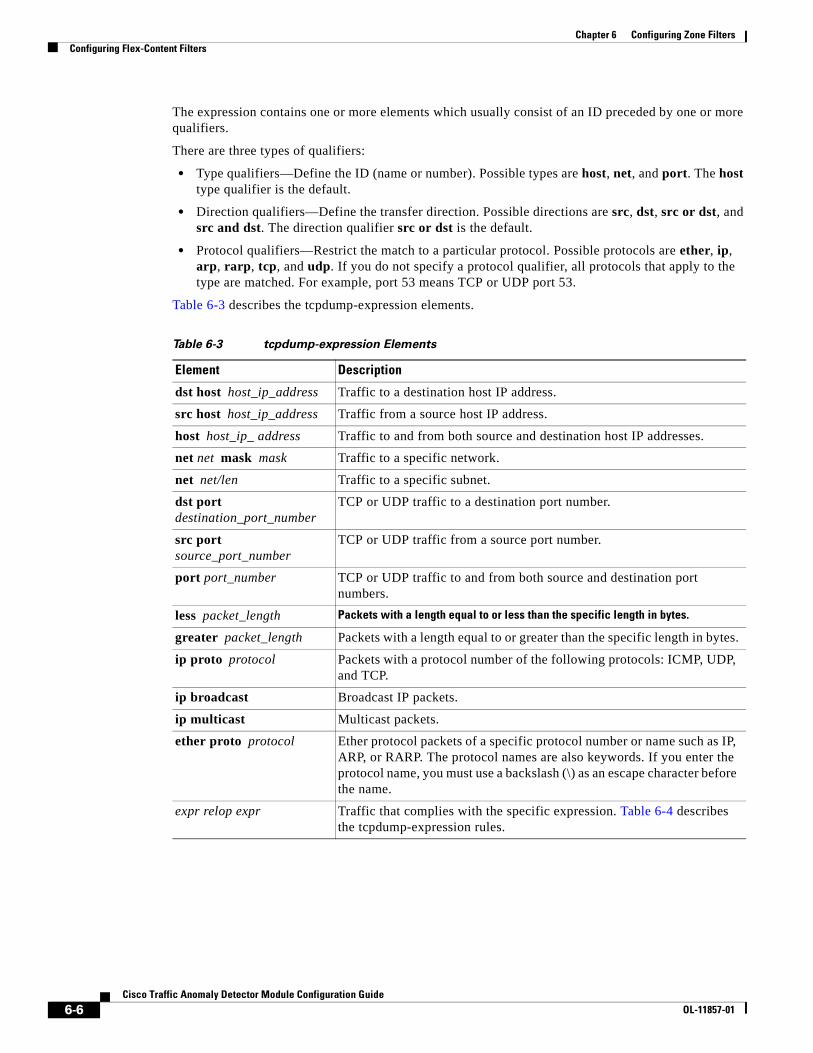
Chapter 6 Configuring Zone FiltersConfiguring Flex-Content Filters
The expression contains one or more elements which usually consist of an ID preceded by one or more qualifiers.
There are three types of qualifiers:
• Type qualifiers—Define the ID (name or number). Possible types are host, net, and port. The host type qualifier is the default.
• Direction qualifiers—Define the transfer direction. Possible directions are src, dst, src or dst, and src and dst. The direction qualifier src or dst is the default.
• Protocol qualifiers—Restrict the match to a particular protocol. Possible protocols are ether, ip, arp, rarp, tcp, and udp. If you do not specify a protocol qualifier, all protocols that apply to the type are matched. For example, port 53 means TCP or UDP port 53.
Table 6-3 describes the tcpdump-expression elements.
Table 6-3 tcpdump-expression Elements
Element Description
dst host host_ip_address Traffic to a destination host IP address.
src host host_ip_address Traffic from a source host IP address.
host host_ip_ address Traffic to and from both source and destination host IP addresses.
net net mask mask Traffic to a specific network.
net net/len Traffic to a specific subnet.
dst port destination_port_number
TCP or UDP traffic to a destination port number.
src port source_port_number
TCP or UDP traffic from a source port number.
port port_number TCP or UDP traffic to and from both source and destination port numbers.
less packet_length Packets with a length equal to or less than the specific length in bytes.
greater packet_length Packets with a length equal to or greater than the specific length in bytes.
ip proto protocol Packets with a protocol number of the following protocols: ICMP, UDP, and TCP.
ip broadcast Broadcast IP packets.
ip multicast Multicast packets.
ether proto protocol Ether protocol packets of a specific protocol number or name such as IP, ARP, or RARP. The protocol names are also keywords. If you enter the protocol name, you must use a backslash (\) as an escape character before the name.
expr relop expr Traffic that complies with the specific expression. Table 6-4 describes the tcpdump-expression rules.
6-6Cisco Traffic Anomaly Detector Module Configuration Guide
OL-11857-01
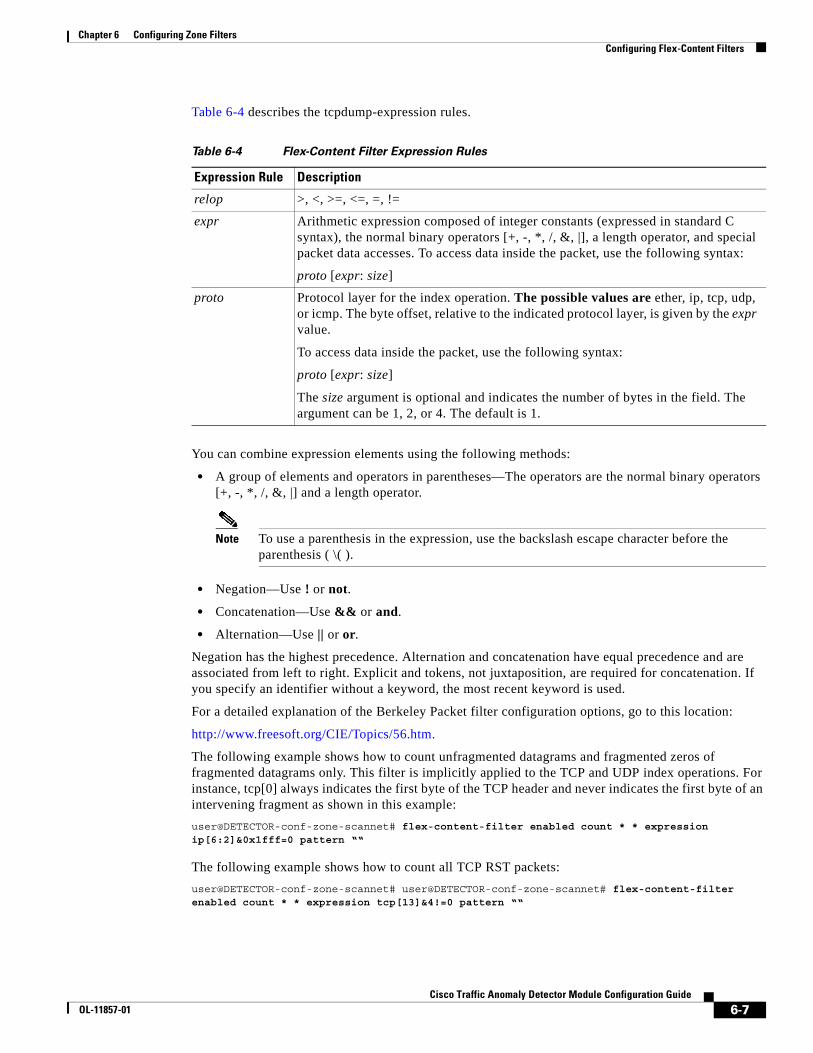
Chapter 6 Configuring Zone FiltersConfiguring Flex-Content Filters
Table 6-4 describes the tcpdump-expression rules.
You can combine expression elements using the following methods:
• A group of elements and operators in parentheses—The operators are the normal binary operators [+, -, *, /, &, |] and a length operator.
Note To use a parenthesis in the expression, use the backslash escape character before the parenthesis ( \( ).
• Negation—Use ! or not.
• Concatenation—Use && or and.
• Alternation—Use || or or.
Negation has the highest precedence. Alternation and concatenation have equal precedence and are associated from left to right. Explicit and tokens, not juxtaposition, are required for concatenation. If you specify an identifier without a keyword, the most recent keyword is used.
For a detailed explanation of the Berkeley Packet filter configuration options, go to this location:
http://www.freesoft.org/CIE/Topics/56.htm.
The following example shows how to count unfragmented datagrams and fragmented zeros of fragmented datagrams only. This filter is implicitly applied to the TCP and UDP index operations. For instance, tcp[0] always indicates the first byte of the TCP header and never indicates the first byte of an intervening fragment as shown in this example:
user@DETECTOR-conf-zone-scannet# flex-content-filter enabled count * * expression ip[6:2]&0x1fff=0 pattern ““
The following example shows how to count all TCP RST packets:
user@DETECTOR-conf-zone-scannet# user@DETECTOR-conf-zone-scannet# flex-content-filter enabled count * * expression tcp[13]&4!=0 pattern ““
Table 6-4 Flex-Content Filter Expression Rules
Expression Rule Description
relop >, <, >=, <=, =, !=
expr Arithmetic expression composed of integer constants (expressed in standard C syntax), the normal binary operators [+, -, *, /, &, |], a length operator, and special packet data accesses. To access data inside the packet, use the following syntax:
proto [expr: size]
proto Protocol layer for the index operation. The possible values are ether, ip, tcp, udp, or icmp. The byte offset, relative to the indicated protocol layer, is given by the expr value.
To access data inside the packet, use the following syntax:
proto [expr: size]
The size argument is optional and indicates the number of bytes in the field. The argument can be 1, 2, or 4. The default is 1.
6-7Cisco Traffic Anomaly Detector Module Configuration Guide
OL-11857-01
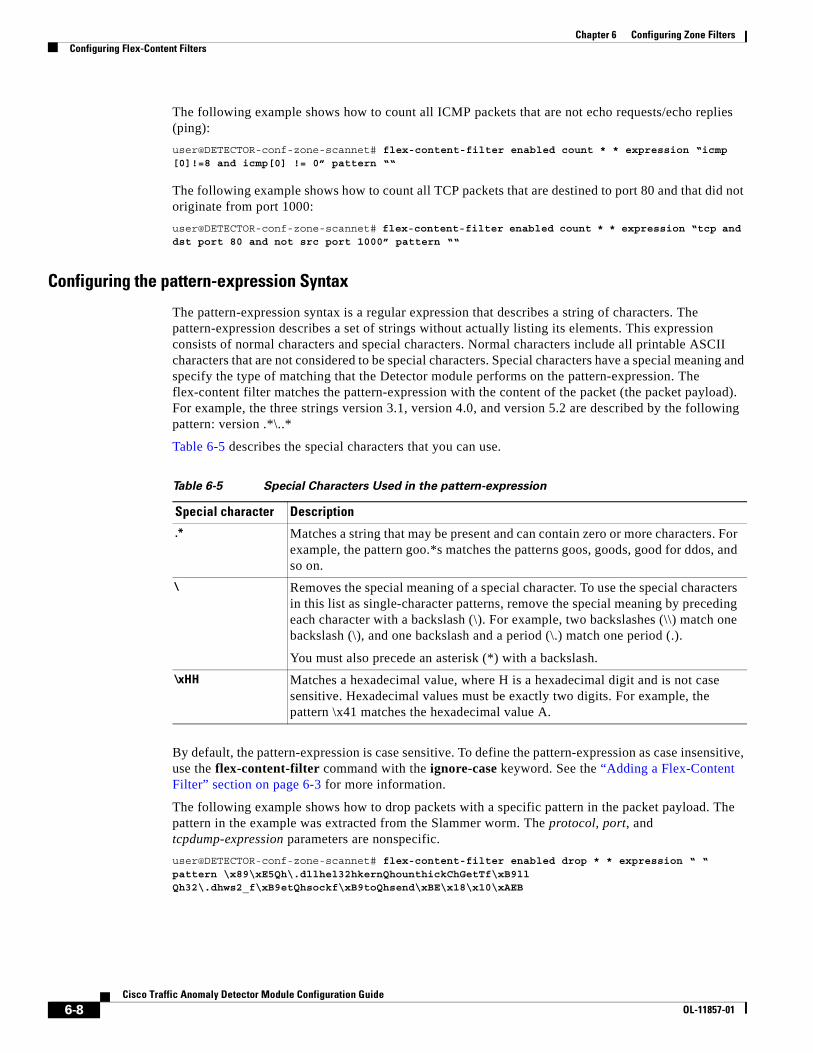
Chapter 6 Configuring Zone FiltersConfiguring Flex-Content Filters
The following example shows how to count all ICMP packets that are not echo requests/echo replies (ping):
user@DETECTOR-conf-zone-scannet# flex-content-filter enabled count * * expression “icmp [0]!=8 and icmp[0] != 0” pattern ““
The following example shows how to count all TCP packets that are destined to port 80 and that did not originate from port 1000:
user@DETECTOR-conf-zone-scannet# flex-content-filter enabled count * * expression “tcp and dst port 80 and not src port 1000” pattern ““
Configuring the pattern-expression Syntax
The pattern-expression syntax is a regular expression that describes a string of characters. The pattern-expression describes a set of strings without actually listing its elements. This expression consists of normal characters and special characters. Normal characters include all printable ASCII characters that are not considered to be special characters. Special characters have a special meaning and specify the type of matching that the Detector module performs on the pattern-expression. The flex-content filter matches the pattern-expression with the content of the packet (the packet payload). For example, the three strings version 3.1, version 4.0, and version 5.2 are described by the following pattern: version .*\..*
Table 6-5 describes the special characters that you can use.
By default, the pattern-expression is case sensitive. To define the pattern-expression as case insensitive, use the flex-content-filter command with the ignore-case keyword. See the “Adding a Flex-Content Filter” section on page 6-3 for more information.
The following example shows how to drop packets with a specific pattern in the packet payload. The pattern in the example was extracted from the Slammer worm. The protocol, port, and tcpdump-expression parameters are nonspecific.
user@DETECTOR-conf-zone-scannet# flex-content-filter enabled drop * * expression “ “ pattern \x89\xE5Qh\.dllhel32hkernQhounthickChGetTf\xB9ll Qh32\.dhws2_f\xB9etQhsockf\xB9toQhsend\xBE\x18\x10\xAEB
Table 6-5 Special Characters Used in the pattern-expression
Special character Description
.* Matches a string that may be present and can contain zero or more characters. For example, the pattern goo.*s matches the patterns goos, goods, good for ddos, and so on.
\ Removes the special meaning of a special character. To use the special characters in this list as single-character patterns, remove the special meaning by preceding each character with a backslash (\). For example, two backslashes (\\) match one backslash (\), and one backslash and a period (\.) match one period (.).
You must also precede an asterisk (*) with a backslash.
\xHH Matches a hexadecimal value, where H is a hexadecimal digit and is not case sensitive. Hexadecimal values must be exactly two digits. For example, the pattern \x41 matches the hexadecimal value A.
6-8Cisco Traffic Anomaly Detector Module Configuration Guide
OL-11857-01
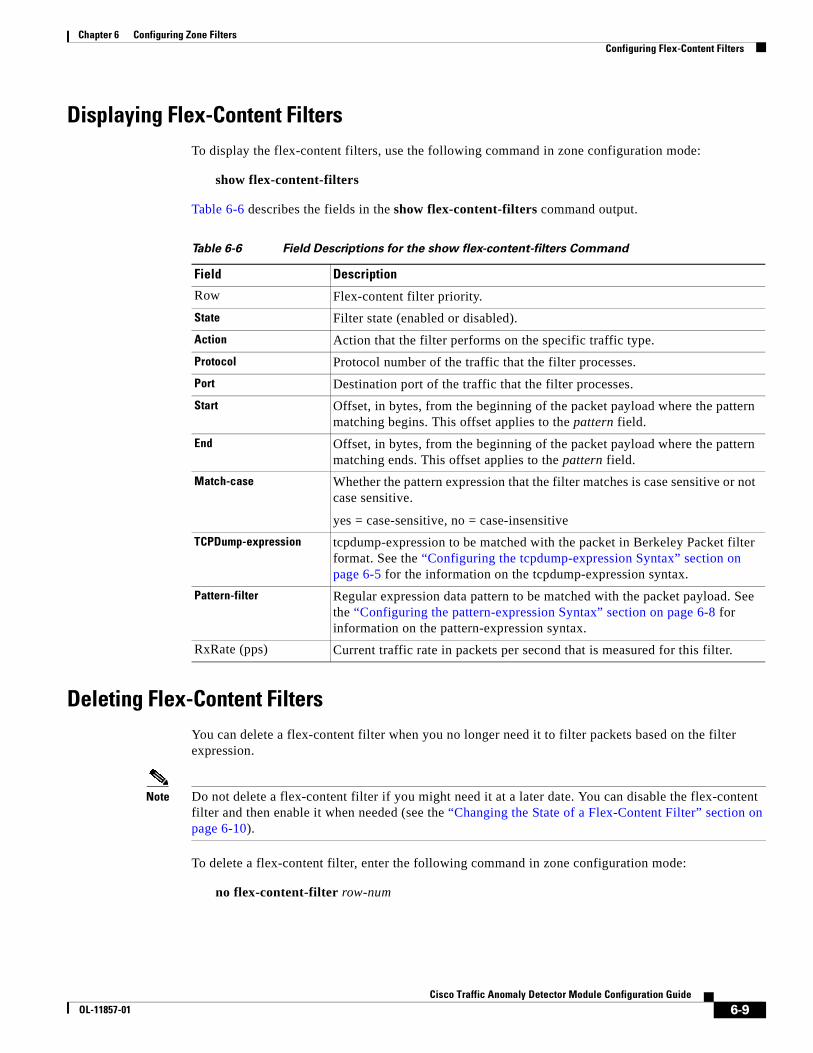
Chapter 6 Configuring Zone FiltersConfiguring Flex-Content Filters
Displaying Flex-Content FiltersTo display the flex-content filters, use the following command in zone configuration mode:
show flex-content-filters
Table 6-6 describes the fields in the show flex-content-filters command output.
Deleting Flex-Content FiltersYou can delete a flex-content filter when you no longer need it to filter packets based on the filter expression.
Note Do not delete a flex-content filter if you might need it at a later date. You can disable the flex-content filter and then enable it when needed (see the “Changing the State of a Flex-Content Filter” section on page 6-10).
To delete a flex-content filter, enter the following command in zone configuration mode:
no flex-content-filter row-num
Table 6-6 Field Descriptions for the show flex-content-filters Command
Field Description
Row Flex-content filter priority.
State Filter state (enabled or disabled).
Action Action that the filter performs on the specific traffic type.
Protocol Protocol number of the traffic that the filter processes.
Port Destination port of the traffic that the filter processes.
Start Offset, in bytes, from the beginning of the packet payload where the pattern matching begins. This offset applies to the pattern field.
End Offset, in bytes, from the beginning of the packet payload where the pattern matching ends. This offset applies to the pattern field.
Match-case Whether the pattern expression that the filter matches is case sensitive or not case sensitive.
yes = case-sensitive, no = case-insensitive
TCPDump-expression tcpdump-expression to be matched with the packet in Berkeley Packet filter format. See the “Configuring the tcpdump-expression Syntax” section on page 6-5 for the information on the tcpdump-expression syntax.
Pattern-filter Regular expression data pattern to be matched with the packet payload. See the “Configuring the pattern-expression Syntax” section on page 6-8 for information on the pattern-expression syntax.
RxRate (pps) Current traffic rate in packets per second that is measured for this filter.
6-9Cisco Traffic Anomaly Detector Module Configuration Guide
OL-11857-01
Chapter 6 Configuring Zone FiltersConfiguring Bypass Filters
The row-num argument specifies the flex-content filter row number to delete. To display the list of flex-content filters and identify the row number of the flex-content filter to delete, use the show flex-content-filters command (see the “Displaying Flex-Content Filters” section on page 6-9). To delete all flex-content filters, enter an asterisk (*) for the row number.
The following example shows how to delete a flex-content filter:
user@DETECTOR-conf-zone-scannet# no flex-content-filters 5
Changing the State of a Flex-Content FilterYou can disable a flex-content filter to prevent the Detector module from filtering packets based on the filter expression and to prevent it from filtering specific types of traffic. When you disable the filter, it remains in the flex-content filter list, which allows you to enable the filter again if needed.
If you do not intend to use a flex-content filter again, you can delete it (see the “Deleting Flex-Content Filters” section on page 6-9).
To change the state of a flex-content filter, enter the following command in zone configuration mode:
flex-content-filter row-num {disabled | enabled}
The row-num argument specifies the flex-content filter row number. To display the list of flex-content filters and identify the row number of the flex-content filter to enable or disable, enter the show flex-content-filters command (see the “Displaying Flex-Content Filters” section on page 6-9).
The following example shows how to disable a flex-content filter:
user@DETECTOR-conf-zone-scannet# flex-content-filters 5 disabled
Configuring Bypass FiltersThe bypass filter prevents the Detector module from analyzing specific traffic flows by directing trusted traffic away from the Detector module’s anomaly detection functions.
This section contains the following topics:
• Adding a Bypass Filter
• Displaying Bypass Filters
• Deleting Bypass Filters
Adding a Bypass FilterTo add a bypass filter, use the following command in zone configuration mode:
bypass-filter row-num src-ip [ip-mask] protocol dest-port [fragments-type]
6-10Cisco Traffic Anomaly Detector Module Configuration Guide
OL-11857-01
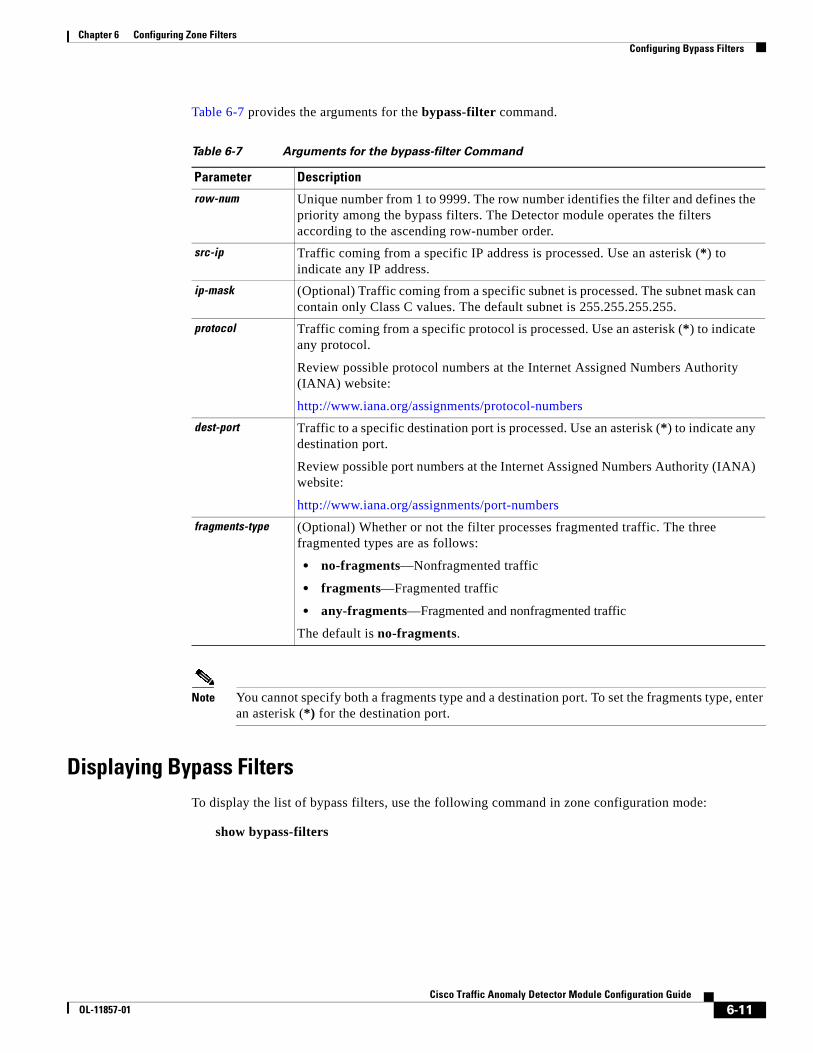
Chapter 6 Configuring Zone FiltersConfiguring Bypass Filters
Table 6-7 provides the arguments for the bypass-filter command.
Note You cannot specify both a fragments type and a destination port. To set the fragments type, enter an asterisk (*) for the destination port.
Displaying Bypass FiltersTo display the list of bypass filters, use the following command in zone configuration mode:
show bypass-filters
Table 6-7 Arguments for the bypass-filter Command
Parameter Description
row-num Unique number from 1 to 9999. The row number identifies the filter and defines the priority among the bypass filters. The Detector module operates the filters according to the ascending row-number order.
src-ip Traffic coming from a specific IP address is processed. Use an asterisk (*) to indicate any IP address.
ip-mask (Optional) Traffic coming from a specific subnet is processed. The subnet mask can contain only Class C values. The default subnet is 255.255.255.255.
protocol Traffic coming from a specific protocol is processed. Use an asterisk (*) to indicate any protocol.
Review possible protocol numbers at the Internet Assigned Numbers Authority (IANA) website:
http://www.iana.org/assignments/protocol-numbers
dest-port Traffic to a specific destination port is processed. Use an asterisk (*) to indicate any destination port.
Review possible port numbers at the Internet Assigned Numbers Authority (IANA) website:
http://www.iana.org/assignments/port-numbers
fragments-type (Optional) Whether or not the filter processes fragmented traffic. The three fragmented types are as follows:
• no-fragments—Nonfragmented traffic
• fragments—Fragmented traffic
• any-fragments—Fragmented and nonfragmented traffic
The default is no-fragments.
6-11Cisco Traffic Anomaly Detector Module Configuration Guide
OL-11857-01
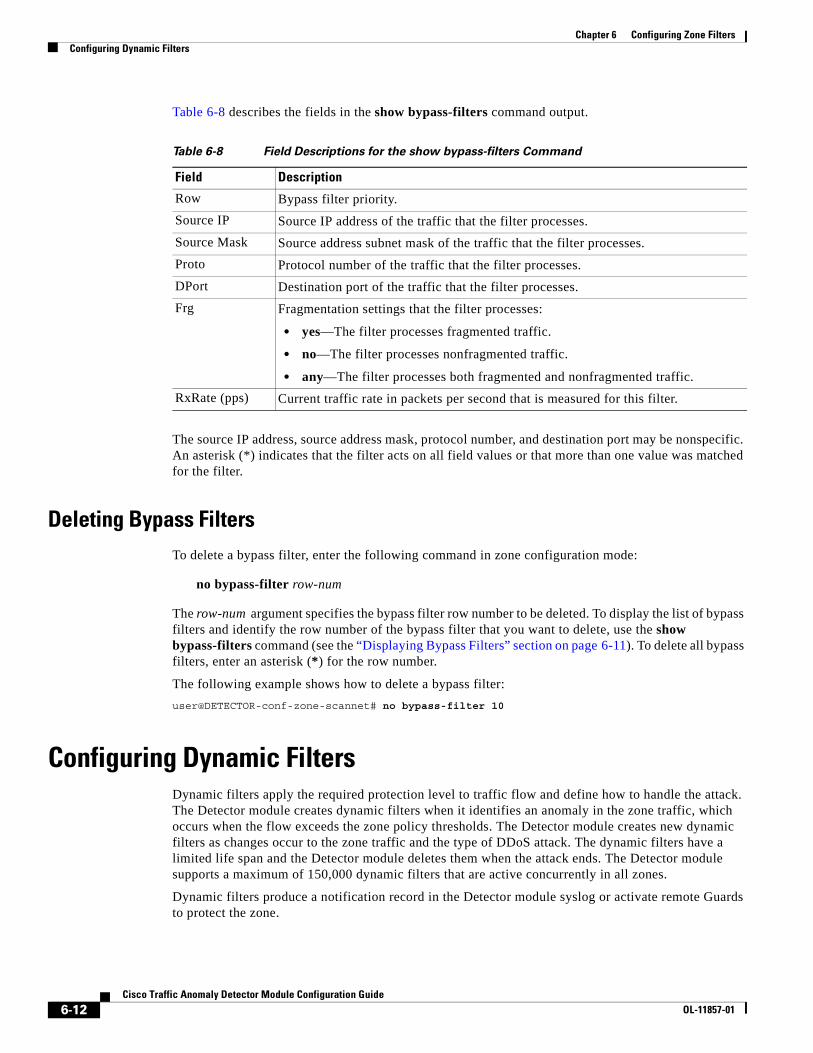
Chapter 6 Configuring Zone FiltersConfiguring Dynamic Filters
Table 6-8 describes the fields in the show bypass-filters command output.
The source IP address, source address mask, protocol number, and destination port may be nonspecific. An asterisk (*) indicates that the filter acts on all field values or that more than one value was matched for the filter.
Deleting Bypass FiltersTo delete a bypass filter, enter the following command in zone configuration mode:
no bypass-filter row-num
The row-num argument specifies the bypass filter row number to be deleted. To display the list of bypass filters and identify the row number of the bypass filter that you want to delete, use the show bypass-filters command (see the “Displaying Bypass Filters” section on page 6-11). To delete all bypass filters, enter an asterisk (*) for the row number.
The following example shows how to delete a bypass filter:
user@DETECTOR-conf-zone-scannet# no bypass-filter 10
Configuring Dynamic FiltersDynamic filters apply the required protection level to traffic flow and define how to handle the attack. The Detector module creates dynamic filters when it identifies an anomaly in the zone traffic, which occurs when the flow exceeds the zone policy thresholds. The Detector module creates new dynamic filters as changes occur to the zone traffic and the type of DDoS attack. The dynamic filters have a limited life span and the Detector module deletes them when the attack ends. The Detector module supports a maximum of 150,000 dynamic filters that are active concurrently in all zones.
Dynamic filters produce a notification record in the Detector module syslog or activate remote Guards to protect the zone.
Table 6-8 Field Descriptions for the show bypass-filters Command
Field Description
Row Bypass filter priority.
Source IP Source IP address of the traffic that the filter processes.
Source Mask Source address subnet mask of the traffic that the filter processes.
Proto Protocol number of the traffic that the filter processes.
DPort Destination port of the traffic that the filter processes.
Frg Fragmentation settings that the filter processes:
• yes—The filter processes fragmented traffic.
• no—The filter processes nonfragmented traffic.
• any—The filter processes both fragmented and nonfragmented traffic.
RxRate (pps) Current traffic rate in packets per second that is measured for this filter.
6-12Cisco Traffic Anomaly Detector Module Configuration Guide
OL-11857-01
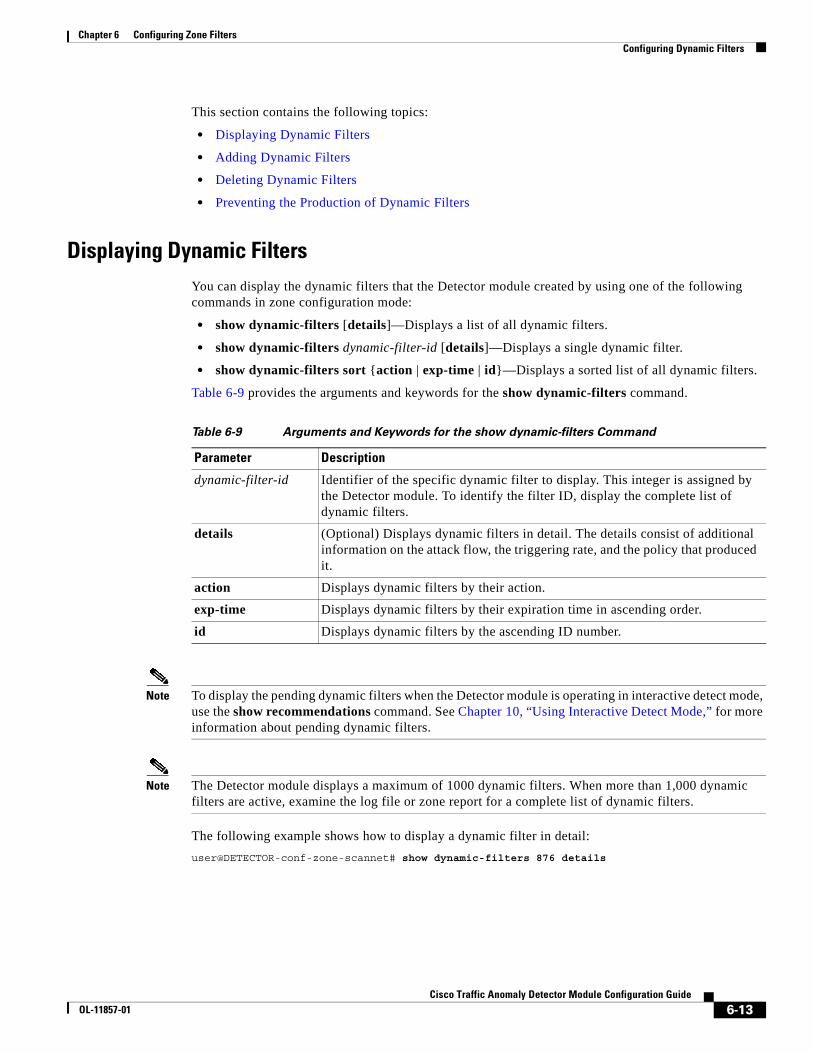
Chapter 6 Configuring Zone FiltersConfiguring Dynamic Filters
This section contains the following topics:
• Displaying Dynamic Filters
• Adding Dynamic Filters
• Deleting Dynamic Filters
• Preventing the Production of Dynamic Filters
Displaying Dynamic FiltersYou can display the dynamic filters that the Detector module created by using one of the following commands in zone configuration mode:
• show dynamic-filters [details]—Displays a list of all dynamic filters.
• show dynamic-filters dynamic-filter-id [details]—Displays a single dynamic filter.
• show dynamic-filters sort {action | exp-time | id}—Displays a sorted list of all dynamic filters.
Table 6-9 provides the arguments and keywords for the show dynamic-filters command.
Note To display the pending dynamic filters when the Detector module is operating in interactive detect mode, use the show recommendations command. See Chapter 10, “Using Interactive Detect Mode,” for more information about pending dynamic filters.
Note The Detector module displays a maximum of 1000 dynamic filters. When more than 1,000 dynamic filters are active, examine the log file or zone report for a complete list of dynamic filters.
The following example shows how to display a dynamic filter in detail:
user@DETECTOR-conf-zone-scannet# show dynamic-filters 876 details
Table 6-9 Arguments and Keywords for the show dynamic-filters Command
Parameter Description
dynamic-filter-id Identifier of the specific dynamic filter to display. This integer is assigned by the Detector module. To identify the filter ID, display the complete list of dynamic filters.
details (Optional) Displays dynamic filters in detail. The details consist of additional information on the attack flow, the triggering rate, and the policy that produced it.
action Displays dynamic filters by their action.
exp-time Displays dynamic filters by their expiration time in ascending order.
id Displays dynamic filters by the ascending ID number.
6-13Cisco Traffic Anomaly Detector Module Configuration Guide
OL-11857-01
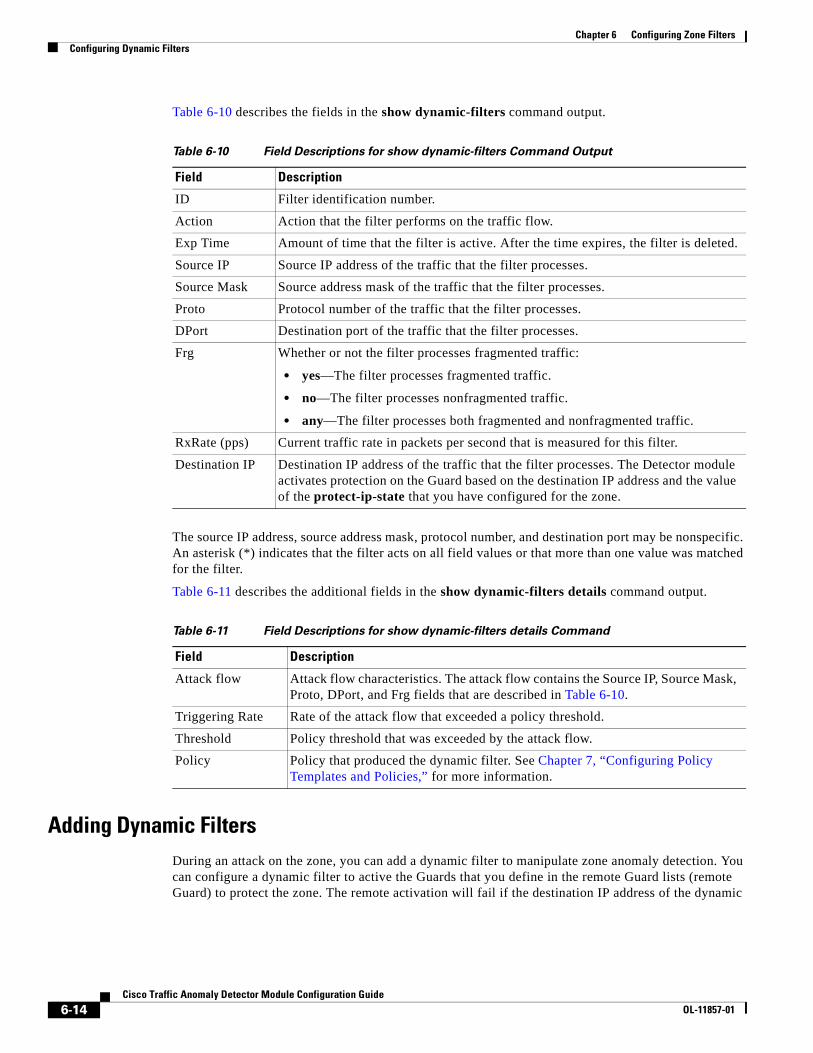
Chapter 6 Configuring Zone FiltersConfiguring Dynamic Filters
Table 6-10 describes the fields in the show dynamic-filters command output.
The source IP address, source address mask, protocol number, and destination port may be nonspecific. An asterisk (*) indicates that the filter acts on all field values or that more than one value was matched for the filter.
Table 6-11 describes the additional fields in the show dynamic-filters details command output.
Adding Dynamic FiltersDuring an attack on the zone, you can add a dynamic filter to manipulate zone anomaly detection. You can configure a dynamic filter to active the Guards that you define in the remote Guard lists (remote Guard) to protect the zone. The remote activation will fail if the destination IP address of the dynamic
Table 6-10 Field Descriptions for show dynamic-filters Command Output
Field Description
ID Filter identification number.
Action Action that the filter performs on the traffic flow.
Exp Time Amount of time that the filter is active. After the time expires, the filter is deleted.
Source IP Source IP address of the traffic that the filter processes.
Source Mask Source address mask of the traffic that the filter processes.
Proto Protocol number of the traffic that the filter processes.
DPort Destination port of the traffic that the filter processes.
Frg Whether or not the filter processes fragmented traffic:
• yes—The filter processes fragmented traffic.
• no—The filter processes nonfragmented traffic.
• any—The filter processes both fragmented and nonfragmented traffic.
RxRate (pps) Current traffic rate in packets per second that is measured for this filter.
Destination IP Destination IP address of the traffic that the filter processes. The Detector module activates protection on the Guard based on the destination IP address and the value of the protect-ip-state that you have configured for the zone.
Table 6-11 Field Descriptions for show dynamic-filters details Command
Field Description
Attack flow Attack flow characteristics. The attack flow contains the Source IP, Source Mask, Proto, DPort, and Frg fields that are described in Table 6-10.
Triggering Rate Rate of the attack flow that exceeded a policy threshold.
Threshold Policy threshold that was exceeded by the attack flow.
Policy Policy that produced the dynamic filter. See Chapter 7, “Configuring Policy Templates and Policies,” for more information.
6-14Cisco Traffic Anomaly Detector Module Configuration Guide
OL-11857-01
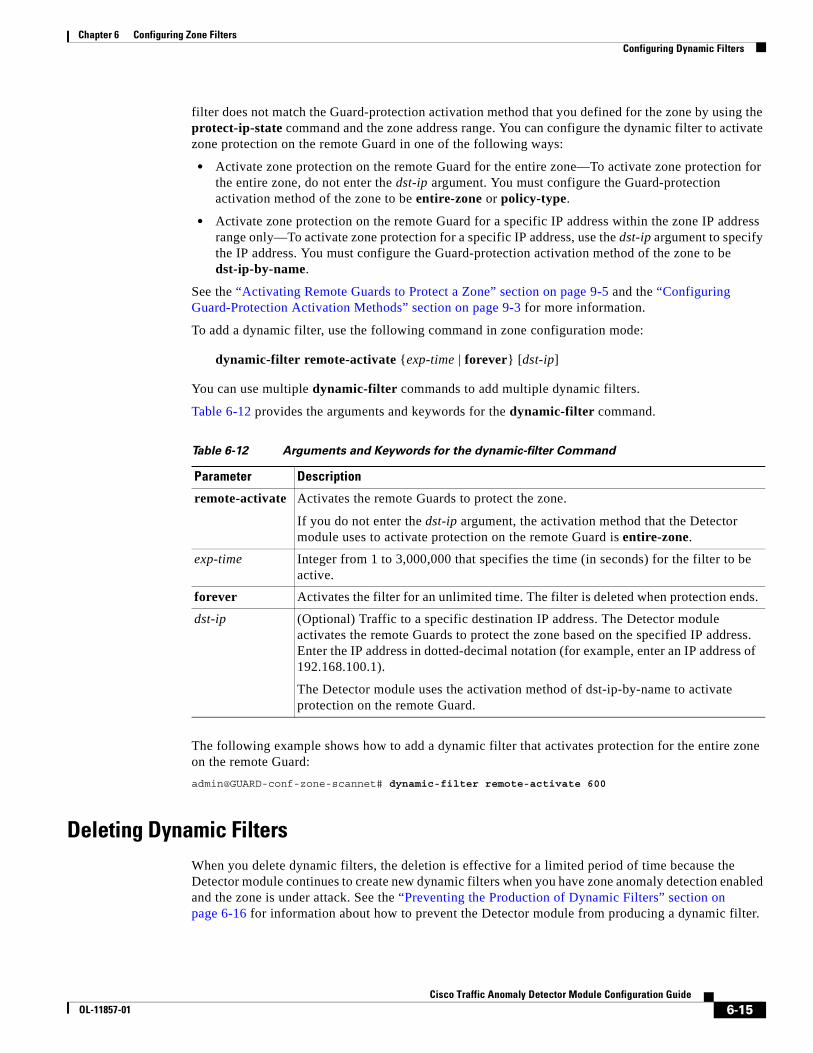
Chapter 6 Configuring Zone FiltersConfiguring Dynamic Filters
filter does not match the Guard-protection activation method that you defined for the zone by using the protect-ip-state command and the zone address range. You can configure the dynamic filter to activate zone protection on the remote Guard in one of the following ways:
• Activate zone protection on the remote Guard for the entire zone—To activate zone protection for the entire zone, do not enter the dst-ip argument. You must configure the Guard-protection activation method of the zone to be entire-zone or policy-type.
• Activate zone protection on the remote Guard for a specific IP address within the zone IP address range only—To activate zone protection for a specific IP address, use the dst-ip argument to specify the IP address. You must configure the Guard-protection activation method of the zone to be dst-ip-by-name.
See the “Activating Remote Guards to Protect a Zone” section on page 9-5 and the “Configuring Guard-Protection Activation Methods” section on page 9-3 for more information.
To add a dynamic filter, use the following command in zone configuration mode:
dynamic-filter remote-activate {exp-time | forever} [dst-ip]
You can use multiple dynamic-filter commands to add multiple dynamic filters.
Table 6-12 provides the arguments and keywords for the dynamic-filter command.
The following example shows how to add a dynamic filter that activates protection for the entire zone on the remote Guard:
admin@GUARD-conf-zone-scannet# dynamic-filter remote-activate 600
Deleting Dynamic FiltersWhen you delete dynamic filters, the deletion is effective for a limited period of time because the Detector module continues to create new dynamic filters when you have zone anomaly detection enabled and the zone is under attack. See the “Preventing the Production of Dynamic Filters” section on page 6-16 for information about how to prevent the Detector module from producing a dynamic filter.
Table 6-12 Arguments and Keywords for the dynamic-filter Command
Parameter Description
remote-activate Activates the remote Guards to protect the zone.
If you do not enter the dst-ip argument, the activation method that the Detector module uses to activate protection on the remote Guard is entire-zone.
exp-time Integer from 1 to 3,000,000 that specifies the time (in seconds) for the filter to be active.
forever Activates the filter for an unlimited time. The filter is deleted when protection ends.
dst-ip (Optional) Traffic to a specific destination IP address. The Detector module activates the remote Guards to protect the zone based on the specified IP address. Enter the IP address in dotted-decimal notation (for example, enter an IP address of 192.168.100.1).
The Detector module uses the activation method of dst-ip-by-name to activate protection on the remote Guard.
6-15Cisco Traffic Anomaly Detector Module Configuration Guide
OL-11857-01
Chapter 6 Configuring Zone FiltersConfiguring Dynamic Filters
To delete a dynamic filter, enter the following command in zone configuration mode:
no dynamic-filter dynamic-filter-id
The dynamic-filter-id argument specifies the dynamic filter ID. To display the list of dynamic filters and identify the ID of the dynamic filter to delete, use the show dynamic-filters command (see the “Displaying Dynamic Filters” section on page 6-13). To delete all zone dynamic filters, enter an asterisk (*) for the dynamic filter identifier.
The following example shows how to delete a dynamic filter:
user@DETECTOR-conf-zone-scannet# no dynamic-filter 876
Preventing the Production of Dynamic FiltersTo prevent the Detector module from producing unwanted dynamic filters, perform one of the following actions:
• Deactivate the policy that produces the dynamic filters (see the “Changing the Policy State” section on page 7-13 for more information). To determine which policy produced the unwanted dynamic filters, see the “Displaying Dynamic Filters” section on page 6-13.
• Configure a bypass filter for the desired traffic flow (see the “Configuring Bypass Filters” section on page 6-10).
• Increase the threshold of the policy that produces the undesired dynamic filter (see the “Configuring the Policy Threshold” section on page 7-13).
6-16Cisco Traffic Anomaly Detector Module Configuration Guide
OL-11857-01
Cisco TraOL-11857-01
C H A P T E R 7
Configuring Policy Templates and PoliciesThis chapter describes the Cisco Traffic Anomaly Detector (Detector module) zone policies, policy structure, and policy templates, and it describes how to configure the zone policy and the policy template parameters.
This chapter refers to the Cisco Guard (Guard), the companion product of the Detector module. The Guard is a Distributed Denial of Service (DDoS) attack detection and mitigation device that cleans the zone traffic as the traffic flows through it, dropping the attack traffic and injecting the legitimate traffic back into the network. When the Detector module determines that the zone is under attack, it can activate the Guard attack mitigation services. The Detector module can also synchronize zone configurations with the Guard. For more information about the Guard, see the Cisco Anomaly Guard Module Configuration Guide or the Cisco Guard Configuration Guide.
This chapter contains the following sections:
• Understanding Zone Policies
• Understanding Policy Templates
• Understanding the Policy Path
• Configuring Policy Parameters
• Understanding Worm Policies
• Monitoring Policies
• Backing Up the Policy Configuration
Understanding Zone PoliciesThe zone policies enable the Detector module to perform a statistical analysis of the zone traffic flow. The zone policies are configured to take action against a particular traffic flow if the flow exceeds the policy thresholds, indicating malicious or abnormal traffic. When a flow exceeds the policy thresholds, the policies configure a set of filters (dynamic filters) dynamically to record the event in its syslog or activate a Guard that you have defined in the remote Guard lists. When activated, the Guard protects the zone by mitigating the attack.
Every zone configuration contains a set of policies. When you create a new zone using a predefined zone template, the Detector module configures the new zone with policies associated with the template. When you create a new zone by copying an existing zone, the Detector module configures the new zone with the policies of the existing zone.
7-1ffic Anomaly Detector Module Configuration Guide
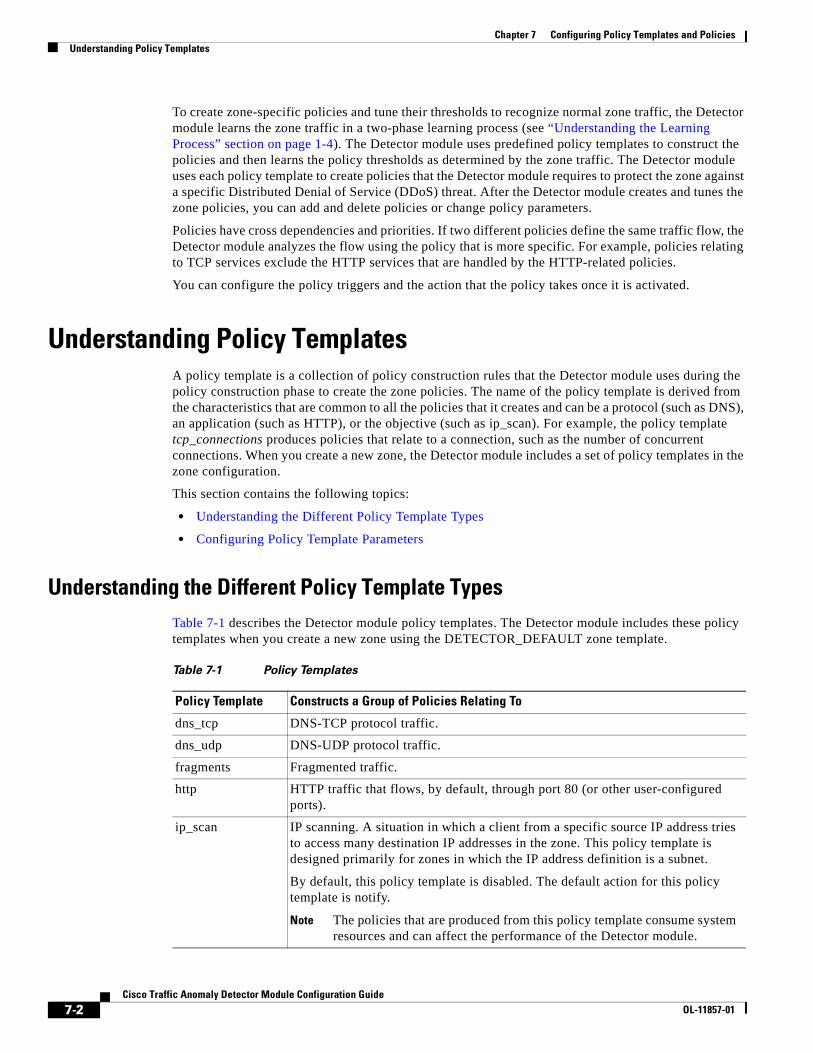
Chapter 7 Configuring Policy Templates and PoliciesUnderstanding Policy Templates
To create zone-specific policies and tune their thresholds to recognize normal zone traffic, the Detector module learns the zone traffic in a two-phase learning process (see “Understanding the Learning Process” section on page 1-4). The Detector module uses predefined policy templates to construct the policies and then learns the policy thresholds as determined by the zone traffic. The Detector module uses each policy template to create policies that the Detector module requires to protect the zone against a specific Distributed Denial of Service (DDoS) threat. After the Detector module creates and tunes the zone policies, you can add and delete policies or change policy parameters.
Policies have cross dependencies and priorities. If two different policies define the same traffic flow, the Detector module analyzes the flow using the policy that is more specific. For example, policies relating to TCP services exclude the HTTP services that are handled by the HTTP-related policies.
You can configure the policy triggers and the action that the policy takes once it is activated.
Understanding Policy TemplatesA policy template is a collection of policy construction rules that the Detector module uses during the policy construction phase to create the zone policies. The name of the policy template is derived from the characteristics that are common to all the policies that it creates and can be a protocol (such as DNS), an application (such as HTTP), or the objective (such as ip_scan). For example, the policy template tcp_connections produces policies that relate to a connection, such as the number of concurrent connections. When you create a new zone, the Detector module includes a set of policy templates in the zone configuration.
This section contains the following topics:
• Understanding the Different Policy Template Types
• Configuring Policy Template Parameters
Understanding the Different Policy Template TypesTable 7-1 describes the Detector module policy templates. The Detector module includes these policy templates when you create a new zone using the DETECTOR_DEFAULT zone template.
Table 7-1 Policy Templates
Policy Template Constructs a Group of Policies Relating To
dns_tcp DNS-TCP protocol traffic.
dns_udp DNS-UDP protocol traffic.
fragments Fragmented traffic.
http HTTP traffic that flows, by default, through port 80 (or other user-configured ports).
ip_scan IP scanning. A situation in which a client from a specific source IP address tries to access many destination IP addresses in the zone. This policy template is designed primarily for zones in which the IP address definition is a subnet.
By default, this policy template is disabled. The default action for this policy template is notify.
Note The policies that are produced from this policy template consume system resources and can affect the performance of the Detector module.
7-2Cisco Traffic Anomaly Detector Module Configuration Guide
OL-11857-01
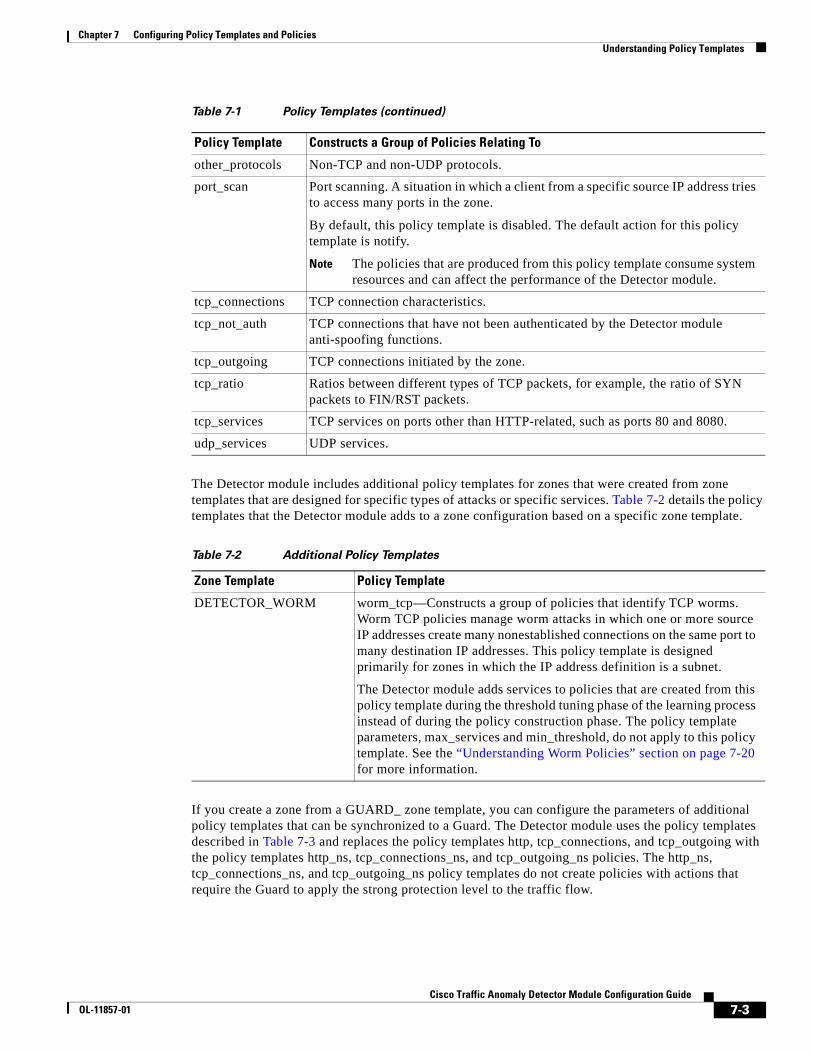
Chapter 7 Configuring Policy Templates and PoliciesUnderstanding Policy Templates
The Detector module includes additional policy templates for zones that were created from zone templates that are designed for specific types of attacks or specific services. Table 7-2 details the policy templates that the Detector module adds to a zone configuration based on a specific zone template.
If you create a zone from a GUARD_ zone template, you can configure the parameters of additional policy templates that can be synchronized to a Guard. The Detector module uses the policy templates described in Table 7-3 and replaces the policy templates http, tcp_connections, and tcp_outgoing with the policy templates http_ns, tcp_connections_ns, and tcp_outgoing_ns policies. The http_ns, tcp_connections_ns, and tcp_outgoing_ns policy templates do not create policies with actions that require the Guard to apply the strong protection level to the traffic flow.
other_protocols Non-TCP and non-UDP protocols.
port_scan Port scanning. A situation in which a client from a specific source IP address tries to access many ports in the zone.
By default, this policy template is disabled. The default action for this policy template is notify.
Note The policies that are produced from this policy template consume system resources and can affect the performance of the Detector module.
tcp_connections TCP connection characteristics.
tcp_not_auth TCP connections that have not been authenticated by the Detector module anti-spoofing functions.
tcp_outgoing TCP connections initiated by the zone.
tcp_ratio Ratios between different types of TCP packets, for example, the ratio of SYN packets to FIN/RST packets.
tcp_services TCP services on ports other than HTTP-related, such as ports 80 and 8080.
udp_services UDP services.
Table 7-1 Policy Templates (continued)
Policy Template Constructs a Group of Policies Relating To
Table 7-2 Additional Policy Templates
Zone Template Policy Template
DETECTOR_WORM worm_tcp—Constructs a group of policies that identify TCP worms. Worm TCP policies manage worm attacks in which one or more source IP addresses create many nonestablished connections on the same port to many destination IP addresses. This policy template is designed primarily for zones in which the IP address definition is a subnet.
The Detector module adds services to policies that are created from this policy template during the threshold tuning phase of the learning process instead of during the policy construction phase. The policy template parameters, max_services and min_threshold, do not apply to this policy template. See the “Understanding Worm Policies” section on page 7-20 for more information.
7-3Cisco Traffic Anomaly Detector Module Configuration Guide
OL-11857-01
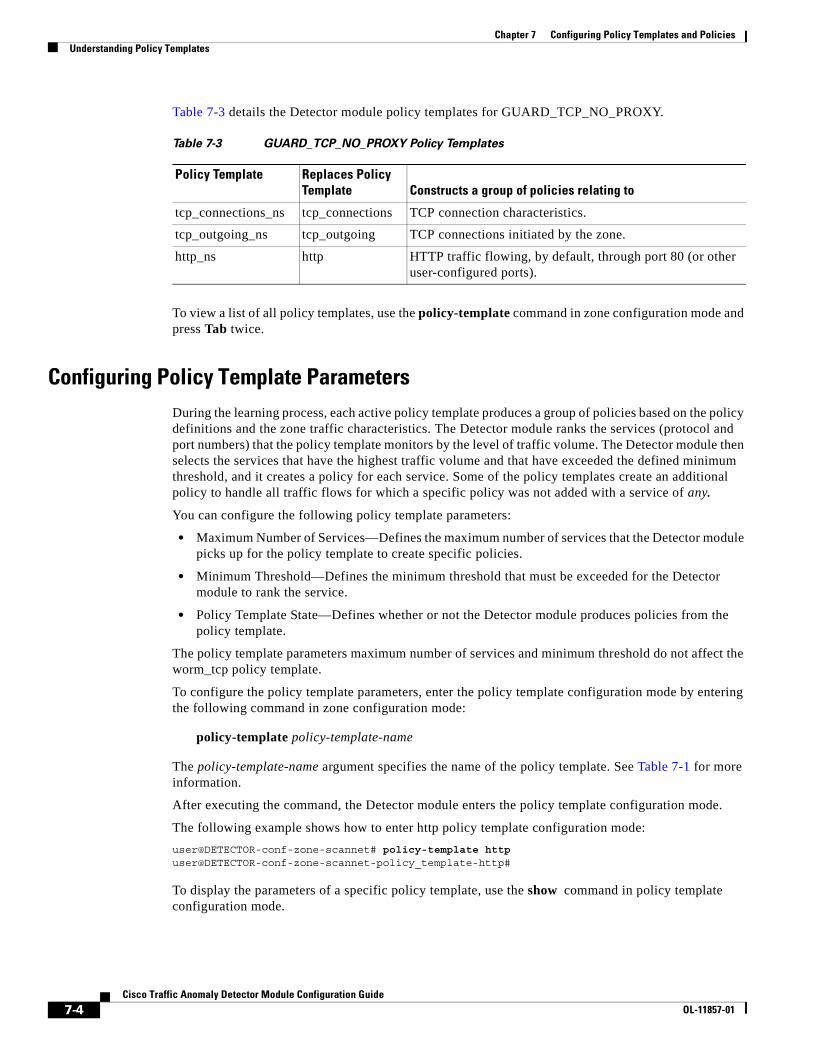
Chapter 7 Configuring Policy Templates and PoliciesUnderstanding Policy Templates
Table 7-3 details the Detector module policy templates for GUARD_TCP_NO_PROXY.
To view a list of all policy templates, use the policy-template command in zone configuration mode and press Tab twice.
Configuring Policy Template ParametersDuring the learning process, each active policy template produces a group of policies based on the policy definitions and the zone traffic characteristics. The Detector module ranks the services (protocol and port numbers) that the policy template monitors by the level of traffic volume. The Detector module then selects the services that have the highest traffic volume and that have exceeded the defined minimum threshold, and it creates a policy for each service. Some of the policy templates create an additional policy to handle all traffic flows for which a specific policy was not added with a service of any.
You can configure the following policy template parameters:
• Maximum Number of Services—Defines the maximum number of services that the Detector module picks up for the policy template to create specific policies.
• Minimum Threshold—Defines the minimum threshold that must be exceeded for the Detector module to rank the service.
• Policy Template State—Defines whether or not the Detector module produces policies from the policy template.
The policy template parameters maximum number of services and minimum threshold do not affect the worm_tcp policy template.
To configure the policy template parameters, enter the policy template configuration mode by entering the following command in zone configuration mode:
policy-template policy-template-name
The policy-template-name argument specifies the name of the policy template. See Table 7-1 for more information.
After executing the command, the Detector module enters the policy template configuration mode.
The following example shows how to enter http policy template configuration mode:
user@DETECTOR-conf-zone-scannet# policy-template httpuser@DETECTOR-conf-zone-scannet-policy_template-http#
To display the parameters of a specific policy template, use the show command in policy template configuration mode.
Table 7-3 GUARD_TCP_NO_PROXY Policy Templates
Policy Template Replaces Policy Template Constructs a group of policies relating to
tcp_connections_ns tcp_connections TCP connection characteristics.
tcp_outgoing_ns tcp_outgoing TCP connections initiated by the zone.
http_ns http HTTP traffic flowing, by default, through port 80 (or other user-configured ports).
7-4Cisco Traffic Anomaly Detector Module Configuration Guide
OL-11857-01
Chapter 7 Configuring Policy Templates and PoliciesUnderstanding Policy Templates
This section contains the following topics:
• Configuring the Maximum Number of Services
• Configuring the Minimum Threshold
• Configuring Policy Template States
• Configuring All Policy Template Parameters Simultaneously
Configuring the Maximum Number of Services
The maximum number of services parameter defines the maximum number of services (protocol numbers or port numbers) for which the policy template selects and creates policies. The Detector module ranks the services by the level of traffic volume for each service. The Detector module then selects the services that have the highest traffic volume and that have exceeded the defined minimum threshold (as defined by the min-threshold parameter), and it creates policies for each service. The Detector module may add an additional policy with a service of any to handle all other traffic flows with the characteristics of the policy template.
Note The higher the maximum number of services, the more Detector module memory the zone requires.
You can only define the maximum number of services parameter for policy templates that detect services: tcp_services, tcp_services_ns, udp_services, and other protocols. You cannot configure it for policy templates that monitor a specific service, such as dns_tcp, which monitors service 53, or for policy templates that relate to a specific traffic characteristic, such as fragments.
The Detector module measures the traffic rate of the service based on the policy traffic characteristics. The traffic characteristic can be the source IP addresses or the destination IP addresses. A policy that monitors the service any measures the rate of source IP addresses on all services that are not handled by a specific policy.
By limiting the service number, you can configure the Detector module policies to your preferred traffic flow requirements.
To configure the maximum number of services, use the following command in policy template configuration mode:
max-services max-services
The max-services argument is an integer greater than 1 that defines the maximum number of services that the Detector module selects. We recommend that you do not exceed the maximum of 10 services.
The following example shows how to configure the maximum number of services that the Detector module monitors to 5:
user@DETECTOR-conf-zone-scannet-policy_template-tcp_services# max-services 5
Configuring the Minimum Threshold
The minimum threshold parameter defines the minimum traffic volume for a service. When the threshold is exceeded, the Detector module constructs policies that relate to the service traffic according to the particular traffic flow that exceeded the threshold. By setting the threshold, you can adapt the anomaly detection operation to the traffic volume of the zone services.
7-5Cisco Traffic Anomaly Detector Module Configuration Guide
OL-11857-01
Chapter 7 Configuring Policy Templates and PoliciesUnderstanding Policy Templates
You cannot configure the minimum threshold parameter for policy templates that are essential for proper zone anomaly detection and always construct a policy such as the following policy templates: tcp_services, udp_services, other_protocols, http, and fragments.
To configure the minimum threshold, use the following command in policy template configuration mode:
min-threshold min-threshold
The threshold argument is a real number (a floating point number with two decimal places), equal to or greater than 0, that defines the minimum threshold rate in packets per second (pps). When measuring concurrent connections and the SYN/FIN ratio, the threshold is an integer that defines the total number of connections.
The following example shows how to configure the minimum threshold of the policy template http:
user@DETECTOR-conf-zone-scannet-policy_template-http# min-threshold 12.3
Configuring Policy Template States
The policy template state parameter defines whether the policy template is enabled or disabled. The Detector module is unable to use a disabled policy template during the policy construction phase to produce policies.
Caution Disabling a policy template may seriously compromise zone anomaly detection. If you disable a policy template, the Detector module cannot detect the zone traffic to which the policy template relates. For example, disabling the dns_udp policy template prevents the Detector module from creating zone policies that manage DNS (UDP) attacks.
To disable a policy template, use the disable command in policy template configuration mode.
To enable a policy template, use the enable command in policy template configuration mode.
The following example shows how to disable the policy template http:
user@DETECTOR-conf-zone-scannet-policy_template-http# disable
Configuring All Policy Template Parameters Simultaneously
You can configure all policy template operational parameters with a single command by entering the following command in zone configuration mode:
policy-template policy-template-name max-services min-threshold {disabled | enabled}
7-6Cisco Traffic Anomaly Detector Module Configuration Guide
OL-11857-01
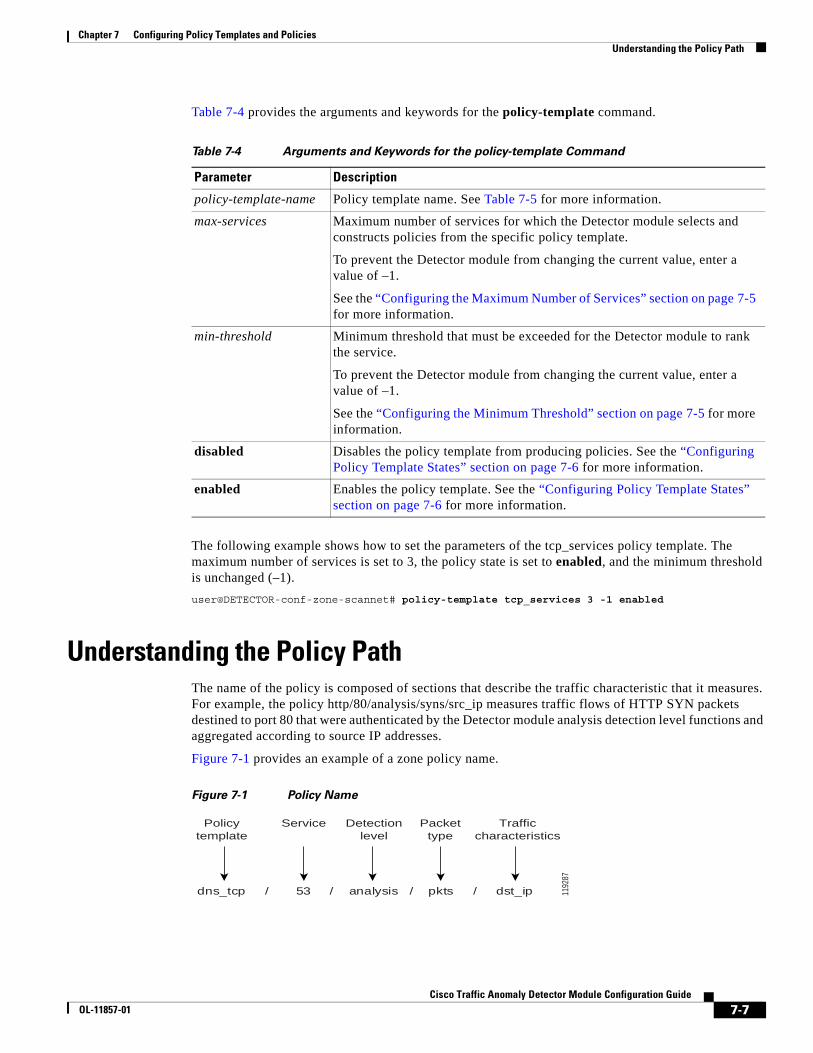
Chapter 7 Configuring Policy Templates and PoliciesUnderstanding the Policy Path
Table 7-4 provides the arguments and keywords for the policy-template command.
The following example shows how to set the parameters of the tcp_services policy template. The maximum number of services is set to 3, the policy state is set to enabled, and the minimum threshold is unchanged (–1).
user@DETECTOR-conf-zone-scannet# policy-template tcp_services 3 -1 enabled
Understanding the Policy PathThe name of the policy is composed of sections that describe the traffic characteristic that it measures. For example, the policy http/80/analysis/syns/src_ip measures traffic flows of HTTP SYN packets destined to port 80 that were authenticated by the Detector module analysis detection level functions and aggregated according to source IP addresses.
Figure 7-1 provides an example of a zone policy name.
Figure 7-1 Policy Name
Table 7-4 Arguments and Keywords for the policy-template Command
Parameter Description
policy-template-name Policy template name. See Table 7-5 for more information.
max-services Maximum number of services for which the Detector module selects and constructs policies from the specific policy template.
To prevent the Detector module from changing the current value, enter a value of –1.
See the “Configuring the Maximum Number of Services” section on page 7-5 for more information.
min-threshold Minimum threshold that must be exceeded for the Detector module to rank the service.
To prevent the Detector module from changing the current value, enter a value of –1.
See the “Configuring the Minimum Threshold” section on page 7-5 for more information.
disabled Disables the policy template from producing policies. See the “Configuring Policy Template States” section on page 7-6 for more information.
enabled Enables the policy template. See the “Configuring Policy Template States” section on page 7-6 for more information.
1192
87
dns_tcp / 53 / analysis / pkts / dst_ip
Detectionlevel
Service Packettype
Trafficcharacteristics
Policytemplate
7-7Cisco Traffic Anomaly Detector Module Configuration Guide
OL-11857-01
Chapter 7 Configuring Policy Templates and PoliciesUnderstanding the Policy Path
Table 7-5 describes the policy name sections.
The first four sections of the policy name (policy template, service, detection level, and packet type) define the type of traffic that is analyzed. The last section of the policy path (traffic characteristics) defines how to analyze the flow.
This section describes each of the policy path sections as follows:
• Understanding and Managing the Policy Services
• Understanding the Packet Types that the Detector module Monitors
• Understanding the Traffic Characteristics that the Detector Module Monitors
Understanding and Managing the Policy ServicesThe service section defines the zone application port or protocol to which each policy relates. Policies have cross dependencies and priorities. If two different policies define the same traffic flow, the Detector module analyzes the flow using the policy that is more specific. The service any relates to all traffic that does not specifically match other services created from the same policy template.
We recommend that you define specific policies for the zone main services to obtain anomaly detection that is most suited to your individual needs.
Caution Do not add the same service (port number) to more than one policy because it may decrease the Detector module performance.
When you add or delete a service from the zone policies, the Detector module marks the zone policies as untuned. If you enabled zone anomaly detection and the learning process, the Detector module cannot detect anomalies in the zone traffic until you perform one of the following actions:
• Perform the threshold tuning phase of the learning process and accept the results (see the “Activating the Threshold Tuning Phase” section on page 8-6).
• Mark the zone policies tuned (see the “Marking the Policies as Tuned” section on page 8-10).
This section contains the following topics:
• Adding a Service
• Deleting a Service
Table 7-5 Policy Name Sections
Section Description
Policy template Policy template that was used to construct the policy. Each policy template deals with the characteristics that the Detector module requires to detect a specific DDoS threat. See the “Understanding Policy Templates” section on page 7-2 for more information.
Service Port number or protocol number in the traffic flow that the policy monitors.
Detection level Detection level that the Detector module applies to the traffic flow. Detection levels have a static configuration and cannot be configured manually.
Packet types Packet types that the Detector module monitors.
Traffic characteristics Traffic characteristics that the Detector module uses to aggregate the policy.
7-8Cisco Traffic Anomaly Detector Module Configuration Guide
OL-11857-01
Chapter 7 Configuring Policy Templates and PoliciesUnderstanding the Policy Path
Adding a Service
You can add services to all policies that were created from a specific policy template. The new service is an addition to the services that were discovered during the policy construction phase and is defined with default values. You can define the threshold manually, but we recommend that you run the threshold tuning phase of the learning process to tune the policies to the zone traffic. See the “Activating the Threshold Tuning Phase” section on page 8-6 for more information.
You can add a new service to policies that were created from the following policy templates:
• tcp_services, udp_services, tcp_services_ns, or worm_tcp
The service designates a port number.
• other_protocols
The service designates a protocol number.
Note If you activate the policy construction phase after adding a service, new services might override the manually added service.
Unless you enable the policy construction phase, you may need to add a service manually in the following situations:
• A new application or service was added to the zone network.
• The policy construction phase was activated for a short period, so it does not reflect all the network services (for instance, if there are known applications or services that are active only once a week or during the night).
To add a service, use one of the following commands:
• add-service service-num (in policy template configuration mode)
• policy-template policy-template-name add-service service-num (zone configuration mode)
Table 7-6 provides the arguments for the add-service command.
The following example shows how to add a service to all the policies that were created from the policy template tcp_services:
user@DETECTOR-conf-zone-scannet-policy_template-tcp_services# add-service 25
Deleting a Service
You can delete a specific service for any policy template. The Detector module will delete the service from all policies that were created from the specific policy template.
To delete a service, use one of the following commands:
• remove-service service-num (in policy template configuration mode)
• policy-template policy-template-name remove-service service-num (in zone configuration mode)
Table 7-6 Arguments for the add-service Command
Parameter Description
service-num Protocol or port number.
policy-template-name Policy template name. See Table 7-1 for more information.
7-9Cisco Traffic Anomaly Detector Module Configuration Guide
OL-11857-01
Chapter 7 Configuring Policy Templates and PoliciesUnderstanding the Policy Path
Table 7-7 provides the arguments for the remove-service command.
Caution If you delete a service, the Detector module policies cannot monitor the traffic of that service, which may compromise zone anomaly detection.
You can remove services from the following policy templates:
• tcp_services, udp_services, or tcp_services_ns
The service is a port number.
• other_protocols
The service is a protocol number.
If you do not activate the policy construction phase of the learning process, you may need to remove a service manually in the following situations:
• An application or service was removed from the network.
• An application or service that you do not want to enable (because it is uncommon for the network environment) but was identified during the policy construction phase.
Note If you activate the policy construction phase after removing a service, the same service might be added again.
The following example shows how to delete a service from all policies that were created from the policy template tcp_services:
user@DETECTOR-conf-zone-scannet-policy_template-tcp_services# remove-service 25
Understanding the Packet Types that the Detector module MonitorsThe Detector module monitors packet characteristics, which can be one of the following:
• Packet type (for example, TCP-SYN packets)
• Packet analysis (for example, authenticated packets, which are packets that the Detector module has verified their connection by performing a TCP handshake)
• Packet direction (for example, incoming connections)
Table 7-7 Arguments for the remove-service Command
Parameter Description
service-num Protocol or port number to remove.
policy-template-name Policy template name. See Table 7-1 for more information.
7-10Cisco Traffic Anomaly Detector Module Configuration Guide
OL-11857-01
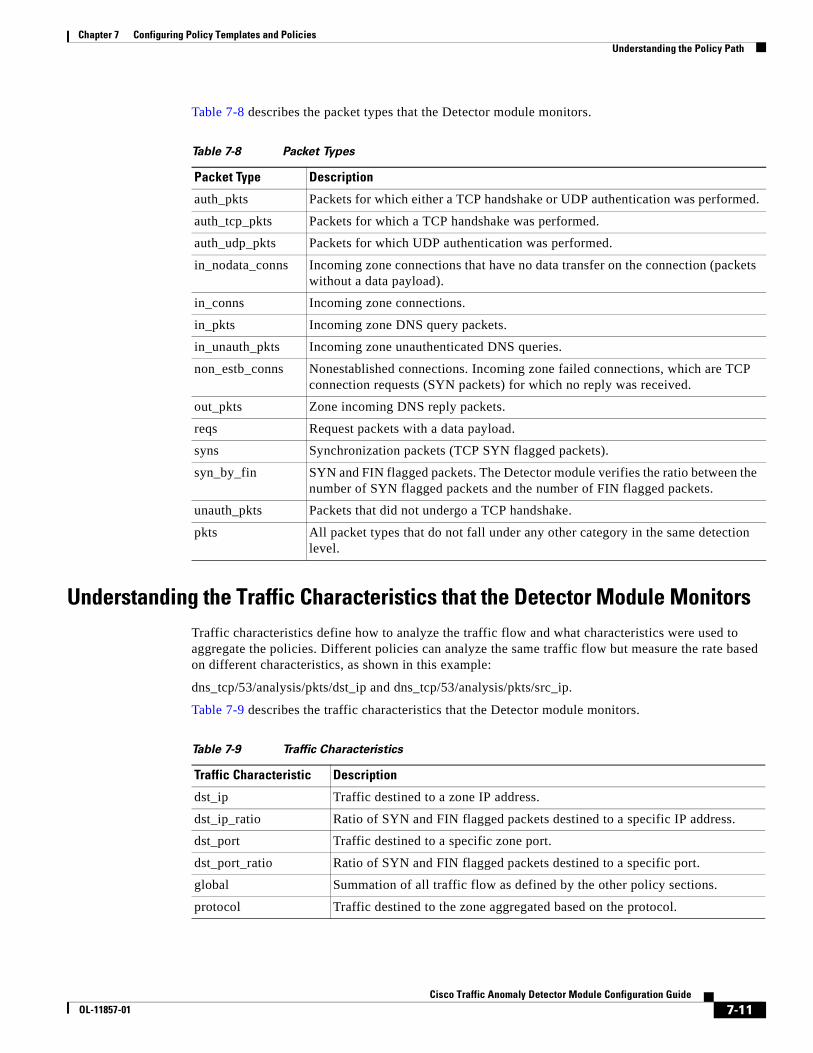
Chapter 7 Configuring Policy Templates and PoliciesUnderstanding the Policy Path
Table 7-8 describes the packet types that the Detector module monitors.
Understanding the Traffic Characteristics that the Detector Module MonitorsTraffic characteristics define how to analyze the traffic flow and what characteristics were used to aggregate the policies. Different policies can analyze the same traffic flow but measure the rate based on different characteristics, as shown in this example:
dns_tcp/53/analysis/pkts/dst_ip and dns_tcp/53/analysis/pkts/src_ip.
Table 7-9 describes the traffic characteristics that the Detector module monitors.
Table 7-8 Packet Types
Packet Type Description
auth_pkts Packets for which either a TCP handshake or UDP authentication was performed.
auth_tcp_pkts Packets for which a TCP handshake was performed.
auth_udp_pkts Packets for which UDP authentication was performed.
in_nodata_conns Incoming zone connections that have no data transfer on the connection (packets without a data payload).
in_conns Incoming zone connections.
in_pkts Incoming zone DNS query packets.
in_unauth_pkts Incoming zone unauthenticated DNS queries.
non_estb_conns Nonestablished connections. Incoming zone failed connections, which are TCP connection requests (SYN packets) for which no reply was received.
out_pkts Zone incoming DNS reply packets.
reqs Request packets with a data payload.
syns Synchronization packets (TCP SYN flagged packets).
syn_by_fin SYN and FIN flagged packets. The Detector module verifies the ratio between the number of SYN flagged packets and the number of FIN flagged packets.
unauth_pkts Packets that did not undergo a TCP handshake.
pkts All packet types that do not fall under any other category in the same detection level.
Table 7-9 Traffic Characteristics
Traffic Characteristic Description
dst_ip Traffic destined to a zone IP address.
dst_ip_ratio Ratio of SYN and FIN flagged packets destined to a specific IP address.
dst_port Traffic destined to a specific zone port.
dst_port_ratio Ratio of SYN and FIN flagged packets destined to a specific port.
global Summation of all traffic flow as defined by the other policy sections.
protocol Traffic destined to the zone aggregated based on the protocol.
7-11Cisco Traffic Anomaly Detector Module Configuration Guide
OL-11857-01
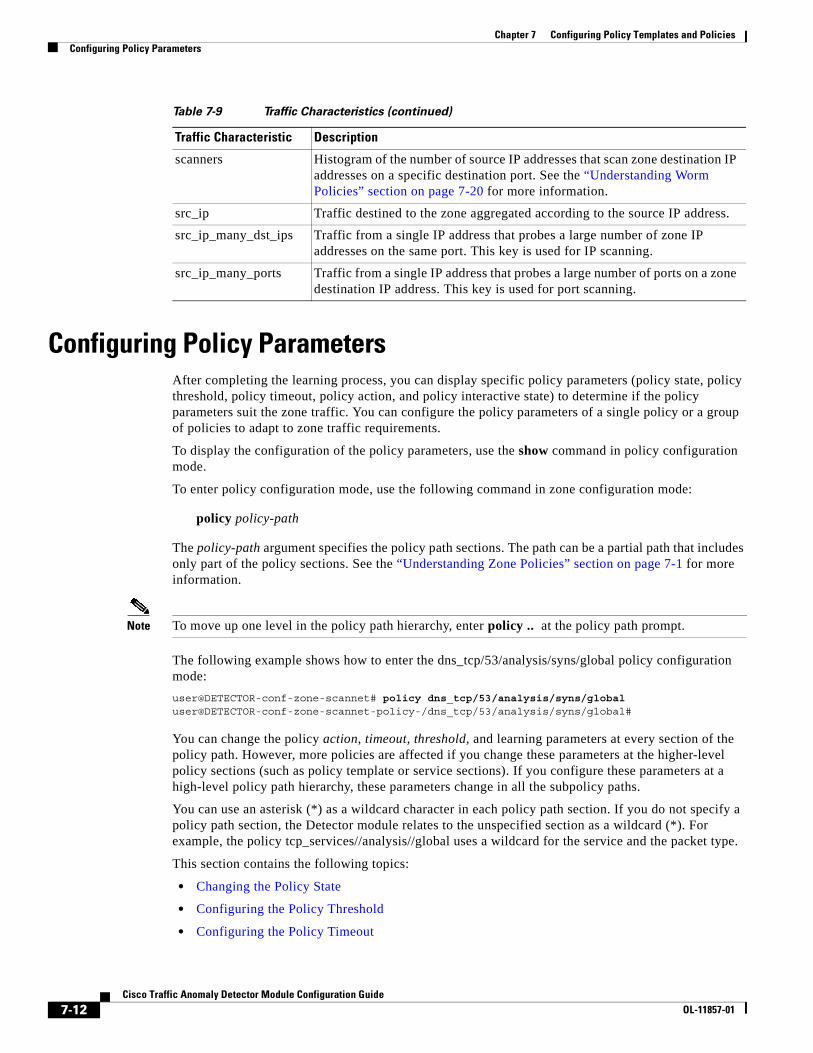
Chapter 7 Configuring Policy Templates and PoliciesConfiguring Policy Parameters
Configuring Policy ParametersAfter completing the learning process, you can display specific policy parameters (policy state, policy threshold, policy timeout, policy action, and policy interactive state) to determine if the policy parameters suit the zone traffic. You can configure the policy parameters of a single policy or a group of policies to adapt to zone traffic requirements.
To display the configuration of the policy parameters, use the show command in policy configuration mode.
To enter policy configuration mode, use the following command in zone configuration mode:
policy policy-path
The policy-path argument specifies the policy path sections. The path can be a partial path that includes only part of the policy sections. See the “Understanding Zone Policies” section on page 7-1 for more information.
Note To move up one level in the policy path hierarchy, enter policy .. at the policy path prompt.
The following example shows how to enter the dns_tcp/53/analysis/syns/global policy configuration mode:
user@DETECTOR-conf-zone-scannet# policy dns_tcp/53/analysis/syns/global user@DETECTOR-conf-zone-scannet-policy-/dns_tcp/53/analysis/syns/global#
You can change the policy action, timeout, threshold, and learning parameters at every section of the policy path. However, more policies are affected if you change these parameters at the higher-level policy sections (such as policy template or service sections). If you configure these parameters at a high-level policy path hierarchy, these parameters change in all the subpolicy paths.
You can use an asterisk (*) as a wildcard character in each policy path section. If you do not specify a policy path section, the Detector module relates to the unspecified section as a wildcard (*). For example, the policy tcp_services//analysis//global uses a wildcard for the service and the packet type.
This section contains the following topics:
• Changing the Policy State
• Configuring the Policy Threshold
• Configuring the Policy Timeout
scanners Histogram of the number of source IP addresses that scan zone destination IP addresses on a specific destination port. See the “Understanding Worm Policies” section on page 7-20 for more information.
src_ip Traffic destined to the zone aggregated according to the source IP address.
src_ip_many_dst_ips Traffic from a single IP address that probes a large number of zone IP addresses on the same port. This key is used for IP scanning.
src_ip_many_ports Traffic from a single IP address that probes a large number of ports on a zone destination IP address. This key is used for port scanning.
Table 7-9 Traffic Characteristics (continued)
Traffic Characteristic Description
7-12Cisco Traffic Anomaly Detector Module Configuration Guide
OL-11857-01
Chapter 7 Configuring Policy Templates and PoliciesConfiguring Policy Parameters
• Configuring the Policy Action
• Configuring the Policy Interactive Status
Changing the Policy StateThe zone policies have three possible states:
• Active—The policy monitors the traffic and performs an action once the threshold is exceeded.
• Inactive—The policy monitors the traffic and obtains the threshold, but it takes no action when a threshold is exceeded. You can inactivate a policy to avoid reactivating the threshold-tuning phase of the learning process.
• Disabled—The policy does not monitor the traffic flow, so no threshold is obtained.
Note We recommend that you activate the threshold tuning phase of the learning process to ensure that the Detector module monitors the correct thresholds for the other policies.
Caution When you disable a policy, the active zone policies assume responsibility for the traffic that would normally be monitored by the disabled policy. To adjust the thresholds of the active policies, we recommend that you activate the threshold tuning phase before you activate zone anomaly detection.
To change the policy state, use the following command in policy configuration mode:
state {active | disabled | inactive}
The following example shows how to set the policy state:
user@DETECTOR-conf-zone-scannet-policy-/dns_tcp/53/analysis/syns# state disabled
The following example shows how to set the state of all global policies:
user@DETECTOR-conf-zone-scannet-policy-/*/*/*/global# state inactive
Caution If you deactivate or disable a policy, the zone policies may not assume their role, and the zone anomaly detection can be compromised.
If you activate the policy construction phase after disabling a zone policy, all zone policies are reconfigured according to the current traffic flow and the policy may be reactivated.
Configuring the Policy ThresholdThe policy threshold defines the threshold traffic rate for a specific policy and is adjusted by the threshold tuning phase. When this threshold is exceeded, the policy performs the action that is defined by the policy action.
The threshold is measured in packets per second except for policies that are constructed from the following policy templates:
• num_soruces—The threshold is measured in the number of IP addresses or ports.
7-13Cisco Traffic Anomaly Detector Module Configuration Guide
OL-11857-01
Chapter 7 Configuring Policy Templates and PoliciesConfiguring Policy Parameters
• tcp_connections—The threshold is measured in the number of connections.
• tcp_ratio—The threshold is measured as the ratio number.
• worm_tcp—The threshold is measured as the maximum number of zone destination IP addresses that a source IP may scan.
You can configure the policy threshold in the following ways:
• Set the threshold—You can set the value of the policy threshold. See the “Setting the Policy Threshold” section on page 7-14.
• Multiply the threshold—The Detector module multiplies the current policy thresholds by a factor. The new value may change in subsequent threshold tuning phases if you do not set it as fixed. See the “Multiplying a Threshold by a Factor” section on page 7-16.
• Configure specific IP thresholds—The Detector module sets thresholds for specific IP source addresses within the zone address range. See the “Configuring Specific IP Thresholds” section on page 7-17.
The policy threshold may change if you perform additional threshold tuning phases. You can modify how a threshold may change in subsequent threshold tuning phases in the following ways:
• Set the threshold as fixed—The Detector module will not change the value of the policy threshold, proxy-threshold, and threshold-list in subsequent threshold tuning phases. See the “Setting the Threshold as Fixed” section on page 7-15.
• Set a fixed multiplier for the policy threshold—The Detector module calculates the policy threshold in subsequent threshold tuning phases based on the current policy threshold, the learned threshold, and the fixed multiplier. See the “Configuring a Threshold Multiplier” section on page 7-15.
This section contains the following topics:
• Setting the Policy Threshold
• Setting the Threshold as Fixed
• Configuring a Threshold Multiplier
• Multiplying a Threshold by a Factor
• Configuring Specific IP Thresholds
Setting the Policy Threshold
To configure the policy threshold, use the following command in policy configuration mode:
threshold threshold
The threshold argument is a positive number that specifies the policy threshold.
The following example shows how to set the threshold value of the policy dns_tcp/53/analysis/syns/global to 300:
user@DETECTOR-conf-zone-scannet-policy-/dns_tcp/53/analysis/syns/ global# threshold 300
7-14Cisco Traffic Anomaly Detector Module Configuration Guide
OL-11857-01
Chapter 7 Configuring Policy Templates and PoliciesConfiguring Policy Parameters
Setting the Threshold as Fixed
You can set a policy threshold, proxy-threshold, and threshold-list as fixed. The Detector module ignores new thresholds in the threshold tuning phase of the learning process and maintains the current thresholds. Setting a threshold as fixed enables you to configure the thresholds of a policy but continue learning the thresholds of other policies.
To set a policy threshold as fixed, use the following command in policy configuration mode:
learning-params fixed-threshold
The following example shows how to set the threshold of the policy dns_tcp/53/analysis/syns/global as fixed:
user@DETECTOR-conf-zone-scannet-policy-/dns_tcp/53/analysis/syns/ global# learning-params fixed-threshold
You can set the threshold of several policies as fixed in a single command by entering the command in zone configuration mode. To set a policy threshold as fixed while in zone configuration mode, use the following command:
policy policy-path learning-params fixed-threshold
The policy-path argument specifies the policy path. The path can be a partial path that includes only part of the policy sections. See the “Understanding Zone Policies” section on page 7-1 for more information.
The following example shows how to set the thresholds of all policies that were created from the dns_tcp policy template as fixed:
user@DETECTOR-conf-zone-scannet# policy dns_tcp learning-params fixed-threshold
To display the policy learning parameters, use the show learning-params command in policy configuration mode, or use the show policies policy-path learning-params command in zone configuration mode.
Configuring a Threshold Multiplier
You can set a multiplier for a policy threshold. The Detector module calculates a new policy threshold by multiplying the learned threshold by the specified multiplier before accepting the results of subsequent threshold tuning phases. The Detector module accepts the results of the threshold tuning phase using the configured threshold selection method. See the “Configuring the Threshold Selection Method” section on page 8-9.
To set a multiplier for the policy threshold, use the following command in zone configuration mode:
policy policy-path learning-params threshold-multiplier threshold-multiplier
7-15Cisco Traffic Anomaly Detector Module Configuration Guide
OL-11857-01
Chapter 7 Configuring Policy Templates and PoliciesConfiguring Policy Parameters
Table 7-10 provides the arguments and keywords for the policy learning-params threshold-multiplier command.
To set a multiplier for the policy threshold in policy configuration mode, use the learning-params threshold-multiplier threshold-multiplier command.
The following example shows how to configure a threshold multiplier so that the Detector module decreases the thresholds of policies that were created from the policy template dns_tcp by half in subsequent threshold tuning phases:
user@DETECTOR-conf-zone-scannet# policy dns_tcp learning-params threshold-multiplier 0.5
To display the policy learning parameters, use the show learning-params command in policy configuration mode, or use the show policies policy-path learning-params command in zone configuration mode.
Multiplying a Threshold by a Factor
You can multiply the thresholds of a policy or a group of policies by a factor, which enables you to increase or decrease the threshold of a policy or a group of policies if the traffic volume does not represent the zone traffic. You can enable the Detector module to multiply the policy thresholds, the proxy thresholds, and the thresholds that were defined by the policy threshold-list command.
To multiply policy thresholds by a factor, use the following command in zone configuration mode:
policy policy-path thresh-mult threshold-multiply-factor
Table 7-11 provides the arguments and keywords for the policy thresh-mult command.
Table 7-10 Arguments and Keywords for the policy learning-params threshold-multiplier
Command
Parameter Description
policy-path Policy path for which to multiply the thresholds. The path can be a partial path that includes only part of the policy sections. See the “Understanding Zone Policies” section on page 7-1 for more information.
learning-params Configures the learning parameters.
threshold-multiplier threshold-multiplier
Multiplies the policy threshold. The threshold-multiplier is a real positive number (a floating point number with two decimal places) by which the policy threshold is multiplied. Enter a number less than 1 to decrease the policy threshold.
Table 7-11 Arguments and Keywords for the policy thresh-mult Command
Parameter Description
policy-path Policy template name. See Table 7-1 for more information.
thresh-mult threshold-multiply-factor
Specifies a real positive number (a floating point number with 4 decimal places) by which to multiply the threshold. Enter a number less than 1 to decrease the policy threshold.
7-16Cisco Traffic Anomaly Detector Module Configuration Guide
OL-11857-01
Chapter 7 Configuring Policy Templates and PoliciesConfiguring Policy Parameters
The following example shows how to decrease the thresholds of policies that were created from the policy template dns_tcp by half:
user@DETECTOR-conf-zone-scannet# policy */*/*/*/src_ip thresh-mult 0.5
Note The Detector module may change the threshold value in subsequent threshold tuning phases. To prevent the Detector module from changing the threshold value, set the threshold value as fixed. See the “Setting the Threshold as Fixed” section on page 7-15.
To display the policy learning parameters, use the show learning-params command in policy configuration mode, or use the show policies policy-path learning-params command in zone configuration mode.
Configuring Specific IP Thresholds
You can avoid false attack detections by the Detector module when traffic increases on a known high traffic source or destination IP address by configuring a policy with a threshold for traffic that is associated with that IP address.
You should consider configuring a specific IP threshold if one of the following situations occurs:
• When there is known high-volume traffic from a source IP address, you can configure a threshold to apply to traffic that originates from the specific source IP address.
• When there is a nonhomogeneous zone (a zone that consists of more than a single IP address) and there is known high-volume traffic flowing to part of the zone only, you can configure a threshold to apply to traffic that targets the specific destination IP address within the zone.
You can configure a specific IP threshold only for policies with traffic characteristics of destination IP (dest_ip).
To configure a specific IP threshold, use one of the following commands:
• policy policy-path threshold-list ip threshold [ip threshold ...] (in zone configuration mode)
• threshold-list ip threshold [ip threshold ...] (in policy configuration mode)
Table 7-12 provides the arguments for the threshold-list command.
You can add a maximum of 10 specific IP thresholds for each policy. You can enter all specific IP thresholds in a single command.
The Detector module might change the policy thresholds in subsequent threshold tuning phases if the threshold selection method is set to new-thresholds. See the “Configuring the Threshold Selection Method” section on page 8-9 for more information.
Table 7-12 Arguments for the policy threshold-list Command
Parameter Description
policy-path Policy template name. See Table 7-1 for more information.
ip Specific IP address.
threshold Threshold traffic rate in packets per second, except for policies that measure concurrent connections and SYN-by-FIN ratio where the threshold is the number of connections.
7-17Cisco Traffic Anomaly Detector Module Configuration Guide
OL-11857-01
Chapter 7 Configuring Policy Templates and PoliciesConfiguring Policy Parameters
The following example shows how to set specific IP thresholds for IP addresses 10.10.10.2 and 10.10.15.2 for the policy http/80/analysis/syns/src_ip:
user@DETECTOR-conf-zone-scannet-policy-/http/80/analysis/syns/src_ip# threshold-list 10.10.10.2 500 10.10.15.2 500
Configuring the Policy TimeoutThe timeout parameter defines the minimum time for dynamic filters that are produced by the policy to apply their action.
To configure the policy timeout, use the following command in policy configuration mode:
timeout {forever | timeout}
Table 7-13 provides the arguments and keywords for the timeout command.
The following example shows how to set the timeout of the policy http/80/analysis/syns/src_ip to 100 seconds:
user@DETECTOR-conf-zone-scannet-policy-/http/80/analysis/syns/src_ip# timeout 100
To change the timeout of a group of policies simultaneously, use the policy set-timeout command in zone configuration mode.
The following example shows how to set the timeout of all policies that were produced from the HTTP policy template and measure source IP addresses to 100:
user@DETECTOR-conf-zone-scannet# policy http/*/*/*/src_ip set-timeout 100
Configuring the Policy ActionThe action parameter defines the type of action that the policy takes once its threshold is exceeded.
To configure the policy action, use the following command in policy configuration mode:
action policy-action
Table 7-13 Arguments and Keywords for the timeout Command
Parameter Description
forever Specifies an indefinite time span.
timeout Integer from 1 to 3,000,000 that specifies the minimum time in seconds that the dynamic filters, which are produced by the policy, are active.
7-18Cisco Traffic Anomaly Detector Module Configuration Guide
OL-11857-01
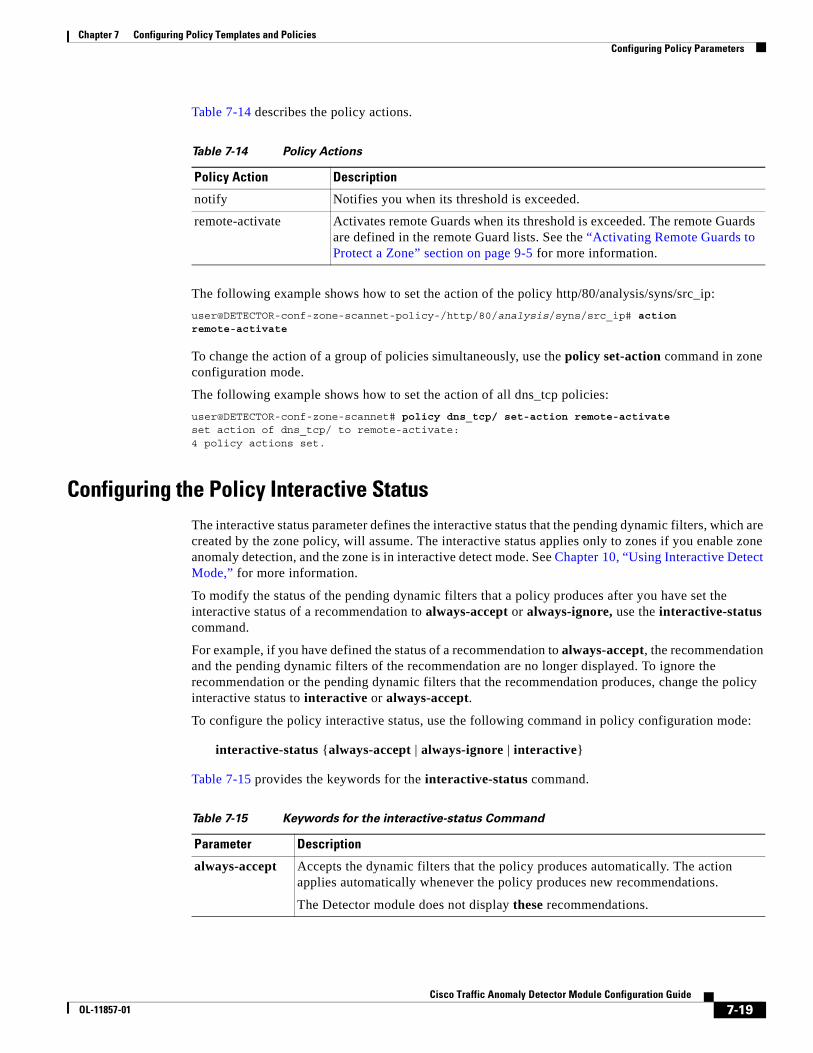
Chapter 7 Configuring Policy Templates and PoliciesConfiguring Policy Parameters
Table 7-14 describes the policy actions.
The following example shows how to set the action of the policy http/80/analysis/syns/src_ip:
user@DETECTOR-conf-zone-scannet-policy-/http/80/analysis/syns/src_ip# action remote-activate
To change the action of a group of policies simultaneously, use the policy set-action command in zone configuration mode.
The following example shows how to set the action of all dns_tcp policies:
user@DETECTOR-conf-zone-scannet# policy dns_tcp/ set-action remote-activate set action of dns_tcp/ to remote-activate: 4 policy actions set.
Configuring the Policy Interactive StatusThe interactive status parameter defines the interactive status that the pending dynamic filters, which are created by the zone policy, will assume. The interactive status applies only to zones if you enable zone anomaly detection, and the zone is in interactive detect mode. See Chapter 10, “Using Interactive Detect Mode,” for more information.
To modify the status of the pending dynamic filters that a policy produces after you have set the interactive status of a recommendation to always-accept or always-ignore, use the interactive-status command.
For example, if you have defined the status of a recommendation to always-accept, the recommendation and the pending dynamic filters of the recommendation are no longer displayed. To ignore the recommendation or the pending dynamic filters that the recommendation produces, change the policy interactive status to interactive or always-accept.
To configure the policy interactive status, use the following command in policy configuration mode:
interactive-status {always-accept | always-ignore | interactive}
Table 7-15 provides the keywords for the interactive-status command.
Table 7-14 Policy Actions
Policy Action Description
notify Notifies you when its threshold is exceeded.
remote-activate Activates remote Guards when its threshold is exceeded. The remote Guards are defined in the remote Guard lists. See the “Activating Remote Guards to Protect a Zone” section on page 9-5 for more information.
Table 7-15 Keywords for the interactive-status Command
Parameter Description
always-accept Accepts the dynamic filters that the policy produces automatically. The action applies automatically whenever the policy produces new recommendations.
The Detector module does not display these recommendations.
7-19Cisco Traffic Anomaly Detector Module Configuration Guide
OL-11857-01
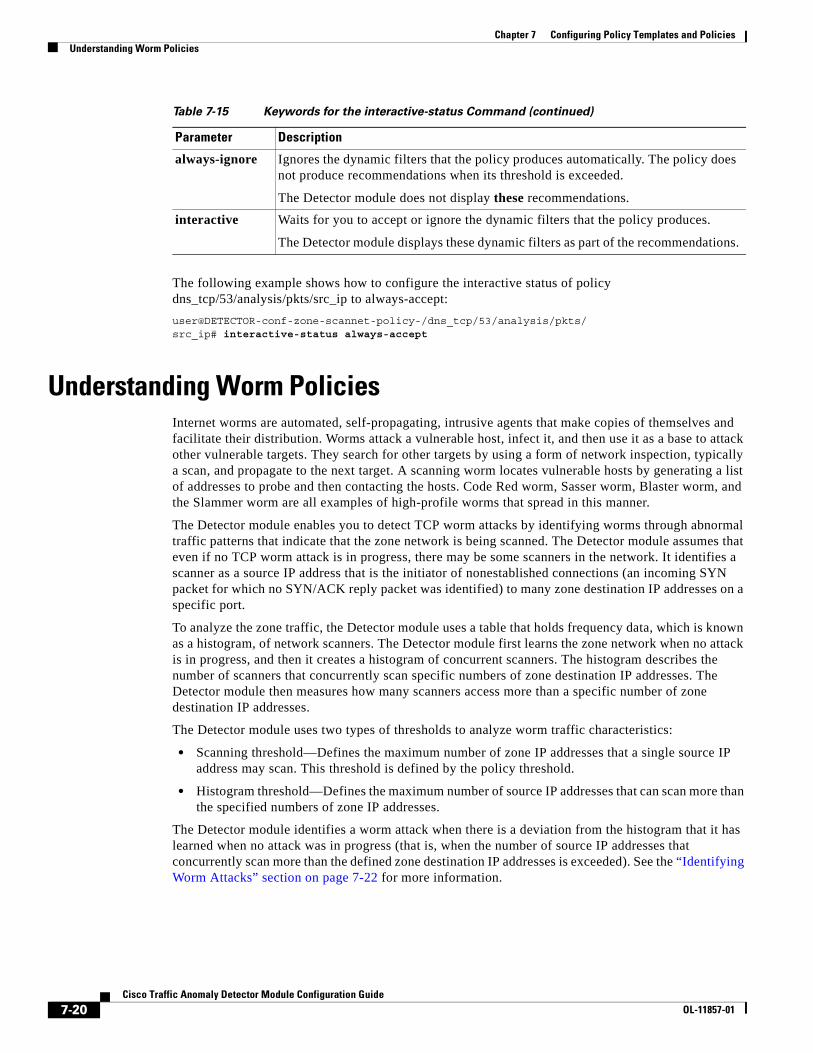
Chapter 7 Configuring Policy Templates and PoliciesUnderstanding Worm Policies
The following example shows how to configure the interactive status of policy dns_tcp/53/analysis/pkts/src_ip to always-accept:
user@DETECTOR-conf-zone-scannet-policy-/dns_tcp/53/analysis/pkts/ src_ip# interactive-status always-accept
Understanding Worm PoliciesInternet worms are automated, self-propagating, intrusive agents that make copies of themselves and facilitate their distribution. Worms attack a vulnerable host, infect it, and then use it as a base to attack other vulnerable targets. They search for other targets by using a form of network inspection, typically a scan, and propagate to the next target. A scanning worm locates vulnerable hosts by generating a list of addresses to probe and then contacting the hosts. Code Red worm, Sasser worm, Blaster worm, and the Slammer worm are all examples of high-profile worms that spread in this manner.
The Detector module enables you to detect TCP worm attacks by identifying worms through abnormal traffic patterns that indicate that the zone network is being scanned. The Detector module assumes that even if no TCP worm attack is in progress, there may be some scanners in the network. It identifies a scanner as a source IP address that is the initiator of nonestablished connections (an incoming SYN packet for which no SYN/ACK reply packet was identified) to many zone destination IP addresses on a specific port.
To analyze the zone traffic, the Detector module uses a table that holds frequency data, which is known as a histogram, of network scanners. The Detector module first learns the zone network when no attack is in progress, and then it creates a histogram of concurrent scanners. The histogram describes the number of scanners that concurrently scan specific numbers of zone destination IP addresses. The Detector module then measures how many scanners access more than a specific number of zone destination IP addresses.
The Detector module uses two types of thresholds to analyze worm traffic characteristics:
• Scanning threshold—Defines the maximum number of zone IP addresses that a single source IP address may scan. This threshold is defined by the policy threshold.
• Histogram threshold—Defines the maximum number of source IP addresses that can scan more than the specified numbers of zone IP addresses.
The Detector module identifies a worm attack when there is a deviation from the histogram that it has learned when no attack was in progress (that is, when the number of source IP addresses that concurrently scan more than the defined zone destination IP addresses is exceeded). See the “Identifying Worm Attacks” section on page 7-22 for more information.
always-ignore Ignores the dynamic filters that the policy produces automatically. The policy does not produce recommendations when its threshold is exceeded.
The Detector module does not display these recommendations.
interactive Waits for you to accept or ignore the dynamic filters that the policy produces.
The Detector module displays these dynamic filters as part of the recommendations.
Table 7-15 Keywords for the interactive-status Command (continued)
Parameter Description
7-20Cisco Traffic Anomaly Detector Module Configuration Guide
OL-11857-01
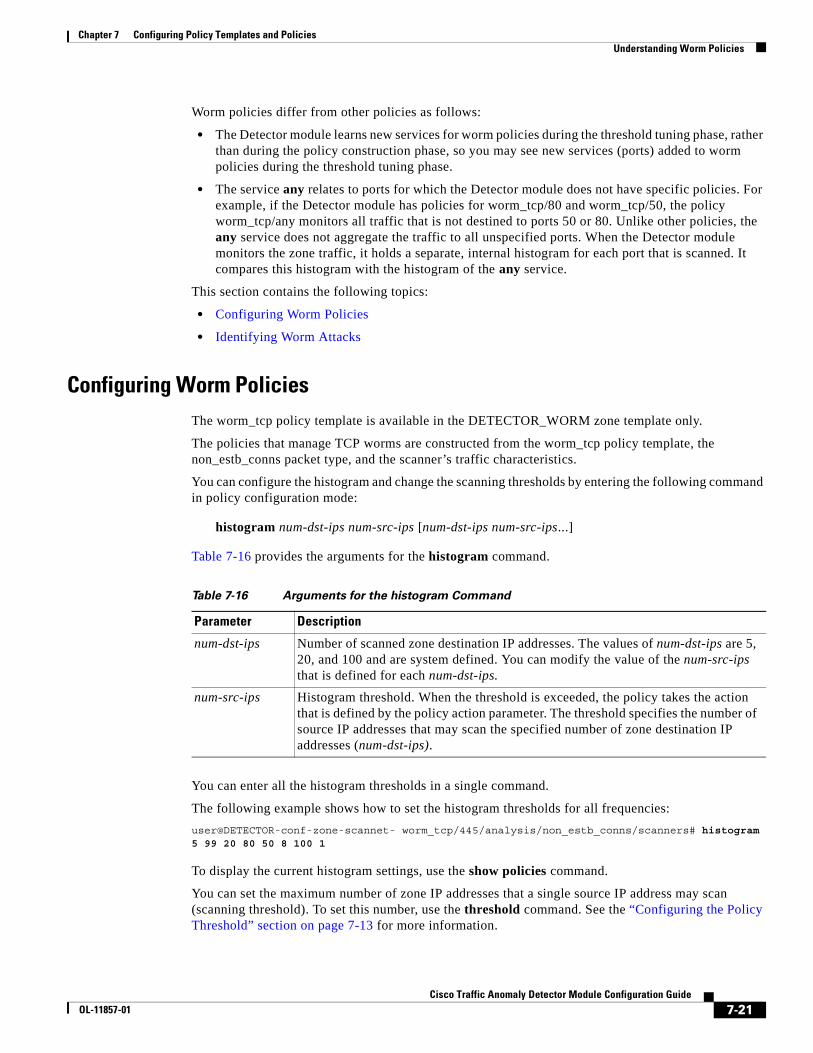
Chapter 7 Configuring Policy Templates and PoliciesUnderstanding Worm Policies
Worm policies differ from other policies as follows:
• The Detector module learns new services for worm policies during the threshold tuning phase, rather than during the policy construction phase, so you may see new services (ports) added to worm policies during the threshold tuning phase.
• The service any relates to ports for which the Detector module does not have specific policies. For example, if the Detector module has policies for worm_tcp/80 and worm_tcp/50, the policy worm_tcp/any monitors all traffic that is not destined to ports 50 or 80. Unlike other policies, the any service does not aggregate the traffic to all unspecified ports. When the Detector module monitors the zone traffic, it holds a separate, internal histogram for each port that is scanned. It compares this histogram with the histogram of the any service.
This section contains the following topics:
• Configuring Worm Policies
• Identifying Worm Attacks
Configuring Worm PoliciesThe worm_tcp policy template is available in the DETECTOR_WORM zone template only.
The policies that manage TCP worms are constructed from the worm_tcp policy template, the non_estb_conns packet type, and the scanner’s traffic characteristics.
You can configure the histogram and change the scanning thresholds by entering the following command in policy configuration mode:
histogram num-dst-ips num-src-ips [num-dst-ips num-src-ips...]
Table 7-16 provides the arguments for the histogram command.
You can enter all the histogram thresholds in a single command.
The following example shows how to set the histogram thresholds for all frequencies:
user@DETECTOR-conf-zone-scannet- worm_tcp/445/analysis/non_estb_conns/scanners# histogram 5 99 20 80 50 8 100 1
To display the current histogram settings, use the show policies command.
You can set the maximum number of zone IP addresses that a single source IP address may scan (scanning threshold). To set this number, use the threshold command. See the “Configuring the Policy Threshold” section on page 7-13 for more information.
Table 7-16 Arguments for the histogram Command
Parameter Description
num-dst-ips Number of scanned zone destination IP addresses. The values of num-dst-ips are 5, 20, and 100 and are system defined. You can modify the value of the num-src-ips that is defined for each num-dst-ips.
num-src-ips Histogram threshold. When the threshold is exceeded, the policy takes the action that is defined by the policy action parameter. The threshold specifies the number of source IP addresses that may scan the specified number of zone destination IP addresses (num-dst-ips).
7-21Cisco Traffic Anomaly Detector Module Configuration Guide
OL-11857-01
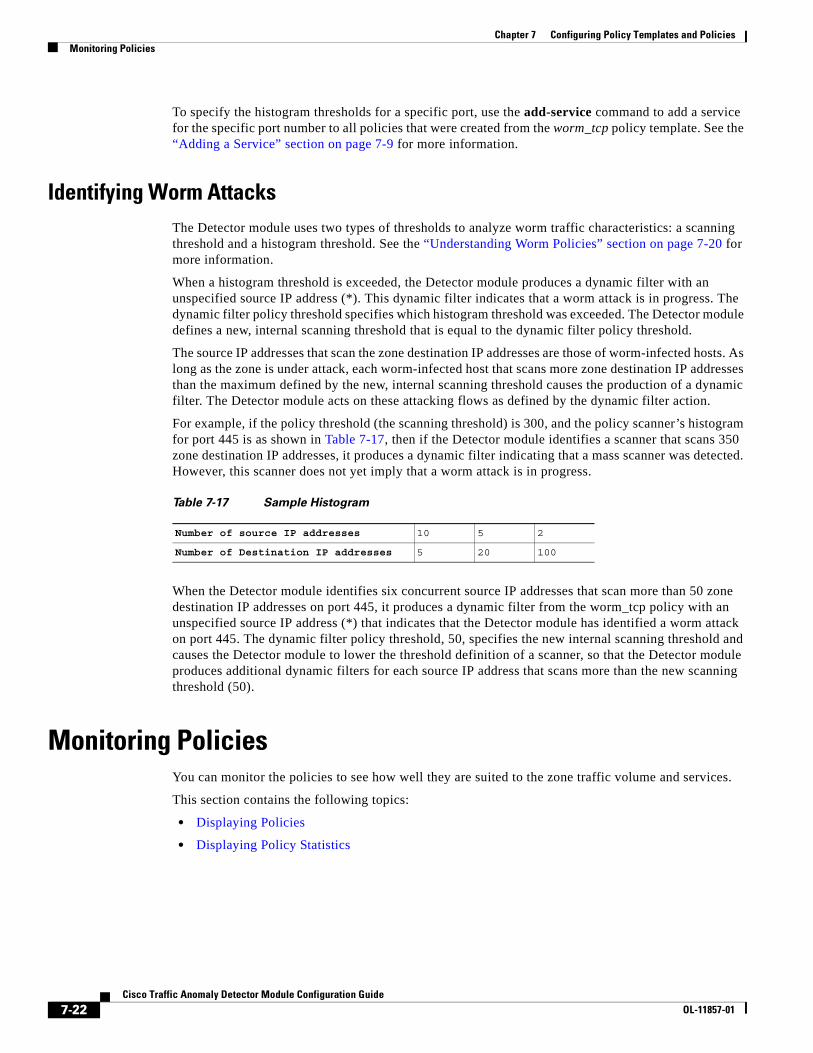
Chapter 7 Configuring Policy Templates and PoliciesMonitoring Policies
To specify the histogram thresholds for a specific port, use the add-service command to add a service for the specific port number to all policies that were created from the worm_tcp policy template. See the “Adding a Service” section on page 7-9 for more information.
Identifying Worm AttacksThe Detector module uses two types of thresholds to analyze worm traffic characteristics: a scanning threshold and a histogram threshold. See the “Understanding Worm Policies” section on page 7-20 for more information.
When a histogram threshold is exceeded, the Detector module produces a dynamic filter with an unspecified source IP address (*). This dynamic filter indicates that a worm attack is in progress. The dynamic filter policy threshold specifies which histogram threshold was exceeded. The Detector module defines a new, internal scanning threshold that is equal to the dynamic filter policy threshold.
The source IP addresses that scan the zone destination IP addresses are those of worm-infected hosts. As long as the zone is under attack, each worm-infected host that scans more zone destination IP addresses than the maximum defined by the new, internal scanning threshold causes the production of a dynamic filter. The Detector module acts on these attacking flows as defined by the dynamic filter action.
For example, if the policy threshold (the scanning threshold) is 300, and the policy scanner’s histogram for port 445 is as shown in Table 7-17, then if the Detector module identifies a scanner that scans 350 zone destination IP addresses, it produces a dynamic filter indicating that a mass scanner was detected. However, this scanner does not yet imply that a worm attack is in progress.
When the Detector module identifies six concurrent source IP addresses that scan more than 50 zone destination IP addresses on port 445, it produces a dynamic filter from the worm_tcp policy with an unspecified source IP address (*) that indicates that the Detector module has identified a worm attack on port 445. The dynamic filter policy threshold, 50, specifies the new internal scanning threshold and causes the Detector module to lower the threshold definition of a scanner, so that the Detector module produces additional dynamic filters for each source IP address that scans more than the new scanning threshold (50).
Monitoring PoliciesYou can monitor the policies to see how well they are suited to the zone traffic volume and services.
This section contains the following topics:
• Displaying Policies
• Displaying Policy Statistics
Table 7-17 Sample Histogram
Number of source IP addresses 10 5 2
Number of Destination IP addresses 5 20 100
7-22Cisco Traffic Anomaly Detector Module Configuration Guide
OL-11857-01
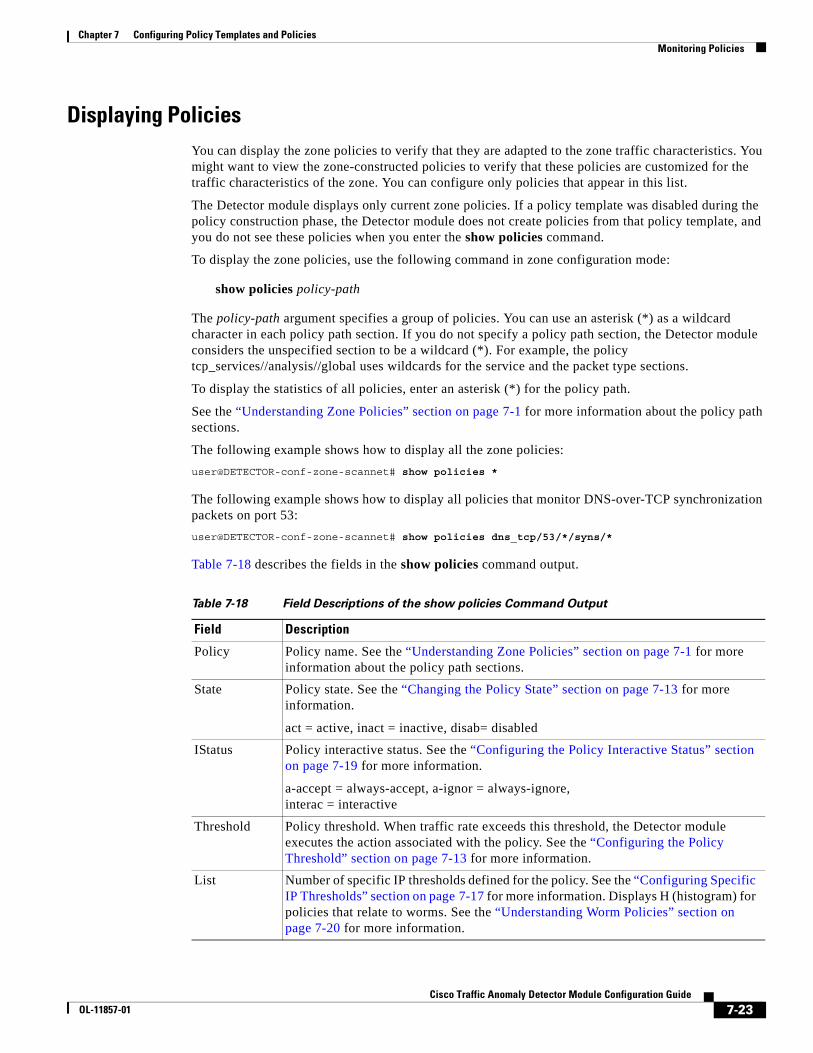
Chapter 7 Configuring Policy Templates and PoliciesMonitoring Policies
Displaying PoliciesYou can display the zone policies to verify that they are adapted to the zone traffic characteristics. You might want to view the zone-constructed policies to verify that these policies are customized for the traffic characteristics of the zone. You can configure only policies that appear in this list.
The Detector module displays only current zone policies. If a policy template was disabled during the policy construction phase, the Detector module does not create policies from that policy template, and you do not see these policies when you enter the show policies command.
To display the zone policies, use the following command in zone configuration mode:
show policies policy-path
The policy-path argument specifies a group of policies. You can use an asterisk (*) as a wildcard character in each policy path section. If you do not specify a policy path section, the Detector module considers the unspecified section to be a wildcard (*). For example, the policy tcp_services//analysis//global uses wildcards for the service and the packet type sections.
To display the statistics of all policies, enter an asterisk (*) for the policy path.
See the “Understanding Zone Policies” section on page 7-1 for more information about the policy path sections.
The following example shows how to display all the zone policies:
user@DETECTOR-conf-zone-scannet# show policies *
The following example shows how to display all policies that monitor DNS-over-TCP synchronization packets on port 53:
user@DETECTOR-conf-zone-scannet# show policies dns_tcp/53/*/syns/*
Table 7-18 describes the fields in the show policies command output.
Table 7-18 Field Descriptions of the show policies Command Output
Field Description
Policy Policy name. See the “Understanding Zone Policies” section on page 7-1 for more information about the policy path sections.
State Policy state. See the “Changing the Policy State” section on page 7-13 for more information.
act = active, inact = inactive, disab= disabled
IStatus Policy interactive status. See the “Configuring the Policy Interactive Status” section on page 7-19 for more information.
a-accept = always-accept, a-ignor = always-ignore, interac = interactive
Threshold Policy threshold. When traffic rate exceeds this threshold, the Detector module executes the action associated with the policy. See the “Configuring the Policy Threshold” section on page 7-13 for more information.
List Number of specific IP thresholds defined for the policy. See the “Configuring Specific IP Thresholds” section on page 7-17 for more information. Displays H (histogram) for policies that relate to worms. See the “Understanding Worm Policies” section on page 7-20 for more information.
7-23Cisco Traffic Anomaly Detector Module Configuration Guide
OL-11857-01
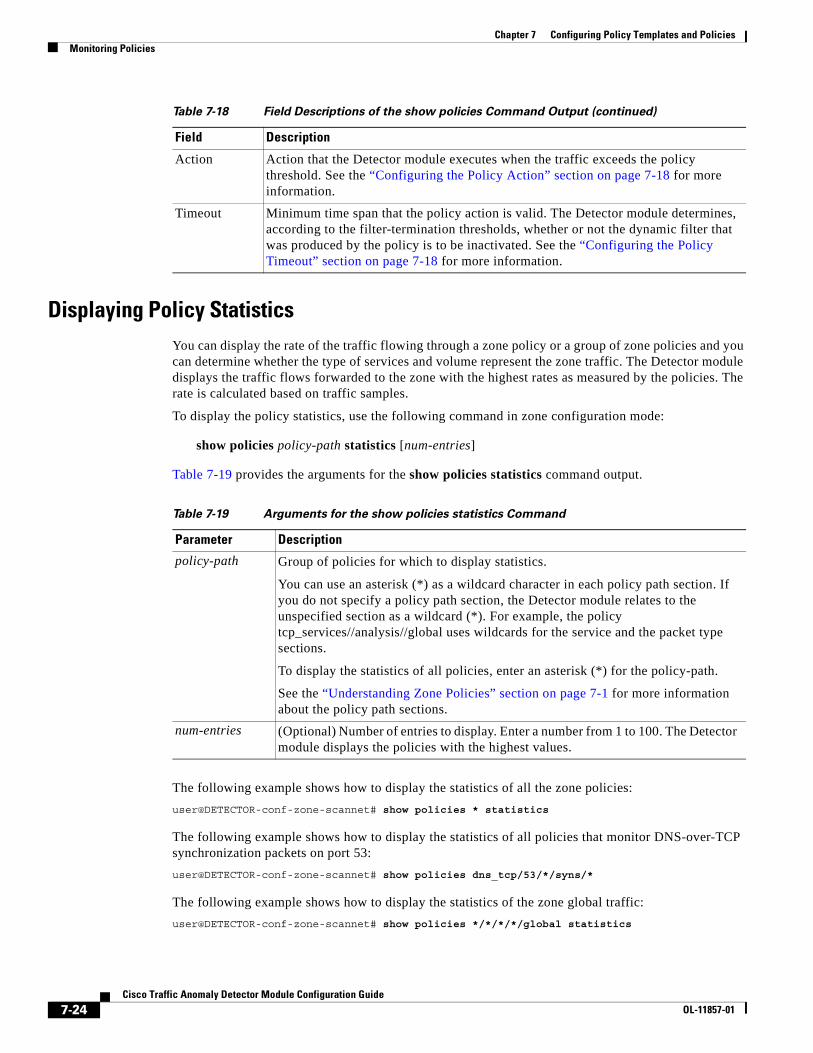
Chapter 7 Configuring Policy Templates and PoliciesMonitoring Policies
Displaying Policy StatisticsYou can display the rate of the traffic flowing through a zone policy or a group of zone policies and you can determine whether the type of services and volume represent the zone traffic. The Detector module displays the traffic flows forwarded to the zone with the highest rates as measured by the policies. The rate is calculated based on traffic samples.
To display the policy statistics, use the following command in zone configuration mode:
show policies policy-path statistics [num-entries]
Table 7-19 provides the arguments for the show policies statistics command output.
The following example shows how to display the statistics of all the zone policies:
user@DETECTOR-conf-zone-scannet# show policies * statistics
The following example shows how to display the statistics of all policies that monitor DNS-over-TCP synchronization packets on port 53:
user@DETECTOR-conf-zone-scannet# show policies dns_tcp/53/*/syns/*
The following example shows how to display the statistics of the zone global traffic:
user@DETECTOR-conf-zone-scannet# show policies */*/*/*/global statistics
Action Action that the Detector module executes when the traffic exceeds the policy threshold. See the “Configuring the Policy Action” section on page 7-18 for more information.
Timeout Minimum time span that the policy action is valid. The Detector module determines, according to the filter-termination thresholds, whether or not the dynamic filter that was produced by the policy is to be inactivated. See the “Configuring the Policy Timeout” section on page 7-18 for more information.
Table 7-18 Field Descriptions of the show policies Command Output (continued)
Field Description
Table 7-19 Arguments for the show policies statistics Command
Parameter Description
policy-path Group of policies for which to display statistics.
You can use an asterisk (*) as a wildcard character in each policy path section. If you do not specify a policy path section, the Detector module relates to the unspecified section as a wildcard (*). For example, the policy tcp_services//analysis//global uses wildcards for the service and the packet type sections.
To display the statistics of all policies, enter an asterisk (*) for the policy-path.
See the “Understanding Zone Policies” section on page 7-1 for more information about the policy path sections.
num-entries (Optional) Number of entries to display. Enter a number from 1 to 100. The Detector module displays the policies with the highest values.
7-24Cisco Traffic Anomaly Detector Module Configuration Guide
OL-11857-01
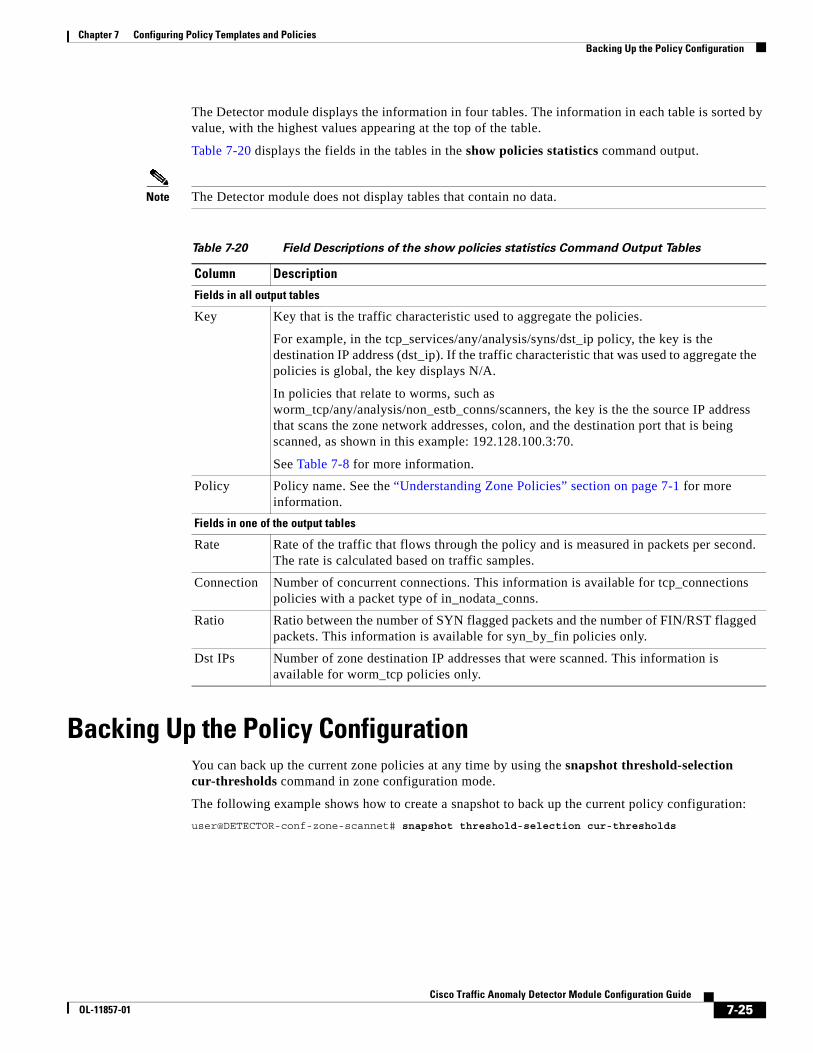
Chapter 7 Configuring Policy Templates and PoliciesBacking Up the Policy Configuration
The Detector module displays the information in four tables. The information in each table is sorted by value, with the highest values appearing at the top of the table.
Table 7-20 displays the fields in the tables in the show policies statistics command output.
Note The Detector module does not display tables that contain no data.
Backing Up the Policy ConfigurationYou can back up the current zone policies at any time by using the snapshot threshold-selection cur-thresholds command in zone configuration mode.
The following example shows how to create a snapshot to back up the current policy configuration:
user@DETECTOR-conf-zone-scannet# snapshot threshold-selection cur-thresholds
Table 7-20 Field Descriptions of the show policies statistics Command Output Tables
Column Description
Fields in all output tables
Key Key that is the traffic characteristic used to aggregate the policies.
For example, in the tcp_services/any/analysis/syns/dst_ip policy, the key is the destination IP address (dst_ip). If the traffic characteristic that was used to aggregate the policies is global, the key displays N/A.
In policies that relate to worms, such as worm_tcp/any/analysis/non_estb_conns/scanners, the key is the the source IP address that scans the zone network addresses, colon, and the destination port that is being scanned, as shown in this example: 192.128.100.3:70.
See Table 7-8 for more information.
Policy Policy name. See the “Understanding Zone Policies” section on page 7-1 for more information.
Fields in one of the output tables
Rate Rate of the traffic that flows through the policy and is measured in packets per second. The rate is calculated based on traffic samples.
Connection Number of concurrent connections. This information is available for tcp_connections policies with a packet type of in_nodata_conns.
Ratio Ratio between the number of SYN flagged packets and the number of FIN/RST flagged packets. This information is available for syn_by_fin policies only.
Dst IPs Number of zone destination IP addresses that were scanned. This information is available for worm_tcp policies only.
7-25Cisco Traffic Anomaly Detector Module Configuration Guide
OL-11857-01

Chapter 7 Configuring Policy Templates and PoliciesBacking Up the Policy Configuration
7-26Cisco Traffic Anomaly Detector Module Configuration Guide
OL-11857-01

Cisco TraOL-11857-01
C H A P T E R 8
Learning the Zone Traffic CharacteristicsThis chapter describes how to use the Cisco Traffic Anomaly Detector Module (Detector module) learning process to analyze zone traffic characteristics to create and tune the policies that the Detector module uses for zone anomaly detection.
This chapter refers to the Cisco Guard (Guard), the companion product of the Detector module. The Guard is a Distributed Denial of Service (DDoS) attack detection and mitigation device that cleans the zone traffic as the traffic flows through it, dropping the attack traffic and injecting the legitimate traffic back into the network. When the Detector module determines that the zone is under attack, it can activate the Guard attack mitigation services. The Detector module can also synchronize zone configurations with the Guard. For more information about the Guard, see the Cisco Anomaly Guard Module Configuration Guide or the Cisco Guard Configuration Guide.
This chapter contains the following sections:
• Understanding the Learning Process and Related Options
• Synchronizing the Zone Learning Process Results with a Guard
• Activating the Policy Construction Phase
• Activating the Threshold Tuning Phase
• Configuring Learning Parameters
• Enabling the Detect and Learn Function
• Using Snapshots to Verify the Results of the Learning Process
• Backing Up the Zone Policies
Understanding the Learning Process and Related OptionsThe learning process allows the Detector module to analyze normal zone traffic conditions to establish a baseline for determining when traffic is normal and when traffic contains anomalies that indicate an attack on the zone. During the learning process, the Detector module creates new zone policies and modifies the policy thresholds based on the normal traffic patterns to produce the reference baseline.
For the learning process to take place, you must configure the switch to capture the traffic sent to the zone and pass a copy of it to the Detector module. See the “Configuring Traffic Sources for Capturing Traffic” section on page 2-3 for more information.
8-1ffic Anomaly Detector Module Configuration Guide
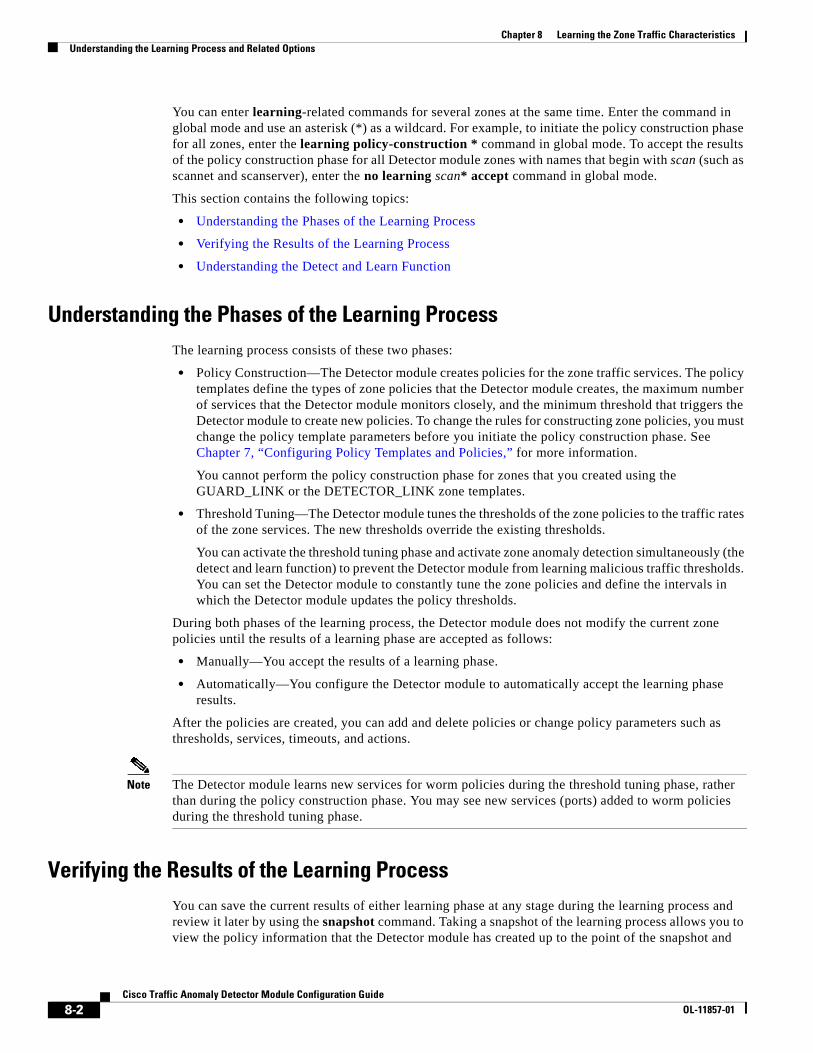
Chapter 8 Learning the Zone Traffic CharacteristicsUnderstanding the Learning Process and Related Options
You can enter learning-related commands for several zones at the same time. Enter the command in global mode and use an asterisk (*) as a wildcard. For example, to initiate the policy construction phase for all zones, enter the learning policy-construction * command in global mode. To accept the results of the policy construction phase for all Detector module zones with names that begin with scan (such as scannet and scanserver), enter the no learning scan* accept command in global mode.
This section contains the following topics:
• Understanding the Phases of the Learning Process
• Verifying the Results of the Learning Process
• Understanding the Detect and Learn Function
Understanding the Phases of the Learning ProcessThe learning process consists of these two phases:
• Policy Construction—The Detector module creates policies for the zone traffic services. The policy templates define the types of zone policies that the Detector module creates, the maximum number of services that the Detector module monitors closely, and the minimum threshold that triggers the Detector module to create new policies. To change the rules for constructing zone policies, you must change the policy template parameters before you initiate the policy construction phase. See Chapter 7, “Configuring Policy Templates and Policies,” for more information.
You cannot perform the policy construction phase for zones that you created using the GUARD_LINK or the DETECTOR_LINK zone templates.
• Threshold Tuning—The Detector module tunes the thresholds of the zone policies to the traffic rates of the zone services. The new thresholds override the existing thresholds.
You can activate the threshold tuning phase and activate zone anomaly detection simultaneously (the detect and learn function) to prevent the Detector module from learning malicious traffic thresholds. You can set the Detector module to constantly tune the zone policies and define the intervals in which the Detector module updates the policy thresholds.
During both phases of the learning process, the Detector module does not modify the current zone policies until the results of a learning phase are accepted as follows:
• Manually—You accept the results of a learning phase.
• Automatically—You configure the Detector module to automatically accept the learning phase results.
After the policies are created, you can add and delete policies or change policy parameters such as thresholds, services, timeouts, and actions.
Note The Detector module learns new services for worm policies during the threshold tuning phase, rather than during the policy construction phase. You may see new services (ports) added to worm policies during the threshold tuning phase.
Verifying the Results of the Learning ProcessYou can save the current results of either learning phase at any stage during the learning process and review it later by using the snapshot command. Taking a snapshot of the learning process allows you to view the policy information that the Detector module has created up to the point of the snapshot and
8-2Cisco Traffic Anomaly Detector Module Configuration Guide
OL-11857-01
Chapter 8 Learning the Zone Traffic CharacteristicsSynchronizing the Zone Learning Process Results with a Guard
decide whether or not to accept the results of the learning process. Saving the results of the learning phase in a snapshot does not affect the zone configuration. You can update the zone configuration with the policy information in a snapshot.
For more information about using the snapshot command, see the “Creating Snapshots” section on page 8-12.
Understanding the Detect and Learn FunctionAfter the Detector module has performed the policy construction phase, you can activate the threshold tuning phase of the learning process and enable zone anomaly detection simultaneously using the detect and learn function. The Detector module tunes the policy thresholds while monitoring the traffic for anomalies using the last saved policy thresholds. The detect and learn function enables the Detector module to detect zone anomalies, constantly update the policy thresholds based on the zone traffic characteristics, and prevents the Detector module from learning malicious traffic thresholds.
Before you activate the detect and learn function, you can configure when and how the Detector module accepts the results of the threshold tuning phase by configuring the learning parameters.
See the “Enabling the Detect and Learn Function” section on page 8-11 for more information.
Synchronizing the Zone Learning Process Results with a GuardYou can configure the Detector module to perform threshold tuning and to update the corresponding zone configuration on a Guard using a process called zone synchronization, For example, when you enable the detect and learn function on the Detector module and it detects an anomaly, it stops the learning process, updates the Guard with the latest zone configuration using zone synchronization, and then activates the Guard’s attack mitigation services. Zone synchronization enables you to use the Detector module to continuously adjust the zone policy thresholds to changes in the normal traffic for both the Detector module and the Guard. Because the Detector module analyzes a copy of the zone traffic, you avoid having to constantly divert the zone traffic to the Guard for the learning process.
To synchronize the Detector module learning process results with a Guard, you must perform the following tasks:
1. Add the Guard to a remote Guard list on the Detector module and define the communication method as Secure Sockets Layer (SSL). See the “Activating Remote Guards Using Remote Guard Lists” section on page 9-5.
2. Establish an SSL communication channel with the Guard. See the “Configuring the SSL Communication Channels Parameters” section on page 4-17.
3. Create the zone on the Detector module using a Guard zone template. See the “Creating a New Zone from a Zone Template” section on page 5-4.
4. Activate the detect and learn function for the zone (see the “Enabling the Detect and Learn Function” section on page 8-11).
You can synchronize the zone configuration with the Guard manually or configure the Detector module to synchronize the zone configuration with the Guard automatically. See the “Synchronizing Zone Configurations with a Guard” section on page 5-8 for more information.
8-3Cisco Traffic Anomaly Detector Module Configuration Guide
OL-11857-01
Chapter 8 Learning the Zone Traffic CharacteristicsActivating the Policy Construction Phase
Activating the Policy Construction PhaseUse the policy construction phase after creating a new zone or any time that the zone configuration needs updating with new service policies. When you enable the policy construction phase, the Detector module analyzes the traffic to discover the main services (ports and protocols) that the zone uses. the Detector module creates the zone policies for the services using the rules established by the policy templates.
Note You can reconfigure the policy construction rules by modifying the policy templates before you initiate the policy construction phase. For example, you can prevent the Detector module from creating policies of a certain type by disabling the relevant policy template. You can also modify the default values for the policy parameters (timeout, action, and threshold). See Chapter 7, “Configuring Policy Templates and Policies” for more information.
The new policies that the Detector module creates during the policy construction phase replace the existing policies when you accept the results of the phase.
Note You cannot perform the policy construction phase of the learning process for zones that are based on these bandwidth-limited link zone templates: DETECTOR_LINK_128K, DETECTOR_LINK_1M, DETECTOR_LINK_4M and GUARD_LINK_512K, GUARD_LINK_128K, GUARD_LINK_1M, GUARD_LINK_4M, and GUARD_LINK_512K.
Before you activate the policy construction phase, make sure that no attack on the zone is in progress so that the Detector module does not construct the policies based on the traffic characteristics of a DDoS attack. If you allow the Detector module to learn the traffic characteristics of a DDoS attack and save the results of the attack as a baseline, you may prevent the Detector module from detecting future attacks because the Detector module may view the attacks as normal traffic conditions.
To construct the zone policies, perform the following steps:
Step 1 Activate the policy construction phase by entering the following command in zone configuration mode:
learning policy-construction
Step 2 Check that the Detector module is receiving a copy of the zone traffic.
Wait at least 10 seconds after initiating policy construction or threshold tuning and enter the show rates command. Verify that the value of the Received traffic rate is greater than zero. A value of zero indicates that the Detector module is not receiving a copy of the zone traffic. Check the configuration of traffic sources for capturing traffic. See the “Configuring Traffic Sources for Capturing Traffic” section on page 2-3 for more information.
Step 3 (Optional) Display the policies that the Detector module is constructing.
You can save a snapshot of the learning parameters (services, thresholds, and other policy-related data) by using the snapshot command at any stage during the policy construction phase, and review it later. You can save a single snapshot or save a periodic snapshot at specified intervals.
For more information, see the “Backing Up the Policy Configuration” section on page 7-25.
8-4Cisco Traffic Anomaly Detector Module Configuration Guide
OL-11857-01
Chapter 8 Learning the Zone Traffic CharacteristicsActivating the Policy Construction Phase
Step 4 (Optional) After you have run the policy construction phase long enough for the Detector module to analyze a complete sample of the network traffic, you can accept the policies that the Detector module suggested without stopping the policy construction phase. You can accept the policies once, or define that the Detector module automatically accept the suggested policies at specified intervals. You can ensure that the zone has the most updated policies and continues to learn the zone traffic.
To accept the policies that the Detector module suggested and continue the policy construction phase, use the following command:
learning accept
To automatically accept the policies that the Detector module suggests at specified intervals, use the following command:
learning-params periodic-action auto-accept learn_params_days learn_params_hours learn_params_minutes
See the “Configuring Learning Parameters” section on page 8-8 for more information.
Use the no learning-params periodic-action command to terminate the periodic action.
Step 5 After allowing the Detector module enough time to analyze a complete sample of the network traffic, terminate the policy construction phase and decide how to handle the newly constructed policies.
Note We recommend that you let the policy construction phase continue for at least 2 hours before terminating it to allow the Detector module enough time to discover the main services (ports and protocols) that the zone uses.
You can perform one of the following actions:
• Accept the suggested policies—You can accept the policies that the Detector module suggested by entering the following command in zone configuration mode:
no learning accept
The Detector module erases previously learned policies and thresholds.
After accepting the newly constructed policies, you can manually add or remove policies. See Chapter 7, “Configuring Policy Templates and Policies,” for more information.
• Reject the suggested policies—You can reject the policies that the Detector module suggested by entering the following command in zone configuration mode:
no learning reject
The Detector module stops the process and does not save the new policies that it has just learned. The policies of the zone are the policies that the Detector module had prior to initiating the learning process or prior to the last time that you accepted the results of the policy construction phase.
After performing the policy construction phase, enable the threshold tuning phase to tune the thresholds of each policy (see the “Activating the Threshold Tuning Phase” section on page 8-6).
The following example shows how to initiate the policy construction phase and accept the suggested policies at 12-hour intervals. The example also shows how to stop the policy construction phase and accept the suggested policies.
user@DETECTOR-conf-zone-scannet# learning policy-constructionuser@DETECTOR-conf-zone-scannet# learning-params periodic-action auto-accept 0 12 0user@DETECTOR-conf-zone-scannet# no learning accept
8-5Cisco Traffic Anomaly Detector Module Configuration Guide
OL-11857-01
Chapter 8 Learning the Zone Traffic CharacteristicsActivating the Threshold Tuning Phase
Activating the Threshold Tuning PhaseUse the threshold tuning phase to enable the Detector module to analyze the zone traffic and define thresholds for the zone policies. We recommend that you run the threshold tuning phase during peak traffic time (the busiest part of the day) for a minimum of 24 hours to allow the Detector module enough time to properly tune the policy thresholds.
Note The following procedure includes the command for enabling the detect and learn function which enables the Detector module to perform threshold tuning and anomaly detection simultaneously. We recommend that you enable the detect and learn function when you need to perform the threshold tuning phase (see the “Understanding the Detect and Learn Function” section on page 8-3).
To activate the threshold tuning phase of the learning process, perform the following steps:
Step 1 Initiate the threshold tuning phase by entering one of the following commands in zone configuration mode:
• learning threshold-tuning—Enables the threshold tuning phase only.
• detect learning—Enables the detect and learn function in which the threshold tuning phase and anomaly detection perform simultaneously. You can also activate the detect and learn function by entering the learning threshold-tuning command and the detect command (the order is not important).
Note If you activate the detect and learn function when traffic to the zone is moderate, the Detector module may consider the traffic during peak time as an attack. In this case, you can perform one of the following tasks:
• Set the state of the zone policy thresholds to untuned by entering the no learning-params threshold-tuned command in zone configuration mode. See the “Marking the Policies as Tuned” section on page 8-10 for more information.
• Deactivate zone anomaly detection and continue to learn the zone policy thresholds by entering the no detect command in zone configuration mode.
Step 2 Verify that the Detector module is receiving a copy of the zone traffic. Wait at least 10 seconds after initiating the policy construction phase or threshold tuning phase and enter the show rates command. Verify that the value of the Received traffic rate is greater than zero. A value of zero indicates that the Detector module is not receiving a copy of the zone traffic. Check the configuration of traffic sources for capturing traffic. See the “Configuring Traffic Sources for Capturing Traffic” section on page 2-3 for more information.
Step 3 (Optional) Display the zone policies that the Detector module is tuning by using the snapshot command (see the “Using Snapshots to Verify the Results of the Learning Process” section on page 8-12).
Step 4 Accept the suggested thresholds. You can accept the thresholds that the Detector module currently suggests and continue the threshold tuning phase, or configure the Detector module to automatically accept the suggested policies at specified intervals to ensure that the zone has the most updated thresholds and continues to learn the zone traffic.
To accept the policies that the Detector module suggests and continue the threshold tuning phase, use the following command:
learning accept [threshold-selection {new-thresholds | max-thresholds | weighted weight}]
8-6Cisco Traffic Anomaly Detector Module Configuration Guide
OL-11857-01
Chapter 8 Learning the Zone Traffic CharacteristicsActivating the Threshold Tuning Phase
See Table 8-2 on page 8-9 for a description of the threshold-selection arguments and keywords.
To automatically accept the policies that the Detector module suggests at specified intervals, use the following command:
learning-params periodic-action auto-accept learn_params_days learn_params_hours learn_params_minutes
See the “Configuring Learning Parameters” section on page 8-8 for more information.
Use the no learning-params periodic-action command to terminate the periodic action.
Step 5 Terminate the threshold tuning phase and accept or reject the current suggested thresholds after allowing the Detector module enough time to properly tune the policy thresholds.
Note If you have the detect and learn function enabled, we recommend that you do not terminate the threshold tuning phase.
Perform one of the following actions:
• Accept the suggested policies—Terminate the learning process and accept the policy thresholds that the Detector module suggests by entering the following command in zone configuration mode:
no learning accept [threshold-selection {new-thresholds | max-thresholds | weighted weight}]
See Table 8-2 for a description of the threshold-selection arguments and keywords.
The Detector module replaces the previously learned thresholds with the new thresholds. After accepting the newly tuned policies, you can manually change the policy parameters. See Chapter 7, “Configuring Policy Templates and Policies,” for more information.
• Reject the suggested policies—Terminate the learning process and reject the policy thresholds that the Detector module suggests by entering one of the the following commands in zone configuration mode:
– no learning reject
The Detector module stops tuning the thresholds and makes no changes to the current thresholds. This process may result in a situation in which new zone policies have thresholds that were obtained based on past traffic characteristics. We recommend that you enable the threshold tuning phase at a later time or that you configure the thresholds manually.
– deactivate
If you have the detect and learn function enabled, use the deactivate command to terminate anomaly detection and the threshold tuning phase without saving the current suggested thresholds.
The following example shows how to initiate the threshold tuning phase and accept the suggested policies at 1-hour intervals. The Detector module then stops the threshold tuning phase and accepts the suggested policies if the threshold values are higher than the current values (the max-thresholds method).
user@DETECTOR-conf-zone-scannet# learning threshold-tuninguser@DETECTOR-conf-zone-scannet# learning-params periodic-action auto-accept 0 1 0user@DETECTOR-conf-zone-scannet# no learning accept threshold-selection max-thresholds
8-7Cisco Traffic Anomaly Detector Module Configuration Guide
OL-11857-01
Chapter 8 Learning the Zone Traffic CharacteristicsConfiguring Learning Parameters
After performing the threshold tuning phase, you can perform the following tasks:
• Display the learning process results—Use the show policies statistics command to view the results of the threshold tuning phase (see the “Displaying Policies” section on page 7-23 for more information).
• Modify the learning process results—Change policy parameter values that may not accurately represent normal traffic characteristics. See the “Configuring Policy Parameters” section on page 7-12.
• Set the policy threshold as fixed—The next time you enable the threshold tuning phase, the Detector module ignores new thresholds and maintains the current ones. See the “Setting the Threshold as Fixed” section on page 7-15 for more information.
• Set a fixed multiplier for the policy—The next time you enable the threshold tuning phase, the Detector module calculates new policy thresholds by multiplying the learned threshold by the specified multiplier and then applying the threshold selection method on the result. See the “Configuring a Threshold Multiplier” section on page 7-15 for more information.
Configuring Learning ParametersThis section shows how to configure the learning parameters to manage the following functions that affect all of the zone policies:
• Period Detector module actions—Configure the Detector module to automatically accept the zone policies and save a snapshot of the zone policies at specified intervals.
• Threshold selection method—Configure the default method that the Detector module uses to generate new policy thresholds after it accepts the results of the threshold tuning phase.
• Tuned state of the zone policies—Set the state of the current zone polices to tuned or untuned.
To display the current configuration of the learning parameters, use the show learning-params command in zone configuration mode.
This section contains the following topics:
• Configuring Periodic Actions
• Configuring the Threshold Selection Method
• Marking the Policies as Tuned
Configuring Periodic ActionsYou can configure the Detector module to perform one of the following actions at specified intervals:
• Automatically accept the zone policies and save a snapshot of the policies
• Save a snapshot of the zone policies only
See the “Verifying the Results of the Learning Process” section on page 8-2 for more information on snapshots.
To set the periodic action that the Detector module performs, use the following command in zone configuration mode:
learning-params periodic-action {auto-accept | snapshot-only} learn_params_days learn_params_hours learn_params_minutes
8-8Cisco Traffic Anomaly Detector Module Configuration Guide
OL-11857-01
Chapter 8 Learning the Zone Traffic CharacteristicsConfiguring Learning Parameters
Table 8-1 provides the arguments and keywords for the learning-params command.
The value of the interval is the sum of the learn_params_days value, the learn_params_hours value, and the learn_params_minutes value.
The following example shows how to set the Detector module to accept the policies at 1-hour intervals:
user@DETECTOR-conf-zone-scannet# learning-params periodic-action auto-accept 0 1 0
Configuring the Threshold Selection MethodYou can define the default method that the Detector module uses to generate new thresholds to accept during the threshold tuning phase. You can accept the results of the threshold tuning phase manually, or configure the Detector module to automatically accept the results of the threshold tuning phase at specified intervals.
To configure the threshold selection method, use the following command in zone configuration mode:
learning-params threshold-selection {new-thresholds | max-thresholds | weighted weight}
Table 8-2 provides the arguments and keywords for the learning-params threshold-selection command.
This example shows how to configure the Detector module to accept the suggested policies if the learned threshold values are higher than the current policy threshold values:
user@DETECTOR-conf-zone-scannet# learning-params threshold-selection max-thresholds
Table 8-1 Arguments and Keywords for the learning-params periodic-action Command
Parameter Description
auto-accept Accepts the policies that the Detector module suggested at the specified interval. The Detector module saves a snapshot of the zone policies after accepting the newly suggested ones.
snapshot-only Saves a snapshot of the policies at the specified interval. The Detector module does not accept the new policies and does not modify the policy thresholds.
learn_params_days Interval in days. Enter an integer from 0 to 1000.
learn_params_hours Interval in hours. Enter an integer from 0 to 1000.
learn_params_minutes Interval in minutes. Enter an integer from 0 to 1000.
Table 8-2 Arguments and Keywords for the learning-params threshold-selection Command
Parameter Description
new-thresholds Saves the results of the learning process to the zone configuration.
max-thresholds Compares the current policy threshold to the learned threshold and saves the higher threshold to the zone configuration.
This method is the default.
weighted weight Calculates the policy thresholds to save based on the following formula:
new-threshold = (learned-threshold * weight + current-threshold * (100 – weight)) / 100
8-9Cisco Traffic Anomaly Detector Module Configuration Guide
OL-11857-01
Chapter 8 Learning the Zone Traffic CharacteristicsConfiguring Learning Parameters
Marking the Policies as TunedThe Detector module marks the policy threshold status that defines if the policy thresholds are tuned or not tuned and relates to this status when you enable the protect and learn function. The policy threshold status specifies if the Detector module identifies an attack on the zone when the policy threshold is exceeded.
When a new zone is created, or after you accept the policy construction phase results for a zone, the Detector module marks the zone policy thresholds as untuned. The default thresholds of the zone templates are tuned so that the Detector module activates the anti-spoofing functions quickly if it identifies traffic anomalies in the zone traffic. When you enable the protect and learn function, the learning process might stop if the current zone traffic is higher than the current policy threshold values. To avoid this situation, if the zone policies are not tuned, the Detector module does not detect attacks in the zone traffic when you enable the detect and learn function until the zone policy thresholds are accepted once.
If the zone policies are untuned, the Detector module activates only a threshold selection method of accept-new and ignores previous threshold values when accepting the new policies. If the Detector module accepts the threshold tuning phase results of the learning process for a zone with a threshold selection method other than accept-new, bad policy threshold values may result. See the “Configuring the Threshold Selection Method” section on page 8-9 for more information about the threshold selection method.
The Detector module marks the zone policies as untuned in the following situations:
• When creating a new zone
• After accepting the policy construction phase results
• After removing a service or adding a new service to the zone policies
The Detector module marks the zone policies as tuned after accepting the threshold tuning phase results.
You can modify the settings of the zone policies. To mark the zone policies as tuned, use the following command in zone configuration mode:
learning-params threshold-tuned
To mark the zone policies as untuned, use the no form of this command.
You may want to change the status of the zone policies to tuned when one of the following applies:
• The new zone was duplicated from an existing zone or snapshot that has similar traffic characteristics.
• You have manually configured all policy thresholds.
You may want to change the status of the zone policies to untuned when one of the following applies:
• A major change was made in the zone network.
• The zone IP address or subnet was modified.
• You have not initiated the detect and learn function during the peak traffic time. Change the status of the zone policies to untuned to prevent the Detector module from identifying the traffic during the peak time as an attack.
When the zone policies are marked as untuned, the Detector module does not monitor the current policy thresholds and does not detect attacks on the zone if the policy thresholds are exceeded.
8-10Cisco Traffic Anomaly Detector Module Configuration Guide
OL-11857-01
Chapter 8 Learning the Zone Traffic CharacteristicsEnabling the Detect and Learn Function
Caution Do not change the status of the zone policies to untuned if there is an attack on the zone because that prevents the Detector module from detecting the attack and causes the Detector module to learn malicious traffic thresholds.
The following example shows how to mark the status of the zone policies as tuned:
user@DETECTOR-conf-zone-scannet# learning-params threshold-tuned
Enabling the Detect and Learn FunctionYou can enable the threshold tuning phase of the learning process and zone anomaly detection simultaneously by using the detect and learn function. The Detector module continuously tunes the policy thresholds and at the same time monitors the traffic for anomalies using the last saved policy thresholds. If the Detector module detects an attack on the zone, it stops the learning process to prevent it from learning malicious traffic thresholds. If you have the Detector module configured to activate a Guard to mitigate the attack, it activates the Guard and then constantly polls the Guard. When the Detector module determines that the Guard has deactivated zone protection, it verifies that additional traffic anomalies do not exist before reactivating the detect and learn function.
Perform the following actions before you activate the detect and learn function:
• Activate the policy construction phase of the learning process to construct zone-specific policies (see the “Activating the Policy Construction Phase” section on page 8-4).
• Display the current tuned state of the zone policies by using the show learning-params command in zone configuration mode. If the policies are tuned, then the Detector module is ready to perform the detect and learn operation.
Caution If the zone policies are untuned when you enable the detect and learn function, the Detector module is unable to detect zone anomalies until the first time that you accept the results of the threshold tuning phase.
If the policies are untuned, the Detector module functions as follows until the first time that you accept results of threshold tuning phase:
– Performs the threshold tuning phase of the learning process only. The Detector module does not detect anomalies because it does not monitor the traffic for policy threshold violations. After the first time that you accept the results of the threshold tuning phase, the Detector module marks the policies as tuned and begins monitoring the traffic for anomalies.
– The Detector module activates a threshold selection method of accept-new even if you have the threshold selection method configured for max-threshold or weighted (see the “Configuring the Threshold Selection Method” section on page 8-9). After the first time that you accept the results of the threshold tuning phase, the Detector module uses the threshold selection method that you have configured.
See the “Marking the Policies as Tuned” section on page 8-10 for more information.
You can accept the results of the threshold tuning phase manually or configure the Detector module to accept the results automatically. You can also configure when and how the Detector module accepts the results of the learning process (see the “Configuring Learning Parameters” section on page 8-8).
8-11Cisco Traffic Anomaly Detector Module Configuration Guide
OL-11857-01
Chapter 8 Learning the Zone Traffic CharacteristicsUsing Snapshots to Verify the Results of the Learning Process
To activate the learning process and zone anomaly detection simultaneously, use the detect learning command or enter both the learning threshold-tuning command and the detect command (the order is not important).
For more information about the threshold tuning phase, see the “Activating the Threshold Tuning Phase” section on page 8-6. For more information about enabling anomaly detection, see Chapter 9, “Detecting Zone Traffic Anomalies.”
Using Snapshots to Verify the Results of the Learning ProcessThe snapshot function allows you to save a copy of the learning parameters (services, thresholds, and other policy-related data) at any stage of the learning process. You can use snapshots to perform the following tasks:
• Compare the learning parameters of two zones.
• Compare two of the zone snapshots to verify the outcome of the learning process and trace the differences in policies, services, and thresholds.
• Use the policies of a snapshot taken during normal traffic conditions to provide anomaly detection if an attack occurs during the learning process.
• Copy zone policies from a snapshot to configure the zone according to previous learning results.
We recommend that you save a snapshot every few hours during the learning process. You can take the snapshot manually or configure the Detector module to automatically take a snapshot at specified intervals. The Detector module can save up to 100 snapshots for each zone. New snapshots replace the previous ones.
This section contains the following topics:
• Creating Snapshots
• Comparing Learning Results
• Displaying Snapshots
• Deleting Snapshots
• Copying Policies to the Zone Configuration
Creating SnapshotsYou can save a single snapshot of the zone learning parameters or configure the Detector module to automatically take a snapshot at specified intervals. The Detector module continues the learning process while taking the snapshot.
To configure the Detector module to automatically take a snapshot at specified intervals, see the “Configuring Periodic Actions” section on page 8-8 for more information.
To save a single snapshot of the zone learning parameters, use the following command in zone configuration mode:
snapshot [threshold-selection {new-thresholds | max-thresholds | cur-thresholds | weighted calc-weight}]
8-12Cisco Traffic Anomaly Detector Module Configuration Guide
OL-11857-01
Chapter 8 Learning the Zone Traffic CharacteristicsUsing Snapshots to Verify the Results of the Learning Process
Table 8-3 provides the arguments and keywords for the snapshot command.
The following example shows how to create a snapshot in which the thresholds are the highest value between the current policy threshold and the new threshold of the learning process:
user@DETECTOR-conf-zone-scannet# snapshot threshold-selection max-thresholds
To save a single snapshot in global mode, use the following command:
snapshot zone-name [threshold-selection {new-thresholds | max-thresholds | cur-thresholds | weighted weight}]
Comparing Learning ResultsYou can compare the learning results of two snapshots or two zones to trace the differences in policies, services, and thresholds.
This section contains the following topics:
• Comparing Snapshots
• Comparing Zones
Comparing Snapshots
To compare two snapshots, use the following command in zone configuration mode:
diff snapshots snapshot-id1 snapshot-id2 [percent]
Table 8-3 Arguments and Keywords for the snapshot Command
Parameter Description
threshold-selection (Optional) Specifies the method that the Detector module uses to calculate the snapshot thresholds. By default, the Detector module uses the zone threshold-selection method that is defined by the learning-params threshold-selection command. The default zone threshold-selection method is max-thresholds.
new-thresholds Saves the results of the leaning process to the zone configuration.
max-thresholds Compares the current policy threshold to the learned threshold and saves the higher threshold to the zone configuration. This is the default method.
cur-thresholds Ignores the new thresholds of the learning process and saves the current policy thresholds to the snapshot. You can use this method to create a backup of the current zone policies and policy thresholds.
weighted calc-weight
Calculates the policy thresholds to save based on the following formula:
threshold = (new-threshold * calc-weight + current-threshold * (100 - calc-weight)) / 100
8-13Cisco Traffic Anomaly Detector Module Configuration Guide
OL-11857-01
Chapter 8 Learning the Zone Traffic CharacteristicsUsing Snapshots to Verify the Results of the Learning Process
Table 8-4 provides the arguments for the diff command.
The following example shows how to display the zone snapshots and compare the two most recent snapshots:
user@DETECTOR-conf-zone-scannet# show snapshotsID Time1 Feb 10 10:32:042 Feb 10 10:49:123 Feb 10 11:01:50user@DETECTOR-conf-zone-scannet# diff 2 3
To compare snapshots in global mode, use the following command:
diff zone-name snapshots snapshot-id1 snapshot-id2 [percent]
Comparing Zones
You can compare the learning parameters of two zones by using the following command in global mode or in configuration mode:
diff zone-name1 zone-name2 [percent]
Table 8-5 provides the arguments for the diff command.
The following example shows how to compare the learning parameters of two zones:
user@DETECTOR# diff scannet scannet-mailserver
Table 8-4 Arguments for the diff Command
Parameter Description
snapshot-id1 Identifier of the first snapshot to compare. To display a list of the zone snapshots, use the show snapshots command.
snapshot-id2 Identifier of the second snapshot to compare. To display a list of the zone snapshots, use the show snapshots command.
percent (Optional) Percentage of difference. The Detector module compares the two snapshots and displays only the differences in policy thresholds that are greater than the specified value. The default percentage is 100%, which means that the Detector module displays all the differences between the two snapshots.
Table 8-5 Arguments for the diff Command
Parameter Description
zone-name1 Name of the first zone with learning parameters that is to be compared.
zone-name2 Name of the second zone with learning parameters that is to be compared.
percent (Optional) Percentage of difference. The Detector module compares the two zones and displays only differences in policy thresholds that are higher than the specified value. The default percentage is 100%, which means that the Detector module displays all differences between the two zones.
8-14Cisco Traffic Anomaly Detector Module Configuration Guide
OL-11857-01
Chapter 8 Learning the Zone Traffic CharacteristicsUsing Snapshots to Verify the Results of the Learning Process
Displaying SnapshotsYou can display a list of the zone snapshots or the snapshot parameters to get a comprehensive view of the zone learning results by entering the following command in zone configuration mode:
show snapshots [snapshot-id [policies policy-path]]
Table 8-6 provides the arguments and keywords for the show snapshots command.
To compare snapshots in global mode, use the the following command:
show zone zone-name snapshots [snapshot-id [policies policy-path]]
The fields of the show zone zone-name snapshots snapshot-id policies policy-path command output are identical to the fields in the output of the show policies command. See the “Displaying Policies” section on page 7-23 for more information.
Table 8-7 describes the fields in the show snapshots command output.
The following example shows how to display a list of the zone snapshots and the policies that are related to dns_tcp in snapshot 2:
user@DETECTOR-conf-zone-scannet# show snapshotsID Time1 Feb 10 10:32:042 Feb 10 10:49:12user@DETECTOR-conf-zone-scannet# show snapshots 2 policies dns_tcp
Deleting SnapshotsYou can delete old snapshots to free disk space by using the following command in zone configuration mode:
no snapshot snapshot-id
The snapshot-id argument specifies the ID of an existing snapshot. Enter an asterisk (*) to delete all the zone snapshots. To view the details of a snapshot, use the show snapshots command.
Table 8-6 Arguments and Keywords for the show snapshots Command
Parameter Description
snapshot-id (Optional) Identifier of the snapshot to display. If you do not specify policies, the default is to display a list of all the zone snapshots. To view the snapshot ID, use this command with no arguments.
policies policy-path
(Optional) Specifies a group of policies to display. See the “Understanding Zone Policies” section on page 7-1 for more information.
Table 8-7 Field Descriptions for show snapshots Command Output
Field Description
ID Snapshot identifier.
Time Date and time that the snapshot was taken.
8-15Cisco Traffic Anomaly Detector Module Configuration Guide
OL-11857-01
Chapter 8 Learning the Zone Traffic CharacteristicsUsing Snapshots to Verify the Results of the Learning Process
The following example shows how to delete all the zone snapshots:
user@DETECTOR-conf-zone-scannet# no snapshot *
Copying Policies to the Zone ConfigurationYou can copy a complete policy configuration or a partial configuration to the current zone.
You can copy the following information:
• Copy services—You can copy services from a source zone to the zone, which allows you to configure the zone policies without applying the policy construction phase to discover these services. Before you copy services to the zone, verify that the zones have similar traffic patterns.
• Copy policy parameters—You can replace the zone policy parameters with the policy parameters of one of the zone snapshots, which allows you to revert to prior learning results. The Detector module copies parameters of existing policies only.
To copy the zone policies, use the following command in zone configuration mode:
copy-policies {snapshot-id | src-zone-name [service-path]}
Table 8-8 provides the arguments and keywords for the copy-policies command.
The following example shows how to copy all services that relate to the policy template tcp_connections from the zone webnet to the current zone, scannet:
user@DETECTOR-conf-zone-scannet# copy-policies webnet tcp_connections/
The following example shows how to display a list of the zone snapshots and then copy the policies from the snapshot with ID 2:
user@DETECTOR-conf-zone-scannet# show snapshotsID Time1 Feb 10 10:32:042 Feb 10 10:49:12user@DETECTOR-conf-zone-scannet# copy-policies 2
Table 8-8 Arguments and Keywords for the copy-policies Command
Parameter Description
snapshot-id Identifier of the snapshot from which the policies are copied. To view the snapshot ID, use the show snapshots command.
src-zone-name Name of the zone for which service policies are copied.
service-path (Optional) Service to be copied. A service path can have one of the following formats:
• policy-template—Copies all policies that relate to the policy template.
• policy-template/service-num—Copies all policies that relate to the policy template and the specified service.
The default is to copy all policies and services.
8-16Cisco Traffic Anomaly Detector Module Configuration Guide
OL-11857-01
Chapter 8 Learning the Zone Traffic CharacteristicsBacking Up the Zone Policies
Backing Up the Zone PoliciesYou can create a backup the current zone policies at any time by using the following command in zone configuration mode:
snapshot threshold-selection cur-thresholds
The following example shows how to back up the current zone policies:
user@DETECTOR-conf-zone-scannet# snapshot threshold-selection cur-thresholds
8-17Cisco Traffic Anomaly Detector Module Configuration Guide
OL-11857-01

Chapter 8 Learning the Zone Traffic CharacteristicsBacking Up the Zone Policies
8-18Cisco Traffic Anomaly Detector Module Configuration Guide
OL-11857-01
Cisco TraOL-11857-01
C H A P T E R 9
Detecting Zone Traffic AnomaliesThis chapter describes how to configure the Cisco Traffic Anomaly Detector Module (Detector module) to detect traffic anomalies.
This chapter refers to the Cisco Guard (Guard), the companion product of the Detector module. The Guard is a Distributed Denial of Service (DDoS) attack detection and mitigation device that cleans the zone traffic as the traffic flows through it, dropping the attack traffic and injecting the legitimate traffic back into the network. When the Detector module determines that the zone is under attack, it can activate the Guard attack mitigation services. The Detector module can also synchronize zone configurations with the Guard. For more information about the Guard, see the Cisco Anomaly Guard Module Configuration Guide or the Cisco Guard Configuration Guide.
This chapter contains the following sections:
• Understanding Zone Anomaly Detection
• Configuring How the Detector Module Performs Zone Anomaly Detection
• Configuring Guard-Protection Activation Methods
• Activating Zone Anomaly Detection
• Deactivating Zone Anomaly Detection
• Activating Remote Guards to Protect a Zone
Understanding Zone Anomaly DetectionZone anomaly detection refers to when the Detector module is actively monitoring a copy of the zone traffic and looking for indications of a DDoS attack on the zone. When a traffic anomaly triggers a policy action by exceeding the policy threshold (indicating an attack), the Detector module performs one of the following tasks:
• Activates a Guard that you define on the Detector module remote Guard lists to mitigate the attack.
• Sends you a notification.
Before you activate anomaly detection, observe the following requirement and recommendation:
• Configure port mirroring on the switch or connect the Detector module to a router using an optical splitter —You must use one of these methods to provide the Detector module with a copy of the zone traffic for analysis purposes.
9-1ffic Anomaly Detector Module Configuration Guide
Chapter 9 Detecting Zone Traffic AnomaliesUnderstanding Zone Anomaly Detection
• Perform the learning process—We recommend that you allow the Detector module to create a set of zone-specific policies and policy thresholds based on normal traffic characteristics. To perform the learning process, we recommend that you perform the following steps:
1. Activate the policy construction phase—The Detector module creates a set of policies based on the services that it detects in the zone traffic. See the “Activating the Policy Construction Phase” section on page 8-4 for more information.
2. Activate the detect and learn function—The Detector module performs the threshold tuning phase of the learning process while monitoring the traffic for anomalies using the last accepted policy thresholds. If the Detector module detects an attack on the zone, it stops the threshold tuning phase but continues to look for anomalies in the zone traffic. See the “Enabling the Detect and Learn Function” section on page 8-11 for more information.
Note Activate the detect and learn option only when you are sure that the zone is not under attack.
• Synchronize the zone configuration with the Guard—When you associate Guards with theDetector module to provide zone protection, you can synchronize the zone configuration on the Detector module with the zone configuration on a Guard. See the “Synchronizing Zone Configurations with a Guard” section on page 5-8 and the “Activating Remote Guards to Protect a Zone” section on page 9-5 for more information.
• Define the anomaly detection characteristics—You can configure the following optional anomaly detection characteristics:
– Operation mode—Define how the Detector module performs zone anomaly detection (whether the Detector module detects anomalies in the zone traffic automatically or in an interactive manner in which you determine the actions that the Detector module executes). See the“Configuring How the Detector Module Performs Zone Anomaly Detection” section on page 9-3 for more information.
– Guard-Protection activation methods—Define how the Detector module activates a remote Guard to protect the zone. The Detector module can activate the remote Guard to protect a partial zone that is a part of the entire zone (for example, a specific server that is part of a protected network environment) or activate the remote Guard to protect the entire zone.
Tip You can verify that the Detector module is receiving a copy of the zone traffic by waiting at least 10 seconds after initiating the policy construction phase and entering the show rates command. Verify that the value of the Received traffic rate is greater than zero. A value of zero indicates that the Detector module is not receiving a copy of the zone traffic. Check the configuration of the port mirroring on the switch, or use an optical splitter to check the connection of the Detector module to the router.
9-2Cisco Traffic Anomaly Detector Module Configuration Guide
OL-11857-01
Chapter 9 Detecting Zone Traffic AnomaliesConfiguring How the Detector Module Performs Zone Anomaly Detection
Configuring How the Detector Module Performs Zone Anomaly Detection
During an attack on a zone, the Detector module creates dynamic filters that determine what actions the Detector module performs during the attack. You can configure the Detector module to execute the action associated with each dynamic filter automatically or wait until you decide whether or not to execute the proposed action. To control the execution of the dynamic filter actions, you configure the Detector module to perform anomaly detection in one of the following modes:
• Automatic protect mode—The Detector module activates the dynamic filter actions as soon as the Detector module creates the filter. This operation mode is the default.
• Interactive detect mode—The Detector module saves the dynamic filters as recommendations. You review the list of recommendations and decide which recommendations to accept, ignore, or direct to automatic activation.
Use the show command in zone configuration mode to display the current operation mode of the zone.
To enable the interactive detect mode, use the following command in zone configuration mode:
interactive
To disable the interactive detect mode and use the automatic detect mode, use the following command in zone configuration mode:
no interactive
See Chapter 10, “Using Interactive Detect Mode” for information about the following interactive protection operations:
• Enabling the interactive protect mode when you create a new zone.
• Managing the protection recommendations.
• Determining when you must switch to the automatic protect mode.
Configuring Guard-Protection Activation MethodsGuard-protection activation methods define how a remote Guard that you associate with the Detector activates zone protection. The activation methods focus on the zone protection requirements and save Guard module resources.
To activate a Guard-protection activation method, use the following command in zone configuration mode:
protect-ip-state {entire-zone | dst-ip-by-name | dst-ip-by-ip | policy-type}
The Guard-protection activation methods are as follows:
• entire-zone—Activates a Guard module to protect the entire zone when it detects an anomaly in the zone traffic. This method saves Guard module resources because it reduces the number of active zones that the Guard module protects. Use this method when the zone consists of related subzones.
• dst-ip-by-name—Activates a Guard module to protect a particular IP address when it detects an anomaly in the zone traffic that is destined to that IP address. You can activate a Guard module to protect the attacked IP address but avoid diverting the traffic of the entire zone to the Guard module.
9-3Cisco Traffic Anomaly Detector Module Configuration Guide
OL-11857-01
Chapter 9 Detecting Zone Traffic AnomaliesActivating Zone Anomaly Detection
If the Detector module cannot associate the traffic anomaly with a particular IP address, it does not activate a Guard module to protect the zone. Use this method when the zone consists of unrelated subzones.
• dst-ip-by-ip—Activates a Guard module to protect a particular IP address when it detects an anomaly in the zone traffic that is destined to that IP address. The IP address must be in the address range of one of the zones that is defined on the Guard module. However, the zone name on the Detector module does not have to be identical to the zone name on the Guard module. The dst-ip-by-ip Guard-protection activation method is equivalent to using the protect ip-address command on the Guard module. Use this method when the zone names on the Detector module are not identical to the zone names on the Guard module or when the zone consists of unrelated subzones.
Note To ensure that the Guard module activates zone protection for the attacked IP address only and avoids diverting the traffic of the entire zone to itself, make sure that the zone is defined on the Guard module with an activation extent of ip-address-only.
• policy-type—Activates the Guard module to protect the entire zone or to protect a particular IP address within the zone address range according to the policy that caused the Detector module to activate the Guard module. The Detector module activates the Guard module to protect a particular IP address if it detects an anomaly in the zone traffic that is destined to that IP address (for example, if the policy that caused the remote activation has traffic characteristics of dst_ip). If the Detector module cannot associate the traffic anomaly with a particular IP address, it activates the Guard module to protect the entire zone (for example, if the policy that caused the remote activation has traffic characteristics of global). Use this method when the zone consists of related subzones so that you can prevent a targeted zone from causing damage to the entire zone.
The following example shows how to configure the Guard-protection activation method:
user@DETECTOR-conf-zone-scannet# protect-ip-state entire-zone
Activating Zone Anomaly DetectionYou can activate zone anomaly detection by using the following command in zone configuration mode:
detect [learning]
The optional learning keyword enables the Detector module to detect anomalies in the zone traffic and tune the zone policy thresholds using the detect and learn function (see the “Enabling the Detect and Learn Function” section on page 8-11 for more information).
The following example shows how to activate anomaly detection for the zone scannet:
user@DETECTOR-conf-zone-scannet# detect
9-4Cisco Traffic Anomaly Detector Module Configuration Guide
OL-11857-01
Chapter 9 Detecting Zone Traffic AnomaliesDeactivating Zone Anomaly Detection
Deactivating Zone Anomaly DetectionYou can deactivate zone anomaly detection by using one of the following commands in zone configuration mode:
• no detect—Ends zone anomaly detection. Ends zone anomaly detection. If you have the detect and learn function enabled when you enter the no detect command, the Detector module ends zone anomaly detection but continues with the policy threshold phase of the learning process (see the “Enabling the Detect and Learn Function” section on page 8-11 for more information).
• deactivate—Ends both zone anomaly detection and the threshold tuning phase of the learning process.
Activating Remote Guards to Protect a ZoneWhen the Detector module detects a zone traffic anomaly, it creates dynamic filters that can activate the Guard modules that you associate with the Detector module. If you do not associate any Guard modules with the Detector module, then the dynamic filters instruct the Detector module to log the event only.
You can use the Detector module to activate a remote Guard in one of the following ways:
• Using a remote Guard list—Use Secure Sockets Layer (SSL) to enable remote activation and zone synchronization, or use SSH to enable remote activation only.
• Activating offline—Configure the Detector module to issue a notification when an attack on the zone occurs.
• Activating manually—Create a dynamic filter to activate remote Guards.
You place the Detector module downstream from the Guard. When no attack is in progress, the Detector module sees all inbound traffic destined for the protected zone. During an attack when the Guard diverts traffic from the targeted zone for mitigation, the Detector module sees the legitimate traffic that the Guard forwards to the zone.
This section contains the following topics:
• Activating Remote Guards Using Remote Guard Lists
• Activating Remote Guards Offline
• Activating Remote Guards Manually
Activating Remote Guards Using Remote Guard ListsYou can configure the Detector module with a list of Guards (known as the remote Guard lists) that it activates to protect a zone. The Detector module maintains two types of remote Guard lists as follows:
• Zone remote Guard lists—The Detector module activates the Guards on this zone-specific list to protect the zone and may synchronize the zone configuration with the Guards.
• A Default remote Guard list—The Detector searches the default list only if the zone remote Guard list is empty or does not contain both SSL and Secure Shell communication methods.
Note If you add a Guard to the remote Guard lists, you must establish a communication channel with that remote Guard. See the “Establishing Communication with the Guard” section on page 4-16 for more information.
9-5Cisco Traffic Anomaly Detector Module Configuration Guide
OL-11857-01
Chapter 9 Detecting Zone Traffic AnomaliesActivating Remote Guards to Protect a Zone
Each remote Guard list supports two communication methods:
• SSL—The Detector module communicates with the Guards using SSL. The Detector module can activate the Guards to protect the zone and synchronize the zone configuration with the remote Guards.
The Detector module can synchronize the zone configuration with the Guards on the remote Guard lists before activating the Guards to protect the zone. See the “Synchronizing Zone Configurations with a Guard” section on page 5-8 for more information.
• Secure Shell (SSH)—The Detector module communicates with the Guards using SSH. The Detector module can activate the Guards to protect the zone but cannot synchronize the zone configuration with the Guards.
The Detector module activates a Guard module in the default remote Guard list only if a Guard module with the same communication method was not defined in the zone remote Guard list.
Caution If you change the remote Guard lists, you must regenerate the SSL certificates that the Detector module uses for the communication channel with the remote Guards or the communication fails. See the “Regenerating SSL Certificates” section on page 4-19 for more information.
Verify that the Detector module has at least one Guard defined in one of the remote Guard lists (the default remote Guard list or the zone remote Guard list). If no remote Guard is defined in any one of the remote Guard lists, the Detector module records the event in its log file.
This section contains the following topics:
• Activating a Remote Guard and Synchronizing Zone Configuration
• Configuring the Default Remote Guard List
• Configuring the Zone Remote Guard Lists
Activating a Remote Guard and Synchronizing Zone Configuration
To activate a remote Guard and synchronize zone configuration, perform the following steps:
Step 1 Create and configure a new zone using one of the Guard zone templates.
See the “Creating a New Zone” section on page 5-4.
Step 2 Add the remote Guard IP address to either of the following lists:
• Zone remote Guard list—A list of remote Guards that the Detector module activates to protect the zone.
See the “Configuring the Zone Remote Guard Lists” section on page 9-8 for more information.
• Detector default remote Guard list—The default list of remote Guards. The Detector module activates these remote Guards if the zone remote Guard list is empty.
See the “Configuring the Default Remote Guard List” section on page 9-7 for more information.
Step 3 Configure the communication channel with the remote Guard.
See the “Establishing Communication with the Guard” section on page 4-16 for more information.
Step 4 Configure the zone Guard-protection forms (protect-ip-state) to determine the method that the Detector module uses to activate a remote Guard.
See the “Configuring Guard-Protection Activation Methods” section on page 9-3 for more information.
9-6Cisco Traffic Anomaly Detector Module Configuration Guide
OL-11857-01
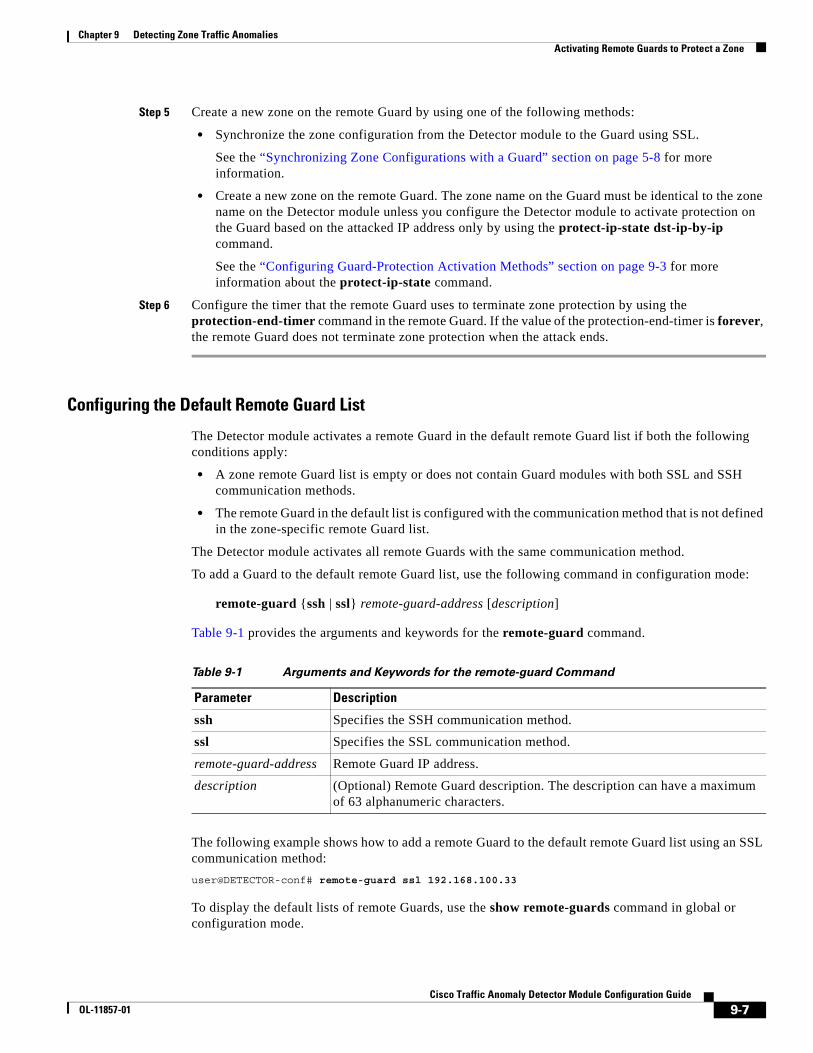
Chapter 9 Detecting Zone Traffic AnomaliesActivating Remote Guards to Protect a Zone
Step 5 Create a new zone on the remote Guard by using one of the following methods:
• Synchronize the zone configuration from the Detector module to the Guard using SSL.
See the “Synchronizing Zone Configurations with a Guard” section on page 5-8 for more information.
• Create a new zone on the remote Guard. The zone name on the Guard must be identical to the zone name on the Detector module unless you configure the Detector module to activate protection on the Guard based on the attacked IP address only by using the protect-ip-state dst-ip-by-ip command.
See the “Configuring Guard-Protection Activation Methods” section on page 9-3 for more information about the protect-ip-state command.
Step 6 Configure the timer that the remote Guard uses to terminate zone protection by using the protection-end-timer command in the remote Guard. If the value of the protection-end-timer is forever, the remote Guard does not terminate zone protection when the attack ends.
Configuring the Default Remote Guard List
The Detector module activates a remote Guard in the default remote Guard list if both the following conditions apply:
• A zone remote Guard list is empty or does not contain Guard modules with both SSL and SSH communication methods.
• The remote Guard in the default list is configured with the communication method that is not defined in the zone-specific remote Guard list.
The Detector module activates all remote Guards with the same communication method.
To add a Guard to the default remote Guard list, use the following command in configuration mode:
remote-guard {ssh | ssl} remote-guard-address [description]
Table 9-1 provides the arguments and keywords for the remote-guard command.
The following example shows how to add a remote Guard to the default remote Guard list using an SSL communication method:
user@DETECTOR-conf# remote-guard ssl 192.168.100.33
To display the default lists of remote Guards, use the show remote-guards command in global or configuration mode.
Table 9-1 Arguments and Keywords for the remote-guard Command
Parameter Description
ssh Specifies the SSH communication method.
ssl Specifies the SSL communication method.
remote-guard-address Remote Guard IP address.
description (Optional) Remote Guard description. The description can have a maximum of 63 alphanumeric characters.
9-7Cisco Traffic Anomaly Detector Module Configuration Guide
OL-11857-01
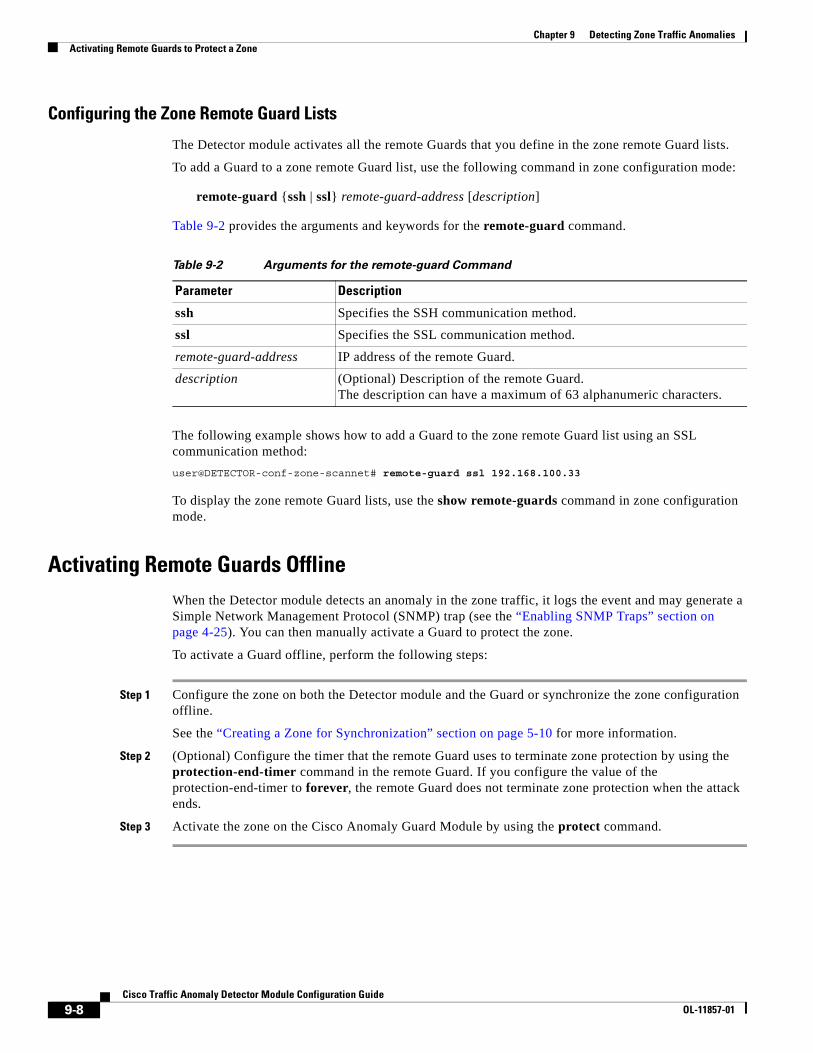
Chapter 9 Detecting Zone Traffic AnomaliesActivating Remote Guards to Protect a Zone
Configuring the Zone Remote Guard Lists
The Detector module activates all the remote Guards that you define in the zone remote Guard lists.
To add a Guard to a zone remote Guard list, use the following command in zone configuration mode:
remote-guard {ssh | ssl} remote-guard-address [description]
Table 9-2 provides the arguments and keywords for the remote-guard command.
The following example shows how to add a Guard to the zone remote Guard list using an SSL communication method:
user@DETECTOR-conf-zone-scannet# remote-guard ssl 192.168.100.33
To display the zone remote Guard lists, use the show remote-guards command in zone configuration mode.
Activating Remote Guards OfflineWhen the Detector module detects an anomaly in the zone traffic, it logs the event and may generate a Simple Network Management Protocol (SNMP) trap (see the “Enabling SNMP Traps” section on page 4-25). You can then manually activate a Guard to protect the zone.
To activate a Guard offline, perform the following steps:
Step 1 Configure the zone on both the Detector module and the Guard or synchronize the zone configuration offline.
See the “Creating a Zone for Synchronization” section on page 5-10 for more information.
Step 2 (Optional) Configure the timer that the remote Guard uses to terminate zone protection by using the protection-end-timer command in the remote Guard. If you configure the value of the protection-end-timer to forever, the remote Guard does not terminate zone protection when the attack ends.
Step 3 Activate the zone on the Cisco Anomaly Guard Module by using the protect command.
Table 9-2 Arguments for the remote-guard Command
Parameter Description
ssh Specifies the SSH communication method.
ssl Specifies the SSL communication method.
remote-guard-address IP address of the remote Guard.
description (Optional) Description of the remote Guard. The description can have a maximum of 63 alphanumeric characters.
9-8Cisco Traffic Anomaly Detector Module Configuration Guide
OL-11857-01
Chapter 9 Detecting Zone Traffic AnomaliesActivating Remote Guards to Protect a Zone
Activating Remote Guards ManuallyFrom the Detector module, you can activate a remote Guard manually to protect the zone even before the Detector module detects an anomaly in the zone traffic.
To activate a remote Guard manually, perform the following steps on the Detector module:
Step 1 Add the remote Guard to the zone remote Guard list or to the default remote Guard list.
See the “Activating Remote Guards Using Remote Guard Lists” section on page 9-5 for more information.
Step 2 Create a dynamic filter by entering the dynamic-filter remote-activate command.
See the “Adding Dynamic Filters” section on page 6-14 for more information.
9-9Cisco Traffic Anomaly Detector Module Configuration Guide
OL-11857-01

Chapter 9 Detecting Zone Traffic AnomaliesActivating Remote Guards to Protect a Zone
9-10Cisco Traffic Anomaly Detector Module Configuration Guide
OL-11857-01
Cisco TraOL-11857-01
C H A P T E R 10
Using Interactive Detect ModeYou can activate the Cisco Traffic Anomaly Detector Module (Detector module) to perform zone anomaly detection in either one of the following modes of operation:
• Automatic detect mode—Automatically activates the dynamic filters that it creates during an attack.
• Interactive detect mode—Creates dynamic filters during an attack but does not activate them. Instead, the Detector module groups the dynamic filters as recommended actions for you to review and decide whether to accept, ignore, or direct these recommendations to automatic activation.
This chapter describes the interactive detect mode and how to switch between the two modes of operation.
This chapter refers to the Cisco Guard (Guard), the companion product of the Detector module. The Guard is a Distributed Denial of Service (DDoS) attack detection and mitigation device that cleans the zone traffic as the traffic flows through it, dropping the attack traffic and injecting the legitimate traffic back into the network. When the Detector module determines that the zone is under attack, it can activate the Guard attack mitigation services. The Detector module can also synchronize zone configurations with the Guard. For more information about the Guard, see the Cisco Anomaly Guard Module Configuration Guide or the Cisco Guard Configuration Guide.
This chapter includes the following sections:
• Understanding Interactive Detect Mode
• Activating Interactive Detect Mode and Anomaly Detection
• Configuring the Zone for Interactive Detect Mode
• Displaying Recommendations
• Managing Recommendations
• Deactivating Interactive Detect Mode
Understanding Interactive Detect ModeWhen a Distributed Denial of Service (DDoS) attack on a zone begins, the zone policies create dynamic filters. If you configure the zone to operate in interactive detect mode, the Detector module does not activate the dynamic filters automatically, but waits for you to decide on what action to take. The filters that await your decision are called pending dynamic filters. The Detector module groups the pending dynamic filters according to the policy that produced them and presents the groups to you as Detector module recommendations, which provide the following information:
• A summary of the pending filters, including information about the name of the policy that caused the creation of the pending dynamic filters.
10-1ffic Anomaly Detector Module Configuration Guide
Chapter 10 Using Interactive Detect ModeActivating Interactive Detect Mode and Anomaly Detection
• The data on the traffic anomaly that resulted in the policy activation.
• The number of pending dynamic filters.
• The recommended action.
When you enable interactive detect mode in a zone configuration, you take control over which actions the Detector module executes during an attack on the zone. You decide which pending dynamic filters to accept, ignore, or direct to automatic activation. You can configure the zone to operate in interactive detect mode when you define the zone, before you activate zone protection, or after you activate zone detection.
The Detector module continues to produce pending dynamic filters as long as it is in interactive detect mode and the zone is under attack. You can enable the interactive detect mode at any time during zone anomaly detection.
The Detector module can manage up to 1000 pending dynamic filters and when the number of pending dynamic filters reaches this limit, the Detector module performs the following actions:
• Displays an error message instructing you to deactivate the zone and reactivate it in automatic detect mode.
• Records the recommendations in the zone log file and report and then deletes them.
You can switch from the interactive detect mode to the automatic protect mode at any time during zone protection, even when the zone is under attack. When you switch to automatic protect mode during an attack, the Detector module performs the following actions:
• Retains the dynamic filters that were added as a result of you accepting a recommendation.
• Accepts the pending dynamic filters associated with any recommendations that you did not act upon prior to switching to automatic protect mode.
• Accepts any new dynamic filters automatically as the policies produce them.
Activating Interactive Detect Mode and Anomaly DetectionThis section provides a quick overview of the steps that you need to take to activate the Detector module in interactive detect mode. Each step includes the CLI command required to complete the task.
To activate interactive detect mode, perform the following steps:
Step 1 Configure a new or existing zone to operate in interactive detect mode by using the appropriate command as follows:
• New zone—Enter the zone new-zone-name interactive command in zone configuration mode.
user@DETECTOR-conf# zone scannet interactive
• Existing zone—Enter the interactive command in zone configuration mode.
user@DETECTOR-conf-zone-scannet# interactive
See the “Configuring the Zone for Interactive Detect Mode” section on page 10-3 for more information.
Step 2 (Optional) Configure the Detector module to display a notification when new recommendations are available by using the event monitor command.
user@DETECTOR# event monitor
You can also use an external syslog server to receive notification of new pending dynamic filters or manually display the status of the zone by using the show command in zone configuration mode.
10-2Cisco Traffic Anomaly Detector Module Configuration Guide
OL-11857-01
Chapter 10 Using Interactive Detect ModeConfiguring the Zone for Interactive Detect Mode
Step 3 Activate the Detector module to learn the zone traffic patterns by using the learning command. See Chapter 8, “Learning the Zone Traffic Characteristics,” for more information about the learning process.
Step 4 Activate zone anomaly detection by using the detect command.
user@DETECTOR-conf-zone-scannet# detect
See Chapter 9, “Detecting Zone Traffic Anomalies,” for more information.
Step 5 Display new recommendations and their pending dynamic filters by using the show recommendations command.
user@DETECTOR-conf-zone-scannet# show recommendationsuser@DETECTOR-conf-zone-scannet# show recommendations 135 pending-filters
See the “Displaying Recommendations” section on page 10-4 for more information.
Step 6 Decide how to manage the new recommendations by using the recommendation command. You can decide to accept or ignore recommendations, or to instruct the Detector module to automatically activate the recommendations.
user@DETECTOR-conf-zone-scannet# recommendation 135 accept
See the “Managing Recommendations” section on page 10-6 for more information.
Step 7 You can deactivate interactive detect mode at any time by using the no interactive command. The Detector module activates new dynamic filters automatically.
user@DETECTOR-conf-zone-scannet# no interactive
See the “Deactivating Interactive Detect Mode” section on page 10-8 for more information.
Configuring the Zone for Interactive Detect ModeYou can activate interactive detect mode for an existing zone by using the interactive command in zone configuration mode.
The following example shows how to activate interactive detect mode for an existing zone:
user@DETECTOR-conf-zone-scannet# interactive
To create a new zone configured for interactive detect mode, use the following command in configuration mode:
zone new-zone-name interactive
The new-zone-name argument specifies the name of the new zone. The zone name is an alphanumeric string that must start with a letter, cannot include any spaces, and can have a maximum of 63 characters.
The following example shows how to create a new zone configured for interactive detect mode:
user@DETECTOR-conf# zone scannew interactive
The new zone is created with a default zone template that is configured for interactive detect mode. See the “Creating a New Zone” section on page 5-4 for more information.
10-3Cisco Traffic Anomaly Detector Module Configuration Guide
OL-11857-01
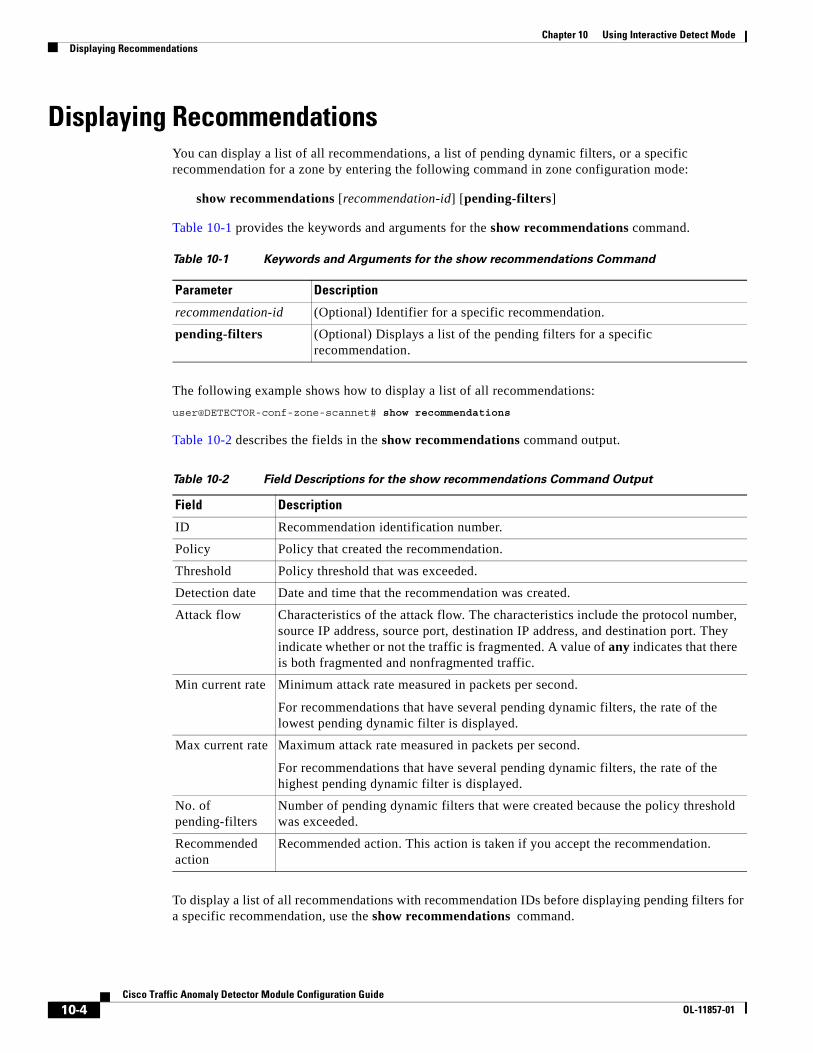
Chapter 10 Using Interactive Detect ModeDisplaying Recommendations
Displaying RecommendationsYou can display a list of all recommendations, a list of pending dynamic filters, or a specific recommendation for a zone by entering the following command in zone configuration mode:
show recommendations [recommendation-id] [pending-filters]
Table 10-1 provides the keywords and arguments for the show recommendations command.
The following example shows how to display a list of all recommendations:
user@DETECTOR-conf-zone-scannet# show recommendations
Table 10-2 describes the fields in the show recommendations command output.
To display a list of all recommendations with recommendation IDs before displaying pending filters for a specific recommendation, use the show recommendations command.
Table 10-1 Keywords and Arguments for the show recommendations Command
Parameter Description
recommendation-id (Optional) Identifier for a specific recommendation.
pending-filters (Optional) Displays a list of the pending filters for a specific recommendation.
Table 10-2 Field Descriptions for the show recommendations Command Output
Field Description
ID Recommendation identification number.
Policy Policy that created the recommendation.
Threshold Policy threshold that was exceeded.
Detection date Date and time that the recommendation was created.
Attack flow Characteristics of the attack flow. The characteristics include the protocol number, source IP address, source port, destination IP address, and destination port. They indicate whether or not the traffic is fragmented. A value of any indicates that there is both fragmented and nonfragmented traffic.
Min current rate Minimum attack rate measured in packets per second.
For recommendations that have several pending dynamic filters, the rate of the lowest pending dynamic filter is displayed.
Max current rate Maximum attack rate measured in packets per second.
For recommendations that have several pending dynamic filters, the rate of the highest pending dynamic filter is displayed.
No. of pending-filters
Number of pending dynamic filters that were created because the policy threshold was exceeded.
Recommended action
Recommended action. This action is taken if you accept the recommendation.
10-4Cisco Traffic Anomaly Detector Module Configuration Guide
OL-11857-01
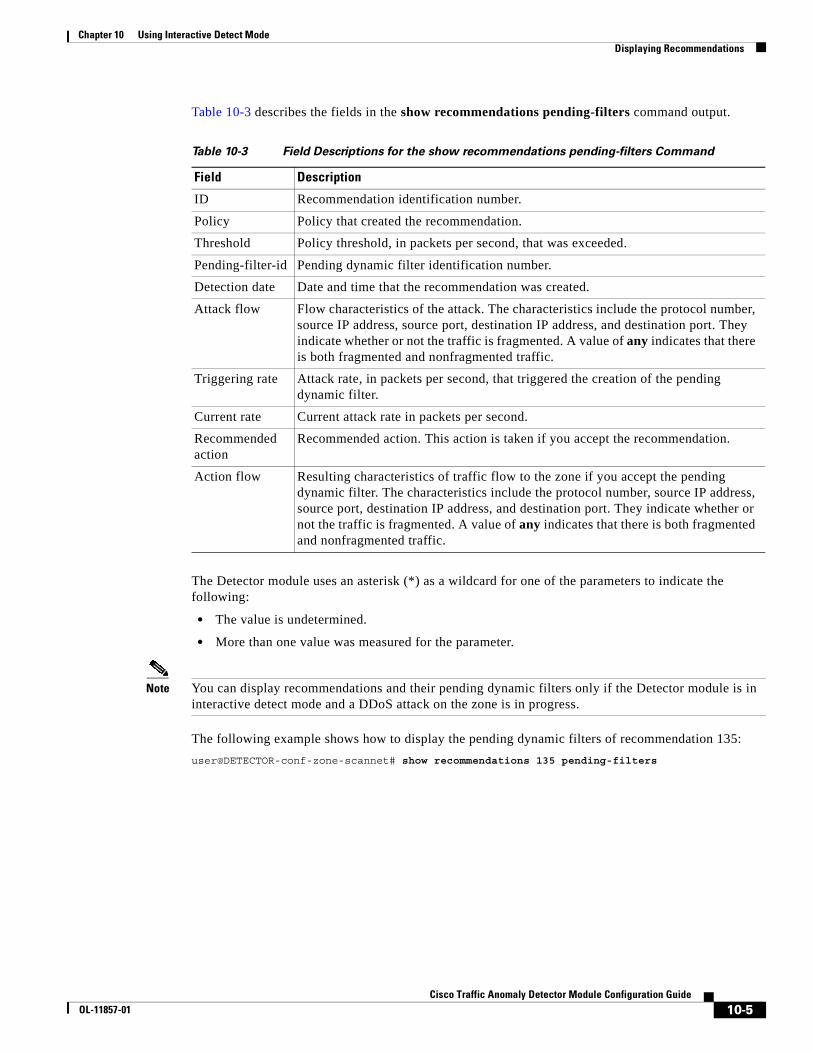
Chapter 10 Using Interactive Detect ModeDisplaying Recommendations
Table 10-3 describes the fields in the show recommendations pending-filters command output.
The Detector module uses an asterisk (*) as a wildcard for one of the parameters to indicate the following:
• The value is undetermined.
• More than one value was measured for the parameter.
Note You can display recommendations and their pending dynamic filters only if the Detector module is in interactive detect mode and a DDoS attack on the zone is in progress.
The following example shows how to display the pending dynamic filters of recommendation 135:
user@DETECTOR-conf-zone-scannet# show recommendations 135 pending-filters
Table 10-3 Field Descriptions for the show recommendations pending-filters Command
Field Description
ID Recommendation identification number.
Policy Policy that created the recommendation.
Threshold Policy threshold, in packets per second, that was exceeded.
Pending-filter-id Pending dynamic filter identification number.
Detection date Date and time that the recommendation was created.
Attack flow Flow characteristics of the attack. The characteristics include the protocol number, source IP address, source port, destination IP address, and destination port. They indicate whether or not the traffic is fragmented. A value of any indicates that there is both fragmented and nonfragmented traffic.
Triggering rate Attack rate, in packets per second, that triggered the creation of the pending dynamic filter.
Current rate Current attack rate in packets per second.
Recommended action
Recommended action. This action is taken if you accept the recommendation.
Action flow Resulting characteristics of traffic flow to the zone if you accept the pending dynamic filter. The characteristics include the protocol number, source IP address, source port, destination IP address, and destination port. They indicate whether or not the traffic is fragmented. A value of any indicates that there is both fragmented and nonfragmented traffic.
10-5Cisco Traffic Anomaly Detector Module Configuration Guide
OL-11857-01
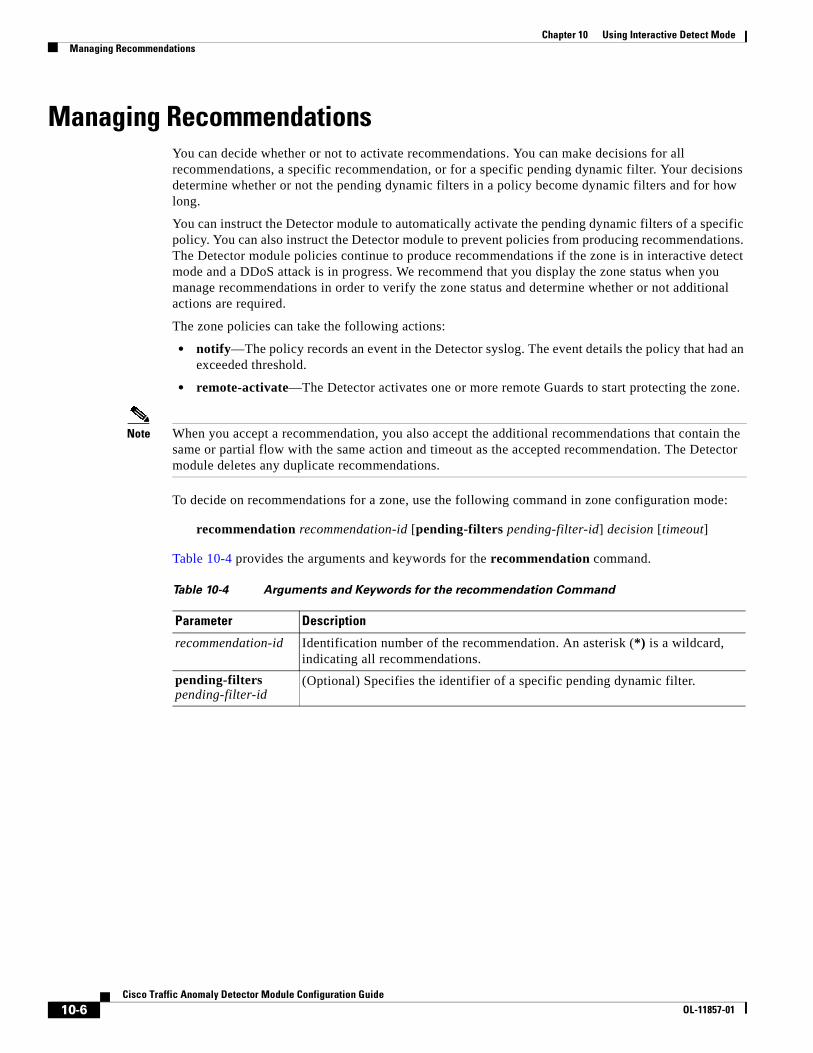
Chapter 10 Using Interactive Detect ModeManaging Recommendations
Managing RecommendationsYou can decide whether or not to activate recommendations. You can make decisions for all recommendations, a specific recommendation, or for a specific pending dynamic filter. Your decisions determine whether or not the pending dynamic filters in a policy become dynamic filters and for how long.
You can instruct the Detector module to automatically activate the pending dynamic filters of a specific policy. You can also instruct the Detector module to prevent policies from producing recommendations. The Detector module policies continue to produce recommendations if the zone is in interactive detect mode and a DDoS attack is in progress. We recommend that you display the zone status when you manage recommendations in order to verify the zone status and determine whether or not additional actions are required.
The zone policies can take the following actions:
• notify—The policy records an event in the Detector syslog. The event details the policy that had an exceeded threshold.
• remote-activate—The Detector activates one or more remote Guards to start protecting the zone.
Note When you accept a recommendation, you also accept the additional recommendations that contain the same or partial flow with the same action and timeout as the accepted recommendation. The Detector module deletes any duplicate recommendations.
To decide on recommendations for a zone, use the following command in zone configuration mode:
recommendation recommendation-id [pending-filters pending-filter-id] decision [timeout]
Table 10-4 provides the arguments and keywords for the recommendation command.
Table 10-4 Arguments and Keywords for the recommendation Command
Parameter Description
recommendation-id Identification number of the recommendation. An asterisk (*) is a wildcard, indicating all recommendations.
pending-filters pending-filter-id
(Optional) Specifies the identifier of a specific pending dynamic filter.
10-6Cisco Traffic Anomaly Detector Module Configuration Guide
OL-11857-01
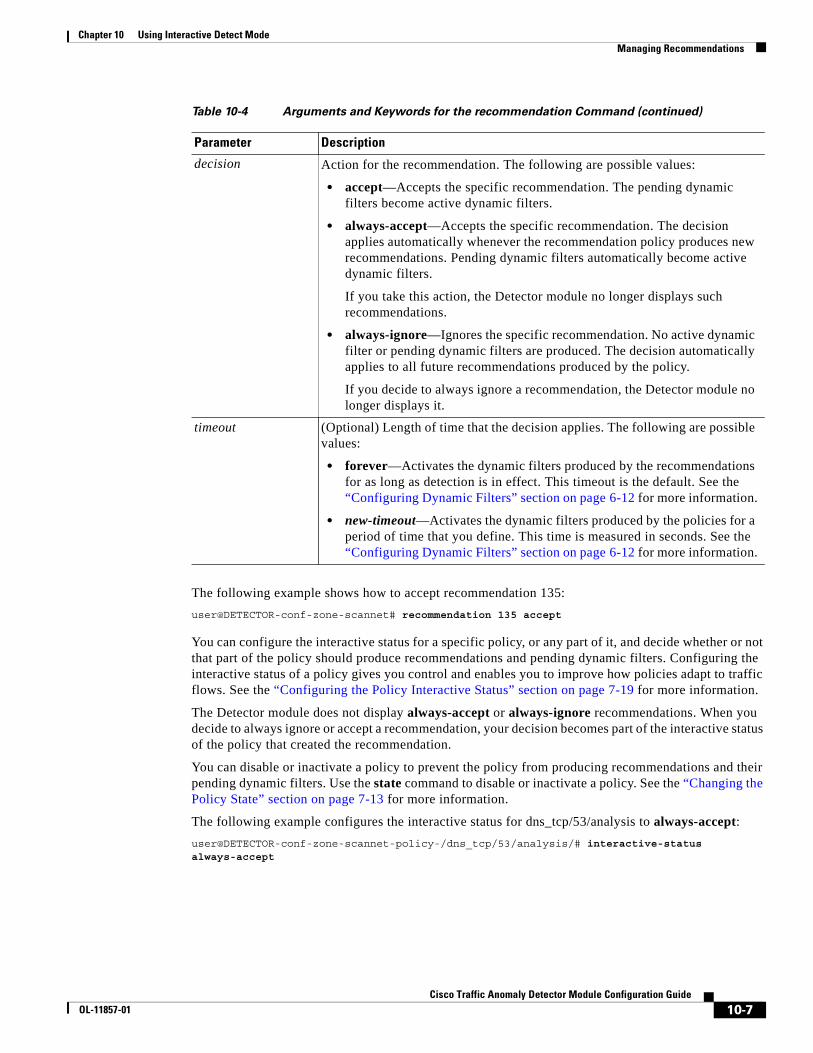
Chapter 10 Using Interactive Detect ModeManaging Recommendations
The following example shows how to accept recommendation 135:
user@DETECTOR-conf-zone-scannet# recommendation 135 accept
You can configure the interactive status for a specific policy, or any part of it, and decide whether or not that part of the policy should produce recommendations and pending dynamic filters. Configuring the interactive status of a policy gives you control and enables you to improve how policies adapt to traffic flows. See the “Configuring the Policy Interactive Status” section on page 7-19 for more information.
The Detector module does not display always-accept or always-ignore recommendations. When you decide to always ignore or accept a recommendation, your decision becomes part of the interactive status of the policy that created the recommendation.
You can disable or inactivate a policy to prevent the policy from producing recommendations and their pending dynamic filters. Use the state command to disable or inactivate a policy. See the “Changing the Policy State” section on page 7-13 for more information.
The following example configures the interactive status for dns_tcp/53/analysis to always-accept:
user@DETECTOR-conf-zone-scannet-policy-/dns_tcp/53/analysis/# interactive-status always-accept
decision Action for the recommendation. The following are possible values:
• accept—Accepts the specific recommendation. The pending dynamic filters become active dynamic filters.
• always-accept—Accepts the specific recommendation. The decision applies automatically whenever the recommendation policy produces new recommendations. Pending dynamic filters automatically become active dynamic filters.
If you take this action, the Detector module no longer displays such recommendations.
• always-ignore—Ignores the specific recommendation. No active dynamic filter or pending dynamic filters are produced. The decision automatically applies to all future recommendations produced by the policy.
If you decide to always ignore a recommendation, the Detector module no longer displays it.
timeout (Optional) Length of time that the decision applies. The following are possible values:
• forever—Activates the dynamic filters produced by the recommendations for as long as detection is in effect. This timeout is the default. See the “Configuring Dynamic Filters” section on page 6-12 for more information.
• new-timeout—Activates the dynamic filters produced by the policies for a period of time that you define. This time is measured in seconds. See the “Configuring Dynamic Filters” section on page 6-12 for more information.
Table 10-4 Arguments and Keywords for the recommendation Command (continued)
Parameter Description
10-7Cisco Traffic Anomaly Detector Module Configuration Guide
OL-11857-01
Chapter 10 Using Interactive Detect ModeDeactivating Interactive Detect Mode
Deactivating Interactive Detect ModeTo deactivate the interactive detect mode, use the no interactive command in zone configuration mode. When you deactivate the interactive detect mode, the Detector module activates all new dynamic filters automatically and configures the interactive status of the policies to always-accept (see the “Displaying Policies” section on page 7-23 for information about displaying the zone policies).
The following example shows how to deactivate interactive detect mode for the zone scannet:
user@DETECTOR-conf-zone-scannet# no interactive
10-8Cisco Traffic Anomaly Detector Module Configuration Guide
OL-11857-01
Cisco TraOL-11857-01
C H A P T E R 11
Using Attack ReportsThis chapter describes the attack reports that the Cisco Traffic Anomaly Detector Module (Detector module) produces and contains the following sections:
• Understanding the Report Layout
• Understanding the Report Parameters
• Displaying Attack Reports
• Exporting Attack Reports
• Deleting Attack Reports
Understanding the Report LayoutThe Detector module provides an attack report for each zone to help you form a comprehensive view of the attack. An attack begins when the Detector module produces the first dynamic filter and ends when no dynamic filter is in use and no new dynamic filters are added. Reports include details of the attacks that are organized into sections that describe different characteristics of the traffic flow during an attack. You can display reports of previous attacks and ongoing attacks, and you can export reports to a network server using File Transfer Protocol (FTP), Secure FTP (SFTP), or Secure Copy Protocol (SCP).
This section contains the following topics:
• General Details
• Attack Statistics
• Detected Anomalies
General DetailsThe general details section of the attack report includes general information about an attack.
11-1ffic Anomaly Detector Module Configuration Guide
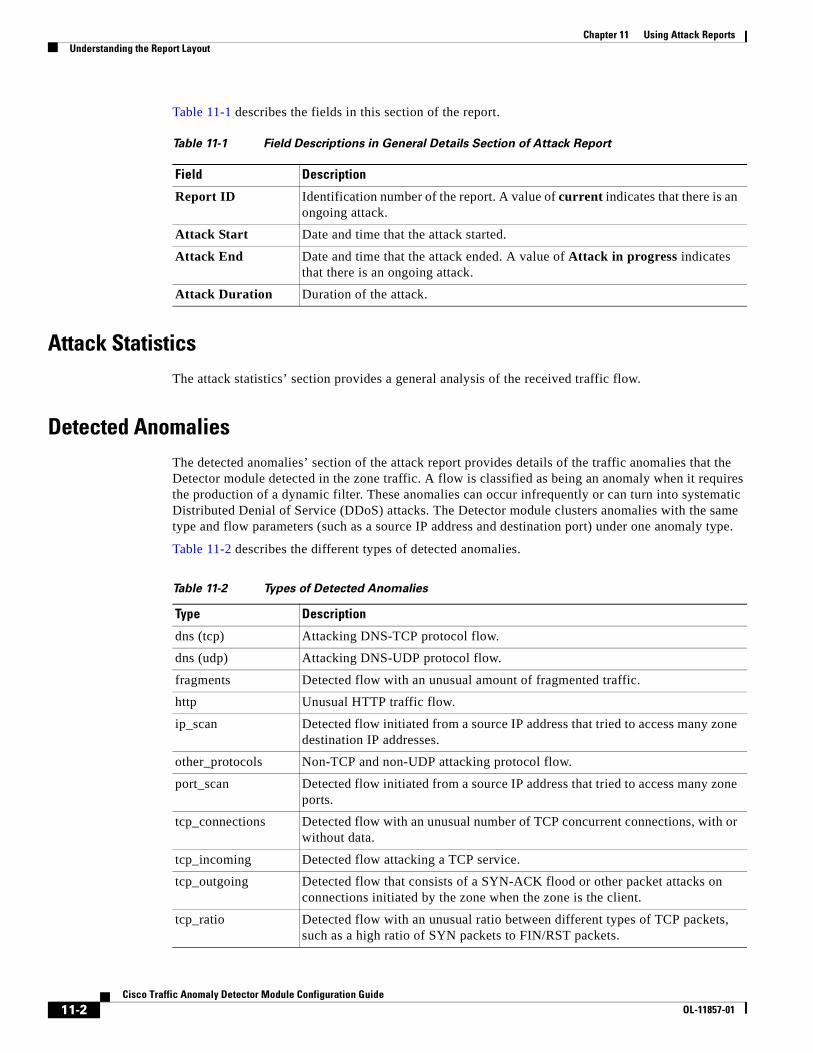
Chapter 11 Using Attack ReportsUnderstanding the Report Layout
Table 11-1 describes the fields in this section of the report.
Attack StatisticsThe attack statistics’ section provides a general analysis of the received traffic flow.
Detected AnomaliesThe detected anomalies’ section of the attack report provides details of the traffic anomalies that the Detector module detected in the zone traffic. A flow is classified as being an anomaly when it requires the production of a dynamic filter. These anomalies can occur infrequently or can turn into systematic Distributed Denial of Service (DDoS) attacks. The Detector module clusters anomalies with the same type and flow parameters (such as a source IP address and destination port) under one anomaly type.
Table 11-2 describes the different types of detected anomalies.
Table 11-1 Field Descriptions in General Details Section of Attack Report
Field Description
Report ID Identification number of the report. A value of current indicates that there is an ongoing attack.
Attack Start Date and time that the attack started.
Attack End Date and time that the attack ended. A value of Attack in progress indicates that there is an ongoing attack.
Attack Duration Duration of the attack.
Table 11-2 Types of Detected Anomalies
Type Description
dns (tcp) Attacking DNS-TCP protocol flow.
dns (udp) Attacking DNS-UDP protocol flow.
fragments Detected flow with an unusual amount of fragmented traffic.
http Unusual HTTP traffic flow.
ip_scan Detected flow initiated from a source IP address that tried to access many zone destination IP addresses.
other_protocols Non-TCP and non-UDP attacking protocol flow.
port_scan Detected flow initiated from a source IP address that tried to access many zone ports.
tcp_connections Detected flow with an unusual number of TCP concurrent connections, with or without data.
tcp_incoming Detected flow attacking a TCP service.
tcp_outgoing Detected flow that consists of a SYN-ACK flood or other packet attacks on connections initiated by the zone when the zone is the client.
tcp_ratio Detected flow with an unusual ratio between different types of TCP packets, such as a high ratio of SYN packets to FIN/RST packets.
11-2Cisco Traffic Anomaly Detector Module Configuration Guide
OL-11857-01
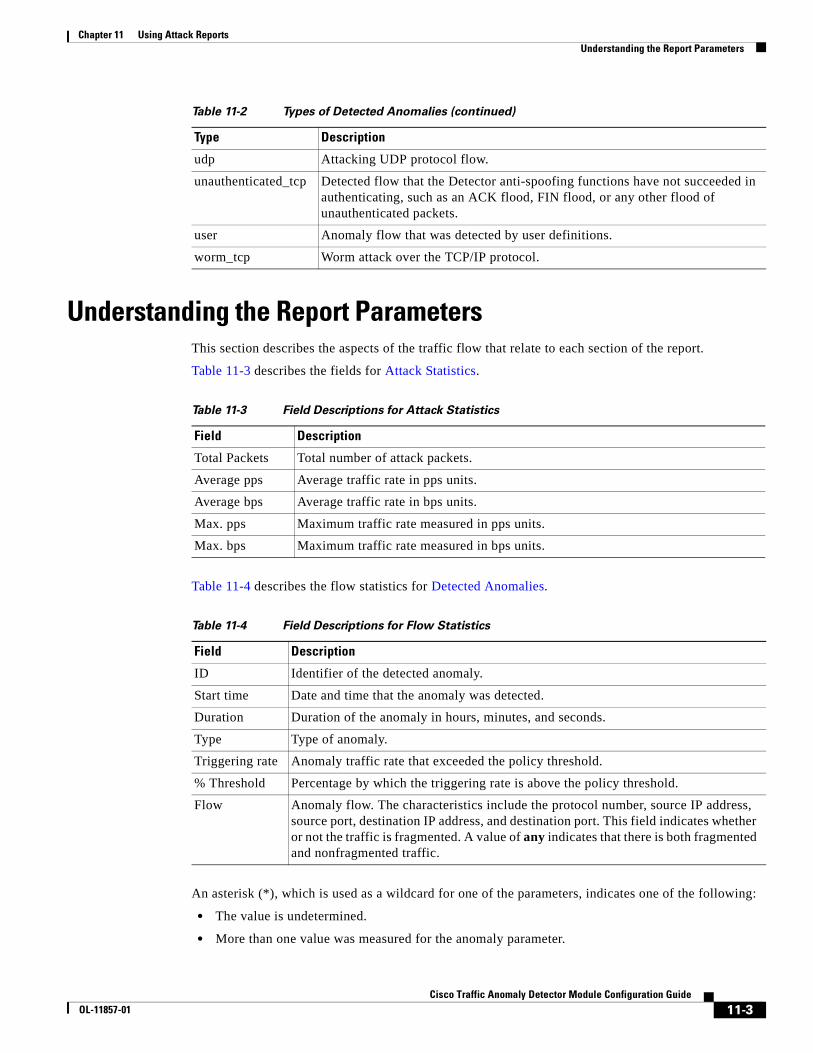
Chapter 11 Using Attack ReportsUnderstanding the Report Parameters
Understanding the Report ParametersThis section describes the aspects of the traffic flow that relate to each section of the report.
Table 11-3 describes the fields for Attack Statistics.
Table 11-4 describes the flow statistics for Detected Anomalies.
An asterisk (*), which is used as a wildcard for one of the parameters, indicates one of the following:
• The value is undetermined.
• More than one value was measured for the anomaly parameter.
udp Attacking UDP protocol flow.
unauthenticated_tcp Detected flow that the Detector anti-spoofing functions have not succeeded in authenticating, such as an ACK flood, FIN flood, or any other flood of unauthenticated packets.
user Anomaly flow that was detected by user definitions.
worm_tcp Worm attack over the TCP/IP protocol.
Table 11-2 Types of Detected Anomalies (continued)
Type Description
Table 11-3 Field Descriptions for Attack Statistics
Field Description
Total Packets Total number of attack packets.
Average pps Average traffic rate in pps units.
Average bps Average traffic rate in bps units.
Max. pps Maximum traffic rate measured in pps units.
Max. bps Maximum traffic rate measured in bps units.
Table 11-4 Field Descriptions for Flow Statistics
Field Description
ID Identifier of the detected anomaly.
Start time Date and time that the anomaly was detected.
Duration Duration of the anomaly in hours, minutes, and seconds.
Type Type of anomaly.
Triggering rate Anomaly traffic rate that exceeded the policy threshold.
% Threshold Percentage by which the triggering rate is above the policy threshold.
Flow Anomaly flow. The characteristics include the protocol number, source IP address, source port, destination IP address, and destination port. This field indicates whether or not the traffic is fragmented. A value of any indicates that there is both fragmented and nonfragmented traffic.
11-3Cisco Traffic Anomaly Detector Module Configuration Guide
OL-11857-01
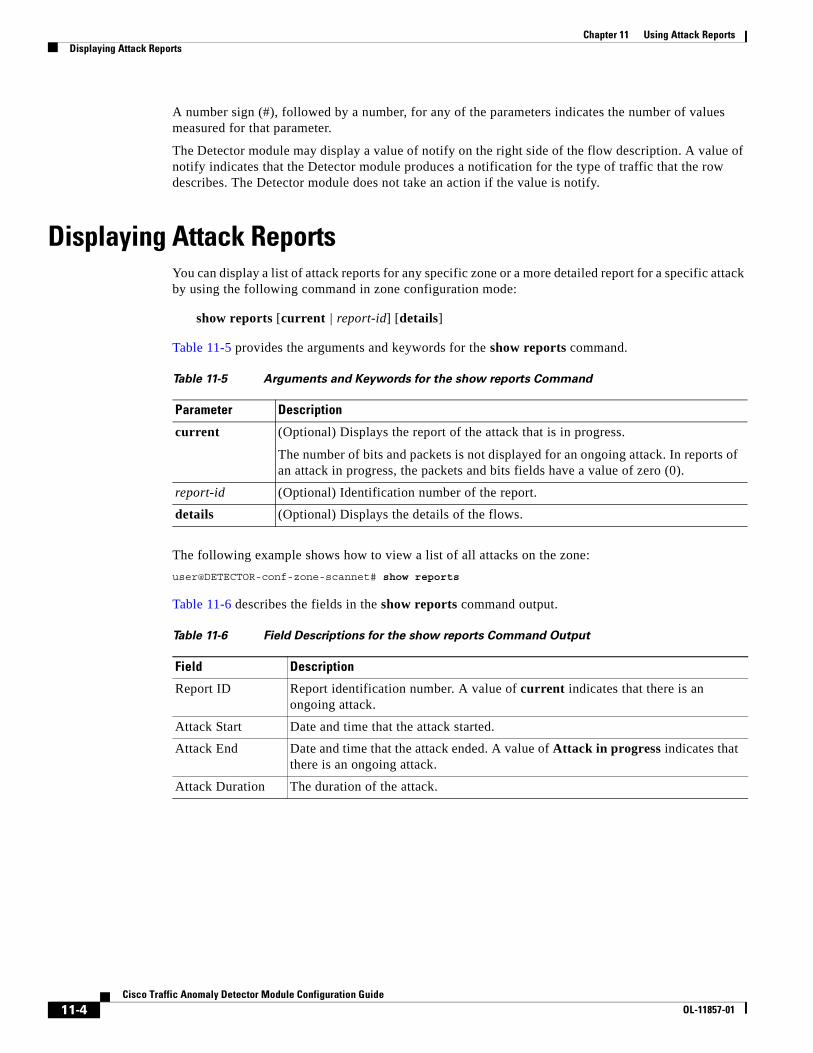
Chapter 11 Using Attack ReportsDisplaying Attack Reports
A number sign (#), followed by a number, for any of the parameters indicates the number of values measured for that parameter.
The Detector module may display a value of notify on the right side of the flow description. A value of notify indicates that the Detector module produces a notification for the type of traffic that the row describes. The Detector module does not take an action if the value is notify.
Displaying Attack ReportsYou can display a list of attack reports for any specific zone or a more detailed report for a specific attack by using the following command in zone configuration mode:
show reports [current | report-id] [details]
Table 11-5 provides the arguments and keywords for the show reports command.
The following example shows how to view a list of all attacks on the zone:
user@DETECTOR-conf-zone-scannet# show reports
Table 11-6 describes the fields in the show reports command output.
Table 11-5 Arguments and Keywords for the show reports Command
Parameter Description
current (Optional) Displays the report of the attack that is in progress.
The number of bits and packets is not displayed for an ongoing attack. In reports of an attack in progress, the packets and bits fields have a value of zero (0).
report-id (Optional) Identification number of the report.
details (Optional) Displays the details of the flows.
Table 11-6 Field Descriptions for the show reports Command Output
Field Description
Report ID Report identification number. A value of current indicates that there is an ongoing attack.
Attack Start Date and time that the attack started.
Attack End Date and time that the attack ended. A value of Attack in progress indicates that there is an ongoing attack.
Attack Duration The duration of the attack.
11-4Cisco Traffic Anomaly Detector Module Configuration Guide
OL-11857-01
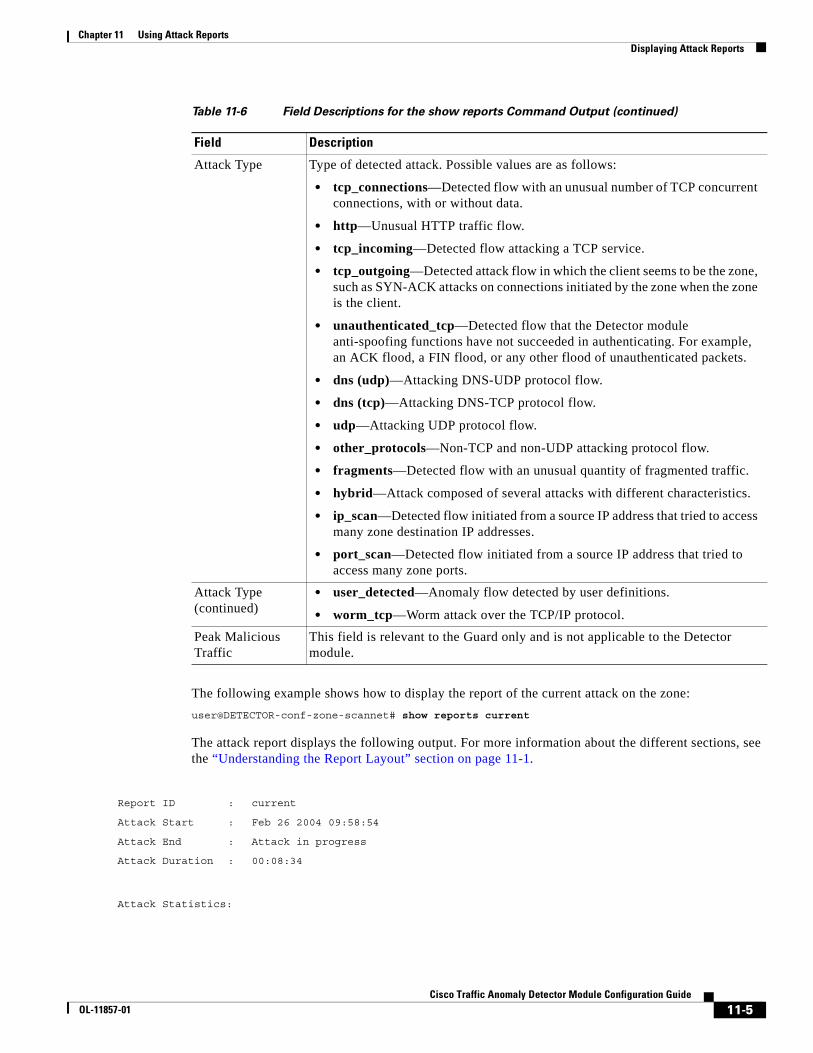
Chapter 11 Using Attack ReportsDisplaying Attack Reports
The following example shows how to display the report of the current attack on the zone:
user@DETECTOR-conf-zone-scannet# show reports current
The attack report displays the following output. For more information about the different sections, see the “Understanding the Report Layout” section on page 11-1.
Attack Type Type of detected attack. Possible values are as follows:
• tcp_connections—Detected flow with an unusual number of TCP concurrent connections, with or without data.
• http—Unusual HTTP traffic flow.
• tcp_incoming—Detected flow attacking a TCP service.
• tcp_outgoing—Detected attack flow in which the client seems to be the zone, such as SYN-ACK attacks on connections initiated by the zone when the zone is the client.
• unauthenticated_tcp—Detected flow that the Detector module anti-spoofing functions have not succeeded in authenticating. For example, an ACK flood, a FIN flood, or any other flood of unauthenticated packets.
• dns (udp)—Attacking DNS-UDP protocol flow.
• dns (tcp)—Attacking DNS-TCP protocol flow.
• udp—Attacking UDP protocol flow.
• other_protocols—Non-TCP and non-UDP attacking protocol flow.
• fragments—Detected flow with an unusual quantity of fragmented traffic.
• hybrid—Attack composed of several attacks with different characteristics.
• ip_scan—Detected flow initiated from a source IP address that tried to access many zone destination IP addresses.
• port_scan—Detected flow initiated from a source IP address that tried to access many zone ports.
Attack Type (continued)
• user_detected—Anomaly flow detected by user definitions.
• worm_tcp—Worm attack over the TCP/IP protocol.
Peak Malicious Traffic
This field is relevant to the Guard only and is not applicable to the Detector module.
Table 11-6 Field Descriptions for the show reports Command Output (continued)
Field Description
Report ID : current
Attack Start : Feb 26 2004 09:58:54
Attack End : Attack in progress
Attack Duration : 00:08:34
Attack Statistics:
11-5Cisco Traffic Anomaly Detector Module Configuration Guide
OL-11857-01
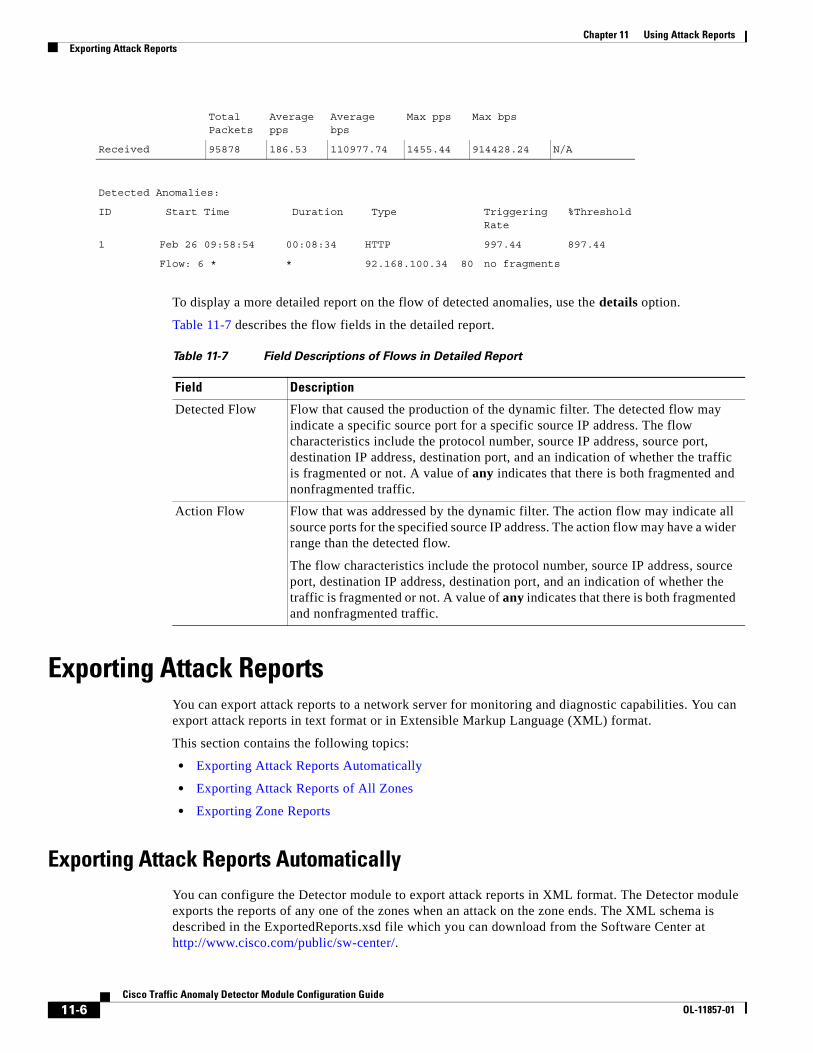
Chapter 11 Using Attack ReportsExporting Attack Reports
To display a more detailed report on the flow of detected anomalies, use the details option.
Table 11-7 describes the flow fields in the detailed report.
Exporting Attack ReportsYou can export attack reports to a network server for monitoring and diagnostic capabilities. You can export attack reports in text format or in Extensible Markup Language (XML) format.
This section contains the following topics:
• Exporting Attack Reports Automatically
• Exporting Attack Reports of All Zones
• Exporting Zone Reports
Exporting Attack Reports AutomaticallyYou can configure the Detector module to export attack reports in XML format. The Detector module exports the reports of any one of the zones when an attack on the zone ends. The XML schema is described in the ExportedReports.xsd file which you can download from the Software Center at http://www.cisco.com/public/sw-center/.
Total Packets
Average pps
Average bps
Max pps Max bps
Received 95878 186.53 110977.74 1455.44 914428.24 N/A
Detected Anomalies:
ID Start Time Duration Type Triggering Rate
%Threshold
1 Feb 26 09:58:54 00:08:34 HTTP 997.44 897.44
Flow: 6 * * 92.168.100.34 80 no fragments
Table 11-7 Field Descriptions of Flows in Detailed Report
Field Description
Detected Flow Flow that caused the production of the dynamic filter. The detected flow may indicate a specific source port for a specific source IP address. The flow characteristics include the protocol number, source IP address, source port, destination IP address, destination port, and an indication of whether the traffic is fragmented or not. A value of any indicates that there is both fragmented and nonfragmented traffic.
Action Flow Flow that was addressed by the dynamic filter. The action flow may indicate all source ports for the specified source IP address. The action flow may have a wider range than the detected flow.
The flow characteristics include the protocol number, source IP address, source port, destination IP address, destination port, and an indication of whether the traffic is fragmented or not. A value of any indicates that there is both fragmented and nonfragmented traffic.
11-6Cisco Traffic Anomaly Detector Module Configuration Guide
OL-11857-01
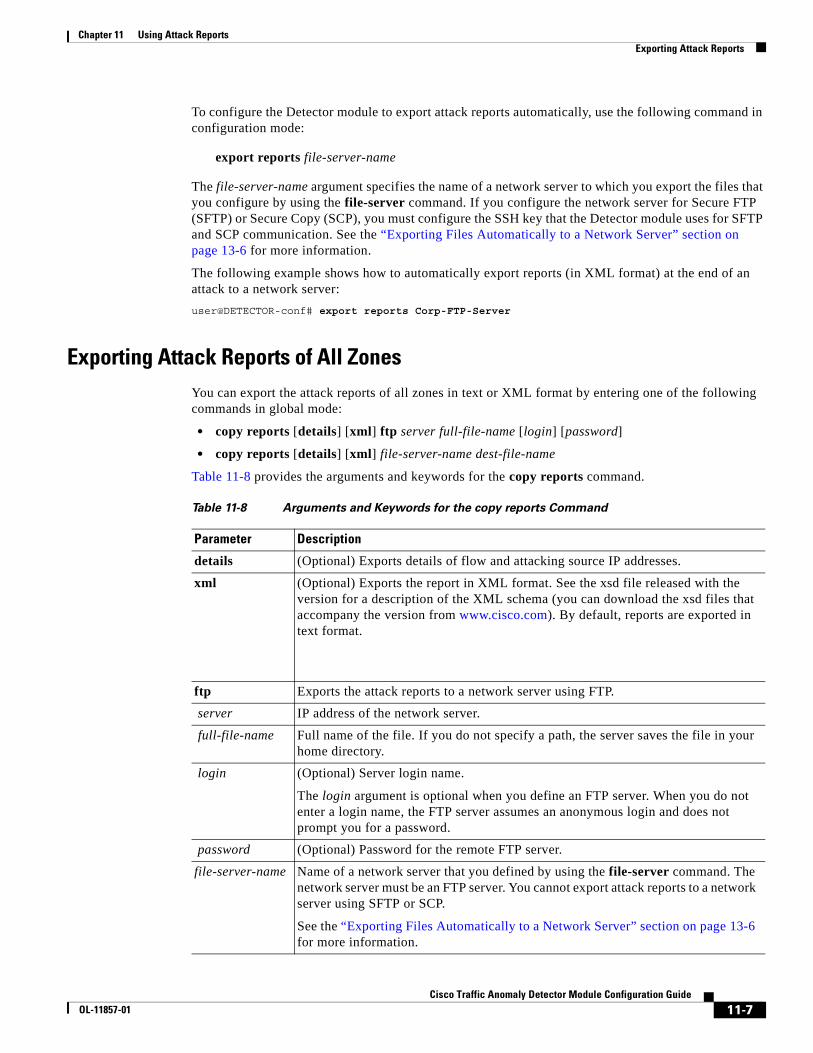
Chapter 11 Using Attack ReportsExporting Attack Reports
To configure the Detector module to export attack reports automatically, use the following command in configuration mode:
export reports file-server-name
The file-server-name argument specifies the name of a network server to which you export the files that you configure by using the file-server command. If you configure the network server for Secure FTP (SFTP) or Secure Copy (SCP), you must configure the SSH key that the Detector module uses for SFTP and SCP communication. See the “Exporting Files Automatically to a Network Server” section on page 13-6 for more information.
The following example shows how to automatically export reports (in XML format) at the end of an attack to a network server:
user@DETECTOR-conf# export reports Corp-FTP-Server
Exporting Attack Reports of All ZonesYou can export the attack reports of all zones in text or XML format by entering one of the following commands in global mode:
• copy reports [details] [xml] ftp server full-file-name [login] [password]
• copy reports [details] [xml] file-server-name dest-file-name
Table 11-8 provides the arguments and keywords for the copy reports command.
Table 11-8 Arguments and Keywords for the copy reports Command
Parameter Description
details (Optional) Exports details of flow and attacking source IP addresses.
xml (Optional) Exports the report in XML format. See the xsd file released with the version for a description of the XML schema (you can download the xsd files that accompany the version from www.cisco.com). By default, reports are exported in text format.
ftp Exports the attack reports to a network server using FTP.
server IP address of the network server.
full-file-name Full name of the file. If you do not specify a path, the server saves the file in your home directory.
login (Optional) Server login name.
The login argument is optional when you define an FTP server. When you do not enter a login name, the FTP server assumes an anonymous login and does not prompt you for a password.
password (Optional) Password for the remote FTP server.
file-server-name Name of a network server that you defined by using the file-server command. The network server must be an FTP server. You cannot export attack reports to a network server using SFTP or SCP.
See the “Exporting Files Automatically to a Network Server” section on page 13-6 for more information.
11-7Cisco Traffic Anomaly Detector Module Configuration Guide
OL-11857-01
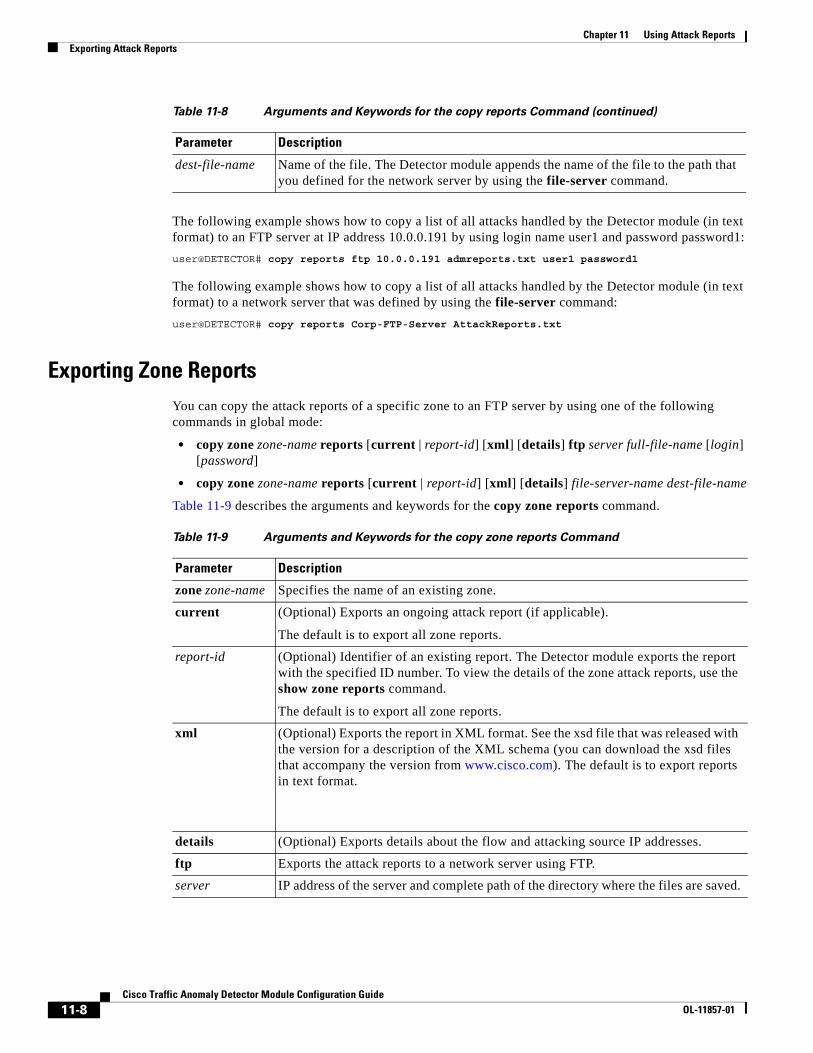
Chapter 11 Using Attack ReportsExporting Attack Reports
The following example shows how to copy a list of all attacks handled by the Detector module (in text format) to an FTP server at IP address 10.0.0.191 by using login name user1 and password password1:
user@DETECTOR# copy reports ftp 10.0.0.191 admreports.txt user1 password1
The following example shows how to copy a list of all attacks handled by the Detector module (in text format) to a network server that was defined by using the file-server command:
user@DETECTOR# copy reports Corp-FTP-Server AttackReports.txt
Exporting Zone ReportsYou can copy the attack reports of a specific zone to an FTP server by using one of the following commands in global mode:
• copy zone zone-name reports [current | report-id] [xml] [details] ftp server full-file-name [login] [password]
• copy zone zone-name reports [current | report-id] [xml] [details] file-server-name dest-file-name
Table 11-9 describes the arguments and keywords for the copy zone reports command.
dest-file-name Name of the file. The Detector module appends the name of the file to the path that you defined for the network server by using the file-server command.
Table 11-8 Arguments and Keywords for the copy reports Command (continued)
Parameter Description
Table 11-9 Arguments and Keywords for the copy zone reports Command
Parameter Description
zone zone-name Specifies the name of an existing zone.
current (Optional) Exports an ongoing attack report (if applicable).
The default is to export all zone reports.
report-id (Optional) Identifier of an existing report. The Detector module exports the report with the specified ID number. To view the details of the zone attack reports, use the show zone reports command.
The default is to export all zone reports.
xml (Optional) Exports the report in XML format. See the xsd file that was released with the version for a description of the XML schema (you can download the xsd files that accompany the version from www.cisco.com). The default is to export reports in text format.
details (Optional) Exports details about the flow and attacking source IP addresses.
ftp Exports the attack reports to a network server using FTP.
server IP address of the server and complete path of the directory where the files are saved.
11-8Cisco Traffic Anomaly Detector Module Configuration Guide
OL-11857-01
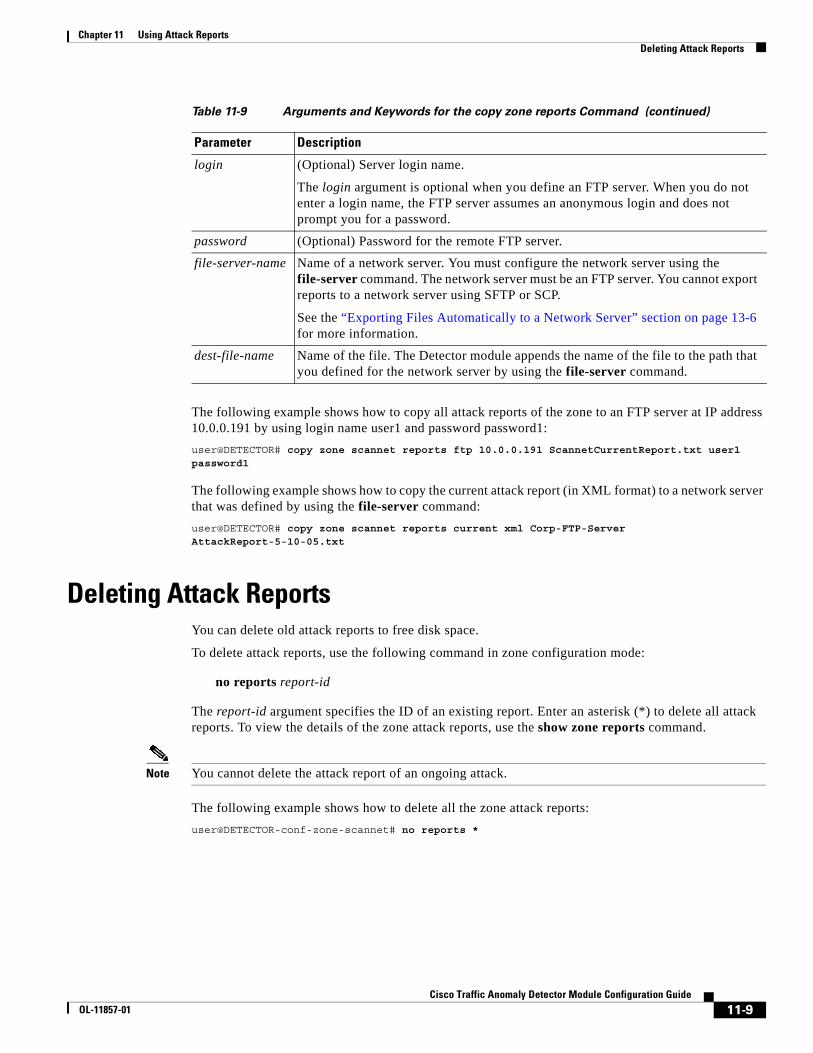
Chapter 11 Using Attack ReportsDeleting Attack Reports
The following example shows how to copy all attack reports of the zone to an FTP server at IP address 10.0.0.191 by using login name user1 and password password1:
user@DETECTOR# copy zone scannet reports ftp 10.0.0.191 ScannetCurrentReport.txt user1 password1
The following example shows how to copy the current attack report (in XML format) to a network server that was defined by using the file-server command:
user@DETECTOR# copy zone scannet reports current xml Corp-FTP-Server AttackReport-5-10-05.txt
Deleting Attack ReportsYou can delete old attack reports to free disk space.
To delete attack reports, use the following command in zone configuration mode:
no reports report-id
The report-id argument specifies the ID of an existing report. Enter an asterisk (*) to delete all attack reports. To view the details of the zone attack reports, use the show zone reports command.
Note You cannot delete the attack report of an ongoing attack.
The following example shows how to delete all the zone attack reports:
user@DETECTOR-conf-zone-scannet# no reports *
login (Optional) Server login name.
The login argument is optional when you define an FTP server. When you do not enter a login name, the FTP server assumes an anonymous login and does not prompt you for a password.
password (Optional) Password for the remote FTP server.
file-server-name Name of a network server. You must configure the network server using the file-server command. The network server must be an FTP server. You cannot export reports to a network server using SFTP or SCP.
See the “Exporting Files Automatically to a Network Server” section on page 13-6 for more information.
dest-file-name Name of the file. The Detector module appends the name of the file to the path that you defined for the network server by using the file-server command.
Table 11-9 Arguments and Keywords for the copy zone reports Command (continued)
Parameter Description
11-9Cisco Traffic Anomaly Detector Module Configuration Guide
OL-11857-01

Chapter 11 Using Attack ReportsDeleting Attack Reports
11-10Cisco Traffic Anomaly Detector Module Configuration Guide
OL-11857-01
Cisco TraOL-11857-01
C H A P T E R 12
Using Detector Module Diagnostic ToolsThis chapter describes how to display statistics and diagnostics on the Cisco Traffic Anomaly Detector Module (Detector module).
Note Operational and configuration differences exist between a Detector module operating at 1 Gbps and a Detector module operating at 2 Gbps. This chapter discusses the differences between the 1-Gbps operation and the 2-Gbps operation. Unless stated, the information in this chapter applies to both modes of operation. For more information, see the “Understanding the 1-Gbps and 2-Gbps Bandwidth Options” section on page 1-6.
This chapter contains the following sections:
• Displaying the Installed Software Version Number and License Agreement
• Displaying the Software License Key Information
• Displaying the Detector Module Configuration
• Displaying Detector Module Zones
• Using Counters to Analyze Traffic
• Displaying the Zone Status
• Managing Detector Module Logs
• Monitoring Network Traffic and Extracting Attack Signatures
• Displaying General Diagnostic Data
• Displaying Flash Memory Usage
• Displaying Memory Consumption
• Displaying the CPU Utilization
• Monitoring System Resources
• Managing the ARP Cache
• Displaying Network Statistics
• Using Traceroute
• Verifying Connectivity
• Obtaining Debug Information
12-1ffic Anomaly Detector Module Configuration Guide
Chapter 12 Using Detector Module Diagnostic ToolsDisplaying the Installed Software Version Number and License Agreement
Displaying the Installed Software Version Number and License Agreement
You can display the software licensing agreement and the version number of the software image loaded on your Detector module. Viewing the version number allows you to verify which of the following bandwidth options your Detector module is using:
• 1-Gbps operation—The maximum bandwidth for traffic between the Detector module and the supervisor engine is 1 Gbps and all data traffic moves over one interface port only.
• 2-Gbps operation—The maximum bandwidth for traffic between the Detector module and the supervisor engine is 2 Gbps and all data traffic moves over two interface ports. If the installed software image allows 2-Gbps operation, it will contain the XG designator in its version number (for example, Cisco Cisco Anomaly Detector Module Image version 6.0(0.39)-XG).
Note For 2-Gbps operation, you must have the associated software license key installed for the Detector module to operate (see the “Displaying the Software License Key Information” section on page 12-2).
To display the software version number and licensing agreement information, use the following command:
show version
Displaying the Software License Key InformationIf the Detector module is using the XG version of the software image for 2-Gbps operation, you can display information related to the license key required to activate the XG software image. Display the license key information to verify the following information:
• The license key is loaded.
• The license key has not expired. If the license key is a demo version, the expiration date of the demo license key displays. If the installed license key is a permanent one, then the word permanent displays as the expiration date.
Note The software image for 1-Gbps operation does not require a license key. To verify which software image is currently loaded on the Detector module, use the show version command (see the “Displaying the Installed Software Version Number and License Agreement” section on page 12-2).
To display the software version number and licensing agreement information, use the following command:
show license-key
12-2Cisco Traffic Anomaly Detector Module Configuration Guide
OL-11857-01
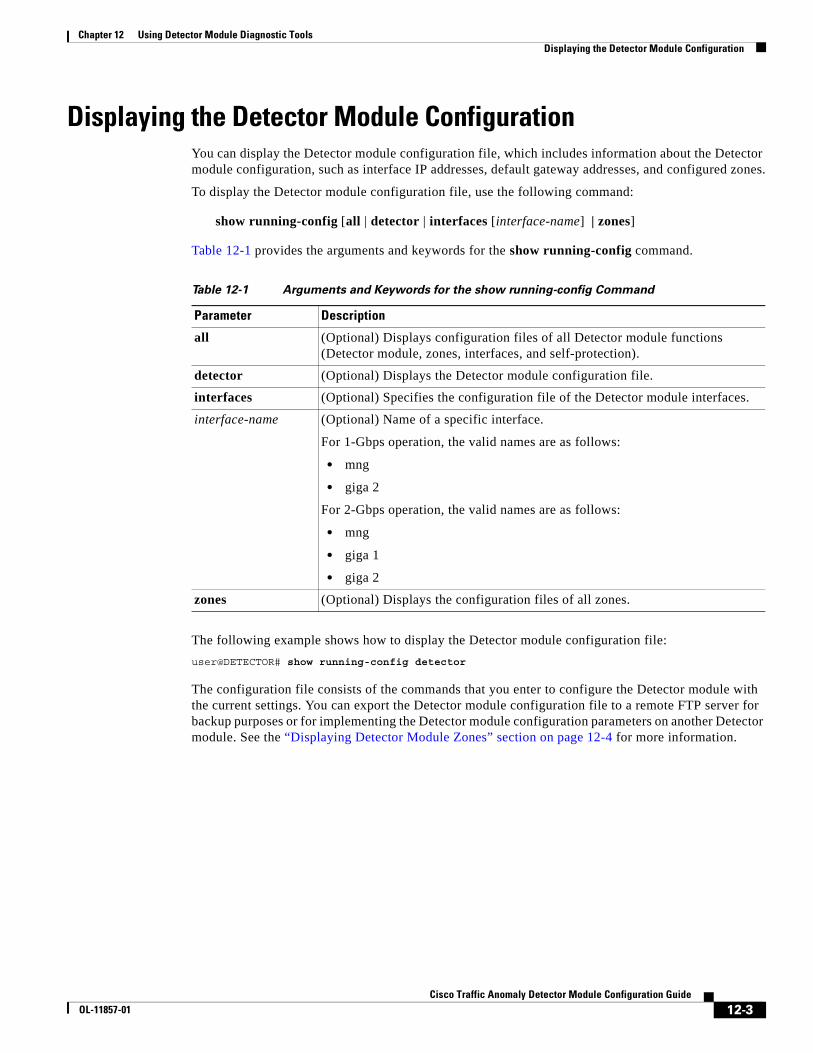
Chapter 12 Using Detector Module Diagnostic ToolsDisplaying the Detector Module Configuration
Displaying the Detector Module ConfigurationYou can display the Detector module configuration file, which includes information about the Detector module configuration, such as interface IP addresses, default gateway addresses, and configured zones.
To display the Detector module configuration file, use the following command:
show running-config [all | detector | interfaces [interface-name] | zones]
Table 12-1 provides the arguments and keywords for the show running-config command.
The following example shows how to display the Detector module configuration file:
user@DETECTOR# show running-config detector
The configuration file consists of the commands that you enter to configure the Detector module with the current settings. You can export the Detector module configuration file to a remote FTP server for backup purposes or for implementing the Detector module configuration parameters on another Detector module. See the “Displaying Detector Module Zones” section on page 12-4 for more information.
Table 12-1 Arguments and Keywords for the show running-config Command
Parameter Description
all (Optional) Displays configuration files of all Detector module functions (Detector module, zones, interfaces, and self-protection).
detector (Optional) Displays the Detector module configuration file.
interfaces (Optional) Specifies the configuration file of the Detector module interfaces.
interface-name (Optional) Name of a specific interface.
For 1-Gbps operation, the valid names are as follows:
• mng
• giga 2
For 2-Gbps operation, the valid names are as follows:
• mng
• giga 1
• giga 2
zones (Optional) Displays the configuration files of all zones.
12-3Cisco Traffic Anomaly Detector Module Configuration Guide
OL-11857-01
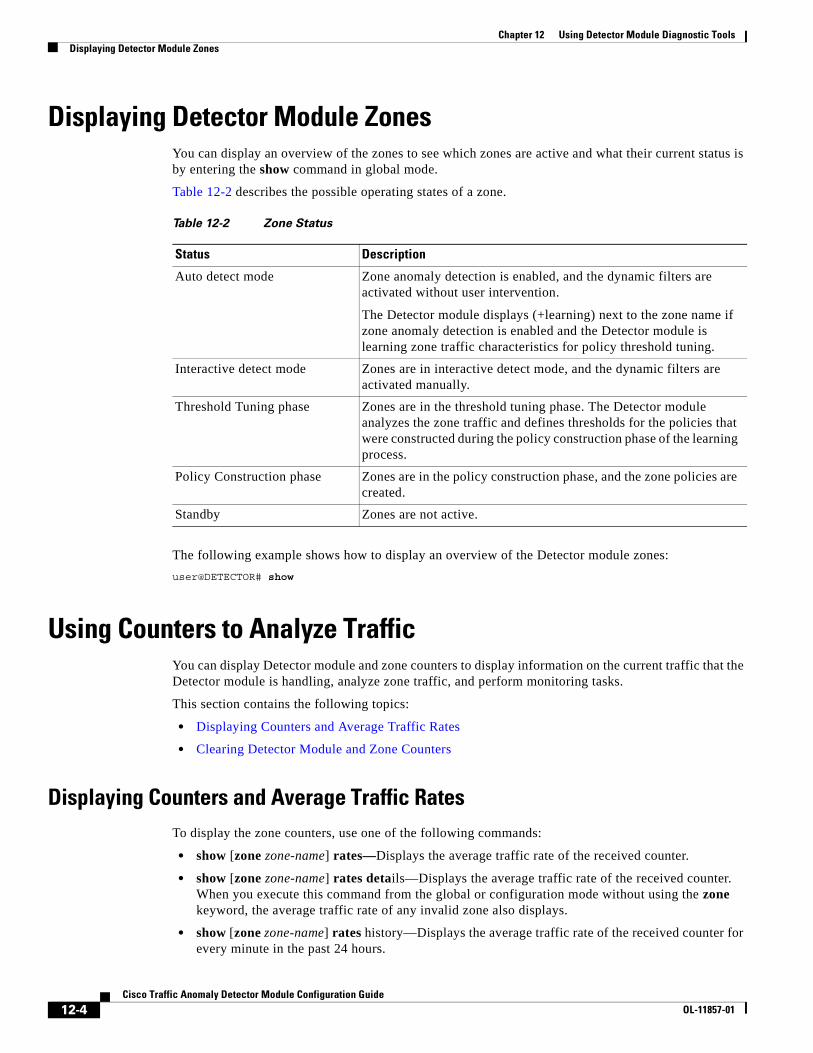
Chapter 12 Using Detector Module Diagnostic ToolsDisplaying Detector Module Zones
Displaying Detector Module ZonesYou can display an overview of the zones to see which zones are active and what their current status is by entering the show command in global mode.
Table 12-2 describes the possible operating states of a zone.
The following example shows how to display an overview of the Detector module zones:
user@DETECTOR# show
Using Counters to Analyze TrafficYou can display Detector module and zone counters to display information on the current traffic that the Detector module is handling, analyze zone traffic, and perform monitoring tasks.
This section contains the following topics:
• Displaying Counters and Average Traffic Rates
• Clearing Detector Module and Zone Counters
Displaying Counters and Average Traffic RatesTo display the zone counters, use one of the following commands:
• show [zone zone-name] rates—Displays the average traffic rate of the received counter.
• show [zone zone-name] rates details—Displays the average traffic rate of the received counter. When you execute this command from the global or configuration mode without using the zone keyword, the average traffic rate of any invalid zone also displays.
• show [zone zone-name] rates history—Displays the average traffic rate of the received counter for every minute in the past 24 hours.
Table 12-2 Zone Status
Status Description
Auto detect mode Zone anomaly detection is enabled, and the dynamic filters are activated without user intervention.
The Detector module displays (+learning) next to the zone name if zone anomaly detection is enabled and the Detector module is learning zone traffic characteristics for policy threshold tuning.
Interactive detect mode Zones are in interactive detect mode, and the dynamic filters are activated manually.
Threshold Tuning phase Zones are in the threshold tuning phase. The Detector module analyzes the zone traffic and defines thresholds for the policies that were constructed during the policy construction phase of the learning process.
Policy Construction phase Zones are in the policy construction phase, and the zone policies are created.
Standby Zones are not active.
12-4Cisco Traffic Anomaly Detector Module Configuration Guide
OL-11857-01
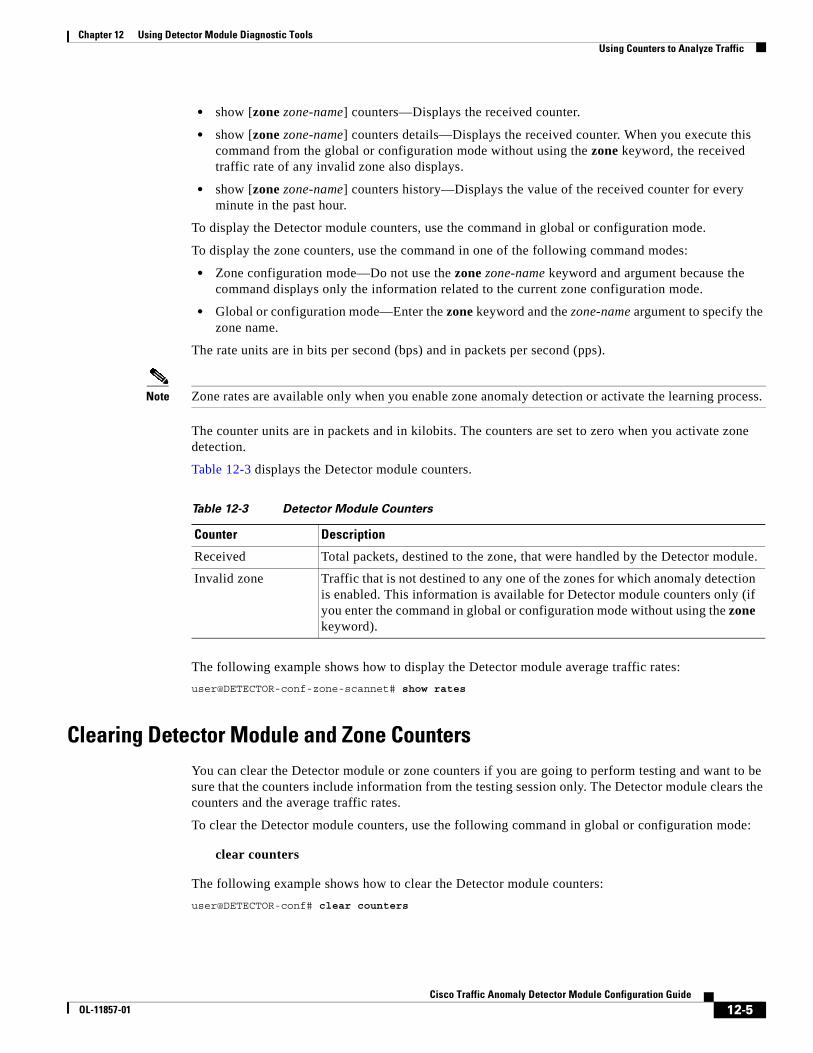
Chapter 12 Using Detector Module Diagnostic ToolsUsing Counters to Analyze Traffic
• show [zone zone-name] counters—Displays the received counter.
• show [zone zone-name] counters details—Displays the received counter. When you execute this command from the global or configuration mode without using the zone keyword, the received traffic rate of any invalid zone also displays.
• show [zone zone-name] counters history—Displays the value of the received counter for every minute in the past hour.
To display the Detector module counters, use the command in global or configuration mode.
To display the zone counters, use the command in one of the following command modes:
• Zone configuration mode—Do not use the zone zone-name keyword and argument because the command displays only the information related to the current zone configuration mode.
• Global or configuration mode—Enter the zone keyword and the zone-name argument to specify the zone name.
The rate units are in bits per second (bps) and in packets per second (pps).
Note Zone rates are available only when you enable zone anomaly detection or activate the learning process.
The counter units are in packets and in kilobits. The counters are set to zero when you activate zone detection.
Table 12-3 displays the Detector module counters.
The following example shows how to display the Detector module average traffic rates:
user@DETECTOR-conf-zone-scannet# show rates
Clearing Detector Module and Zone CountersYou can clear the Detector module or zone counters if you are going to perform testing and want to be sure that the counters include information from the testing session only. The Detector module clears the counters and the average traffic rates.
To clear the Detector module counters, use the following command in global or configuration mode:
clear counters
The following example shows how to clear the Detector module counters:
user@DETECTOR-conf# clear counters
Table 12-3 Detector Module Counters
Counter Description
Received Total packets, destined to the zone, that were handled by the Detector module.
Invalid zone Traffic that is not destined to any one of the zones for which anomaly detection is enabled. This information is available for Detector module counters only (if you enter the command in global or configuration mode without using the zone keyword).
12-5Cisco Traffic Anomaly Detector Module Configuration Guide
OL-11857-01
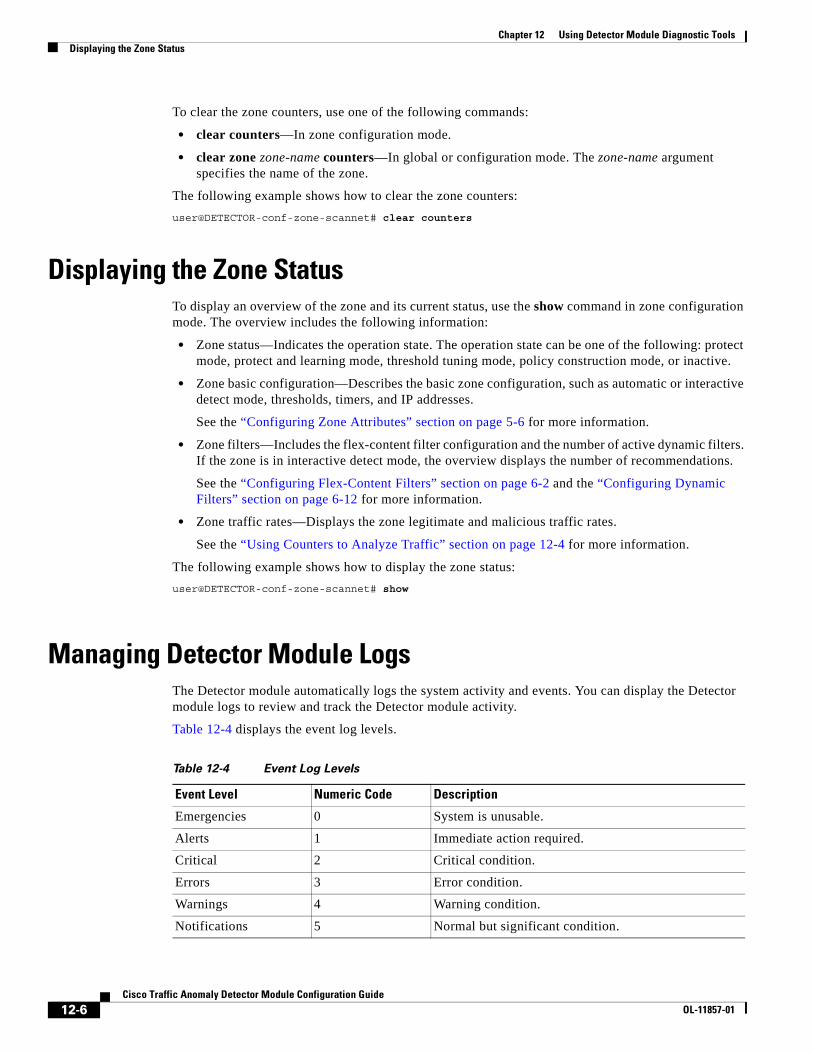
Chapter 12 Using Detector Module Diagnostic ToolsDisplaying the Zone Status
To clear the zone counters, use one of the following commands:
• clear counters—In zone configuration mode.
• clear zone zone-name counters—In global or configuration mode. The zone-name argument specifies the name of the zone.
The following example shows how to clear the zone counters:
user@DETECTOR-conf-zone-scannet# clear counters
Displaying the Zone StatusTo display an overview of the zone and its current status, use the show command in zone configuration mode. The overview includes the following information:
• Zone status—Indicates the operation state. The operation state can be one of the following: protect mode, protect and learning mode, threshold tuning mode, policy construction mode, or inactive.
• Zone basic configuration—Describes the basic zone configuration, such as automatic or interactive detect mode, thresholds, timers, and IP addresses.
See the “Configuring Zone Attributes” section on page 5-6 for more information.
• Zone filters—Includes the flex-content filter configuration and the number of active dynamic filters. If the zone is in interactive detect mode, the overview displays the number of recommendations.
See the “Configuring Flex-Content Filters” section on page 6-2 and the “Configuring Dynamic Filters” section on page 6-12 for more information.
• Zone traffic rates—Displays the zone legitimate and malicious traffic rates.
See the “Using Counters to Analyze Traffic” section on page 12-4 for more information.
The following example shows how to display the zone status:
user@DETECTOR-conf-zone-scannet# show
Managing Detector Module LogsThe Detector module automatically logs the system activity and events. You can display the Detector module logs to review and track the Detector module activity.
Table 12-4 displays the event log levels.
Table 12-4 Event Log Levels
Event Level Numeric Code Description
Emergencies 0 System is unusable.
Alerts 1 Immediate action required.
Critical 2 Critical condition.
Errors 3 Error condition.
Warnings 4 Warning condition.
Notifications 5 Normal but significant condition.
12-6Cisco Traffic Anomaly Detector Module Configuration Guide
OL-11857-01
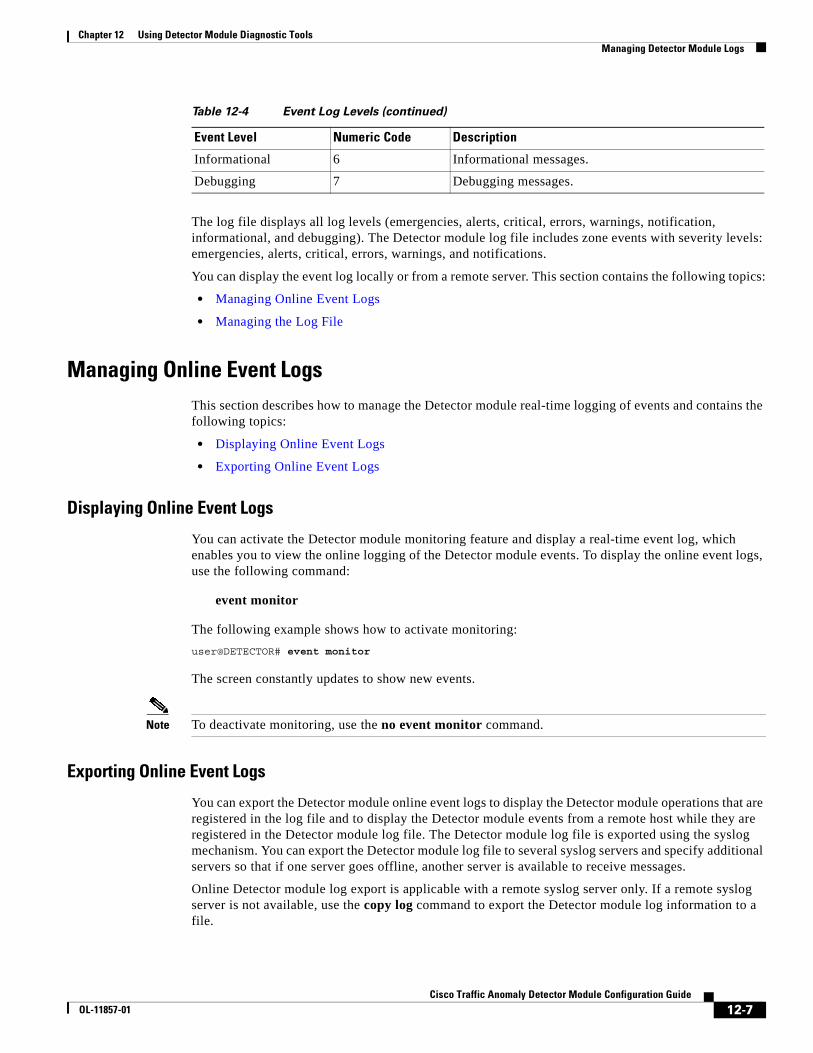
Chapter 12 Using Detector Module Diagnostic ToolsManaging Detector Module Logs
The log file displays all log levels (emergencies, alerts, critical, errors, warnings, notification, informational, and debugging). The Detector module log file includes zone events with severity levels: emergencies, alerts, critical, errors, warnings, and notifications.
You can display the event log locally or from a remote server. This section contains the following topics:
• Managing Online Event Logs
• Managing the Log File
Managing Online Event LogsThis section describes how to manage the Detector module real-time logging of events and contains the following topics:
• Displaying Online Event Logs
• Exporting Online Event Logs
Displaying Online Event Logs
You can activate the Detector module monitoring feature and display a real-time event log, which enables you to view the online logging of the Detector module events. To display the online event logs, use the following command:
event monitor
The following example shows how to activate monitoring:
user@DETECTOR# event monitor
The screen constantly updates to show new events.
Note To deactivate monitoring, use the no event monitor command.
Exporting Online Event Logs
You can export the Detector module online event logs to display the Detector module operations that are registered in the log file and to display the Detector module events from a remote host while they are registered in the Detector module log file. The Detector module log file is exported using the syslog mechanism. You can export the Detector module log file to several syslog servers and specify additional servers so that if one server goes offline, another server is available to receive messages.
Online Detector module log export is applicable with a remote syslog server only. If a remote syslog server is not available, use the copy log command to export the Detector module log information to a file.
Informational 6 Informational messages.
Debugging 7 Debugging messages.
Table 12-4 Event Log Levels (continued)
Event Level Numeric Code Description
12-7Cisco Traffic Anomaly Detector Module Configuration Guide
OL-11857-01
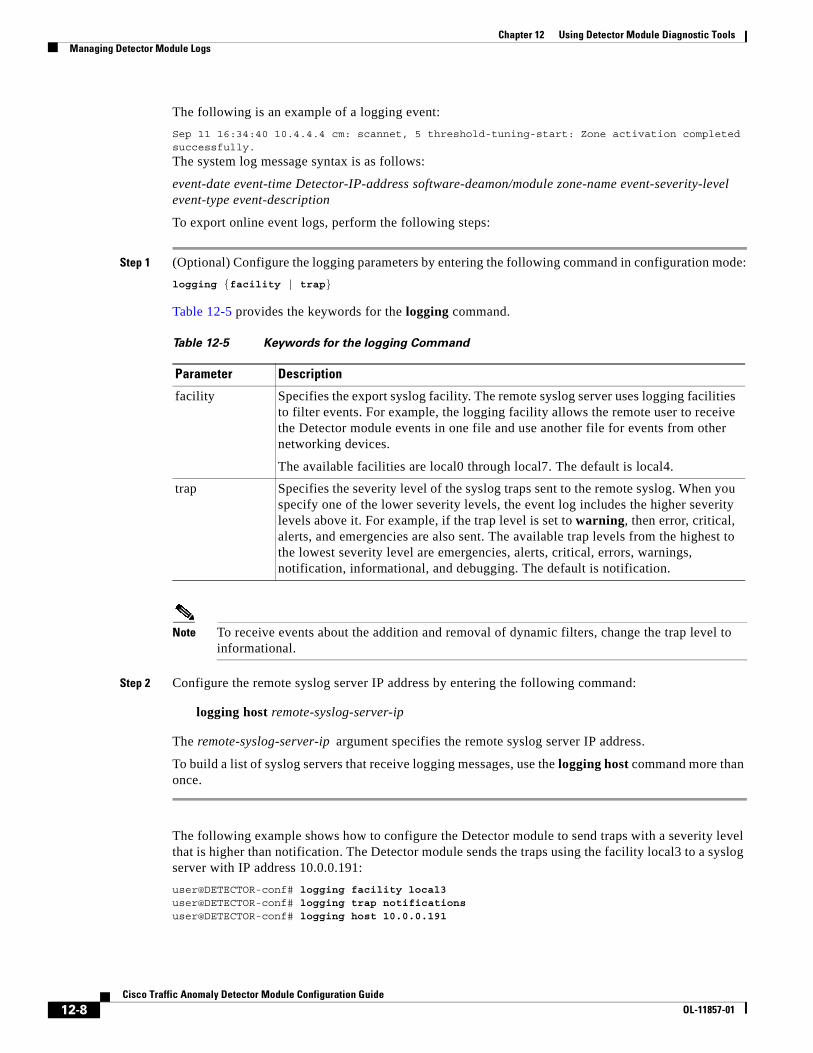
Chapter 12 Using Detector Module Diagnostic ToolsManaging Detector Module Logs
The following is an example of a logging event:
Sep 11 16:34:40 10.4.4.4 cm: scannet, 5 threshold-tuning-start: Zone activation completed successfully.
The system log message syntax is as follows:
event-date event-time Detector-IP-address software-deamon/module zone-name event-severity-level event-type event-description
To export online event logs, perform the following steps:
Step 1 (Optional) Configure the logging parameters by entering the following command in configuration mode:
logging {facility | trap}
Table 12-5 provides the keywords for the logging command.
Note To receive events about the addition and removal of dynamic filters, change the trap level to informational.
Step 2 Configure the remote syslog server IP address by entering the following command:
logging host remote-syslog-server-ip
The remote-syslog-server-ip argument specifies the remote syslog server IP address.
To build a list of syslog servers that receive logging messages, use the logging host command more than once.
The following example shows how to configure the Detector module to send traps with a severity level that is higher than notification. The Detector module sends the traps using the facility local3 to a syslog server with IP address 10.0.0.191:
user@DETECTOR-conf# logging facility local3user@DETECTOR-conf# logging trap notificationsuser@DETECTOR-conf# logging host 10.0.0.191
Table 12-5 Keywords for the logging Command
Parameter Description
facility Specifies the export syslog facility. The remote syslog server uses logging facilities to filter events. For example, the logging facility allows the remote user to receive the Detector module events in one file and use another file for events from other networking devices.
The available facilities are local0 through local7. The default is local4.
trap Specifies the severity level of the syslog traps sent to the remote syslog. When you specify one of the lower severity levels, the event log includes the higher severity levels above it. For example, if the trap level is set to warning, then error, critical, alerts, and emergencies are also sent. The available trap levels from the highest to the lowest severity level are emergencies, alerts, critical, errors, warnings, notification, informational, and debugging. The default is notification.
12-8Cisco Traffic Anomaly Detector Module Configuration Guide
OL-11857-01
Chapter 12 Using Detector Module Diagnostic ToolsManaging Detector Module Logs
To display the configuration that the Detector module uses to export online event logs, use the show logging command or the show log export-ip command.
Managing the Log FileThis section describes how to manage the Detector module log file and contains the following topics:
• Displaying the Log File
• Exporting the Log File
• Clearing the Log File
Displaying the Log File
You can display the Detector module log for diagnostic or monitoring purposes. The Detector module log file includes zone events with these severity levels: emergencies, alerts, critical, errors, warnings, and notification.
To display the Detector module log, use the following command in global mode:
show log
The following example shows how to display the Detector module log:
user@DETECTOR# show log
You can display a zone log to display events that relate to the specified zone only.
To display the zone log, use the show log command in zone configuration mode.
Exporting the Log File
You can export the Detector module log file to a network server for monitoring or diagnostics by entering one of the following commands in global mode:
• copy [zone zone-name] log ftp server full-file-name [login [password]]
• copy [zone zone-name] log {sftp | scp} server full-file-name login
Table 12-6 provides the arguments and keywords for the copy log ftp command.
Table 12-6 Arguments and Keywords for the copy log ftp Command
Parameter Description
zone zone-name (Optional) Specifies the zone name. Exports the zone log file. The default is to export the Detector module log file.
log Exports the log file.
ftp Specifies FTP.
sftp Specifies SFTP.
scp Specifies SCP.
server IP address of the network server, path, and filename. Enter the IP address in dotted-decimal notation (for example, enter 192.168.10.2). If you do not specify a path, the server saves the file in your home directory.
12-9Cisco Traffic Anomaly Detector Module Configuration Guide
OL-11857-01
Chapter 12 Using Detector Module Diagnostic ToolsManaging Detector Module Logs
Note You can configure the Detector module to export event logs automatically by using the logging host command. See the “Exporting Online Event Logs” section on page 12-7 for more information.
Because Secure File Transfer Protocol (SFTP) and Secure Copy Protocol (SCP) rely on Secure Shell (SSH) for secure communication, if you do not configure the key that the Detector module uses before you enter the copy command with the sftp or scp option, the Detector module prompts you for the password. See the “Configuring the Keys for SFTP and SCP Connections” section on page 4-24 for more information about how to configure the key that the Detector module uses for secure communication.
The following example shows how to export the Detector module log file to an FTP server:
user@DETECTOR# copy log ftp 10.0.0.191 log.txt <user> <password>
Clearing the Log File
You can clear the Detector module or zone log file if it is large or if you are going to perform testing and want to be sure that the log file includes information from the testing session only.
To clear the zone log file of all entries, use the following command in zone configuration mode:
clear log
To clear the Detector module or zone log file of all entries, use the following command in configuration mode:
clear [zone zone-name] log
The optional zone zone-name keyword and argument specifies the zone name. The default is to clear the Detector module log file.
The following example shows how to clear the Detector module log:
user@DETECTOR-conf# clear log
login (Optional) Server login name. The login argument is optional when you define an FTP server. When you do not enter a login name, the FTP server assumes an anonymous login and does not prompt you for a password.
password (Optional) Password for the remote FTP server. If you do not enter the password, the Detector module prompts you for it.
Table 12-6 Arguments and Keywords for the copy log ftp Command (continued)
Parameter Description
12-10Cisco Traffic Anomaly Detector Module Configuration Guide
OL-11857-01
Chapter 12 Using Detector Module Diagnostic ToolsMonitoring Network Traffic and Extracting Attack Signatures
Monitoring Network Traffic and Extracting Attack SignaturesYou can configure the Detector module to record traffic directly from the network through nonintrusive taps and create a database from the recorded traffic. By querying the recorded traffic database, you can analyze past events, generate signatures of an attack, or compare current network traffic patterns with traffic patterns that the Detector module recorded previously under normal traffic conditions.
You can configure filters so that the Detector module records only traffic that meets certain criteria or you can record all traffic data and filter the traffic that the Detector module displays.
The Detector module records the traffic in PCAP format, which is compressed and encoded by the gzip (GNU zip) program with an accompanying file in Extensible Markup Language (XML) format that describes the recorded data.
The Detector module can analyze the recorded traffic to determine if there are any common patterns or signatures that appear in the payload of the recorded attack packets. The Detector module can extract signatures from the recorded traffic. Using the signature, you can configure a flex-content filter to block all traffic containing packet payloads that match the signature.
The Detector module can record traffic as follows:
• Automatically—Continuously records the traffic data in packet-dump capture files.
New packet-dump capture files replace the previous ones. To save previous packet-dump capture files, you must export them to a network server.
• Manually—Records the traffic in packet-dump capture files when you activate the Detector module to record the traffic.
New packet-dump capture files replace previous files. To save the recorded traffic, export the packet-dump capture files to a network server before you activate the Detector module to record traffic again.
You can activate only one manual packet-dump capture at a time for a zone, but you can activate the manual packet-dump capture and the automatic packet-dump capture simultaneously. The Detector module can manually record traffic for up to four zones simultaneously.
The Detector module allocates, by default, 20-MB disk space for manual packet-dump capture files of all zones. The Detector module can save up to 80-MB disk space for manual and automatic packet-dump capture files of all zones. You must delete old files to free the disk space for additional packet-dump capture files.
This section contains the following topics:
• Configuring the Detector Module to Automatically Record Traffic
• Activating the Detector Module to Manually Record Traffic
• Stopping the Detector Module from Manually Recording Traffic
• Displaying Manual Packet-Dump Settings
• Exporting Packet-Dump Capture Files Automatically
• Exporting Packet-Dump Capture Files Manually
• Importing Packet-Dump Capture Files
• Displaying Packet-Dump Capture Files
• Generating Attack Signatures from Packet-Dump Capture Files
• Copying Packet-Dump Capture Files
• Deleting Packet-Dump Capture Files
12-11Cisco Traffic Anomaly Detector Module Configuration Guide
OL-11857-01
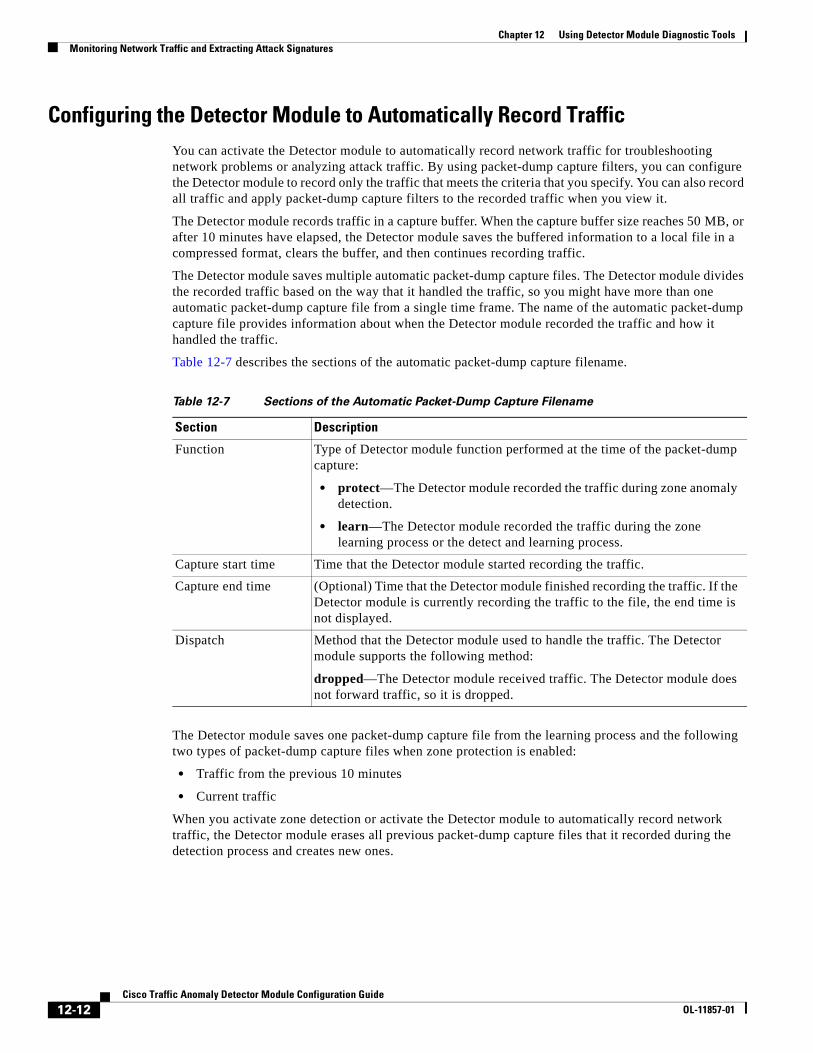
Chapter 12 Using Detector Module Diagnostic ToolsMonitoring Network Traffic and Extracting Attack Signatures
Configuring the Detector Module to Automatically Record Traffic You can activate the Detector module to automatically record network traffic for troubleshooting network problems or analyzing attack traffic. By using packet-dump capture filters, you can configure the Detector module to record only the traffic that meets the criteria that you specify. You can also record all traffic and apply packet-dump capture filters to the recorded traffic when you view it.
The Detector module records traffic in a capture buffer. When the capture buffer size reaches 50 MB, or after 10 minutes have elapsed, the Detector module saves the buffered information to a local file in a compressed format, clears the buffer, and then continues recording traffic.
The Detector module saves multiple automatic packet-dump capture files. The Detector module divides the recorded traffic based on the way that it handled the traffic, so you might have more than one automatic packet-dump capture file from a single time frame. The name of the automatic packet-dump capture file provides information about when the Detector module recorded the traffic and how it handled the traffic.
Table 12-7 describes the sections of the automatic packet-dump capture filename.
The Detector module saves one packet-dump capture file from the learning process and the following two types of packet-dump capture files when zone protection is enabled:
• Traffic from the previous 10 minutes
• Current traffic
When you activate zone detection or activate the Detector module to automatically record network traffic, the Detector module erases all previous packet-dump capture files that it recorded during the detection process and creates new ones.
Table 12-7 Sections of the Automatic Packet-Dump Capture Filename
Section Description
Function Type of Detector module function performed at the time of the packet-dump capture:
• protect—The Detector module recorded the traffic during zone anomaly detection.
• learn—The Detector module recorded the traffic during the zone learning process or the detect and learning process.
Capture start time Time that the Detector module started recording the traffic.
Capture end time (Optional) Time that the Detector module finished recording the traffic. If the Detector module is currently recording the traffic to the file, the end time is not displayed.
Dispatch Method that the Detector module used to handle the traffic. The Detector module supports the following method:
dropped—The Detector module received traffic. The Detector module does not forward traffic, so it is dropped.
12-12Cisco Traffic Anomaly Detector Module Configuration Guide
OL-11857-01
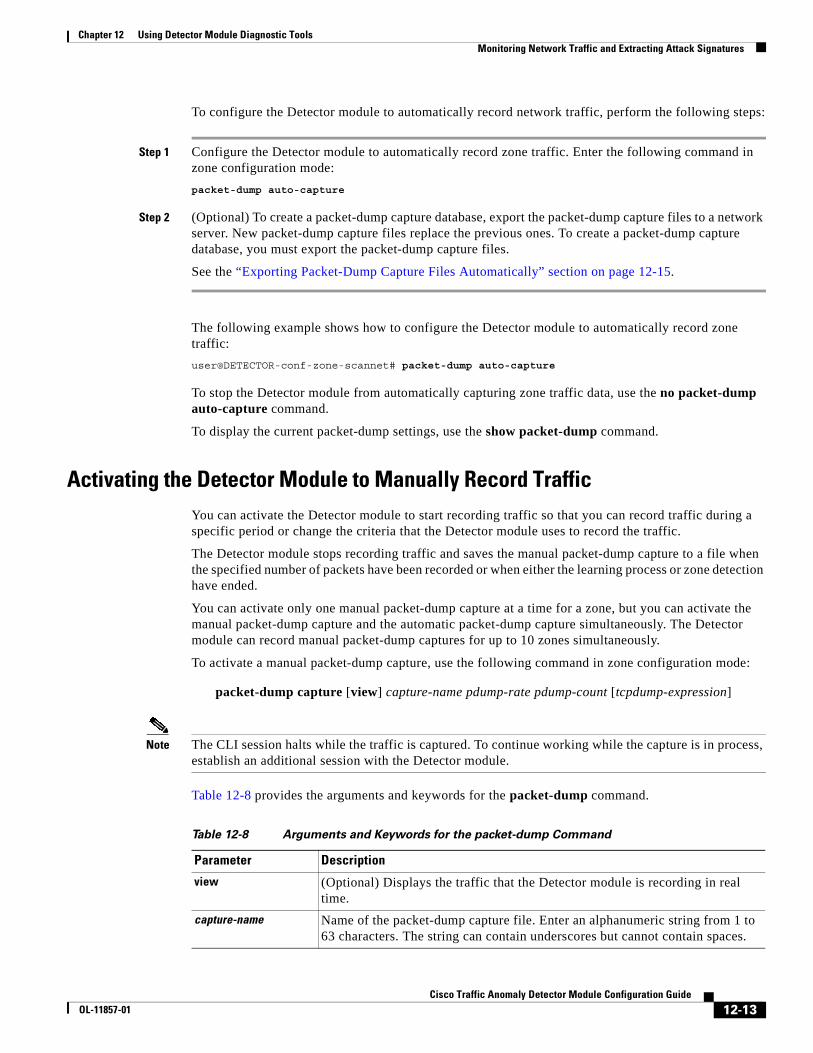
Chapter 12 Using Detector Module Diagnostic ToolsMonitoring Network Traffic and Extracting Attack Signatures
To configure the Detector module to automatically record network traffic, perform the following steps:
Step 1 Configure the Detector module to automatically record zone traffic. Enter the following command in zone configuration mode:
packet-dump auto-capture
Step 2 (Optional) To create a packet-dump capture database, export the packet-dump capture files to a network server. New packet-dump capture files replace the previous ones. To create a packet-dump capture database, you must export the packet-dump capture files.
See the “Exporting Packet-Dump Capture Files Automatically” section on page 12-15.
The following example shows how to configure the Detector module to automatically record zone traffic:
user@DETECTOR-conf-zone-scannet# packet-dump auto-capture
To stop the Detector module from automatically capturing zone traffic data, use the no packet-dump auto-capture command.
To display the current packet-dump settings, use the show packet-dump command.
Activating the Detector Module to Manually Record TrafficYou can activate the Detector module to start recording traffic so that you can record traffic during a specific period or change the criteria that the Detector module uses to record the traffic.
The Detector module stops recording traffic and saves the manual packet-dump capture to a file when the specified number of packets have been recorded or when either the learning process or zone detection have ended.
You can activate only one manual packet-dump capture at a time for a zone, but you can activate the manual packet-dump capture and the automatic packet-dump capture simultaneously. The Detector module can record manual packet-dump captures for up to 10 zones simultaneously.
To activate a manual packet-dump capture, use the following command in zone configuration mode:
packet-dump capture [view] capture-name pdump-rate pdump-count [tcpdump-expression]
Note The CLI session halts while the traffic is captured. To continue working while the capture is in process, establish an additional session with the Detector module.
Table 12-8 provides the arguments and keywords for the packet-dump command.
Table 12-8 Arguments and Keywords for the packet-dump Command
Parameter Description
view (Optional) Displays the traffic that the Detector module is recording in real time.
capture-name Name of the packet-dump capture file. Enter an alphanumeric string from 1 to 63 characters. The string can contain underscores but cannot contain spaces.
12-13Cisco Traffic Anomaly Detector Module Configuration Guide
OL-11857-01
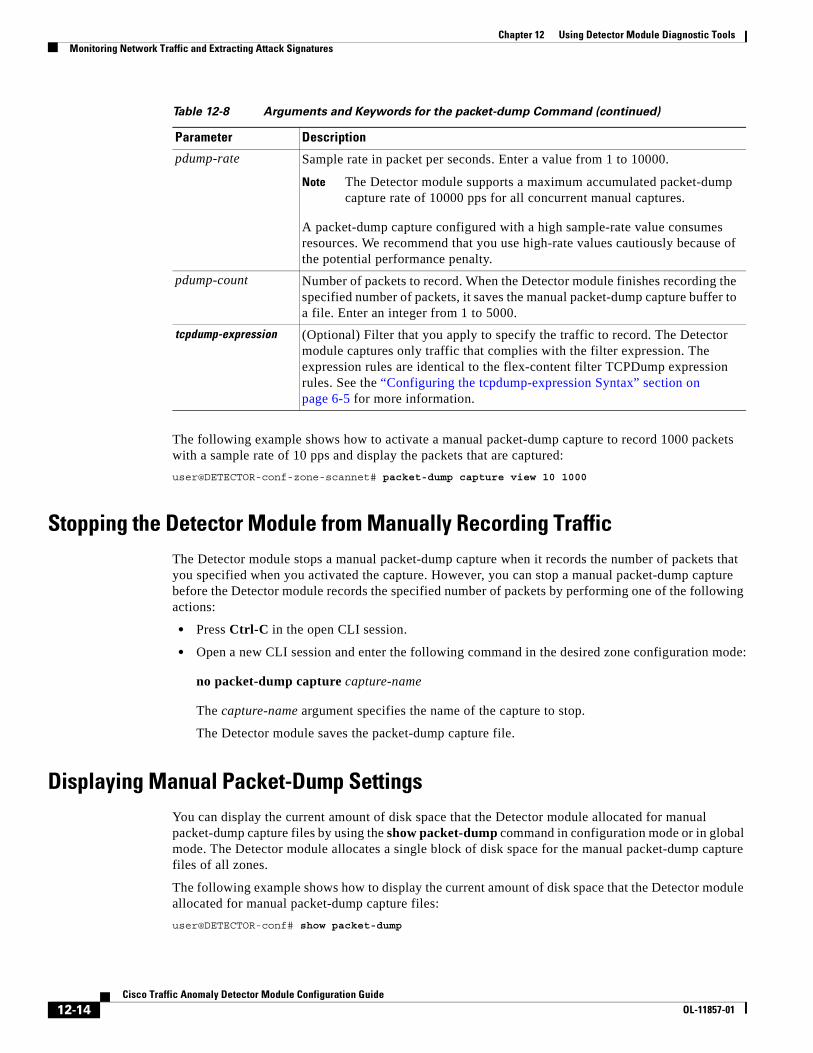
Chapter 12 Using Detector Module Diagnostic ToolsMonitoring Network Traffic and Extracting Attack Signatures
The following example shows how to activate a manual packet-dump capture to record 1000 packets with a sample rate of 10 pps and display the packets that are captured:
user@DETECTOR-conf-zone-scannet# packet-dump capture view 10 1000
Stopping the Detector Module from Manually Recording TrafficThe Detector module stops a manual packet-dump capture when it records the number of packets that you specified when you activated the capture. However, you can stop a manual packet-dump capture before the Detector module records the specified number of packets by performing one of the following actions:
• Press Ctrl-C in the open CLI session.
• Open a new CLI session and enter the following command in the desired zone configuration mode:
no packet-dump capture capture-name
The capture-name argument specifies the name of the capture to stop.
The Detector module saves the packet-dump capture file.
Displaying Manual Packet-Dump SettingsYou can display the current amount of disk space that the Detector module allocated for manual packet-dump capture files by using the show packet-dump command in configuration mode or in global mode. The Detector module allocates a single block of disk space for the manual packet-dump capture files of all zones.
The following example shows how to display the current amount of disk space that the Detector module allocated for manual packet-dump capture files:
user@DETECTOR-conf# show packet-dump
pdump-rate Sample rate in packet per seconds. Enter a value from 1 to 10000.
Note The Detector module supports a maximum accumulated packet-dump capture rate of 10000 pps for all concurrent manual captures.
A packet-dump capture configured with a high sample-rate value consumes resources. We recommend that you use high-rate values cautiously because of the potential performance penalty.
pdump-count Number of packets to record. When the Detector module finishes recording the specified number of packets, it saves the manual packet-dump capture buffer to a file. Enter an integer from 1 to 5000.
tcpdump-expression (Optional) Filter that you apply to specify the traffic to record. The Detector module captures only traffic that complies with the filter expression. The expression rules are identical to the flex-content filter TCPDump expression rules. See the “Configuring the tcpdump-expression Syntax” section on page 6-5 for more information.
Table 12-8 Arguments and Keywords for the packet-dump Command (continued)
Parameter Description
12-14Cisco Traffic Anomaly Detector Module Configuration Guide
OL-11857-01
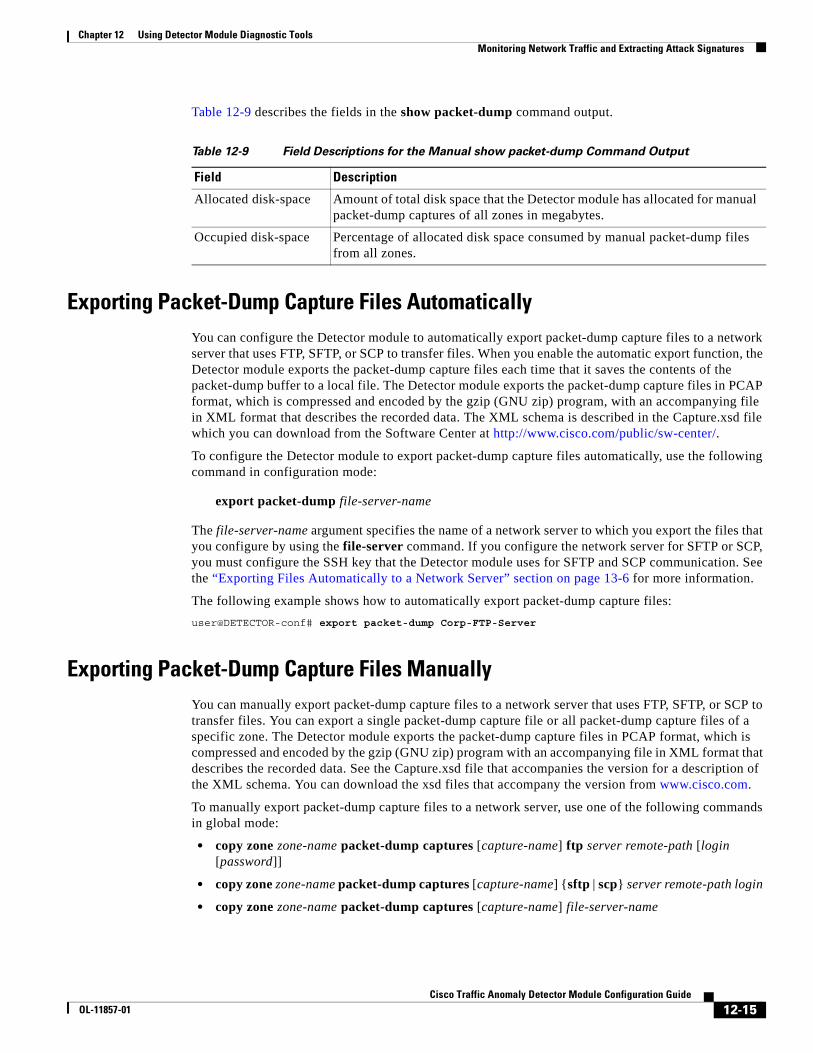
Chapter 12 Using Detector Module Diagnostic ToolsMonitoring Network Traffic and Extracting Attack Signatures
Table 12-9 describes the fields in the show packet-dump command output.
Exporting Packet-Dump Capture Files AutomaticallyYou can configure the Detector module to automatically export packet-dump capture files to a network server that uses FTP, SFTP, or SCP to transfer files. When you enable the automatic export function, the Detector module exports the packet-dump capture files each time that it saves the contents of the packet-dump buffer to a local file. The Detector module exports the packet-dump capture files in PCAP format, which is compressed and encoded by the gzip (GNU zip) program, with an accompanying file in XML format that describes the recorded data. The XML schema is described in the Capture.xsd file which you can download from the Software Center at http://www.cisco.com/public/sw-center/.
To configure the Detector module to export packet-dump capture files automatically, use the following command in configuration mode:
export packet-dump file-server-name
The file-server-name argument specifies the name of a network server to which you export the files that you configure by using the file-server command. If you configure the network server for SFTP or SCP, you must configure the SSH key that the Detector module uses for SFTP and SCP communication. See the “Exporting Files Automatically to a Network Server” section on page 13-6 for more information.
The following example shows how to automatically export packet-dump capture files:
user@DETECTOR-conf# export packet-dump Corp-FTP-Server
Exporting Packet-Dump Capture Files ManuallyYou can manually export packet-dump capture files to a network server that uses FTP, SFTP, or SCP to transfer files. You can export a single packet-dump capture file or all packet-dump capture files of a specific zone. The Detector module exports the packet-dump capture files in PCAP format, which is compressed and encoded by the gzip (GNU zip) program with an accompanying file in XML format that describes the recorded data. See the Capture.xsd file that accompanies the version for a description of the XML schema. You can download the xsd files that accompany the version from www.cisco.com.
To manually export packet-dump capture files to a network server, use one of the following commands in global mode:
• copy zone zone-name packet-dump captures [capture-name] ftp server remote-path [login [password]]
• copy zone zone-name packet-dump captures [capture-name] {sftp | scp} server remote-path login
• copy zone zone-name packet-dump captures [capture-name] file-server-name
Table 12-9 Field Descriptions for the Manual show packet-dump Command Output
Field Description
Allocated disk-space Amount of total disk space that the Detector module has allocated for manual packet-dump captures of all zones in megabytes.
Occupied disk-space Percentage of allocated disk space consumed by manual packet-dump files from all zones.
12-15Cisco Traffic Anomaly Detector Module Configuration Guide
OL-11857-01
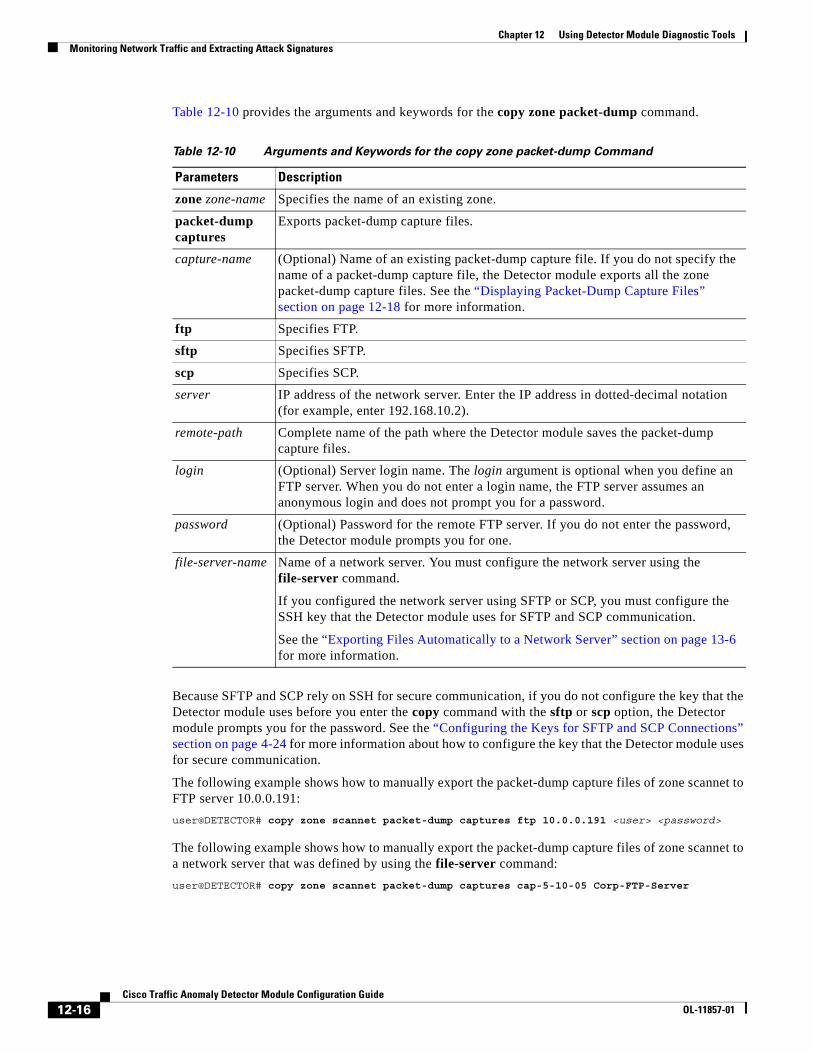
Chapter 12 Using Detector Module Diagnostic ToolsMonitoring Network Traffic and Extracting Attack Signatures
Table 12-10 provides the arguments and keywords for the copy zone packet-dump command.
Because SFTP and SCP rely on SSH for secure communication, if you do not configure the key that the Detector module uses before you enter the copy command with the sftp or scp option, the Detector module prompts you for the password. See the “Configuring the Keys for SFTP and SCP Connections” section on page 4-24 for more information about how to configure the key that the Detector module uses for secure communication.
The following example shows how to manually export the packet-dump capture files of zone scannet to FTP server 10.0.0.191:
user@DETECTOR# copy zone scannet packet-dump captures ftp 10.0.0.191 <user> <password>
The following example shows how to manually export the packet-dump capture files of zone scannet to a network server that was defined by using the file-server command:
user@DETECTOR# copy zone scannet packet-dump captures cap-5-10-05 Corp-FTP-Server
Table 12-10 Arguments and Keywords for the copy zone packet-dump Command
Parameters Description
zone zone-name Specifies the name of an existing zone.
packet-dump captures
Exports packet-dump capture files.
capture-name (Optional) Name of an existing packet-dump capture file. If you do not specify the name of a packet-dump capture file, the Detector module exports all the zone packet-dump capture files. See the “Displaying Packet-Dump Capture Files” section on page 12-18 for more information.
ftp Specifies FTP.
sftp Specifies SFTP.
scp Specifies SCP.
server IP address of the network server. Enter the IP address in dotted-decimal notation (for example, enter 192.168.10.2).
remote-path Complete name of the path where the Detector module saves the packet-dump capture files.
login (Optional) Server login name. The login argument is optional when you define an FTP server. When you do not enter a login name, the FTP server assumes an anonymous login and does not prompt you for a password.
password (Optional) Password for the remote FTP server. If you do not enter the password, the Detector module prompts you for one.
file-server-name Name of a network server. You must configure the network server using the file-server command.
If you configured the network server using SFTP or SCP, you must configure the SSH key that the Detector module uses for SFTP and SCP communication.
See the “Exporting Files Automatically to a Network Server” section on page 13-6 for more information.
12-16Cisco Traffic Anomaly Detector Module Configuration Guide
OL-11857-01
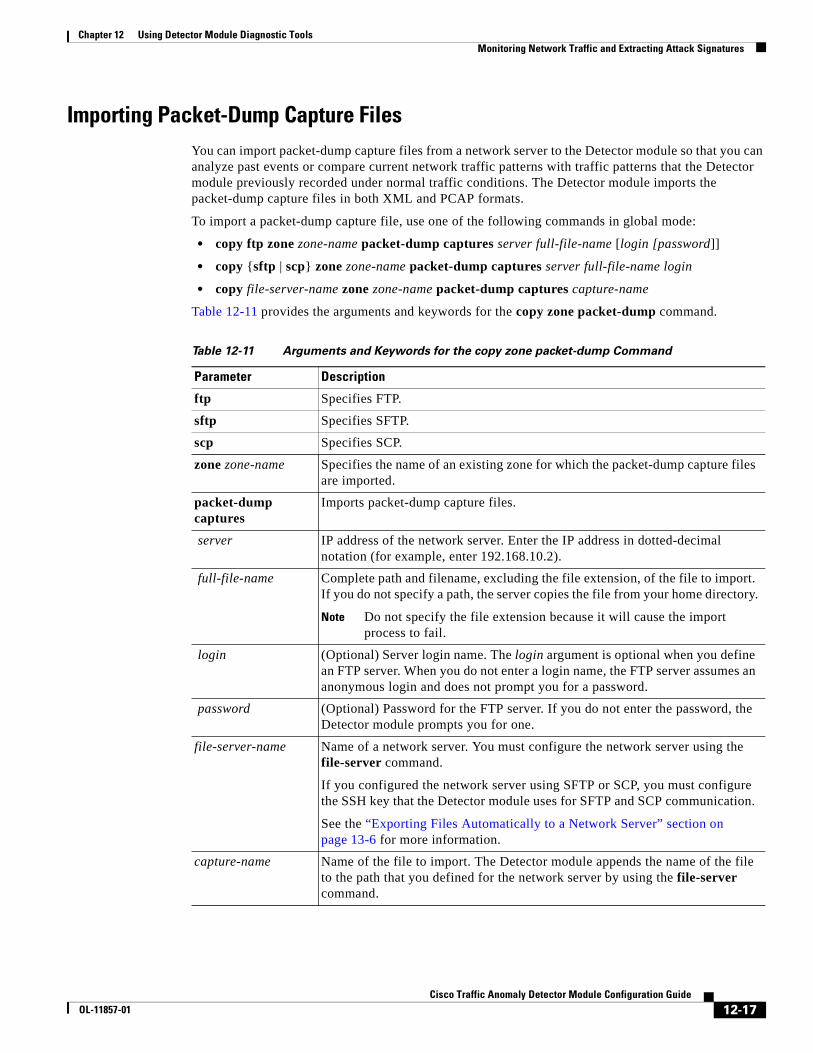
Chapter 12 Using Detector Module Diagnostic ToolsMonitoring Network Traffic and Extracting Attack Signatures
Importing Packet-Dump Capture FilesYou can import packet-dump capture files from a network server to the Detector module so that you can analyze past events or compare current network traffic patterns with traffic patterns that the Detector module previously recorded under normal traffic conditions. The Detector module imports the packet-dump capture files in both XML and PCAP formats.
To import a packet-dump capture file, use one of the following commands in global mode:
• copy ftp zone zone-name packet-dump captures server full-file-name [login [password]]
• copy {sftp | scp} zone zone-name packet-dump captures server full-file-name login
• copy file-server-name zone zone-name packet-dump captures capture-name
Table 12-11 provides the arguments and keywords for the copy zone packet-dump command.
Table 12-11 Arguments and Keywords for the copy zone packet-dump Command
Parameter Description
ftp Specifies FTP.
sftp Specifies SFTP.
scp Specifies SCP.
zone zone-name Specifies the name of an existing zone for which the packet-dump capture files are imported.
packet-dump captures
Imports packet-dump capture files.
server IP address of the network server. Enter the IP address in dotted-decimal notation (for example, enter 192.168.10.2).
full-file-name Complete path and filename, excluding the file extension, of the file to import. If you do not specify a path, the server copies the file from your home directory.
Note Do not specify the file extension because it will cause the import process to fail.
login (Optional) Server login name. The login argument is optional when you define an FTP server. When you do not enter a login name, the FTP server assumes an anonymous login and does not prompt you for a password.
password (Optional) Password for the FTP server. If you do not enter the password, the Detector module prompts you for one.
file-server-name Name of a network server. You must configure the network server using the file-server command.
If you configured the network server using SFTP or SCP, you must configure the SSH key that the Detector module uses for SFTP and SCP communication.
See the “Exporting Files Automatically to a Network Server” section on page 13-6 for more information.
capture-name Name of the file to import. The Detector module appends the name of the file to the path that you defined for the network server by using the file-server command.
12-17Cisco Traffic Anomaly Detector Module Configuration Guide
OL-11857-01
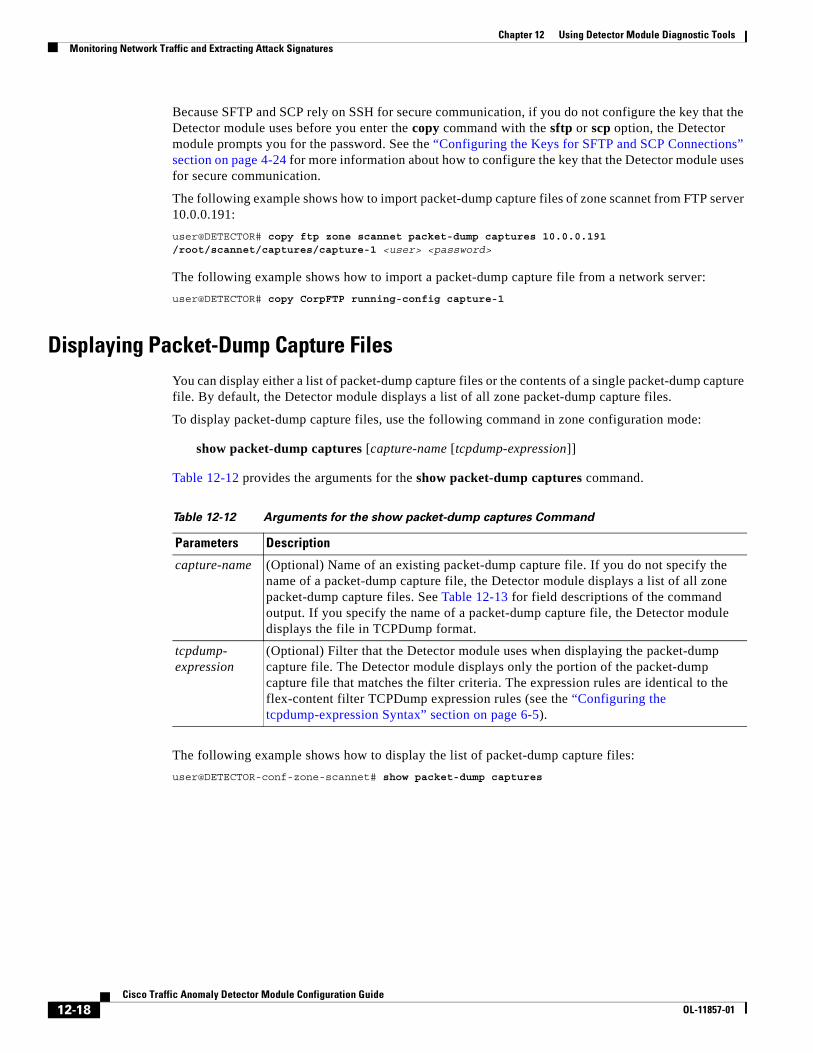
Chapter 12 Using Detector Module Diagnostic ToolsMonitoring Network Traffic and Extracting Attack Signatures
Because SFTP and SCP rely on SSH for secure communication, if you do not configure the key that the Detector module uses before you enter the copy command with the sftp or scp option, the Detector module prompts you for the password. See the “Configuring the Keys for SFTP and SCP Connections” section on page 4-24 for more information about how to configure the key that the Detector module uses for secure communication.
The following example shows how to import packet-dump capture files of zone scannet from FTP server 10.0.0.191:
user@DETECTOR# copy ftp zone scannet packet-dump captures 10.0.0.191 /root/scannet/captures/capture-1 <user> <password>
The following example shows how to import a packet-dump capture file from a network server:
user@DETECTOR# copy CorpFTP running-config capture-1
Displaying Packet-Dump Capture FilesYou can display either a list of packet-dump capture files or the contents of a single packet-dump capture file. By default, the Detector module displays a list of all zone packet-dump capture files.
To display packet-dump capture files, use the following command in zone configuration mode:
show packet-dump captures [capture-name [tcpdump-expression]]
Table 12-12 provides the arguments for the show packet-dump captures command.
The following example shows how to display the list of packet-dump capture files:
user@DETECTOR-conf-zone-scannet# show packet-dump captures
Table 12-12 Arguments for the show packet-dump captures Command
Parameters Description
capture-name (Optional) Name of an existing packet-dump capture file. If you do not specify the name of a packet-dump capture file, the Detector module displays a list of all zone packet-dump capture files. See Table 12-13 for field descriptions of the command output. If you specify the name of a packet-dump capture file, the Detector module displays the file in TCPDump format.
tcpdump- expression
(Optional) Filter that the Detector module uses when displaying the packet-dump capture file. The Detector module displays only the portion of the packet-dump capture file that matches the filter criteria. The expression rules are identical to the flex-content filter TCPDump expression rules (see the “Configuring the tcpdump-expression Syntax” section on page 6-5).
12-18Cisco Traffic Anomaly Detector Module Configuration Guide
OL-11857-01
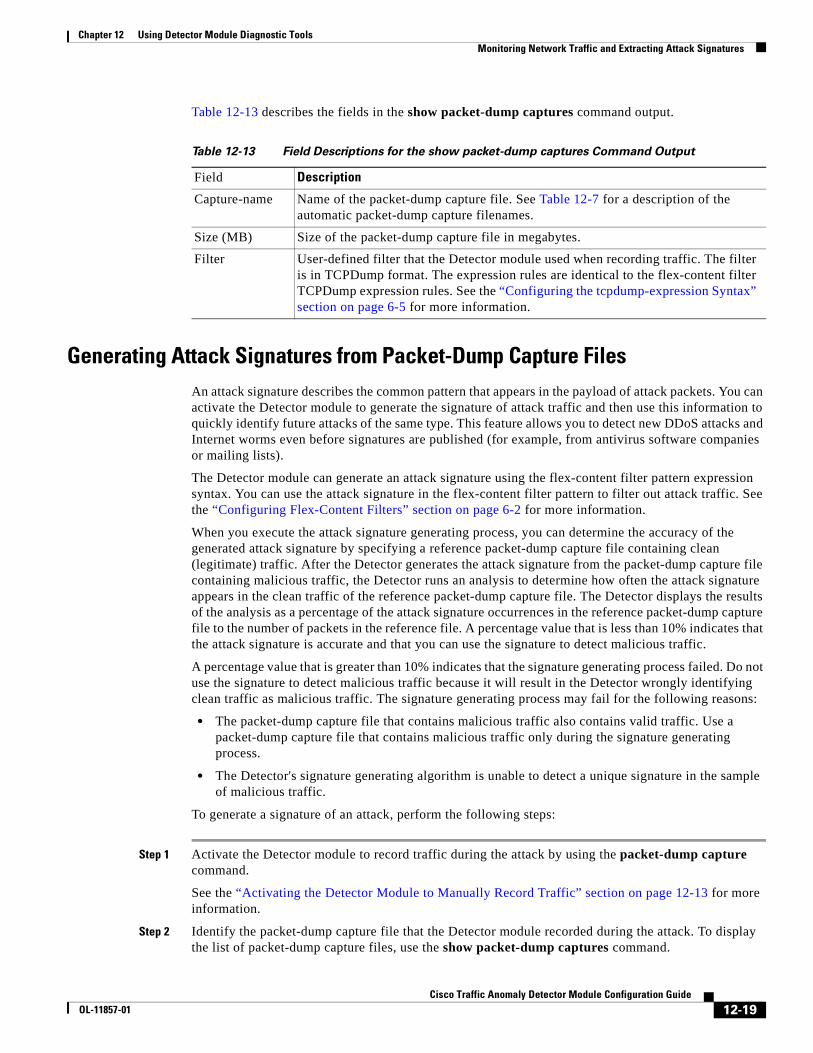
Chapter 12 Using Detector Module Diagnostic ToolsMonitoring Network Traffic and Extracting Attack Signatures
Table 12-13 describes the fields in the show packet-dump captures command output.
Generating Attack Signatures from Packet-Dump Capture FilesAn attack signature describes the common pattern that appears in the payload of attack packets. You can activate the Detector module to generate the signature of attack traffic and then use this information to quickly identify future attacks of the same type. This feature allows you to detect new DDoS attacks and Internet worms even before signatures are published (for example, from antivirus software companies or mailing lists).
The Detector module can generate an attack signature using the flex-content filter pattern expression syntax. You can use the attack signature in the flex-content filter pattern to filter out attack traffic. See the “Configuring Flex-Content Filters” section on page 6-2 for more information.
When you execute the attack signature generating process, you can determine the accuracy of the generated attack signature by specifying a reference packet-dump capture file containing clean (legitimate) traffic. After the Detector generates the attack signature from the packet-dump capture file containing malicious traffic, the Detector runs an analysis to determine how often the attack signature appears in the clean traffic of the reference packet-dump capture file. The Detector displays the results of the analysis as a percentage of the attack signature occurrences in the reference packet-dump capture file to the number of packets in the reference file. A percentage value that is less than 10% indicates that the attack signature is accurate and that you can use the signature to detect malicious traffic.
A percentage value that is greater than 10% indicates that the signature generating process failed. Do not use the signature to detect malicious traffic because it will result in the Detector wrongly identifying clean traffic as malicious traffic. The signature generating process may fail for the following reasons:
• The packet-dump capture file that contains malicious traffic also contains valid traffic. Use a packet-dump capture file that contains malicious traffic only during the signature generating process.
• The Detector's signature generating algorithm is unable to detect a unique signature in the sample of malicious traffic.
To generate a signature of an attack, perform the following steps:
Step 1 Activate the Detector module to record traffic during the attack by using the packet-dump capture command.
See the “Activating the Detector Module to Manually Record Traffic” section on page 12-13 for more information.
Step 2 Identify the packet-dump capture file that the Detector module recorded during the attack. To display the list of packet-dump capture files, use the show packet-dump captures command.
Table 12-13 Field Descriptions for the show packet-dump captures Command Output
Field Description
Capture-name Name of the packet-dump capture file. See Table 12-7 for a description of the automatic packet-dump capture filenames.
Size (MB) Size of the packet-dump capture file in megabytes.
Filter User-defined filter that the Detector module used when recording traffic. The filter is in TCPDump format. The expression rules are identical to the flex-content filter TCPDump expression rules. See the “Configuring the tcpdump-expression Syntax” section on page 6-5 for more information.
12-19Cisco Traffic Anomaly Detector Module Configuration Guide
OL-11857-01
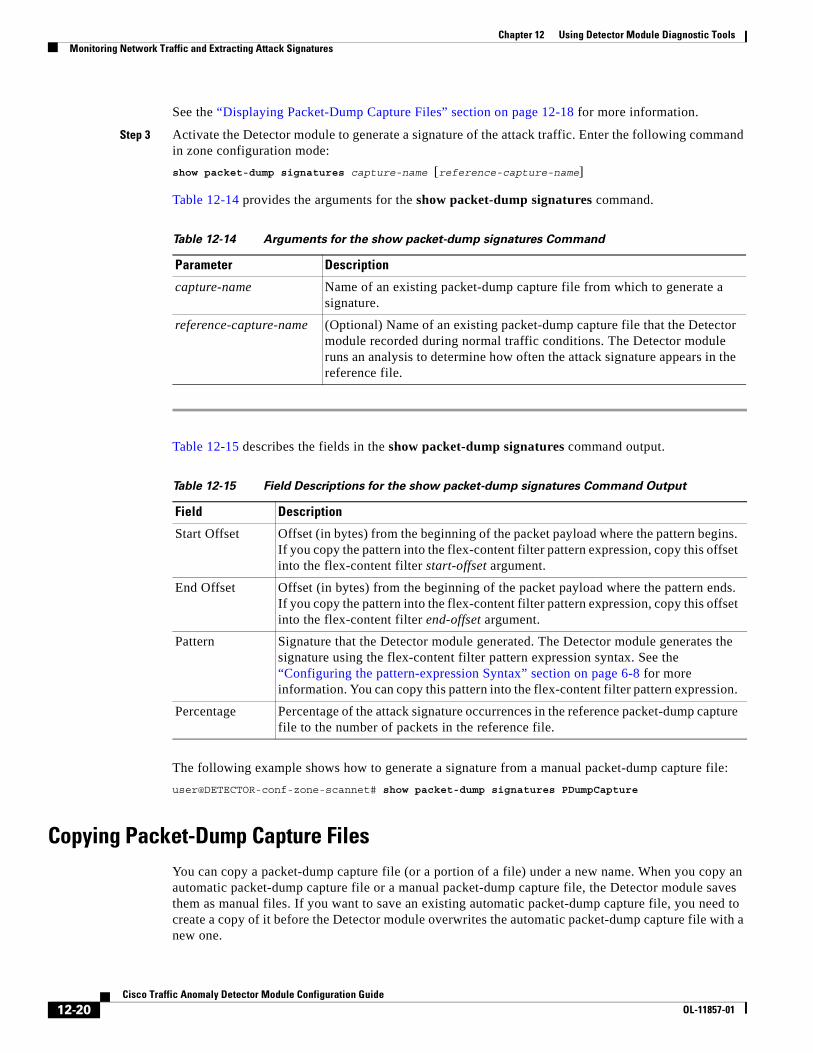
Chapter 12 Using Detector Module Diagnostic ToolsMonitoring Network Traffic and Extracting Attack Signatures
See the “Displaying Packet-Dump Capture Files” section on page 12-18 for more information.
Step 3 Activate the Detector module to generate a signature of the attack traffic. Enter the following command in zone configuration mode:
show packet-dump signatures capture-name [reference-capture-name]
Table 12-14 provides the arguments for the show packet-dump signatures command.
Table 12-15 describes the fields in the show packet-dump signatures command output.
The following example shows how to generate a signature from a manual packet-dump capture file:
user@DETECTOR-conf-zone-scannet# show packet-dump signatures PDumpCapture
Copying Packet-Dump Capture FilesYou can copy a packet-dump capture file (or a portion of a file) under a new name. When you copy an automatic packet-dump capture file or a manual packet-dump capture file, the Detector module saves them as manual files. If you want to save an existing automatic packet-dump capture file, you need to create a copy of it before the Detector module overwrites the automatic packet-dump capture file with a new one.
Table 12-14 Arguments for the show packet-dump signatures Command
Parameter Description
capture-name Name of an existing packet-dump capture file from which to generate a signature.
reference-capture-name (Optional) Name of an existing packet-dump capture file that the Detector module recorded during normal traffic conditions. The Detector module runs an analysis to determine how often the attack signature appears in the reference file.
Table 12-15 Field Descriptions for the show packet-dump signatures Command Output
Field Description
Start Offset Offset (in bytes) from the beginning of the packet payload where the pattern begins. If you copy the pattern into the flex-content filter pattern expression, copy this offset into the flex-content filter start-offset argument.
End Offset Offset (in bytes) from the beginning of the packet payload where the pattern ends. If you copy the pattern into the flex-content filter pattern expression, copy this offset into the flex-content filter end-offset argument.
Pattern Signature that the Detector module generated. The Detector module generates the signature using the flex-content filter pattern expression syntax. See the “Configuring the pattern-expression Syntax” section on page 6-8 for more information. You can copy this pattern into the flex-content filter pattern expression.
Percentage Percentage of the attack signature occurrences in the reference packet-dump capture file to the number of packets in the reference file.
12-20Cisco Traffic Anomaly Detector Module Configuration Guide
OL-11857-01
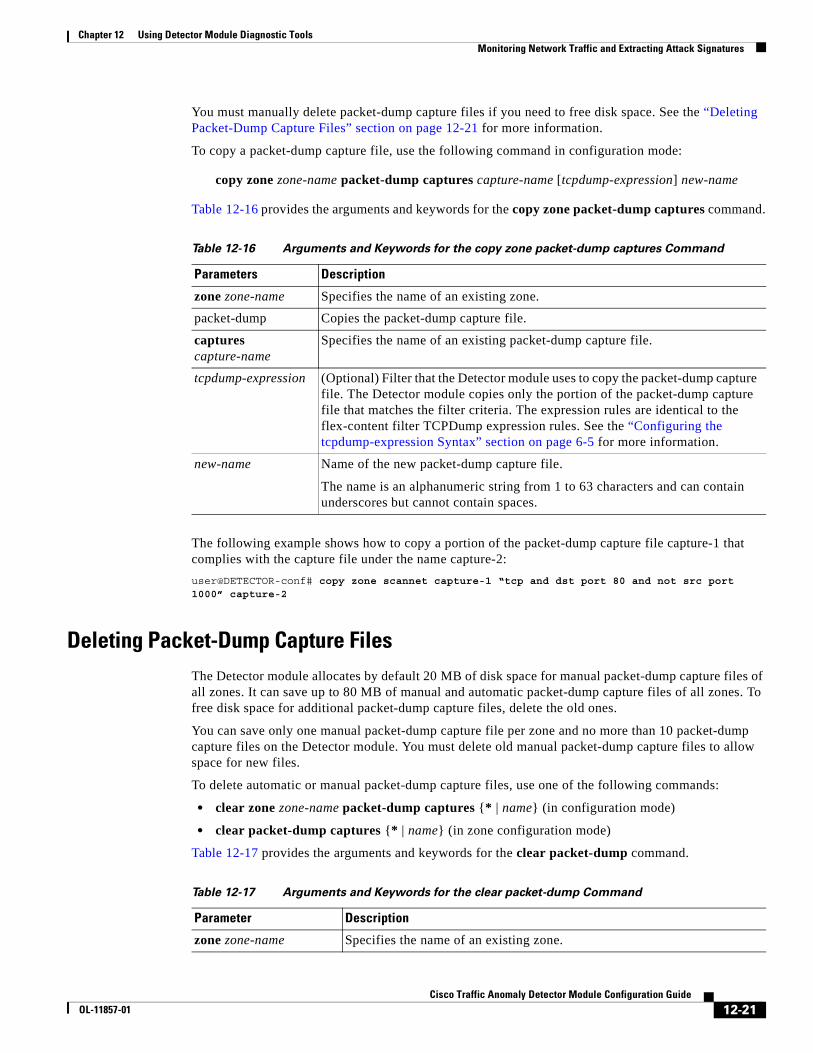
Chapter 12 Using Detector Module Diagnostic ToolsMonitoring Network Traffic and Extracting Attack Signatures
You must manually delete packet-dump capture files if you need to free disk space. See the “Deleting Packet-Dump Capture Files” section on page 12-21 for more information.
To copy a packet-dump capture file, use the following command in configuration mode:
copy zone zone-name packet-dump captures capture-name [tcpdump-expression] new-name
Table 12-16 provides the arguments and keywords for the copy zone packet-dump captures command.
The following example shows how to copy a portion of the packet-dump capture file capture-1 that complies with the capture file under the name capture-2:
user@DETECTOR-conf# copy zone scannet capture-1 “tcp and dst port 80 and not src port 1000” capture-2
Deleting Packet-Dump Capture FilesThe Detector module allocates by default 20 MB of disk space for manual packet-dump capture files of all zones. It can save up to 80 MB of manual and automatic packet-dump capture files of all zones. To free disk space for additional packet-dump capture files, delete the old ones.
You can save only one manual packet-dump capture file per zone and no more than 10 packet-dump capture files on the Detector module. You must delete old manual packet-dump capture files to allow space for new files.
To delete automatic or manual packet-dump capture files, use one of the following commands:
• clear zone zone-name packet-dump captures {* | name} (in configuration mode)
• clear packet-dump captures {* | name} (in zone configuration mode)
Table 12-17 provides the arguments and keywords for the clear packet-dump command.
Table 12-16 Arguments and Keywords for the copy zone packet-dump captures Command
Parameters Description
zone zone-name Specifies the name of an existing zone.
packet-dump Copies the packet-dump capture file.
captures capture-name
Specifies the name of an existing packet-dump capture file.
tcpdump-expression (Optional) Filter that the Detector module uses to copy the packet-dump capture file. The Detector module copies only the portion of the packet-dump capture file that matches the filter criteria. The expression rules are identical to the flex-content filter TCPDump expression rules. See the “Configuring the tcpdump-expression Syntax” section on page 6-5 for more information.
new-name Name of the new packet-dump capture file.
The name is an alphanumeric string from 1 to 63 characters and can contain underscores but cannot contain spaces.
Table 12-17 Arguments and Keywords for the clear packet-dump Command
Parameter Description
zone zone-name Specifies the name of an existing zone.
12-21Cisco Traffic Anomaly Detector Module Configuration Guide
OL-11857-01
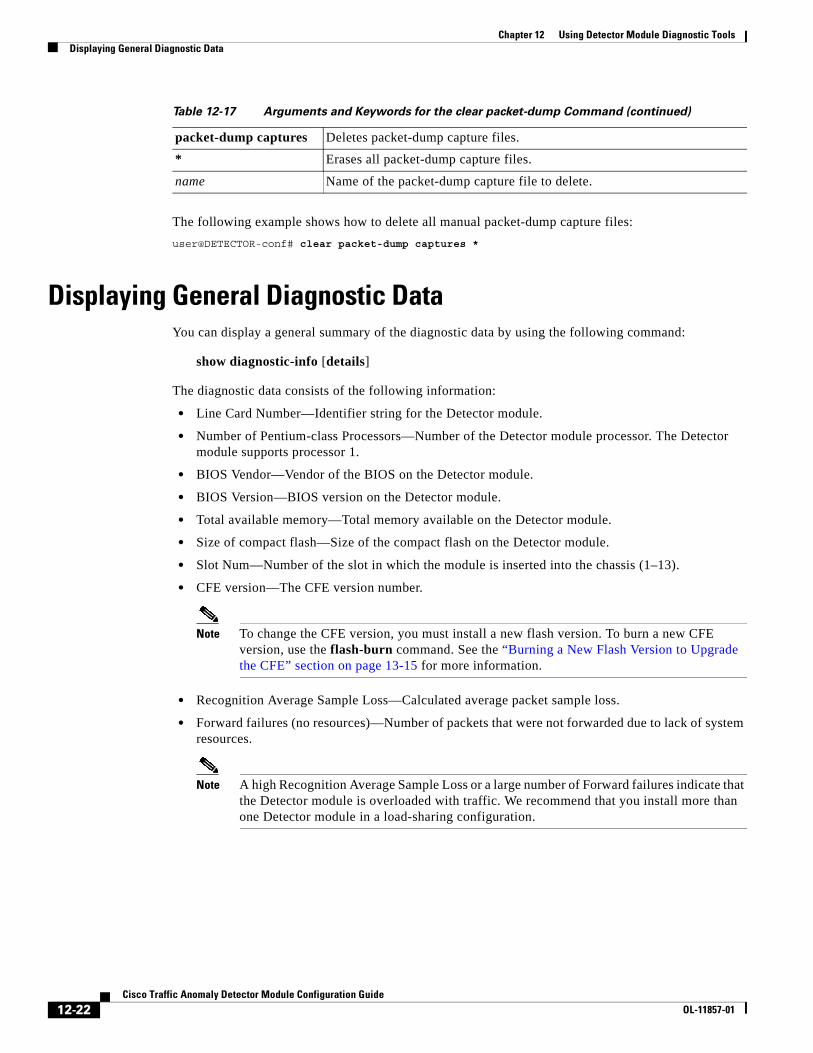
Chapter 12 Using Detector Module Diagnostic ToolsDisplaying General Diagnostic Data
The following example shows how to delete all manual packet-dump capture files:
user@DETECTOR-conf# clear packet-dump captures *
Displaying General Diagnostic DataYou can display a general summary of the diagnostic data by using the following command:
show diagnostic-info [details]
The diagnostic data consists of the following information:
• Line Card Number—Identifier string for the Detector module.
• Number of Pentium-class Processors—Number of the Detector module processor. The Detector module supports processor 1.
• BIOS Vendor—Vendor of the BIOS on the Detector module.
• BIOS Version—BIOS version on the Detector module.
• Total available memory—Total memory available on the Detector module.
• Size of compact flash—Size of the compact flash on the Detector module.
• Slot Num—Number of the slot in which the module is inserted into the chassis (1–13).
• CFE version—The CFE version number.
Note To change the CFE version, you must install a new flash version. To burn a new CFE version, use the flash-burn command. See the “Burning a New Flash Version to Upgrade the CFE” section on page 13-15 for more information.
• Recognition Average Sample Loss—Calculated average packet sample loss.
• Forward failures (no resources)—Number of packets that were not forwarded due to lack of system resources.
Note A high Recognition Average Sample Loss or a large number of Forward failures indicate that the Detector module is overloaded with traffic. We recommend that you install more than one Detector module in a load-sharing configuration.
packet-dump captures Deletes packet-dump capture files.
* Erases all packet-dump capture files.
name Name of the packet-dump capture file to delete.
Table 12-17 Arguments and Keywords for the clear packet-dump Command (continued)
12-22Cisco Traffic Anomaly Detector Module Configuration Guide
OL-11857-01
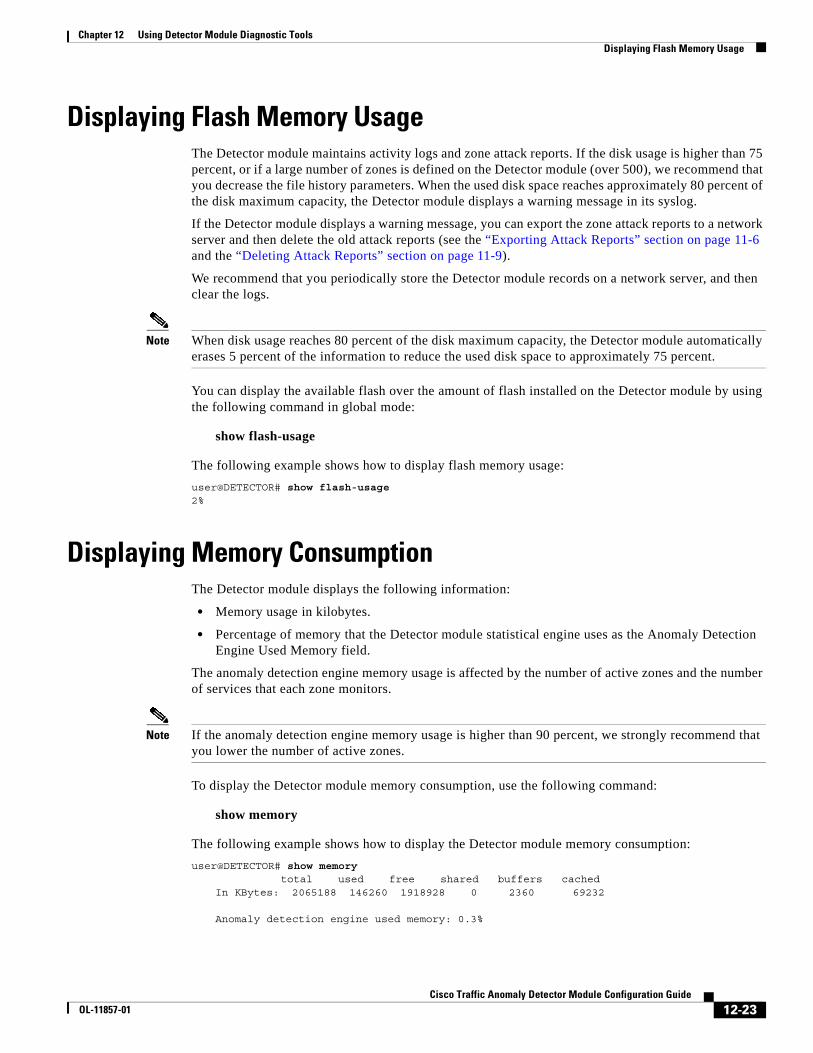
Chapter 12 Using Detector Module Diagnostic ToolsDisplaying Flash Memory Usage
Displaying Flash Memory UsageThe Detector module maintains activity logs and zone attack reports. If the disk usage is higher than 75 percent, or if a large number of zones is defined on the Detector module (over 500), we recommend that you decrease the file history parameters. When the used disk space reaches approximately 80 percent of the disk maximum capacity, the Detector module displays a warning message in its syslog.
If the Detector module displays a warning message, you can export the zone attack reports to a network server and then delete the old attack reports (see the “Exporting Attack Reports” section on page 11-6 and the “Deleting Attack Reports” section on page 11-9).
We recommend that you periodically store the Detector module records on a network server, and then clear the logs.
Note When disk usage reaches 80 percent of the disk maximum capacity, the Detector module automatically erases 5 percent of the information to reduce the used disk space to approximately 75 percent.
You can display the available flash over the amount of flash installed on the Detector module by using the following command in global mode:
show flash-usage
The following example shows how to display flash memory usage:
user@DETECTOR# show flash-usage2%
Displaying Memory ConsumptionThe Detector module displays the following information:
• Memory usage in kilobytes.
• Percentage of memory that the Detector module statistical engine uses as the Anomaly Detection Engine Used Memory field.
The anomaly detection engine memory usage is affected by the number of active zones and the number of services that each zone monitors.
Note If the anomaly detection engine memory usage is higher than 90 percent, we strongly recommend that you lower the number of active zones.
To display the Detector module memory consumption, use the following command:
show memory
The following example shows how to display the Detector module memory consumption:
user@DETECTOR# show memory total used free shared buffers cached
In KBytes: 2065188 146260 1918928 0 2360 69232
Anomaly detection engine used memory: 0.3%
12-23Cisco Traffic Anomaly Detector Module Configuration Guide
OL-11857-01
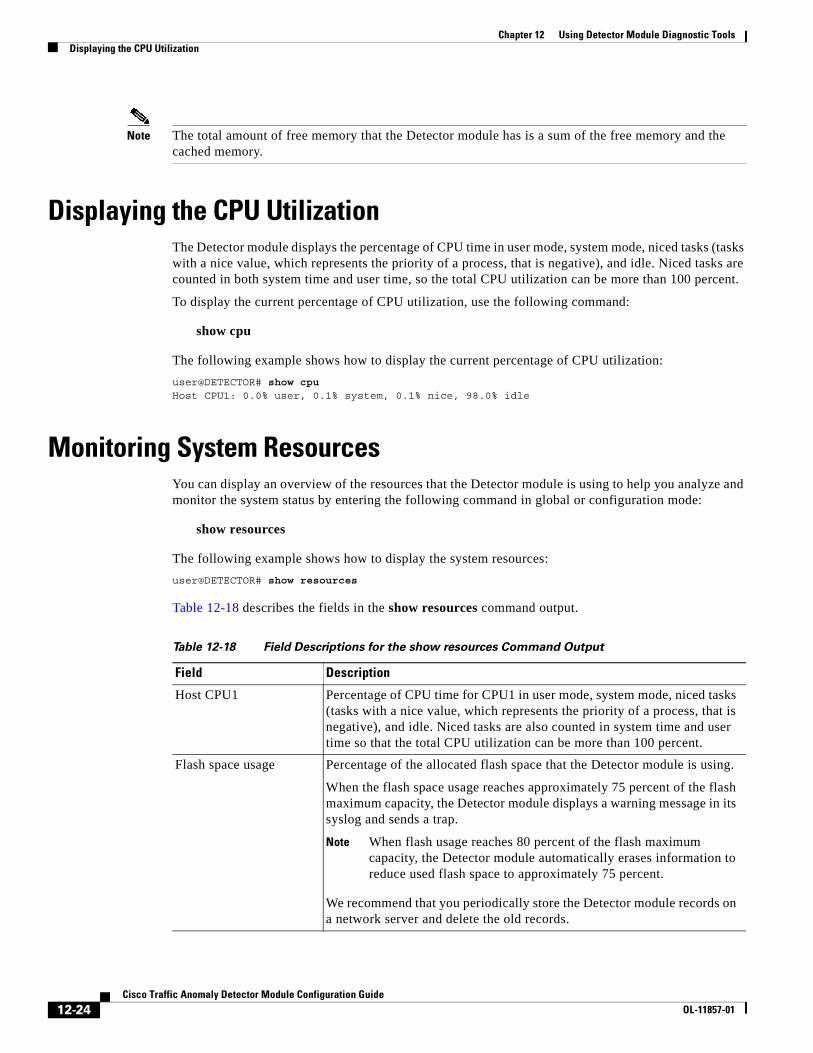
Chapter 12 Using Detector Module Diagnostic ToolsDisplaying the CPU Utilization
Note The total amount of free memory that the Detector module has is a sum of the free memory and the cached memory.
Displaying the CPU UtilizationThe Detector module displays the percentage of CPU time in user mode, system mode, niced tasks (tasks with a nice value, which represents the priority of a process, that is negative), and idle. Niced tasks are counted in both system time and user time, so the total CPU utilization can be more than 100 percent.
To display the current percentage of CPU utilization, use the following command:
show cpu
The following example shows how to display the current percentage of CPU utilization:
user@DETECTOR# show cpuHost CPU1: 0.0% user, 0.1% system, 0.1% nice, 98.0% idle
Monitoring System ResourcesYou can display an overview of the resources that the Detector module is using to help you analyze and monitor the system status by entering the following command in global or configuration mode:
show resources
The following example shows how to display the system resources:
user@DETECTOR# show resources
Table 12-18 describes the fields in the show resources command output.
Table 12-18 Field Descriptions for the show resources Command Output
Field Description
Host CPU1 Percentage of CPU time for CPU1 in user mode, system mode, niced tasks (tasks with a nice value, which represents the priority of a process, that is negative), and idle. Niced tasks are also counted in system time and user time so that the total CPU utilization can be more than 100 percent.
Flash space usage Percentage of the allocated flash space that the Detector module is using.
When the flash space usage reaches approximately 75 percent of the flash maximum capacity, the Detector module displays a warning message in its syslog and sends a trap.
Note When flash usage reaches 80 percent of the flash maximum capacity, the Detector module automatically erases information to reduce used flash space to approximately 75 percent.
We recommend that you periodically store the Detector module records on a network server and delete the old records.
12-24Cisco Traffic Anomaly Detector Module Configuration Guide
OL-11857-01
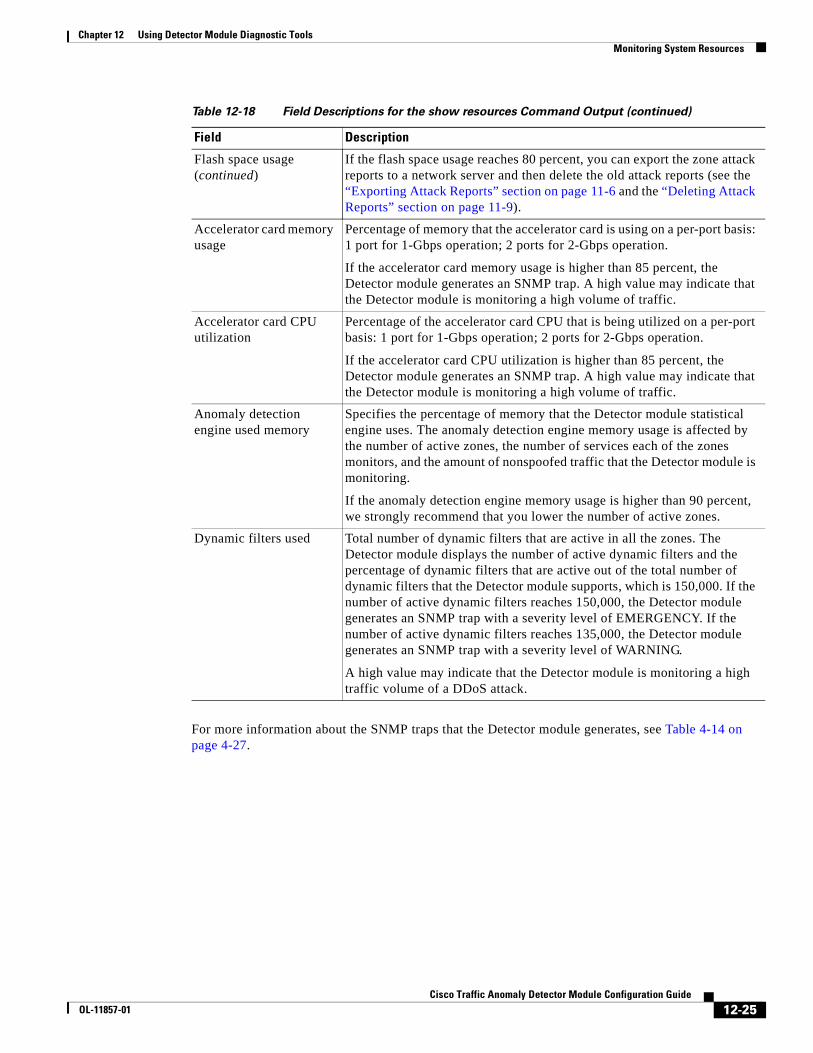
Chapter 12 Using Detector Module Diagnostic ToolsMonitoring System Resources
For more information about the SNMP traps that the Detector module generates, see Table 4-14 on page 4-27.
Flash space usage (continued)
If the flash space usage reaches 80 percent, you can export the zone attack reports to a network server and then delete the old attack reports (see the “Exporting Attack Reports” section on page 11-6 and the “Deleting Attack Reports” section on page 11-9).
Accelerator card memory usage
Percentage of memory that the accelerator card is using on a per-port basis: 1 port for 1-Gbps operation; 2 ports for 2-Gbps operation.
If the accelerator card memory usage is higher than 85 percent, the Detector module generates an SNMP trap. A high value may indicate that the Detector module is monitoring a high volume of traffic.
Accelerator card CPU utilization
Percentage of the accelerator card CPU that is being utilized on a per-port basis: 1 port for 1-Gbps operation; 2 ports for 2-Gbps operation.
If the accelerator card CPU utilization is higher than 85 percent, the Detector module generates an SNMP trap. A high value may indicate that the Detector module is monitoring a high volume of traffic.
Anomaly detection engine used memory
Specifies the percentage of memory that the Detector module statistical engine uses. The anomaly detection engine memory usage is affected by the number of active zones, the number of services each of the zones monitors, and the amount of nonspoofed traffic that the Detector module is monitoring.
If the anomaly detection engine memory usage is higher than 90 percent, we strongly recommend that you lower the number of active zones.
Dynamic filters used Total number of dynamic filters that are active in all the zones. The Detector module displays the number of active dynamic filters and the percentage of dynamic filters that are active out of the total number of dynamic filters that the Detector module supports, which is 150,000. If the number of active dynamic filters reaches 150,000, the Detector module generates an SNMP trap with a severity level of EMERGENCY. If the number of active dynamic filters reaches 135,000, the Detector module generates an SNMP trap with a severity level of WARNING.
A high value may indicate that the Detector module is monitoring a high traffic volume of a DDoS attack.
Table 12-18 Field Descriptions for the show resources Command Output (continued)
Field Description
12-25Cisco Traffic Anomaly Detector Module Configuration Guide
OL-11857-01
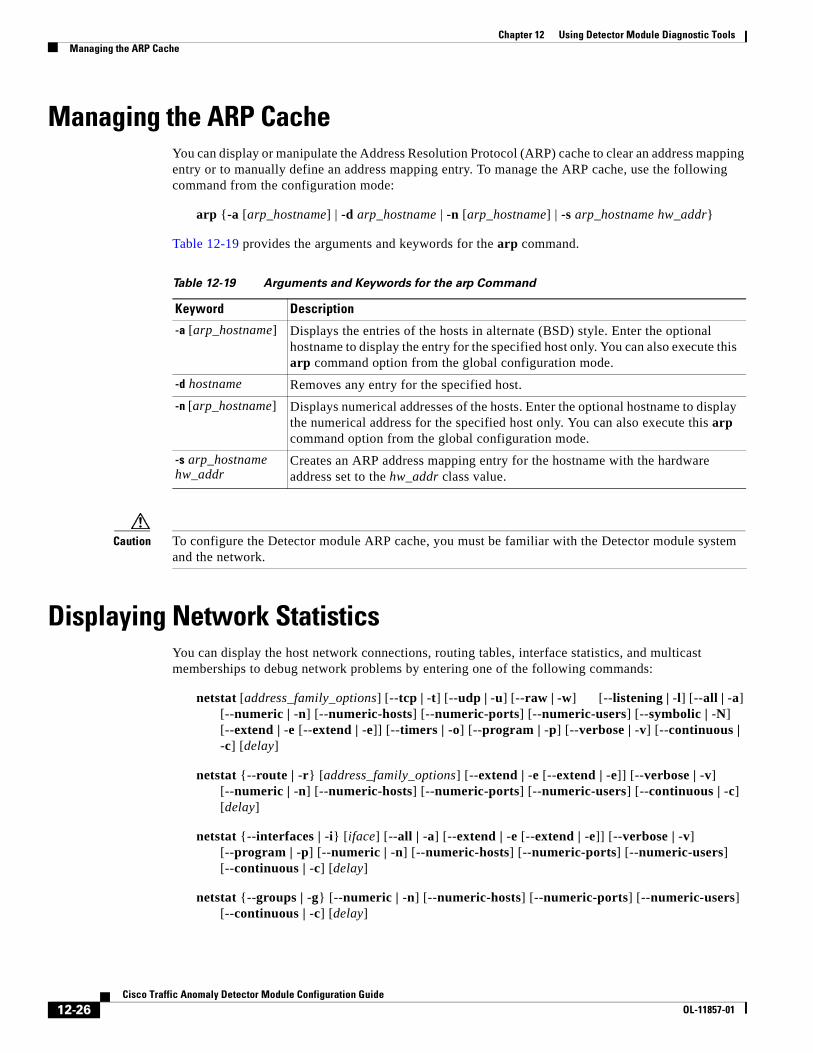
Chapter 12 Using Detector Module Diagnostic ToolsManaging the ARP Cache
Managing the ARP CacheYou can display or manipulate the Address Resolution Protocol (ARP) cache to clear an address mapping entry or to manually define an address mapping entry. To manage the ARP cache, use the following command from the configuration mode:
arp {-a [arp_hostname] | -d arp_hostname | -n [arp_hostname] | -s arp_hostname hw_addr}
Table 12-19 provides the arguments and keywords for the arp command.
Caution To configure the Detector module ARP cache, you must be familiar with the Detector module system and the network.
Displaying Network StatisticsYou can display the host network connections, routing tables, interface statistics, and multicast memberships to debug network problems by entering one of the following commands:
netstat [address_family_options] [--tcp | -t] [--udp | -u] [--raw | -w] [--listening | -l] [--all | -a] [--numeric | -n] [--numeric-hosts] [--numeric-ports] [--numeric-users] [--symbolic | -N] [--extend | -e [--extend | -e]] [--timers | -o] [--program | -p] [--verbose | -v] [--continuous | -c] [delay]
netstat {--route | -r} [address_family_options] [--extend | -e [--extend | -e]] [--verbose | -v] [--numeric | -n] [--numeric-hosts] [--numeric-ports] [--numeric-users] [--continuous | -c] [delay]
netstat {--interfaces | -i} [iface] [--all | -a] [--extend | -e [--extend | -e]] [--verbose | -v] [--program | -p] [--numeric | -n] [--numeric-hosts] [--numeric-ports] [--numeric-users] [--continuous | -c] [delay]
netstat {--groups | -g} [--numeric | -n] [--numeric-hosts] [--numeric-ports] [--numeric-users] [--continuous | -c] [delay]
Table 12-19 Arguments and Keywords for the arp Command
Keyword Description
-a [arp_hostname] Displays the entries of the hosts in alternate (BSD) style. Enter the optional hostname to display the entry for the specified host only. You can also execute this arp command option from the global configuration mode.
-d hostname Removes any entry for the specified host.
-n [arp_hostname] Displays numerical addresses of the hosts. Enter the optional hostname to display the numerical address for the specified host only. You can also execute this arp command option from the global configuration mode.
-s arp_hostname hw_addr
Creates an ARP address mapping entry for the hostname with the hardware address set to the hw_addr class value.
12-26Cisco Traffic Anomaly Detector Module Configuration Guide
OL-11857-01
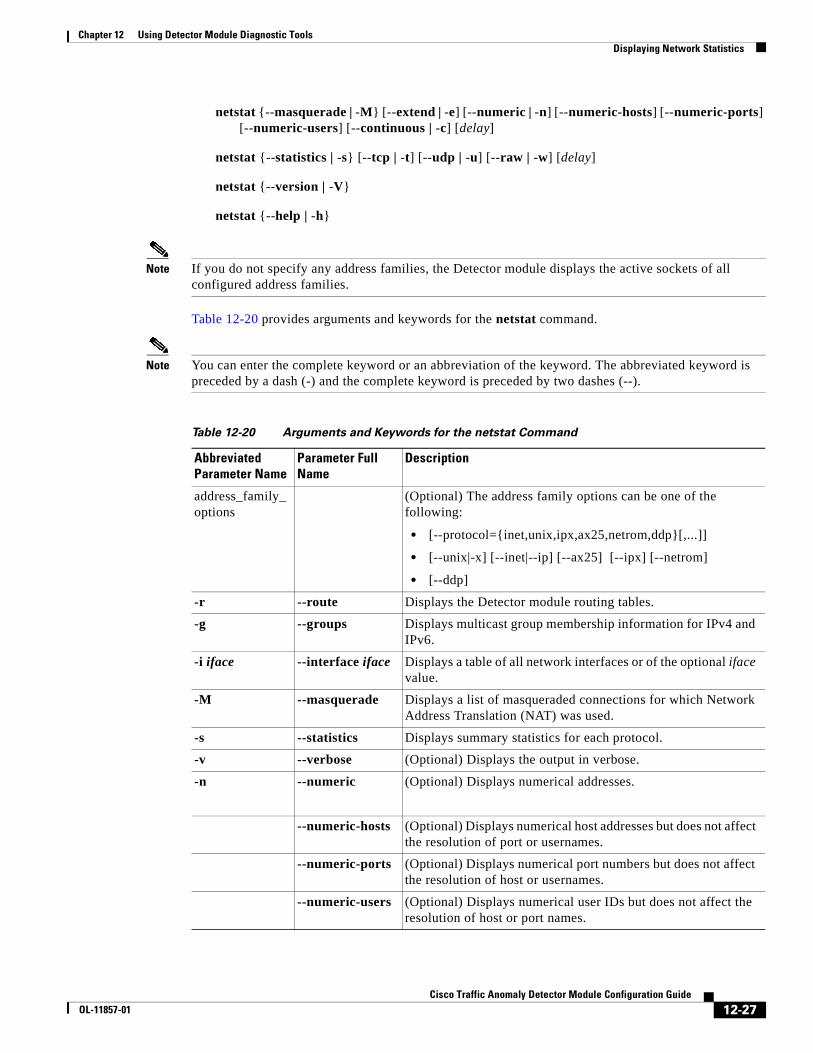
Chapter 12 Using Detector Module Diagnostic ToolsDisplaying Network Statistics
netstat {--masquerade | -M} [--extend | -e] [--numeric | -n] [--numeric-hosts] [--numeric-ports] [--numeric-users] [--continuous | -c] [delay]
netstat {--statistics | -s} [--tcp | -t] [--udp | -u] [--raw | -w] [delay]
netstat {--version | -V}
netstat {--help | -h}
Note If you do not specify any address families, the Detector module displays the active sockets of all configured address families.
Table 12-20 provides arguments and keywords for the netstat command.
Note You can enter the complete keyword or an abbreviation of the keyword. The abbreviated keyword is preceded by a dash (-) and the complete keyword is preceded by two dashes (--).
Table 12-20 Arguments and Keywords for the netstat Command
Abbreviated Parameter Name
Parameter Full Name
Description
address_family_ options
(Optional) The address family options can be one of the following:
• [--protocol={inet,unix,ipx,ax25,netrom,ddp}[,...]]
• [--unix|-x] [--inet|--ip] [--ax25] [--ipx] [--netrom]
• [--ddp]
-r --route Displays the Detector module routing tables.
-g --groups Displays multicast group membership information for IPv4 and IPv6.
-i iface --interface iface Displays a table of all network interfaces or of the optional iface value.
-M --masquerade Displays a list of masqueraded connections for which Network Address Translation (NAT) was used.
-s --statistics Displays summary statistics for each protocol.
-v --verbose (Optional) Displays the output in verbose.
-n --numeric (Optional) Displays numerical addresses.
--numeric-hosts (Optional) Displays numerical host addresses but does not affect the resolution of port or usernames.
--numeric-ports (Optional) Displays numerical port numbers but does not affect the resolution of host or usernames.
--numeric-users (Optional) Displays numerical user IDs but does not affect the resolution of host or port names.
12-27Cisco Traffic Anomaly Detector Module Configuration Guide
OL-11857-01
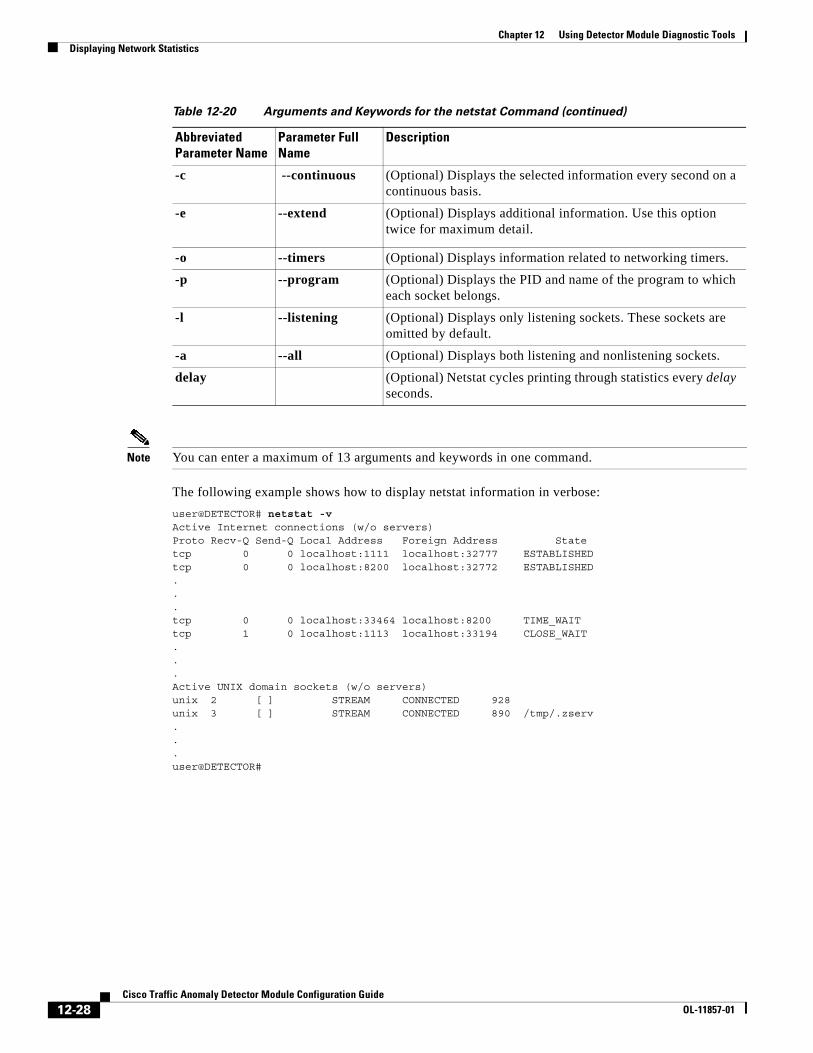
Chapter 12 Using Detector Module Diagnostic ToolsDisplaying Network Statistics
Note You can enter a maximum of 13 arguments and keywords in one command.
The following example shows how to display netstat information in verbose:
user@DETECTOR# netstat -vActive Internet connections (w/o servers)Proto Recv-Q Send-Q Local Address Foreign Address Statetcp 0 0 localhost:1111 localhost:32777 ESTABLISHEDtcp 0 0 localhost:8200 localhost:32772 ESTABLISHED...tcp 0 0 localhost:33464 localhost:8200 TIME_WAITtcp 1 0 localhost:1113 localhost:33194 CLOSE_WAIT...Active UNIX domain sockets (w/o servers)unix 2 [ ] STREAM CONNECTED 928unix 3 [ ] STREAM CONNECTED 890 /tmp/.zserv...user@DETECTOR#
-c --continuous (Optional) Displays the selected information every second on a continuous basis.
-e --extend (Optional) Displays additional information. Use this option twice for maximum detail.
-o --timers (Optional) Displays information related to networking timers.
-p --program (Optional) Displays the PID and name of the program to which each socket belongs.
-l --listening (Optional) Displays only listening sockets. These sockets are omitted by default.
-a --all (Optional) Displays both listening and nonlistening sockets.
delay (Optional) Netstat cycles printing through statistics every delay seconds.
Table 12-20 Arguments and Keywords for the netstat Command (continued)
Abbreviated Parameter Name
Parameter Full Name
Description
12-28Cisco Traffic Anomaly Detector Module Configuration Guide
OL-11857-01
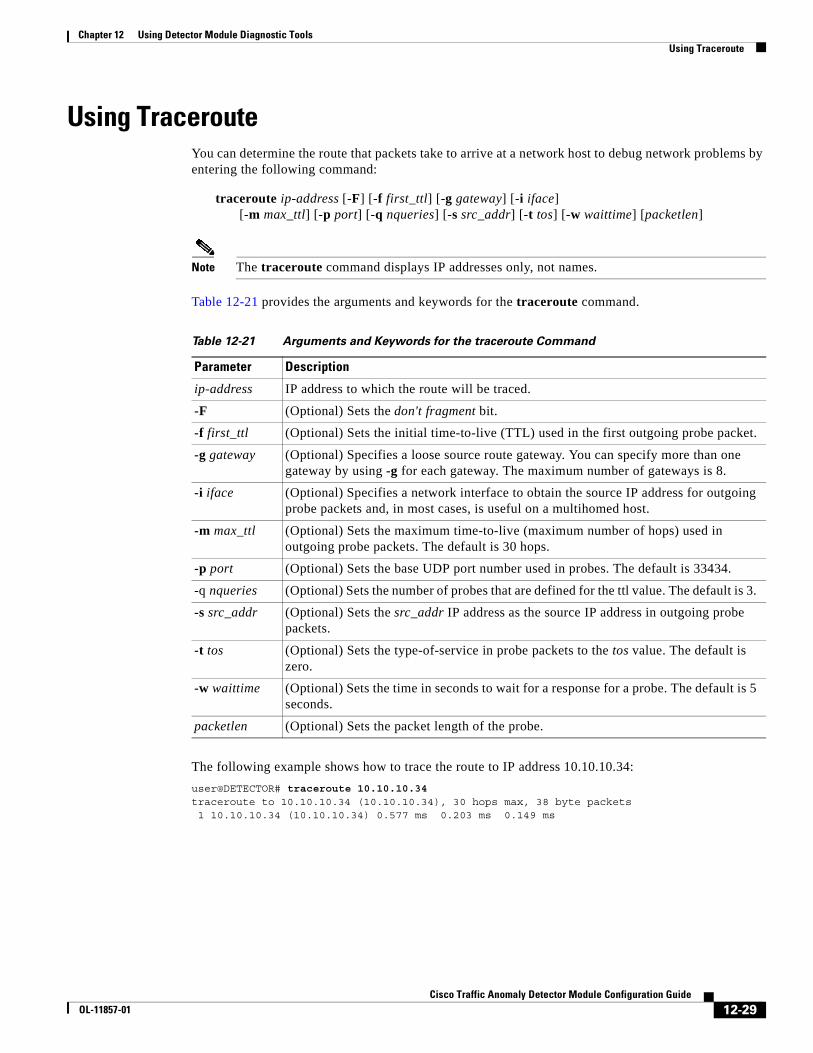
Chapter 12 Using Detector Module Diagnostic ToolsUsing Traceroute
Using TracerouteYou can determine the route that packets take to arrive at a network host to debug network problems by entering the following command:
traceroute ip-address [-F] [-f first_ttl] [-g gateway] [-i iface] [-m max_ttl] [-p port] [-q nqueries] [-s src_addr] [-t tos] [-w waittime] [packetlen]
Note The traceroute command displays IP addresses only, not names.
Table 12-21 provides the arguments and keywords for the traceroute command.
The following example shows how to trace the route to IP address 10.10.10.34:
user@DETECTOR# traceroute 10.10.10.34traceroute to 10.10.10.34 (10.10.10.34), 30 hops max, 38 byte packets 1 10.10.10.34 (10.10.10.34) 0.577 ms 0.203 ms 0.149 ms
Table 12-21 Arguments and Keywords for the traceroute Command
Parameter Description
ip-address IP address to which the route will be traced.
-F (Optional) Sets the don't fragment bit.
-f first_ttl (Optional) Sets the initial time-to-live (TTL) used in the first outgoing probe packet.
-g gateway (Optional) Specifies a loose source route gateway. You can specify more than one gateway by using -g for each gateway. The maximum number of gateways is 8.
-i iface (Optional) Specifies a network interface to obtain the source IP address for outgoing probe packets and, in most cases, is useful on a multihomed host.
-m max_ttl (Optional) Sets the maximum time-to-live (maximum number of hops) used in outgoing probe packets. The default is 30 hops.
-p port (Optional) Sets the base UDP port number used in probes. The default is 33434.
-q nqueries (Optional) Sets the number of probes that are defined for the ttl value. The default is 3.
-s src_addr (Optional) Sets the src_addr IP address as the source IP address in outgoing probe packets.
-t tos (Optional) Sets the type-of-service in probe packets to the tos value. The default is zero.
-w waittime (Optional) Sets the time in seconds to wait for a response for a probe. The default is 5 seconds.
packetlen (Optional) Sets the packet length of the probe.
12-29Cisco Traffic Anomaly Detector Module Configuration Guide
OL-11857-01
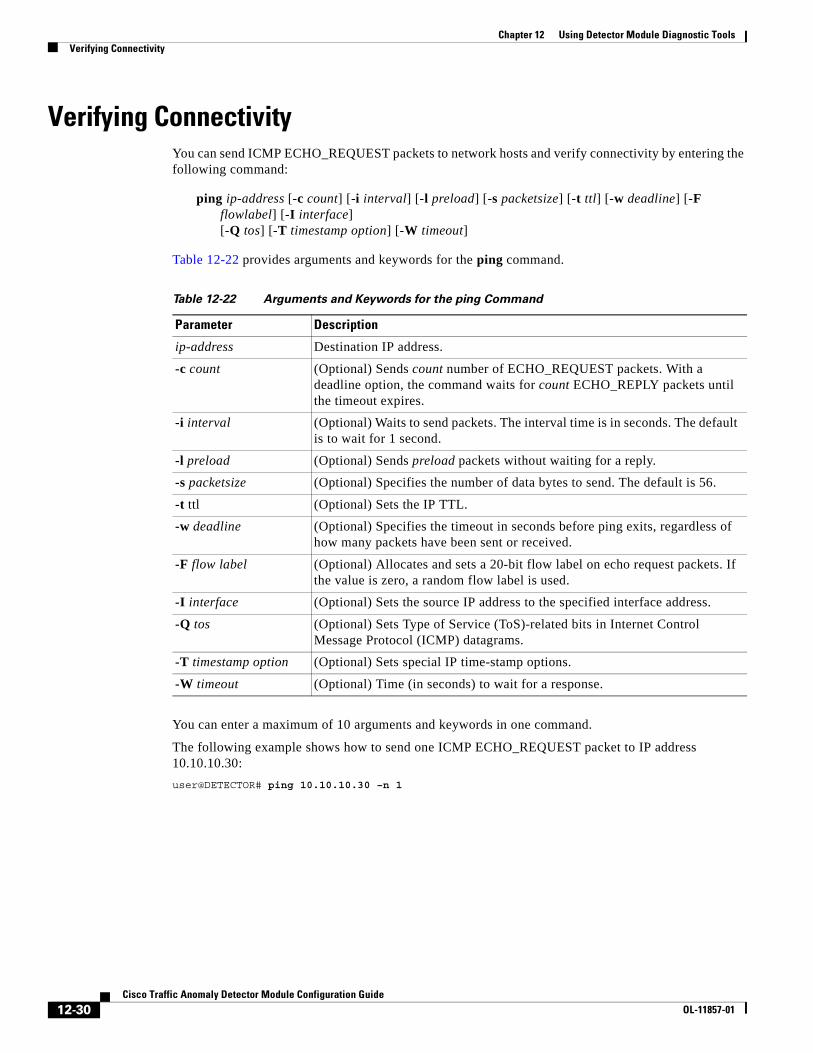
Chapter 12 Using Detector Module Diagnostic ToolsVerifying Connectivity
Verifying ConnectivityYou can send ICMP ECHO_REQUEST packets to network hosts and verify connectivity by entering the following command:
ping ip-address [-c count] [-i interval] [-l preload] [-s packetsize] [-t ttl] [-w deadline] [-F flowlabel] [-I interface] [-Q tos] [-T timestamp option] [-W timeout]
Table 12-22 provides arguments and keywords for the ping command.
You can enter a maximum of 10 arguments and keywords in one command.
The following example shows how to send one ICMP ECHO_REQUEST packet to IP address 10.10.10.30:
user@DETECTOR# ping 10.10.10.30 –n 1
Table 12-22 Arguments and Keywords for the ping Command
Parameter Description
ip-address Destination IP address.
-c count (Optional) Sends count number of ECHO_REQUEST packets. With a deadline option, the command waits for count ECHO_REPLY packets until the timeout expires.
-i interval (Optional) Waits to send packets. The interval time is in seconds. The default is to wait for 1 second.
-l preload (Optional) Sends preload packets without waiting for a reply.
-s packetsize (Optional) Specifies the number of data bytes to send. The default is 56.
-t ttl (Optional) Sets the IP TTL.
-w deadline (Optional) Specifies the timeout in seconds before ping exits, regardless of how many packets have been sent or received.
-F flow label (Optional) Allocates and sets a 20-bit flow label on echo request packets. If the value is zero, a random flow label is used.
-I interface (Optional) Sets the source IP address to the specified interface address.
-Q tos (Optional) Sets Type of Service (ToS)-related bits in Internet Control Message Protocol (ICMP) datagrams.
-T timestamp option (Optional) Sets special IP time-stamp options.
-W timeout (Optional) Time (in seconds) to wait for a response.
12-30Cisco Traffic Anomaly Detector Module Configuration Guide
OL-11857-01
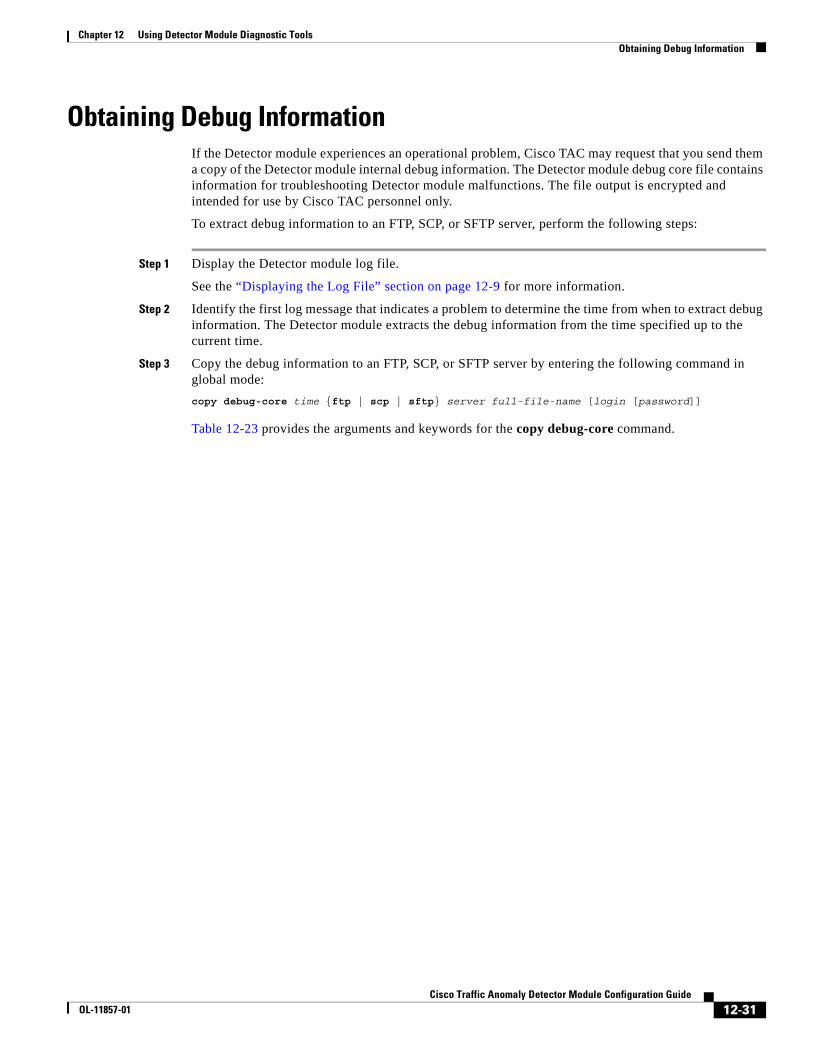
Chapter 12 Using Detector Module Diagnostic ToolsObtaining Debug Information
Obtaining Debug InformationIf the Detector module experiences an operational problem, Cisco TAC may request that you send them a copy of the Detector module internal debug information. The Detector module debug core file contains information for troubleshooting Detector module malfunctions. The file output is encrypted and intended for use by Cisco TAC personnel only.
To extract debug information to an FTP, SCP, or SFTP server, perform the following steps:
Step 1 Display the Detector module log file.
See the “Displaying the Log File” section on page 12-9 for more information.
Step 2 Identify the first log message that indicates a problem to determine the time from when to extract debug information. The Detector module extracts the debug information from the time specified up to the current time.
Step 3 Copy the debug information to an FTP, SCP, or SFTP server by entering the following command in global mode:
copy debug-core time {ftp | scp | sftp} server full-file-name [login [password]]
Table 12-23 provides the arguments and keywords for the copy debug-core command.
12-31Cisco Traffic Anomaly Detector Module Configuration Guide
OL-11857-01
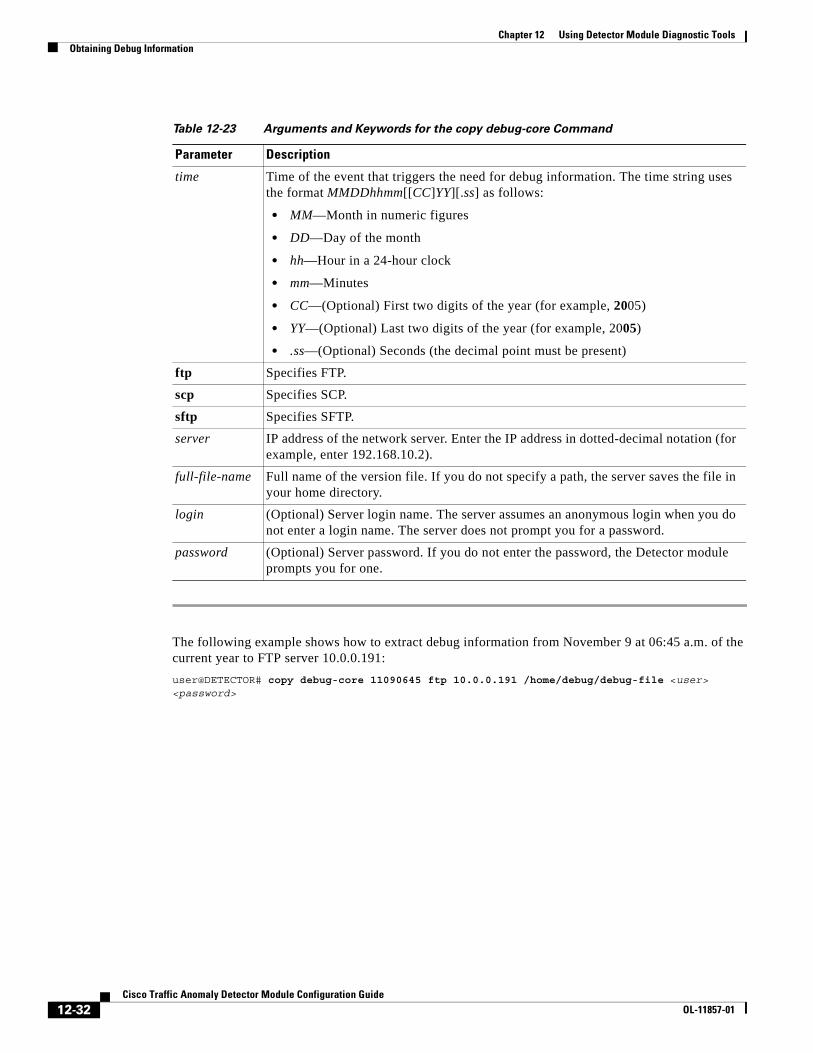
Chapter 12 Using Detector Module Diagnostic ToolsObtaining Debug Information
The following example shows how to extract debug information from November 9 at 06:45 a.m. of the current year to FTP server 10.0.0.191:
user@DETECTOR# copy debug-core 11090645 ftp 10.0.0.191 /home/debug/debug-file <user> <password>
Table 12-23 Arguments and Keywords for the copy debug-core Command
Parameter Description
time Time of the event that triggers the need for debug information. The time string uses the format MMDDhhmm[[CC]YY][.ss] as follows:
• MM—Month in numeric figures
• DD—Day of the month
• hh—Hour in a 24-hour clock
• mm—Minutes
• CC—(Optional) First two digits of the year (for example, 2005)
• YY—(Optional) Last two digits of the year (for example, 2005)
• .ss—(Optional) Seconds (the decimal point must be present)
ftp Specifies FTP.
scp Specifies SCP.
sftp Specifies SFTP.
server IP address of the network server. Enter the IP address in dotted-decimal notation (for example, enter 192.168.10.2).
full-file-name Full name of the version file. If you do not specify a path, the server saves the file in your home directory.
login (Optional) Server login name. The server assumes an anonymous login when you do not enter a login name. The server does not prompt you for a password.
password (Optional) Server password. If you do not enter the password, the Detector module prompts you for one.
12-32Cisco Traffic Anomaly Detector Module Configuration Guide
OL-11857-01
Cisco TraOL-11857-01
C H A P T E R 13
Performing Maintenance TasksThis chapter describes how to perform tasks used for general care and maintenance of the Cisco Traffic Anomaly Detector Module (Detector module).
Note Operational and configuration differences exist between a Detector module operating at 1 Gbps and a Detector module operating at 2 Gbps. This chapter discusses the differences between the 1-Gbps operation and the 2-Gbps operation. Unless stated, the information in this chapter applies to both modes of operation. For more information, see the “Understanding the 1-Gbps and 2-Gbps Bandwidth Options” section on page 1-6.
This chapter refers to the Cisco Guard (Guard), the companion product of the Detector module. The Guard is a Distributed Denial of Service (DDoS) attack detection and mitigation device that cleans the zone traffic as the traffic flows through it, dropping the attack traffic and injecting the legitimate traffic back into the network. When the Detector module determines that the zone is under attack, it can activate the Guard attack mitigation services. The Detector module can also synchronize zone configurations with the Guard. For more information about the Guard, see the Cisco Anomaly Guard Module Configuration Guide or the Cisco Guard Configuration Guide.
This chapter contains the following sections:
• Configuring File Servers
• Exporting the Configuration
• Importing and Updating the Configuration
• Exporting Files Automatically to a Network Server
• Reloading the Detector Module
• Rebooting the Detector Module and Inactivating Zones
• Upgrading the Detector Module Software
• Upgrading the Bandwidth Performance from 1 Gbps to 2 Gbps
• Using MP Commands
• Recovering from a Lost Password Condition
• Resetting the Detector Module Configuration to Factory Default Values
13-1ffic Anomaly Detector Module Configuration Guide
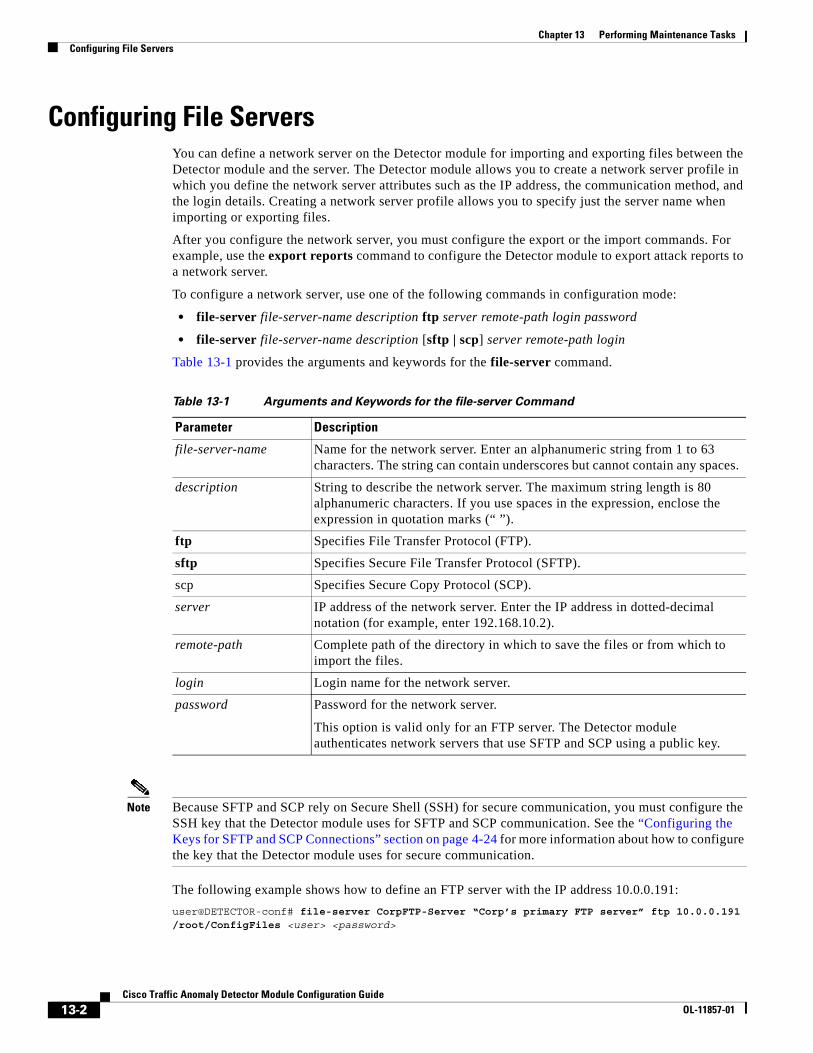
Chapter 13 Performing Maintenance TasksConfiguring File Servers
Configuring File ServersYou can define a network server on the Detector module for importing and exporting files between the Detector module and the server. The Detector module allows you to create a network server profile in which you define the network server attributes such as the IP address, the communication method, and the login details. Creating a network server profile allows you to specify just the server name when importing or exporting files.
After you configure the network server, you must configure the export or the import commands. For example, use the export reports command to configure the Detector module to export attack reports to a network server.
To configure a network server, use one of the following commands in configuration mode:
• file-server file-server-name description ftp server remote-path login password
• file-server file-server-name description [sftp | scp] server remote-path login
Table 13-1 provides the arguments and keywords for the file-server command.
Note Because SFTP and SCP rely on Secure Shell (SSH) for secure communication, you must configure the SSH key that the Detector module uses for SFTP and SCP communication. See the “Configuring the Keys for SFTP and SCP Connections” section on page 4-24 for more information about how to configure the key that the Detector module uses for secure communication.
The following example shows how to define an FTP server with the IP address 10.0.0.191:
user@DETECTOR-conf# file-server CorpFTP-Server “Corp’s primary FTP server” ftp 10.0.0.191 /root/ConfigFiles <user> <password>
Table 13-1 Arguments and Keywords for the file-server Command
Parameter Description
file-server-name Name for the network server. Enter an alphanumeric string from 1 to 63 characters. The string can contain underscores but cannot contain any spaces.
description String to describe the network server. The maximum string length is 80 alphanumeric characters. If you use spaces in the expression, enclose the expression in quotation marks (“ ”).
ftp Specifies File Transfer Protocol (FTP).
sftp Specifies Secure File Transfer Protocol (SFTP).
scp Specifies Secure Copy Protocol (SCP).
server IP address of the network server. Enter the IP address in dotted-decimal notation (for example, enter 192.168.10.2).
remote-path Complete path of the directory in which to save the files or from which to import the files.
login Login name for the network server.
password Password for the network server.
This option is valid only for an FTP server. The Detector module authenticates network servers that use SFTP and SCP using a public key.
13-2Cisco Traffic Anomaly Detector Module Configuration Guide
OL-11857-01
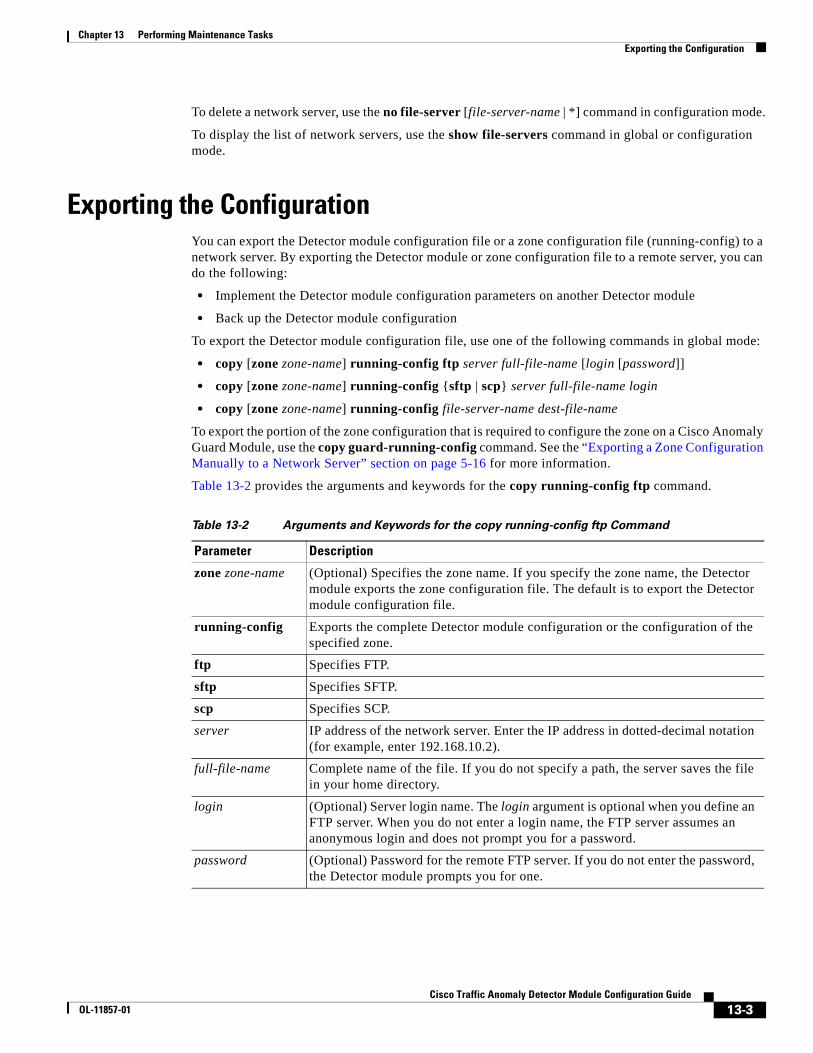
Chapter 13 Performing Maintenance TasksExporting the Configuration
To delete a network server, use the no file-server [file-server-name | *] command in configuration mode.
To display the list of network servers, use the show file-servers command in global or configuration mode.
Exporting the ConfigurationYou can export the Detector module configuration file or a zone configuration file (running-config) to a network server. By exporting the Detector module or zone configuration file to a remote server, you can do the following:
• Implement the Detector module configuration parameters on another Detector module
• Back up the Detector module configuration
To export the Detector module configuration file, use one of the following commands in global mode:
• copy [zone zone-name] running-config ftp server full-file-name [login [password]]
• copy [zone zone-name] running-config {sftp | scp} server full-file-name login
• copy [zone zone-name] running-config file-server-name dest-file-name
To export the portion of the zone configuration that is required to configure the zone on a Cisco Anomaly Guard Module, use the copy guard-running-config command. See the “Exporting a Zone Configuration Manually to a Network Server” section on page 5-16 for more information.
Table 13-2 provides the arguments and keywords for the copy running-config ftp command.
Table 13-2 Arguments and Keywords for the copy running-config ftp Command
Parameter Description
zone zone-name (Optional) Specifies the zone name. If you specify the zone name, the Detector module exports the zone configuration file. The default is to export the Detector module configuration file.
running-config Exports the complete Detector module configuration or the configuration of the specified zone.
ftp Specifies FTP.
sftp Specifies SFTP.
scp Specifies SCP.
server IP address of the network server. Enter the IP address in dotted-decimal notation (for example, enter 192.168.10.2).
full-file-name Complete name of the file. If you do not specify a path, the server saves the file in your home directory.
login (Optional) Server login name. The login argument is optional when you define an FTP server. When you do not enter a login name, the FTP server assumes an anonymous login and does not prompt you for a password.
password (Optional) Password for the remote FTP server. If you do not enter the password, the Detector module prompts you for one.
13-3Cisco Traffic Anomaly Detector Module Configuration Guide
OL-11857-01
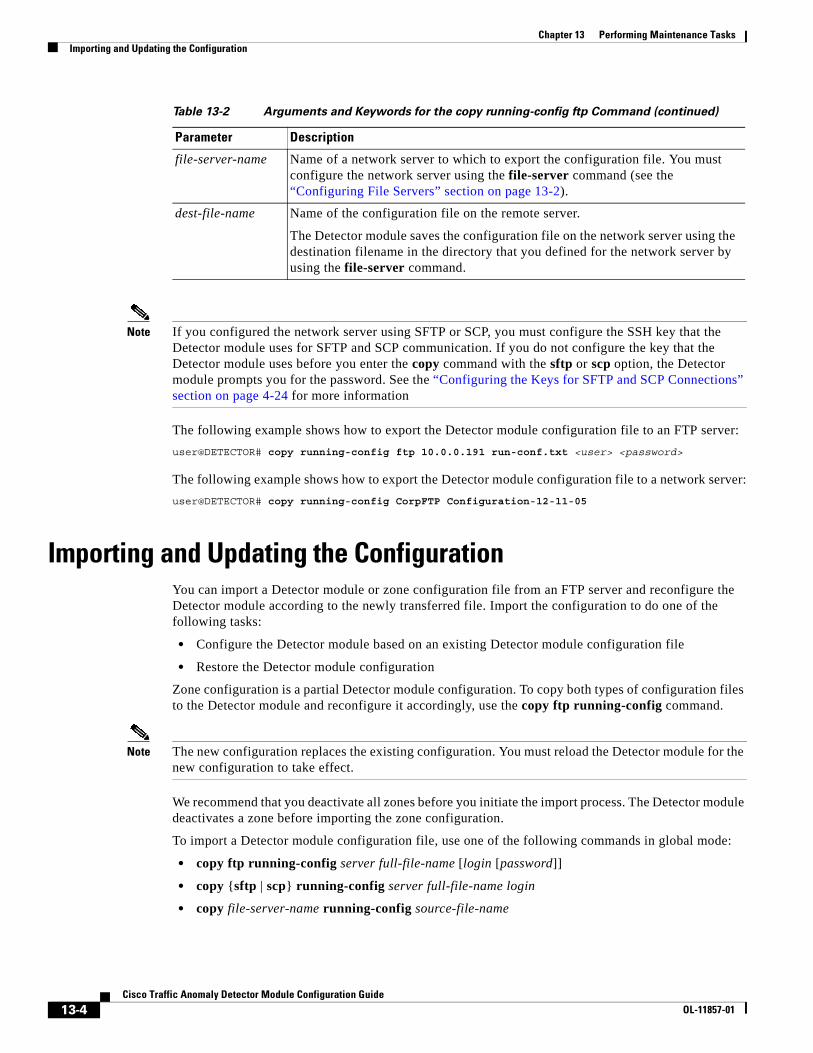
Chapter 13 Performing Maintenance TasksImporting and Updating the Configuration
Note If you configured the network server using SFTP or SCP, you must configure the SSH key that the Detector module uses for SFTP and SCP communication. If you do not configure the key that the Detector module uses before you enter the copy command with the sftp or scp option, the Detector module prompts you for the password. See the “Configuring the Keys for SFTP and SCP Connections” section on page 4-24 for more information
The following example shows how to export the Detector module configuration file to an FTP server:
user@DETECTOR# copy running-config ftp 10.0.0.191 run-conf.txt <user> <password>
The following example shows how to export the Detector module configuration file to a network server:
user@DETECTOR# copy running-config CorpFTP Configuration-12-11-05
Importing and Updating the ConfigurationYou can import a Detector module or zone configuration file from an FTP server and reconfigure the Detector module according to the newly transferred file. Import the configuration to do one of the following tasks:
• Configure the Detector module based on an existing Detector module configuration file
• Restore the Detector module configuration
Zone configuration is a partial Detector module configuration. To copy both types of configuration files to the Detector module and reconfigure it accordingly, use the copy ftp running-config command.
Note The new configuration replaces the existing configuration. You must reload the Detector module for the new configuration to take effect.
We recommend that you deactivate all zones before you initiate the import process. The Detector module deactivates a zone before importing the zone configuration.
To import a Detector module configuration file, use one of the following commands in global mode:
• copy ftp running-config server full-file-name [login [password]]
• copy {sftp | scp} running-config server full-file-name login
• copy file-server-name running-config source-file-name
file-server-name Name of a network server to which to export the configuration file. You must configure the network server using the file-server command (see the “Configuring File Servers” section on page 13-2).
dest-file-name Name of the configuration file on the remote server.
The Detector module saves the configuration file on the network server using the destination filename in the directory that you defined for the network server by using the file-server command.
Table 13-2 Arguments and Keywords for the copy running-config ftp Command (continued)
Parameter Description
13-4Cisco Traffic Anomaly Detector Module Configuration Guide
OL-11857-01
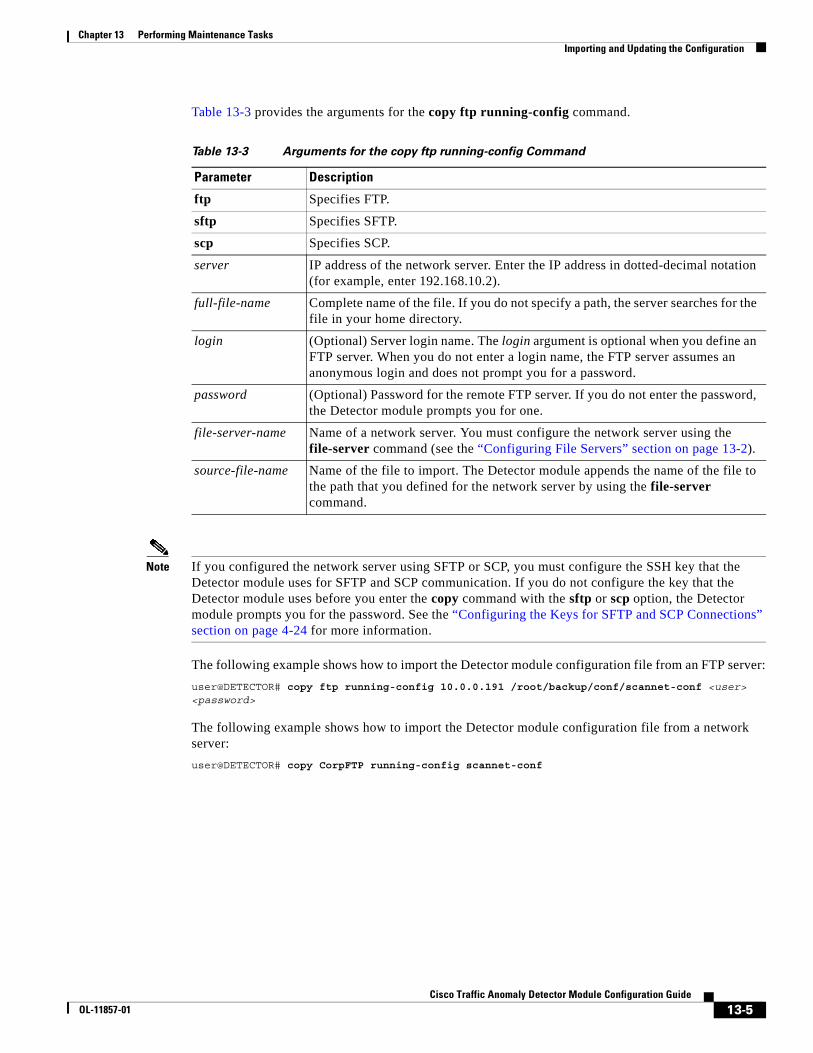
Chapter 13 Performing Maintenance TasksImporting and Updating the Configuration
Table 13-3 provides the arguments for the copy ftp running-config command.
Note If you configured the network server using SFTP or SCP, you must configure the SSH key that the Detector module uses for SFTP and SCP communication. If you do not configure the key that the Detector module uses before you enter the copy command with the sftp or scp option, the Detector module prompts you for the password. See the “Configuring the Keys for SFTP and SCP Connections” section on page 4-24 for more information.
The following example shows how to import the Detector module configuration file from an FTP server:
user@DETECTOR# copy ftp running-config 10.0.0.191 /root/backup/conf/scannet-conf <user> <password>
The following example shows how to import the Detector module configuration file from a network server:
user@DETECTOR# copy CorpFTP running-config scannet-conf
Table 13-3 Arguments for the copy ftp running-config Command
Parameter Description
ftp Specifies FTP.
sftp Specifies SFTP.
scp Specifies SCP.
server IP address of the network server. Enter the IP address in dotted-decimal notation (for example, enter 192.168.10.2).
full-file-name Complete name of the file. If you do not specify a path, the server searches for the file in your home directory.
login (Optional) Server login name. The login argument is optional when you define an FTP server. When you do not enter a login name, the FTP server assumes an anonymous login and does not prompt you for a password.
password (Optional) Password for the remote FTP server. If you do not enter the password, the Detector module prompts you for one.
file-server-name Name of a network server. You must configure the network server using the file-server command (see the “Configuring File Servers” section on page 13-2).
source-file-name Name of the file to import. The Detector module appends the name of the file to the path that you defined for the network server by using the file-server command.
13-5Cisco Traffic Anomaly Detector Module Configuration Guide
OL-11857-01
Chapter 13 Performing Maintenance TasksExporting Files Automatically to a Network Server
Exporting Files Automatically to a Network ServerYou can configure the Detector module to export the following files automatically to a network server:
• Packet-dump capture files—The Detector module exports the packet-dump capture files when the capture buffer size reaches 50 MB or after 10 minutes have elapsed. See the “Exporting Packet-Dump Capture Files Automatically” section on page 12-15 for more information.
• Attack reports—The Detector module exports the reports of any one of the zones when an attack on the zone ends. See the “Exporting Attack Reports Automatically” section on page 11-6 for more information.
• Zone configuration —The Detector module exports the zone configuration file each time that the results of the threshold-tuning phase of the learning process are accepted. See the “Exporting a Zone Configuration Automatically to a Network Server” section on page 5-15 for more information.
The Detector module exports the packet-dump capture files and the attack reports in Extensible Markup Language (XML) format. The software version is accompanied by xsd files that describe the XML schema. You can download the xsd files from www.cisco.com.
To export files automatically to a network server, perform the following steps:
Step 1 Define the network server to which you can export files.
See the “Configuring File Servers” section on page 13-2 for more information.
Step 2 Configure the Detector module to export files automatically by entering the following command:
export {packet-dump | reports | sync-config} file-server-name
13-6Cisco Traffic Anomaly Detector Module Configuration Guide
OL-11857-01
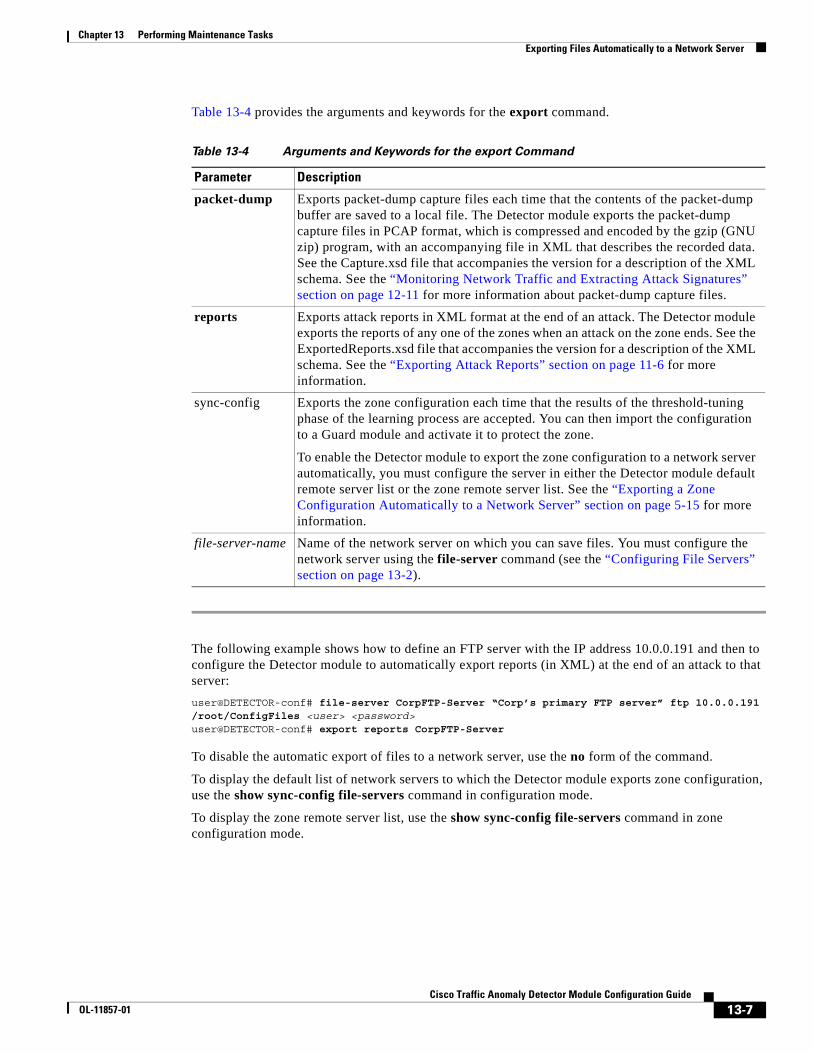
Chapter 13 Performing Maintenance TasksExporting Files Automatically to a Network Server
Table 13-4 provides the arguments and keywords for the export command.
The following example shows how to define an FTP server with the IP address 10.0.0.191 and then to configure the Detector module to automatically export reports (in XML) at the end of an attack to that server:
user@DETECTOR-conf# file-server CorpFTP-Server “Corp’s primary FTP server” ftp 10.0.0.191 /root/ConfigFiles <user> <password>user@DETECTOR-conf# export reports CorpFTP-Server
To disable the automatic export of files to a network server, use the no form of the command.
To display the default list of network servers to which the Detector module exports zone configuration, use the show sync-config file-servers command in configuration mode.
To display the zone remote server list, use the show sync-config file-servers command in zone configuration mode.
Table 13-4 Arguments and Keywords for the export Command
Parameter Description
packet-dump Exports packet-dump capture files each time that the contents of the packet-dump buffer are saved to a local file. The Detector module exports the packet-dump capture files in PCAP format, which is compressed and encoded by the gzip (GNU zip) program, with an accompanying file in XML that describes the recorded data. See the Capture.xsd file that accompanies the version for a description of the XML schema. See the “Monitoring Network Traffic and Extracting Attack Signatures” section on page 12-11 for more information about packet-dump capture files.
reports Exports attack reports in XML format at the end of an attack. The Detector module exports the reports of any one of the zones when an attack on the zone ends. See the ExportedReports.xsd file that accompanies the version for a description of the XML schema. See the “Exporting Attack Reports” section on page 11-6 for more information.
sync-config Exports the zone configuration each time that the results of the threshold-tuning phase of the learning process are accepted. You can then import the configuration to a Guard module and activate it to protect the zone.
To enable the Detector module to export the zone configuration to a network server automatically, you must configure the server in either the Detector module default remote server list or the zone remote server list. See the “Exporting a Zone Configuration Automatically to a Network Server” section on page 5-15 for more information.
file-server-name Name of the network server on which you can save files. You must configure the network server using the file-server command (see the “Configuring File Servers” section on page 13-2).
13-7Cisco Traffic Anomaly Detector Module Configuration Guide
OL-11857-01
Chapter 13 Performing Maintenance TasksReloading the Detector Module
Reloading the Detector Module You can reload the Detector module configuration without rebooting the machine by using the reload command.
For the following changes to take effect, you must reload the Detector module:
• Deactivating or activating a physical interface using the shutdown command
• Burning a new flash
Rebooting the Detector Module and Inactivating ZonesBy default, the Detector module reactivates zones that were active before the reboot process.
To change the default behavior so that the Detector module loads all zones in an inactive operation state, enter the following command in configuration mode:
no boot reactivate-zones
Caution The zone learning phase is restarted after reboot.
Upgrading the Detector Module SoftwareThis section describes the following software components that the Detector module requires for its operation:
• Cisco IOS release that supports the Supervisor Engine 2 or Supervisor Engine 720.
• Detector module software (maintenance partition image and application partition image)
To upgrade the Detector module software, you must log on to the supervisor engine.
This section contains the following topics:
• Supervisor Engine 2 or Supervisor Engine 720 Cisco IOS Software
• Detector Module Software
Supervisor Engine 2 or Supervisor Engine 720 Cisco IOS Software The Cisco IOS software image resides on the Supervisor Engine 2 or the Supervisor Engine 720 of the Cisco Catalyst 6500 series switch or the Cisco 7600 series router. The image on the supervisor engine recognizes and initializes the Detector module and its processor. You must use a Cisco IOS software release that supports the Detector module.
13-8Cisco Traffic Anomaly Detector Module Configuration Guide
OL-11857-01
Chapter 13 Performing Maintenance TasksUpgrading the Detector Module Software
Detector Module SoftwareThe Detector module software resides on a compact flash (CF) card that is integrated with the processor control complex. The compact flash has two partitions for software images, each with its own Detector module software image:
• Maintenance Partition (MP)—Contains the Detector module maintenance software image required for base module initialization and daughter card control functions. The supervisor engine identifies the MP as cf:1.
• Application Partition (AP)—Contains the Detector module application software image. The supervisor engine identifies the AP as cf:4.
You can upgrade the Detector module software on the compact flash card through the supervisor engine console. The upgrade process involves downloading the latest versions of the AP and MP images from the Cisco Software Center to an File Transfer Protocol (FTP) or a Trivial File Transfer Protocol (TFTP) server and installing them to the compact flash card.
Note If you are upgrading the Detector module software to increase the bandwidth performance from 1 Gbps to 2 Gbps, see the “Upgrading the Bandwidth Performance from 1 Gbps to 2 Gbps” section on page 13-16.
The following upgrade procedures are available for the Detector module:
• AP upgrade procedure—Upgrades an AP image using the supervisor engine CLI. See the “Upgrading the AP Image” section on page 13-10.
• MP upgrade procedure—Upgrades the MP image using the supervisor engine CLI. The MP image rarely requires upgrading. Use this procedure only when instructed to do so in the release note that corresponds with the software release. See the “Upgrading the MP Image” section on page 13-12.
• Inline image upgrade procedure—Upgrades the AP or MP image using the Detector module CLI. See the “Upgrading the AP and MP Images Inline” section on page 13-13.
• Common Firmware Environment (CFE)—Upgrades the CFE on the Detector module. The CFE rarely requires upgrading because the process of installing a new AP or MP image also upgrades the CFE. You need to upgrade the CFE only when the Detector module displays an error message that indicates a mismatch between the current CFE and the new MP or AP image. See the “Burning a New Flash Version to Upgrade the CFE” section on page 13-15.
Upgrading Operation NotesFollow these guidelines when upgrading the AP and MP software images and CFE:
• To upgrade the AP and MP versions, log into the supervisor engine.
• To upgrade the CFE, log into the Detector module.
• If you need to upgrade both AP and MP images, you must upgrade the MP image first.
• Use the hw-module module slot_number reset cf:1 command to switch to the MP. The main purpose for operating in the MP mode is to upgrade the AP image.
• Use the hw-module module slot_number reset cf:4 command to switch to the AP. The AP is the normal operating mode.
13-9Cisco Traffic Anomaly Detector Module Configuration Guide
OL-11857-01
Chapter 13 Performing Maintenance TasksUpgrading the Detector Module Software
• The show module command displays the software version of the partition image that you are running. If you are running the AP image, the show module command displays the AP image version. A sample format of the AP image version is 5.1(0.12). If you are running the MP image, it displays the MP image version. A sample format of the MP image version is 5.1(0.0)m.
• The MP image filename uses the c6svc-mp.5-0-3.bin format.
• The AP image filename uses the c6svc-adm-k9.5-0-3.bin format.
• The MP uses the same network settings as the Detector module. You must configure the network settings before you can upgrade the Detector module images. See Chapter 2, “Configuring the Detector Module on the Supervisor Engine” and Chapter 3, “Initializing the Detector Module”for more information.
• When you upgrade a 5.x version of the AP image to a 6.x version with a 1-Gbps bandwidth operation, the installation process changes all instances of the management port designator from eth1 to mng.
Note We recommend that you globally configure the logging console command on the supervisor engine to display the output details of the upgrade procedure. If you are connected from a Telnet session and not from the console, use the terminal monitor command to display console messages.
Upgrading the AP ImageTo upgrade the AP image, perform the following steps:
Step 1 Back up the Detector module configuration before initiating the upgrade process by using the copy running-config command. Backing up enables you to save your existing configuration so that you can quickly restore the configuration to the current state if needed. See the “Exporting the Configuration” section on page 13-3 for more information.
Step 2 Export files that you want to save. You can export the following files:
• Export attack reports that you want to save by using the copy reports command or the copy zone zone-name reports command. See the “Exporting Attack Reports of All Zones” section on page 11-7 and the “Exporting Zone Reports” section on page 11-8 for more information.
• Export logs that you want to save by using the copy log command. See the “Exporting the Log File” section on page 12-9 for more information.
• Export the packet-dump capture files that you want to save by using the copy zone zone-name packet-dump captures command. See the “Exporting Packet-Dump Capture Files Manually” section on page 12-15 for more information.
Step 3 Upgrade an application image to the latest available software release by locating the image on www.cisco.com.
Copy the software image to a directory accessible to FTP or TFTP.
Step 4 Reset the Detector module and load the MP image (this operation takes approximately 3 minutes). Skip this step if you are already running the MP image.
Enter the following command on the supervisor engine:
hw-module module slot_number reset cf:1
The slot_number argument is the number of the slot in which the module is inserted in the chassis.
13-10Cisco Traffic Anomaly Detector Module Configuration Guide
OL-11857-01
Chapter 13 Performing Maintenance TasksUpgrading the Detector Module Software
Step 5 Verify that the MP has booted and that the Detector module status is OK. Enter the following command:
show module slot_number
Step 6 Install the AP image on the compact flash. This operation can take up to 30 minutes depending on the connection speed. Enter the following command:
copy ftp://path/filename pclc#slot_number-fs:
The path/filename argument specifies the FTP location and the name of the image file. If the FTP server does not allow anonymous users, use the following syntax for the ftp-url value: ftp://user@host/absolute-path/filename. Enter your password when prompted.
You can also download the version from a TFTP server.
Caution Do not reset the Detector module until you see this message on the console: “You can now reset the module.” Resetting the module before this message displays will cause the upgrade to fail.
Step 7 Reset the Detector module to the AP by entering the following command:
hw-module module slot_number reset cf:4
Step 8 Verify that the AP image that you copied displays in the output of the show module command by entering the following command:
show module slot_number
Note A new version may require updating the common firmware environment (CFE). See the release note that corresponds with each software release for more information (release notes can be found on www.cisco.com). If there is a CFE mismatch, the Detector module displays the following message when you establish the first session to the Detector module after upgrading the AP image: “Bad CFE version (X). This version requires version Y.”
See the “Burning a New Flash Version to Upgrade the CFE” section on page 13-15 for more information.
The following example shows how to upgrade the AP image:
Sup# hw-module module 8 reset cf:1Device BOOT variable for reset = <cf:1>Warning:Device list is not verified. <<< This message is informational
Proceed with reload of module? [confirm]
% reset issued for module 8Sup# copy tftp:images/ap/adm-APUpgrade-4.0.0.x.bin pclc#8-fs:Address or name of remote host [10.56.36.2]? Source filename [images/ap/adm-APUpgrade-4.0.0.x.bin]? Destination filename [adm-APUpgrade-4.0.0.x.bin]? ...19:50:06: %SVCLC-SP-5-STRRECVD: mod 8: <Application upgrade has started>19:50:06: %SVCLC-SP-5-STRRECVD: mod 8: <Do not reset the module till upgrade completes!!>
......<<< Wait
13-11Cisco Traffic Anomaly Detector Module Configuration Guide
OL-11857-01
Chapter 13 Performing Maintenance TasksUpgrading the Detector Module Software
19:59:58: %SVCLC-SP-5-STRRECVD: mod 8: <Application upgrade has succeeded>19:59:58: %SVCLC-SP-5-STRRECVD: mod 8: <You can now reset the module>
Sup# hw-module module 8 reset cf:4 <<<<< Resets Detector module to APDevice BOOT variable for reset = <cf:4>Proceed with reload of module? [confirm]...%OIR-SP-6-INSCARD:Card inserted in slot 8, interfaces are now online
Upgrading the MP ImageThe MP image rarely requires upgrading. If you are instructed to update the MP software in the release note that corresponds with the software release, perform the following steps:
Step 1 Upgrade to the latest software release by locating the software image on www.cisco.com.
Copy the software image to a directory that is accessible to FTP or TFTP.
To reset the Detector module and load the MP image (this operation takes approximately 3 minutes), enter the following command on the supervisor engine:
hw-module module slot_number reset cf:1
Skip this step if you are running the MP image already.
The slot_number argument is the number of the slot in which the module is inserted in the chassis.
Step 2 Verify that the MP has booted and that the Detector module status is OK by entering the following command:
show module slot_number
Step 3 Copy the MP image to the compact flash by entering the following command on the supervisor engine:
copy ftp://path/filename pclc#slot_number-fs:
The path/filename argument specifies the FTP location and name of the image file.
If the FTP server does not allow anonymous users, use the following syntax for the ftp-url value: ftp://user@host/absolute-path/filename. Enter your password when prompted.
It can take up to 30 minutes to download an application image depending on the connection speed.
Caution Do not reset the Detector module until you see this message on the console: “You can now reset the module.” Resetting the module before this message displays will cause the upgrade to fail.
You can also download the version from a TFTP server.
See the “Using MP Commands” section on page 13-18 for more information about the MP commands.
Step 4 Verify that the MP image that you copied is displayed in the output of the show module command by entering the following command:
show module slot_number
Step 5 Reset the Detector module to the AP by entering the following command:
hw-module module slot_number reset cf:4
13-12Cisco Traffic Anomaly Detector Module Configuration Guide
OL-11857-01
Chapter 13 Performing Maintenance TasksUpgrading the Detector Module Software
The following example shows how to upgrade the MP image:
Sup# hw-module module 8 reset cf:1Device BOOT variable for reset = <cf:1>Warning:Device list is not verified. <<< This message is informational
Proceed with reload of module? [confirm]
% reset issued for module 8Sup# copy tftp:images/mp/MPUpgrade-4.0.0.0.bin pclc#8-fs:Address or name of remote host [10.56.36.2]? Source filename [images/ap/MPUpgrade-4.0.0.0.bin]? Destination filename [MPUpgrade-4.0.0.0.bin]? ...3d19h:%SVCLC-SP-5-STRRECVD:mod 8:<Upgrade of MP was successful.>3d19h:%SVCLC-SP-5-STRRECVD:mod 8:<You can now reset the module>Sup# show module 8.The Following output shows MP image name because Detector module is reset to MP (cf:1). Mod MAC addressesHwFwSwStatus--- ------------------------------------- ------- ----------- -------8 000f.348d.d7f0 to 000f.348d.d7f70.3017.2(1)4.0(0.0)mOther ...Sup# hw-module module 8 reset cf:4 <<< Resets Detector module to AP (normal operation)Device BOOT variable for reset = <cf:4>Proceed with reload of module? [confirm]...%OIR-SP-6-INSCARD:Card inserted in slot 8, interfaces are now online
Upgrading the AP and MP Images InlineThe inline image upgrade procedure provides an alternative method to upgrading the AP and MP images. When performing the inline image upgrade, you execute the upgrade from the Detector module rather than from the supervisor engine.
To upgrade the software image, perform the following steps:
Step 1 Back up the Detector module configuration before initiating the upgrade process by using the copy running-config command. Backing up enables you to save your existing configuration so that you can quickly restore the configuration to the current state if needed. See the “Exporting the Configuration” section on page 13-3 for more information.
Step 2 Export files that you want to save. You can export the following files:
• Export attack reports that you want to save by using the copy reports command or the copy zone zone-name reports command. See the “Exporting Attack Reports of All Zones” section on page 11-7 and the “Exporting Zone Reports” section on page 11-8 for more information.
• Export logs that you want to save by using the copy log command. See the “Exporting the Log File” section on page 12-9 for more information.
• Export the packet-dump capture files that you want to save by using the copy zone zone-name packet-dump captures command. See the “Exporting Packet-Dump Capture Files Manually” section on page 12-15 for more information.
Step 3 Upgrade an image to the latest available version by locating the image on www.cisco.com.
Copy the software image to a directory accessible to FTP.
13-13Cisco Traffic Anomaly Detector Module Configuration Guide
OL-11857-01
Chapter 13 Performing Maintenance TasksUpgrading the Detector Module Software
Step 4 Log in to the supervisor engine through the console port or through a Telnet session.
Step 5 If the Detector module is operating from the maintenance image, proceed to Step 7. If the Detector module is not operating from the maintenance image, enter the following command on the supervisor engine:
hw-module module slot_number reset cf:1
The slot_number argument is the number of the slot in which the module is inserted into the chassis.
Step 6 After the Detector module is back online, establish a console session with the Detector module and log into the root account. The default password for the root account is cisco. To establish the console session, enter the following command at the supervisor engine prompt:
session slot slot_number processor processor_number
The slot-number is the number of the slot in which the Detector module is inserted in the chassis (1–13 depending on the model of your switch or router). The processor_number is the number of the Detector module processor. The Detector module supports management through processor 1 only.
Step 7 Upgrade the software image by entering the following command:
upgrade ftp://path/filename
The path/filename argument specifies the FTP location and the name of the image file.
If the FTP server does not allow anonymous users, use the following syntax for the ftp-url value: ftp://user@host/absolute-path/filename. Enter your password when prompted.
To upgrade the AP software image, enter the AP software image filename. To upgrade the MP software image, enter the MP software image filename. See the “Upgrading Operation Notes” section on page 13-9 for more information.
Caution Do not reset the Detector module until you see this message on the console: “Application image upgrade complete. You can boot the image now.” Resetting the module before this message displays will cause the upgrade to fail.
Step 8 Log out of the Detector module by entering the exit command after completing the upgrade.
Step 9 Reset the Detector module to the AP software image by entering the following command:
hw-module module slot_number reset cf:4
Note Upgrading to a new software release might require updating the common firmware environment (CFE). See the release note that corresponds with each software release for more information. If there is a CFE mismatch, the Detector module displays the following message when you establish the first session to the Detector module after upgrading the AP image: “Bad CFE version (X). This version requires version Y.” See the “Burning a New Flash Version to Upgrade the CFE” section on page 13-15 for more information.
Step 10 When the Detector module has rebooted, verify the software version by entering the show version command.
The following example shows how to upgrade the Detector module application software:
Sup# hw-module module 8 reset cf:1
13-14Cisco Traffic Anomaly Detector Module Configuration Guide
OL-11857-01
Chapter 13 Performing Maintenance TasksUpgrading the Detector Module Software
.
.
.Proceed with reload of module? [confirm]% reset issued for module 9...Sup# session slot 8 proc 1...login:rootPassword: [email protected]# upgrade ftp://psdlab-pc1/pub/images/ap/adm-APUpgrade-4.0.0.x.bin
Downloading the image. This may take several minutes......Upgrading will wipe out the contents on the storage media.Do you want to proceed installing it [y|N]:
Proceeding with upgrade. Please do not interrupt.If the upgrade is interrupted or fails, boot intoMaintenance image again and restart upgrade....Application image upgrade complete. You can boot the image [email protected]# exitlogout [ OK ][Connection to 127.0.0.91 closed by foreign host]Sup# hw-module module 8 reset cf:4
Burning a New Flash Version to Upgrade the CFEYou can burn a new flash version only when there is a mismatch between the current CFE and the software release. A mismatch condition can occur when you update the Detector module AP or MP software.
When a CFE mismatch is detected, the Detector module displays the following message when you establish the first session with the Detector module after upgrading the software release (X denotes the old flash version and Y denotes the new flash version): “Bad CFE version (X). This version requires version Y.”
Note If you try to burn a new flash version when the CFE and the Detector module software versions match, the operation fails.
13-15Cisco Traffic Anomaly Detector Module Configuration Guide
OL-11857-01
Chapter 13 Performing Maintenance TasksUpgrading the Bandwidth Performance from 1 Gbps to 2 Gbps
Caution You must be sure that there is a stable power supply to the Detector module and avoid performing any Detector module operations while you burn a new flash version. If you fail to adhere to these restrictions, the upgrade may fail and cause the Detector module to become inaccessible.
To burn a new flash version, perform the following steps:
Step 1 Enter the following command in configuration mode:
flash-burn
Step 2 Reload the Detector module by entering the following command:
reload
You must enter the reload command after burning a new flash version. The Detector module is not fully functional until you enter the reload command.
The following example shows how to burn a new flash version:
user@DETECTOR-conf# flash-burn Please note: DON'T PRESS ANY KEY WHILE IN THE PROCESS! . . .Burned firmware successfully SYSTEM IS NOT FULLY OPERATIONAL. Type 'reload' to restart the system
Upgrading the Bandwidth Performance from 1 Gbps to 2 GbpsIf your Detector module currently operates with a maximum bandwidth of 1 Gbps, you can upgrade the bandwidth performance to 2 Gbps by installing the XG version of the software image and corresponding software license key. The XG software image activates an additional interface port between the Detector module and the supervisor engine to data traffic. (The 1-Gbps software image uses only one interface port for data traffic.) The software license key activates the installed XG software image. For more information, see the “Understanding the 1-Gbps and 2-Gbps Bandwidth Options” section on page 1-6.
When you install the XG software image, the Detector module is not operational until you install the corresponding software license and make the necessary configuration modifications that are required for the 2-Gbps operation. The configuration changes include the following items:
• Interface configurations—Configure the new interface on the supervisor engine.
• SSL Certificates—Generate a new SSL certificate on the Detector module and any associated Guard.
Installing the XG software image and license does not affect the following Detector module items:
• Zone configurations—Existing zone configuration information is untouched.
• Management access—Configuration parameters that you had configured on mng for the 1-Gbps operation remain for the same for the 2-Gbps operation.
This section contains the following topics:
• Obtaining and Installing the XG Software Image for the 2-Gbps Operation
• Obtaining and Installing the XG Software Image License Key
• Activating the Additional Data Port for the 2-Gbps Operation
13-16Cisco Traffic Anomaly Detector Module Configuration Guide
OL-11857-01
Chapter 13 Performing Maintenance TasksUpgrading the Bandwidth Performance from 1 Gbps to 2 Gbps
• Regenerating the SSL Certificates for the 2-Gbps Operation
Obtaining and Installing the XG Software Image for the 2-Gbps OperationTo obtain a copy of the XG software image and install the software on the Detector module, see the “Upgrading the AP Image” section on page 13-10.
To verify that the XG software image is loaded, use the show version command. With the XG software image loaded, XG displays after the software version number (for example, version 6.0(.0.39)-XG).
Obtaining and Installing the XG Software Image License KeyThe license key that is required to activate the XG software image is tied to the Media Access Control (MAC) address of the Detector module where the XG software image resides. This section describes the process that you use to order the XG software license key.
Note You must have the XG version of the 6.0 operating software (or newer) loaded on your Detector module before ordering and installing the corresponding license. To verify the version of software currently loaded on your Detector module, use the show version command. When the XG software image is loaded, the software version number has a -XG suffix (for example, version 6.0(0.39)-XG).
To obtain and install the 2-Gbps license, perform the following steps:
Step 1 From the Detector module, enter the show license-key unique-identifier command (this command requires the admin privilege level) to view the Detector module MAC address.
Step 2 Record the MAC address information because you will need this information when placing your order for the 2-Gbps operation license.
Step 3 Order the lic-adm-2g-k9 license using any of the available Cisco ordering tools on www.cisco.com.
Step 4 When you receive the Software License Claim Certificate from Cisco, follow the instructions that direct you to the following Cisco.com website:
http://www.cisco.com/go/license
Step 5 Enter the Product Authorization Key (PAK) number found on the Software License Claim Certificate as your proof of purchase.
Step 6 Provide all of the requested information to generate a license key.
Once the system generates the license key, you will receive a license key e-mail with an attached license file and installation instructions. Save the license key e-mail in a safe place in case you need it in the future.
Step 7 Open the license key file using a text editor and copy its contents into your desktop computer's clipboard.
Step 8 From the Detector module, enter the license-key add command in configuration mode. The CLI prompts you to enter the key lines.
Step 9 Paste the contents of your desktop computer’s clipboard (containing the license key) and press Enter.
Step 10 Enter an empty line and press Enter. If the Detector module contains a previously installed license, a confirmation message displays that asks if you want to install the new license.
Step 11 Type y (yes). The XG software image is now active and ready for the 2-Gbps operation.
13-17Cisco Traffic Anomaly Detector Module Configuration Guide
OL-11857-01
Chapter 13 Performing Maintenance TasksUsing MP Commands
Step 12 (Optional) Enter the show license-key command to verify that the key loaded properly and is valid.
Activating the Additional Data Port for the 2-Gbps OperationInstalling and activating the XG software image allows data traffic between the supervisor engine and the Detector module to travel over two interface ports rather than just one interface port. To activate the additional data port on the Detector module for the 2-Gbps operation, use the no shutdown command in the interface configuration mode.
For more information, see the “Configuring a Physical Interface” section on page 3-8.
Regenerating the SSL Certificates for the 2-Gbps OperationThe Detector module uses an Secure Sockets Layer (SSL) certificate to establish a secure communication channel with its associated Guard devices. Upgrading from the 1-Gbps software image to the 2-Gbps software image deletes any existing SSL certificate from the Detector module. After installing the 2-Gbps software image and license, you must regenerate the SSL certificates that the Detector module and associated Guards use to establish a secure communication channel between them. For any associated Guard, you must first delete the existing SSL certificate before you can generate a new certificate.
For more information, see the “Regenerating SSL Certificates” section on page 4-19.
Using MP CommandsYou can boot the Detector module to the MP and access the set of interfaces available on the MP to administer and diagnose the Detector module. One of the key features of the MP is to provide the ability to install a new AP image.
To boot to the MP, perform the following steps:
Step 1 Reset the Detector module to the MP by entering the following command on the supervisor engine:
hw-module module slot_number reset cf:1
The slot_number argument is the number of the slot in which the module is inserted into the chassis.
Step 2 After the Detector module is back online, establish a session with the Detector module and log in to the MP using the MP root user account (username: root, password (default): cisco).
13-18Cisco Traffic Anomaly Detector Module Configuration Guide
OL-11857-01
Chapter 13 Performing Maintenance TasksRecovering from a Lost Password Condition
Table 13-5 summarizes the MP commands.
Recovering from a Lost Password ConditionYou can reset the forgotten password of the Detector module default admin user account using one of the following methods:
• Using a user account with administrative privileges—Enables you to use the Detector module CLI to configure the default admin user account with a new password without affecting the other user accounts. For more information, see the “Changing the Passwords of Other Users” section on page 4-7.
• Reviewing the TACACS server configuration—Enables you to determine the current password associated with the default admin user account. This method requires that you currently have the Detector module configured to perform login authentication on a TACACS server first.
• Using the Linux tac-cli user account—Enables you to use Linux to configure the Detector module default admin user account with a new password without affecting the other user accounts. For more information, see the “Resetting the Default admin User Account Password” section.
Table 13-5 MP Commands
Command Description
clear ap password Clears the following information that you have defined on the Detector module:
• All user passwords
• All TACACS+ login authentication method (reset to local)
Note This command does not reset the MP root user account.
clear ap config Returns the Detector module to its default configuration. This command deletes all Detector module configuration, logs, reports, and license key (if installed).
ip address [ip address] [subnet]
Configures the IP address that the Detector module uses to access the external network.
ip gateway [default-gateway]
Specifies the default gateway for the network.
passwd Changes the password for the current user.
passwd-guest Changes the password for the guest account.
ping {host-name | ip address}
Pings a specified host on the network and verifies that the network parameters are configured correctly.
show images Displays the images stored in the application partition.
show ip Displays the network parameters of the Detector module.
upgrade ftp-url Upgrades the image where ftp-url is the URL specifying the FTP server containing the image and the path to the image. The path format is as follows: ftp://user:password@server-name/path.
You can specify the name of the FTP server or its IP address.
13-19Cisco Traffic Anomaly Detector Module Configuration Guide
OL-11857-01
Chapter 13 Performing Maintenance TasksRecovering from a Lost Password Condition
• Resetting all user account information—Deletes all configured user account information (usernames and associated passwords) and deletes the passwords associated with the following Detector module default user accounts: admin, riverhead, tac-cli, and root. After resetting the user account information, you access the Detector module as if you were accessing it for the first time and the CLI prompts you to configure the default user account passwords. For more information, see the “Resetting All User Account Information” section.
This section contains the following topics:
• “Resetting the Default admin User Account Password”
• “Resetting All User Account Information”
Resetting the Default admin User Account Password You can reset the password of the Detector module default admin user account by using the Linux tac-cli user account.
To reset the Detector module default admin user account password, perform the following steps:
Step 1 Log in to the Detector module as the Linux tac-cli user.
Step 2 Switch to the admin username by using the su - admin command.
Step 3 Configure the password for the Detector module default admin user account by using one of the following commands:
• username admin admin password—The password argument consists of 6 to 24 characters.
• password admin—The CLI prompts you to enter a password and reenter it for verification as shown in the following example:
@PGuardR3#password adminNew Password: Retype New Password: finished successfullyPassword was changed successfully
The password consists of 6 to 24 characters.
Step 4 Switch back to the tac-cli prompt by using the exit command.
Step 5 Log out of tac-cli using the exit command.
Step 6 Log in to the Detector module using the admin username and the new password.
Step 7 (Optional) If the login authentication method is configured for local authentication, configure the other Detector module user account names and passwords (see the “Adding a User” section on page 4-6).
Resetting All User Account InformationThe procedure in this section shows how to reset the Detector module user account information when you forget the password to all Detector module administrative user accounts and the Linux tac-cli user account.
13-20Cisco Traffic Anomaly Detector Module Configuration Guide
OL-11857-01
Chapter 13 Performing Maintenance TasksRecovering from a Lost Password Condition
Caution The process of resetting the Detector module user account information deletes all configured user account information, including all usernames and associated passwords. After the user account information is reset, only the default user account names (admin, riverhead, tac-cli, and root) remain, requiring you to log on using the procedure in the “Accessing the Detector Module for the First Time” section on page 2-9 and assign new passwords to these four user accounts.
Caution Resetting the user account information requires rebooting the Detector module, which will interrupt network traffic processing. We recommend that you avoid using this procedure while the Detector module is in service.
There are two methods for resetting all user account information as follows:
• Using the MP root user account—Uses the root user account that is built into the MP. The default password for this root account is cisco. You must boot the Detector module to the MP to use this method. This method also resets the login authentication method to “local” to avoid a lockout condition due to an invalid TACACS login authentication configuration. Resetting the user account information using this method does not reset the MP root user account.
• Using the AP root user account—Uses the root user account that is built into the AP. This user account is accessible from the supervisor engine only and is authenticated locally only, even if you have the Detector configured to use TACACS as the authentication method. To use this method, you must know the AP root user account password, which you configured when you first installed the Detector module and established the initial session. Resetting the user account information using this method does not reset the MP root user account.
Using the AP root user account to reset all user account information is useful if you are locked out due to an invalid TACACS login authentication configuration and there is no way to recover from it because you do not have access the TACACS configuration. Because the AP root user account is always authenticated locally, you can avoid TACACS authentication.
Note The main advantage of clearing all configured user account information using the AP rather than the MP is reduced downtime. Using the MP requires two reboots of the Detector module whereas using the AP requires only one reboot.
This section contains the following topics:
• Resetting the User Account Information Using the MP root User Account
• Resetting the User Account Information Using the AP root User Account
Resetting the User Account Information Using the MP root User Account
To reset the Detector module user account information and change the login authentication method to “local” using the MP root user account, perform the following steps:
Step 1 Reset the Detector module to the MP by entering the following command on the supervisor engine:
hw-module module slot_number reset cf:1
The slot_number argument is the number of the slot in which the module is inserted into the chassis.
13-21Cisco Traffic Anomaly Detector Module Configuration Guide
OL-11857-01
Chapter 13 Performing Maintenance TasksResetting the Detector Module Configuration to Factory Default Values
Step 2 After the Detector module is back online, establish a session with the Detector module and log in to the MP using the MP root user account (username: root, password (default): cisco).
Step 3 Delete all user account information that is configured on the Detector module by entering the following command:
clear ap password
Step 4 Reset the Detector module to the AP by entering the following command:
hw-module module slot_number reset cf:4
Step 5 Access the Detector module using the procedure in the “Accessing the Detector Module for the First Time” section on page 2-9 and assign new passwords to the following default user accounts: admin, riverhead, tac-cli, and root.
Step 6 (Optional) Configure new user accounts for accessing the Guard module (see the “Adding a User” section on page 4-6).
Resetting the User Account Information Using the AP root User Account
To reset the Detector module user account information using the AP root user account, perform the following steps:
Step 1 Log on to the Detector module from supervisor engine using the AP root username and password.
Step 2 Clear the user account information by entering the clear password command as follows:
root@DETECTOR#clear passwordWARNING: this will reset all user passwords (reboot required), are you sure? '[Y/N]: 'YReboot is required after clear password. Please use the 'hw-module module [slot #] reset' command via the Cisco Catalyst CLI to reboot the blade
Step 3 Press Y to approve the reset request.
Step 4 Use the exit command to log out of root as follows:
.root@DETECTOR#exitlogout
[Connection to 127.0.0.31 closed by foreign host]
Step 5 Reboot the Detector module by entering the hw-module module X reset cf:4 command.
Resetting the Detector Module Configuration to Factory Default Values
You can reset the Detector module to the factory-default values and configure it as a new Detector module by using the following command in configuration mode:
clear config all
13-22Cisco Traffic Anomaly Detector Module Configuration Guide
OL-11857-01
Chapter 13 Performing Maintenance TasksResetting the Detector Module Configuration to Factory Default Values
Resetting the configuration to factory defaults is useful when you want to remove an undesirable configuration in the Detector module, if the configuration has become complex, or if you want to move the Detector module from one network to another network. You can also use the clear ap config MP command to reset the Detector module to the factory-default values (see the “Using MP Commands” section).
Caution Resetting the Detector module configuration deletes all configured user account information, including all usernames and associated passwords. After you reset the Detector module configuration, the default user account names (admin, riverhead, tac-cli (Linux), and root) are the only user account information that remain, requiring you to log on using the procedure in the “Accessing the Detector Module for the First Time” section on page 2-9.
You should back up the Detector module configuration by using the copy running-config command before you reset it to the factory-default settings. See the “Exporting the Configuration” section on page 13-3.
Caution Execute the clear config all command using either an out-of-band management interface connection (if available) or a connection through the supervisor. When the Detector module executes the clear config command, it clears the configuration and then performs a reboot after you confirm the reboot request. If you execute the clear config all command using an inline SSH connection, you are disconnected during the clear configuration process and the Detector module does not reboot. You must then connect to the supervisor engine and reboot the Detector module manually.
To reset the Detector module to the factory-default settings, perform the following steps using an out-of-band console connection:
Step 1 Enter the clear config all command from the configuration mode. The CLI displays a verification prompt that asks you to verify that you want to clear all of the configuration information.
Step 2 Enter yes. The CLI displays a prompt stating that a reboot is required and to press the Enter key.
Caution You must reboot the Detector module at this time (using the current session) or it will not operate correctly.
Step 3 Press the Enter key.
Step 4 Access the Detector module by following the procedure in the “Accessing the Detector Module for the First Time” section on page 2-9 and assign new passwords to the following default user accounts: admin, riverhead, tac-cli, and root.
Step 5 Reconfigure the Detector module.
The following example shows how to reset the Detector module to the factory-default settings using an out-of-band console connection:
user@DETECTOR-conf# clear config allAre you sure you want to clear ALL configuration and logging information?Type 'yes' to clear config, or any other key to cancelyes Reboot is required after clear config. Please press Enter to continue
13-23Cisco Traffic Anomaly Detector Module Configuration Guide
OL-11857-01

Chapter 13 Performing Maintenance TasksResetting the Detector Module Configuration to Factory Default Values
13-24Cisco Traffic Anomaly Detector Module Configuration Guide
OL-11857-01
Cisco TraOL-11857-01
I N D E X
Symbols
# (number sign) 11-4
* (wildcard) 3-7, 5-5, 11-3
Numerics
1-Gbps and 2-Gbps bandwidth options
displaying software license key 12-2
displaying software version 12-2
understanding 1-6
upgrading to 2 Gbps 13-16
2-Gbps operation upgrade
activating additional data port 13-18
regenerating SSL certificates 13-18
A
AAA
accounting 4-12
authentication 4-5
authorization 4-10
configuring 4-3
aaa accounting command 4-12
aaa authentication command 4-5
aaa authorization command 4-10
accounting, configuring 4-12
action command 7-18
action flow 11-6
add-service command 7-9
admin privilege level 3-2, 4-6
always-accept 7-19
always-ignore 7-20
anomaly
detected 11-2
flow 11-3
anomaly detection engine memory usage 12-23, 12-25
AP
booting to 2-12
clearing configuration 13-19
clearing passwords 13-19, 13-22
upgrading 13-10
upgrading, inline 13-13
application partition
See AP
attack report
copying 11-7
detected anomalies 11-2
exporting 11-6, 11-7, 13-6
exporting automatically 11-6
layout 11-1
notify 11-4
statistics 11-2
timing 11-1
viewing 11-4
attack types 11-5
authentication, configuring 4-5
authorization
configuring 4-8, 4-9
disabling zone command completion 4-12, 5-6
auth packet types 7-11
automatic detect mode 1-5
automatic protection mode 9-3
automatic protect mode 9-3, 10-1
IN-1ffic Anomaly Detector Module Configuration Guide
Index
B
bandwidth options
displaying software license key 12-2
displaying software version 12-2
understanding 1-6
upgrading to 2 Gbps 13-16
banner, configuring login 4-30
Berkeley Packet filter 6-7
boot command 2-11
burn flash 13-15
bypass filter
command 6-10
configuring 6-10
definition 1-5, 6-1
deleting 6-12
displaying 6-11
C
capture, packets 12-13
caution, symbol overview 1-xvii
CFE 13-11, 13-14, 13-15
clear ap config command 13-19
clear ap password command 13-19, 13-22
clear counters command 3-9, 12-5
clear log command 12-10
CLI
changing prompt 4-25
command shortcuts 3-7
error messages 3-5
getting help 3-6
issuing commands 3-4
TAB completion 3-6
using 3-1
command completion 4-12
command line interface
See CLI 3-1
commands, deactivating 3-5
IN-2Cisco Traffic Anomaly Detector Module Configuration Guide
command shortcuts 3-7
config privilege level 3-2, 4-6
configuration, supervisor engine
saving 2-1
configuration file
copying 13-3
exporting 13-3
importing 13-4
viewing 12-3
configuration mode
accessing 4-11
described 3-2
configure command 2-9, 3-7
constructing policies 8-4
copy commands
ftp running-config 13-4
log 12-7, 12-9
packet-dump 12-15
reports 11-7
running-config 5-14, 13-3
zone log 12-9
copy-from-this 5-5
copy guard-running-config command 5-14, 5-16
copy login-banner command 4-31
copy-policies command 8-16
copy wbm-logo command 4-32
counters
clearing 3-9, 12-5
history 12-5
counters, viewing 12-5
cpu utilization 12-24
D
DDoS
nonspoofed attacks 1-3
overview 1-2
spoofed attacks 1-3
zombies 1-3
OL-11857-01
Index
deactivate command 9-5
deactivating commands 3-5
default configuration, returning to 13-19
default-gateway command 3-10
description command 5-6
detect
automatic mode 1-5
interactive mode 1-5, 9-3
detect command 9-4
detected
anomalies 11-2
flow 11-6
detected attack 11-5
DETECTOR_DEFAULT 5-2
DETECTOR_WORM 5-2
diff command 8-13, 8-14
disable command 7-6
disabling, automatic export 13-7
DNS
detected anomalies 11-2
TCP policy templates 7-2
tcp protocol flow 11-5
dst-ip-by-ip activation form 9-4, 9-7
dst-ip-by-name activation form 9-3
dst traffic characteristics 7-11
dynamic filter
1000 and more 6-13
command 6-15, 6-16, 9-9
definition 1-5
deleting 6-15
displaying 6-13
displaying events 12-8
overview 6-2, 6-12
preventing production of 6-16
sorting 6-13
worm 7-22
dynamic filters 10-1
dynamic privilege level 3-2, 4-6
OL-11857-01
E
enable
command 4-10, 7-6
password command 4-9
enabling services 4-2
entire-zone activation form 9-3
event log
activating 12-7
deactivating 12-7
event monitor command 12-7
export, disabling automatic 13-7
export command 13-6
packet-dump 12-15
reports 11-7
exporting
configuration file 13-3
log file 12-9
reports automatically 11-6
exporting GUARD configuration 5-14, 5-16
export sync-config command 5-16
extracting signatures 12-19
F
facility 12-8
file server
configuring 13-2
displaying sync-config 13-8
file-server
command 5-16, 13-2
configuring 13-2
deleting 13-3
displaying 13-3, 13-8
displaying sync-config 5-16, 13-7
filters
bypass 1-5, 6-10
dynamic 1-5, 6-2, 6-12
flex-content 1-5, 6-2
IN-3Cisco Traffic Anomaly Detector Module Configuration Guide
Index
fixed-threshold 7-15
flash-burn command 13-16
flex-content filter
configuring 6-3
definition 1-5, 6-1
displaying 6-9
filtering criteria 6-2
renumbering 6-3
fragments 11-5
detected anomalies 11-2
policy template 7-2
G
generating signatures 12-19
global mode 3-2
global traffic characteristics 7-11
Guard
configuration mode 3-3
exporting configuration 13-6
GUARD_DEFAULT 5-3
GUARD_LINK 5-3
GUARD_TCP_NO_PROXY 5-3
GUARD_ zone policy template 7-3
guard-conf command 5-10
GUARD configuration, exporting 5-14, 5-16
GUARD configuration, importing 5-14
Guard-protection activation methods 9-3
H
histogram command 7-21
host, logging 12-8
host keys
deleting 4-19
host keys, deleting 4-20
hostname
changing 4-25
IN-4Cisco Traffic Anomaly Detector Module Configuration Guide
command 4-25
HTTP
detected anomalies 11-2
policy template 7-2
hw-module command 13-10, 13-11, 13-12, 13-14, 13-18, 13-21
hw-module commands 2-11
hybrid 11-5
I
idle session, configuring timeout 4-33
idle session, displaying timeout 4-33
importing GUARD configuration 5-14
inline upgrade 13-13
in packet types 7-11
installation, verifying 2-2
interactive
operation mode 10-3
policy status 7-20
interactive detect mode 1-5, 9-3
interactive protect mode 10-1
interactive-status command 7-19
interface
activating 3-8, 3-9
clearing counters 3-9
command 3-8
configuration mode 3-3
configuring IP address 3-8
IP address
modifying, zone 5-8
ip address command
deleting 5-8
excluding 5-7
interface 3-8
zone 5-7
ip route command 3-10
IP scan 11-5
detected anomalies 11-2
policy template 7-2
OL-11857-01
Index
IP threshold configuration 7-17
K
key, generating for license 13-17
key command
add 4-21, 4-23
generate 4-21, 4-24
remove 4-24
key publish command 4-21, 4-22
L
learning
command 8-5, 8-7
constructing policies 8-4
overview 8-1
policy-construction command 8-4
synchronizing results 8-3
terminating process 8-5, 8-7
threshold-tuning command 8-6
tuning thresholds 8-6
learning accept command 8-5, 8-6
learning parameters, displaying 8-8
learning-params
deactivating periodic action 8-7
deactivating periodic-action command 8-5
periodic-action command 5-12, 8-5, 8-7, 8-8
threshold-multiplier command 7-15
threshold-selection command 8-6, 8-9
threshold-tuned command 5-8, 8-10
learning-params command 5-11, 5-16
learning-params fixed-threshold command 7-15
licenses
generating key 13-17
ordering XG upgrade license 13-17
LINK templates 8-4
log file
OL-11857-01
clearing 12-10
exporting 12-7, 12-9
viewing 12-9
logging, viewing configuration 12-9
logging command 12-8
login banner
configuring 4-30
deleting 4-31
importing 4-31
login-banner command 4-30
logo
adding WBM 4-32
deleting WBM 4-33
M
maintenance partition
See MP
management
MDM 3-13
overview 3-11
port 2-2
SSH 3-13
VLAN 2-2
WBM 3-11
max-services command 7-5
MDM, activating 3-13
memory consumption 12-23
memory usage, anomaly detection engine 12-23, 12-25
min-threshold command 7-6
monitoring, network traffic 12-15
MP
booting to 2-11
upgrading 13-12
upgrading, inline 13-13
mtu command 3-9
IN-5Cisco Traffic Anomaly Detector Module Configuration Guide
Index
N
netstat command 12-26
network server
configuring 13-2
deleting 13-3
displaying 13-3, 13-8
displaying sync-config 5-16, 13-7, 13-8
network server, configuring 13-2
no learning command 8-5, 8-7
non_estb_conns packet type 7-11
nonspoofed attacks 1-3
no proxy policy templates 7-4
note, symbol overview 1-xvii
notify 11-4
notify policy action 7-19
ns policy templates 7-4
O
other protocols
detected anomalies 11-2
policy template 7-3
out_pkts packet types 7-11
P
packet-dump
auto-capture command 12-13
automatic
activating 12-12
deactivating 12-13
displaying settings 12-13
exporting 12-15, 13-6
signatures 12-20
packet-dump command 12-13
packets, capturing 12-13
password
changing 4-7
IN-6Cisco Traffic Anomaly Detector Module Configuration Guide
enabling 4-9
encrypted 4-6
recovering 13-19, 13-22
pending 10-1
pending dynamic filters 10-1, 10-2
displaying 10-3, 10-5
periodic action
accepting policies automatically 8-5, 8-7
deactivating 8-5, 8-7
permit
command 3-11, 3-13, 4-3
permit ssh command 4-20
ping command 12-30
pkts packet type 7-11
policy
action 7-12, 7-18, 7-19
activating 7-13
adding services 7-9
backing up current 7-25, 8-17
command 7-12
configuration mode 3-3
constructing 1-4, 8-2, 8-4
copying parameters 8-16
copy-policies 8-16
deleting services 7-9
disabling 7-13
inactivating 7-13
learning-params, fixed-threshold command 7-15
marking as tuned 5-8, 8-10
marking threshold as fixed 7-15
multiplying thresholds 7-16
navigating path 7-12
packet types 7-10
show statistics 7-24
state 7-13
threshold 7-12, 7-14
threshold-list command 7-17
timeout 7-12, 7-18
traffic characteristics 7-11
OL-11857-01
Index
tuning thresholds 1-4, 8-2, 8-6
using wildcards 7-12, 7-23, 7-24
viewing statistics 8-8
policy set-timeout command 7-18
policy template
command 7-4, 7-6
configuration command level 7-4
configuration mode 3-3
displaying list 7-4
Guard policy templates for synchronization 7-3
max-services 7-5
min-threshold 7-6
overview 7-2
parameters 7-4
state 7-6
worm_tcp 7-4
policy-template add-service command 7-9
policy-template remove service command 7-9
policy-type activation form 9-4
port scan 11-5
detected anomalies 11-2
policy template 7-3
power enable command 2-11
privilege levels 3-2
assigning passwords 4-9
moving between 4-10
protect
activation methods 9-3
automatic mode 9-3, 10-1
deactivating 9-5
interactive mode 10-1
protect command 9-5
protection-end-timer 9-7, 9-8
protect-ip-state command 9-3
protect learning command 8-6
protocol traffic characteristics 7-11
proxy policy templates, no proxy policy templates 7-4
public key, displaying 4-24
OL-11857-01
R
rates
history 12-4
viewing 12-4
reactivate-zones 13-8
rebooting parameters 13-8
recommendations 10-1
accepting 10-7
activating 10-3, 10-6
change decision 7-19
command 10-6
deactivating 10-3, 10-8
dynamic filters 10-1
ignoring 10-7
overview 10-1
viewing 10-4
viewing pending-filters 10-3, 10-5
reload command 13-8
remote-activate policy action 7-19
remote Guard
activating 6-14
terminating protection 9-7, 9-8
remote-guard command 9-7, 9-8
remote Guard list
displaying 9-7, 9-8
remote Guards
activating 9-5
default list 9-7
list 9-8
list activation order 9-8
remove service command 7-9
renumbering flex-content filters 6-3
report
See attack report 11-1
reports
details 11-4
exporting 13-6
reqs packet type 7-11
IN-7Cisco Traffic Anomaly Detector Module Configuration Guide
Index
reset command 2-11
router configuration mode 3-3
routing table
manipulation 3-10
viewing 3-11
running-config
copy 5-14, 13-3
show 12-3
S
scanners traffic characteristics 7-12
service
adding 7-9
command 3-11, 3-13, 4-2
copy 8-16
deleting 7-9
MDM 3-13
permissions 4-3
snmp-trap 4-26
WBM 3-11
services, enabling 4-2
session, configuring timeout 4-33
session, displaying idle timeout 4-33
session timeout, disabling 4-33
session-timeout command 4-33
set-action 7-19
show commands
counters 12-5
cpu 12-24
diagnostic-info 12-22
dynamic-filters 6-13
file-servers 13-3, 13-8
flex-content-filter 6-9
host-keys 4-20, 4-23
learning parameters 8-8
learning-params 7-15
log 12-9
log export-ip 12-9
IN-8Cisco Traffic Anomaly Detector Module Configuration Guide
logging 12-9
login-banner 4-30
memory 12-23
module 2-2, 13-11, 13-12
packet-dump 12-13
packet-dump signatures 12-20
policies 7-23
policies statistics 7-24, 8-8
public-key 4-23, 4-24
rates 12-4
recommendations 10-4
recommendations pending-filters 10-3, 10-5
remote-guards 9-7, 9-8
reports details 11-4
running-config 12-3
show 12-4
sorting dynamic-filters 6-13
sync-config 5-16
sync-config file-servers 5-16, 13-7, 13-8
templates 5-5
zone policies 7-23
show privilege level 3-2, 4-6
show public-key command 4-25
shutdown command 3-9
signature
generating 12-19
snapshot
backing up policies 7-25, 8-17
command 8-12
comparing 8-13
deleting 8-15
displaying 8-15
overview 8-12
saving 8-12, 8-13
saving periodically 8-8
SNMP
configuring trap generator 4-26
traps description 4-27
snmp commands
OL-11857-01
Index
community 4-29
trap-dest 4-26
software license key, displaying key information 12-2
software version number, displaying 12-2
SPAN, configuring 2-7
specific IP threshold 7-17
spoofed attacks 1-3
src traffic characteristics 7-12
SSH
configuring 3-13
deleting keys 4-24
generating key 4-21, 4-24
host key 4-22
service 3-13
viewing public key 4-23
ssh key, publishing 4-22
state command 7-13
static route, adding 3-10
supervisor engine
booting 2-11
configuring 2-1
powering off 2-11
resetting 2-11
saving configuration 2-1
shutting down 2-11
verifying configuration 2-12
syn_by_fin packet type 7-11
sync command 5-12, 5-13
synchronization
exporting configuration 13-6
syns packet type 7-11
syslog
configuring export parameters 12-8
configuring server 12-8
message format 12-8
system log, message format 12-8
OL-11857-01
T
TACACS+
authentication
key generate command 4-18
key publish command 4-21
clearing statistics 4-16
configuring server 4-13
server connection timeout 4-15
server encryption key 4-15
server IP address 4-14
viewing statistics 4-16
tacacs-server commands
clear statistics 4-16
first-hit 4-13
host 4-13, 4-14
key 4-13, 4-15
show statistics 4-16
timeout 4-13, 4-16
TCP
detected anomalies 11-2, 11-5
no proxy policy templates 7-4
policy templates 7-3
templates
LINK 8-4
viewing policies 5-5
zone 5-2
thresh-mult 7-16
threshold
command 7-14
configuring IP threshold 7-17
configuring list 7-17
configuring specific IP 7-17
marking as tuned 5-8, 8-10
multiplying before accepting 7-15
selection 8-12
setting as fixed 7-15
tuning 1-4, 8-2
worm 7-20
IN-9Cisco Traffic Anomaly Detector Module Configuration Guide
Index
threshold-list command 7-17
threshold selection 8-6
threshold tuning
save results periodically 8-8
timeout command 7-18
timeout session, configuring 4-33
timeout session, disabling 4-33
timesaver, symbol overview 1-xvii
tip, symbol overview 1-xvii
traceroute command 12-29
traffic, monitoring 12-15
traffic sources
capturing 2-3
configuring 2-3
SPAN 2-3
VACL 2-3
trap 12-8
trap-dest 4-26
tuning policy thresholds 8-6
U
UDP
detected anomalies 11-3
policy templates 7-3
unauth_pkts packet type 7-11
unauthenticated TCP detected anomalies 11-3
upgrade command 13-19
upgrade license 13-17
upgrading
AP 13-10
inline 13-13
MP 13-12
user-detected anomalies 11-3
user filter
command 6-3
username
encrypted password 4-6
username command 4-6
IN-10Cisco Traffic Anomaly Detector Module Configuration Guide
users
adding 4-6
adding new 4-6
assigning privilege levels 4-6
deleting 4-8
privilege levels 3-2, 4-9
system users
admin 2-9
riverhead 2-9
username command 4-6
V
VACL, configuring 2-4
version, upgrading 13-19
W
WBM
activating 3-11
WBM logo
adding 4-32
deleting 4-33
worm
dynamic filter 7-22
identifying attack 7-22
overview 7-20
policy 7-11, 7-12
policy templates 7-3, 7-21
thresholds 7-20, 7-21
worm_tcp policy template 7-4
X
XG software image
license key 13-17
obtaining software image 13-17
XG software version, 2-Gbps operation 13-16
OL-11857-01

Index
XML schema 11-6 to 11-8, 12-15, 13-7
Z
zombies 1-3
zone
anomaly detection 9-1
clearing counters 12-6
command 5-4, 5-5, 10-3
command completion 4-12, 5-6
comparing 8-14
configuration mode 3-3, 5-6
copying 5-5
creating 5-4
defining IP address 5-7
deleting 5-5
deleting IP address 5-8
duplicating 5-5
excluding IP address 5-7
exporting configuration 5-16
IP address 5-7
learning 8-1
LINK templates 8-4
modifying IP address 5-8
operation mode 5-5
reconfiguring 5-6
synchronize configuration 5-8
synchronizing automatically 5-11
synchronizing offline 5-14
templates 5-2
viewing configuration 5-7
viewing policies 7-23
viewing status 12-4
zone policy
marking as tuned 5-8, 8-10
zone synchronization 8-3
OL-11857-01
IN-11Cisco Traffic Anomaly Detector Module Configuration Guide
Index
IN-12Cisco Traffic Anomaly Detector Module Configuration Guide
OL-11857-01