& 7klv nanocrystals via self hydrolysis: suppressed anion ... · highly uniform thinly-wrapped...
TRANSCRIPT

Highly Uniform Thinly-Wrapped CsPbX3@Silicone
Nanocrystals via Self Hydrolysis: Suppressed Anion
Exchange and Superior Stability in Polar Solvents
Haifeng Zhao#,†,‡, Linfeng Wei#,†,‡, Peng Zeng†,‡, Mingzhen Liu*,†,‡
† Center for Applied Chemistry, University of Electronic and Technology of China, Chengdu 611731, P. R. China.‡ School of Materials and Energy, University of Electronic and Technology of China, Chengdu 611731, P. R. China.
Electronic Supplementary Material (ESI) for Journal of Materials Chemistry C.This journal is © The Royal Society of Chemistry 2019

Fig. S1 Size distribution of (a) CsPbBr3-silicone matrix composite, (b) CsPbBr3@silicone and
(c) conventional OAm-CsPbBr3 nanocrystals.
Fig. S2 (a) HAADF-TEM image and elemental mapping images of CsPbBr3@silicone showing
the elemental distribution of (b) Si (green), (c) Cs (red), (d) Pb (light blue), (e) Br (light yellow)
and (f) overlapped image.
1

Fig. S3 Characterization of CsPbBr3@silicone nanocrystals synthesized with increasing mole
ratio of PbBr2: APTES from1:4 to 1:18: (a)-(d) TEM and corresponding size distribution, (e)
UV-Vis and PL spectra, (f) PL decay and (g) PL QY.
2
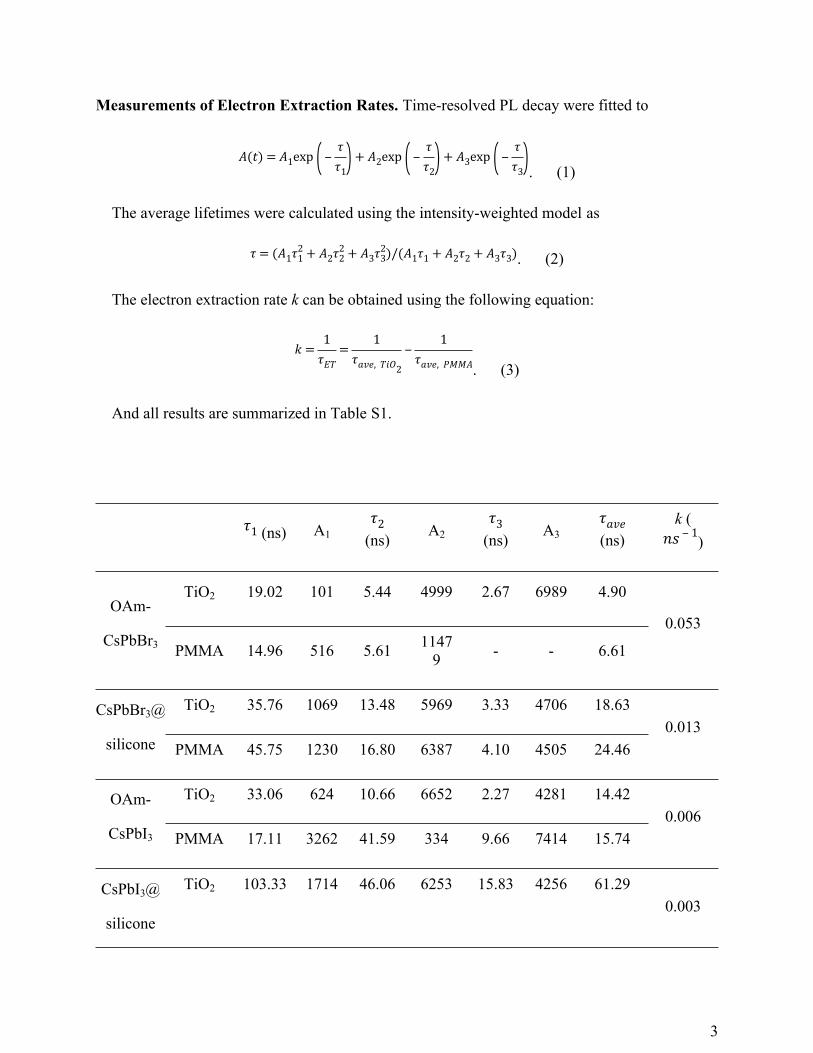
Measurements of Electron Extraction Rates. Time-resolved PL decay were fitted to
. (1)𝐴(𝑡) = 𝐴1exp ( ‒
𝜏𝜏1
) + 𝐴2exp ( ‒𝜏𝜏2
) + 𝐴3exp ( ‒𝜏𝜏3
)The average lifetimes were calculated using the intensity-weighted model as
. (2)𝜏 = (𝐴1𝜏21 + 𝐴2𝜏2
2 + 𝐴3𝜏23)/(𝐴1𝜏1 + 𝐴2𝜏2 + 𝐴3𝜏3)
The electron extraction rate k can be obtained using the following equation:
. (3)𝑘 =
1𝜏𝐸𝑇
=1
𝜏𝑎𝑣𝑒, 𝑇𝑖𝑂2
‒1
𝜏𝑎𝑣𝑒, 𝑃𝑀𝑀𝐴
And all results are summarized in Table S1.
3
(ns)𝜏1 A1 𝜏2
(ns) A2 𝜏3
(ns) A3 𝜏𝑎𝑣𝑒
(ns)k (
)𝑛𝑠 ‒ 1
TiO2 19.02 101 5.44 4999 2.67 6989 4.90OAm-
CsPbBr3 PMMA 14.96 516 5.61 11479 - - 6.61
0.053
TiO2 35.76 1069 13.48 5969 3.33 4706 18.63CsPbBr3@
silicone PMMA 45.75 1230 16.80 6387 4.10 4505 24.460.013
TiO2 33.06 624 10.66 6652 2.27 4281 14.42OAm-
CsPbI3 PMMA 17.11 3262 41.59 334 9.66 7414 15.740.006
CsPbI3@
silicone
TiO2 103.33 1714 46.06 6253 15.83 4256 61.290.003

Table S1 The fitting results of PL decay for thinly-wrapped CsPbBr3@silicone (CsPbI3@silicone)
and OAm-CsPbBr3 (OAm-CsPbI3) nanocrystals coated on PMMA and TiO2 films, respectively.
4
PMMA 129.00 1533 56.13 5916 19.92 4354 74.41

Fig. S4 PL decay of CsPbBr3@silicone (CsPbI3@silicone) and OAm-CsPbBr3(OAm-CsPbI3)
nanocrystals coated on PMMA and TiO2 films, respectively.
5

Fig. S5 PL peak emission intensities of CsPbBr3@silicone in octane with different polar solvent
of different volume ratios: (a) ethanol (EtOH), (b) isopropyl alcohol (iPrOH), (c) n-Butyl alcohol
(n-BuOH), (d) methyl acetate (MeAc) and (e) ethyl acetate (EtAc).
Fig. S6 PL peak emission intensities of OAm-CsPbBr3 in octane with different polar solvent of
different volume ratios: (a) ethanol (EtOH), (b) isopropyl alcohol (iPrOH), (c) n-Butyl alcohol
(n-BuOH), (d) methyl acetate (MeAc) and (e) ethyl acetate (EtAc).
6

Fig. S7. PL emission peak intensities of CsPbI3@silicone (solid symbols) and OAm-CsPbI3
(hollow symbols) in octane with different polar solvents of varying volume ratios (from top to
bottom: EtOH, iPrOH, n-BuOH, MeAc and EtAc).
7

Fig. S8 PL peak emission intensities of CsPbI3@Silicone in octane with different polar solvent
of different volume ratios: (a) ethanol (EtOH), (b) isopropyl alcohol (iPrOH), (c) n-Butyl alcohol
(n-BuOH), (d) methyl acetate (MeAc) and (e) ethyl acetate (EtAc).
Fig. S9 PL peak emission intensities of OAm-CsPbI3 in octane with different polar solvent of
different volume ratios: (a) ethanol (EtOH), (b) isopropyl alcohol (iPrOH), (c) n-Butyl alcohol
(n-BuOH), (d) methyl acetate (MeAc) and (e) ethyl acetate (EtAc).
8

Fig. S10 XRD patterns measured before (bottom curves) and after (top curves) the addition of
33% ethanol in (a) CsPbI3@silicone and (b) OAm-CsPbI3 nanocrystals.
9

Fig. S11 Photos of CsPbBr3@silicone and OAm-CsPbBr3 nanocrystals in different polar solvents
(33%) in natural light and UV 365 nm. (from left to right: octane, EtOH, iPrOH, n-BuOH, MeAc
and EtAc, CsPbBr3@silicone (solid symbols) and OAm-CsPbBr3 (hollow symbols)).
Fig. S12 Photos of CsPbI3@silicone and OAm-CsPbI3 nanocrystals in different polar solvents
(33%) in natural light and UV 365 nm. (from left to right: octane, EtOH, iPrOH, n-BuOH, MeAc
and EtAc, CsPbI3@silicone (solid symbols) and OAm-CsPbI3 (hollow symbols)).
10

Fig. S13 XRD patterns measured in octane with different polar solvents of 33% volume ratios
after 3000 h for (a) CsPbBr3@silicone and (b) CsPbI3@silicone nanocrystals.
11
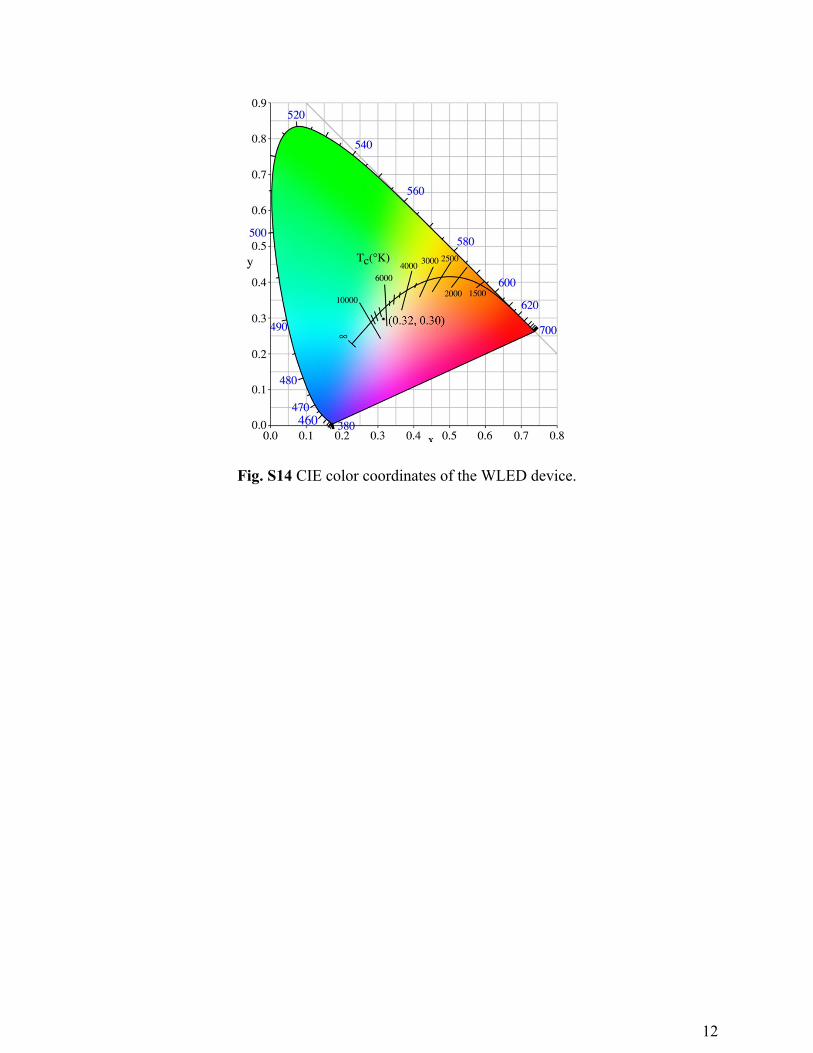
Fig. S14 CIE color coordinates of the WLED device.
12