mitotox · 5 figure 3a shows maximal inhibition of mtbiogenesis after multiple cell divisions by a...
TRANSCRIPT

MitoTox™
Mitochondrial Toxicity Screening
Application Guide

TABLE OF CONTENTS
I. Why is Testing for Mitochondrial Toxicity Important? . . . . . . . . . . . . . . . . . . . . . . . . . . . . . .
II. What Testing Options are Available? . . . . . . . . . . . . . . . . . . . . . . . . . . . . . . . . . . . . . . . . .
III. Screening for General Mitochondrial Function . . . . . . . . . . . . . . . . . . . . . . . . . . . . . . . . .
IV. Investigating Mechanism of Action . . . . . . . . . . . . . . . . . . . . . . . . . . . . . . . . . . . . . . . . . .
V. Important Questions to Consider When Conducting
Cell-Based Mitochondrial Toxicity Testing . . . . . . . . . . . . . . . . . . . . . . . . . . . . . . . . . . . . .
VI. Useful Reviews & Publications . . . . . . . . . . . . . . . . . . . . . . . . . . . . . . . . . . . . . . . . . . . . .
VII. Selected Assays for Drug Toxicity Studies . . . . . . . . . . . . . . . . . . . . . . . . . . . . . . . . . . . .
1
1
4
6
12
16
17

1www.mitosciences.com
I. Why is Testing for Mitochondrial Toxicity Important?
Mitochondria perform two critical functions in the cell, namely the production of more than 90% of the cell’s
energy, and the control of cell survival as an integral part of programmed cell death (apoptosis). Unwanted
changes in either of these functions can have dire consequences, and hence monitoring compounds for
mitochondrial toxicity is a crucial element of any drug toxicity screening program, and of many investigational
toxicology studies as well.
Every year an appreciable percentage of drugs are withdrawn from the market, or their use is curtailed by black
box warnings, due to some adverse effect that was not discovered during preclinical and clinical testing. This is
often because the adverse effect is subtle and does not lead to histopathology.
Recently, and with a better understanding of mitochondrial structure and function, newer assays for
mitochondrial dysfunction have been developed. Application of these assays has revealed strong
mitochondrial impairment by several previously withdrawn drugs including cerivastatin (Baycol), troglitazone
(Rezulin), nefazodone (Serzone), and tolcapone. Not surprisingly, there is now much more focus on identifying
mitochondrial toxicity early in the development process.
II. What Testing Options Are Available?
There are three general adverse effects that result from mitochondrial toxicity: 1. disrupted energy
metabolism; 2. increased free radical generation; and 3. altered apoptosis.
The ability to test drugs for these effects is advancing rapidly. For several years toxicity panels have been
available for cell-based screening systems such as Cellomics®, and these panels typically include one or more
mitochondrial toxicity assays, such as assays for ATP production, membrane potential, caspase 3 activation
(apoptosis), and reactive oxygen species. These assays present a useful first-order screen for general
mitochondrial health, but none of these assays can, even in combination, provide the mechanistic data on
which yes/no decisions can confidently be made about the safety of a drug, nor can they provide biomarkers
which can be used in clinical applications. These assays are also best-suited to identifying acute toxic effects,
and chronic effects on mitochondrial protein expression and post-translational modifications may be missed.
The MitoSciences set of assays extends the data-gathering ability of the toxicologist by providing a set of
investigational assays that allow for the identification and measurement of the specific sites and mechanisms of
toxicity at the individual protein level.

2 Mitochondrial Toxicity Application Guide
Figure 1. Mitochondrial toxicity testing paradigm. The three general toxic effects can be measured using assays suitable for both screening as well as those suited for detailed mechanism-of-action studies. All of the assays in the paradigm can be performed in 96-well plates. All of the screening assays other than the mitochondrial biogenesis assay are available from a variety of vendors, while the biogenesis assay plus the rest of the mechanistic assays are proprietary to Mitosciences.
The MitoSciences assays are able to measure the activity and expression of key metabolic enzymes, plus
their phosphorylation and acetylation, to elucidate effects on energy metabolism. They can measure protein-
specific nitration and carbonylation to elucidate effects from oxidative stress, and they can measure changes in
expression and translocation within the cell of key pro- and anti-apoptotic proteins.
3www.mitosciences.com
Figure 2. The same assay technology is available on both high-throughput and point-of-care platforms.
Stage 1: Screening for General Mitochondrial Function
A typical mitochondrial toxicity testing project begins with cell-based screening assays, all of which can be
run in high-throughput, and, with the exception of the mitochondrial biogenesis assay, all of which measure
acute toxicity parameters and are available from a variety of vendors. The biogenesis assay is proprietary to
MitoSciences, and it is a chronic tox test recommended at the screening stage particularly for antibacterial and
anti-viral drugs, for reasons described below.
Stage 2: Investigating Mechanism of Action
The second step in a mitochondrial tox study is the deployment of a set of MitoSciences assays to generate
further detail on the site(s) and mechanism(s) of action of any toxicity discovered during the screening stage, or
to generate data to ensure that all possible chronic effects of a drug on mitochondrial function have been ruled-
out. The MitoSciences assays can be run in high-throughput for the efficient generation of IC50’s, and many of
them are also available in dipstick form for rapid and simple testing of animal or patient samples.
Solutions
MitoLab™ is MitoSciences’ CRO division, which provides outsourced services for mitochondrial toxicity and
drug discovery studies, and for the development of drug- and disease-related protein biomarkers. Applying a
deep background in mitochondrial function at the molecular level, MitoLab provides a complete set of assays
and consulting services for elucidating the effects of drugs and diseases on metabolic function, and for
making those understandings actionable with quantitative assays for high-throughput screening and clinical
applications.
MitoLab services have been in use by investigational toxicology programs at all 10 of the world’s leading
pharma and biopharma companies, and MitoLab has consistently been praised for its data quality, flexibility,
timeliness of results, and price competitiveness.
MitoSciences also offers many of our assays in kit form, and we can provide extensive support in helping a
customer get the assays performing optimally in their own labs or at their preferred CRO.

4 Mitochondrial Toxicity Application Guide
III. Stage 1: Screening for General Mitochondrial Function
The assays used to conduct initial screening are typically performed on cell cultures within 6-24 hours of drug-
dosing to identify acute effects. The assays in this panel include:
A. ATP Production
Reduction in ATP production can be a primary event caused by a direct effect on mitochondria, or a secondary
event due to altered metabolism through any of several interactions of the compound within the cell.
B. Mitochondrial Membrane Potential
Membrane potential measurement provides information on the coupling ability of electron transfer to ATP
synthesis, as well as the ability of the organelle to take up and release ions and substrates across the
mitochondrial inner membrane.
C. Oxygen Consumption
Measurement of oxygen consumption complements assays of ATP and membrane potential, as O2 utilization
by the cell is a function of both throughput of the electron transport chain and coupling of this process to
ATP production. Moreover, the rate of O2 consumption is linked directly to the membrane potential because
uncoupling, and the resultant loss of proton translocation across the mitochondrial inner membrane, causes a
loss of membrane potential. A determination of O2 consumption is the best way to identify compounds that act
as uncouplers, and these are often, but not always, weak hydrophobic acids.
D. Free Radical Production
Increased free radical production is a feature of mitochondrial dysfunction that can be measured by dye-based
assays of superoxide generation. The predominant source of free radical generation is the mitochondrial
respiratory chain, and inhibition of this process is often connected to increased levels of free radicals. However
there are other cellular sources of free radicals in cells, and so it is not an unequivocal indicator of a direct
effect of the compound on the organelle. Also, the standard assay of free radical scavengers does not
measure the chronic consequences of increased free radical generation, hence the need for measurement of
oxidative and nitrative enzyme modifications, and of modification-induced loss of enzyme activities.
E. Apoptosis Induction
Induction of apoptosis is a critical measurement to make, and several different parameters of this process
are often determined in high-content screens, including changes in the plasma membrane distribution of
phosphatidylserine and activation of caspases. Mitochondrial dysfunction can induce apoptosis and there is
a link between loss of ATP production and apoptosis that appears to be correlated to free radical production.
Apoptosis can also be triggered by many cellular events that do not involve mitochondrial dysfunction directly,
including chromosomal damage, but inevitably the organelle becomes involved as the central executioner.

5www.mitosciences.com
Figure 3A shows maximal inhibition of mtBiogenesis after multiple cell divisions by a number of different anti-bacterials and anti-virals, while Figure 3B shows the loss of mitochondrial-encoded proteins induced by the antibiotic choramphenicol, as a function of dosage. The mitochondrial biogenesis assay is available in high throughput 96-well format (MS642) useful for cell-based experiments and animal studies, and on a dipstick assay platform (MS631) useful for animal studies and clinical trials.
Mitochondria are unique among animal cell organelles in having their own DNA and their own protein synthesis
apparatus. Both features are evolutionary remnants from the early symbiotic fusion of bacterial cells to
produce eukaryotes. For drug screening this has important consequences, as the mitochondrial replication and
translational machinery are more similar to their bacterial counterparts than to the cellular cytosolic/nuclear
corresponding systems. Thus any evaluation of the toxicity of anti-bacterial or antiviral drugs designed to attack
bacterial polymerases or their protein synthesis machinery must be evaluated for their effect on mitochondria.
The MitoBiogenesis™ assays quantitatively measure the levels of a mitochondrial protein whose presence
depends on mitochondrial replication and protein synthesis with that of a mitochondrial protein that is encoded
on the nuclear DNA and translated in the cytosol. For more information about these solutions please refer to
the Mitochondrial Biogenesis Application Guide.
Guiding Stage 2 Studies
The findings of a Stage 1 screen provide an important guide as to which of the MitoSciences assays should be
performed in Stage 2.
F. Inhibition of Mitochondrial Biogenesis
A compound that does not exhibit toxic effects in the aforementioned screening assays, even at high
concentrations, cannot be considered free of mitochondrial toxicity until the potential for chronic toxicity has
been evaluated. This requires culturing cells with the compound for as long as a week, or until there have been
several cell divisions. This is particularly important for antibacterials and antivirals, both of which can affect
mitochondrial biogenesis.
Screen of antibiotics and antivirals Chloramphenicol
100
90
80
70
60
50
40
30
20
10
0
-10
1.0
0.9
0.8
0.7
0.6
0.5
0.4
0.3
0.2
0.1
0.0
0.001 0.01 0.1 1 10
[uM]
3A 3B

6 Mitochondrial Toxicity Application Guide
Whether there is altered energy metabolism or not based on ATP production, change in oxygen utilization, and/
or change in membrane potential, the actual mechanism of action behind such changes can only be revealed
by examining effects at the protein level. General screens for oxidative stress can be even less revealing, as
early compensatory events such as up-regulation of antioxidant proteins can mask a toxic event that can only
be identified by detailed proteomic analysis. Early screens for apoptosis provide greater confidence, and so a
compound that does not induce apoptosis in Stage 1 screening generally only requires more detailed analysis if
the lack of apoptosis was unexpected.
IV. Stage 2: Investigating Mechanism of Action
All of the MitoSciences assays described below are offered by MitoLab, and many are also available in kit form.
All assays are easy to perform and can be carried out in high throughput, or as needed on limited numbers of
samples in a cost effective way. For more information about the MitoLab approach and the available menu of
assays please refer to the MitoLab brochure.
Table 1. Selection of compounds with direct inhibitory effects on the respiratory chain complexes. Data is shown as the average oftriplicate measurements and it is normalized as percentage from DMSO control. OX1 measures the activity of Complex I, OX2+3 measures the activity of Complexes II&III, OX4 measures the activity of Complex IV, and OX5 measures the activity of ATP synthase.
Figure 4. Dose response effect of ATP synthase (Complex V) and succinate ubiquinone oxidoreductase (Complex II) activity in the presence of Troglitazone and Simvastatin respectively. Activity is shown on the X axis and it is given as percentage from DMSO control. Concentration of compounds is shown on the Y axis and is given in the micromolar range.
Compound [50uM] OX1 OX2+3 OX4 OX5
Antimycin 101% 11% 62% 75%
BILN 2061 115% 47% 53% 52%
Chloropromazine 55% 76% 118% 31%
Ciglitazone 87% 27% 52% 77%
Fenofibrate 51% 89% 105% 115%
Fluoxetine 31% 86% 105% 49%
Iressa 107% 82% 85% 38%
KCN 109% 96% 9% 106%
Lopinavir 86% 82% 85% 41%
Myxothiazol 20% 1% 83% 59%
Nelfinavir 98% 73% 122% 38%
Nexavar 53% 19% 62% 19%
Nicardipine 101% 66% 67% 31%
Oligomycin 95% 96% 102% 20%
Paroxetin Maleate 73% 73% 102% 22%
Ranolazine 22% 98% 98% 132%
Rotenone 14% 96% 104% 83%
Simvastatin 92% 55% 70% 43%
Sutent 49% 72% 109% 61%
Ticlopidine 98% 56% 96% 103%
Tolcapone 83% 32% 90% 79%
Troglitazone 89% 25% 43% 33%
TTFA 106% 29% 99% 112%
Tykerb 91% 65% 109% 68%
120
110
100
90
80
70
60
50
40
30
20
10
0
Troglitazone [uM]
Simvastatin [uM]
Dose Response curve of Simvastatinon in vitro CII Activity
Dose Response curve of Troglitazone on in vitro CII Activity
0.01 0.1 1 10 100
120
110
100
90
80
70
60
50
40
30
20
10
0
0.01 0.1 1 10 100
IC50 = 5uM
IC50 = 26uM
7www.mitosciences.com
A. OXPHOS Enzyme Activity Assays
For measuring the direct effect of drugs on the key respiratory chain enzymes.
Many drugs are inhibitors of one or more of these complexes, and such an interaction can be a primary
cause of cell toxicity if the compound can enter mitochondria, which many do. In fact, a significant portion of
compounds, and particularly those weak, hydrophobic acids, can become concentrated in mitochondria.
B. Cell Fractionation & Apoptotic Protein Translocation Assays
For measuring protein movements between cell compartments as a result of a drug treatment.
The relocation of proteins is an important part of metabolic cell signaling and it is a key irreversible step in
apoptosis. The release of cytochrome c and other apoptotic factors from mitochondria is the point of no return
in the apoptotic process. In addition, there is emerging evidence of migration of transcription factors between
mitochondrial and other cellular compartments. Such movements are key steps in the overall control of
mitochondrial biogenesis and function as well as in the execution of apoptosis.
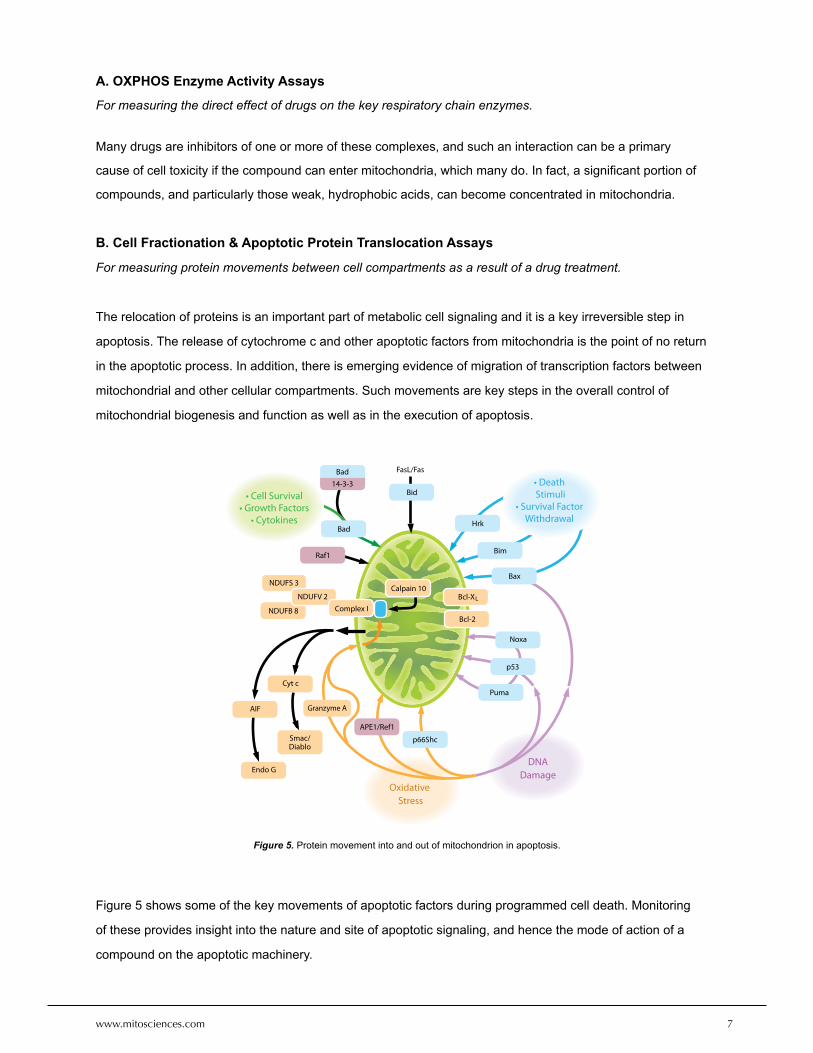
Figure 5 shows some of the key movements of apoptotic factors during programmed cell death. Monitoring
of these provides insight into the nature and site of apoptotic signaling, and hence the mode of action of a
compound on the apoptotic machinery.
Figure 5. Protein movement into and out of mitochondrion in apoptosis.
DNADamage
DNADamage
NDUFB 8
NDUFS 3
NDUFV 2
Hrk
Bim
Bcl-X
FasL/Fas
Calpain 10
Complex IBcl-2
Bid
Puma
p66Shc
Granzyme A
Noxa
p53
Oxidative Stress
Bax
Raf1
APE1/Ref1
Endo G
AIF
Cyt c
Smac/Diablo
• Death Stimuli
• Survival FactorWithdrawal
Bad
Bad14-3-3
• Cell Survival• Growth Factors
• Cytokines
L
8 Mitochondrial Toxicity Application Guide
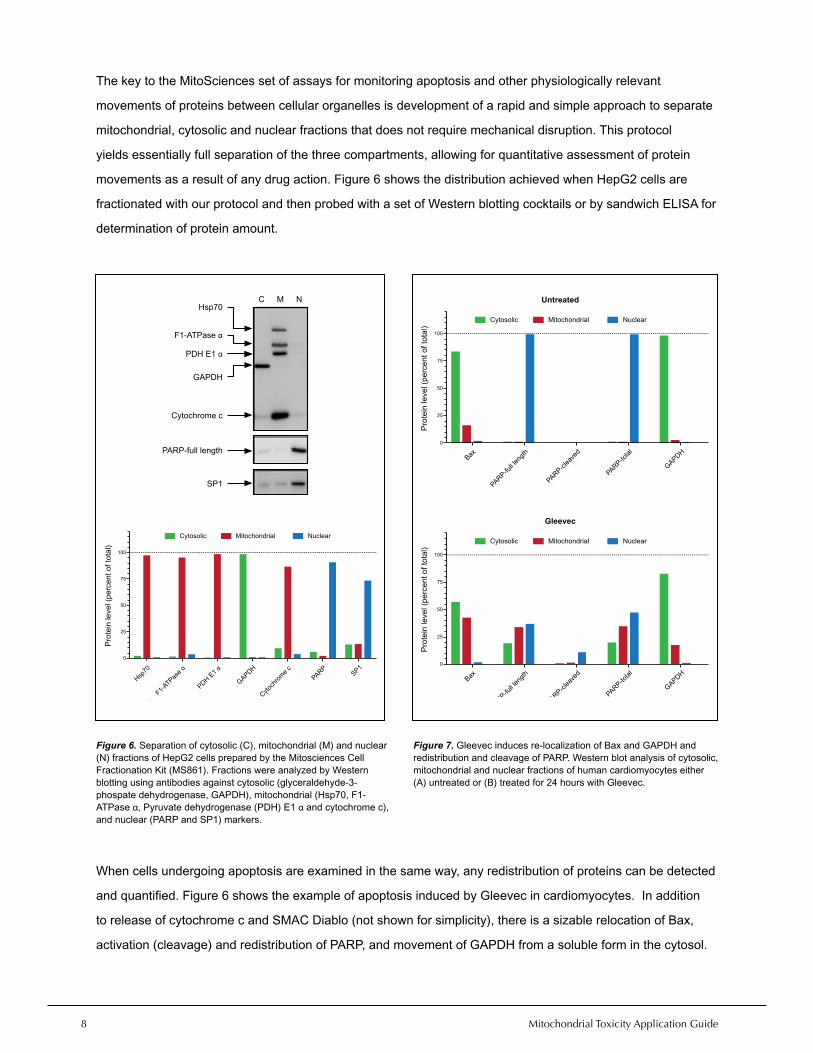
The key to the MitoSciences set of assays for monitoring apoptosis and other physiologically relevant
movements of proteins between cellular organelles is development of a rapid and simple approach to separate
mitochondrial, cytosolic and nuclear fractions that does not require mechanical disruption. This protocol
yields essentially full separation of the three compartments, allowing for quantitative assessment of protein
movements as a result of any drug action. Figure 6 shows the distribution achieved when HepG2 cells are
fractionated with our protocol and then probed with a set of Western blotting cocktails or by sandwich ELISA for
determination of protein amount.
When cells undergoing apoptosis are examined in the same way, any redistribution of proteins can be detected
and quantified. Figure 6 shows the example of apoptosis induced by Gleevec in cardiomyocytes. In addition
to release of cytochrome c and SMAC Diablo (not shown for simplicity), there is a sizable relocation of Bax,
activation (cleavage) and redistribution of PARP, and movement of GAPDH from a soluble form in the cytosol.
Figure 6. Separation of cytosolic (C), mitochondrial (M) and nuclear (N) fractions of HepG2 cells prepared by the Mitosciences Cell Fractionation Kit (MS861). Fractions were analyzed by Western blotting using antibodies against cytosolic (glyceraldehyde-3-phospate dehydrogenase, GAPDH), mitochondrial (Hsp70, F1-ATPase α, Pyruvate dehydrogenase (PDH) E1 α and cytochrome c), and nuclear (PARP and SP1) markers.
Figure 7. Gleevec induces re-localization of Bax and GAPDH and redistribution and cleavage of PARP. Western blot analysis of cytosolic, mitochondrial and nuclear fractions of human cardiomyocytes either (A) untreated or (B) treated for 24 hours with Gleevec.
Untreated
100
75
50
25
0
Cytosolic Mitochondrial Nuclear
Gleevec
100
75
50
25
0
Cytosolic Mitochondrial Nuclear
100
75
50
25
0
Cytosolic Mitochondrial Nuclear
C M NHsp70
F1-ATPase α
PDH E1 α
GAPDH
Cytochrome c
PARP-full length
SP1

9www.mitosciences.com
With different apoptotic stimuli, involvement of, and movements of, Bid, p53, PUMA etc can be followed using
appropriate mAb cocktails.
C. Protein Expression and Post-Translational Modification Assays
For measuring the expression of metabolic and antioxidant enzymes, plus, wherever relevant, their
phosphorylation, acetylation & nitrative modifications.
Cells contain acute and long term mechanisms of adaptation to drug-induced cellular stress. Acute changes
are based on the regulation of metabolism through post–translational modifications such as phosphorylation/
dephosphorylation and acetylation/deactylation events. Long term adaptation is based on changes in the
levels of protein expression.
MitoSciences provides several tools for analyzing such stress-induced changes. First we provide cell-based
protein expression comparison screening of over 30 key metabolic, and antioxidant enzyme targets (the
Met3D™ Enzymes), all of which were selected based on their changing as a result of drug treatments, or
based on literature reports of their up- or down-regulation during cellular stress.
When cells are compared before and after drug-treatment, changes in the expression of a broad range of
enzymes can thus be analyzed qualitatively to identify the various metabolic responses induced. New targets
are being added to this array regularly.
Figure 8. Quantitation of nitrotyrosine modification, represented as signal to background, after mitochondria are exposed in vitro toperoxynitrite (800 μM). Many enzymes are modified presumably as a function of surface-accessible tyrosine residues.
4
3
2
1
0
3-nitrotyrosine

10 Mitochondrial Toxicity Application Guide
Along with the comparative expression measurement, every Met3D™ Enzyme can also be measured for
comparative changes in phosphorylation and acetylation. Recent studies identify changes in the levels of both
modifications, directed by the many cell stress signaling pathways as an important determinant of the response
to cell perturbations, and so it is not surprising that such changes provide a fingerprint of drug effects.
In addition to these regulatory modifications, the Met3D™ Enzymes can also be measured for comparative
modification resulting from nitrative stress. The Met3D™ panel can thus provide insight into oxidative stress by
measuring not only changes in the expression of key free radical scavengers such as SOD2 and catalase, but
it can also identify the extent to which any acute oxidative event has overcome normal protective processes
by measuring oxidative modification of key metabolic enzymes. Figure 8 shows the susceptibility of selected
enzymes to nitrotyrosine modification when cells are exposed to peroxynitrite.
As studies zero-in on specific proteins as potential biomarkers for a particular compound action or unwanted
toxicity, the effect of these changes on enzyme activities can often be obtained as a specific activity (change)
when enzyme activity assays are available.
Figure 9. The effects of oxidative stress on the enzyme pyruvate dehydrogenase (PDH), the key regulator of oxidative metabolism, is studied in greater detail.
(A) As nitration of tyrosines increases with exposure to oxidizing conditions, activity decreases due to site-specific modifications.
(B) After purification using immunocapture beads the site of modification is clearly the E2 subunit which contains a functionally necessary lipoyl domain. Lipoic acid is a wellestablished anti-oxidant.
Oxidative stress and effect on activity Proteomics
17.5
15.0
12.5
10.0
7.5
5.0
2.5
0.0
µM ONOO
0 250 500 750 1000 1250 1500 1750 2000
Activity
3-nitrotyrosine labeling
E2E3bpE1αE1β
WB3-NTYRcoomassie
WBPDH mAb
9A 9B

11www.mitosciences.com
Once an overview of the effects of a drug has been obtained through qualitative comparison screening, more
specific and highly quantitative changes in the levels and post-translational modifications of sets of enzymes
can be monitored using sandwich ELISA assays. Sandwich ELISA’s utilize capture/detector antibody pairs to
provide a highly quantitative measurement of protein expression or post-translational modification. Sandwich
ELISA assays are available for all of the Met3D™ Proteins on both microplate and dipstick platforms.
DetectionAntibody
TargetProtein
Streptavidin-HRP
Biotin
CaptureAntibody
CaptureAntibody
Dipstick
Microplate
Whatman paperDetectionAntibody
Gold
Captureantibody
TargetProtein
Target Protein
Positive Control
Nitrocellulose
Figure 10. Sandwich ELISA microplate assay.
Figure 11. Sandwich ELISA dipstick assay.

12 Mitochondrial Toxicity Application Guide
V. Important Questions to Consider When Conducting
Cell-Based Mitochondrial Toxicity Studies
There are several experimental issues to address before beginning any major screen of compounds for their
mitochondrial toxicity. These involve: cell type to be used, growth medium for the cells, serum concentrations
in the media, concentration of compound, and time/length of incubation before any mitochondrial parameters
can be measured.
A. Which Cell Line(s) Should I Use?
At first, choosing a cell line seems like a relatively easy decision. A priori, it makes sense to use a cell line
derived from the tissue or tissues that you believe are most likely to be positively/negatively affected by the
compound class. However this is not a straightforward choice. First, the process of generating cells from a
tissue source can select a sub-class of cells that are not representative of the entire tissue. Second, both
primary and transformed cell lines by virtue of their growth in culture have accommodated to in vitro growth
conditions, which dramatically differ from the in vivo environment. It is standard practice to grow cells in
a glucose medium. When cells are provided a medium rich in glucose they become lazy and reduce their
dependence on OXPHOS in favor of generating most of the ATP needs by glycolysis. As a result, the effects of
a compound on energy metabolism, particularly on oxidative phosphorylation, can be underestimated.
Furthermore a switch on metabolic substrate generates changes in expression of many proteins, not just the
ones directly involved in OXPHOS or lipid oxidation. The end result is that the cell line is not fully representative
of the tissue from which it was derived, particularly in terms of mitochondrial function. Figure 11 shows protein
expression changes between heart tissue and its derived cardiomyocytes cultured in standard growth media.
Similar broad differences have been reported between the protein expression pattern of liver tissue and primary
hepatocytes.
Another important issue for primary cell lines when it comes to evaluating the mitochondrial effect of a
compound is that there are often limits to the number of divisions that the cells can go through before
senescence or death. This is problematic when studying induced mitochondrial dysfunction because of
the unique character of the organelle; it has its own DNA. The number of copies of this DNA is on the order
of 1000s per cell and therefore the effect of compounds affecting mtDNA replication can take several cell
passages before the threshold for viable mitochondrial protein production is surpassed and the pathogenic
effect observed. These effects are often missed when primary cell lines are chosen. The alternative to primary
cells is to use transformed cell lines e.g. HepG2 cells (which are very commonly used). Such cells can be
kept in culture for many cell divisions. However, it is important to consider that their transformation has
reprogrammed energy metabolism permanently. This is the so-called Warburg effect.
13www.mitosciences.com
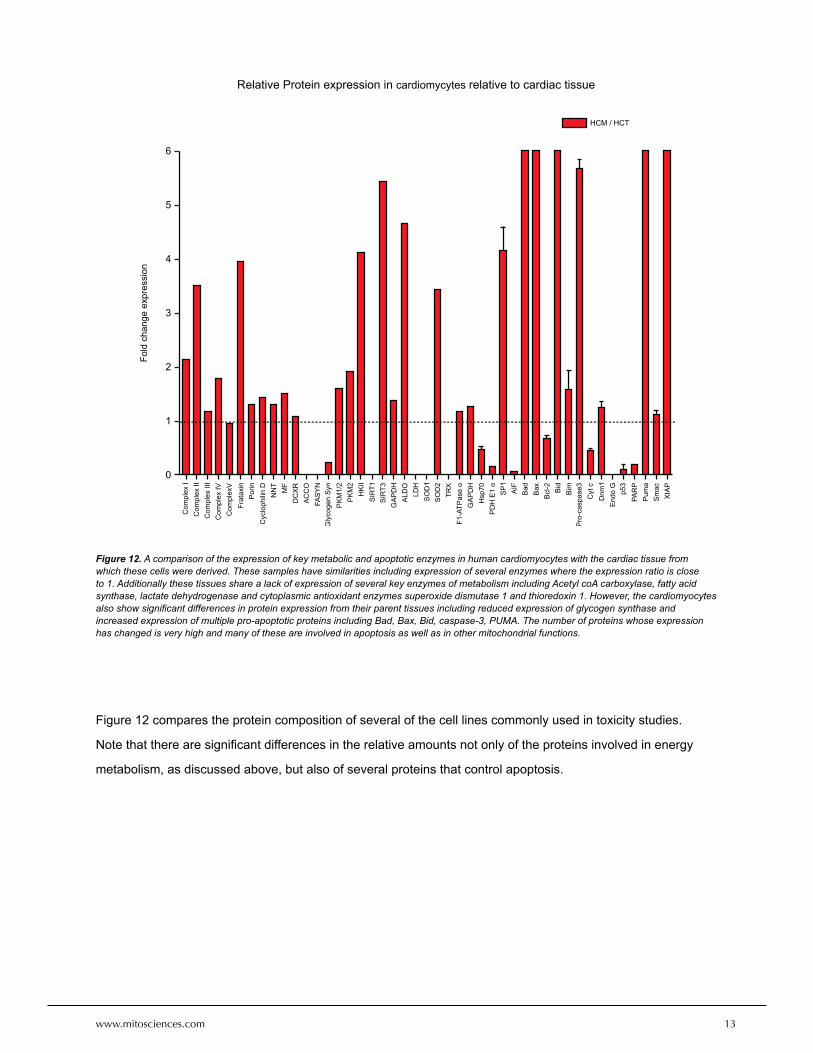
Figure 12 compares the protein composition of several of the cell lines commonly used in toxicity studies.
Note that there are significant differences in the relative amounts not only of the proteins involved in energy
metabolism, as discussed above, but also of several proteins that control apoptosis.
Figure 12. A comparison of the expression of key metabolic and apoptotic enzymes in human cardiomyocytes with the cardiac tissue from which these cells were derived. These samples have similarities including expression of several enzymes where the expression ratio is close to 1. Additionally these tissues share a lack of expression of several key enzymes of metabolism including Acetyl coA carboxylase, fatty acid synthase, lactate dehydrogenase and cytoplasmic antioxidant enzymes superoxide dismutase 1 and thioredoxin 1. However, the cardiomyocytes also show significant differences in protein expression from their parent tissues including reduced expression of glycogen synthase and increased expression of multiple pro-apoptotic proteins including Bad, Bax, Bid, caspase-3, PUMA. The number of proteins whose expression has changed is very high and many of these are involved in apoptosis as well as in other mitochondrial functions.
6
5
4
3
2
1
0
Relative Protein expression in cardiomycytes relative to cardiac tissue
HCM / HCT
14 Mitochondrial Toxicity Application Guide
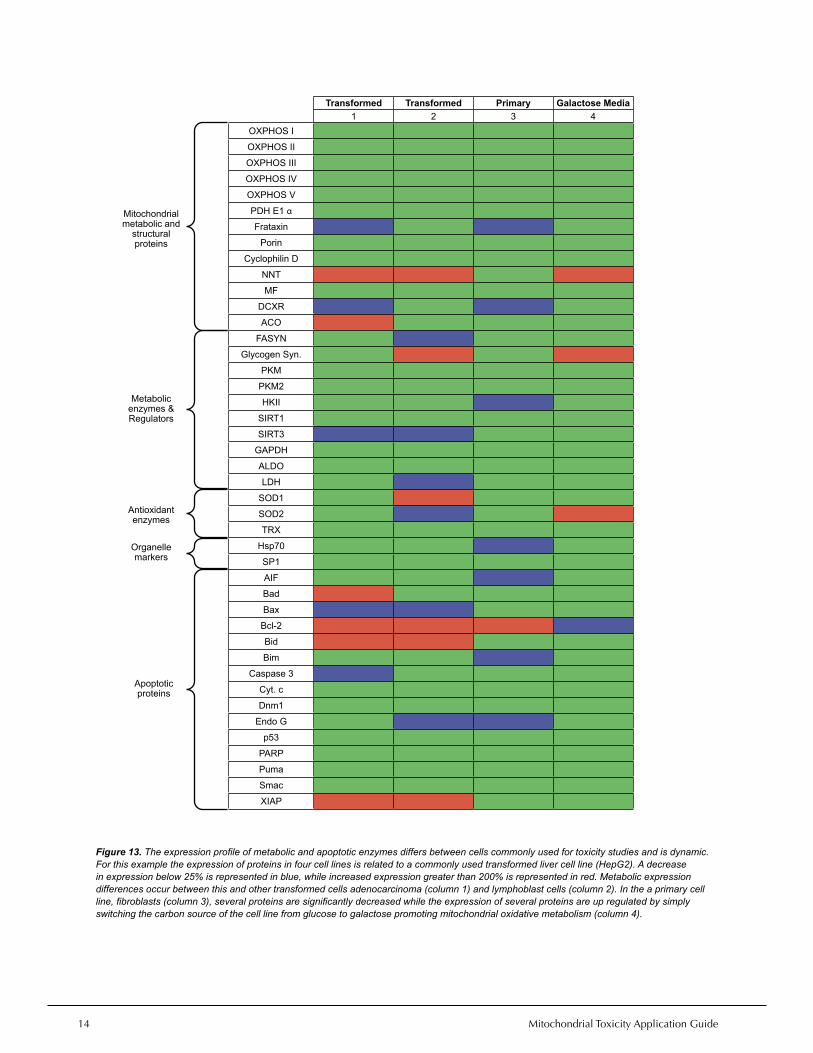
Figure 13. The expression profile of metabolic and apoptotic enzymes differs between cells commonly used for toxicity studies and is dynamic. For this example the expression of proteins in four cell lines is related to a commonly used transformed liver cell line (HepG2). A decrease in expression below 25% is represented in blue, while increased expression greater than 200% is represented in red. Metabolic expression differences occur between this and other transformed cells adenocarcinoma (column 1) and lymphoblast cells (column 2). In the a primary cell line, fibroblasts (column 3), several proteins are significantly decreased while the expression of several proteins are up regulated by simply switching the carbon source of the cell line from glucose to galactose promoting mitochondrial oxidative metabolism (column 4).
Transformed Transformed Primary Galactose Media
1 2 3 4
OXPHOS I
OXPHOS II
OXPHOS III
OXPHOS IV
OXPHOS V
PDH E1 α
Frataxin
Porin
Cyclophilin D
NNT
MF
DCXR
ACO
FASYN
Glycogen Syn.
PKM
PKM2
HKII
SIRT1
SIRT3
GAPDH
ALDO
LDH
SOD1
SOD2
TRX
Hsp70
SP1
AIF
Bad
Bax
Bcl-2
Bid
Bim
Caspase 3
Cyt. c
Dnm1
Endo G
p53
PARP
Puma
Smac
XIAP
Mitochondrialmetabolic and
structuralproteins
Metabolicenzymes &Regulators
Antioxidantenzymes
Organellemarkers
Apoptoticproteins

15www.mitosciences.com
B. What Cell Culture Conditions Should I Use?
This is not a trivial issue. Cells in culture, whether primary or transformed, prefer to use glycolysis rather
than oxidative phosphorylation to produce ATP when grown in glucose. This is potentially problematic when
looking for adverse effects of a compound on energy metabolism, particularly if effects on OXPHOS are being
assessed. One way around the problem is to use galactose plus glutamine as a substrate. The arguments for
using this combination and the way that the cell is fed with reducing equivalents for oxidative phosphorylation
are described in two recent papers and will not be reviewed here [9, 10].Another important issue when cells
are grown in high glucose, as many researchers do, is the high levels of free radicals they produce and the
significant oxidative modification of key metabolic enzymes they show. We recommend screening compounds
initially in both high glucose and in galactose plus glutamine. In the absence of a dual screen, we recommend
to choose the galactose buffer conditions with compounds suspected to have an effect on energy metabolism.
The levels of serum in the media are also an important variable in the experimental design. Many compounds
(such as Troglitazone) are known to bind to serum proteins. Acute treatments of Troglitazone in low serum
media will generate dramatic changes in the levels of many mitochondrial proteins that are not observed in the
presence of high serum media. Serum deprivation can activate apoptosis signaling in many cell lines which
could overestimate toxicity, and so the level of serum must be adjusted in any experimental design according to
the specific questions that the researcher wants to ask about the drugs being screened.
C. How Long Should I Culture My Drug in Cells Before Making Metabolic Measurements?
As mentioned above, compounds can have an acute effect on cellular metabolism due to direct enzyme
inhibition, altered cell signaling and post-translational modifications. Some toxic events occur rapidly and the
cells die soon after, so that long term effects such as apoptosis must be measured relatively early. Many
compounds induce long term effects, often changes in protein expression. When the levels of a protein are
reduced by inhibition of gene expression, the ideal timing for capturing the event depends on the half life of the
proteins involved which varies from one protein to another. If a drug affects mitochondrial DNA replication the
effect is only evident after several cell divisions. Free radical generation can occur early but disappear later,
presumable by compensation through increased production of anti-oxidant proteins. In short, the length of time
of treatment with a compound depends on the parameters to be measured. We generally begin by monitoring
cellular events after incubating with a compound for 6, 24 and 72 hours. When we are dealing with compounds
thought to affect mitochondrial biogenesis we set up cultures for incubation with the drug for seven days.

16 Mitochondrial Toxicity Application Guide
VI. Useful Reviews & Publications
1. Amacher, D.E., Drug-associated mitochondrial toxicity and its detection. Curr Med Chem, 2005. 12(16): p.
1829-39.
2. Boelsterli, U.A. and P.L. Lim, Mitochondrial abnormalities--a link to idiosyncratic drug hepatotoxicity?
Toxicol Appl Pharmacol, 2007. 220(1): p. 92-107.
3. Dykens, J.A. and Y. Will, The significance of mitochondrial toxicity testing in drug development. Drug
Discov Today, 2007. 12(17-18): p. 777-85.
4. Dykens, J.A., et al., In vitro assessment of mitochondrial dysfunction and cytotoxicity of nefazodone,
trazodone, and buspirone. Toxicol Sci, 2008. 103(2): p. 335-45.
5. Nadanaciva, S., et al., Target identification of drug induced mitochondrial toxicity using immunocapture
based OXPHOS activity assays. Toxicol In Vitro, 2007. 21(5): p. 902-11.
6. Nadanaciva, S., et al., Mitochondrial impairment by PPAR agonists and statins identified via
immunocaptured OXPHOS complex activities and respiration. Toxicol Appl Pharmacol, 2007. 223(3): p.
277-87.
7. Will, Y., et al., Effect of the multitargeted tyrosine kinase inhibitors imatinib, dasatinib, sunitinib, and
sorafenib on mitochondrial function in isolated rat heart mitochondria and H9c2 cells. Toxicol Sci, 2008.
106(1): p. 153-61.
8. Shikuma, C.M., et al., Mitochondrial oxidative phosphorylation protein levels in peripheral blood
mononuclear cells correlate with levels in subcutaneous adipose tissue within samples differing by HIV
and lipoatrophy status. AIDS Res Hum Retroviruses, 2008. 24(10): p. 1255-62.
9. Marroquin, L.D., et al., Circumventing the Crabtree effect: replacing media glucose with galactose
increases susceptibility of HepG2 cells to mitochondrial toxicants. Toxicol Sci, 2007. 97(2): p. 539-47.
10. Murray, J., et al., Monitoring oxidative and nitrative modification of cellular proteins; a paradigm for
identifying key disease related markers of oxidative stress. Adv Drug Deliv Rev, 2008. 60(13-14): p. 1497-
503.

17www.mitosciences.com
VII. Selected Assays for Drug Toxicity Studies
MitoBiogenesis™ In-Cell ELISA IR Assay Kit (Catalog # MS642)
A 96- or 384-well plate assay for high-throughput comparative analysis of effects on mtDNA replication and
mitochondrial protein synthesis.
MitoBiogenesis™ Dipstick Assay Kit (Catalog # MS631)
A rapid and simple test for quantitative analysis of mitochondrial biogenesis in human blood and tissue
samples.
MT-OXC Complete OXPHOS Enzyme Activity Panel (Catalog # MT-OXC)
A set of (5) 96-well plate assays for measuring the direct effect of drugs on the activity of the 5 OXPHOS
enzyme complexes.
Cell Fractionation Kit HT (Catalog # MS862)
A complete kit for isolating in high-throughput a mitochondrial, cytosolic and nuclear fraction from cells grown in
96-well plates without the need for mechanical disruption. Ideal for use with ELISA assays or WB cocktails in
Stage 2 studies to follow the translocation of proteins during apoptosis.
ApoTrack™ Cytochrome c Apoptosis WB Antibody Cocktail (Catalog # MSA12)
Allows for the detection of cytochrome c in cytoplasmic and mitochondria-containing fractions for determining
the proportion of released cytochrome c from mitochondria to the cytoplasm from apoptosis. The kit also
includes antibodies against a cytoplasmic protein (GAPDH), and 2 mitochondrial markers (PDH. a matrix
marker, and ATP synthase, an inner membrane marker). This set of control markers allows for the monitoring
and/or optimization of the permeabilization conditions. Ideal for confirming the results of an early high-
throughput screen for cytochrome c release.
In addition to the above assays, MitoSciences also offers numerous microplate and dipstick assays against
individual proteins for a more comprehensive analysis of any single target.
Please see a complete list at http://www.mitosciences.com